monsoon system study in game-t project dr. jun matsumoto dr. jun matsumoto (department of earth...
Post on 21-Dec-2015
215 views
TRANSCRIPT
Monsoon system study in Monsoon system study in GAME-T ProjectGAME-T Project
Dr. Jun MatsumotoDr. Jun Matsumoto
(Department of Earth & Planetary (Department of Earth & Planetary Science, University of Tokyo)Science, University of Tokyo)
Current Status of the GAME
• GAME Phase-I (FY1997-2001; IOP=1998) was successfully finished.
• GAME Phase-II research phase (FY2002-2004) has started!• The 1st GAME-II International Science Panel (GISP) was
held at NASDA/EORC, Tokyo in October 6-7, 2002.• Further data archive (meteorological data for 1997-2002)
effort among the GAME-related countries was agreed.• The international workshop for Regional Climate Modeling
for the (Asian) monsoon system was held at FORSGC, Yokohama in March 2003.
• Continuous observation and monitoring effort is being made through CEOP-Asian Monsoon Project (CAMP) (including FORSGC, CREST-Water Cycle Projects.)
Objectives of GAME- Phase II Objectives of GAME- Phase II (Research Phase 2003-2004)(Research Phase 2003-2004)
• Intensive & Extensive Data Analysis using
GAME data sets.• Comprehensive modeling of Asian monsoon
climate and hydrological cycles.• Application of GAME outputs for the
prediction of hydrological cycle (precipitation, runoff etc.) in monsoon Asia
• Further international cooperation for meteorological & hydrological studies in Asia
GAME-II Working GroupsGAME-II Working Groups
• Land surface processes/ABL/AAN (Joon Kim, M.Sugita)• Radiation processes (T. Nakajima)• Cloud/Precipitation processes (H.Uyeda)• Monsoon system study (J.C.L. Chan, J. Matsumoto)• Monsoon system modeling (F.Kimura)• Re-analysis (N. Yamazaki)• Satellite utilization (K.Nakamura, T. Koike)• GAIN (K.Takahashi)• GAME-Siberia (Georgiadi, T. Ohata)• WEBS (B.J. Sohn, K. Masuda)• WRAP (T.Oki, Thada)

Plan for Monsoon System Study in GAME-IIPlan for Monsoon System Study in GAME-II
By Dr. Jun Matsumoto & Prof. Johnny C. L. Chan; GISP-II, Nov. 7, 2002By Dr. Jun Matsumoto & Prof. Johnny C. L. Chan; GISP-II, Nov. 7, 2002 Main target: Pre-monsoon and monsoon onset
processes How: • Organize workshop (national) February 5-6, 2003 in
Kyoto• Organize international workshop (in the week of
November 10, 2003) with GAME-T2 Workshop in Thailand co-organized with SCSMEX Project Office
• Include satellite and re-analysis related studies• Organize regional studies/collaborations with
Indochina countries• Write review paper on pre-monsoon and monsoon
onset Processes

Forested area is decreasing during 1960 to 2000
(Kanae et al., 2001: J. Hydromet., 2, 51-70)
50%
10%
1960 2000
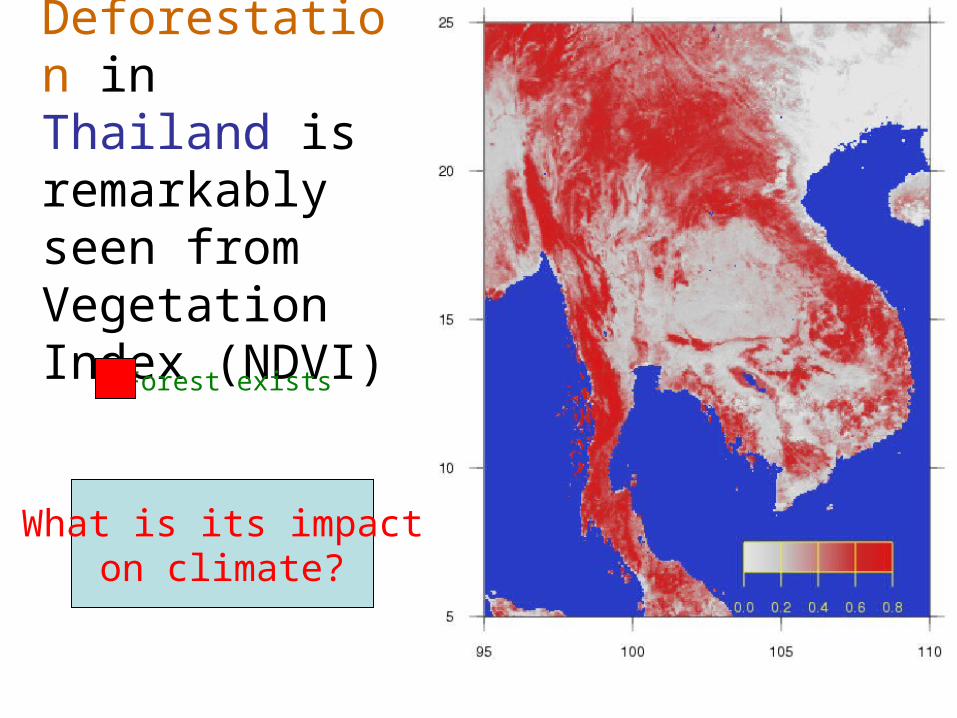
Deforestation in Thailand is remarkably seen from Vegetation Index (NDVI)
Forest exists
What is its impact on climate?
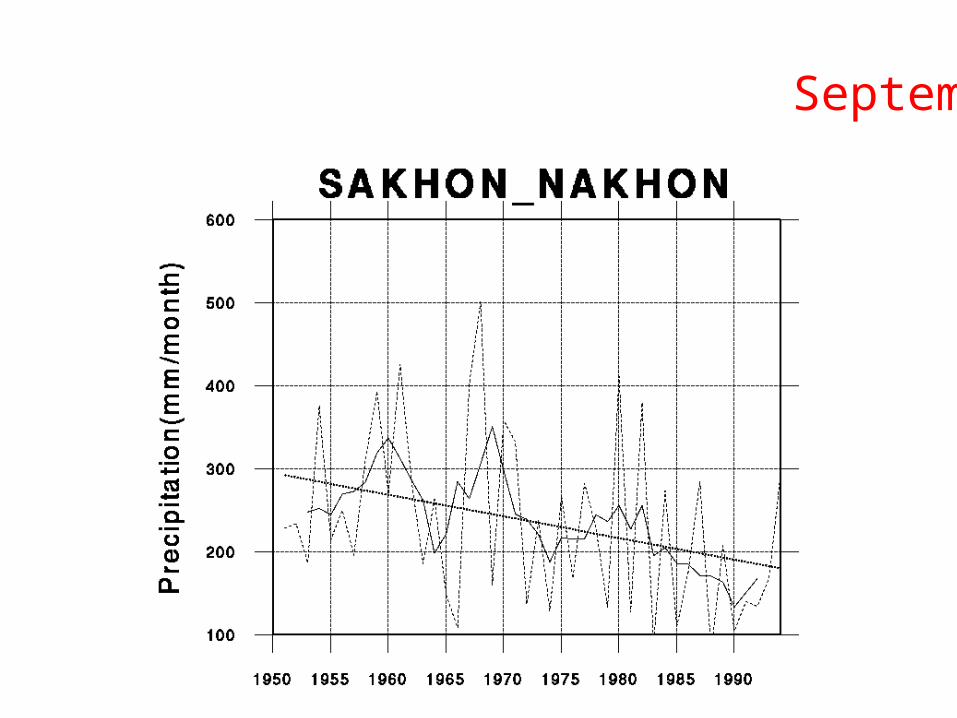
Decrease trend in Rainfall in September
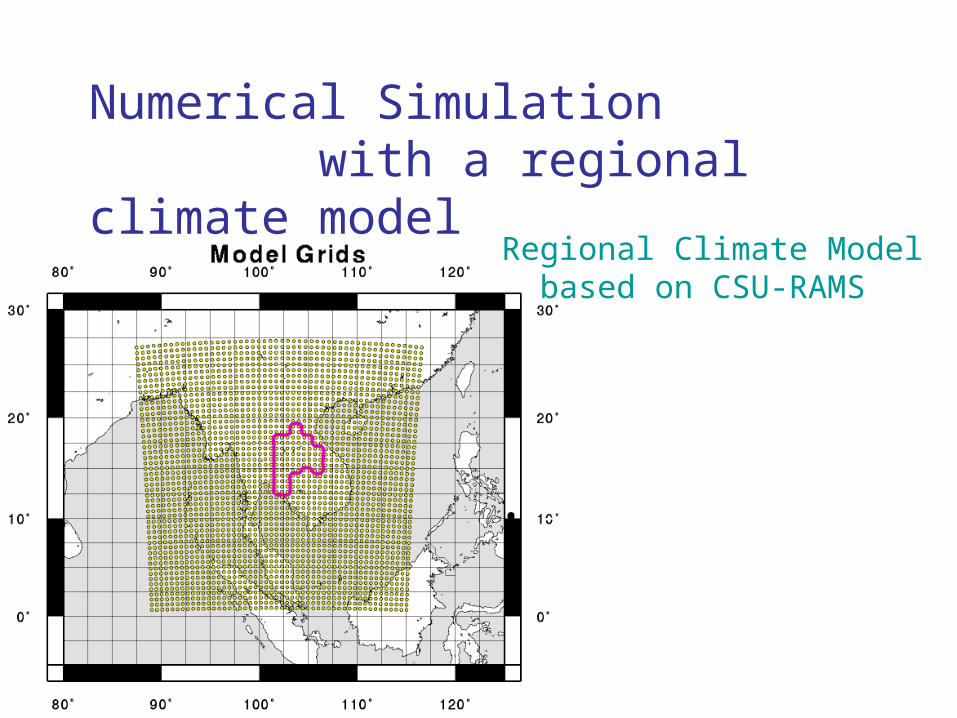
Numerical Simulation with a regional climate model
Regional Climate Model based on CSU-RAMS•basic equations: non-hydrostatic•precipitation: Arakawa-Schubert Bulk cloud microphysics•radiation: 2-stream, k-distribution•surface flux: bulk method
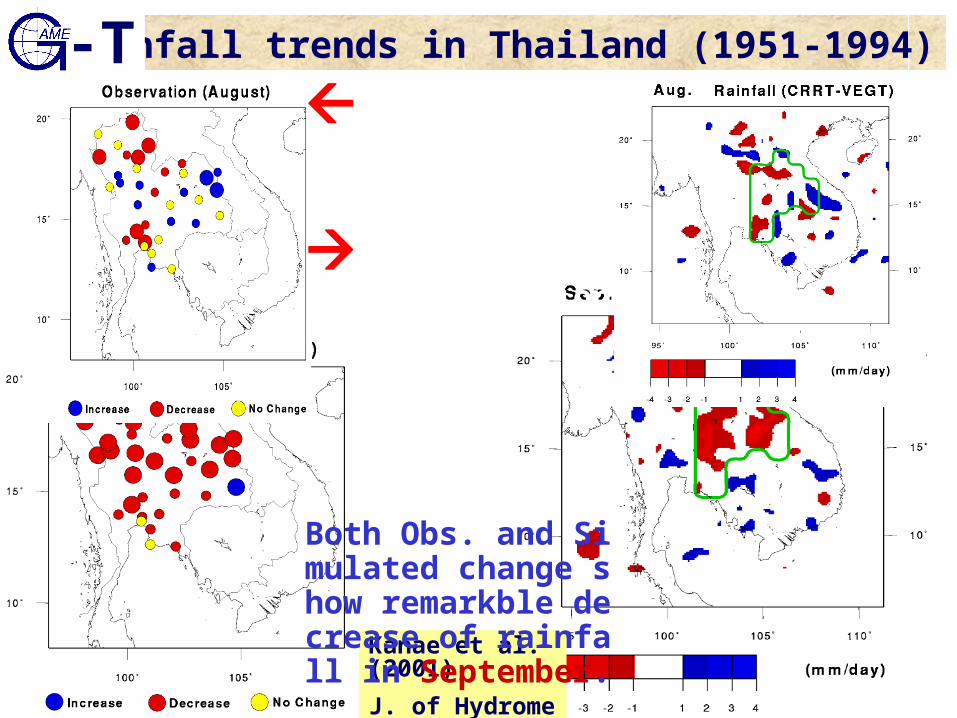
Rainfall trends in Thailand (1951-1994)
Kanae et al.(2001),
J. of Hydromet.
-TObserved trends
Simulated change with deforestation condition by RAMS
Both Obs. and Simulated change show remarkble decrease of rainfall in September.
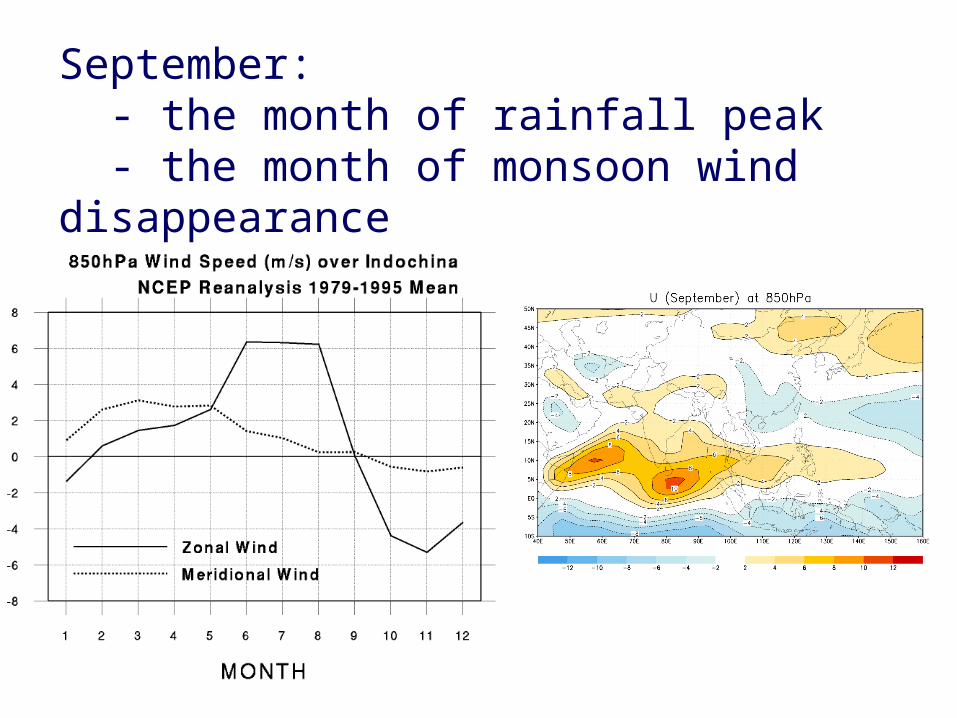
September: - the month of rainfall peak - the month of monsoon wind disappearance
The 2nd International Workshopof Regional Climate Modeling
for the monsoon systems
• Co-sponsors: GAME-ISP and FRSGC• Topics: monsoon climate, energy and hydrological processes in
monsoon regions, orographic effects on precipitation, etc.• Place: IGCR (JAMSTEC) in Yokohama, Japan• Date: March 4-6, 2003• Participants: about 30 to 40 scientists and modelers• For further information;
– [email protected], [email protected]
• The 3rd Workshop will be held in April 2004 in Hawaii
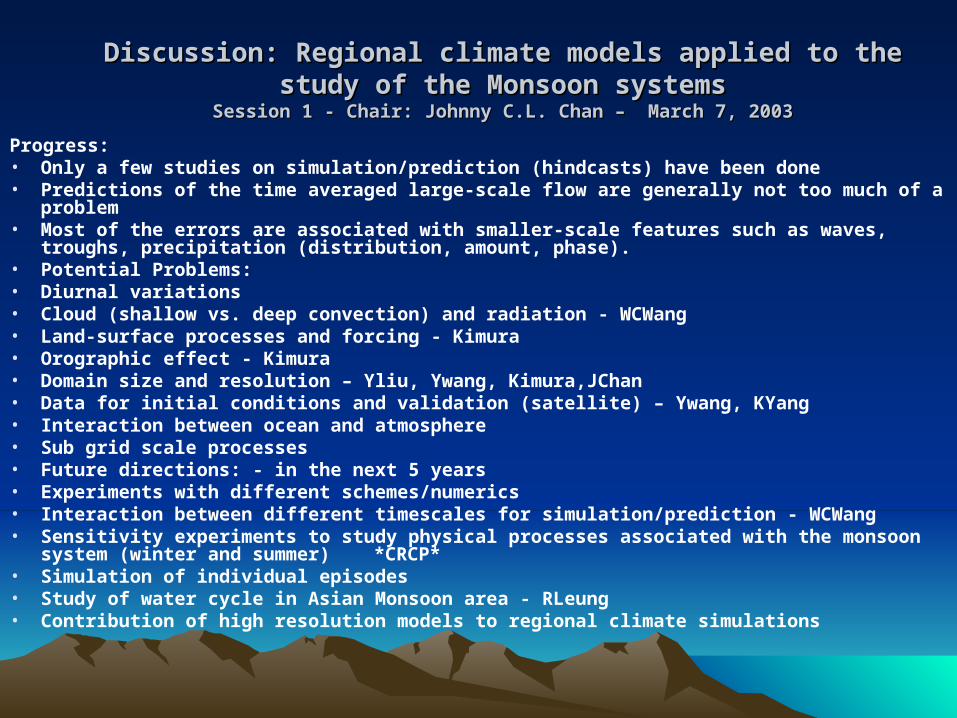
Discussion: Regional climate models applied to the study of the Discussion: Regional climate models applied to the study of the Monsoon systemsMonsoon systems
Session 1 - Chair: Johnny C.L. Chan –Session 1 - Chair: Johnny C.L. Chan – March 7, 2003March 7, 2003
Progress:• Only a few studies on simulation/prediction (hindcasts) have been done• Predictions of the time averaged large-scale flow are generally not too much of a problem• Most of the errors are associated with smaller-scale features such as waves, troughs,
precipitation (distribution, amount, phase).• Potential Problems:• Diurnal variations• Cloud (shallow vs. deep convection) and radiation - WCWang• Land-surface processes and forcing - Kimura• Orographic effect - Kimura• Domain size and resolution – Yliu, Ywang, Kimura,JChan• Data for initial conditions and validation (satellite) – Ywang, KYang• Interaction between ocean and atmosphere• Sub grid scale processes• Future directions: - in the next 5 years• Experiments with different schemes/numerics• Interaction between different timescales for simulation/prediction - WCWang• Sensitivity experiments to study physical processes associated with the monsoon system
(winter and summer) *CRCP*• Simulation of individual episodes• Study of water cycle in Asian Monsoon area - RLeung• Contribution of high resolution models to regional climate simulations

Heavy Rainfall Heavy Rainfall Distribution in Thailand: Distribution in Thailand:
A Preliminary Study A Preliminary Study Hiroaki Takahara Hiroaki Takahara
and and
Jun MatsumotoJun Matsumoto
(Department of Earth & Planetary Sci(Department of Earth & Planetary Science, University of Tokyo)ence, University of Tokyo)
IntroductionIntroduction
• Heavy rainfalls are very important climatological events sometimes causing flood disasters.
• The purpose of this study is to clarify climatological (spatial, seasonal, and inter-annual) characteristics of heavy rainfalls over Southeast Asia.
• This is a preliminary study in Thailand from 1998 to 2000.
Data & methodData & method
• Precipitation data – daily precipitation data at 106 TMD stations including agromet. stations, for 3 years from 1998 to 2000.
• Daily surface weather charts and upper wind fields at 600 meters analyzed by TMD are used to classify synoptic systems as the cause of heavy rainfalls.
Data & method (contd.)Data & method (contd.)
• For each heavy rainfall (>=50mm/day), the cause is identified in 6 synoptic systems, TC (tropical cyclone; typhoon), ITCZ (ITCZ; intertropical convergence zone), LC (local cyclone), WM (westerly monsoon), EM (easterly monsoon), and Ot (others).
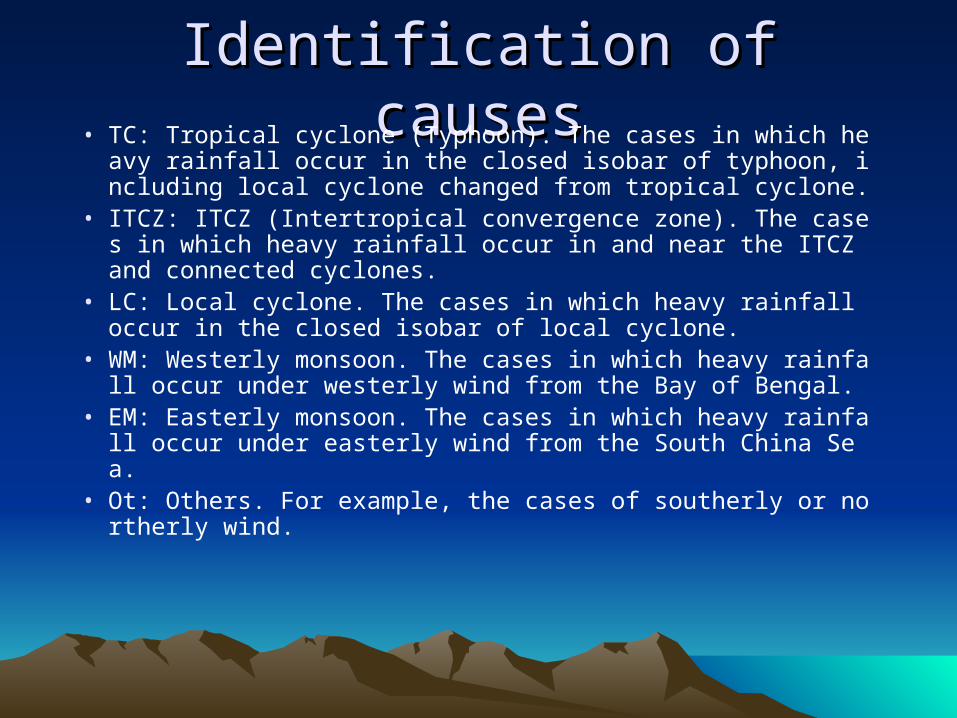
Identification of causesIdentification of causes• TC: Tropical cyclone (Typhoon). The cases in which heavy ra
infall occur in the closed isobar of typhoon, including local cyclone changed from tropical cyclone.
• ITCZ: ITCZ (Intertropical convergence zone). The cases in which heavy rainfall occur in and near the ITCZ and connected cyclones.
• LC: Local cyclone. The cases in which heavy rainfall occur in the closed isobar of local cyclone.
• WM: Westerly monsoon. The cases in which heavy rainfall occur under westerly wind from the Bay of Bengal.
• EM: Easterly monsoon. The cases in which heavy rainfall occur under easterly wind from the South China Sea.
• Ot: Others. For example, the cases of southerly or northerly wind.
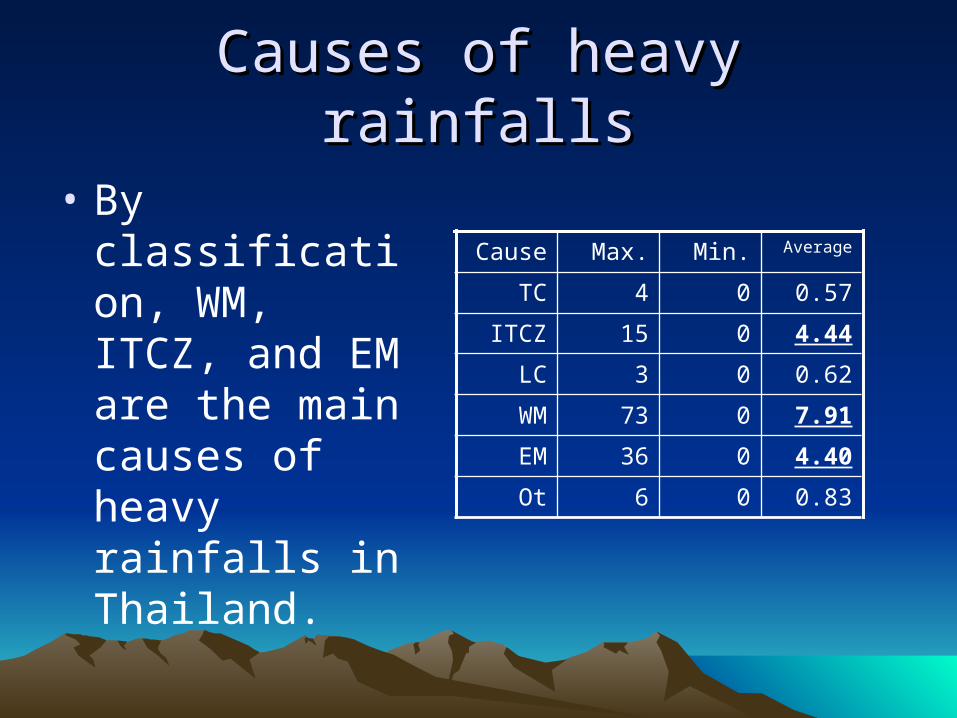
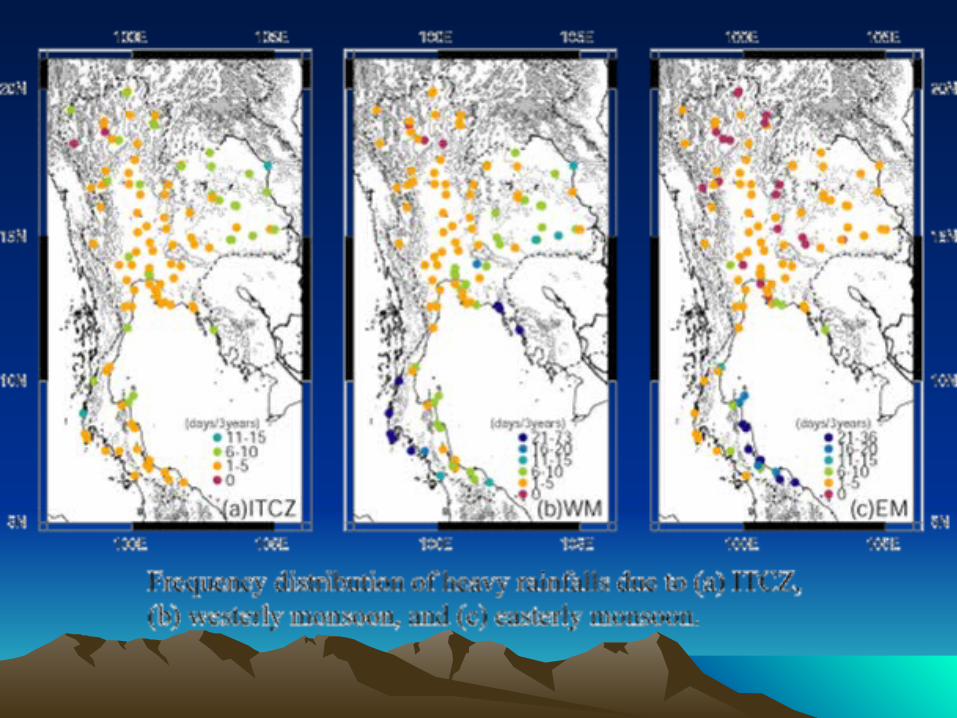
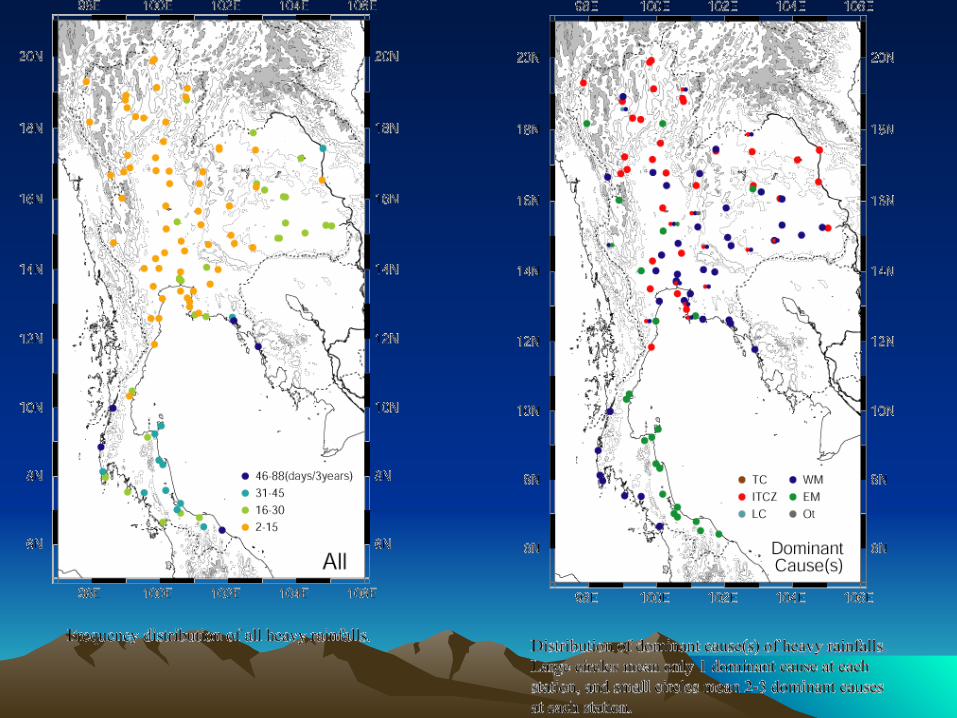
Causes of heavy rainfallsCauses of heavy rainfalls
• By classification, WM, ITCZ, and EM are the main causes of heavy rainfalls in Thailand.
0.8306Ot
4.40036EM
7.91073WM
0.6203LC
4.44015ITCZ
0.5704TC
AverageMin.Max.Cause
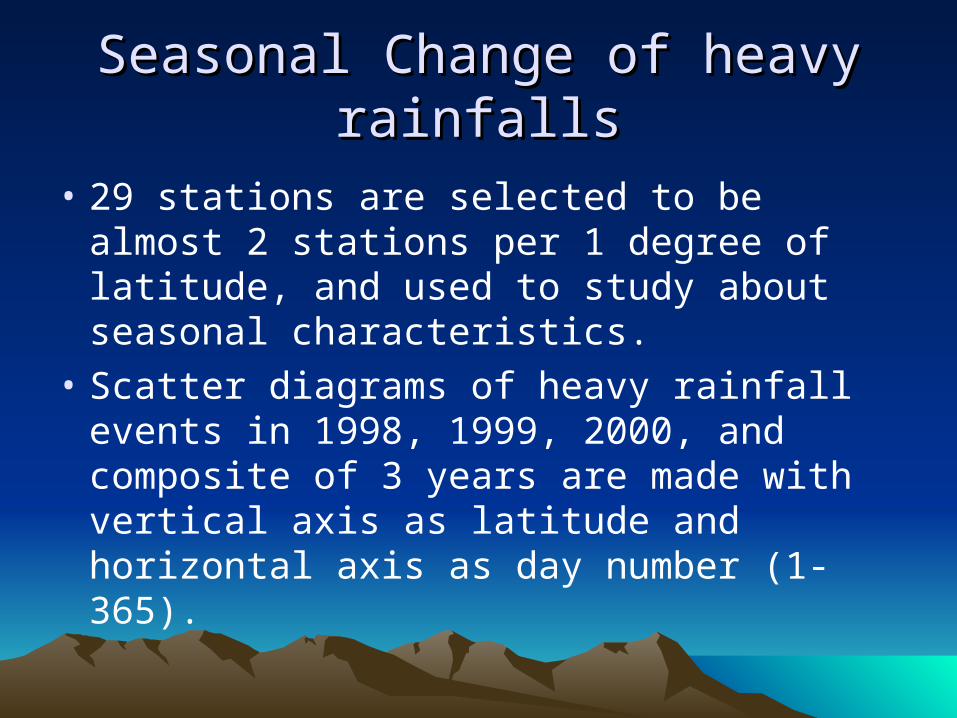
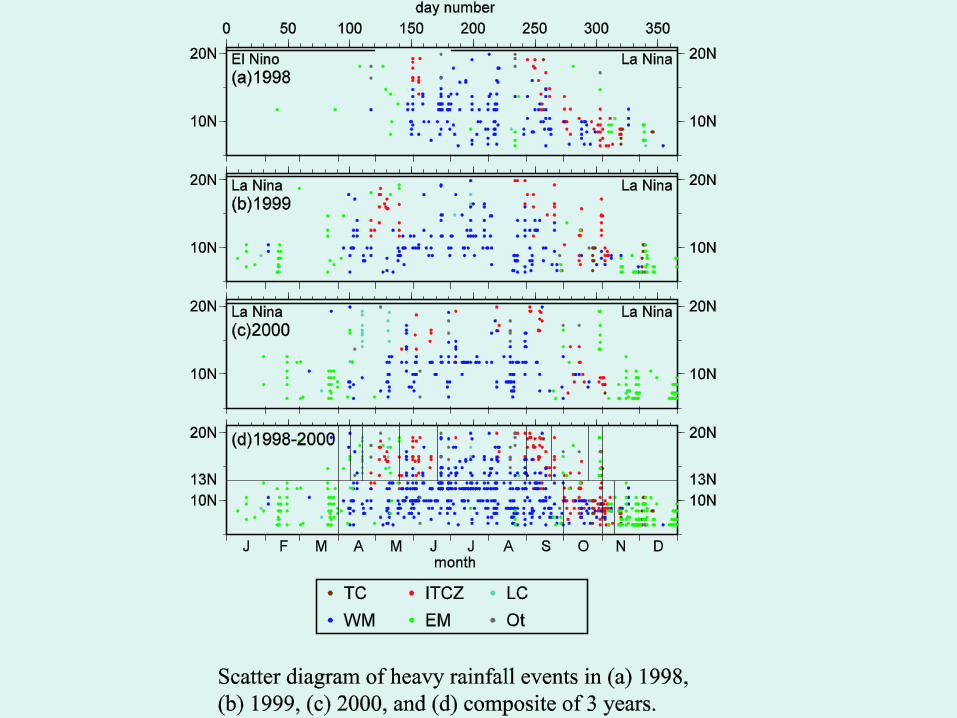
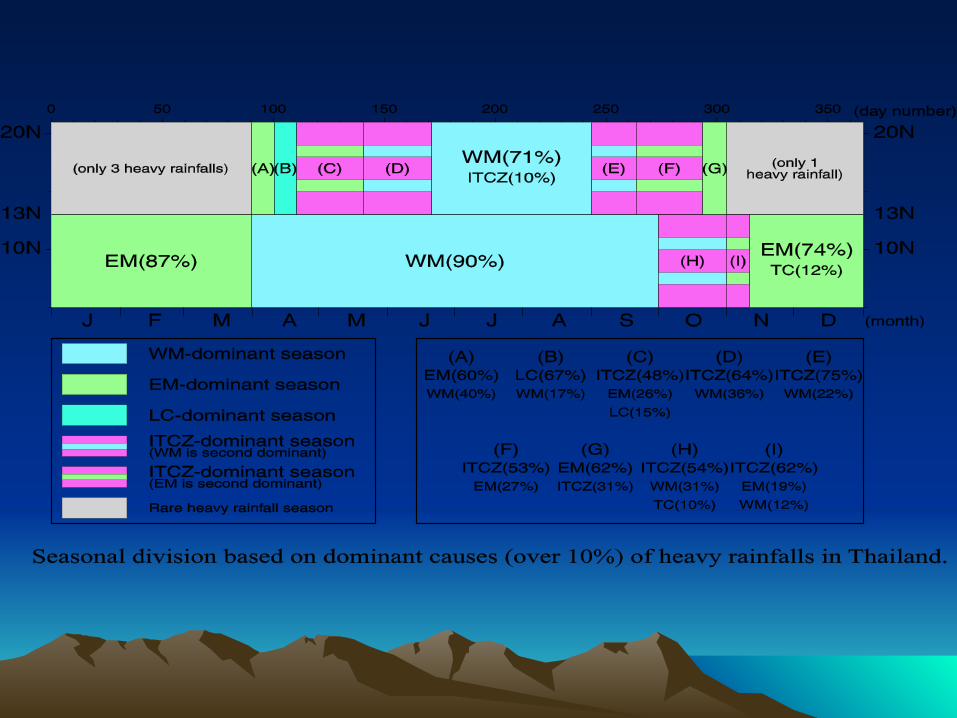
Seasonal Change of heavy rainfallsSeasonal Change of heavy rainfalls
• 29 stations are selected to be almost 2 stations per 1 degree of latitude, and used to study about seasonal characteristics.
• Scatter diagrams of heavy rainfall events in 1998, 1999, 2000, and composite of 3 years are made with vertical axis as latitude and horizontal axis as day number (1-365).
Concluding remarksConcluding remarks
• Main causes of heavy rainfalls in Thailand are ITCZ, WM, and EM.
• Orographic effect is clear in case of WM and EM, but it is not clear in ITCZ.
• In northern division, ITCZ-dominant season is the longest in total. In southern division, WM-dominant season and EM-dominant season are almost 5 months or more.
Future worksFuture works
• Longer data (30 years or more?)
• Data in other Indochina countries (Vietnam, Laos, Cambodia, and Myanmar)
• Inter-annual variability of heavy rainfalls, including their relation to El Nino/La Nina event
Inter-annual Variation of Inter-annual Variation of Tropical Cyclone Tropical Cyclone
approaching Indochinaapproaching Indochina
Hideaki SHOJI Hideaki SHOJI and and
Jun MATSUMOTOJun MATSUMOTO (Department of Earth and Planetary (Department of Earth and Planetary
Science, University of Tokyo, JAPAN)Science, University of Tokyo, JAPAN)
IntroductionIntroduction• This investigation shows the seasonal and inte
r-annual variations of the TCs approaching Indochina (TCIC).
• Also shown are the characteristics of the large-scale flow pattern between the abundant TCIC (ATCAC) and no TCIC (NTCIC) years in order to through insight on the mechanism of inter-annual variations of the number of TCIC.
Data and MethodData and Method
• Tropical cyclone best-track positions for 50 years from 1951 to 2000 are obtained from the Japan Meteorological Agency (JMA). Some of TCs generated over the WNP move westward across 110°E and approaching Vietnam coast. These TCs are called TCIC in the present paper.
• To investigate the large-scale flow patterns, the monthly mean wind data at 850 and 500 hPa are utilized based on the reanalysis of the National Center for Environmental Prediction (NCEP) for the period 1951-2000. The wind data at 500 and 850 hPa are utilized
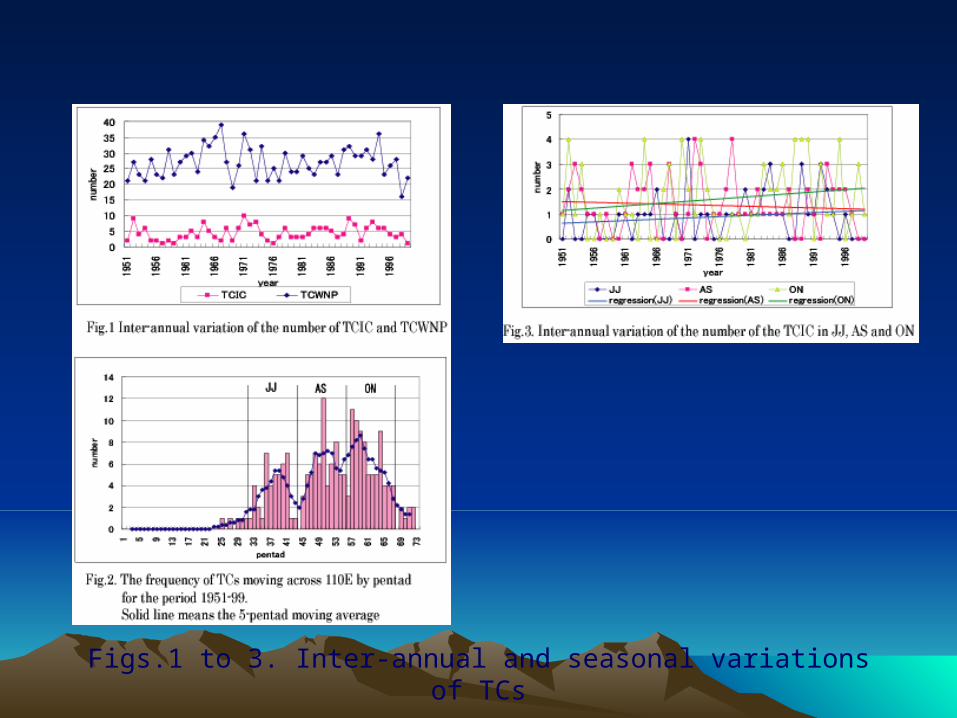
Figs.1 to 3. Inter-annual and seasonal variations of TCs
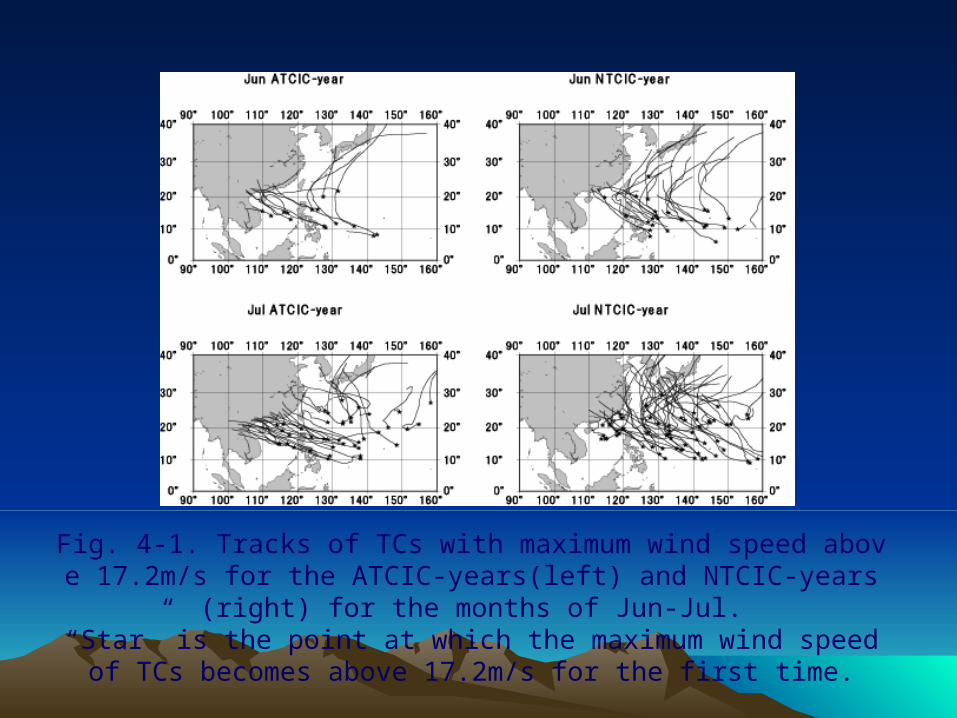
Fig. 4-1. Tracks of TCs with maximum wind speed above 17.2m/s for the ATCIC-years(left) and NTCIC-years(right) for the months of Jun-Jul.“Star” is the point at which the maximum wind speed of TCs becomes
above 17.2m/s for the first time.
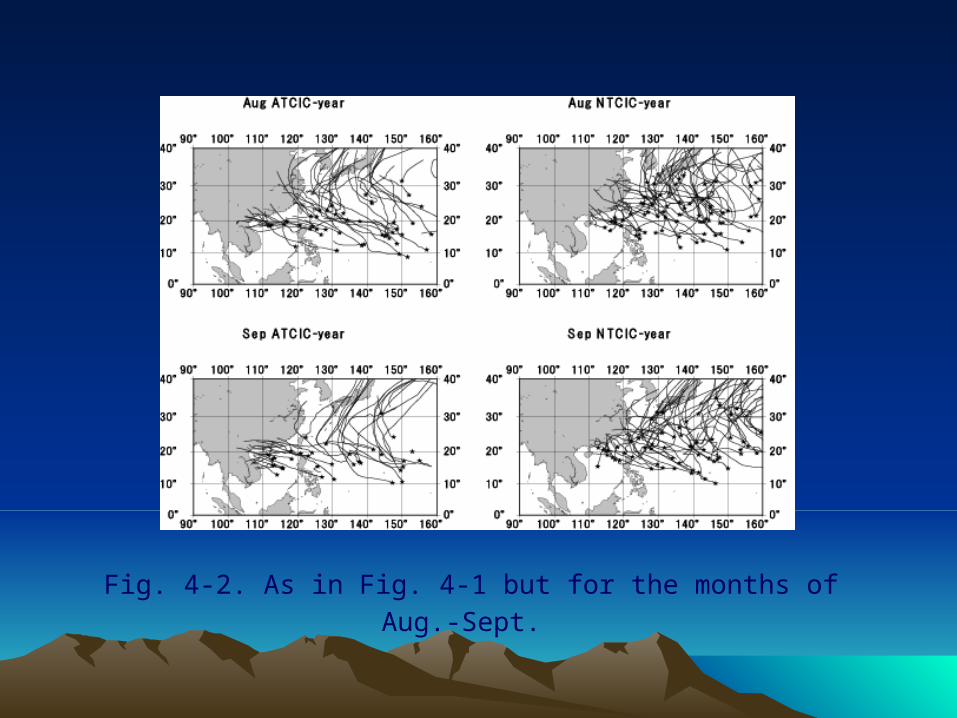
Fig. 4-2. As in Fig. 4-1 but for the months of Aug.-Sept.
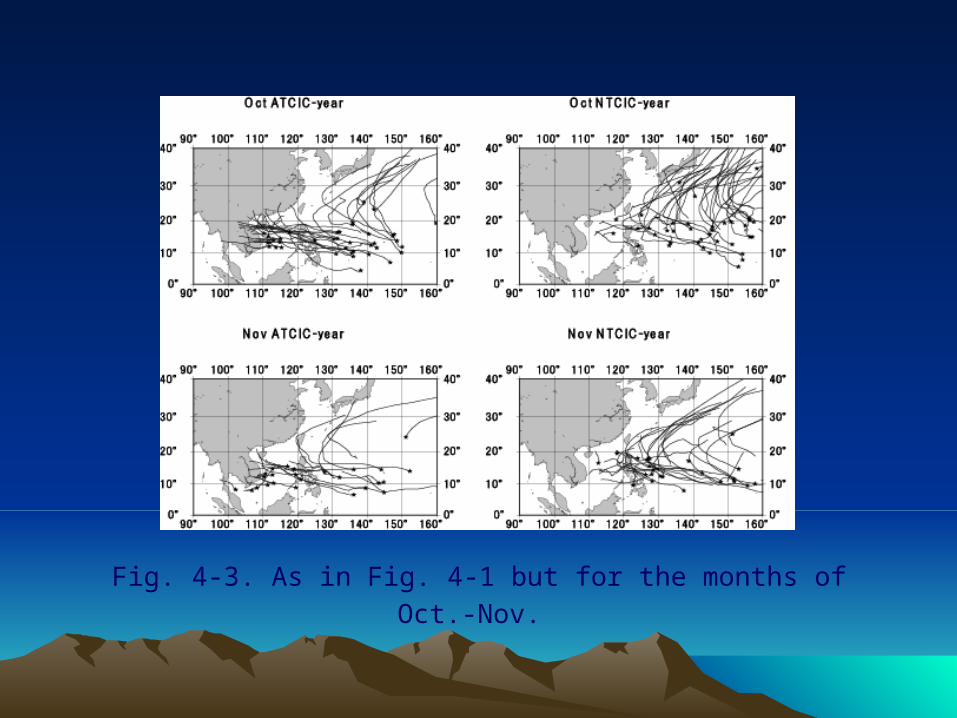
Fig. 4-3. As in Fig. 4-1 but for the months of Oct.-Nov.

Fig. 5-1. Monthly wind vectors (left) and anomalous wind vectors (right) at 500hPa for the ATCIC-years for the months of Jun.-Jul.
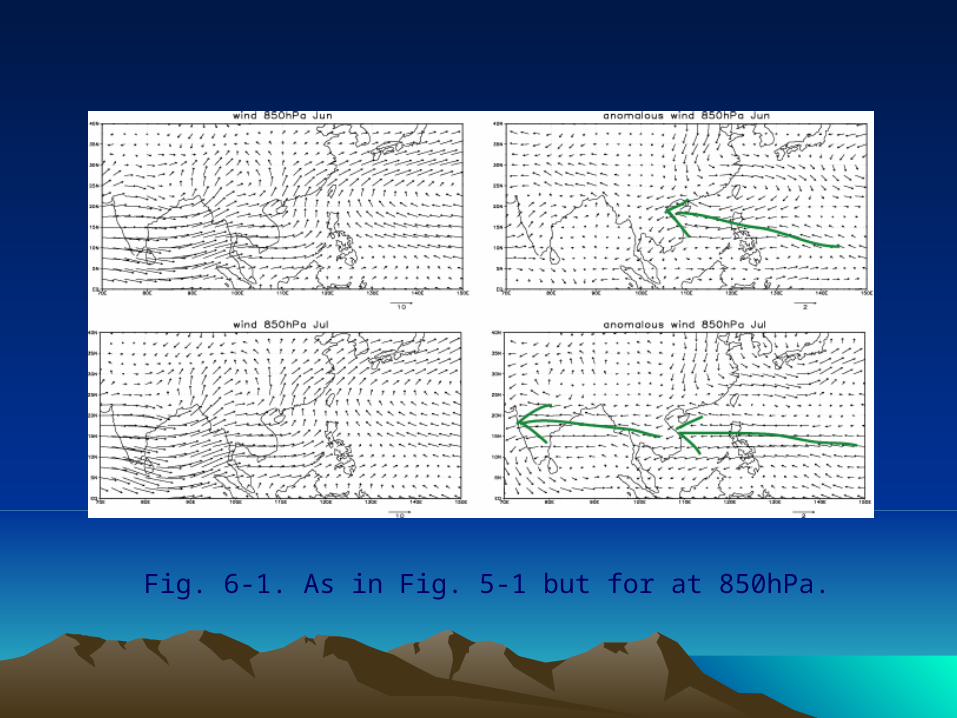
Fig. 6-1. As in Fig. 5-1 but for at 850hPa.
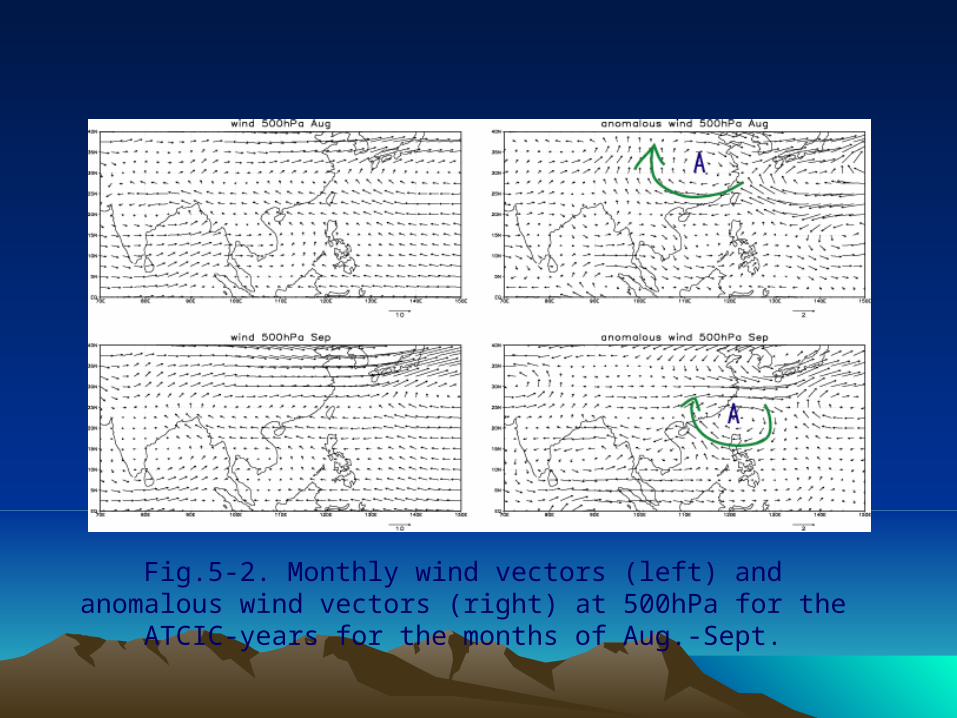
Fig.5-2. Monthly wind vectors (left) and anomalous wind vectors (right) at 500hPa for the ATCIC-years for the months of Aug.-Sept.
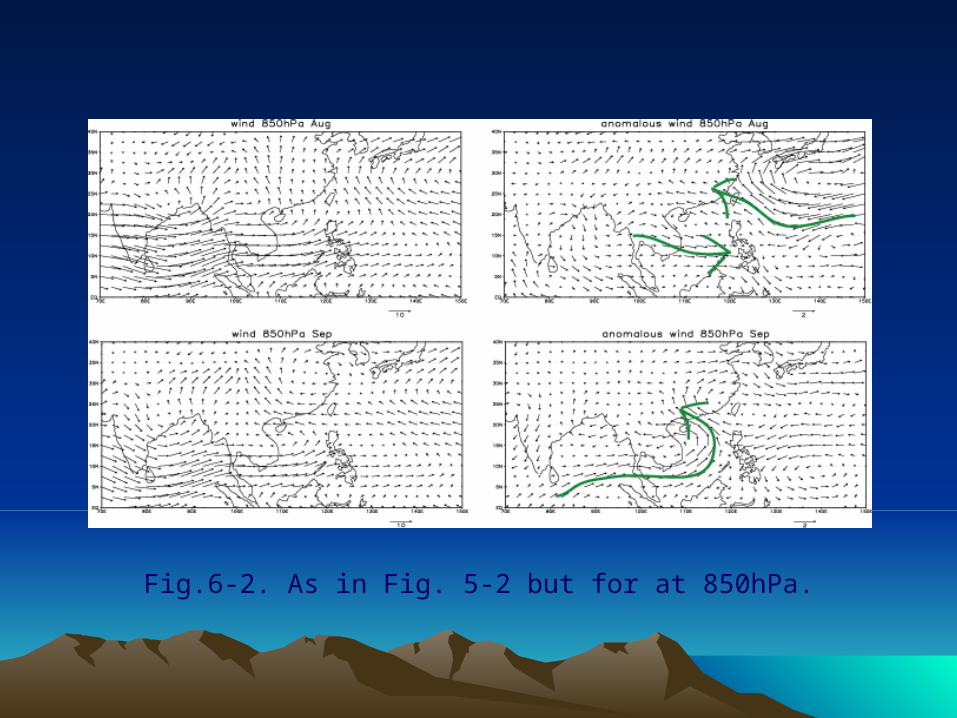
Fig.6-2. As in Fig. 5-2 but for at 850hPa.
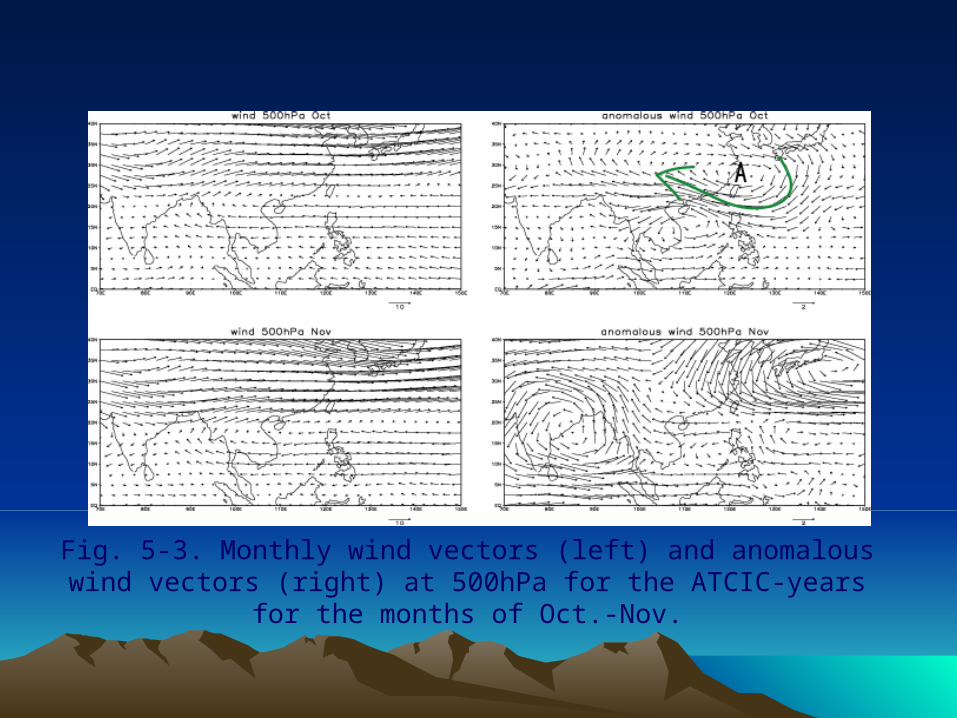
Fig. 5-3. Monthly wind vectors (left) and anomalous wind vectors (right) at 500hPa for the ATCIC-years for the months of Oct.-Nov.
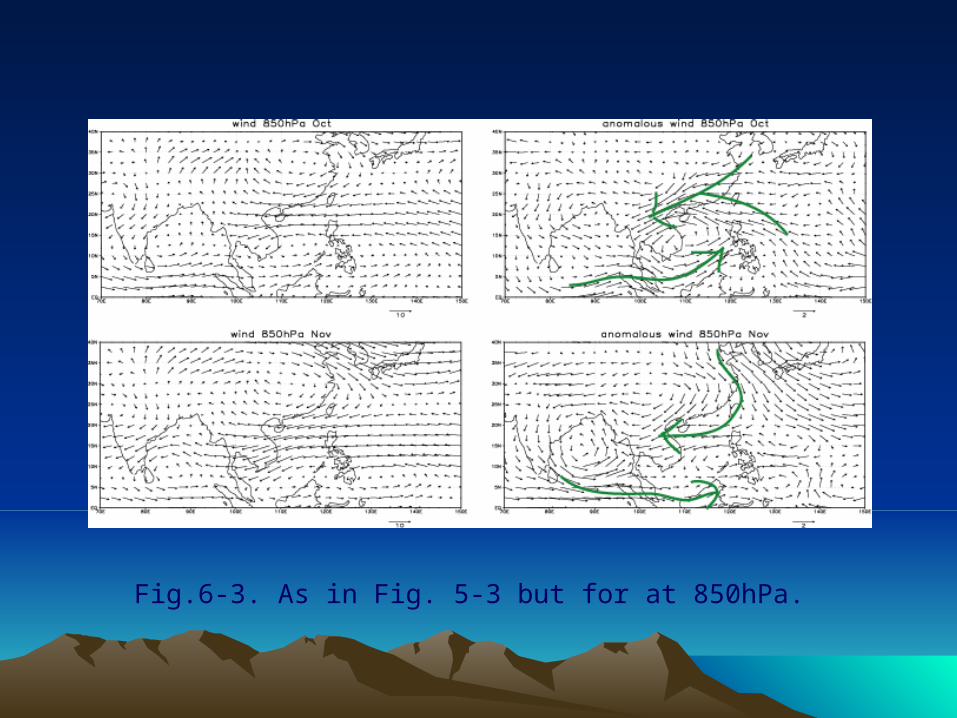
Fig.6-3. As in Fig. 5-3 but for at 850hPa.
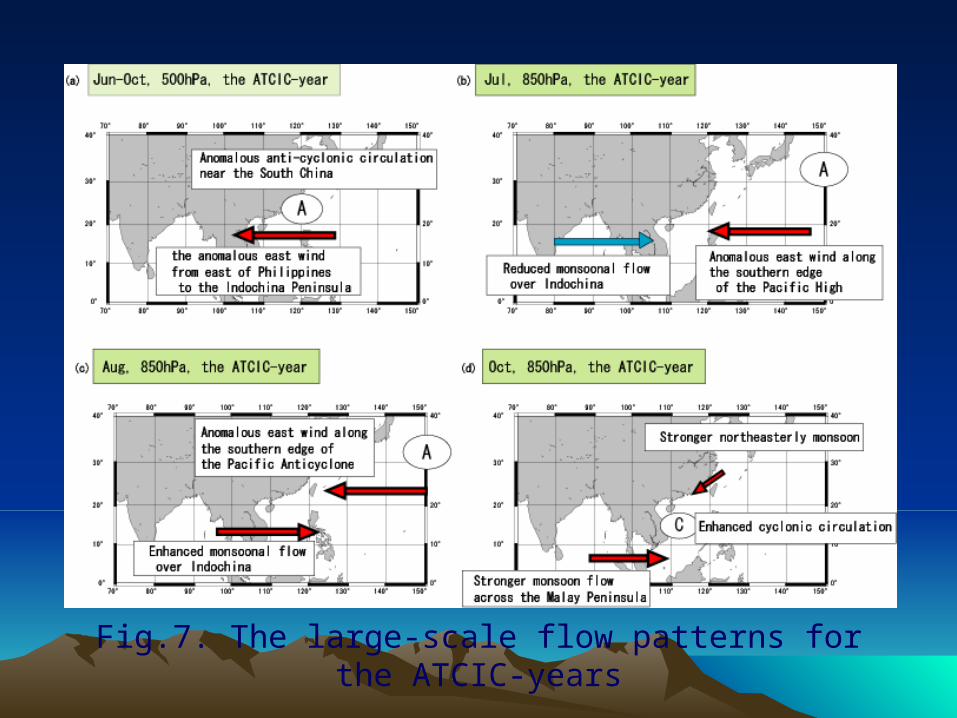
Fig.7. The large-scale flow patterns for the ATCIC-years

• The number of TCIC in a year has no long-term trend. TCICN in JJ and ON has increasing trend for the period 1951-2000, but TCIC in AS has decreasing trend.
• The inter-annual variation of the number of TCIC is not related to that of TCWNP.
• When abundant TCs approach Indochina, the anomalous easterly from east of the Philippines to the Indochina Peninsula is found at 500hPa.
• The variation of TCIC is related to the easterly wind along the south edge of Pacific High in Jun-Aug.
• Between July and August, the effect of monsoon flow over Indochina to the TCIC is reversed.
• In Oct-Nov, the westerly monsoon across the Malay Peninsula and the northeasterly monsoon are both stronger in ATCIN-year.