modelsheet and the modelsheet logo are registered trademarks of modelsheet software, llc. copyright...
TRANSCRIPT

ModelSheet and the ModelSheet logo are registered trademarks of ModelSheet Software, LLC.Copyright © 2009 by ModelSheet Software, LLC
Business Analyticsfor Decision Support
10/16/08

Copyright © 2009 ModelSheet Software, LLC.®
Principal Consultant in Business Analytics
Howard I. Cannon, Chairman and CTO, Founder While working on the MIT Research Staff, Howard invented Flavors, the first non-hierarchical object-oriented programming system. He co-founded Symbolics, where he engineered major pieces of the company's hardware and software, founded and ran the successful Graphics Division, and as VP of Product Marketing managed the introduction of several key products. He was VP of Development at Macsyma, where he led a small team that produced review-winning technology when matched against much larger competitors. Howard founded Groton NeoChem, where he led the development and marketing of revolutionary Web-based data management software for drug discovery. The company was sold to SciQuest. He has been an executive in a number of other companies, where he led development and made numerous technical innovations. Howard did undergraduate work at MIT.
Richard J. Petti, President, Founder As a marketing executive at MathWorks, a $400 million software company, Dick introduced revolutionary business analytics that directly impacted overall revenue and profitability, contributed on all 11 management boards for commercial businesses, and restructured strategic planning to enable project champions and executives to better evaluate opportunities. As Division GM at Symbolics, he turned around the Macsyma business and raised funding to spin it off as Macsyma Inc., which he ran until its acquisition by a defense contractor. Dick served as a consultant at McKinsey, where he received top ratings for his financial analysis, operations analysis, and troubleshooting in R&D management. Dick has worked or consulted in 8 businesses in Fortune 100 companies, including GE HQ and two other GE locations. MBA U Chicago, PhD Berkeley, BS MIT.
2

Copyright © 2009 ModelSheet Software, LLC.®
3
Experience includes diverse industries and functions.
Industries
Functions Software Manufacturing Service Consulting
General Management
Macsyma, Inc. Symbolics Armstrong Computing
McKinsey
Booz, Allen & Hamilton
Marketing, Bus. Planning
MathWorksMacsymaSymbolics Hasbro InteractiveAlphatechGroton NeochemInsightful
SciComp
GE HQGE Wireless CommunicationsAT&TExxon Nuclear
McKesson
Manufacturing& Computer Operations
GE LightingBoeing
American Express
Product Development
MacsymaSymbolicsIntellivid
GE LightingXerox
Pilgrim Telephone
Industry and Functional Background
Return

Copyright © 2009 ModelSheet Software, LLC.®
4
Outline
Marketing Programs
Product Programs
SalesAnalysis
Sales Planning& Resources
• Product profitabilityoSoftware qualityoModelSheet model
(Product profitability)
• Program profitabilityoPricing analysisoData miningoModelSheet Model
(Program profitability)
Operations Analysis
oManufacturing oDistributionoComputer operationsoModelSheet model
(Process flow analysis)
• Sales planning• Sales force
organization
Summary &Next Steps
Introduction
• Background• Strategy & analytics
Business Development
• Project selectionoBusiness planningoBusiness cases
• In-depth sales analysis• Color maps• Market basket analysis• Customer x product
profitability
Key:• Included in main presentationo Excluded from main presentation
oProject cost accountingoModelSheet models– Business financial plan– Investment project analysis
Finance

Copyright © 2009 ModelSheet Software, LLC.®
5
Effective use of information is an increasing source of advantage in non-information industries.
“Is a supermarket a business that sells food, or is it a business that exploits knowledge
about customer preferences, geographical biases, supply chain logistics, product life cycle, many kinds of sales information
to optimize its operationsdelivery, inventory, pricing, product placement, promotion
to grow and increase margin?
The answer to that question may determine your company’s long-term viability in the Information Age.”
Source: Business Intelligence, by David Loshin, page 11
Strategy and analytics

Copyright © 2009 ModelSheet Software, LLC.®
6
Business Intelligence transforms data into actions in three stages.
Extract information from data.Analytic information means trends and patterns in data.
Example of information: Sales of product A are lower in German Auto industry and higher in Japan than in overall Auto markets.
Create knowledge from analytic information and business context.Knowledge means placing information in a business context, including causes, effects, interrelationships.
Example: Product A sells more in Germany and less in Japan because it use used in electronics pioneered in Germany that Japan has not adopted.
Create plans and actions from knowledge to improve results.– Create tactical plans the serve the existing strategy. – Alter strategy for serving customers and generating value.
Strategy and analytics

Copyright © 2009 ModelSheet Software, LLC.®
7
Business intelligence can transform data into actions in many parts of a business.
Sales analysis: analyze patterns of strength and weakness
BenefitsDomain
Yields better decisions than ad-hoc opinions
Sales plans: produce consistent, detailed sales plans
Allocate resources better, build consensus behind targets
Marketing programs: measure revenue generation, profit
Let marketing ROI drive most marketing programs
Product and channel profitability Take account of profitability, but don’t let it dominate planning.
Investment project evaluation: score candidate projects
Scoring systems and tools aid very complex decisions.
Operations analysis: quantify costs, margins in manufacturing, distribu-tion, service, admin processes
Translate objectives into operational metrics and goals.
Strategy and analytics
Return

Copyright © 2009 ModelSheet Software, LLC.®
8
Outline
Marketing Programs
Product Programs
SalesAnalysis
Sales Planning& Resources
• Product profitabilityoSoftware qualityoModelSheet model
(Product profitability)
• Program profitabilityoPricing analysisoData miningoModelSheet Model
(Program profitability)
Operations Analysis
oManufacturing oDistributionoComputer operationsoModelSheet model
(Process flow analysis)
• Sales planning• Sales force
organization
Summary &Next Steps
Business Development
Introduction
• Background• Strategy & analytics
• Project selectionoBusiness planningoBusiness cases
• In-depth sales analysis• Color maps• Market basket analysis• Customer x product
profitability
Key:• Included in main presentationo Excluded from main presentation
oProject cost accountingoModelSheet models– Business financial plan– Investment project analysis
Finance

Copyright © 2009 ModelSheet Software, LLC.®
9
Challenge: Identify high and low-performing marketing programs.
• What does 'success' mean for a marketing program?
• Revenue-generation metrics are often misleading.– How do you allocate credit among marketing programs that touched a
customer?
• Lead generation metrics are often misleading.– Lead-to-order conversion rates and average order sizes vary across
segments.
Marketing programs evaluation
Most companies can’t adequately measure effectiveness of Marketing and Sales programs.

Copyright © 2009 ModelSheet Software, LLC.®
10
Solution: Evaluate programs mostly on revenue generation and contribution margin.
• Key Assumptions / Methods– The customer is the site, not the person who purchases. – Each lead event declines in effectiveness over time.– Program event types have different levels of impact.– Allocate revenues to marketing programs.
• Measures of Effectiveness– Generation of leads / new leads / or highly qualified leads– Generation of revenue / new customer revenue– Contribution margin is generally the best metric.
• How to use the Metrics– Compare programs by program type and at several levels of hierarchy.– Compare programs for each market segment.– Combine metrics with field knowledge.
Industry: Technical
Software
Industry: Technical
Software
Marketing programs evaluation

Copyright © 2009 ModelSheet Software, LLC.®
11
Marketing Program Analysis
Pgm Cluster (All) Cmpgn (All)Sector (All) Sales Tier (All)Pgm Bud Office (All) Acct Location FrancePgm Grp (Multiple Items) Acct Ind Grp AutoPgm Ind Grp (All) New/Old (All)Pgm Ind Fam (All) Opty/Order (All)Unprod_Ld? (All) Lead Qtr Q1Cmpgn Attend (All) Lead Yr 2005Pgm Family (All) Rev_Ev_Yr (All)Acct Region (All)
DataPgm Type Pgm Sub-Type Pgm Win $ CM $ CM %Seminar Private Seminar FR - Paris - 2005Jan15 9,073 7,855 93.8%
FR - Rouen - 2005Jan26 630 470 33.9%Private Seminar Total 9,703 8,325 85.8%Public Seminar FR- Platform Lille - 2005Mar12 330 337 96.9%Public Seminar Total 330 337 96.9%
Seminar Total 10,033 8,662 86.4%
Specify type of lead event
Specify country and industry
Specify year, quarter of event
Marketing program analysis shows leads,imputed revenue, contribution margin $ and %.
Program Event with very low
CM %
All reports contain illustrative data
Marketing programs evaluation

Copyright © 2009 ModelSheet Software, LLC.®
12
Client Impact: Marketing Program Analysis had a strong impact at MathWorks.
• Sales VP: “Revenues are below plan. I want more promotional spending in every area.”
• CEO: “I won’t spend more until I know where and how effective are the millions we now spend.”
• 1-2 years later: Marketing uses new metrics to identify individual program events to improve or eliminate.
• 3 years later: Director of Marketing Programs gets ovation during presentation in German office for quantitatively linking strong/weak product-industry segments, customer sites, and marketing programs.
Marketing programs evaluation

Copyright © 2009 ModelSheet Software, LLC.®
13
Outline
Marketing Programs
Product Programs
SalesAnalysis
Sales Planning& Resources
• Product profitabilityoSoftware qualityoModelSheet model
(Product profitability)
• Program profitabilityoPricing analysisoData miningoModelSheet Model
(Program profitability)
Operations Analysis
oManufacturing oDistributionoComputer operationsoModelSheet model
(Process flow analysis)
• Sales planning• Sales force organi
zation
Summary &Next Steps
Business Development
Introduction
• Background• Strategy & analytics
• Project selectionoBusiness planningoBusiness cases
• In-depth sales analysis• Color maps• Market basket analysis• Customer x product
profitability
Key:• Included in main presentationo Excluded from main presentation
oProject cost accountingoModelSheet models– Business financial plan– Investment project analysis
Finance

Copyright © 2009 ModelSheet Software, LLC.®
14
Challenge: Forecast sales for a business with thousands of segments.
Segments defined by
products, channels, customer industries/sectors, product options, revenue categories and interrelated interdependencies between segments.
Managers can not humanly track thousands of segments
Managers must have final say on high-level targets
But cannot humanly deal with excessive detail
Sales planning

Copyright © 2009 ModelSheet Software, LLC.®
15
Solution: Let managers' judgment control the overall plan and let historical data provide detail.
Our tools:
Base plan on managers' targets for larger segments
• By revenue categories, product, location/channel, license option, customer industry and sector.
• Use hierarchies of products, locations/channels and industries.
Use historical data to plan detailed segments
Use centrally-planned estimates of macro-effects
Ensuring consistent macro-assumptions across the company and freeing segmentmanagers from this burden.
Set up performance metrics that are independent of macro-effects.
Your segment managers can predict growth relative to overall company plan in a more straightforward way.
Industry: Technical
Software
Industry: Technical
Software
Sales planning

Copyright © 2009 ModelSheet Software, LLC.®
16
Manager’s targets control the plan;historical data provides background detail.
Managers’ revenue targets
Green indicates plan matches targets well.
Red indicates plan doesn’t matches targets so well.
Managers’ revenue targets
Sales planning
Managers' Inputs to Sales Plan - Locations (Channels)
Location Region
Mgr
Target
Perp Rev
($K)
Mgr
Target
Perp Rev
Grow %
Plan Perp
Rev ($K)
Plan Perp
Rev Grow
%
(Fcst- Mgr
Target)
Perp Δ%
Mgr
Target
Support
Rev ($K)
Mgr
Target
Support
Rev Grow
%
Plan
Support
Rev ($K)
Plan
Support
Rev Grow
%
(Fcst- Mgr
Target)
Support
Δ%
NA-National NA 19,890 19,907 7.2% 0.1% 53,980 53,063 26.1% - 2.2%
NA-Regional NA 14,890 14,901 7.4% 0.1% 30,208 30,990 29.0% 3.3%
NA-Other NA 24 24 9.9% 0.2% 34 35 32.2% 3.2%
France EMEA 3,058 3,059 28.1% 0.0% 10,780 10,819 40.2% 0.5%
Germany EMEA 6,450 6,452 16.1% 0.0% 15,900 16,014 28.7% 0.9%
Nordic EMEA 2,240 2,241 27.5% 0.0% 7,984 7,966 34.4% - 0.3%
UK EMEA 2,570 2,571 5.8% 0.0% 7,670 7,672 26.5% 0.0%
EMEA-Other EMEA 5,989 5,992 6.1% 0.1% 14,985 14,889 34.8% - 0.9%
Japan APLA 7,193 7,197 5.5% 0.1% 11,856 11,463 11.6% - 3.8%
APLA-Other APLA 5,090 5,094 5.8% 0.1% 6,977 6,382 4.6% - 9.8%
Total 67,394 8.9% 67,439 9.0% 0.1% 160,374 27.6% 159,292 26.7% - 0.9%
Locations Perpetual License Revenue Support Revenue

Copyright © 2009 ModelSheet Software, LLC.®
17
Usually allow manager’s location targets to dominate over industry targets.
Inputs to Sales Plan - Industries
Mgr Target Mgr Target Plan Plan
(Plan - Mgr
Trgt) Mgr Target Mgr Target Plan Plan
(Plan - Mgr
Trgt)
I _Family I _Group Rev ($K) Growth % Rev ($K) Growth % Δ% Rev ($K) Growth % Rev ($K) Growth % Δ%
Aero Defense Aero Defense 10.0% 25,112 7.7% - 2.3% 64,178 21.6% 0.0%
Auto-OEM Auto 10.0% 8,787 9.4% - 0.6% 22,614 23.0% 0.0%
Auto-Parts Auto 12.0% 2,290 13.2% 1.2% 4,434 41.2% 0.0%
Comms Electronics 12.0% 5,939 10.4% - 1.6% 14,091 26.3% 0.0%
Computers Electronics 14.0% 3,147 10.0% - 4.0% 6,403 30.7% 0.0%
Boards Electronics 13.0% 3,135 10.4% - 2.6% 6,648 26.2% 0.0%
Semicond Electronics 14.0% 4,254 11.9% - 2.1% 11,588 67.4% 0.0%
Ind Equip Ind Equip 12.0% 4,630 9.7% - 2.3% 8,651 23.4% 0.0%
Instruments Tier 2 12.0% 3,024 9.7% - 2.3% 5,277 31.3% 0.0%
Medical Tier 2 10.0% 2,321 7.1% - 2.9% 4,714 31.9% 0.0%
Process Ind Tier 2 8.0% 4,800 6.9% - 1.1% 10,694 25.3% 0.0%
68,620 10.9% 67,439 9.0% - 1.9% 159,292 26.7% 159,292 26.7% 0.0%
Support RevenueIndustries Perpetual License Revenue
Managers’ revenue growth targets
Yellow indicates plan matches
targets fairly well.
No managers’
targets
Sales planning

Copyright © 2009 ModelSheet Software, LLC.®
18
Sales plan shows detail similar to that in sales analyses.
Output of Revenue Plan
P_Family (All) Region (All) I_Family (All)Product (All) Location (All) Option (All)Pr_Mgr (All) I_Group (All)
DataRev Class P_Group 2002 2003 2004 2005 2006 Var 2006 GR 2003 GR 2004 GR 2005 GR 2006Perp PL 32,427 31,188 35,948 39,458 42,830 3,372 -3.8% 15.3% 9.8% 8.5%
Add-ons 19,593 18,320 21,278 22,425 24,609 2,184 -6.5% 16.1% 5.4% 9.7%Perp Total 52,020 49,508 57,226 61,882 67,439 5,556 -4.8% 15.6% 8.1% 9.0%Support PL 33,852 33,203 36,405 40,526 55,400 14,874 -1.9% 9.6% 11.3% 36.7%
Add-ons 17,377 16,513 20,348 20,775 35,902 15,126 -5.0% 23.2% 2.1% 72.8%Support Total 51,228 49,717 56,753 61,301 91,302 30,001 -3.0% 14.2% 8.0% 48.9%Grand Total 103,248 99,224 113,979 123,183 158,740 35,557 -3.9% 14.9% 8.1% 28.9%
Sales history, 4 years
Planned revenue
Growth history,
3 years
Planned growth
Can filter plan like sales reports
Sales planning

Copyright © 2009 ModelSheet Software, LLC.®
19
Client Impact: Sales Planning Tools improve segment detail, credibility and consensus around sales plans.
• Product, industry managers have stronger voice in sales plan.
• Plans can track detail variances in reviews.
• Centralized forecasting of overall sales improves sales plan.
• Sales plan has greater buy-in from executives and managers.
Return
Sales planning

Copyright © 2009 ModelSheet Software, LLC.®
20
Challenge: Help sales reps to sell solutions in second-tier customer industries.
Geographic sales reps are too diversified to learn industry problems and solutions.
• Second-tier industries suffer most: communications, electronics, financial services, biotech-pharmaceutical, industrial equipment.
• Smaller customers in major industries, served by Geo reps, suffer too. – National account sales has focus needed to sell solutions in largest industries:
aero-defense, automotive.
Previous attempt to organize by industry caused “a train wreck.”
• Must assign new accounts to right industry in real time.• Commission squabbles• Sales management highly valued administrative simplicity.
Sales force organization

Copyright © 2009 ModelSheet Software, LLC.®
21
Solution: Reorganize global sales by industry,but flexibly.
Explore the facts.• Solicit opinions of industry and SBU marketing managers and sales reps.• Compare specialization by industry with rep productivity.
– Use ‘Gini’ specialization indices by industry and sales channel.
Design methods, build support.• Initiate discussion with geographic sales management.• Promote flexible industry assignment to senior management.
– 80:20 rule is OK. Fix account assignments gradually over several years.– Discuss relative value of simple sales admin and selling effectiveness.
• Follow up with matrixed multifunctional industry teams.
Expand to global sales force.• Implement in U.S. and largest foreign markets.• Implement across national borders in selected situations.
Industry: Technical
Software
Industry: Technical
Software
Sales force organization

Copyright © 2009 ModelSheet Software, LLC.®
22
Client Impact: Worldwide sales force enabled to sell solutions in secondary industries.
• Marketers and sales reps in secondary industries thrilled by opportunity to learn problems and sell solutions.
• Project that was resisted at top three levels of management becomes an unqualified success.
Return
Sales force organization

Copyright © 2009 ModelSheet Software, LLC.®
23
Outline
Marketing Programs
Product Programs
SalesAnalysis
Sales Planning& Resources
• Product profitabilityoSoftware qualityoModelSheet model
(Product profitability)
• Program profitabilityoPricing analysisoData miningo ModelSheet Model
(Program profitability)• In-depth sales analysis• Color maps• Market basket analysis• Customer x product pro
fitability
Operations Analysis
oManufacturing oDistributionoComputer operationsoModelSheet model
(Process flow analysis)
• Sales planning• Sales force
organization
Summary &Next Steps
Business Development
Introduction
• Background• Strategy & analytics
• Project SelectionoBusiness planningoBusiness cases
Key:• Included in main presentationo Excluded from main presentation
Finance
oProject cost accountingoModelSheet models– Business Financial plan– Investment project analysis

Copyright © 2009 ModelSheet Software, LLC.®
24
Challenge: Managers find it hard to cut through data complexity to reveal detailed sales trends.
First, adjust sales for distortions in revenue
Due to currency exchange rates, geographic differences in actual prices, channel or customer discounts, price changes over time, purchase of distributor, trade-ins, upgrades
in unit salesDue to product options, trade-ins and upgrades.
due to timing from seasonality, random large orders, prepayments.
Detect and analyze trends in secondary segments.– Growth trends in smaller segments often signal emerging opportunities.– Define segments by products, locations, industries, revenue categories.
Sales analysis

Copyright © 2009 ModelSheet Software, LLC.®
25
Solution: Highlight broad and detailed trends by segment and adjust for the most common distortions.
Our tools:
Enable fine segmentation and roll-up of company sales.
• By revenue category, product, product option, location/channel, customer industry and sector, and application.
• We use hierarchies of products, locations/channels and industries to deliver appropriate granularity for each situation.
Adjust for structural changes to focus on market effects.
• Adjust revenue for exchange rates and, optionally, by normalizing for price differences due to geographic location, sales channel, volume discounts, and price changes over time.
• We also adjust unit sales by defining 'virtual unit' across product options and accrue for trade-ins and upgrades.
Adjust for timing and noise.
• Report de-seasonalized sales for most purposes. • Recommend using a good revenue recognition policy for early service orders.
Industry: Technical
Software
Industry: Technical
Software
Sales analysis

Copyright © 2009 ModelSheet Software, LLC.®
26
Pivot Table of Revenue - High-Level Overview
Rev-or-Units Rev D-Options (All) I Group (All)Rev Class (All) Region (All) I Family (All)P Family (All) Location-1 (All) Industry (All)Product (All) Location-2 (All) Prod Year (All)Options (All) Location-3 (All) Prod Mgr (All)
DataProd Group 2001 2002 2003 2004 2005 GR 2002 GR 2003 GR 2004 GR 2005Platform A 67,604 74,819 77,709 91,393 106,008 10.7% 3.9% 17.6% 16.0%A Add-ons 51,201 58,882 60,367 75,570 92,199 15.0% 2.5% 25.2% 22.0%Platform B 29,595 34,960 36,084 42,127 46,444 18.1% 3.2% 16.7% 10.2%B Add-ons 36,605 45,287 48,162 62,487 70,518 23.7% 6.3% 29.7% 12.9%Grand Total 185,004 213,949 222,321 271,577 315,169 15.6% 3.9% 22.2% 16.1%
Pivot reports provide overview and drill-down to detail.
Choose • revenue• unit sales• normalized revenue
5-levels of products &
options
4 levels of locations
Revenue classes• product sales• support• leases Prod intro year
measures innovation
Product manager for convenience
Sales history, 5 years
Growth history,
4 years
Roll-up to company total
Sales analysis
3 levels of industries

Copyright © 2009 ModelSheet Software, LLC.®
28
Use fineness appropriate for each management level.Coarse and Fine Segmentation by Location
Rev-or-Vseat V-Units Product (All)Rev Class (All) Options (All)P Group (All) I Group (All)P Family (All) I Family (All)
DataRegion Location-1 Location-2 Location-3 2002 2003 2004 2005EMEA France 18,924 31,789 45,331 35,634
Germany 32,077 43,970 47,089 48,574Nordic 8,868 23,509 3,280 28,703UK 28,758 22,718 27,321 44,693EMEA-Tier 2 Benelux 15,706 -3,284 15,045 11,273
Israel 5,512 20,296 -1,364 23,076Italy 5,186 4,794 21,493 4,208Spain 15,768 9,587 1,603 11,524Switzerland 17,337 13,304 8,484 13,490EMEA-Other Czech Republic 6,142 3,282 -6,382 -9,105
Greece 15,084 1,248 -8,695 -11,381Hungary -6,499 1,252 9,135 5,142Poland -11,251 15,902 -1,053 14,851Russia -10,434 8,432 -8,189 -7,157S Africa -7,036 345 -11,253 3,578Turkey 14,639 -1,298 2,848 2,833EMEA-Remainder 15,349 10,239 9,295 -1,363
EMEA-Other Total 15,993 39,403 -14,294 -2,602EMEA-Tier 2 Total 75,503 84,099 30,966 60,968
EMEA Total 164,129 206,086 153,989 218,573
Sales analysis

Copyright © 2009 ModelSheet Software, LLC.®
29
Order Attach Rates by Customer Site
Rev-or-Units V-Units Prod Mgr (All) I Group (All)Rev Class Perp Prod Year (All) I Family (All)Options (All) Region (All) Site Age (All)P Group (All) Location-1 (All) CoState (All)P Family (All) Location-2 (All) CoSalesTeam(All)
Product DataPlatform 1 Platform 2 Product A Product B
Parent Company CompanySite 2005 2005
2005 %P1 2005
2005 %P1 2005
2005 %P1
Intel Corp Intel R&D 170 25 14.7% 103 60.7% 71 41.8%Intel Corp India 29 0 0.0% 5 17.0% 1 3.4%Intel Corp 13 4 31.9% 13 103.7% 6 47.9%Intel Corp UK Ltd 22 0 0.0% 10 45.5% 16 72.9%Intel Corp Salem, Oregon 1 0 0.0% 0 0.0% 0 0.0%ZAO Intel A/O 1 0 0.0% 0 0.0% 0 0.0%Intel Electronics 74 Ltd 1 1 157.7% 1 157.7% 1 157.7%Intel Products M Sdn Bhd 1 0 0.0% 0 0.0% 0 0.0%
Intel Corp Total 237 30 12.6% 132 55.6% 95 40.0%
Probe why similar customer sites have different product attach rates.
2-levels of customer
organization
Attach rates relative to product Platform 1.
Site age probes how well you attract new customers.
Sales analysis

Copyright © 2009 ModelSheet Software, LLC.®
30
Color Maps help spot segments with above- and below-average performance.
Color Map of Product Attach Rates
Automotive Industry Auto Total
European CountriesEurope Total
AsiaTotal
Product Family Product France Germany Nordic UK OtherPlatform Product Platform % % % % % % % % %
Product family 1 Add-on #1 % % % % % % % % %Add-on #2 % % % % % % % % %Add-on #3 % % % % % % % % %Add-on #4 % % % % % % % % %
Product family 1 Total % % % % % % % % %Product family 2 Total % % % % % % % % %Product family 3 Total % % % % % % % % %
Key: = product attach rate significantly higher than global industry average= product attach rate significantly lower than global industry average=product sales are too low to consider attach rate
North America
Total
France has below-average sales of two add-on
families in Auto industry.
UK has above-average sales of two add-on
families in Auto industry.
UK does not have significant above-average
sales of any add-on product in this family.
Sales analysis
UK has below-average sales of Platform product
in Auto industry.France has above-
average sales of Platform product in Auto industry.

Copyright © 2009 ModelSheet Software, LLC.®
31
“Market basket analysis” shows which products are purchased and used together, and how often.
Definition: “Market basket analysis” computes which products occur together, and how often.
• Analyze orders to determine what products sell together well• Analyze installed base to determine what products are used together
Typical Uses:
• Advise sales reps to focus on best product combos for each segment.Design sales training modules to cover co-use products together.
• Feature most popular product combos in sales & marketing programs.• Adjust product plans based on how customers use products together.• Design product suites.
The term “market basket analysis” comes from grocery marketing. “How many people buy both beer and diapers on Thursdays?”
Sales analysis

Copyright © 2009 ModelSheet Software, LLC.®
32
Client Impact: Sales Analysis Toolsrevolutionized business planning at MathWorks.
• Product managers spend 2-3 hours on each sales review (not 2-3 weeks).
• Reviews waste little time guessing which trends are real and which are artifacts (instead of half the time).
• Improves resource allocations in Marketing and Development.
• Depth and clarity of conclusions in reviews takes a great leap.– Accurately scope and diagnose areas of strength and weakness.– Detect irrational pricing or other policies buried in the system.– Provides market feedback from small and medium customers.
Return
Sales analysis

Copyright © 2009 ModelSheet Software, LLC.®
33
Challenge: Manage low-margin businesswith huge diversity of product-customer segments.
Business segments are too numerous to manage by feel.
• 60+ wholesale locations• 500-3,000 customers per location• 300-2,000 products per location
Profits are often concentrated.
• ~20% of customers generate 80% of profits.• ~20% of customers generate losses.• Some product or service lines generate losses.
This problem is common in low-margin businesses with many product or service offerings.
• Wholesale and retail distribution• Retail financial services• Health care institutions
Product & customer profitability

Copyright © 2009 ModelSheet Software, LLC.®
34
Industry:Chemical
Wholesaler
Industry:Chemical
Wholesaler
Solution: Estimate profitability of products, customers and product x customer segments.
Compute gross margin from prices and COGS.
Allocate selling costs to customers and to products.
Use activity-based costing to create detailed cost models.
X
• Warehousing and delivery costs• Order admin costs
Actions: Alter prices for some products and customers.
• Drop some products. Consider joint ordering and usage.• Alter prices for some customers, with intent to lose some customers
Product & customer profitability
Copyright © 2009 ModelSheet Software, LLC.®
35
Client Impact: Customer x product profitability metrics improved profits at chemical distributor.
• Repriced money-losing customers and took chance they walk.– Top 20% of customers generate half of profit. 10% cause losses.
• Repriced or eliminated unprofitable product lines at some locations.
• Raised profitability significantly at test locations.– Largest branches had 5-15% unprofitable customers.– Smaller branches had less unprofitable business.
• Client added customer and product profitability as a permanent utility.
Return
Product & customer profitability

Copyright © 2009 ModelSheet Software, LLC.®
36
Outline
Marketing Programs
Product Programs
SalesAnalysis
Sales Planning& Resources
• Product profitabilityoSoftware qualityoModelSheet model
(Product profitability)
• Program profitabilityoPricing analysisoData miningoModelSheet Model
(Program profitability)
Operations Analysis
oManufacturing oDistributionoComputer operationsoModelSheet model
(Process flow analysis)
• Sales planning• Sales force
organization
Summary &Next Steps
Business Development
Introduction
• Background• Strategy & analytics
• Project selectionoBusiness planningoBusiness cases
• In-depth sales analysis• Color maps• Market basket analysis• Customer x product
profitability
Key:• Included in main presentationo Excluded from main presentation
oProject cost accountingoModelSheet models
– Business financial plan– Investment project analysis
Finance

Copyright © 2009 ModelSheet Software, LLC.®
37
Challenge: Consider product profitability in investment decisions.
What is the role of profitability in investment decisions?
• How does a company combine financial metrics with human judgment? • How can a company avoid letting financial metrics stifle the vision and judgment
needed for innovation in many situations?
How do you estimate profitability of products?
• How do you account for long-term development investments? • Which costs do you include? • How do you allocate costs to products? • How do you treat technical and market dependencies among products?
Product profitability

Copyright © 2009 ModelSheet Software, LLC.®
38
Solution: Let the role of product profitability metrics in investment decisions vary across businesses.
Our tool:
Fosters an environment for proper use of financial information in investment decisions that values qualitative factors and expert opinion.
Uses product profitability metrics to help build consensus around potentially contentious resource decisions.
Computes product profitability
By using appropriate time horizons for product development investments; including product-specific marketing, selling, and supports costs; and using cost drivers for activity-based costing.
Industry:Technical
Software
Industry:Technical
Software
Product profitability

Copyright © 2009 ModelSheet Software, LLC.®
39
Client Impact: Product profitability metrics improve process and results for investments in product.
• Product CM becomes key input for engineering headcount decisions at MathWorks.– Even long-time executives discovered patterns they did not fully realize.
• Product CM helps build consensus around contentious decisions.– Product CM prevents some weaker resource requests from surfacing.
Return
Product profitability

Copyright © 2009 ModelSheet Software, LLC.®
40
Outline
Marketing Programs
Product Programs
SalesAnalysis
Sales Planning& Resources
• Product profitabilityoSoftware qualityoModelSheet model
(Product profitability)
• Program profitabilityoPricing analysisoData miningoModelSheet Model
(program profitability)
Operations Analysis
oManufacturing oDistributionoComputer operationsoModelSheet model
(Process flow analysis)
• Sales planning• Sales force
organization
Summary &Next Steps
Business Development
Introduction
• Background• Strategy & analytics
• Project selectionoBusiness planningoBusiness cases
– Enter embryonic bio market– Turnaround small business– Large business in trouble
• In-depth sales analysis• Color maps• Market basket analysis• Customer x product
profitability
o Project cost accountingo ModelSheet models– Financial plan– Investment project
Finance

Copyright © 2009 ModelSheet Software, LLC.®
41
Challenge: Allocate resources among scores of candidate projects.
Dozens of projects compete for resources each year.
Conditions vary widely across business units and segments.
• High/medium market growth rates• Unchallenged market leader or competitor with <5% share.• Varying market synergies with company’s market-leading products• Varying synergies with company’s existing products and expertise.• Varying expertise in distribution and in support compared to leader.
Some engineering managers believe no need to plan: “Throw 1-2 engineers at each opportunity; add/subtract based on early results.”
Project selection

Copyright © 2009 ModelSheet Software, LLC.®
42
Solution: Quantify strategic concepts with linear decision models.
Introduce standard strategic concepts.
• Market attractiveness (Market growth is often the best simply proxy.)• Relative competitive strength (Relative market share is best simple proxy.)
Score each project on key dimensions.
• Market attractiveness: growth, appropriate size, competitive intensity• Competitive position
- Products and technology- Relative market share, synergies with other products- Distribution and support
Estimate costs and payoffs.
• 5-year revenue estimates and risks• Development costs and risks• Business model difficulties and risks
Assemble into portfolio view.
Industry:Technical
Software
Industry:Technical
Software
Project selection

Copyright © 2009 ModelSheet Software, LLC.®
43
Client Impact: Investment project evaluation toolbrought discipline and buy-in to resource decisions.
• Eliminated backlog of unevaluated investment proposals.– Scored two dozen projects in first year methods used.
• Trained managers in how to think about project evaluation.– Engineers particularly liked the rational and thorough process.
• Managers who got adverse resource decisions knew reasons.
Return
Project selection

Copyright © 2009 ModelSheet Software, LLC.®
44
Implemented Investment Project Financial Analysis as a ModelSheet Model
• ModelSheet model and Excel workbook for investment project financial analysis Link
• ModelSheet model has advantages over Excel.• Named variables, readable symbolic formulas (and fewer formulas)• Segmentation dimensions, time series• Separates model logic from sheet layouts• Generates Excel workbooks• Learn about ModelSheet
Link
Return
Investment project analysis

Copyright © 2009 ModelSheet Software, LLC.®
45
Outline
Marketing Programs
Product Programs
SalesAnalysis
Sales Planning& Resources
• Product profitabilityoSoftware qualityoModelSheet model
(Product profitability)
• Program profitabilityoPricing analysisoData miningoModelSheet model
(Program profitability)
Operations Analysis
oManufacturing oComputer operationsoDistributionoComputer operations
(Process flow analysis)
Business Development
• Sales planning• Sales force
organization
Summary &Next Steps
Introduction
• Background• Strategy & analytics
• Project SelectionoBusiness planningoBusiness cases
• In-depth sales analysis• Color maps• Market basket analysis• Customer x product
profitability
Key:• Included in main presentationo Excluded from main presentation
Finance
oProject cost accountingoModelSheet models– Business Financial plan– Investment project analysis
Copyright © 2009 ModelSheet Software, LLC.®
46
Summary: Operational Data Contains Information That Can Improve Decisions.
Operational data contains organic information that can inform and improve decision-making.
Organic reports help manage many aspects of a business.
A company needs certain assets to implement organic reports.• Relevant operational data• Information systems infrastructure• Strategic – analytic expertise
Summary and next steps

Copyright © 2009 ModelSheet Software, LLC.®
47
Suggested Next Steps
Identify likely opportunities for impact of strategic assessment and business analytics.
•Business Development
•Finance
•Marketing Programs
•Sales Planning and Resources
•Product Programs
•Operations Analysis
•Sales Analysis
Return
Summary and next steps

Copyright © 2009 ModelSheet Software, LLC.®
48
Appendix
The appendix includes topics excluded from the flow of the default presentation in order to save time.

Copyright © 2009 ModelSheet Software, LLC.®
49
Industry: Telecom
Equipment
Industry: Telecom
Equipment
Industry:Technical
Software
Industry:Technical
Software
Find the right prices and where to compete.
Case 1: Optimize Educational prices for technical software
• Do controlled test on a few products in large product line.• Analyze why price elasticities vary by product type.• Estimate revenue and unit sales impact of price changes.
Case 2: Telecom PBX equipment
• Segments include small/large PBX, buy/lease, premium options.• Revenue includes up-front charges and annual fees.• Customer preferences differ for current cash and NPV. • Can vendor be competitive across the board?
Pricing

Copyright © 2009 ModelSheet Software, LLC.®
50
Client Impact: Pricing analysis has helped clientsto manage profits and market share.
• MathWorks Education Marketing has firm basis for deciding which prices to adjust.
• AT&T identified areas of mis-pricing that lost PBX orders.
Return
Pricing

Copyright © 2009 ModelSheet Software, LLC.®
51
Definition of “Data Mining”
Data mining means finding hidden patterns in customer behavior that lead to more effective actions.
Found in in large, high-dimensional data sets
Data mining focuses on differentiating impact of marketing and sales activities by individual customers.
• Instead of impact on market segments.• This is a critical activity in building a customer-centric business.
• Two basic types of data mining differ.
• Supervised learningDirected: seeks to answer a pre-formed question, validate a hypothesis.
• Unsupervised learningUndirected: seeks useful patterns in data that were not previously known.
“unsupervised learning”
Data mining

Copyright © 2009 ModelSheet Software, LLC.®
52
Challenge: Predict which customers will buy which products with what probabilities.
Types of Information Used to Predict Customer Purchases
• Installed base of products• Purchase history by product / service• Seminars and other marketing program events attended
– E.g. webinars, product trials.
• Web pages visited• ‘Opportunities’ (very highly qualified leads)• Number and types of support requests
– Including recommendation of support engineers for new purchases.
Data mining

Copyright © 2009 ModelSheet Software, LLC.®
53
Solution: Various approaches can predict purchases and probabilities.
Some Algorithmic Methods for Data Mining
• Neural networks
• Maximum likelihood methods – with parameterized model
• Bayesian networks
R&D Project –
not implemented
R&D Project –
not implemented
Return
Data mining

Copyright © 2009 ModelSheet Software, LLC.®
54
Implemented Marketing Program Contribution Margin Analysis as a ModelSheet Model.
• ModelSheet model and Excel workbook for marketing program contribution margin analysis Link
• Allocate revenue to marketing programs to compute contribution margin
• ModelSheet model has advantages over Excel• Named variables, readable symbolic formulas (and fewer formulas)• Segmentation dimensions, time series• Separates model logic from sheet layouts• Generates Excel workbooks• Learn about ModelSheet
Link
Return
Data mining

Copyright © 2009 ModelSheet Software, LLC.®
55
Challenge: Assure high level of software quality.
What does quality mean?
How organize for quality?
How balance repairing defects with new features?
How test code?
How use up-front design and reviews?
Use coding standards?
Software quality

Copyright © 2009 ModelSheet Software, LLC.®
56
Solution: Reorganize software development to focus on quality over new features.
• Adjust the meaning of quality to different applications. – Use different blends of reliability, features, performance, memory footprint, usability I different
situations. • SW developers have primary responsibility for quality.
– One or two developers have primary responsibility for quality of each SW module. Developers write and perform tests, write draft documentation.
– Keep ratio of QE to developers low. • Use short design-test-fix cycle.
– Clear all defects in overnight testing. Exceptions require approvals. • Use 4 kinds of testers and 5 kinds of tests.
– Testers: primary developers, domain experts, idiosyncratic users, aesthetes– Tests: feature tests, interaction tests, application tests, off-course tests, stress tests.– Include algorithms, user interface, on-line help and documentation.
• Do up front external design reviews and code reviews. – Document semantics, usage procedures, programmer interfaces. Use up-front project plan
and standard project management variance metrics. Adapt reviews to seniority of developers.• Enforce code standards.
– Modularity, abstraction, object ontology, naming, code layout, comments, executable tests and demos, user documentation, user interface and help systems. Little non-source documentation
Software quality
Copyright © 2009 ModelSheet Software, LLC.®
57
Challenge: Track defects for maximum impact on quality.
• Classify defects by impact on users.– impact per encounter, and frequency of encounters.
• Defect repair process is very complex. – What products are affected– Who is responsible– Current status in the process– Schedule and rate of progress
• Show each user what he needs without burying him in detail.
Software quality

Copyright © 2009 ModelSheet Software, LLC.®
58
Solution: Show patterns of defect inventory and process with flexible level of detail.
Key Features of Defect Reports
• Reflect differences in priority of defects.– Severity of each occurrence affects priority.– Frequency of occurrence affects priority.
• Report inventory and flow-through of defects.– Current status– Schedule information
• Show appropriate information to each user.– Present different views for different user groups.– Use hierarchies of product components, teams, status.
Software quality

Copyright © 2009 ModelSheet Software, LLC.®
59
Owner Div (All) Sub Comp (All) Create Date yr-mo(All)Owner Dept (All) Severity (All) Last Mod Date yr-mo(All)Owner Mgr (All) Frequency (All) Last Mod By (All)Component (All) Status (All)
Sum of Total S_Status
Owner Group Owner S_Comp PriorityAll Dev Open
All QE Open Closed
Grand Total
Accessories Conrad B Core 1 High 1 13 Low 4 4
Optical instruments 1 High 2 22 Medium 3 1 43 Low 6 6
Michelle S Core 2 Medium 1 13 Low 1 1
Optical instruments 1 High 2 22 Medium 1 2 33 Low 3 3
Defect reports show appropriate information to each user.
3 levels of product
components
2 levels of defect status
3 levels pf priority2 factors in priority
Timing information
5 levels of ownership

Copyright © 2009 ModelSheet Software, LLC.®
60
Client Impact: MathWorks is growing rapidlyin huge production code markets.
• MathWorks is growing from maker of design tools to a leading maker of tools for programming embedded microprocessors.– Automatically programming the world’s microprocessors is a huge growth
market.
• Leading embedded system vendors are adopting new releases of MathWorks software.– This is a critical decision point for key customers.
• This program implemented the most radical and disruptive changes in MathWorks development practices in many years.– President made software quality his top priority for two years.
Return
Software quality

Copyright © 2009 ModelSheet Software, LLC.®
61
Implemented Product Profitability Analysisas a ModelSheet Model.
• ModelSheet model and Excel workbook for Business Unit Financial Plan Link
• Revenue less costs of goods, development, marketing, support
• ModelSheet model has advantages over Excel• Named variables, readable symbolic formulas (and fewer formulas)• Segmentation dimensions, time series• Separates model logic from sheet layouts• Generates Excel workbooks• Learn about ModelSheet
Link
Return
Software quality
Copyright © 2009 ModelSheet Software, LLC.®
62
Outline
Marketing Programs
Product Programs
SalesAnalysis
Sales Planning& Resources
• Product profitabilityoSoftware qualityoModelSheet model
(Product profitability)
• Program profitabilityoPricing analysisoData miningoModelSheet Model
(program profitability)
Operations Analysis
oManufacturing oDistributionoComputer operationsoModelSheet model
(Process flow analysis)
• Sales planning• Sales force
organization
Summary &Next Steps
Business Development
Introduction
• Background• Strategy & analytics
• Project selectionoBusiness planningoBusiness cases
• In-depth sales analysis• Color maps• Market basket analysis• Customer x product
profitability
oProject cost accountingo ModelSheet models– Financial plan– Investment project analysis
Finance
Key:• Included in main presentationo Excluded from main presentation

Copyright © 2009 ModelSheet Software, LLC.®
63
Challenge: Cost accounting systems misguidebusiness decisions at regulated company.
Capital and expense cost accounting maximizes regulated profits but distorts business decisions.
Competitors’ rule of thumb: “price 10% below market leader and make large profits.
Market leader cannot adopt competitors’ pricing because accounting system says this would generate losses.
• Is the leader a cost laggard?• How does the accounting system affect profit metrics?
- Timing of revenues and costs- Building book value as basis for regulated profits
Cost accounting

Copyright © 2009 ModelSheet Software, LLC.®
64
Solution: Adopt cost accounting methods of investment bankers.
Capitalize expenditures not recouped from initial cash flows.
Do not capitalize at-risk expenditures that support future earnings, such as installation costs on leased systems.
Client Impact: Large PBX maker adopted more realistic costing and pricing.
Industry:Telecom
Equipment
Industry:Telecom
Equipment
Cost accounting
• Two years later, client reduced stated book value by 20%.
• More accurate costing led to more competitive pricing.
Return

Copyright © 2009 ModelSheet Software, LLC.®
65
Implemented Business Unit Financial Planas a ModelSheet Model.
• ModelSheet model and Excel workbook for Business Unit Financial Plan Link
• Generic financial plan with 150+ variables
• ModelSheet model has advantages over Excel• Named variables, readable symbolic formulas (and fewer formulas)• Segmentation dimensions, time series• Separates model logic from sheet layouts• Generates Excel workbooks• Learn about ModelSheet
Link
Return
$1 Billion business in trouble

Copyright © 2009 ModelSheet Software, LLC.®
66
Implemented Investment Project Financial Analysisas a ModelSheet Model.
• ModelSheet model and Excel workbook for Business Unit Financial Plan Link
• Investment return metrics based on discounted cash flow
• ModelSheet model has advantages over Excel• Named variables, readable symbolic formulas (and fewer formulas)• Segmentation dimensions, time series• Separates model logic from sheet layouts• Generates Excel workbooks• Learn about ModelSheet
Link
Return
$1 Billion business in trouble

Copyright © 2009 ModelSheet Software, LLC.®
67
Strategy drives analysis, and can drive it in different directions.
Basic Strategy
Type of MetricRevenue, growth Cost,
ProductivityAsset Utilization
Incubate • Sales growth by segment
• Time to break even • Cash flow
Grow • Penetration of key customers, applications
• % sales from new products
• Revenue per employee• Revenue / non-labor input
• R&D as % revenue• Investment as %
revenue
Sustain • Sales growth by segment
• Contribution margins • Cost reduction rates• Indirect costs / sales
• ROI• Asset turnover
Harvest • Market share• % share of substitutes
• Unit costs • ROI• Asset turnover
Strategic planning
Illustrative metrics
Illustrative metrics

Copyright © 2009 ModelSheet Software, LLC.®
68
We can help formulate business plans.
Planning at MathWorks– Served on all 11 management boards for commercial businesses.
• Aerospace, Automotive, Biotech-Pharmaceutical, Communications-Electronics-Semiconductors, Financial Services, Industrial Automation
• Control Design, Signal & Image Processing, Technical Computing, T&M
– Led planning for several business units.• Led planning for first two vertical products in a new application
(computational biology) • Drove new strategy for money-losing low-growth business unit that got it on a
better trajectory.
– Headed annual long-term planning meeting.
– Drove key organizational changes.• Re-organization of sales force by industry.• strategic quality initiative in software development.• I.T. effectiveness issues.
Other companies (next slide)
Strategic planning

Copyright © 2009 ModelSheet Software, LLC.®
69
We can help formulate business plans. (continued)
In Fortune 100 (8 businesses for GE, McKinsey, Booz Allen)
– Diagnosed strategic investment issues involving product line, manufacturing, and distribution for $900 million communications equipment business. Identified estimated $80 million recurring savings.
– Identified problems in 3,000-man RD&E lab that allowed two $100+ million project failures to pass reviews.
In small software company
Turned around world-class technical software product.
Strategic planning
Return

Copyright © 2009 ModelSheet Software, LLC.®
70
Challenge: Enter computational biology markets?
Growth was slowing for core business units.
• Computerization of engineering work flows is maturing.• 2002 hi-tech bust signaled that execution alone would lead to cul-de-sac.
Highly profitable privately-held company can consider 5-10 year investments in automating new work flows.
• Consider other aspects of engineering workflows.More investment in production code generation, EDA system-level design,
validation, verification & test, medical imaging, …
• Consider new technical workflows.Computational life science, business intelligence, finite elements, …
Engineer-champions of computational biology: “This is the next big thing in computation; get in now and make a killing.”
Strategy in computational biology

Copyright © 2009 ModelSheet Software, LLC.®
71
Solution: Get into computational biology now and lose money for 5-10 years.
Recognize why comp. biology is unique among opportunities.• More basic life science is converted to engineering than anywhere else.
Analogy: Maxwell’s equations ~1860-1870 started replacement of mechanical-tech by electro-tech at the cutting edge of innovation. Lasted 150 years.
• Applied life science will be the greatest tech growth area in 21st century.
Overcome bad timing for the two best opportunities for entry.• Late into bioinformatics. Very hard to build unique technology position.• Systems biology still immature. Can build unique technology position.
Two product strategies both need staying power.• Bioinformatics: enter with good product, versus very good freeware.
Key fact: many life science researchers using, struggling with MathWorks tools despite lack of attention to their needs. Fill pot-holes and create a winner.
• Systems biology: Leapfrog the field with groundbreaking technology in add-on product at low price.
Strategy in computational biology

Copyright © 2009 ModelSheet Software, LLC.®
72
Client Impact: MathWorks has software and strategy to become the leader in computational biology.
• MathWorks is in process of losing money for 5-10 years.
• MathWorks is already the leader in computational systems biology.
• MathWorks has a tough fight against bioinformatics freeware.
• Computational Biology is likely the most explosive technical computing application in the 21st century.
Return
Strategy in computational biology

Copyright © 2009 ModelSheet Software, LLC.®
73
Challenge: T&M business unit has minus 100% ROS,tiny market share, and low growth.
3% of customers (for platform product) buy key T&M product.• Market research and business plan projected 50%.• Attach rate is not growing.
Development, marketing budgets imply faith in strong growth.• Some marketing budget as large as business units with 50 x revenue.• Development team meets guidelines for business with 10 x revenue.
Scale economies and standards are important.• Scale and standards usually critical in established software markets.• Products and support must handle many hardware boards (scale).
T&M management board meetings are full of assertions.• Sales force reluctance drives low sales. So fix sales.• T&M products pulling other products. Give T&M credit for added revenue.• Seek partnerships with instrument makers to pull T&M products through.
Strategy in Test & Measurement

Copyright © 2009 ModelSheet Software, LLC.®
74
Solution: Ask customers.Reposition T&M as utility function for main products.
Survey 97% of customers who don’t buy and 3% who do.• Ask a dozen obvious questions about need for T&M function, product
strengths, incumbent products, force of standardization…• Start with 1-2 dozen interviews to ensure survey captures the key issues.
Private discussions unearthed key problems.• Serious product deficiencies for the main part of market.• Incumbency of and standardization on market leader is crucial.
Solution: position T&M products as completing design cycle for company’s core products in control design etc.• Avoid head-on competition with entrenched leader in core of market.
Cut marketing programs aiming at direct competition with leader.
• Give time to fix product deficiencies.
Strategy in Test & Measurement

Copyright © 2009 ModelSheet Software, LLC.®
75
Client Impact: T&M business growing fastwith better margins.
• T&M repositioned as part of larger “Model-Based Design” story.– Not positioned head-to-head with mainstream T&M leaders who have a
different kind of product.
• Some product deficiencies fixed (deployment).– Refocusing on product needs helped.
• Growth and margins are up. – Growth increases substantially in two years.– Resource commitments are scaled to new strategy.
Return
Strategy in Test & Measurement

Copyright © 2009 ModelSheet Software, LLC.®
76
Challenge: Why was $900 million* wireless comms vendor unprofitable and losing share?
• Solid #2 competitor was now tied with #3 vendor.– Share fell from 36% to 16% in 15 years.– Leader’s share increased from 50% to 65%.
• Growth was good but becoming nil.
• Profitability was sub-standard and becoming nil.
• Entered microprocessor-controlled radios at good time, but lagging with second generation.
$1 Billion business in trouble

Copyright © 2009 ModelSheet Software, LLC.®
77
Diagnosis: Business in growth industrywas harvested for 15 years.
• Replace 10-year-old core product to exploit chip integration.– “New” products were repackaged versions of old less integrated products.– Core product redesign was cancelled yearly to make profit targets.
• Reduce manufacturing costs.– Install new manufacturing information system.
• WIP choked factory floor, interfered with operations.• New MPR system cancelled each year to make profit targets.
– Move some manufacturing overseas to improve cost position.• Asian rivals with small shares depressed price levels.
• Distribution– Weak product line enabled competitors to penetrate indirect distribution.– Business had small services business. #1 competitor made as much
money in wireless service business as in equipment.
• Solution: Invest to realize $80M savings; or sell.
Industry:
Communications
Equipment
Industry:
Communications
Equipment
$1 Billion business in trouble

Copyright © 2009 ModelSheet Software, LLC.®
78
Client Impact: GE recovered capital for refocusing on stronger businesses.
• Wireless communications business was sold.– Management concludes it is too late to fix past strategic mistakes.
Return
$1 Billion business in trouble

Copyright © 2009 ModelSheet Software, LLC.®
79
Outline
Marketing Programs
Product Programs
SalesAnalysis
Sales Planning& Resources
• Product profitabilityoSoftware qualityoModelSheet model
(Product profitability)
• Program profitabilityoPricing analysisoData miningoModelSheet model
(program profitability)
Operations Analysis
oManufacturingoDistributionoComputer operationsoModelSheet model
(Process flow analysis)
• Sales planning
Summary &Next Steps
Business Development
Introduction
• Background• Strategy & analytics
• Project selectionoBusiness planningoBusiness cases
• In-depth sales analysis• Color maps• Market basket analysis• Customer x product
profitability
Key:• Included in main presentationo Excluded from main presentation
oProject cost accountingoModelSheet models
– Business financial plan– Investment project analysis
Finance
Copyright © 2009 ModelSheet Software, LLC.®
80
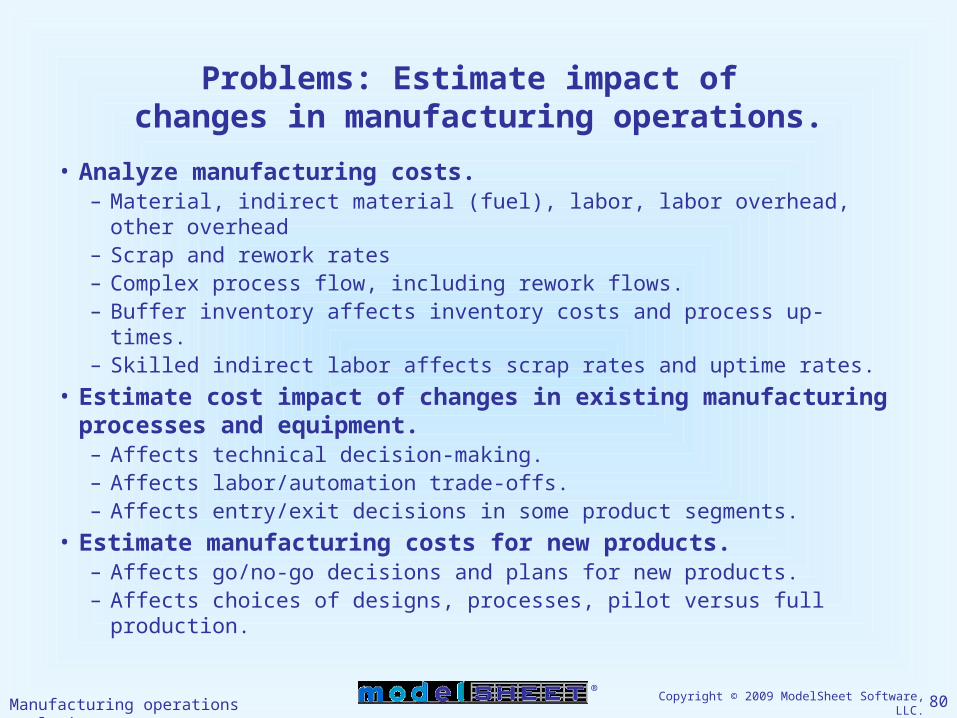
Problems: Estimate impact of changes in manufacturing operations.
• Analyze manufacturing costs.– Material, indirect material (fuel), labor, labor overhead, other overhead– Scrap and rework rates– Complex process flow, including rework flows.– Buffer inventory affects inventory costs and process up-times.– Skilled indirect labor affects scrap rates and uptime rates.
• Estimate cost impact of changes in existing manufacturing processes and equipment.– Affects technical decision-making.– Affects labor/automation trade-offs.– Affects entry/exit decisions in some product segments.
• Estimate manufacturing costs for new products.– Affects go/no-go decisions and plans for new products.– Affects choices of designs, processes, pilot versus full production.
Manufacturing operations analysis

Copyright © 2009 ModelSheet Software, LLC.®
81
Solution: Model costs based on manufacturing work flow.
Industry:Electrical Manufacturing
Industry:Electrical Manufacturing
• Theoretical factor costs
• Actual factor costs• Scrap rates• Rework rates• Cost impact of
process changes
Metrics
Key Differences from Financial Cost Accounting• Include benefits and taxes in direct labor. • Break out indirect labor with benefits & taxes.• Break out equipment depreciation & maintenance. • Model volume-dependence of costs (e.g. fixed & variable costs).
Stage 1 Stage 2 Stage 3 Stage 4
Scrap Scrap Scrap Scrap
Rework
Costs• Material• Direct Labor• Indirect Labor• Equipment• Overhead Costs Costs Costs
Often included in overhead for inventory
tax accounting.
Manufacturing operations analysis

Copyright © 2009 ModelSheet Software, LLC.®
82
Client Impact: GE Lighting improved decision support for manufacturing changes and new products.
• Engineering can make more accurate cost estimates of factory changes.– New costing methods reduce allocated OH rates from 600%+ to 20%.
• Manufacturing costing for new lamp products is more accurate.– Brite Stik® flourescent lamps– Miniature metal halide lamps
Return
Manufacturing operations analysis

Copyright © 2009 ModelSheet Software, LLC.®
83
Challenge: Estimate costs of distribution function.
• Operational logistics drive warehousing costs.– Facilities and picking costs vary widely.
• Optimize position in warehouse based on impact on operating costs.
• Operational logistics drive delivery costs.– Choose cost drivers: Distances, weight and space costs, routing.– Interactions of high, low profit segments
• Carry some money-losing products for profitable customers.
• Turnover affects inventory carrying costs.
Distribution analysis

Copyright © 2009 ModelSheet Software, LLC.®
84
Solution: Develop operational model of distribution costs.
• Model warehousing costs.– Pallet picking model allocates forklift time and costs.
• Location in warehouse affects travel time.• Container type, partial pallets and bulk or weight determines forklift costs.
– Floor space, turnover determine space costs for each product.• Distinguish fixed and variable costs in decision to drop a customer or product.
• Model delivery costs.– Weight or volume determined truck space.– Length of deliver route and joint deliveries affect costs.
• Model order admin costs.– Account for asset turnover, EOQ and vendor characteristics.
Industry:Chemical
Wholesaler
Industry:Chemical
Wholesaler
Distribution analysis
Copyright © 2009 ModelSheet Software, LLC.®
85
Client Impact: Distributor improved warehouse operations.
• Alter warehouse layout, picking policies, and delivery logistics.
• Distribution analysis was a cornerstone of profitability analysis that improved division performance.
Return
Distribution analysis

Copyright © 2009 ModelSheet Software, LLC.®
86
Challenge: Do benefits justifynew back-office information system?
• Process many products in same work flow.– Air and other tickets, hotel and other reservations, travelers checks
• Determine costs and cost drivers of current and new systems.– Factory-like processing flow with sequence of stages– Accumulate labor, machinery, overhead costs
Estimate cost savings of new information processing system.
• Determine which parts of the business system confer strategic advantage over low-cost competitors.
Computer operations analysis

Copyright © 2009 ModelSheet Software, LLC.®
87
Solution: Construct process flow similar to manufacturing process.
Industry:Travel Services
Industry:Travel Services
SpecialProcessing
Stage 1
Costs• Material• Direct Labor• Indirect Labor• Equipment• Overhead
Stage 3
CostsStage 4
Costs
Stage 5
Costs
Stage 2
Costs
• Theoretical factor costs
• Actual factor costs• Scrap rates• Rework rates• Cost impact of
process changes
Metrics
Special Considerations• Distinct products share
processing stages.• Some processes apply only
to exceptional cases.• Compare costs & capabil-
ities with new system.
Computer operations analysis

Copyright © 2009 ModelSheet Software, LLC.®
88
Client Impact: Client cancels large unjustified I.T. project.
• $40M project by IBM terminated.
• European Division preserves profit margins.
• Control of I.T. returns to team that built in-house system.
Return
Computer operations analysis
Copyright © 2009 ModelSheet Software, LLC.®
89
Implemented Operations Process Flow analysisas a ModelSheet Model.
• ModelSheet model and Excel workbook for Operations Process Flow analysis Link
• Units and cost flow thru manufacturing or business process flow
• ModelSheet model has advantages over Excel• Named variables, readable symbolic formulas (and fewer formulas)• Segmentation dimensions, time series• Separates model logic from sheet layouts• Generates Excel workbooks• Learn about ModelSheet
Link
Return
Operations process flow analysis