models for predicting thermal properties and temperature...
TRANSCRIPT

MODELS FOR PREDICTING THERMAL PROPERTIES
AND TEMPERATURE IN MASS CONCRETE
CONTAINING GROUND GRANULATED BLAST
FURNACE SLAG
BY
AROSHA DABARERA
A THESIS SUBMITTED IN PARTIAL FULFILLMENT OF THE
REQUIREMENTS FOR THE DEGREE OF MASTER OF SCIENCE
(ENGINEERING AND TECHNOLOGY)
SIRINDHORN INTERNATIONAL INSTITUTE OF TECHNOLOGY
THAMMASAT UNIVERSITY
ACADEMIC YEAR 2015


ii
Acknowledgements
The author wishes to express his profound gratitude to his advisor,
Asst. Prof. Dr. Warangkana Saengsoy, for her precious guidance throughout
the research work. Her continuous advice, encouragement and support made
the authors work to complete within his study period.
Sincere appreciation is contributed to Prof. Dr. Somnuk
Tangtermsirikul for his thorough and invaluable consultation during the study
period. The guidance given by Dr. Krittiya Kaewmanee throughout the study is
acknowledged by the author. Moreover, the author would like to extend his
gratitude for suggestions given by external committee member Asst. Prof.
Saranagon Hemavibool.
The author wishes to extend his gratitude towards Sirindhorn
International Institute of Technology (SIIT), Thammasat University which
enabled him to learn from international professionals and provided scholarship
during the study period. Special appreciation is forwarded to all researchers in
Construction and Maintenance Technology Research Center (CONTEC) for
kind encouragement and suggestions during his study.
The acknowledgement is extended to Taiheiyo Cement
Corporation, Japan which consulted and partially funded for this project. The
author would like to thank project consultants Mr. Ryuichiroh Kuga and Ms.
Kanako Mori for their kind support towards this study.
The author gratefully appreciates his colleagues and friends who
provided a pleasant environment to study and enjoy his stay in Thailand.
Finally sincere gratitude and utmost admiration is dedicated to the author’s
parents and family members who supported all through his life.

iii
Abstract
MODELS FOR PREDICTING THERMAL PROPERTIES AND
TEMPERATURE IN MASS CONCRETE CONTAINING GROUND
GRANULATED BLAST FURNACE SLAG
by
AROSHA DABARERA
Bachelor of Science in Civil and Infrastructure Engineering, AIT, 2014
Ground Granulated Blast Furnace Slag is widely used as a partial
replacement of cement in mass concrete structures. However, the effect of slag
towards thermal properties in mass concrete is not extensively investigated.
Predicting thermal properties and adiabatic temperature rise are essentially
useful for investigating thermal cracking potential especially at early stage of
mass concrete. Existing prediction methods and models have some problems
such as constant thermal properties are mostly utilized for predicting
temperature rise of mass concrete. These assumptions lead to errors and
inaccurate predictions of temperature and thermal cracking potentials
especially at the early stage where thermal properties tend to change rapidly.
Therefore accurate modelling of thermal properties could be beneficial to
provide solid background to accurately predicting thermal cracking of mass
concrete.
This study is aimed to develop time-dependent models for predicting
hydration degrees of cement and slag which are vital parameters in modeling
many properties of concrete. Then the models of free water, specific heat,
thermal conductivity, coefficient of thermal expansion, and total heat
generation of concrete including slag are modified. These models are then
composed to predict the adiabatic temperature rise of mass concrete

iv
incorporating slag. The model simulations can be used to accurately predict the
experimentally measured data from different sources. Moreover, semi-
adiabatic temperature rises of concrete with fly ash and slag are evaluated
experimentally. The 28-day compressive strength model and initial slump
model are verified with the test results of concrete mixtures containing
different replacement levels of fly ash and slag.
Keywords: Adiabatic Temperature Rise, Hydration Degree, Slag, Thermal
Properties, Mass concrete, Model
v
Table of Contents
Chapter Title Page
Signature Page i
Acknowledgements ii
Abstract iii
Table of Contents v
List of Figures ix
List of Tables xiv
1 Introduction 1
1.1 General 1
1.2 Statement of Problems 2
1.3 Objectives and Scope of Study 4
2 Literature Reviews 8
2.1 Ground Granulated Blast Furnace Slag 8
2.2 Hydration Degrees of Cement and Slag 9
2.2.1 Hydration degree of cement 9
2.2.2 Hydration degree of slag 9
2.3 Experiments on Thermal Properties 13
2.3.1 Specific heat 13
2.3.2 Thermal conductivity 14
2.3.3 Coefficient of thermal expansion 16
2.4 Effect of Slag on Heat Evolution of Concrete 17
2.5 Thermal Cracking of Mass Concrete 19
2.5.1 Overview of thermal cracking 19
2.5.2 Models for predicting temperature and thermal cracking 20
3 Hydration Degrees of Cement and Slag 24
3.1 Determination of Hydration Degree of Cement 24

vi
3.2 Determination of Hydration Degree of Slag 28
3.3 Key Factors Affecting Hydration Degree of Slag in Concrete 29
3.4 Effect of Physical Acceleration of Cement by Slag Particles 32
4 Model for Predicting Free Water Content 34
4.1 General 34
4.2 Experimental Program 34
4.2.1 Materials 34
4.2.2 Mix proportions 35
4.2.3 Specimen preparation and test method 36
4.3 Experimental Results 36
4.3.1 Effect of water to binder ratio 38
4.3.2 Effect of slag replacement level 38
4.4 Model for Predicting Free Water Content 38
4.4.1 Free water content 38
4.4.2 Chemically bound water content 39
4.4.3 Gel water content 40
4.5 Verification of Free Water Model 40
5 Model for Predicting Specific Heat 43
5.1 General 43
5.2 Experimental Program 43
5.2.1 Materials and mix proportions 43
5.2.2 Specimen preparation and test method 44
5.3 Experimental Results 46
5.3.1 Effect of water to binder ratio 48
5.3.2 Effect of slag replacement level 48
5.4 Model for Predicting Specific Heat 48
5.5 Verification of Specific Heat Model 51
6 Model for Predicting Thermal Conductivity 53
6.1 General 53
vii
6.2 Experimental Program 53
6.2.1 Materials and mix proportions 53
6.2.2 Specimen preparation and test method 54
6.3 Experimental Results 54
6.3.1 Effect of water to binder ratio 54
6.3.2 Effect of slag replacement level 55
6.4 Model for Predicting Thermal Conductivity 57
6.5 Verification of Thermal Conductivity Model 58
7 Model for Predicting Coefficient of Thermal Expansion 60
7.1 General 60
7.2 Experimental Program 60
7.2.1 Materials and mix proportions 60
7.2.2 Specimen preparation and test method 61
7.3 Experimental Results 63
7.3.1 Effect of water to binder ratio 64
7.3.2 Effect of slag replacement level 64
7.4 Model for Predicting CTE 66
7.5 Verification of CTE Model 67
8 Model for Simulating Adiabatic temperature of Mass Concrete 69
8.1 General 69
8.2 Total Heat Generation of Concrete 69
8.3 Verifications using Proposed Adiabatic Temperature Model 73
9 Semi-Adiabatic Temperature Rise of Mass Concrete 81
9.1 General 81
9.2 Experimental Program 81
9.2.1 Materials and mix proportions 81
9.2.2 Specimen preparation and test method 83
9.3 Experimental Results 84

viii
9.3.1 Effect of w/b 84
9.3.2 Effect of fly ash 84
9.3.3 Effect of slag 86
10 Initial slump 90
10.1 General 90
10.2 Experimental procedure 94
10.3 Experimental Results 95
10.4 Verification of the initial slump model for concrete 97
11 Compressive Strength 99
11.1 General 99
11.2 Experimental procedure 100
11.3 Experimental Results 101
11.3.1 Effect of w/b 101
11.3.2 Effect of fly ash 101
11.3.3 Effect of slag 104
11.4 Verification of the 28-day Compressive Strength Model 107
12 Conclusions and Recommendations for future studies 110
12.1 Conclusions 110
12.2 Recommendations for Future Study 113
References 114
Appendices 122
Appendix A 123
Appendix B 126
Appendix C 128
Appendix D 129

ix
List of Figures
Figure Page
1.1 Step-by-step procedure to compute adiabatic temperature rise in
concrete 5
1.2 Flowchart to compute semi adiabatic temperature rise and thermal
cracking potential of mass concrete containing slag 7
2.1 Key factors affecting the reactivity of slag in cement 11
2.2 Behavior of some factors towards the tendency of hydration degree of
slag in cement 11
3.1 Average hydration degree of cement pastes with w/b = 0.25 and 0.40 at
28°C and 40°C 27
3.2 Average hydration degree of cement pastes with T = 28°C and 40°C at
w/b = 0.40 27
3.3 Simulations of hydration degree of slag in concrete with w/b = 0.40 and
0.60 at slag replacement ratio (s) = 0.50 29
3.4 Simulations of hydration degree of slag in concrete with s = 0.50 and
0.75 at w/b = 0.40 30
3.5 Simulations of hydration degree of slag in concrete with T = 28°C and
40°C with s= 0.50 and w/b=0.40 31
3.6 Simulations of hydration degree of slag in concrete with Fslag = 4300
cm2/g and 6000 cm
2/g with s= 0.50 and w/b=0.40 32
4.1 Test results of weight ratio of free water to total binder of pastes with
slag replacement levels= 0%, 45%, 60%, and 75% at w/b=0.25 37
4.2 Test results of weight ratio of free water to total binder of pastes with
slag replacement levels= 0%, 45%, 60%, and 75% at w/b=0.40 37
4.3 Comparison between test results and model simulations of weight ratio
of free water to total binder of pastes with slag replacement levels= 0%,
45%, 60%, and 75% at w/b=0.25 41
4.4 Comparison between test results and model simulations of weight ratio
of free water to total binder of pastes with slag replacement levels= 0%,
45%, 60%, and 75% at w/b=0.40 42

x
Figure Page
5.1 Testing specific heat and thermal conductivity (a) setup of the sensor
sandwiched by a paste specimen, (b) Hot Disk Thermal Constants
Analyser apparatus 45
5.2 Test results of specific heat of pastes with slag replacement levels= 0%,
45%, 60%, and 75% at w/b=0.25 47
5.3 Test results of specific heat of pastes with slag replacement levels= 0%,
45%, 60%, and 75% at w/b=0.40 47
5.4 Comparison between test results and model simulations of specific heat
of pastes with slag replacement levels= 0%, 45%, 60%, and 75% at
w/b=0.25 51
5.5 Comparison between test results and model simulations of specific heat
of pastes with slag replacement levels= 0%, 45%, 60%, and 75% at
w/b=0.40 52
6.1 Test results of thermal conductivity of pastes with slag replacement
levels= 0%, 45%, 60%, and 75% at w/b=0.25 56
6.2 Test results of thermal conductivity of pastes with slag replacement
levels= 0%, 45%, 60%, and 75% at w/b=0.40 56
6.3 Comparison between test results and model simulations of thermal
conductivity of pastes with slag replacement levels= 0%, 45%, 60%,
and 75% at w/b=0.25 59
6.4 Comparison between test results and model simulations of thermal
conductivity of pastes with slag replacement levels= 0%, 45%, 60%,
and 75% at w/b=0.40 59
7.1 Temperature changing process to measure CTE of slag-cement pastes 61
7.2 Example of firmly wrapped paste specimens for measuring CTE 62
7.3 Experimental setup for measuring CTE of paste specimens 62
7.4 Test results of CTE of pastes with slag replacement levels= 0%, 45%,
60%, and 75% at w/b=0.25 65
7.5 Test results of CTE of pastes with slag replacement levels= 0%, 45%,
60%, and 75% at w/b=0.40 65

xi
Figure Page
7.6 Comparison between test results and model simulations CTE of pastes
with slag replacement levels= 0%, 45%, 60%, and 75% at w/b=0.25 67
7.7 Comparison between test results and model simulations CTE of pastes
with slag replacement levels= 0%, 45%, 60%, and 75% at w/b=0.40 68
8.1 Comparison of dispersion factors of fly ash and slag which affect the
adherence of cement particles in concrete 72
8.2 Comparison of tested and predicted adiabatic temperature rise for
concrete with 40% slag, w/b=0.392 and initial temperatures of 20°C
and 30°C 74
8.3 Comparison of tested and predicted adiabatic temperature rise for
concrete with 40% slag, w/b=0.493 and initial temperatures of 20°C
and 30°C 74
8.4 Comparison of tested and predicted adiabatic temperature rise for
cement concrete at w/b=0.4 and 0.65 76
8.5 Comparison of tested and predicted adiabatic temperature rise for
concrete with 50% slag and at w/b=0.4 and 0.6 76
8.6 Comparison of tested and predicted adiabatic temperature rise for
concrete with 65% slag and at w/b=0.4 and 0.6 77
8.7 Comparison of tested and predicted adiabatic temperature rise for
concrete with 75% slag and at w/b=0.4 and 0.6 77
8.8 Comparison of tested and predicted adiabatic temperature rise for
concrete with 65% slag and at w/b=0.50 79
8.9 Comparison of tested and predicted adiabatic temperature rise for
concrete with 74% slag and at w/b=0.46 79
9.1 Setup of formwork for measuring semi adiabatic temperature rise of a
mass concrete sample 83
9.2 Tested results of semi-adiabatic temperature of concrete with fly ash
R=0%, 30%, and 50% at w/b=0.4 85
9.3 Tested results of semi-adiabatic temperature of concrete with fly ash
R=0%, 30%, and 50% at w/b=0.5 85

xii
Figure Page
9.4 Tested results of semi-adiabatic temperature of concrete with fly ash
R=0%, 30%, and 50% at w/b=0.6 86
9.5 Tested results of semi-adiabatic temperature of concrete with slag
S=0%, 50%, and 75% at w/b=0.4 87
9.6 Tested results of semi-adiabatic temperature of concrete with slag
S=0%, 50%, and 75% at w/b=0.5 87
9.7 Tested results of semi-adiabatic temperature of concrete with slag
S=0%, 50%, and 75% at w/b=0.6 88
9.8 Heating up and cooling down slopes computed from temperature
profiles of fly ash and slag concrete with w/b=0.50 89
10.1 Tested results of initial slump of concrete with fly ash R=0%, 30%, and
50% at w/b=0.4, 0.5, and 0.6 96
10.2 Tested results of initial slump of concrete with slag S=0%, 50%, 65%,
and 75% at w/b=0.4, 0.5, and 0.6 96
10.3 Comparison of tested and predicted initial slump values for concrete
containing fly ash R=0%, 30%, and 50% for all tested w/b 98
10.4 Comparison of tested and predicted initial slump values for concrete
containing slag S= 50%, 65%, and 75% for all tested w/b 98
11.1 Tested results of compressive strength of concrete with fly ash R= 0%,
30%, and 50% at w/b=0.40 102
11.2 Tested results of compressive strength of concrete with fly ash R= 0%,
30%, and 50% at w/b=0.50 103
11.3 Tested results of compressive strength of concrete with fly ash R= 0%,
30%, and 50% at w/b=0.60 104
11.4 Tested results of compressive strength of concrete with slag S= 0%,
50%, 65%, and 75% at w/b=0.40 105
11.5 Tested results of compressive strength of concrete with slag S= 0%,
50%, 65%, and 75% at w/b=0.50 106
11.6 Tested results of compressive strength of concrete with slag S= 0%,
50%, 65%, and 75% at w/b=0.60 106
xiii
Figure Page
11.7 Comparison of strength development ratios of concrete with fly ash R=
0%, 30%, 50%, and concrete with slag S=50%, 65%, 75% at w/b=0.50 107
11.8 Comparison of tested and predicted 28-day compressive strength values
for concrete containing fly ash R=0%, 30%, and 50% for all tested w/b 108
11.9 Comparison of tested and predicted 28-day compressive strength values
for concrete containing slag S=50%, 65%, and 75% for all tested w/b 109

xiv
List of Tables
Tables Page
4.1 Physical properties of cement and slag 34
4.2 Chemical compositions of cement and slag 35
4.3 Mix proportions of the tested paste specimens 35
5.1 Specific heat of the constituents of concrete 46
6.1 Thermal conductivities of the constituents of concrete 55
7.1 CTE values of the constituents of concrete 64
8.1 Maximum heat generation values for major cement compounds 73
9.1 Mix design of the binders used in casting concrete 82
1
Chapter 1
Introduction
1.1 General
Mass concrete can be defined as any volume of concrete in which the
dimensions are large enough for the requirement of considering minimization of
thermal cracking potential. Some examples of massive concrete structures are dams,
mat foundations, pile caps, transfer plates and structural members in which minimum
dimension is large, exceeding 0.9m for example. Hydration of cement generates heat
since it is an exothermic reaction. This generated heat dissipates rapidly in concrete
elements with relatively small dimensions. However, it is not the case for massive
concrete structures. The hydration process causes accumulation of heat inside the
mass concrete. Lower thermal conductivity of concrete makes it difficult to dissipate
the generated heat. Therefore, temperature difference occurs between center and
surface of the mass concrete element resulting in temperature gradients which lead to
thermal cracking especially at early age.
Thermal cracking results in many structural, durability, and aesthetic
problems. It can decrease the service life of concrete structures. Therefore, it is very
important to mitigate early age temperature and thermal cracking of mass concrete
especially at early age of the structure. Many approaches are taken to control
temperature rise of massive concrete during the construction stage. Some examples of
steps taken to alleviate thermal cracking problem are decreasing the placing
temperature of concrete, providing internal and external cooling, providing external
insulation, and using low heat materials, etc.
An effective way to minimize thermal cracking is to use Supplementary
Cementitious Materials (SCM’s) due to their lower reactivity at early stages. For
example, it is proven that fly ash can reduce the thermal cracking potential in mass
concrete when utilized as a partial replacement of cement. Ground Granulated Blast
Furnace Slag (herein after referred to as slag) is also widely used in some countries to

2
partially replace cement in mass concrete. This is a by-product from steel
manufacturing process which has gained attraction due to its engineering benefits
such as low heat generation, low permeability and improvement of some durability
properties. However, modelling of thermal properties and temperature are not
thoroughly investigated in slag replaced concrete. Therefore, understanding about the
behaviour of slag-cement system is essentially beneficial for the use of slag in
concrete construction industry.
To predict the thermal properties and temperature of slag concrete, evaluation
of hydration degree of cement and slag are critical steps. The interaction of slag-
cement system is also important to investigate. Then effect of slag towards the
quantitative change in free water amount and necessary thermal properties including
the heat evolution, heat transfer behaviour in concrete should be investigated. Thus,
thermal properties, temperature of slag concrete can be predicted which, not only can
be used to attain an insight for effectiveness of using slag in mass concrete
construction process, but also can be compared with other SCM’s currently utilized in
mass concrete construction.
1.2 Statement of Problems
The ability to accurately predict hydration degrees of cement and slag is the
major obstacle encountered in modelling many time-dependent properties of cement-
slag concrete. Many efforts have been carried out to find hydration degree of cement
in concrete (Tangtermsirikul & Saengsoy, 2002; Choktaweekarn & Tangtermsirikul,
2010; Kolani et al., 2012). However, the accuracy of the predictions were limited due
to several reasons such as not considering the effect of chemical and physical
properties of cement, errors in predicting stoichiometry of hydrated products, and not
considering all reactive compounds in cement. On the other hand, few studies
attempted to develop models to determine hydration degree of slag in paste or
concrete. Some of these models did not consider the influence of chemical
compositions, and physical properties of slag, time-dependent effect of free water and
specific heat, total heat generation in theoretical concepts of their modelling.

3
Therefore, accurate modelling of hydration degrees of cement and slag is essentially
beneficial for evaluating thermal cracking potential of slag concrete.
Predicting thermal properties such as specific heat, thermal conductivity,
coefficient of thermal expansion, heat transfer coefficient at exposed surfaces, and
mechanical properties such as early age tensile strength, tensile strain capacity and
modulus of elasticity are critical steps for modelling of thermal cracking potential in
concrete. It is a well-known fact that the hydration degrees of cement and slag
increase with time, which results in altering of the properties of concrete. Hence, the
thermal properties change with time especially at the early age of concrete. Therefore,
it is crucial to understand the effect of slag towards the behaviour of these properties
in order to model thermal properties of slag concrete.
Many researchers were able to experimentally investigate those thermal
properties of paste, mortar and concrete. However, most of the experiments were
conducted at 28 days or longer ages after casting (Bentz et al., 2011; Damdelen et al.,
2014; Demirboga, 2007). Some studies used oven-dried specimens thus omitting the
moisture condition inside the specimens, which supposed to be considered in accurate
evaluation to measure thermal properties. Few efforts have been made to find the
effect of fly ash towards altering time-dependent thermal properties in concrete
(Saengsoy, 2003; Choktaweekarn, 2008). In these studies, specific heat, thermal
conductivity and coefficient of thermal expansion were modelled based on the
thermal properties of each constituent and fraction of constituents in concrete at
considered age. However, the effect of slag was not modelled or experimentally
evaluated in these studies. The specific heat and thermal conductivity of mortar
containing different replacements of slag were experimentally measured by Viet et al.
(Viet et al., 2014). The measurements were obtained at 3 and 7 days and it was found
that the behaviour is similar to that of fly ash. However, modelling of thermal
properties for paste, mortar and concrete was not developed in his study.
Mostly, time-dependent modelling of thermal properties is limited due to
conflicts among results (Guo et al., 2001). Therefore, constant thermal properties are
4
mostly utilized for thermal cracking modelling. These assumptions lead to errors and
inaccurate predictions of temperature and thermal cracking potentials especially at the
early stage where thermal properties tend to change rapidly. Therefore accurate
modelling of thermal properties could be beneficial to provide solid background to
accurate thermal modelling of concrete.
In the case of mass concrete, adiabatic temperature rise is vital since it is the
most influential factor for thermal cracking potential. Several investigations have
been done to experimentally measure adiabatic temperature rise in mass concrete
incorporating slag (Attari et al., 2012; Tada et al., 2014). Models have been
developed for predicting temperature rise and evaluating thermal cracking potential of
mass concrete as well (Wang & Linger, 2010; Santhikumar et al., 1993; Faria et
al.2006). However, these models assumed constant specific heat values in their
analysis to predict temperature in concrete. Therefore the accuracy of these
simulations is limited.
A time-dependent model was developed (Choktaweekarn, 2008) to predict the
adiabatic temperature rise and thermal cracking potential of mass concrete containing
fly ash. It consists of various sub-models such as hydration degree of cement,
hydration degree of fly ash, thermal properties models and heat generation model.
Thereby, adiabatic temperature rise in the center of mass concrete can be computed
based on the criteria that no heat loss to or gain from surrounding. If any interaction
occurs between the concrete to or from surrounding, thermal conductivity involving
rate of heat flow in concrete, heat transfer coefficients and other external effects are
needed, hence semi adiabatic temperature rise can be predicted as well. Therefore,
modelling of thermal properties, temperature of mass concrete containing slag could
be beneficial for bridging a knowledge-gap for construction industry.
1.3 Objectives and Scope of Study
The key objective of this study is to develop models that can accurately
predict thermal properties and adiabatic temperature in concrete containing slag. For

5
this process, the initial step is to model the hydration degrees of cement and slag.
When slag is included as a binder, it not only reacts but also can affect the cement
hydration phases as well. Therefore, thorough investigation is carried out on the
interaction of slag-cement system and the effect of slag towards hydration process of
cement. Then, a time-dependent model for free water is developed based on
experiments for slag-cement paste. It is followed by modelling time-dependent
thermal properties which are specific heat, thermal conductivity, and coefficient of
thermal expansion based on experiments of slag-cement pastes. Then, these models
are linked to compute the adiabatic temperature rise at the center of mass concrete
containing slag. The developed model is to be verified for its accuracy using previous
experimental results on adiabatic temperature rise of mass concrete samples including
slag from different sources. The first part of this study can be illustrated through the
flowchart shown in Fig. 1.1.
Fig. 1.1 Step-by-step procedure to compute adiabatic temperature rise in concrete
Inputs: Initial temperature, Mix proportions, Necessary properties of cement, slag, aggregates and water
Total heat generation (Q)
Hydration degrees of cement and slag
Free water content
Specific heat (c)
Q=mcΔT
Adiabatic temperature rise (ΔT)

6
After efficaciously attaining the first objective, the next is to obtain semi-
adiabatic temperature rise and to evaluate thermal cracking potential in mass concrete.
Adiabatic conditions interpret no heat loss or gain from the surrounding environment.
However, when practical application is considered, semi-adiabatic condition is
observed due to some heat loss to or gain from environment. Therefore, this model is
to be extended in such a way that it could predict not only the semi-adiabatic
temperature rise in concrete, but also the risk of thermal cracking of the structural
member due to restraint of concrete (Choktaweekarn, 2008). In order to obtain semi-
adiabatic temperature and thermal cracking, the dimension of element, environmental
and boundary conditions must be input other than the parameters mentioned in the
original model. Heat of hydration of binder obtained from the previous adiabatic
temperature rise model, is used as an input for a commercial FEM program to
evaluate semi-adiabatic temperature rise. Then, thermal cracking potential is
evaluated based on the criteria comparing restraining strain to that of the tensile strain
capacity of any considered location in the mass concrete structure. The second part of
this study can be illustrated through the flowchart shown in Fig. 1.2. The prediction of
thermal cracking is not included in the scope of this study, thus, it can be investigated
as a further step.
Experimental process is carried out to investigate the semi-adiabatic
temperature rise of mass concrete specimens with different fly ash and slag
replacements. These results are to be verified by the model predictions. Initial slump
model is discussed and verified using the experimental results obtained from this
study. Moreover, compressive strength of slag concrete and fly ash concrete is
experimentally investigated as well. The 28-day compressive strength model is
described and verified using the test results in this study.

7
Fig. 1.2 Flowchart to compute semi-adiabatic temperature rise and thermal cracking
potential of mass concrete containing slag
Finite element heat transfer analysis
Thermal conductivity Total heat generation
Input: Convection heat transfer coefficient at the
surface of concrete
Input: Dimension of structure and ambient and boundary
conditions
Semi-adiabatic temperature
Temperature gradient between center and surface of concrete
Finite element structural analysis
Restraint due to different thermal deformation
Coefficient of thermal expansion
Input: Modulus
of elasticity, Poisson’s
ratio
Restraint due to differential thermal deformation
Check: Restrained strain > Tensile strain capacity
No Yes
No crack Crack
8
Chapter 2
Literature Reviews
2.1 Ground Granulated Blast Furnace Slag
Slag is a by-product obtained from steel and iron manufacturing process
(Beushausen et al., 2012). It is produced in the blast furnace as a by-product when the
iron ore is reduced by coke at 1350°C-1550°C. The main product which is molten
iron is formed in the bottom of the blast furnace while the liquid slag forms the layer
above it due to lower density of slag. Subsequently the liquid slag layer is separated
and it is cooled down using air or water flow. It is estimated that roughly 300 kg of
slag is produced per metric ton of pig iron (Chen, 2007).
There are three main types of slag which is categorized by the cooling process
(Chen, 2007). First is the air-cooled slag which is produced by solidifying the liquid
layer slowly in the air followed by accelerated cooling by spraying water. This is
normally used in asphalt paving, road bases, and as a concrete aggregate due to its
hard and dense structure. The second type is named as pelletized slag which is
produced by cooling slag with water and flinging it into air. This is mostly used in
cement production as a raw material. It has lower glass content than other types. The
third and mostly common form of slag is Ground Granulated Blast Furnace Slag. It is
produced by quenching the liquid slag with water in order to obtain granulates. These
granulates consist more than 95% of glass content. Grinding this material will result
in GGBS which is used as a mineral admixture in concrete (Oner & Akyuz, 2007).
The chemical composition of GGBS generally consists of 27-40% SiO2, 30%-
50% CaO, 5%-15% Al2O3 and 1%-10% MgO (Zhu et al., 2012). It is stated that the
performance of slag as a cementitious material depends highly on the chemical
composition, glass content and fineness of particles. Major positive effects of GGBS
could be mentioned as lower heat of hydration, increase durability and long term
strength and suitability in normal and severe conditions such as marine environment

9
as well. (Ground Granulated Blast Furnace Slag is referred to as slag here onwards, in
the forthcoming chapters).
2.2 Hydration Degrees of Cement and Slag
2.2.1 Hydration degree of cement
Hydration degree of cement has been modelled in many studies since it is the
governing process for prediction of various properties of concrete (Tantermsirikul &
Saengsoy, 2002; Choktaweekarn & Tangtermsirikul, 2010;Kolani et al., 2012).
Kolani et al. (2012) developed a hydration model for cement based on stoichiometric
calculations by relating the chemical composition of the cement to that of their
hydrated products. However, it was concluded that errors in the stoichiometry of
hydrated products reduced the accuracy of this model. Wang and Lee (2010)
developed a kinetic model for predicting hydration degree of cement based on
production and consumption of calcium hydroxide in concrete. However, the
accuracy was limited as this model did not consider the effect of hydration of each
reactive compound and influence of chemical and physical properties of binders.
Saengsoy and Tangtermsirikul (2002) developed a model for estimating hydration
degree of cement by considering reactivity of each reactive compound in cement
(C3A, C3S, C2S, and C4AF). An average hydration degree can also be estimated as a
weight average of the hydration degrees of all reactive compounds in the cement. In
the current study, this model is adopted to compute time-dependent hydration degree
of cement.
2.2.2 Hydration degree of slag
Hydration degree of slag in paste may be experimentally obtained by several
methods such as selective dissolution, recrystallization of slag from differential
scanning calorimetry, cumulative heat evolution curves from isothermal calorimetry,
and chemical shrinkage curves (Kochaba et al., 2011). Among these tests, selective
dissolution method is a comparatively simple, effective and accurate method to obtain
hydration degree of slag. It is based on a preferential chemical dissolution of all other

10
products except unreacted slag (Kochaba et al., 2011; Lumley et al., 1996; Hanehara
et al., 2014; Escalante et al., 2001). The hydration degree can then be calculated
based on the ratio between the reacted amounts of slag per total amount of slag in the
paste mixture. Lumley et al. (1996) observed that hydration degree of slag
significantly changes with age where at water to binder ratios (w/b) of 0.4-0.6 and
20°C, 30-55% of slag reacts in 28 days and 45-75% in 1-2 years. Escalante et al.
(2001) investigated hydration degree of slag by selective dissolution method under
different conditions. It was found that hydration degree of slag increases with
temperature and w/b ratio, whereas, it decreases with increasing replacement level.
Previous studies carried out in Japan (Hanehara et al., 2014; Sagawa & Nawa, 2014)
observed that hydration degree increases as the fineness of slag increases indicating
the importance of physical properties of the slag particles towards hydration.
Analysing experimental results from selective dissolution method from different
sources could be beneficial to develop a generalized model to quantitatively
determine hydration degree of slag.
The behaviour of slag when mixed with water is somewhat different to that of
other minerals admixtures such as fly ash. Slag has a slight self-cementing ability
which does not require calcium hydroxide to form cementitious products (Wang &
Linger, 2010). Although slag show self-hydrating characteristics, the amount of
cementitious products formed and the rates of formation are insufficient for use in
structural applications. Slag reacts remarkably when the environment is suitable, an
alkaline environment in case of concrete (Chen, 2007). The reaction of slag with
hydroxides could be explained by two stages. Initially, slag reacts with alkali metal
hydroxides which are dissolved immediately when cement is mixed with water. In the
second stage, once the concentration of calcium hydroxide reaches a certain amount,
the reaction between slag and CH becomes dominant (Merzouki et al., 2013).
Many factors affect the rate and the reactivity of slag. The key factors
affecting reactivity of slag in cement summarized by Chen (2007) is illustrated in Fig.
2.1. These factors result in either increase or decrease of the hydration degree of slag.
Higher hydration temperature, water to binder ratio, hydraulic index, vitreous fraction
11
and specific surface area increase the reactivity of slag (Escalante et al., 2001).
However, reactivity of slag decreases with the increase of percentage of slag
replacement. The representations of behaviour of few such factors were illustrated
previously by Escalante (2001) as indicated in Fig. 2.2.
Fig. 2.1 Key factors affecting the reactivity of slag in cement (Chen, 2007)
Fig. 2.2 Behaviour of some factors towards the tendency of hydration degree of slag
in cement (Escalante, 2001)

12
Several models have been developed to determine hydration degree of slag
(Kolani et al., 2012; Wang & Linger, 2010; Merzouki et al., 2013; Luan et al., 2012).
Kolani et al. (2012) developed a model to quantify the hydration degree of slag in
blended cement through the measurements of portlandite content, free water content
and hydration heat. Wang and Linger (2010) introduced a kinetic model to predict
hydration degree of slag by considering the portlandite production by cement
hydration and its consumption by slag. These models did not consider the influence
of chemical compositions, and physical properties of cement and slag. Merzouki et
al. (2013) proposed another kinetic model based on stoichiometry of the reaction
between slag and portlandite in which chemical composition of cement and slag,
fineness, curing temperature and w/b were taken into account. However, the model
did not consider the time-dependent effect of free water and specific heat and also
underestimated the portandite for high replacements of slag. Luan et al. (2012)
proposed a model to predict hydration degree considering the role of portlandite as the
activator and the Ca/Si ratio of C-S-H. Time-dependent variation in total heat
generation and specific heat were not considered in this model. Therefore,
generalized model for quantification of reaction degree of slag by considering all
main factors and time-dependent variables is critical to determine the behaviour of
slag in concrete.

13
2.3 Experiments on Thermal Properties
2.3.1 Specific heat
Specific heat can be defined as the amount of heat required to change the
temperature of a unit mass of a certain substance by a unit degree of temperature
change. This parameter is used to relate heat of hydration generated in concrete and
its temperature rise is computed by Eq. (2.1) where Q is the cumulated heat of
hydration (kcal), m is mass of concrete (kg), c is the specific heat of concrete
(kcal/kg/oC) and ∆T is temperature rise at considered time t (
oC).
TmcQ (2.1)
The specific heat of concrete is a time-dependent parameter. As the hydration
proceeds, amount of free water reduces rapidly with time hence increasing the degree
of hydration. Since the specific heat of water is the highest among all other
constituents in concrete, specific heat decreases rapidly with time at the early age
(Choktaweekarn, 2008).
Few experimental investigations have been done to observe the tendency of
specific heat of slag-cement paste. A previous study (Schutter & Taewe, 1995)
measured specific heat of slag-cement paste by obtaining the temperature rise in a
calorimeter when given certain energy supply. Tests were done for paste specimens
with w/b of 0.5 and it was concluded that specific heat decreases linearly with the
increase of hydration degree. Another study (Viet T. , 2013) measured specific heat of
slag-cement paste at w/b of 0.4. Two slag replacements of 25% and 60% were utilized
and it was found that, specific heat increases as the slag level increases. This is due to
higher free water amount available in the initial stage of slag-cement paste than that of
the cement only paste. However, this study only concerned results at 3 and 7 days.
Bentz (2007) and He (2005) used transient plane source technique to measure
specific heat of cement paste. This method is based on a use of a transiently heated
plane sensor and it is typically stated as Hot Disk Thermal Constants Analyzer. The

14
hot disk technique is based on using a thin metal strip or a metal disk as a continuous
plane heat source (He, 2005; Gustafsson, 1991; Log & Gustafsson, 1995). The metal
disk or strip is sealed between two thin polyimide films for electrical insulation.
During the experiment, the hot disk sensor is sandwiched between two pieces of
samples to be investigated, and a small constant current is supplied to the sensor. The
sensor also serves as a temperature monitor, so that the temperature increase in the
sensor is accurately determined through resistance measurement as a function of time.
For the samples, w/b ratios of 0.3 and 0.4 were used and it was concluded that
specific heat increases as w/b of the sample increases (Bentz, 2007). Moreover, it
decreases as hydration degree increases.
2.3.2 Thermal conductivity
Thermal conductivity is known as the rate of heat transfer through a unit cross
sectional area of material for a specific temperature gradient. Heat transfer through
conduction in a specified direction is proportional to temperature gradient in that
direction and the area perpendicular to the direction of heat flow. The general
equation of rate of heat flow in specified direction x, qx (kcal/day) is shown in Eq.
(2.2) as follows.
dx
dTkAqx (2.2)
where k is the thermal conductivity (kcal/ m day °C), A is the area of the cross
section perpendicular to the direction of heat flow (m2), dT/dx is the temperature
gradient in the direction of heat flow (°C/m).
Thermal conductivities of aggregates are higher than that of the paste, thus the
mineralogical character of aggregate greatly influences thermal conductivity of
concrete (Choktaweekarn, 2008). Moreover, degree of crystallization of aggregate has
significant effect towards the thermal conductivity (Demirboga, 2007). Heat
conduction is higher in aggregate with crystalline structure than amorphous and
vitreous aggregate. Porosity and moisture content are other factors that affect this

15
property in concrete. Moreover, as the hydration process continues, amount of free
water in concrete reduces with an increase of hydrated products resulting in increasing
thermal conductivity with time especially in early stages.
There are two main techniques for measuring thermal conductivity which are
steady state and transient methods. Steady state method is useful when the material
under examination is rigid and dry or conditioned to the ambient condition
(Choktaweekarn, 2008). The method is not suitable when moisture redistribution can
occur during the period of the test. The transient method is convenient to use with
rigid and semi-rigid materials and has particular advantages when thermal
conductivity of moist materials is to be measured. Transient measurement technique is
appropriate for low conductivity porous materials. The rapidity of the determination
does not allow sufficient time for any moisture movement to occur within the sample
during testing. Moisture has great effect on thermal conductivity of concrete, then
transient method is preferable.
Steady state method was applied in a previous study to find the effect of slag
on thermal conductivity by using 15% and 30% slag replacements by weight
(Demirboga, 2007). Paste and mortar specimens were tested at 28 days in oven dried
conditions. The results showed that thermal conductivity decreased with the increase
of slag replacements levels. Demirboga further analyzed the effect on thermal
conductivity with high replacement levels of slag (Demirboga et al., 2007). For 50%,
60% and 70% replacement levels of slag, thermal conductivity decreased 15%, 18%
and 17% respectively. It is stated that the density reduces as the slag replacement is
higher, thus affecting lower thermal conductivities of concrete.
Transient method was used by Bentz (2007) to measure thermal conductivity
of cement pastes since casting until 28 days. Hot disk thermal constants analyzer was
used for the measurements. The variables investigated included w/b and different
curing conditions of saturated and sealed. It was observed that hydration did not
significantly affect the thermal conductivity of pastes. The similar method was used in
another study (Choktaweekarn, 2008) to measure thermal conductivity of paste and

16
mortar with partial fly ash replacements. It was concluded that the values increase just
after casting up to 3 days of age, then followed by constant tendencies. Moreover, it
was found that the use of fly ash reduces thermal conductivity due to decreased
density of specimens.
2.3.3 Coefficient of thermal expansion
A study stated that concrete can slightly expand or contract depending on the
temperature rise or fall (Neville & Brooks, 1987). The coefficient of thermal
expansion (CTE) is known as the length change of a unit length per unit degree of
temperature change. The expression for CTE for concrete is mentioned from Eq.
(2.3).
T
LLCTEc
)/( 0 (2.3)
Where CTE is the coefficient of thermal expansion of concrete (micron/oC),
∆L is the length change of the specimen (mm), Lo is the initial length of the specimen
(mm) and ∆T is the temperature change (oC).
CTE of concrete is a result of CTE of cement paste and aggregate since they
are the main constituents. If the CTE of aggregate and cement paste differs too much,
a large temperature change which cause differential movement may break the bond
between them easily (Choktaweekarn, 2008). Therefore utilizing a proper aggregate
which has a similar CTE value to the paste could reduce the internal stresses.
However, due to the availability and cost of aggregate, use of mineral admixtures is
considered as a more feasible way of reducing CTE in concrete (Shui et al., 2010).
Shui et al. (2010) investigated CTE of hardened cement paste with slag
replacements of 15% and 30%. The thermal dilation rate was measured with changing
temperature from 20oC to 85
oC at a rate of 0.5
oC per minute. For every 5
oC
temperature was kept constant for two minutes to allow sufficient temperature
equilibrium of specimens. Then length change of specimen was recorded. Afterwards

17
using the following Equation, thermal dilation rates were converted into CTE.
Important conclusions were obtained by measuring CTE together with porosity and
CH content of cement paste. It was observed that slag increased porosity of the
cement paste and decreased CH content leading to lowering CTE values. Voids could
accommodate internal thermal expansion of material, thus increased porosity resulted
in decreasing CTE.
Kada et al. (2002) developed a simple method to find the CTE at early age of
concrete. This method is based on applying a temperature shock in a range of 10°C to
50°C in a short period not longer than one hour. Since the duration was short, the
effect of autogeneous shrinkage was not considered in this experiment. It was
observed that the CTE of concrete with w/b of 0.45 decreased rapidly within few
hours after casting, and then remained almost constant. The similar method was
adopted in a previous study (Choktaweekarn, 2008) for testing paste, mortar and
concrete by cooling them down in a refrigerator to reduce temperature until 10°C,
then followed by moving out to return the temperature back to room temperature
(about 30±2°C). The specimens were tested for the change in length for every 5°C
change of temperature, thereby CTE values were computed. It was concluded that
CTE of concrete is a time-dependent property which increases with age due to
increased continuity of the structure.
2.4 Effect of Slag on Heat Evolution of Concrete
A laboratory program (Attari et al., 2012) measured the heat generated from
concrete mixes including slag replacements from 0% to 70%. Thermocouples were
used to record internal temperature of concrete specimens with dimensions of
30×30×15 cm. The specimens were insulated during the curing process to prevent
excessive heat loss to or gain from surrounding. Then the total amount of heat
released was computed based on the laws of heat transfer and measured temperature
profiles until one week. It was concluded that the total heat released during the
measurement period reduced as the slag replacement level increased, however,

18
continuous increase was observed at the later stage when compared to that of the
cement only concrete.
Hydration temperatures of high-strength concrete columns were
experimentally investigated to assess the influence of slag replacement level ranging
from 0% to 70% (Sioulas & Sanjayan, 2000). The large concrete columns of
dimensions 80×80×120 cm were cast with top and bottom surfaces insulated using
50mm thick expanded polystyrene form. The results indicated that the peak
temperature rise encountered at the center of the columns significantly reduced with
the inclusion of slag into concrete. A delay in the time to attain the maximum
temperature is observed for the specimens with slag and it increased as the slag
replacement increased. The thermal gradients observed were 128, 109, 86, and 64
°C/m for the specimens with slag replacements of 0%, 30%, 50%, and 70%,
respectively. Moreover, the temperature difference between center and surface was
mitigated by including slag in concrete.
Semi-adiabatic calorimetry technique was used previously (Ruiz et al., 2001)
to investigate the heat evolution of concrete containing 30% and 50% of slag. It was
reported that the rate of temperature rise was lower when the slag replacement is
higher. However, the time to attain peak temperature was shortened for the 30% slag
specimen when compared to that of the 50% slag replaced specimen. Moreover, it
was concluded that lower water to binder ratio may result in similar or slightly higher
heat evolution of concrete containing lower replacements of slag.
A previous study analyzed the heat evolution of high performance concrete
using normal and ultra-fine slags (Divsholi & Lim, 2012). Two types of slag are used
which have different particle sizes of 4100 cm2/g and 8700 cm
2/g, respectively. The
slag replacements used in this study were 45% and 60%. It was observed that the
temperature rise was higher in concrete containing ultra-fine slag when compared to
that of the concrete containing normal slag. This was due to increase of total surface
area for reaction which increases the rate of hydration and pozzolanic reactions.

19
An experimental study (Tada et al., 2014) comparatively investigated the
effect of fly ash and slag on heat evolution of concrete. Adiabatic temperature rise
was tested using air circular type measurement equipment containing a sample
capacity of 50 liters. Practical fly ash and slag replacements levels which are mostly
used in mass concrete were used. Fly ash was varied from 20% to 50% and slag was
varied from 50% to 75%. It was reported that peak temperature significantly reduces
in fly ash concrete when compared to that of slag concrete. Moreover, lower thermal
gradients were observed in fly ash concrete as well.
2.5 Thermal Cracking of Mass Concrete
2.5.1 Overview of thermal cracking
Hydration of cement generates heat since it is an exothermic reaction. This
generated heat dissipates rapidly in concrete elements with relatively small dimension
(Alhozaimy et al., 2015). But, for massive concrete structures, the hydration process
causes accumulation of heat inside the structures. The difference of temperature
between center and surface of the mass concrete results in temperature gradient which
leads to thermal cracking especially at early age (Ballim, 2003; Nili & Salehi, 2010;
Saengsoy & Tangtermsirikul, 2003). Thermal cracking results in deterioration and
reduces service life of concrete structures.
There are several reasons for the propagation of thermal cracking. One of the
main reasons is utilizing concrete mixes that generate significant amount of heat such
as high-strength and self-consolidating concrete mixes (Ng, 2014). Construction of
massive concrete structures without appropriate measures to mitigate heat generation
is another reason. Disregarding the consequences of thermal movements during both
design and construction stage may lead to occurrence of thermal cracking as well.
It is required to control temperature especially in massive concrete structures,
hence many methods are practically utilized in order to alleviate thermal cracking
problem. There are three main methods used to mitigate thermal cracking in the
design and construction phases of massive concrete structures (Ng, 2014). The first

20
method is restraint analysis and optimization. It is done by reducing adverse effects of
movement restraint. For example, using different construction sequence or cycles
such as layer casting method can be utilized to reduce thermal cracking
(Choktaweekarn & Tangtermsirikul, 2010). The second method is taking thermal
control measures. Using in-situ cooling pipes by circulating air or water in the curing
process, reducing placing temperature, and external insulation are some of examples
for thermal control measures. The third method is to use appropriate mix design such
that the thermal cracking potential is lowered. Replacing part of mixing water with
ice, use of aggragates with lower CTE, and use of supplementary cementitious
materials (SCM’s) as partial replacement of cement are some of the examples under
this method.
Use of SCM’s is the easiest and economically and environmentally viable
method among all these methods to reduce thermal cracking of massive concrete
structures. However, rheological, thermal and mechanical properties may change
when cement is partially replaced by mineral admixtures. Therefore, it is essentially
beneficial to develop modeling for the concrete to predict the most appropriate mix
design of concrete with mineral admixtures, in order to minimize thermal cracking
potential of concrete.
2.5.2 Models for predicting temperature and thermal cracking
A numerical model was previously developed (Attari et al., 2012) in order to
simulate adiabatic temperature rise of concrete containing slag. Firstly, hydration
degree of concrete was quantified based on the heat released. Then heat of hydration
was experimentally verified from testing semi- adiabatic temperature rise of concrete
containing slag replacements from 0% to 70%. Best fit mathematical model was
proposed to compute adiabatic temperature rise based on laws of heat transfer.
However, it was reported that the prediction of hydration degree is not accurate since
it was computed based on the heat released. Moreover, the effect of slag on free
water, specific heat was not considered as well.

21
Ballim (2003) proposed a model for predicting time based temperature profiles
in mass concrete elements. The rate of heat generation was determined using an
adiabatic calorimeter in which a concrete sample was placed and temperature rise was
monitored up to 7 days. The results were then converted into maturity rate of heat
evolution. A finite difference model was used to compute time-dependent temperature
at any location of the concrete by using the results obtained from heat rate-maturity
relationship. Laboratory verifications were carried out in order to validate the model.
It was reported that the accuracy of the model predictions was limited due to errors in
assumptions of constant thermal properties.
Previous study (Luan et al., 2012) composed a model to predict adiabatic
temperature rise of concrete containing slag. The model was developed based on
hydration degrees of cement and slag. Heat generation and specific heat of concrete
were assumed as constants. Adiabatic temperature rise in concrete at different initial
temperatures and mix proportions were simulated. The accuracy of the predictions
was limited especially at early age due to assumptions of constant thermal properties
and heat rates.
Wang and Linger (2010) developed a kinetic model for predicting adiabatic
temperature rise of concrete containing fly ash and slag. The hydration degrees of
cement and mineral admixtures were computed based on production and consumption
of calcium hydroxide in concrete. Adiabatic temperature rise predictions were done
and it was reported that limitations exist as this model did not consider the effect of
hydration of each reactive compound and influence of chemical and physical
properties of binders.
A multi-component model for hydration heat of blended cement was proposed
in a previous study (Kishi & Maekawa, 1996). Reactive components considered were
Portland cement, fly ash, and slag. The heat rate and the thermal activity of each
mineral compound were computed based on material properties. The hydration
degrees of cement and mineral admixtures were computed step by step by using
modified Arrhenius’s low of chemical reactions. The retardation of fly ash on cement
22
hydration was considered when computing the hydration degrees. The model was
verified by analysis of adiabatic and semi-adiabatic temperature rise simulations.
However, the hydration of cement was affected by the addition of slag as well, which
was not considered in this model. Moreover, the effect of slag for thermal properties
was not considered as well.
A model to predict thermal cracking was previously developed (Schutter,
2002). It was based on hydration degree of blended cement containing slag. The
cracking tendency was implemented by a smeared cracking approach having non-
linear softening behavior. In this study, it was assumed that the specific heat and
thermal diffusivity of hardening concrete decrease linearly with increasing hydration
degree. However, constant value was used for the coefficient of thermal expansion
due to lack of experimental results. The proposed model was verified with
experimental results and showed good agreement with the tested tendencies of
thermal cracking.
A computerized program was developed for simulating temperature in mass
concrete in a previous study (Saengsoy, 2003). It is capable of simulating the
temperature in fly ash concrete. The required input parameters for this program are
initial temperature, mix proportions of concrete and properties of cement and fly ash.
When these parameters are given, the program initially computes the degree of
hydration in cement compounds and degree of pozzolanic reaction of fly ash in
concrete. It was followed by computing the cumulative heat based on summation of
all the heat liberated from the reactions of each cement compound including
formation of ettringite and monosulphate, and the reaction of fly ash. A time-
dependent model for specific heat was introduced, enabling more realistic temperature
simulation especially at early age of mass concrete. It was reported that the
formulated model could accurately predict the test results of adiabatic temperature
rise.
23
When practical applications are considered in real mass concrete construction,
semi-adiabatic condition is observed due to heat loss to environment. Therefore, an
enhanced model to compute not only semi-adiabatic temperature rise in concrete, but
also the risk of thermal cracking of structural members due to restraint of concrete is
developed in a previous study (Choktaweekarn, 2008). In order to obtain semi-
adiabatic temperature and thermal cracking potential, the dimension of element,
environmental and boundary conditions must be input other than the parameters
mentioned in the original model by Saengsoy (2003). Heat of hydration and
pozzolanic reactions were obtained by from the previous adiabatic rise model and
they were used as inputs for a commercial FEM program. Moreover, models were
proposed to obtain thermal properties such as specific heat, thermal conductivity and
coefficient of thermal expansion. FEM program was used to analyze semi-adiabatic
temperature and restrained strain of concrete. In this study, restrained strain was
compared to that of the tensile strain capacity of specific point of concrete to evaluate
the thermal cracking potential of fly ash concrete. If the restrained strain is higher
than that of the tensile strain capacity of concrete at any point, it results in thermal
cracking.
24
Chapter 3
Hydration Degrees of Cement and Slag
3.1 Determination of Hydration Degree of Cement
The mechanism of cement hydration process is complex, thus reaction
behavior has been studied considering each individual reactive compound (Young et
al., 1998; Saengsoy, 2003). The basic reactions of the cement hydration process is
described below. The abbreviated notations are used for the principal oxides in clinker
as follows; C for CaO, S for SiO2, A for Al2O3, F for Fe2O3, S for SO3, and H for
H2O.
Eq. (3.1) and Eq. (3.2) indicate examples of hydration reactions of Calcium
Silicates which are C3S and C2S. These reactions produce calcium silicate hydrate
gels and calcium hydroxide.
CH3 HSC H6 SC2 3233 (3.1)
tricalcium silicate Water C-S-H Gel Calcium hydroxide
CH HSC H4 SC2 3232 (3.2)
dicalcium silicate Water C-S-H Gel Calcium hydroxide
As seen from Eq. (3.3), C3A reacts with calcium and sulfate ions that are
available due to dissolution of gypsum.
323623 HASC H26 CSH3 AC (3.3)
tricalcium aluminate gypsum water ettringite
Ettringite is stable only if sulphate is available. If all sulphate was consumed
before C3A hydration complete, ettringite transform into monosulfoaluminate as
indicated in Eq. (3.4).

25
12432363 ASHC3 H4 HASC AC2 (3.4)
tricalcium aluminate ettringite water monosulfoaluminate
If monosulfoaluminate is again contacted with a new source of sulphate, it
reacts and forms ettringite as indicated in Eq. (3.5).
32362124 HASC H16 CSH2 ASHC
(3.5)
Monosulfoaluminate gypsum water ettringite
If there are no sulphate ions present, C3A will form calclium aluminate
hydrates as indicated in Eq. (3.6).
821343 AHC AHC H21 AC (3.6)
C4AF reactions are slower than C3A reactions. Due to insufficient calcium to
form calcium sulfoaluminates, amorphous hydrous oxides of aluminium or iron will
form as indicated in Eq. (3.7) and Eq. (3.8).
3323624 H)F,A( HS)F,A(C H21 CSH3 AFC (3.7)
312432364 H)F,A(2 SH)F,A(C3 H7 HS)F,A(C AFC2 (3.8)
In this study, the equations for predicting the hydration degrees of C3A, C3S,
C2S, and C4AF are adopted from a previous study carried out by Saengsoy and
Tangtermsirikul (2003). The hydration degree which represents reaction rate was
modeled previously as a function of age, water to cement ratio and concrete
temperature. This proposed model computed the hydration degree at each 10°C
increment of concrete temperature. Therefore, if the temperature is in between a
multiplier of 10°C, linear interpolation was done to obtain the hydration rates. The
original model was modified by Choktaweekarn (2008) to increase the accuracy at

26
early age of concrete. The modified model is used in this study to simulate the
hydration degree of cement.
Since, the model predict hydration degree of each reactive compound, the
average hydration degree is computed based on the assumption that each cement
compound react independently. The average hydration degree of cement in concrete is
defined as the weight fraction average of hydration degree of all cement compounds
in the concrete mix. It is computed by using Eq. (3.9).
4
1i
i
4
1i
ii
hy
m
)t(m
)t( (3.9)
Where αhy(t) is the average hydration degree of cement (%), i denotes each
mineral compound of cement (C3A, C3S, C2S, and C4AF), mi denotes the mass of
each compound per unit cubic meter of cement (kg/m3), and αi(t) denotes respective
hydration degree of reactive cement compound i (%).
Some examples of the average hydration degree of cement in pastes which
illustrate the effect of w/c ratio and temperature are shown in Fig. 3.1 and Fig. 3.2,
respectively.

27
Fig. 3.1 Average hydration degree of cement pastes with w/b = 0.25 and 0.40 at 28°C
Fig. 3.2 Average hydration degree of cement pastes with T = 28°C and 40°C at w/b =
0.40

28
3.2 Determination of Hydration Degree of Slag
The hydration degree of slag in this study is defined as the weight fraction of
already reacted slag per total slag in the concrete mix. As mentioned in the literature
review, this can be obtained experimentally for paste by selective dissolution method.
In this study, the main objective is to develop a time-dependent model for
predicting hydration degree of slag in concrete. It is difficult to develop a generalized
model to compute hydration degree of slag based on previous experimental results
obtained from different sources due to dissimilar values, possibly caused by different
methods of measurements. Moreover, analysis of selective dissolution data done only
in paste samples is considered not possible to include the effect of fine and coarse
aggregate in concrete. It is known that the presence of aggregate enhances the degree
of reaction by providing a better mixing efficiency (Chang & Peng, 2001). Therefore,
the model equation is obtained using the method of back analysis from adiabatic
temperature results of slag concrete from Tada et al. (2014) since the slag and cement
used in this previous study and our study are obtained from the same source of
manufacturer.
However, the tendencies of previously obtained results from selective
dissolution method by Lumley et al., 1996; Copeland & Kantro, 1969; Shinwa et al.,
2009; Escalante et al., 2001; Hinrichs & Odler, 1989; Sagawa & Nawa, 2009 are also
studied to investigate the key parameters affecting the hydration degree of slag. The
key parameters of the model for predicting hydration degree of slag are age, water to
binder ratio, concrete temperature, slag replacement ratio and fineness of the slag.
The equation for computing hydration degree of slag is shown in Eq. (3.10).
)b/wj1(
slag
slag
cb
slag
k
Ti)3500F(h1
T)sgb/wf(*Expe1)]1t(d[Expsta
(3.10)
where αslag is the hydration degree of slag in concrete at the considered age. t,
s, w/b, T, and Fslag are the considered age (days), slag replacement ratio, water to
29
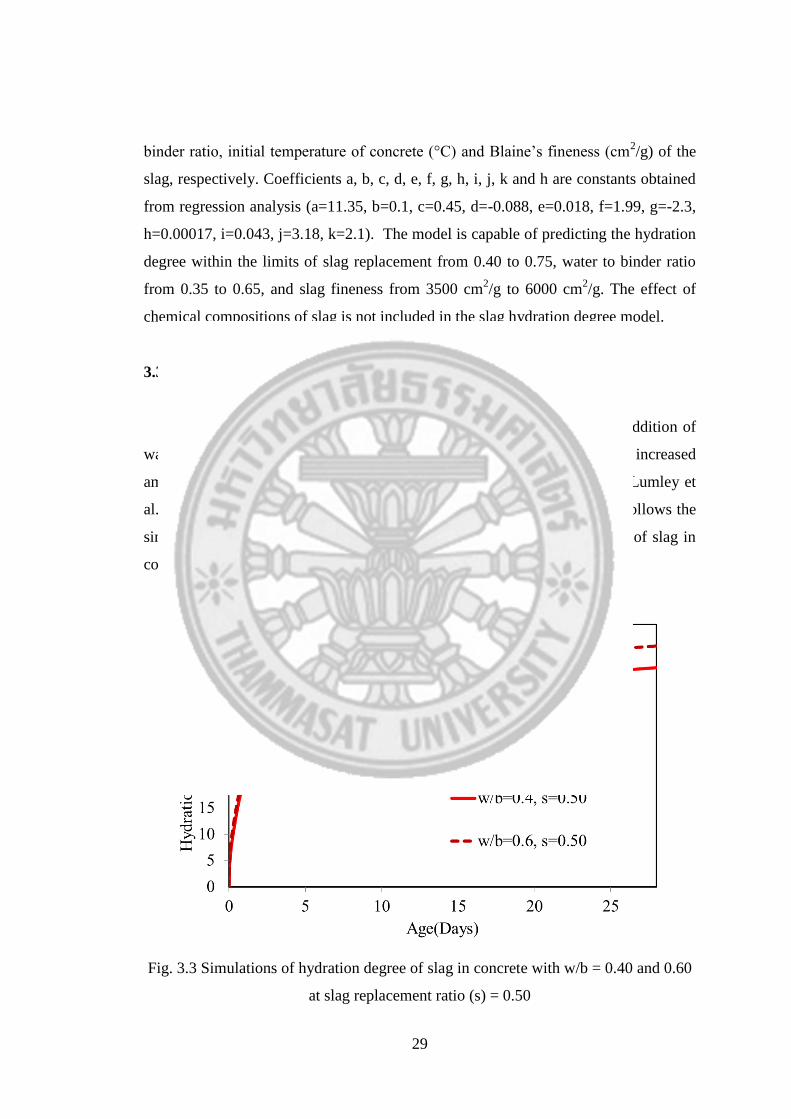
binder ratio, initial temperature of concrete (°C) and Blaine’s fineness (cm2/g) of the
slag, respectively. Coefficients a, b, c, d, e, f, g, h, i, j, k and h are constants obtained
from regression analysis (a=11.35, b=0.1, c=0.45, d=-0.088, e=0.018, f=1.99, g=-2.3,
h=0.00017, i=0.043, j=3.18, k=2.1). The model is capable of predicting the hydration
degree within the limits of slag replacement from 0.40 to 0.75, water to binder ratio
from 0.35 to 0.65, and slag fineness from 3500 cm2/g to 6000 cm
2/g. The effect of
chemical compositions of slag is not included in the slag hydration degree model.
3.3 Key Factors Affecting Hydration Degree of Slag in Concrete
The hydration degree increases as the w/b of the paste increases. Addition of
water results in higher contact between slag and water which leads to form increased
amount of hydrated products. This results in enhancing reactivity of slag (Lumley et
al., 1996; Copeland & Kantro, 1969). The tendency of model simulations follows the
similar pattern as shown in Fig. 3.3 which illustrates the hydration degree of slag in
concrete at w/b ratios of 0.4 and 0.6.
Fig. 3.3 Simulations of hydration degree of slag in concrete with w/b = 0.40 and 0.60
at slag replacement ratio (s) = 0.50

30
Decrease in slag replacement percentage results in increasing the hydration
degree of slag in cement paste. This occurs due to higher alkaline activating effect of
the cement at lower concentrations of slag as previously reported by Escalante et al.
(2001) and Hinrichs & Odler (1989). The effect of slag replacement level for
hydration degree of slag in current model is shown in Fig. 3.4 which illustrates the
hydration degree of slag in concrete at slag replacements of 0.50 and 0.75.
Fig. 3.4 Simulations of hydration degree of slag in concrete with s = 0.50 and 0.75 at
w/b = 0.40
Effect of temperature on hydration degree of slag is investigated and described
previously by Shinwa et al. (2009), Escalante et al. (2001) and Luke & Glasser,
1988). It is reported that the hydration degree of slag is more sensitive to the curing
temperature than that of the hydration degree of cement. It is well known that as the
temperature increases, the molecules move faster and collide more vigorously
resulting in higher enhancing the hydration degree of slag. Fig. 3.5 illustrates the
hydration degree of slag in concrete at 28°C and 40°C in which the hydration degree
increases as the temperature increases.

31
Fig. 3.5 Simulations of hydration degree of slag in concrete with T = 28°C and 40°C
with s= 0.50 and w/b=0.40
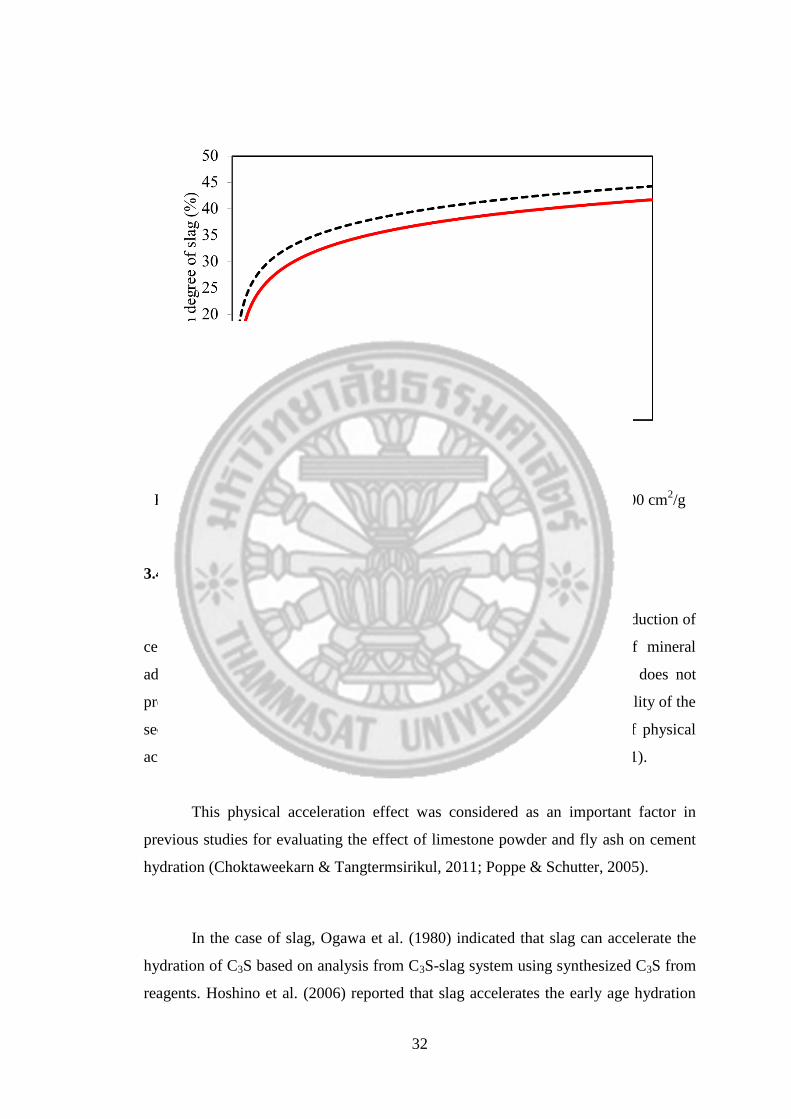
Fineness of the slag particles is another vital factor affecting the hydration
degree of slag. Hydration degree of slag is proportional to the total surface area
(Chen, 2007). Thus, it is reported that as the fineness increases, the hydration degree
of slag increases due to higher contact area for the reaction to progress (Hinrichs &
Odler, 1989; Sagawa & Nawa, 2009). The effect of slag fineness from the model
simulations in this study is illustrated in Fig. 3.6.
It is clearly seen that the model simulation patterns follow similar theoritical
background as described in previous studies. However, the comparison between
magnitudes of results of hydration degree from selective dissolution method
conducted on pastes containing slag and hydration degree of slag computed in this
study may not be reasonable at this stage. This is because the model in this study
concerns about hydration degree of slag in concrete whereas the experimental results
by selective dissolution methods concerns about pastes.
32
Fig. 3.6 Simulations of hydration degree of slag in concrete with Fslag = 4300 cm2/g
and 6000 cm2/g with s= 0.50 and w/b=0.40
3.4 Effect of Physical Acceleration of Cement by Slag Particles
The addition of slag can affect the cement hydration process. The reduction of
cement content decreases the total heat generation in the presence of mineral
admixtures (Alhozaimy et al., 2015; Nili & Salehi, 2010). However, it does not
proportionally reduce the initial rate of heat evolution. This is due to the ability of the
secondary fine particles to disperse cement particles denoted as a kind of physical
acceleration (Saengsoy et al., 2003; Choktaweekarn & Tangtermsirikul, 2011).
This physical acceleration effect was considered as an important factor in
previous studies for evaluating the effect of limestone powder and fly ash on cement
hydration (Choktaweekarn & Tangtermsirikul, 2011; Poppe & Schutter, 2005).
In the case of slag, Ogawa et al. (1980) indicated that slag can accelerate the
hydration of C3S based on analysis from C3S-slag system using synthesized C3S from
reagents. Hoshino et al. (2006) reported that slag accelerates the early age hydration

33
of C3S and C3A from analysis of hydration degree of cement paste using combined X-
ray diffraction and Rietveld analysis method.
In this study, dispersion effect is considered to affect hydration degrees of C3S
and C3A in cement at very early age. However, its effect on hydration reactions at
later age is insignificant. Equations for dispersion effect are proposed for acceleration
of C3S and C3A hydration, by adopting the concept of a previous study by
Choktaweekarn (2011), as shown in Eq. (3.11) and Eq. (3.12), respectively. Hence,
the existing hydration degrees of C3S and C3A are modified using Eq. (3.13) and Eq.
(3.14).
rslagcslag
SC
SCSCSC
SC
wwFt
ttt
1
234
9420100
120450
100
148642
100
189913
100
166121
3
333
3
tan.)(
.
)(.
)(.
)(.
(3.11)
r
slagcslag
1AC
2
AC
3
AC
4
AC
AC
wwFtan78.0100
)1t(1354.0
100
)1t(4181.0
100
)1t(5095.1
100
)1t(0281.1
3
333
3
(3.12)
SCSCifiedmod,SC 333 (3.13)
ACACifiedmod,AC 333 (3.14)
Where ΦC3S and ΦC3A are the dispersion factors for C3S and C3A acceleration,
respectively. Fslag is Blaine’s fineness of slag powder (cm2/g). wc and wslag are weight
ratios of cement and slag per unit weight of concrete. r is the replacement ratio of
slag. αC3S and αC3A are hydration degrees of C3S and C3A, respectively. αC3S,modified,
αC3A,modified are the modified hydration degrees of C3S and C3A after the physical
acceleration, respectively and t is the considered age in days.

34
Chapter 4
Model for Predicting Free Water Content
4.1 General
Water inside hardened paste system can be classified into two main parts
which are evaporable and non-evaporable water. Free water is defined as evaporable
water which is freely accessible for hydration process (Saengsoy & Tangtermsirikul,
2003). Many studies have reported that change of free water in concrete is significant
especially at early age, and it affects the thermal properties as well (RILEM
Commiision, 1981; Neville, 1995; Kolani et al., 2012). The amount of free water
reduces as the hydration progresses in cement and binders (Choktaweekarn, 2008).
Thus the thermal properties change as the hydration of cement and slag proceeds.
Therefore, it is essentially beneficial to model the behaviour of free water in paste in
order to predict thermal properties of concrete.
4.2 Experimental Program
4.2.1 Materials
The binders used throughout this study were Ordinary Portland Cement type I
and Ground Granulated Blast Furnace Slag provided from Taiheiyo Cement
Corporation, Japan. The physical and chemical compositions of cement and slag are
shown in Table 4.1 and Table 4.2, respectively. Normal tap water was used in all
mixes. Small plastic boxes were used to cast and cure the paste specimens in sealed
condition.
Table 4.1 Physical properties of cement and slag
Physical properties Cement type I Slag
Specific gravity 3.16 2.89
Fineness (cm2/g) 3570 4330
Loss on ignition (%) 2.06 0.96

35
Table 4.2 Chemical compositions of cement and slag
Binder
type
Chemical composition (%)
SiO2 Al2O3 Fe2O3 CaO MgO SO3
Cement 20 5.4 3 63.4 2.7 2
Slag 33.47 14.35 0.26 43.26 5.14 2.1
4.2.2 Mix proportions
This experiment was conducted to obtain free water content inside paste
specimens with time. A total of eight mixtures were cast to test free water of paste
specimens. Water to binder ratios (w/b) of 0.25 and 0.40 were used. Slag
replacements of 0%, 45%, 60%, and 75% were utilized. Mixture designation is
denoted as “W40 S45” which indicates a paste mixture having w/b of 0.40 and slag
replacement of 45%. All mix proportions of the tested specimens are mentioned in
Table 4.3.
Table 4.3 Mix proportions of the tested paste specimens
Mix designation w/b c/b s/b
W25 S00 0.25 1 0
W25 S45 0.25 0.55 0.45
W25 S60 0.25 0.40 0.60
W25 S75 0.25 0.25 0.75
W40 S00 0.40 1 0
W40 S45 0.40 0.55 0.45
W40 S60 0.40 0.40 0.60
W40 S75 0.40 0.25 0.75
Remarks: w: water, c:cement, s:slag, and b:binders (c+s).
36
4.2.3 Specimen preparation and test method
This experiment was conducted by oven- drying the paste specimens in order
to measure the amount of free water removed from the specimens. This method was
used in previous studies to measure the free water amount in paste and mortars as well
(Saengsoy, 2003; Choktaweekarn, 2008). To make sure that all free water is removed,
specimens with small dimensions were cast.
Specimens for testing free water content were cast in plastic cube moulds with
dimensions 20×20×40mm and were kept sealed until tested. All specimens were
cured in 28±2°C and 50-70% relative humidity conditions until tested at 3, 7, and 28
days. Free water content was obtained by measuring the weight loss upon drying the
specimens at 105°C for 24±2 hours until the weight loss rate was less than 1% of the
total weight.
Free water was computed from the amount of weight loss of paste specimens
which were subjected to drying at 105°C for one day. It is quantified in kg/m3 of
paste.
4.3 Experimental Results
From this experiment, it is observed that the free water contents of paste
specimens clearly reduce with age due to the consumption of water by cement and
slag hydration. From the results, the weight ratio of free water to total binder content
is used to show the effect of water to binder ratio and slag replacement level. The
results of the tested specimens at various ages are shown in Fig 4.1 and Fig 4.2.

37
Fig. 4.1 Test results of weight ratio of free water to total binder of pastes with slag
replacement levels= 0%, 45%, 60%, and 75% at w/b=0.25
Fig. 4.2 Test results of weight ratio of free water to total binder of pastes with slag
replacement levels= 0%, 45%, 60%, and 75% at w/b=0.40

38
4.3.1 Effect of water to binder ratio
When comparing Fig. 4.1 with Fig. 4.2, it is clearly seen that when water to
binder ratio is higher, the free water amount increases. Specimens with w/b of 0.25
have lower free water amount than specimens with w/b of 0.4, regardless of the age.
The tendency is similar for both cement-only and slag-cement paste specimens.
4.3.2 Effect of slag replacement level
The effect of slag is clearly shown for both w/b cases where free water
increases when the slag substitution level is higher. Similar results were previously
reported by Kolani et al. (2012). This is due to lower reactivity of slag at early age
when compared to cement. However, the decreasing rate of free water is higher at
later age for paste with slag. At later age, the reaction of slag in the paste increases.
This is due to the activation of pozzolanic reaction of slag by Ca(OH)2, which is a
product of hydration of cement. Therefore, as hydration of slag continues at later age,
free water is reduced continuously as well.
4.4 Model for Predicting Free Water Content
4.4.1 Free water content
It is clearly seen from the results obtained from this study that free water is a
time-dependent property which significantly reduces as hydration progresses
especially at early age. Therefore, simulating free water content in pastes with slag is
archieved by adopting a time-dependent model which computes free water for paste
containing fly ash. This computation is done based on Eq. (4.1).
)t(W)t(WW)t(W wgelwhpwowfree (4.1)
Free water is computed from Eq. (4.1), where Wfw(t), Wfw0, Wwhp(t), and
Wwgel(t) are the weights of free water (kg/m3), unit water content of the mix (kg/m
3),
weight of water consumed by hydration of cement and reaction of slag (kg/m3), and

39
gel water content (kg/m3), respectively. Free water content in paste is reduced due to
increase of water consumed by hydrations of cement and slag and increase of gel
water content.
4.4.2 Chemically bound water content
In the hardening process of paste, water is consumed by cement and slag
hydrations as well as produces hydrated products. The amount of water involved in
producing hydrated products is computed as the chemically bound water. It is
modelled in this study assuming that the cement and slag hydrations are independent,
as shown in Eq. (4.2).
100
)t(W
100
)t(W)t(W
slag
0uslagslag,hp
hy
0ucc,hpwhp
(4.2)
where Wwhp(t) is the weight of water consumed by hydration of cement and
reaction of slag which is represented in kg/m3. Wuc0, Wuslag0, αhy(t) and αslag(t) are the
initial weight of cement (kg/m3), initial weight of slag (kg/m
3), average hydration
degree of cement (%) and hydration degree of slag (%), respectively.
θhp,c and θhp,slag are the ratios of minimum water to binder ratio required to
obtain maximum reactions of cement and slag, respectively. The value for θhp,c is
mentioned in Eq. (4.3) which was previously used in many studies for representing
chemically bound water of cement (Powers, 1960; Neville, 1995; Lam, Wong, &
Poon, 2000; Saengsoy, 2003). The value for θhp,slag is shown in Eq. (4.4) which was
used to estimate the amount of chemically bound water previously by Maekawa &
Ishida (2002) and Wang & Linger (2010).
21.0c,hp (4.3)
30.0slag,hp (4.4)

40
4.4.3 Gel water content
Gel water is defined as the water which is entrapped within the hydrated
products. Thus, gel water increases as the hydration process of cement and slag
continues. In this study the amount of gel water content is obtained by back analysis
from the test results of free water of paste. It is computed in this study from Eq. (4.5)
assuming that the cement and slag hydrations are independent. In the case of cement
hydration, the gel water is affected by water to binder ratio as previously reported by
Saengsoy (2003). In the case of slag reaction, the gel water is affected by water to
binder ratio and slag replacement level.
100
)t(W
)s1914.3exp(83703.1
08812.3b/w01.0
100
)t(W
b/w1414.0exp(009.1
0026.00126.0)t(W
slag
0uslag
hy
0ucwgel
(4.5)
` where Wwgel(t) is the weight of gel water content (kg/m3), w/b is the water to
binder ratio of the mix and s is the slag replacement level (%). Wuc0, Wuslag0, αhy(t) and
αslag(t) are the initial weight of cement (kg/m3), initial weight of slag (kg/m
3), average
hydration degree of cement (%) and hydration degree of slag (%), respectively.
4.5 Verification of Free Water Model
The proposed model is used to simulate the free water content at various ages
of the tested specimens of paste with different water to binder ratios and slag
replacement levels. The comparison between the model simulations and test results
are shown in Fig. 4.3 and Fig. 4.4. Fig. 4.3 indicates the comparison for paste
specimens with different slag replacement levels at a water to binder ratio of 0.25.
Fig. 4.4 indicates the comparison for paste specimens with different slag replacement
levels at a water to binder ratio of 0.40.

41
The model simulations show sufficient accuracy in predicting the test results
of paste specimens at different water to binder ratios and slag replacement levels. In
the case of slag-cement paste, it is seen that the model predictions show continuous
decrease in long term when compared to that of the cement paste due to slag
hydration.
Fig. 4.3 Comparison between test results and model simulations of weight ratio of
free water to total binder of pastes with slag replacement levels= 0%, 45%, 60%, and
75% at w/b=0.25

42
Fig. 4.4 Comparison between test results and model simulations of weight ratio of
free water to total binder of pastes with slag replacement levels= 0%, 45%, 60%, and
75% at w/b=0.40

43
Chapter 5
Model for Predicting Specific Heat
5.1 General
Specific heat is a time-dependent property which is changed rapidly especially
at the early age after casting of concrete (Choktaweekarn et al., 2009). However,
many studies have used constant specific heat values for analyzing thermal cracking
problems (Kwak & Ha, 2006; Guo et al., 2001). Modeling specific heat as a time-
dependent variable is essentially useful for more accurate and precise predictions of
temperature profiles.
Choktaweekarn et al. (2009) reported that specific heat of concrete at a given
time can be calculated based on weight fraction and specific heat of each constituent.
A time-dependent model was proposed in this previous study for fly ash concrete. In
this study, model proposed by Choktaweekarn et al. (2009) is modified for the effect
of slag in order to simulate the specific heat of slag concrete.
5.2 Experimental Program
5.2.1 Materials and mix proportions
The binders used throughout this study were Ordinary Portland Cement type I
and Ground Granulated Blast Furnace Slag provided by Taiheiyo Cement
Corporation, Japan. The physical and chemical compositions of the cement and slag
are shown previously in Chapter 4 in Table 4.1 and Table 4.2, respectively. Normal
tap water was used as mixing water in all mixes.
This experiment was conducted to obtain specific heat of paste specimens with
time. A total of eight mixtures were cast to test free water of paste specimens. Water
to binder ratios (w/b) of 0.25 and 0.40 were used. Slag replacements of 0%, 45%,
60%, and 75% were utilized. All mix proportions of the tested specimens are
mentioned previously in Chapter 4 in Table 4.3.

44
5.2.2 Specimen preparation and test method
For testing specific heat, specimens were cast with dimensions 50×50×50mm.
These cubes were removed 24 hours after casting and immediately wrapped firstly by
a layer of plastic sheet followed by a layer of aluminum foil to prevent moisture loss
to the environment. The firm wrapping was done in order to prevent evaporation of
water and to simulate no moisture loss to or gain from environment, similar to that of
the condition inside the mass concrete. All specimens were cured in 28±2°C and 50-
70% relative humidity conditions until tested at 3, 7, and 28 days. Each specimen was
smoothly divided into two pieces just before the test was done.
This experiment was conducted by a method based on transiently heated plane
sensor using the instrument named Hot Disk Thermal Constants Analyser (Model:
TPS 2500S). In this test, a hot disk sensor was fitted between the two pieces of paste
specimens with same mix proportions. Then the setup was covered with a sealed
container to prevent moisture movement. An electrical current was passed high
enough to increase temperature of the sensor and the resistance of the specimen was
recorded simultaneously as a function of time. A Ni foil probe which was wrapped in
Kapton was used in this experiment. Figs. 5.1a and 5.1b indicate the setup of the hot
disk sensor in between two pieces of the paste specimen, and the Hot Disk Thermal
Constants Analyser apparatus, respectively.

45
(a) Setup of the sensor sandwiched by a paste specimen
(b) Hot Disk Thermal Constants Analyser apparatus
Fig. 5.1 Testing specific heat using transient method
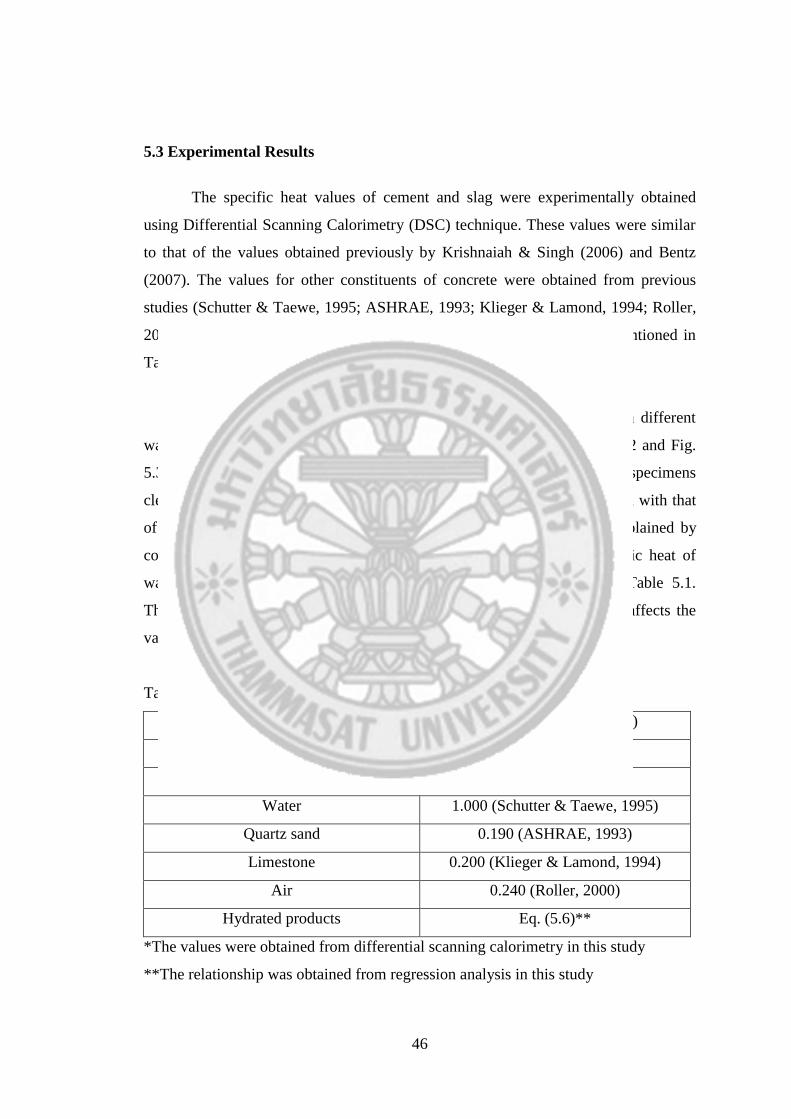
46
5.3 Experimental Results
The specific heat values of cement and slag were experimentally obtained
using Differential Scanning Calorimetry (DSC) technique. These values were similar
to that of the values obtained previously by Krishnaiah & Singh (2006) and Bentz
(2007). The values for other constituents of concrete were obtained from previous
studies (Schutter & Taewe, 1995; ASHRAE, 1993; Klieger & Lamond, 1994; Roller,
2000). The values for specific heat of the constituents of concrete are mentioned in
Table 5.1.
The experimental results for specific heat of paste specimens with different
water to binder ratios and slag replacement levels are indicated in Fig. 5.2 and Fig.
5.3. From this experiment, it is observed that the specific heat of paste specimens
clearly reduce with age. The results of specific heat have higher correlation with that
of the results of free water of paste specimens with time. This can be explained by
considering the specific heat of each constituent of concrete. The specific heat of
water is the highest among all constituents in concrete as shown in Table 5.1.
Therefore, it is evident that free water content is the major factor which affects the
values of specific heat of concrete.
Table 5.1 Specific heat of the constituents of concrete
Constituents in concrete Specific heat (kcal/kg °C)
Cement 0.180*
Slag 0.167*
Water 1.000 (Schutter & Taewe, 1995)
Quartz sand 0.190 (ASHRAE, 1993)
Limestone 0.200 (Klieger & Lamond, 1994)
Air 0.240 (Roller, 2000)
Hydrated products Eq. (5.6)**
*The values were obtained from differential scanning calorimetry in this study
**The relationship was obtained from regression analysis in this study

47
Fig. 5.2 Test results of specific heat of pastes with slag replacement levels= 0%, 45%,
60%, and 75% at w/b=0.25
Fig. 5.3 Test results of specific heat of pastes with slag replacement levels= 0%, 45%,
60%, and 75% at w/b=0.40

48
` 5.3.1 Effect of water to binder ratio
When comparing Fig. 5.2 and Fig. 5.3, it is clearly seen that when water to
binder ratio is higher, the specific heat increases. Specimens with w/b of 0.25 have
lower specific heat than specimens with w/b of 0.4, regardless of the age. The
tendency is similar for both cement-only and slag-cement paste specimens. This is
due to the fact that free water governs the behavior of specific heat as mentioned
previously.
5.3.2 Effect of slag replacement level
The effect of slag is clearly shown for both w/b cases from Fig. 5.2 and Fig.
5.3 where specific heat increases when the slag substitution level is higher. Similar
results were previously reported by Viet (2013) for mortar containing different
replacements of slag. This is due to lower reactivity of slag at early age when
compared to cement. However, the decreasing rate of specific heat is higher at later
age for pastes with slag. This is due to the activation of pozzolanic reaction of slag by
Ca(OH)2 which is a product of hydration of cement at later age. As hydration
progresses, free water decreases, resulting in continous decrease of specific heat of
paste containing slag.
5.4 Model for Predicting Specific Heat
It is clearly seen from the results obtained from this study, that specific heat is
a time-dependent property which is significantly affected by the availability of free
water at the considered age. Moreover, constituents of paste involve in hydration
process which lead to change in their reacted and un reacted compositions. Hence,
time-dependent change of each constituent of paste is vital to simulate specific heat of
concrete.
Model for simulating specific heat of concrete with slag is developed by
adopting a time-dependent model which computes specific heat of concrete

49
containing fly ash (Sarker et al, 1999; Saengsoy, 2003; Choktaweekarn, 2008). In this
model, specific heat of concrete at a given time can be calculated based on weight
fraction and specific heat of each constituent. Few assumptions are made in proposing
this model for specific heat. Specific heat of air is neglected due to smaller portion of
air compared to that of the other constituents. The changes of unit weight of concrete
during hydration process are assumed to have insignificant effect on specific heat.
The modified equations in this study are shown in Eq. (5.1), Eq. (5.2), Eq.
(5.3), Eq. (5.4) and Eq. (5.5). The specific heat of concrete can be computed at any
time from Eq. (5.1). The specific heat of coarse aggregate and fine aggregate is an
intristic property which does not depend on time. Therefore, fine and coarse aggregate
weights remain constant throughout the reaction. However, cement and slag react
with water and the amount of unreacted portions of those binders are time-dependent.
The weight fraction of un-reacted cement and slag can be calculated from Eq. (5.2)
and Eq. (5.3), respectively. The total weight fraction of concrete is kept constant and
can be computed using Eq. (5.4). The hydration process results in reducing un-reaced
binders but producing hydrated products. The time-dependent production of hydrated
products can be computed by Eq. (5.5).
hphpslaguslagcucwfwssgg c)t(wcwc)t(wc)t(wcwcw)t(c (5.1)
0c
hy
uc w100
)t(1)t(w
(5.2)
0slag
slag
uslag w100
)t(1)t(w
(5.3)
At specified time, t,
0.1wwwww 0slag0c0wsg (5.4)
)]t(w)t(w)t(www[0.1)t(w uslagucfwsghp (5.5)
50
where c(t) is the specific heat of concrete at the considered age t (kcal/kg/°C).
wg and ws are the weight ratios of coarse and fine aggregates per unit weight of
concrete, respectively. wfw(t), wuc(t), wuslag(t) and whp(t) are the weight ratios of free
water, unhydrated cement, non-reacted slag, and hydrated products, respectively, at
the considered age t. cg, cs, cw, cc, cslag, and chp are specific heat values of coarse
aggregate, fine aggregate, water, cement, slag, and hydrated products, respectively
(kcal/kg/°C). The values of cslag and cc are obtained from differential scanning
calarimetry. The specific heat values of all constituents in concrete are shown
previously in Table 5.1.
The value of chp is determined from regression analysis from the test results of
specific heat. The hydrated product properties can change with different water to
binder ratios and slag replacement levels. As the w/b increases, the specific heat of
hydrated products increases due to addition of water. As slag replacement increases,
specific heat of hydrated product decreases due to lower specific heat of slag
compared to that of cement. A relationship was obtained to compute specific heat of
hydrated products as a function of w/b and slag replacement which is shown in Eq.
(5.1).
)s168.0b/w357.0exp(0.094 chp (5.1)
where chp is the specific heat of hydrated product (kcal/kg °C), w/b is the water to
binder ratio, and s is the slag replacement ratio in paste.

51
5.5 Verification of Specific Heat Model
The proposed model is used to simulate specific heat at various ages of the
tested specimens of paste with different water to binder ratios and slag replacement
levels. The comparison between the model simulations and test results are shown in
Fig. 5.4 and Fig. 5.5. Fig. 5.4 indicates the comparison for paste specimens with
different slag replacement levels at a water to binder ratio of 0.25. Fig. 5.5 indicates
the comparison for paste specimens with different slag replacement levels at a water
to binder ratio of 0.40.
The model simulations show sufficient accuracy in predicting the test results
of specific heat in paste specimens at different water to binder ratios and slag
replacement levels. In the case of slag-cement paste, it is seen that the model
predictions show continuous decrease in long term when compared to that of the
cement paste due to slag hydration.
Fig. 5.4 Comparison between test results and model simulations of specific heat of
pastes with slag replacement levels= 0%, 45%, 60%, and 75% at w/b=0.25

52
Fig. 5.5 Comparison between test results and model simulations of specific heat of
pastes with slag replacement levels= 0%, 45%, 60%, and 75% at w/b=0.40

53
Chapter 6
Model for Predicting Thermal Conductivity
6.1 General
Thermal conductivity is known as the rate of heat transfer through a unit cross
sectional area of a material for a specific temperature gradient. As the hydration
process continues, amount of free water in concrete reduces with an increase in
hydrated products resulting in increasing thermal conductivity with time especially at
early stage. The thermal conductivity of concrete is affected by the mix proportions
and constituent types in the concrete as well.
There are two main techniques for measuring thermal conductivity which are
steady state and transient methods. Steady state method is useful when the material
under examination is rigid and dry or conditioned to the ambient condition
(Choktaweekarn, 2008). The method is not suitable when moisture redistribution can
occur during the period of the test. Transient measurement technique is appropriate
for low conductivity porous materials. The rapidity of the determination does not
allow sufficient time for any moisture movement to occur within the sample during
testing. Moisture has great effect on thermal conductivity of concrete then transient
method is preferable.
6.2 Experimental Program
6.2.1 Materials and mix proportions
The binders used throughout this study were Ordinary Portland Cement type I
and Ground Granulated Blast Furnace Slag provided by Taiheiyo Cement
Corporation, Japan. The physical and chemical compositions of the cement and slag
are shown previously in Chapter 4 in Table 4.1 and Table 4.2, respectively. Normal
tap water was used as mixing water in all mixes.

54
An experiment was conducted to obtain thermal conductivity of paste
specimens with time. A total of eight mixtures were cast to test thermal conductivity
of paste specimens. Water to binder ratios (w/b) of 0.25 and 0.40 were used. Slag
replacements of 0%, 45%, 60%, and 75% were utilized. All mix proportions of the
tested specimens are mentioned previously in Chapter 4 in Table 4.3.
6.2.2 Specimen preparation and test method
Transient method which was previously used in this study to measure specific
heat, provides the output of thermal conductivity as well. Therefore, all the specimen
preparation and test procedure is similar to that described in Chapter 5.
6.3 Experimental Results
The experimental results for thermal conductivity of paste specimens with
different water to binder ratios and slag replacement levels are indicated in Fig. 6.1
and Fig. 6.2. From this experiment, it is observed that the thermal conductivities of
paste specimens increase up to three days and after that slightly decrease. However,
some of 28 day results show a slight decrease which is probably due to the self-
desiccation of the specimens. If there is no loss of water from the specimens, thermal
conductivity is supposed to increase slightly with age due to increase of hydrated
products and continuity of paste structure.
6.3.1 Effect of water to binder ratio
Fig. 6.1 and Fig. 6.2 indicate that thermal conductivity values of paste
specimens with w/b 0.25 were slightly higher than that of the specimens with w/b
0.40. This is due to higher thermal conductivity of cement than that of the water as
shown in Table 6.1.

55
Table 6.1 Thermal conductivities of the constituents of concrete
Constituents in concrete Thermal conductivity (kcal/m hr °C)
Cement 1.33 (Bentz, 2007)
Slag 0.695*
Water 0.51 (Klieger & Lamond, 1994)
Quartz sand 3.00 (ASHRAE, 1993)
Limestone 2.20 (Klieger & Lamond, 1994)
Air 0.026 (Roller, 2000)
Hydrated products 1.03*
* The value was obtained from regression analysis in this study
6.3.2 Effect of slag replacement level
The effect of slag is shown for both w/b cases in Fig. 6.1 and Fig. 6.2 where
increase of slag replacement level, result in a slight decrease in the values. This is due
to the lower thermal conductivity of slag when compared to cement as shown in Table
6.1. Slag decreases the density hence increase porosity of paste which result in lower
thermal conductivities as mentioned previously in many studies (Demirboga, 2003;
Demirboga, 2007; Choktaweekarn, 2008).
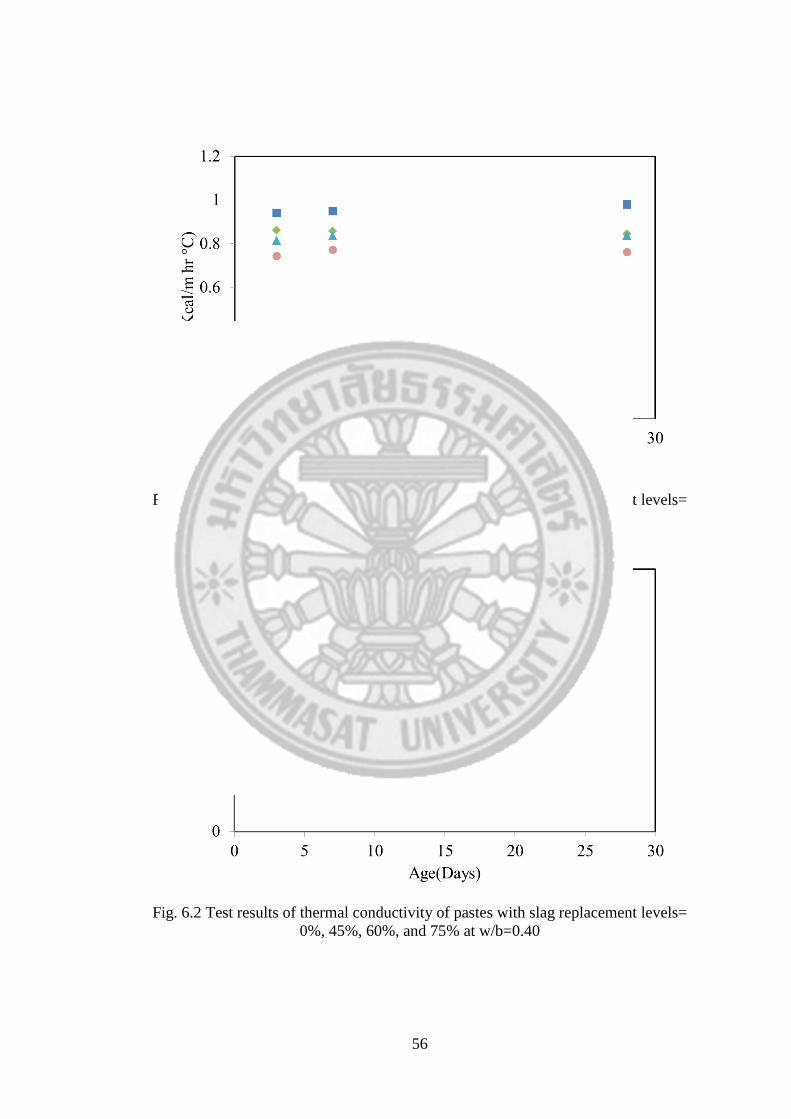
56
Fig. 6.1 Test results of thermal conductivity of pastes with slag replacement levels=
0%, 45%, 60%, and 75% at w/b=0.25
Fig. 6.2 Test results of thermal conductivity of pastes with slag replacement levels=
0%, 45%, 60%, and 75% at w/b=0.40

57
6.4 Model for Predicting Thermal Conductivity
Model for simulating thermal conductivity of concrete with slag is developed
by adopting a time-dependent model which computes thermal conductivity of
concrete containing fly ash (Sarker et al, 1999; Choktaweekarn, 2008). In this model,
thermal conductivity of concrete at a given time can be calculated based on volume
fraction and thermal conductivity of each constituent. Few assumptions are made in
proposing this model. The changes of total volume of concrete during hydration
process are assumed to have insignificant effect on the simulations. Moreover, the
volume decrease of the hydrated products during hydration process is assumed to be
insignificant as well.
The modified equations in this study are shown in Eq. (6.1), Eq. (6.2), Eq.
(6.3), and Eq. (6.4). The thermal conductivity of concrete at any age can be computed
from Eq. (6.1). Similar to that of the specific heat model, fine and coarse aggregate
weights remain constant throughout the reaction process. The volume fractions of un-
reacted cement and slag can be calculated from Eq. (6.2) and Eq. (6.3), respectively.
The volumetric ratio of hydrated products can be computed by Eq. (6.4).
hphpraraslaguslagcucwfwssgg k)t(nknk)t(nk)t(nk)t(nknkn)t(k (6.1)
0c
hy
uc n100
)t(1)t(n
(6.2)
0slag
slag
uslag n100
)t(1)t(n
(6.3)
)]t(n)t(n)t(nnnn[0.1)t(n uslagucfwrasghp (6.4)

58
where k(t) is thermal conductivity of concrete at considered age(kcal/m hr oC),
kg, ks, kw, kc, kslag, kra, khp are thermal conductivities of coarse aggregate, fine
aggregate, free water, cement, slag, air and hydrated products, respectively. The
values are shown in Table 6.1. ng, ns and nra, are volumetric ratios of coarse
aggregate, fine aggregate and air, respectively. nfw(t), nuc(t), nuslag(t) and nhp(t) are
volumetric ratios of free water, unhydrated cement, non-reacted slag and hydrated
product at the considered age, respectively. nc0 and nslag0 are the initial volume
fractions of cement and slag, respectively.
6.5 Verification of Thermal Conductivity Model
The proposed model is used to simulate thermal conductivity at various ages
of the tested specimens of paste with different water to binder ratios and slag
replacement levels. The comparisons between the model simulations and test results
are shown in Fig. 6.3 and Fig. 6.4. Fig. 6.3 indicates the comparison for paste
specimens with different slag replacement levels at a water to binder ratio of 0.25.
Fig. 6.4 indicates the comparison for paste specimens with different slag replacement
levels at a water to binder ratio of 0.40.
The model simulations show sufficient accuracy in predicting the test results
of thermal conductivity of paste specimens at different water to binder ratios and slag
replacement levels. The experimental results at 28 days slightly decreased due to self
dessication especially in specimens with w/b 0.25. However, the model predictions
increase slightly at later age since the continuity of the structure increases if no
moisture movement occurs.

59
Fig. 6.3 Comparison between test results and model simulations of thermal
conductivity of pastes with slag replacement levels= 0%, 45%, 60%, and 75% at
w/b=0.25
Fig. 6.4 Comparison between test results and model simulations of thermal
conductivity of pastes with slag replacement levels= 0%, 45%, 60%, and 75% at
w/b=0.40

60
Chapter 7
Model for Predicting Coefficient of Thermal Expansion
7.1 General
Temperature difference in concrete causes thermal stress which leads to
thermal cracking. One of the key functions in computing thermal strain due to the
occurrence of thermal gradient in concrete is the coefficient of thermal expansion
(CTE). It is known as the unit length change per unit degree of temperature change.
The CTE of concrete depends on the CTE of the constituents which are cementitious
materials, water, hydrated products and aggregates. In this study, CTE of paste
containing slag is experimentally evaluated and time-dependent model is proposed
based on volumetric fractions and CTE of constituents of pastes.
7.2 Experimental Program
7.2.1 Materials and mix proportions
The binders used throughout this study were Ordinary Portland Cement type I
and Ground Granulated Blast Furnace Slag provided by Taiheiyo Cement
Corporation, Japan. The physical and chemical compositions of the cement and slag
are shown previously in Chapter 4 in Table 4.1 and Table 4.2, respectively. Normal
tap water was used as mixing water in all mixes.
This experiment was conducted to obtain CTE of paste specimens with time.
A total of eight mixtures were cast to test CTE of paste specimens. Water to binder
ratios (w/b) of 0.25 and 0.40 were used. Slag replacements of 0%, 45%, 60%, and
75% were utilized. All mix proportions of the tested specimens are mentioned
previously in Chapter 4 in Table 4.3.

61
7.2.2 Specimen preparation and test method
Kada et al. (2002) developed a simple method to find the CTE at early age of
concrete. This method was based on applying a temperature shock in a range of 10°C
to 50°C in a short period, not longer than one hour. Since the duration for each
measurement step was short, the effect of autogeneous shrinkage was not considered
in this experiment. The similar method was adopted in a previous study
(Choktaweekarn, 2008) for testing paste, mortar and concrete.
In this study, CTE was tested by the method used in Choktaweekarn’s study
(Choktaweekarn, 2008). The temperature of the paste specimens was reduced by
cooling them down in a refrigerator until 10°C, then followed by moving out to return
the temperature back to room temperature (about 30±2°C).The specimens were tested
for the change in length at every 5°C change of temperature, then CTE values were
computed. The step by step of temperature changing process is illustrated in Fig. 7.1.
Step 1 Step 2 Step 3 Step 4
Step 8 Step 7 Step 6 Step 5
Fig. 7.1 Temperature changing process to measure CTE of slag-cement pastes
Prism specimens with dimensions 25×25×285mm were cast for slag-cement
paste. The specimens were firmly sealed first by paraffin layer, then plastic and
followed by aluminium foil, immediately after casting in order to prevent evaporation
of water. All specimens were cured in 28±2°C and 50-70% relative humidity
conditions until tested at 1, 3, 7, and 28 days. To obtain data of the temperature,
thermocouples were inserted. Fig. 7.2 shows the sealed specimens which were used to
measure CTE of the pastes. Fig. 7.3 illustrates the setup of the experimental process
where the length change was measured by a length comparator at each step of
temperature change as described in Fig. 7.1.
Room temperature, 30±2°C 25°C 20°C
10°C
15°C
62
Fig. 7.2 Example of firmly wrapped paste specimens for measuring CTE
Fig. 7.3 Experimental setup for measuring CTE of paste specimens
It was reported that autogenous shrinkage does not signifantly affect the
measurement of CTE in fly ash-cement paste (Choktaweekarn, 2008). However,
many studies reported that autogenous shrinkage of paste containing slag was
considerably higher than that of the paste with fly ash (Johari, 2000; Matsuka et al.,
2010). Therefore, autogenous shrinkage was measured in this study to find its effect
63
on CTE. It was reported that autogeneous shrinkage of pastes containing slag increase
as the temperature increases (Matsuka et al., 2010). Thus, the measurements were
taken at 30±2°C since it was the maximum temperature used during the test period.
Even at 30±2°C, the strain due to autogeneous shrinkage was found to be less than
±1% when compared to the strain due to temperature change, during the test period.
Thus, the autogeneous shrinkage was considered to have insignificant effect therefore,
it was not included in computing CTE in this study. If the effect of autogeneous
shrinkage is significant, it is recommended to obtain measurements at each
temperature step in the test thereby include the values to compute CTE.
It was previously reported that for a specific concrete, the level of thermal
expansion or contraction at normal temperature conditions was similar for each unit
temperature change (Choktaweekarn, 2008; Amonamarittakul, 2011). Therefore,
length change measurements were done for every 5°C change of temperature. At the
same time, the autogeneous shrinkage was measured. Then, the CTE is calculated
based on Eq. (7.1).
TCTE AS
(7.1)
CTE is the coefficient of thermal expansion of paste (micron/oC), ε is strain
due to temperature change, εAS is the strain due to autogeneous shrinkage during the
period of ∆T which is the temperature change (oC). The plus sign is used when
heating up and minus is used when cooling down.
7.3 Experimental Results
The experimental results of CTE of paste specimens with different water to
binder ratios and slag replacement levels are illustrated in Fig. 7.4 and Fig. 7.5. From
this experiment, it is observed that the CTE of paste specimens is a time-dependent
property which increases with time. This is due to the fact that continuity of the
structure increases when paste transfer from fresh state to hardened state. Many

64
studies have reported similar tendency for CTE experimental results done on paste,
mortar, and concrete (Berwanger & Sarker, 1976; Choktaweekarn, 2008;
Amonamarittakul, 2011).
7.3.1 Effect of water to binder ratio
Fig. 7.4 and Fig. 7.5 indicate that CTE results of paste specimens with w/b
0.25 are slightly higher than that of the specimens with w/b 0.40. The slight decrease
of CTE as w/b increases may be due to lower amount of cement content. Similar
results were observed previously by Berwanger and Sarker (1976) as well. However,
it was also reported that water behaves somewhat different from solid materials.
When the temperature changes, volume of water in capillary pores of paste increases.
However, water in the pores is capable of moving from pores to pores resulting in
different effect, from that of the solid, on CTE of paste (Choktaweekarn, 2008).
7.3.2 Effect of slag replacement level
Effect of slag replacement level can be seen by comparing Fig. 7.4 with Fig.
7.5. The CTE of pastes decrease as the slag replacement level increases which is due
to lower CTE of slag itself. The CTE values of the constituents of concrete are shown
in Table 7.1. However, the tendency may change in long term as the hydration of slag
continues with time.
Table 7.1 CTE values of the constituents of concrete
Constituents in concrete CTE (micron/ °C)
Cement 14.4 (Choktaweekarn, 2008)
Slag 8.8 (Okura & Imaoka, 1979)
Quartz sand 10.4 (Klieger & Lamond, 1994)
Limestone 4.5 (Klieger & Lamond, 1994)
Hydrated products Eq. (7.3)*
* The relationship was obtained from regression analysis in this study
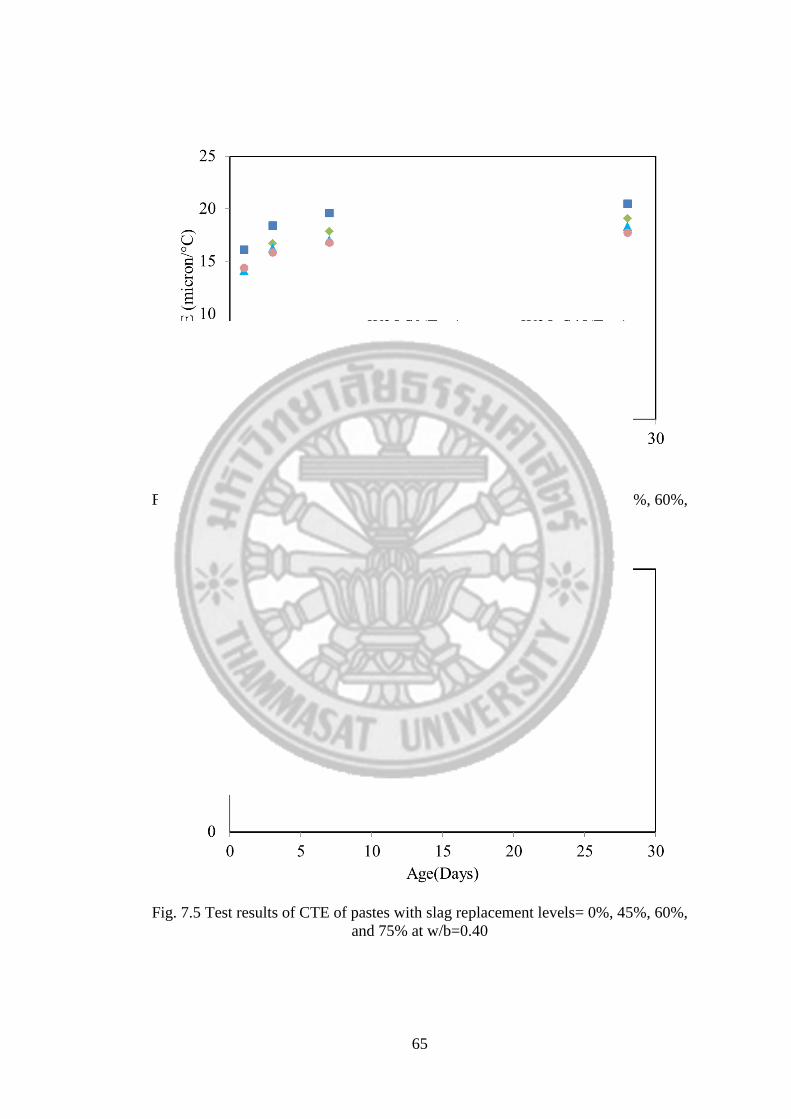
65
Fig. 7.4 Test results of CTE of pastes with slag replacement levels= 0%, 45%, 60%,
and 75% at w/b=0.25
Fig. 7.5 Test results of CTE of pastes with slag replacement levels= 0%, 45%, 60%,
and 75% at w/b=0.40

66
7.4 Model for Predicting CTE
Model for simulating CTE of paste with slag is developed by adopting a time-
dependent model which computes CTE of paste containing fly ash (Choktaweekarn,
2008). In this model, the CTE of paste at a given time can be calculated based on
volume fractions of non-reacted binder content and hydrated product amounts.
Hydrated products increase with time resulting in reducing the non-reacted cement
and slag. The water content affect the CTE in the very early age, however, afterwards
the results are governed by the continuity of structure (Amonamarittakul, 2011). The
proposed model for computing CTE of slag cement paste is shown in Eq. (7.2).
hphp,pslaguslag,pcuc,pp CTE)t(ncCTE)t(nbCTE)t(na)t(CTE (7.2)
CTEp(t) is the CTE of paste at considered age (microns/oC), CTEc, CTEslag and
CTEhp are the CTE of cement, slag and the hydrated products which are given in
Table 7.1. np,uc(t), np,uslag(t) and np,hp(t) are the volumetric ratios of unhydrated cement,
non-reacted slag and hydrated products at the considered ages, which are computed
using similar principles as mentioned in thermal conductivity model in Chapter 6. The
constants a, b and c are derived by regression analysis from test results of pastes with
and without slag. The values are 0.284, 2 and 1.4 respectively.
The relationship for CTEhp is determined from regression analysis of the test
results of CTE. The hydrated product properties can change with different water to
binder ratios and slag replacement levels. As the w/b increases, the CTE of hydrated
products decreases due to reduction of cement amount. As slag replacement increases,
CTE of hydrated product decreases due to lower CTE of slag when compared to that
of cement. A relationship was obtained to compute CTE of hydrated products as a
function of w/b and slag replacement as shown in Eq. (7.3).
)0533.1b/w133.0(006.20s86.5s93.5CTE 2
hp (7.3)
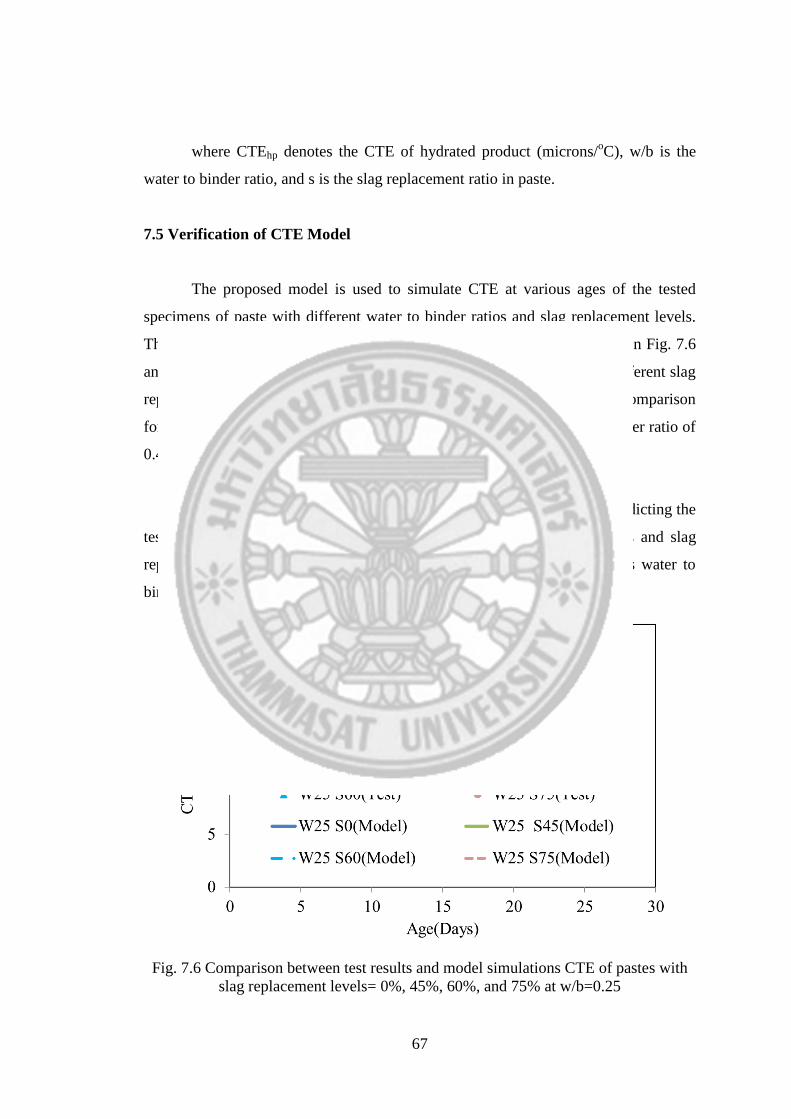
67
where CTEhp denotes the CTE of hydrated product (microns/oC), w/b is the
water to binder ratio, and s is the slag replacement ratio in paste.
7.5 Verification of CTE Model
The proposed model is used to simulate CTE at various ages of the tested
specimens of paste with different water to binder ratios and slag replacement levels.
The comparison between the model simulations and test results are shown in Fig. 7.6
and Fig. 7.7. Fig. 7.6 indicates the comparison for paste specimens with different slag
replacement levels at a water to binder ratio of 0.25. Fig. 7.7 indicates the comparison
for paste specimens with different slag replacement levels at a water to binder ratio of
0.40.
It is seen that the model simulations show sufficient accuracy in predicting the
test results of CTE in paste specimens at different water to binder ratios and slag
replacement levels. The model predictions indicate that CTE decreases as water to
binder ratio and slag replacement level decreases.
Fig. 7.6 Comparison between test results and model simulations CTE of pastes with
slag replacement levels= 0%, 45%, 60%, and 75% at w/b=0.25

68
Fig. 7.7 Comparison between test results and model simulations CTE of pastes with
slag replacement levels= 0%, 45%, 60%, and 75% at w/b=0.40

69
Chapter 8
Model for Simulating Adiabatic Temperature of Mass Concrete
8.1 General
A computerized program was developed for simulating temperature in mass
concrete from a previous study (Saengsoy, 2003). It is capable of simulating the
temperature in fly ash concrete. This program was modified in order to obtain
adiabatic temperature rise of slag concrete. The development of the models to predict
hydration degrees of cement and slag, free water, specific heat were described
previously in Chapters 3, 4, and 5. If the total heat generation in concrete is known,
the temperature can be computed based on a basic equation which is shown in Eq.
(8.1).
mc
QT (8.1)
where Q is the cumulative heat of hydration (kcal), m is mass of the concrete
(kg), c is specific heat of the concrete (kcal/kg/°C), and ΔT is temperature rise at the
considered age (°C). The procedure for computing total heat generation in concrete is
described in this chapter which is followed by simulating adiabatic temperature rise of
concrete containing slag with different mix proportions.
8.2 Total Heat Generation of Concrete
All reactive compounds of cement involve in reactions which cause the
temperature rise in concrete. It is well known that the four major mineral compounds
of cement are C3S, C2S, C3A, and C4AF. The proportions of these compounds are
different in different types of cement. Thus their heat generation also varies
depending on the amount and reaction rate. On the other hand, reaction of slag also
generates heat which results in temperature rise in concrete.

70
Since the hydration degrees of cement compounds and slag are modeled
assuming that the reactions are independent, the total heat generation is also modeled
considering the similar assumption. The total heat generation is computed by the
summation of heat liberated from each cement compound and slag as shown in Eq.
(8.2).
)t(Q)t(Q)t(Q)t(Q)t(Q)t(Q)t(Q)t(Q slagAFETCAETCAFCACSCSC 434323
(8.2)
eff,imax,ii
i w*Q*100
)t()t(Q
(8.3)
ieff,i ww (8.4)
58.0b/w5.0s4037.0s579.0 2 (8.5)
Total heat generation is computed from Eq. (8.2) where Q(t) is the total heat
generation of concrete at the considered age t (kcal/kg of concrete), QC3S(t), QC2S(t),
QC3A(t), QC4AF(t), and Qslag(t) are cumulative heat generation of C3S, C2S, C3A, C4AF
and slag at the considered age t, respectively (kcal/kg of concrete). QC3AET(t) and
QC4AFET(t) are heat generation from ettringite and monosulphate production by C3A
and C4AF reactions with gypsum at the considered age t, respectively (kcal/kg of
concrete).
Heat generation from the compounds of cement and slag is computed based on
Eq. (8.3). Qi(t) is the cumulative heat generation from the ith
compound at the
considered age t (kcal/kg of concrete), αi(t) is the hydration degree of each compound
(%), Qi,max is the maximum cumulative heat generation at completion of the chemical
reaction of the ith
compound (kcal/kg of concrete), and wi,eff is the effective mass
fraction of each compound in the concrete. The compounds considered (i) in this
model are C3S, C2S, C3A, C4AF, and slag.
Slag involves in self-hydration and pozzolanic reactions (Kolani et al., 2012).
In this study, heat generation by slag is assumed as a single parameter because of
71
limited amount of data on the heat generated by the two separate reactions of slag.
Thus, it is recommended in the future to separate the heat generation from slag
hydration and pozzolanic reaction in order to interpret the two reactions
independently.
The effective mass fraction wi,eff , can be computed using Eq. (8.4) where wi is
the mass fraction of each compound in the concrete and Φ is the factor which includes
the effect of slag towards the adherence of cement particles. The adherence of cement
particles is defined as the amount of cement that can actually involve in hydration and
it depends on the type and source of cement (Choktaweekarn, 2008). This causes
some amount of cement to not properly mixed and actively involved in hydration
process. The use of slag may lead to better dispersion of the particles of cement
especially for higher fineness, enabling higher effective weight of cement to involve
in hydration. However, due to irregular particle shape of slag, the particles may
interlock together causing reduction of the dispersion effect in excessive replacements
of slag. It is evident that adherence of particles reduces as the amount of water in the
mix increases as well. Thus, a dispersion factor was introduced for interpreting the
effect of slag, as shown in Eq. (8.5). In this equation, s represents the slag
replacement ratio and w/b is the water to binder ratio of the concrete. This factor is
modeled based on the available test results of adiabatic temperature rise, mostly
Japanese cement sources. Thus, further modification should be done for different
sources of cements.
In the case of fly ash concrete, a separate dispersion factor was proposed
previously by (Choktaweekarn, 2008). A comparison of the dispersion effects of fly
ash and slag which affect the adherence of cement particles is shown in Fig. 8.1.
When comparing, it is seen that the dispersion factor for concrete with fly ash
replacements higher than 30% shows higher dispersion effect when compared to slag
concrete. This is mainly due to the spherical shape of fly ash which enables to slip
each other easily and reduce the inter particle friction forces. Whereas in the case of
slag, this factor decreases when the slag replacement ratio is very high. Slag may
increase dispersion in lower replacement ratios due to finer particles, however,
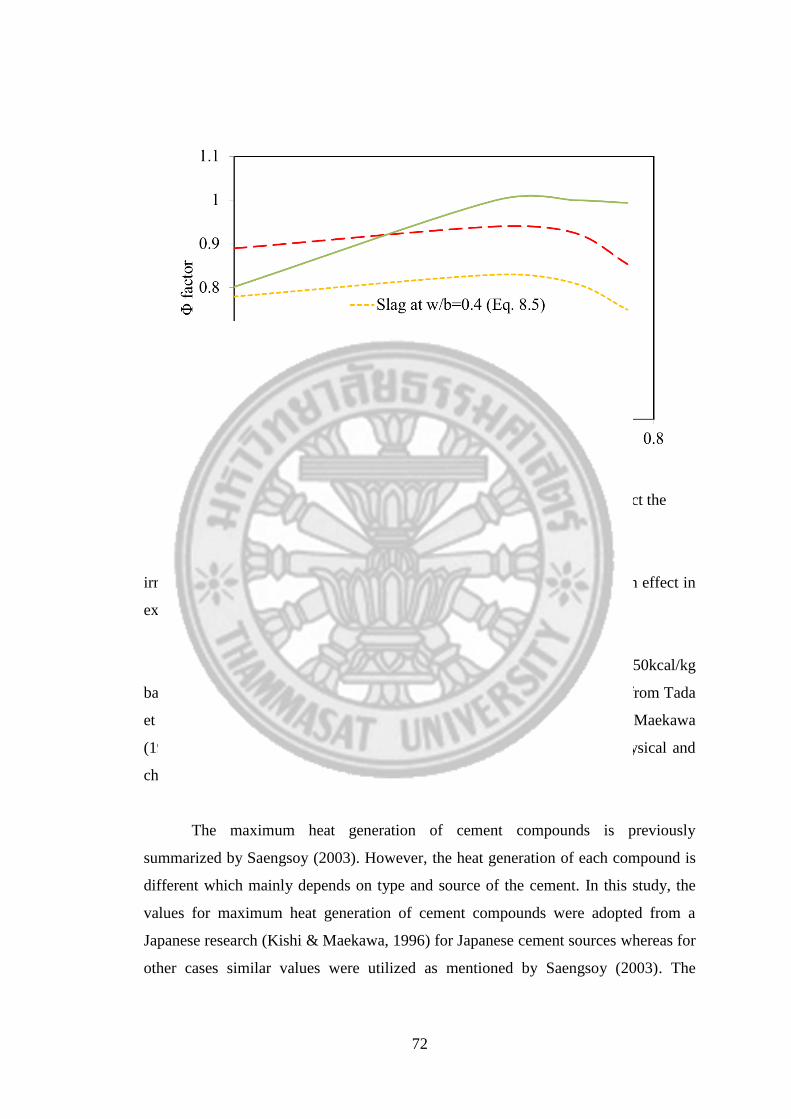
72
Fig. 8.1 Comparison of dispersion factors of fly ash and slag which affect the
adherence of cement particles in concrete
irregular shape of the slag particles may result in reduction of the dispersion effect in
excessive replacements.
The maximum cumulative heat generation by slag is estimated at 150kcal/kg
based on tendencies of heat rate in adiabatic temperature rise data obtained from Tada
et al. (2014). It is slightly higher than the value proposed by Kishi & Maekawa
(1996) as 110kcal/kg. This difference may be mainly due to dissimilar physical and
chemical properties of the slags.
The maximum heat generation of cement compounds is previously
summarized by Saengsoy (2003). However, the heat generation of each compound is
different which mainly depends on type and source of the cement. In this study, the
values for maximum heat generation of cement compounds were adopted from a
Japanese research (Kishi & Maekawa, 1996) for Japanese cement sources whereas for
other cases similar values were utilized as mentioned by Saengsoy (2003). The

73
theoretical values for heat of hydration of main cement compounds are summarized in
Table 8.1.
Table 8.1 Maximum heat generation values for major cement compounds
Major phase Maximum heat of hydration (kcal/kg)
Saengsoy (2003) This study
C3S 105 115
C2S 50 50
C3A 190 195
C4AF 85 85
8.3 Verifications of Proposed Adiabatic Temperature Model
Since the hydration degrees of cement and slag, free water content, specific
heat and total heat generation of concrete are separately modeled, the models can be
linked to compute the adiabatic temperature rise by using Eq. (8.1) as mentioned
earlier. In order to validate the proposed model, verifications are carried out on
concrete incorporating slag. Experimental data were obtained from various sources to
check the accuracy of the described model (Wang & Linger, 2010; Tada et al., 2014;
Taiheiyo Cement Corporation, 2014; TCC-Singapore, 2014).
Verifications for the experimental data obtained from Wang & Linger (2010)
are shown in Fig. 8.2 and Fig. 8.3. In this previous study, investigations were done at
two different initial temperatures, 20°C and 30°C. Comparison between the adiabatic
temperature of concrete incorporating 40% slag with a water to binder ratio of 0.392
and another concrete mixture with 40% slag and water to binder ratio of 0.493 are
shown in Fig. 8.2 and Fig. 8.3, respectively. The mix proportions and physical and
chemical compositions of binder are shown in Appendix A (Tables A1, A3, and A4,
respectively).

74
Fig. 8.2 Comparison of tested and predicted adiabatic temperature rise for concrete
with 40% slag, w/b=0.392 and initial temperatures of 20°C and 30°C
Fig. 8.3 Comparison of tested and predicted adiabatic temperature rise for concrete
with 40% slag, w/b=0.493 and initial temperatures of 20°C and 30°C
75
The verifications shown in Fig. 8.2 and Fig. 8.3 indicate that the proposed
model is able to simulate adiabatic temperature rise of the tested slag concrete
specimens with a reasonable accuracy.
Tada et al. (2014) experimentally investigated adiabatic temperature rise of
concrete with and without slag replacements. Concrete containing only cement at w/b
ratios of 0.40 and 0.65 were tested. Concrete mixes containing 50%, 65%, and 75%
slag replacement levels at w/b ratios of 0.4 and 0.6, were tested to find the effect of
slag replacement. The mix proportions as well as physical and chemical compositions
of the binders are shown in Appendix A (Tables A2, A3, and A4, respectively). The
verifications for these experimental results are shown in Fig. 8.4 to Fig. 8.7.
Comparison of the adiabatic temperature of cement only concrete with w/b ratios of
0.40 and 0.65 are shown in Fig. 8.4. Comparison of the adiabatic temperature of
concrete incorporating 50% slag, 65% slag, and 75% slag with a w/b of 0.4 and 0.6
are shown in Fig. 8.5, Fig. 8.6, and Fig. 8.7, respectively.
The model simulations predict the experimental results with sufficient
accuracy. However, the model simulations predict lower results at early age and
continuously increase with time. This is because the results mainly follow hydration
degree of slag which is modeled to increase continuously with time. Moreover, these
variations of the predictions are considered to be due to lack of consideration of effect
of some compounds in cement and slag which are not taken into account in this study.
These compounds may alter the early age hydration rates of both cement and slag. It
was reported that the impurities included in recent cement production and the SO3
content of slag can alter the hydration rates of cement and slag (Shinwa et al., 2009).
Therefore, interaction of slag-cement behavior should be further investigated for an
enhanced accuracy by also taking into consideration of some chemical compounds of
the binders.

76
Fig. 8.4 Comparison of tested and predicted adiabatic temperature rise for cement
concrete at w/b=0.4 and 0.65
Fig. 8.5 Comparison of tested and predicted adiabatic temperature rise for concrete
with 50% slag and at w/b=0.4 and 0.6

77
Fig. 8.6 Comparison of tested and predicted adiabatic temperature rise for concrete
with 65% slag and at w/b=0.4 and 0.6
Fig. 8.7 Comparison of tested and predicted adiabatic temperature rise for concrete
with 75% slag and at w/b=0.4 and 0.6

78
Taiheiyo Cement Corporation has experimentally investigated temperature of
slag concrete by using different sources of the slag and under different environmental
conditions. One such experimental result was obtained from a report which evaluated
a slag manufactured in Korea (R & D department I, 2014). A concrete mix with 65%
slag replacement level at a w/b of 0.50 was tested in this experiment. The mix
proportions and physical and chemical compositions of binder are shown in Appendix
A (Tables A1, A3, and A4, respectively). The verification is done by using the
proposed model and it is shown in Fig. 8.8.
A practical evaluation of temperature rise of a foundation construction was
done by Taiheiyo Cement Corporation (R & D department II, 2014), in Singapore. A
concrete mix with 74% slag blended cement at w/b of 0.46 was utilized and the
temperature measurements were taken inside a mass concrete foundation. The
temperature profile seemed to show characteristics of an adiabatic temperature
profile, at the center of this mass concrete structure. The proposed model is applied to
verify the measured temperature profile which is shown in Fig. 8.9. The mix
proportions and physical and chemical compositions of the binder are shown in
Appendix A (Tables A1, A2, and A3, respectively).

79
Fig. 8.8 Comparison of tested and predicted adiabatic temperature rise for concrete
with 65% slag and at w/b=0.50
Fig. 8.9 Comparison of tested and predicted adiabatic temperature rise for concrete
with 74% slag and at w/b=0.46

80
The model simulations predicted the experimental results as shown in Fig. 8.8
and Fig. 8.9 with sufficient accuracy. The model simulation seemed higher than that
of the experimental results at later age as shown in Fig. 8.9. This is due to the fact that
the heat loss to surrounding was ignored in the simulation. In the real mass concrete
construction, there could be a slight heat loss to the environment.
The proposed model can be applied in the real mass concrete construction to
investigate the temperature rise of slag concrete. However, few modifications are
required for the proposed model to enhance the accuracy of the predictions. The
adiabatic temperature simulation model for slag concrete can be further modified in
depth to investigate the effect of chemical properties of cement and slag. Moreover,
the accuracy of hydration degrees can be further enhanced as concerning different
types and sources of cement and slag. The effects of water reducing and retarding
admixtures are not included in this model which can be further investigated.

81
Chapter 9
Semi-Adiabatic Temperature Rise of Mass Concrete
9.1 General
Adiabatic temperature rise has been experimentally investigated by many
researchers in order to investigate the temperature profiles in an environment which
do not allow the concrete specimen to have any interaction with surrounding
environment. However, despite of having large dimensions, in practical situations of
mass concrete structures are somewhat affected by the surrounding. Therefore, it is
required to consider the dimensions, environment behavior and boundary conditions
in order to simulate the actual temperature profile inside the mass concrete.
In this study, an experimental investigation on semi-adiabatic temperature rise
of mass concrete samples with fly ash and slag was carried out. Then, the temperature
rise profiles at the center of the specimens were analyzed using heat rates. The heat
rate is vital since this may directly affect thermal cracking potential of mass concrete
structures.
9.2 Experimental Program
9.2.1 Materials and mix proportions
The binders used throughout this study were Ordinary Portland Cement type I,
a blended cement with 50% low calcium fly ash and slag provided by Taiheiyo
Cement Corporation, Japan. The physical and chemical compositions of the cement
and slag are shown previously in Chapter 4, in Table 4.1 and Table 4.2, respectively.
The properties of fly ash in the blended cement are shown in Appendix B (Table B1
and Table B2). Fine and coarse aggregates with specific gravities of 2.58 and 2.72
were used in saturated surface-dry condition. Normal tap water was used as mixing
water. A napthalene-based superplastizer was used for mixes with w/b 0.4.
This experiment was conducted to obtain the semi-adiabatic temperature rise
profiles of mass concrete samples containing different replacements of fly ash and

82
slag at different water to binder ratios. Water to binder ratios (w/b) of 0.40, 0.50 and
0.60 were used. Slag replacements of 50%, 65%, and 75% and fly ash replacements of
30% and 50% were utilized. The replacement levels of fly ash and slag were decided
considering the practical limits of substitutions of mineral admixtures in mass
concrete as clarified by many researchers (Japan Concrete Institute, 2008; Slag
Cement Association, 2002; Thomas, 2007). The mix design of the binders used in this
study are shown in Table 9.1. All mix proportions of concrete used for testing semi-
adiabatic temperature rise of mass concrete samples are indicated in Appendix B
(Table B3).
Table 9.1 Mix design of the binders used in casting concrete
Mix w/b c/b r/b s/b
W40 S/R00 0.4 1.00 0 0
W40 R30 0.4 0.70 0.30 0
W40 R50 0.4 0.50 0.50 0
W40 S50 0.4 0.50 0 0.50
W40 S65 0.4 0.35 0 0.65
W40 S75 0.4 0.25 0 0.75
W50 S/R00 0.5 1.00 0 0
W50 R30 0.5 0.70 0.30 0
W50 R50 0.5 0.50 0.50 0
W50 S50 0.5 0.50 0 0.50
W50 S65 0.5 0.35 0 0.65
W50 S75 0.5 0.25 0 0.75
W60 S/R00 0.6 1.00 0 0
W60 R30 0.6 0.70 0.30 0
W60 R50 0.6 0.50 0.50 0
W60 S50 0.6 0.50 0 0.50
W60 S65 0.6 0.35 0 0.65
W60 S75 0.6 0.25 0 0.75
Remarks: w: water, c:cement, r:fly ash, s:slag, and b:binders (c+r+s).
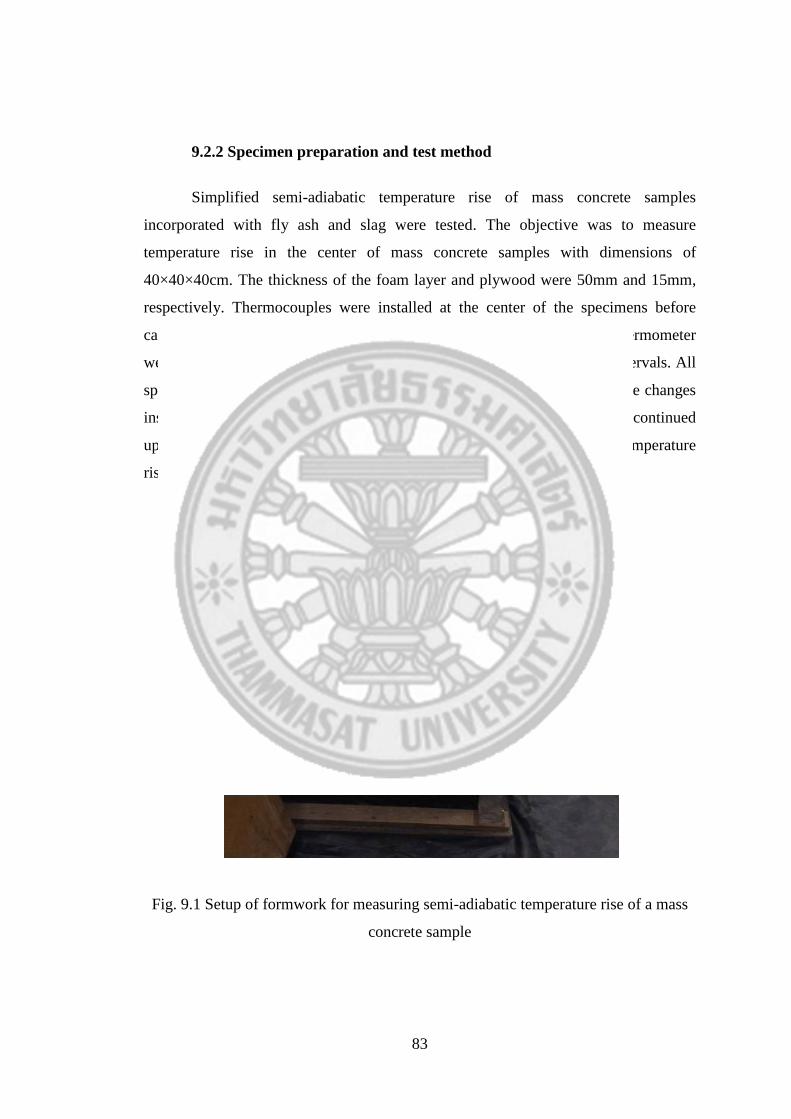
83
9.2.2 Specimen preparation and test method
Simplified semi-adiabatic temperature rise of mass concrete samples
incorporated with fly ash and slag were tested. The objective was to measure
temperature rise in the center of mass concrete samples with dimensions of
40×40×40cm. The thickness of the foam layer and plywood were 50mm and 15mm,
respectively. Thermocouples were installed at the center of the specimens before
casting. Type K nickel/chromium thermocouples, calibrated against a thermometer
were used. The readings were obtained using a data logger at 10-minute intervals. All
specimens were put in 30±2°C and 50-70% RH conditions. The temperature changes
inside the concrete samples were measured immediately after casting and continued
up to 7 days. The setup of formwork for measuring the semi-adiabatic temperature
rise is shown in Fig. 9.1.
Fig. 9.1 Setup of formwork for measuring semi-adiabatic temperature rise of a mass
concrete sample
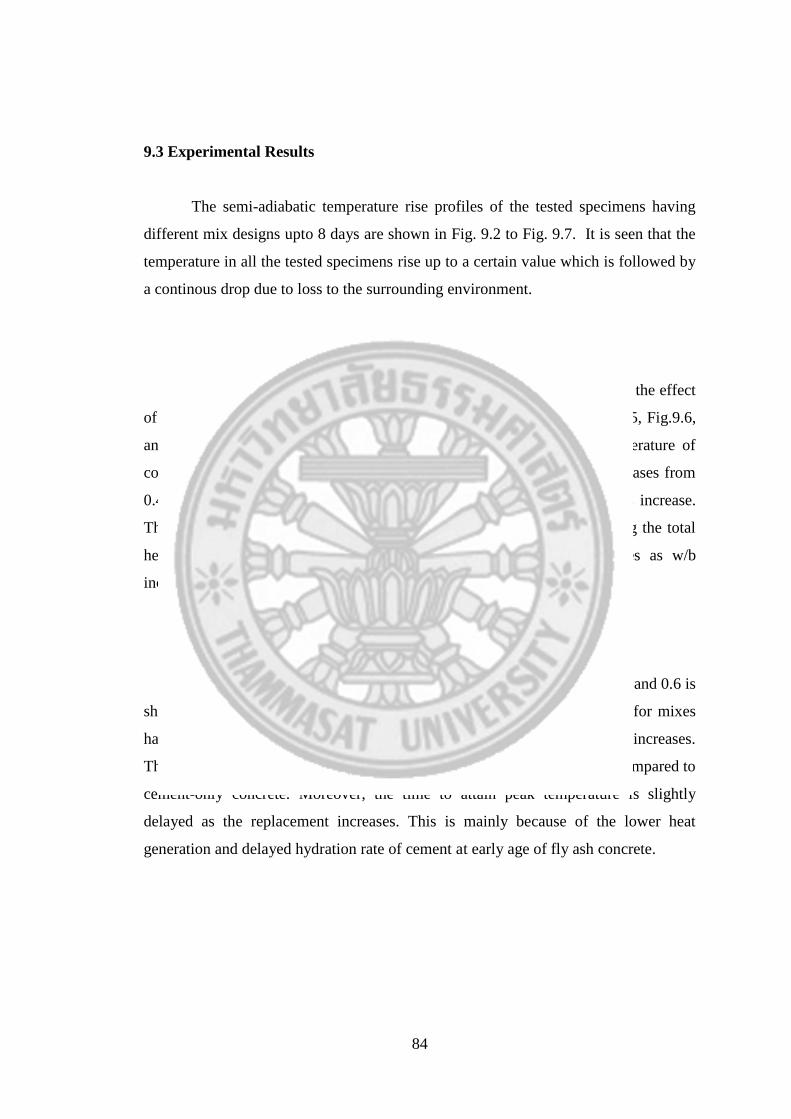
84
9.3 Experimental Results
The semi-adiabatic temperature rise profiles of the tested specimens having
different mix designs upto 8 days are shown in Fig. 9.2 to Fig. 9.7. It is seen that the
temperature in all the tested specimens rise up to a certain value which is followed by
a continous drop due to loss to the surrounding environment.
9.3.1 Effect of w/b
For concrete containing fly ash, Fig. 9.2, Fig. 9.3, and Fig. 9.4 show the effect
of w/b ratios whereas those for slag concrete samples are shown in Fig. 9.5, Fig.9.6,
and Fig. 9.7. It can be seen that for both mineral admixtures, the temperature of
concrete having similar replacement levels clearly reduces as the w/b increases from
0.4 to 0.6. This is due to a reduction of cement amount as the w/b ratios increase.
Then the weight of the cement compounds is reduced resulting in lowering the total
heat generation. Hence, temperature inside concrete specimen decreases as w/b
increases.
9.3.2 Effect of fly ash
The effect of fly ash on temperature of concrete with w/b of 0.4, 0.5, and 0.6 is
shown in Fig. 9.2, Fig. 9.3, and Fig. 9.4, respectively. It is observed that for mixes
having same w/b, peak temperatures are reduced as the fly ash replacement increases.
This is due to low reactivity and heat generation of fly ash concrete when compared to
cement-only concrete. Moreover, the time to attain peak temperature is slightly
delayed as the replacement increases. This is mainly because of the lower heat
generation and delayed hydration rate of cement at early age of fly ash concrete.

85
Fig 9.2 Test results of semi-adiabatic temperature of concrete with fly ash 0%, 30%,
and 50% at w/b=0.4
Fig 9.3 Test results of semi-adiabatic temperature of concrete with fly ash 0%, 30%,
and 50% at w/b=0.5

86
Fig 9.4 Test results of semi-adiabatic temperature of concrete with fly ash 0%, 30%,
and 50% at w/b=0.6
9.3.3 Effect of slag
The effect of slag on temperature of concrete with w/b of 0.4, 0.5, and 0.6 is
shown in Fig. 9.5, Fig. 9.6, and Fig. 9.7, respectively. It is observed that for mixes
having same w/b, peak temperatures are reduced as the slag replacement increases.
This is due to low reactivity and heat generation of slag concrete when compared to
cement-only concrete. Moreover, the time to attain peak temperature is slightly
delayed in slag concrete when compared to cement-only concrete. However, slight
acceleration of the time to attain peak temperature is observed as the slag replacement
increases. This may be because slag has the ability to accelerate the hydration of
certain compounds of cement (Ogawa et al., 1980; Hoshino et al., 2006). It may lead
to a slight acceleration of the time to attain peak temperature as the slag replacement
increases. However, further investigation is recommended to find the other probable
causes for this acceleration.

87
Fig 9.5 Test results of semi-adiabatic temperature of concrete with slag 0%, 50%, and
75% at w/b=0.4
Fig 9.6 Test results of semi-adiabatic temperature of concrete with slag 0%, 50%, and
75% at w/b=0.5

88
Fig 9.7 Test results of semi-adiabatic temperature of concrete with slag 0%, 50%, and
75% at w/b=0.6
Comparison of the fly ash and slag concrete can be done by analysing the
temperature profile characteristics. The initial temperature, peak temperature, time to
attain peak temperature, and heating/cooling slopes are calculated as shown in
Appendix C (Table C1). Lower peak temperature values are observed in fly ash
concrete when compared to that of slag concrete. This can be due to lower heat
generation from fly ash. The time to attain peak temperature is delayed in both cases
when compared to that of cement-only concrete. However, slag concrete showed
slightly quicker time to attain peak temperature as the replacement increased,
whereas, the time delayed in the case of fly ash concrete. This may be due to
acceleration of cement hydration by slag whereas retardation caused by fly ash.
However, further investigation is recommended to find the probable causes for this
acceleration.
The heating up and cooling down slopes are computed based on tangents of
semi-adiabatic temperature profiles (Nili & Salehi, 2010). Heating up slope is
calculated from the difference between maximum temperature and initial temperature.

89
Cooling down slope is calculated from the difference between the peak temperature
and the temperature observed at 90 hours after casting. The obtained values for the
concrete mixes with w/b of 0.5 are summarized in Fig. 9.8. It is clearly seen that fly
ash concrete significantly reduces heating up slopes than that of slag concrete. It
shows that fly ash concrete performs better in lowering heating rate in concrete. The
use of fly ash can be essentially beneficial for mass concrete structures to reduce the
temperature during the period in which the hydration heat is accumulated. The
cooling down slopes are not much different.
Fig 9.8 Heating up and cooling down slopes computed from temperature profiles of
fly ash and slag concrete with w/b=0.50

90
Chapter 10
Initial slump
10.1 General
Workability is known as the quality of concrete obtained such that it could be
placed, compacted, pumped, finished, etc. easily with enough resistance to
segregation at the same time (Kitticharoenkiat, 2000). It is apparent that the main
factor for workability is the amount of free water content in the concrete mix.
Addition of water results in increasing the inter-particle lubrication. However, the
amount of water in fresh concrete can be further divided into two sections. One of
them is the water retained by solid particles which moves together with solids. The
other is defined as free water which is independent from the solid particles. The
hydration process is insignificant when dealing with initial slump of concrete.
Slump tests are carried out in the laboratory and sites to estimate the degree of
wetness of concrete or in other words consistency of concrete. Consistency is a
practical consideration in securing a workable concrete. Slump prediction model was
previously proposed by Kitticharoenkiat (2000) on the basis that slump value linearly
varies with free water content. This was further modified by Khunthongkeaw (2001)
and Wangchuk (2003). The initial slump can be computed by Eq. (10.1).
)WW(SL ofr (10.1)
where SL is the slump value of fresh concrete (cm), α is the slope of slump-
free water content curve of fresh concrete (cm/kg/m3), Wfr is the volume of free
water in fresh concrete (kg/m3), and Wo is the amount of water just enough to
overcome inter particle surface forces.
The slope of slump-free water content has been verified to have relationship
with the ratio of paste volume to void content of aggregate phase which is γ

91
(Wangchuk, 2003). The slope of slump-free water content curves (α) increase with the
increase of γ. The relationship of the above two parameters is shown in Eq. (10.2).
944.14916.4374.463.21573.3 234 (10.2)
The free water content (Wfr) is described as the amount of water that is free,
by any means, from being restricted by all solid particles in the fresh concrete. This
could be calculated using Eq. (10.3).
aararpufr WW)t(WW)t(W (10.3)
where Wu is the unit water content of mix, Wrp(t) is the water restricted by
powder material at the considered age, Wra is the water restricted on the surface of
aggregates, and Waa is the additional free water due to filling effect of ultra-fine
particles. All parameters are provided in kg/m3 of concrete.
The water restricted by powder material includes water absorbed in powder
particles and water retained on surface of powder particles. The total amount of water
restricted by all powder materials (Wrp) is governed by water retain-ability of powder
materials. It can be obtained by Eq. (10.4). Water retain-ability of powder (βi)
depends on many factors such as porosity, surface condition, shape, size distribution
and loss of ignition of each powder. The β for cement and fly ash can be computed by
Eq. (10.5) and Eq. (10.6), respectively. It was stated that water retain-ability of
powder increases with the increase of environmental temperature so that this effect is
considered as well (Wangchuk, 2003).
n
1i
pipirp w*W (10.4)
49.0
c
55.0
c
74.0
pc /S**004.0 (10.5)
34.0
f
74.0
f
16.0
fpf /)LOI98.2(S*028.0 (10.6)

92
where βpi is the water retain-ability of the ith
powder material, and wpi is the
absolutely dried weight of the ith
powder material (kg/m3 of concrete). βpc and βpf are
the water retain-ability coefficients of cement and fly ash (g/g of dried weight), c and
f are the specific gravities of cement and fly ash, Sc and Sf are specific surface areas
of cement and fly ash (cm2/g), is the angularity factor of cement, and LOIf is the
loss on ignition of fly ash (%). The effects of time and temperature are added as
functions and were described previously in details by Wangchuk (2003).
The amount of water restricted at the surface of aggregates (Wra) can be
computed from Eq. (10.7). In this case, the water retain-ability of fine and coarse
aggregates are considered to be affected by specific surface areas, shape of the
particles, dimensions, and the specific gravities of the fine and coarse aggregates.
ggssra w*w*W (10.7)
where βs and βg are the surface water retain-ability coefficients of fine and
coarse aggregates excluding absorption (g/g of SSD aggregate), ws and wg are the
saturated surface-dry (SSD) weights of the fine and coarse aggregates (kg/m3 of mix),
respectively.
It was reported that using fine powders as partial replacements of cement
causes a filling effect on the amount of free water in concrete (Khunthongkeaw,
2001). Finer particles can fill in the voids amongst cement particles resulting in
moving out water entrapped in these voids. Hence, the amount of free water increases,
so reducing the water requirement of concrete to a certain extent. The additional
water due to filling effect of fly ash (Waa) was previously modeled in Eq. (10.8).
wfillaa VW * (10.8)
93
where Vfill is the volume of the fillable particles in the voids among cement
(Vc, m3 of concrete), and w is the specific gravity of water. A filling coefficient is
computed assuming that higher cement content results in larger amount of voids for
being filled by finer powder. This coefficient depends on the shape of particles,
specific surface areas of cement and fly ash, and fly ash replacement level. More
details are shown by Wangchuk (2003).
The minimum free water content required to initiate slump (Wo) is computed
by Eq. (10.9). The inter–particle surface forces were reported to vary significantly
with a certain amount of surface area of solid particles which was previously defined
as the effective surface area (Wangchuk, 2003). Moreover, the spherical particles can
reduce the inter-particle friction among larger particles; hence, a lubrication
coefficient was introduced as well. Therefore, the minimum free water content
required to initiate slump is modeled as a function of both effective surface area of
solid particles and lubrication coefficient.
L
SW
eff
o
76.05 *10*8
(10.9)
where Seff is the effective surface area of solid particles (cm2/m
3 of concrete)
and L is the lubrication coefficient to account for the lubrication effect of spherical
shape powder particles. Detailed explanation is provided by Wangchuk (2003).
After computing the water restricted by powder materials, water restricted by
the aggregates, filling effect by fine powder, free water content can be computed.
Then initial slump can be computed using Eq. (10.1) with substitutions from Eq.
(10.2) to Eq. (10.9).
In this study, initial slump was measured for concrete containing different
replacements of fly ash and slag with different water to binder ratios. The water
retain-ability coeffificents of powder materials were obtained through experiments.
Then the results were comparatively analyzed in order to identify the behavior of

94
initial slump of concrete mixes with fly ash and slag. The tested values of initial
slump of concrete with and without fly ash were verified using the model proposed by
Wangchuk (2003).
10.2 Experimental Procedure
The binders used throughout this study were Ordinary Portland Cement type I,
a blended cement with 50% low calcium fly ash and slag provided by Taiheiyo
Cement Corporation, Japan. The physical and chemical compositions of the cement
and slag are shown previously in Chapter 4, in Table 4.1 and Table 4.2, respectively.
The properties of fly ash in the blended cement are shown in Appendix B (Table B1
and Table B2). Fine and coarse aggregates with specific gravities of 2.58 and 2.72
were used in saturated surface-dry conditions. Normal tap water was used as mixing
water in all mixes. A dosage of 1.5% of a napthalene-based superplasticizer was used
for all concrete mixes with water to binder ratio of 0.4, in order to enhance
workability.
Water retain-ability of powder materials were tested using mini-slump test. A
simple method is adopted from Kitticharoenkiat’s study (Kitticharoenkiat, 2000). It
was measured by finding the lowest water to binder ratio (w/b) that initiates slump of
the paste using a mini-slump cone test. The experiment is started using a low w/b ratio
in which the slump value is zero. Then step by step increasing of the w/b was done
until the slump was initiated. A metal cone shaped mold (40±3 mm inside top
diameter, 90±3 mm inside bottom diameter, and 75±3 mm height) was used in which
the paste was cast in three layers. Each layer was compacted using a metal tamper
weighing 340±15 g. This method was used to find water retainability of slag, cement,
and blended cement with 50% low calcium fly ash.
Initial slump of concrete was measured in concrete containing different
replacements of fly ash and slag with different water to binder ratios. The mixes are
similar to that of the semi-adiabatic temperature measurement previously described in
Chapter 9. The initial slump was measured in accordance with ASTM C143.
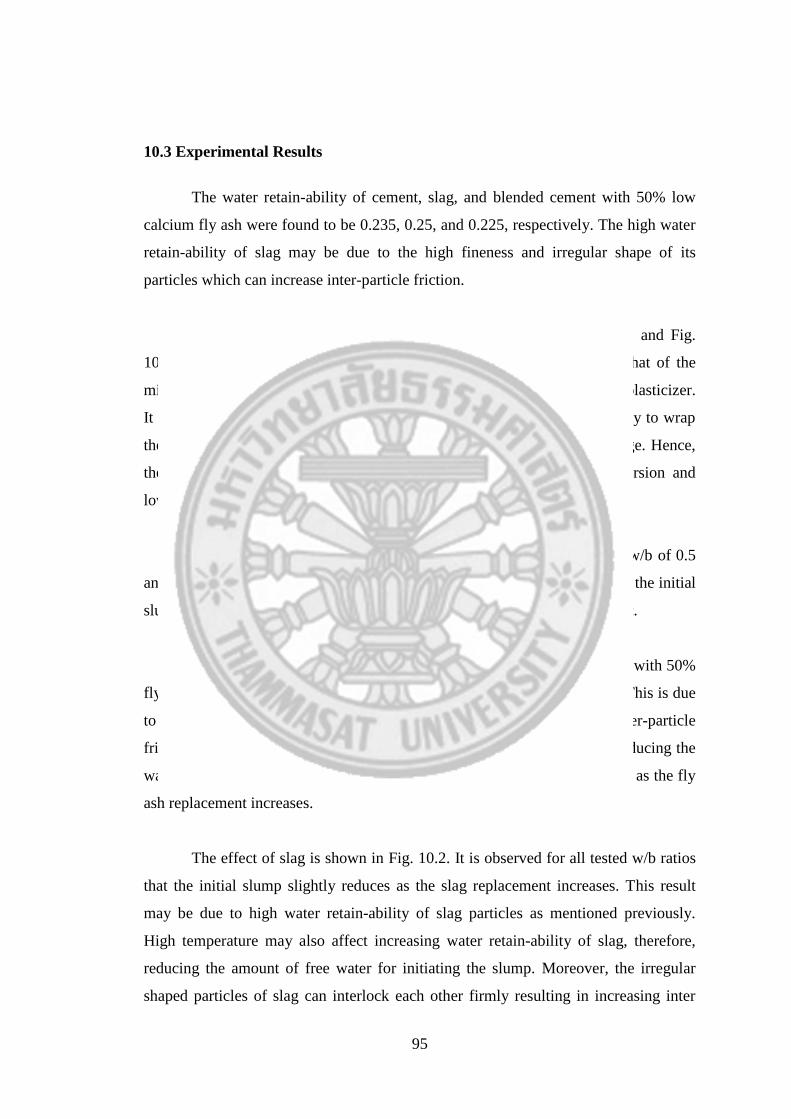
95
10.3 Experimental Results
The water retain-ability of cement, slag, and blended cement with 50% low
calcium fly ash were found to be 0.235, 0.25, and 0.225, respectively. The high water
retain-ability of slag may be due to the high fineness and irregular shape of its
particles which can increase inter-particle friction.
The initial slump of different mix designs are shown in Fig. 10.1 and Fig.
10.2. All the mixes at w/b ratio of 0.40 show higher initial slump than that of the
mixes with w/b of 0.5, due to the addition of 1.5% naphthalene based superplasticizer.
It is well known that the long molecules of superplasticizers have the ability to wrap
themselves around the powder materials and provide highly negative charge. Hence,
the powder materials attempt to repel each other which results in dispersion and
lowering the inter-particle friction forces.
The effect of w/b can be seen when comparing similar mixes with w/b of 0.5
and 0.6 in both Fig. 10.1 and Fig. 10.2. It is seen that as w/b ratio increases, the initial
slump increases due to increased lubrication by additional free water amount.
The effect of fly ash is shown in Fig. 10.1. It is observed that mixes with 50%
fly ash resulted in highest initial slump when compared to all other mixes. This is due
to the spherical particle shape of fly ash which can assist in reducing the inter-particle
friction forces, reducing adherence of cement particles and the ability of reducing the
water requirement due to filling effect as well. Thus, initial slump increases as the fly
ash replacement increases.
The effect of slag is shown in Fig. 10.2. It is observed for all tested w/b ratios
that the initial slump slightly reduces as the slag replacement increases. This result
may be due to high water retain-ability of slag particles as mentioned previously.
High temperature may also affect increasing water retain-ability of slag, therefore,
reducing the amount of free water for initiating the slump. Moreover, the irregular
shaped particles of slag can interlock each other firmly resulting in increasing inter

96
particle friction forces, and reduce dispersion of cement particles as the replacement
of slag is higher.
Fig 10.1 Tested results of initial slump of concrete with fly ash 0%, 30%, and 50% at
w/b=0.4, 0.5, and 0.6
Fig 10.2 Tested results of initial slump of concrete with slag 0%, 50%, 65%, and 75%
at w/b=0.4, 0.5, and 0.6

97
10.4 Verification of the Initial Slump Model for Concrete
The model developed by Wangchuk (2003) is used to predict initial slump of
concrete with and without fly ash. The parameters used for the cement, fly ash, and
slag to verify the initial slump model are summarized in Appendix D (Table D1). A
water reducing efficiency of 0.35 was used as an input in the model for the
napthalene-based superplasticizer used in this experiment (Wangchuk, 2003). The
comparison between tested and predicted values of initial slump for concrete with and
without fly ash is illustrated in Fig. 10.3. It is observed that the existing model is
capable of predicting initial slump with an accuracy in the range of ±3cm.
In the case of concrete containing slag, the comparison between tested and
predicted values of initial slump is illustrated in Fig. 10.4. The existing model is
capable of predicting initial slump with an accuracy in the range of ±2cm for fly ash
concrete cases and ±3cm for slag concrete cases. Slag concrete shows lower accuracy
of the predictions due to inaccuracies in computing the amount of additional water
due to filling effect from finer particles of slag. Existing model predicts the filling
effect from finer particles considering the limits of fly ash replacement levels. Thus, it
is required to modify the model considering the effect of slag replacement level.
Moreover, the effects on initial slump from loss on ignition and temperature are
different in the case of slag when compared to fly ash. Therefore, it is recommended
to further investigate the initial slump and slump models for the case of slag concrete.

98
Fig. 10.3 Comparison of tested and predicted initial slump values for concrete
containing fly ash 0%, 30%, and 50% for all tested w/b
Fig. 10.4 Comparison of tested and predicted initial slump values for concrete
containing slag 50%, 65%, and 75% for all tested w/b
99
Chapter 11
Compressive Strength
11.1 General
Significant amount of literature states the fact that partial replacement of
cement with mineral admixtures such as fly ash or slag, results in lower/delay
compressive strength development at early stages (Demirboga, 2003; Demirboga et
al., 2007; Uysal & Akyunsu, 2012). However, it is seen that higher later strength is
archived due to production of C-S-H at the expense of Ca(OH)2 by the pozzolanic
reaction. The effect of fly ash on compressive strength is different from that of the
effect of slag, due to different physical and chemical properties.
Numerous attempts have been undergone to model the compressive strength
of concrete containing fly ash (Kaewkhluab, 2002; Hung, 2005). Kaewkhluab (2002)
proposed a model to predict compressive strength at 28 days including several factors
which is shown in Eq. (11.1).
airwrLOIfeffc CaOdaysf ****]*)log([)28( 21
' (11.1)
where f’c (28 days) represents 28-day compressive strength of concrete cured
at normal temperature of 30°C. CaOeff is the amount of effective CaO in concrete
which depends on amount of CaO content of binders and fineness of fly ash. α1, α2 are
factors to include the effect of w/b on the compressive strength. λf, xγ, xLOI, xwr, xair
are the factors proposed for the effects of particle packing of fly ash, paste content,
loss on ignition of fly ash, water reducing admixture and air content, respectively. The
model was developed to compute compressive strength until the age of 1 year with the
considerations of hydration degrees. Hung (2005), further modified the previously
proposed model for different types of concretes and various curing temperatures.
In this study, compressive strength tests were conducted for concrete
containing different replacements of fly ash and slag at different water to binder

100
ratios. Then the results were comparatively analyzed in order to identify the behavior
of compressive strength with fly ash and slag. The compressive strength results at 28
days were verified using the model proposed by Kaewkhluab (2002). Simulating
compressive strength of concrete containing slag was done by using similar model,
although it is recommended to modify the proposed model considering the different
behavior of slag when compared to that of fly ash.
11.2 Experimental Procedure
The binders used throughout this study were Ordinary Portland Cement type I,
a blended cement with 50% low calcium fly ash and slag provided by Taiheiyo
Cement Corporation, Japan. The physical and chemical compositions of the cement
and slag are shown previously in Chapter 4, in Table 4.1 and Table 4.2, respectively.
The properties of fly ash in the blended cement are shown in Appendix B (Table B1
and Table B2). Fine and coarse aggregates with specific gravities of 2.58 and 2.72
were used in saturated surface-dry condition. Normal tap water was used as mixing
water in all mixes. A dosage of 1.5% of a napthalene-based superplasticizer was used
for all concrete mixes with water to binder ratio of 0.4, in order to enhance
workability.
This experiment was conducted to investigate the compressive strength
development of concrete samples containing different replacements of fly ash and
slag with different water to binder ratios. Water to binder ratios (w/b) of 0.40, 0.50
and 0.60 were used. Slag replacements of 50%, 65%, and 75% and fly ash
replacements of 30% and 50% were utilized. The mix designs of the concrete used in
this study are similar to that of the semi-adiabatic test which were previously shown
in Table 9.1.
Cube specimens with dimensions of 10×10×10cm were cast to obtain
compressive strength results. Water curing was done until the specimens were tested.
Three specimens were tested per each mix and average compressive strength was
computed. The measurements were taken at 3, 7, 28, and 91 days after casting.
101
11.3 Experimental Results
The compressive strength development of the tested specimens having
different mix designs at 3, 7, 28, and 91 days are shown from Fig. 11.1 to Fig. 11.6.
The effect of age is evident where the compressive strength of all mixes increases
with age. The effect of w/b ratios and fly ash/slag replacement levels are described
below.
11.3.1 Effect of w/b
For concrete containing fly ash, Fig. 11.1, Fig. 11.2, and Fig. 11.3 show the
effect of w/b ratios whereas that for concrete containing slag are shown in Fig. 11.4,
Fig.11.5, and Fig. 11.6. It can be seen that for both mineral admixtures, the
compressive strength of concrete having similar replacement levels clearly reduces as
the w/b increases from 0.4 to 0.6. This is due to the fact that w/b directly affects
microstructure formation by affecting the mean inter-particle distance and volume of
capillary porosity (Hung, 2005). Thus higher w/b results in increasing the total
porosity in the paste mixes. It leads to reduction of the denseness of structure,
resulting in decreasing compressive strength of concrete.
11.3.2 Effect of fly ash
The effect of fly ash for different w/b is shown in Fig. 11.1, Fig. 11.2, and
Fig.11.3. It is observed that for mixes having similar w/b, compressive strength
reduces significantly as the replacement ratio of fly ash increases. Moreover, the
compressive strength is lower than that of cement-only concrete. This tendency is
evident up to 28 days. The compressive strength development ratio values are
computed and summarized in Fig.11.7 for all concrete mixes with w/b of 0.5. It is
defined as the ratio of compressive strength of concrete at a given age to its 28-day
compressive strength. From the compressive strength development ratios of concrete
containing fly ash, it is observed that the ratio at 91 days is higher as the replacement
increases from 0% to 50%. This reveals that the compressive strength gain rate of
concrete with fly ash is higher than that of cement-only concrete at later ages. This is

102
due to the pozzolanic reaction which is weak at early stage after casting of concrete.
After certain period of hydration process, pozzolanic reaction is activated and then the
reactivity of fly ash improves with age. It was previously reported that the period
which pozzolanic reaction starts rapidly, delays as the calcium amount is lower
(Neville, 1995). In this study a low calcium fly ash is utilized thus the strength
development ratio is higher than normal concrete at later age.
Fig 11.1 Test results of compressive strength of concrete with fly ash 0%, 30%, and
50% at w/b=0.40

103
Fig 11.2 Test results of compressive strength of concrete with fly ash 0%, 30%, and
50% at w/b=0.50
Fig 11.3 Test results of compressive strength of concrete with fly ash 0%, 30%, and
50% at w/b=0.60

104
11.3.3 Effect of slag
The effect of slag on compressive strength of concrete with different w/b is
shown in Fig. 11.4, Fig. 11.5, and Fig.11.6. It is observed that for mixes having
similar w/b, compressive strength reduces significantly as the replacement ratio of
slag increases. Moreover, the compressive strength is lower in slag concrete than that
of cement-only concrete at early age. However, in the case of w/b ratio of 0.4, the
early age results are slightly higher at slag replacements of 50% and 65%. This may
be because the addition of slag up to certain limit at low w/b ratios can result in
denser interfacial transition zone (ITZ), optimized structure and distribution of pores
(Shui et al., 2013). It was also reported that slag can reduce the amount and mean size
of Ca(OH)2 crystals, resulting in dense structure with high strength (Gao et al., 2005).
However, it is recommended to investigate the strength development behavior of slag
concrete at early age in order to understand the mechanism clearly.
It is seen that strength development ratios of slag concrete is higher than that
of fly ash concrete up to 28 days. This is due to the fact that slag is capable of reacting
itself with water in a slow rate and actively continues its pozzolanic reaction with
Ca(OH)2 which is produced from cement hydration as well (Wang & Linger, 2010).
Therefore, initial strength gaining rate is higher than that of the fly ash concrete.
However, as the replacement of slag increases, the reactivity becomes lower.
The results of a previous study by Oner & Akyuz (2007) indicated that highest
efficiency and strength of concrete was obtained when the slag content is not too high,
especially up to 60% of the total amount of binding materials. After a certain limit of
slag replacement, it is not efficient as a binder; instead, it will become as filler in
concrete. It was reported that slag could not enter and contribute to the chemical
reactions if the replacement is too high. However, this depends on other parameters
such as physical and chemical properties of slag and mix proportions as well.

105
It is reasonable to compare the effect of fly ash and slag by using compressive
strength development ratios which interpret the ratio of compressive strength of
concrete at a given time to its 28 day compressive strength. The comparison of
strength development ratios of the tested mixes are shown in Fig. 11.7. The ratios of
both fly ash and slag are lower than that of cement-only concrete up to 28 days. It is
seen that slag concrete can gain higher strength rate at early stage than that of the fly
ash concrete. However, in terms of later age strength rate, fly ash concrete is higher
than that of slag concrete since the pozzolanic reaction of fly ash continues further at
later age as well.
Fig 11.4 Test results of compressive strength of concrete with slag 0%, 50%, 65%,
and 75% at w/b=0.40

106
Fig 11.5 Test results of compressive strength of concrete with slag 0%, 50%, 65%,
and 75% at w/b=0.50
Fig 11.6 Test results of compressive strength of concrete with slag 0%, 50%, 65%,
and 75% at w/b=0.60
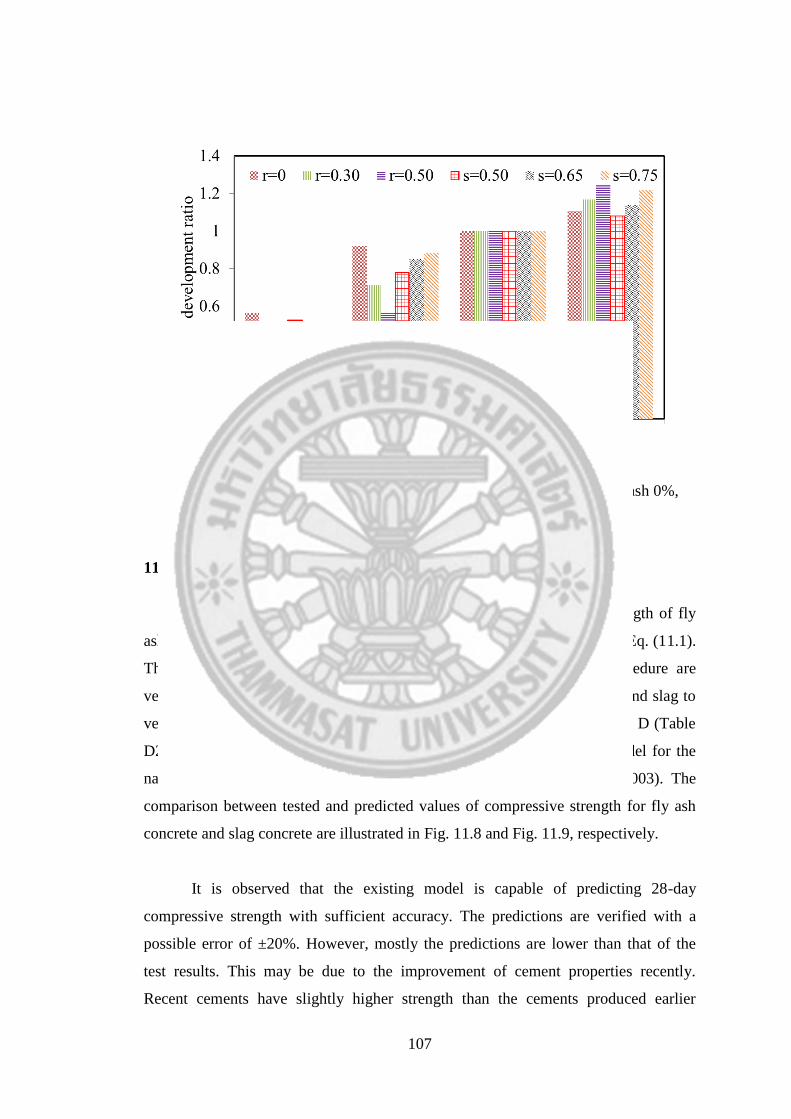
107
Fig 11.7 Comparison of strength development ratios of concrete with fly ash 0%,
30%, 50%, and concrete with slag 50%, 65%, 75% at w/b=0.50
11.4 Verification of the 28-day Compressive Strength Model
Kaewkhluab (2002) proposed a model to predict compressive strength of fly
ash concrete at 28 days including several factors. It is shown previously in Eq. (11.1).
The 28-day compressive strength values obtained by experimental procedure are
verified using this equation. The parameters used for the cement, fly ash, and slag to
verify the 28-day compressive strength model are summarized in Appendix D (Table
D2). A water reducing efficiency of 0.35 was used as an input in the model for the
napthalene-based superplasticizer used in this experiment (Wangchuk, 2003). The
comparison between tested and predicted values of compressive strength for fly ash
concrete and slag concrete are illustrated in Fig. 11.8 and Fig. 11.9, respectively.
It is observed that the existing model is capable of predicting 28-day
compressive strength with sufficient accuracy. The predictions are verified with a
possible error of ±20%. However, mostly the predictions are lower than that of the
test results. This may be due to the improvement of cement properties recently.
Recent cements have slightly higher strength than the cements produced earlier

108
probably due to addition of some compounds into the cement. In the case of concrete
containing slag, the most of the model predictions are lower than that of the test
results as well. The predictions are still satisfactory. However, it is recommended to
further modify the existing model for both cases of fly ash and slag for higher
accuracies.
Fig. 11.8 Comparison of tested and predicted 28-day compressive strength values for
concrete containing fly ash 0%, 30%, and 50% for all tested w/b
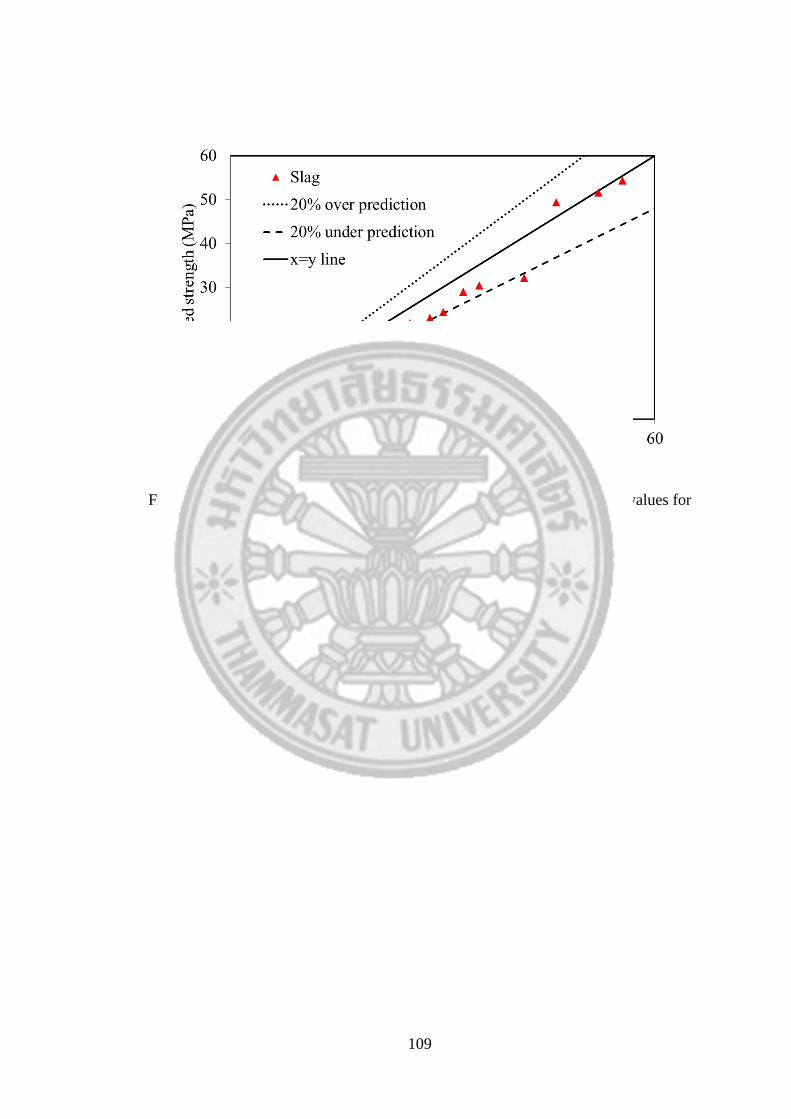
109
Fig. 11.9 Comparison of tested and predicted 28-day compressive strength values for
concrete containing slag 50%, 65%, and 75% for all tested w/b

110
Chapter 12
Conclusions and Recommendations for Future Studies
Predicting temperature rise is essentially useful for investigating thermal
cracking potential especially at early stage of mass concrete containing slag.
Therefore this study mainly focused on investigating thermal properties and
temperature rise through experiments which were followed by modeling these
properties based on hydration degrees of cement and slag. The important conclusions
obtained from this study can be summarized as follows.
12.1 Conclusions
1. The hydration degree which represents reaction rate was modelled as a
function of age, water to cement ratio and concrete temperature. Since, the model was
able to predict hydration degree of each reactive compound, the average hydration
degree was computed based on the assumption that each cement compound reacts
independently.
2. The hydration degree of slag in this study was defined as the weight fraction
of already reacted slag per total slag in the concrete mix. The model equation was
developed using the method of back analysis from adiabatic temperature results of
slag concrete. The key parameters of the model for predicting hydration degree of slag
were age, water to binder ratio, concrete temperature, slag replacement ratio and
fineness of the slag. The dispersion effect was considered to affect hydration degree
of C3S and C3A in cement at very early age. Thus, equations for dispersion effect
were proposed for acceleration of C3S and C3A hydrations.
3. The free water content of paste specimens clearly reduced with age due to
the consumption of water by cement and slag hydration. Free water increased as the
slag substitution level was higher. This was due to lower reactivity of slag at early age
when compared to cement. Simulating free water content in pastes with slag was

111
achieved by adopting a time-dependent model which computes free water based on
chemically bound water and gel water amounts. The model simulations showed
sufficient accuracy in predicting the test results of paste specimens at different water
to binder ratios and slag replacement levels.
4. The specific heat of pastes containing slag was experimentally measured
using transient method. It was concluded that the specific heat is a time-dependent
property which is significantly affected by the availability of free water at the
considered age. Time-dependent model was proposed based on weight fraction and
specific heat of each constituent. The model simulations showed sufficient accuracy
in predicting the tested results.
5. Transient method provided the outputs for thermal conductivity of pastes
containing slag. An increase of slag replacement level resulted in a slight decrease of
the values due to the lower thermal conductivity of slag when compared to cement.
The thermal conductivity model was proposed based on volume fraction and thermal
conductivity of each constituent. The model indicated a certain level of accuracy of
predictions.
6. CTE of pastes was experimentally obtained by measuring change in length
for every 5°C change of temperature. The CTE of pastes decreased as the slag
replacement level increased which was partly due to lower CTE of slag itself. The
model of CTE of paste at a given time was proposed based on volume fractions of
non-reacted binder content and hydrated product amounts. The model simulations
showed sufficient accuracy in predicting the test results.
7. Since the hydration degrees of cement and slag, free water content, specific
heat and total heat generation of concrete were separately modeled, the models can be
linked to compute the adiabatic temperature rise. Verifications of the proposed
adiabatic temperature rise model were done by using different sources of previous test
results. The model simulations were done with a reasonable accuracy of the predicted
results.
112
8. The semi-adiabatic temperature profiles indicated that fly ash concrete
performs better than that of slag concrete in terms of reducing heating up slopes. This
is due to low heat generation, low thermal conductivity, and high specific heat of fly
ash concrete when compared to the slag concrete, especially at early stage.
9. Initial slump increased as the fly ash replacement increased because the
spherical particle shape of fly ash can assist in reducing the inter-particle friction
forces and reduce the water requirement. Slag replacements caused slightly reductions
of the initial slump as the replacement increased. This may be due to high water
retain-ability of slag particles. A model for initial slump, computed based on free
water amount, was verified for both cases of fly ash and slag concrete and it was able
to accurately predict the test results.
10. The compressive strength results indicated that slag concrete possess
higher compressive strength than that of the fly ash concrete. However, strength
development ratios proved that fly ash concrete performed better at later ages. The 28-
day compressive strength model was verified for both fly ash and slag concrete and it
was able to accurately predict the tested values.

113
12. 2 Recommendations for Future Study
1. Effect of chemical composition of slag should be included in modeling
hydration degree of slag. Thereby, different types and sources of slag can be verified
for their hydration degrees.
2. Slag possesses both self-hydration and pozzolanic reactions. The model
equation for hydration degree of slag should be further divided into two sections to
separate these reactions.
3. The properties and behavior of hydrated products can be thoroughly
investigated with different mix designs of paste, mortar, and concrete. Hence, the
accuracy of the models can be further enhanced by understanding the microstructural
behavior of the hydrated products.
4. The maximum heat generation of cement compounds and slag can be varied
with different sources of the cement and slag and may depend on the properties of the
binders. Hence it is required to investigate the maximum heat generation of different
types of binders.
5. The effect of super plasticizers and retarding agents was not included in this
study. Hence, it can be further investigated.
6. The proposed adiabatic temperature simulation model is capable of
predicting the hydration degree within the limits of slag replacement from 0.40 to
0.75, water to binder ratio from 0.35 to 0.65, and slag fineness from 3500 cm2/g to
6000 cm2/g. The prediction range of these parameters can be further enhanced.
7. Finite element analysis shall be applied to simulate the tested semi-adiabatic
temperature profiles in order to investigate heat transfer considering the surrounding
environment.
8. The proposed model can be applied in actual construction to investigate the
temperature of slag concrete. Then, thermal cracking potential can be evaluated by
comparing the restrained strain to tensile strain capacity at any point in mass concrete
structures.
114
References
Alhozaimy, A., Fares, G., Alawad, O., & Al-Negheimish, A. (2015). Heat of
hydration of concrete containing powdered scoria rock as a natural pozzolanic
material. Construction and Building Materials, 81(1), 113-119.
American Society of Heating, R. a.-C. (1993). ASHRAE Handbook fundemental.
Georgia.
Amonamarittakul, S. (2011). Study on properties of concrete containing fly ash with
different properties. Sirindhorn International Institute of Technology,
Thammasat university.
Attari, A., McNally, C., & Richadson, M. (2012). Numerical model for quantifying
degree of hydration in concrete mixes with reduced CO2 footprint. Research
Repository of University College Dublin. Dublin.
Ballim, Y. (2003). A numerical model and associated calorimeter for predicting
temperature profiles in mass concrete. Cement and Concrete Composites,
26(1), 695-703.
Bentz, D. (2007). Transient plane source measurements of the thermal properties of
hydrating cement pastes. Materials and Structures, 40(1), 1073-1080.
Bentz, D., Peltz, M., Duran-Harrera, A., Valdez, P., & Juarez, C. (2011). Thermal
properties of high volume fly ash mortars and concretes. Journal of Building
Physics, 34(3), 263-275.
Berwanger, C., & Sarker, A. (1976). Thermal expansion of concrete and reinforced
concrete. Journal of American Concrete Institute, 73(11), 618-621.
Beushausen, H., Alexander, M., & Ballim, Y. (2012). Early-age properties, strength
development and heat of hydration of concrete containing various South
African slags at different replacement ratios. Construction and building
materials, 29(1), 533-540.
Chang, P., & Peng, Y. (2001). Influence of mixing techniques on properties of high
performance concrete. Cement and Concrete Research, 31(1), 87-95.
Chen, W. (2007). Hydration of Slag Cement:Theory, Modelling and Application.
University of Twente, The Netherlands.
Choktaweekarn, P. (2008). Thermal properties and model for predicting temperature
and thermal cracking in mass concrete, Master Thesis. Sirindhorn
International Institute of Technology, Thammasat University.

115
Choktaweekarn, P., & Tangtermsirikul, S. (2010). Effect of aggregate type, casting,
thickness and curing condition on restrained strain of mass concrete.
Songklanakarin Journal of Science and Technology, 32(4), 391-402.
Choktaweekarn, P., & Tangtermsirikul, S. (2011). Prediction of temperature of mass
concrete with limestone powder. National Convention on Civil Engineering.
Chonburi.
Choktaweekarn, P., Saengsoy, W., & Tangtermsirikul, S. (2009). A model for
predicting the specific heat capacity of fly-ash concrete. Science Asia, 35(2),
178-182.
Copeland, L., & Kantro, D. (1969). Hydration of Portland cement. 5th International
Symposium on the Chemistry of Cement, 2, pp. 386-421. Tokyo.
Damdelen, O., Georgopoulos, C., & Limbachiya, M. (2014). Measuring thermal mass
in sustainable concrete mixes. Journal of Civil Engineering and Architecture
Research, 1(1), 60-70.
Demirboga, R. (2003). Influence of mineral admixtures on thermal conductivity and
compressive strength of mortar. Energy and Buildings, 35(2), 189-192.
Demirboga, R. (2007). Thermal conductivity and compressive strength of concrete
incorporation with mineral admixtures. Building and Environment, 42(1),
2467-2471.
Demirboga, R., Turkmen, I., & Karakoc, M. (2007). Thermo-mechanical properties of
concrete containing high-volume mineral admixtures. Building and
environment, 42(1), 349-354.
Divsholi, B., & Lim, D. (2012). Evaluation of heat of hydration for high performance
concrete incorporating normal and ultra fine ground granulated blast furnace
slag. Our world in concrete & structures, 37(1).
Escalante, J., Gomez, L., Johal, K., Mendoza, G., Mancha, H., & Mendez, J. (2001).
Reactivity of blast-furnace slag in Portland cement blends hydrated under
different conditions. Cement and Concrete Research, 31(1), 1403-1409.
Faria, R., Azenha, M., & Figueiras, J. (2006). Modelling of concrete at early
ages:application to an externally restrained slab. Cement and Concrete
Composites, 28(6), 572-585.
Gao, J., Qian, C. L., Wang, B., & Li, L. (2005). ITZ microstructure of concrete
containing GGBS. Cement and Concrete Research, 35(1), 1299-1304.
Guo, D., Chen, E., Low, G., & Yang, J. (2001). Experimental modelling of
temperature rise of mass concrete by FDM method . 26th Conference on Our

116
World in Concrete & Structures (pp. 261-268). Singapore: Singapore Concrete
Institute.
Gustafsson, S. (1991). Transient plane source techniques for thermal conductivity and
thermal diffusivity measurements of solid materials. Rev Sci Instrum, 62(3),
797-804.
Hanehara, S., Nito, N., Koibuchi, K., & Oyamada, T. (2014). Quantitative analysis of
slag content in anhydrous and hardening blast-furnace slag cement. Cement
Science and Concrete Technology, 64(1), 575-581.
He, Y. (2005). Rapid thermal conductivity measurement with a hot disk sensor Part 1.
Thermochimica Acta, 436(1), 122-129.
Hinrichs, W., & Odler, I. (1989). No Access Investigation of the hydration of Portland
blastfurnace slag cement: hydration kinetics. Advances in Cement Research,
2(5), 9-13.
Hoshino, S., Yamada, K., & Hirao, H. (2006). XRD/Rietveld Analysis of the
hydration and strength development of slag and Limestone blended cement.
Journal of Advanced Concrete Technology, 4(3), 357-367.
Hung, L. (2005). A model for predicting strength development of normal and no-
slump concretes with and without fly ash under various curing temperatures,
Master Thesis. Sirindhorn International Institute of Technology, Thammasat
University.
Japan Concrete Institute, J. (2008). Guidelines for control of cracking of mass
concrete. Tokyo.
Johari, M. (2000). Autogenous shrinkage: Early age measurement and effect of
mineral admixtures. Penang: Universiti Sains Malaysia.
Kada, H., Lachemi, M., Petrov, N., Bonneau, O., & Aitcin, P. (2002). Determination
of the coefficient of thermal expansion of high performance concrete from
initial setting. Materials and Structures, 35(1), 35-41.
Kaewkhluab, T. (2002). A compressive strength model taking into account effects of
chemical composition and physical properties of fly ash and chemical
admixtures, Master Thesis. Sirindhorn International Institute of Technology,
Thammasat University.
Khunthongkeaw, J. (2001). Workability prediction model for concrete and mortar
with and without mineral and chemical admixtures, Master Thesis. Sirindhorn
International Institute of Technology, Thammasat University.

117
Kishi, T., & Maekawa, K. (1996). Hydration heat model for blended cement including
blast furnace slag and fly ash. Cairo First International Conference on
Concrete Structures, (pp. 4-19). Cairo.
Kitticharoenkiat, P. (2000). A slump prediction model based on water retainability
and free water concepts, Master Thesis. Sirindhorn International Institute of
Technology, Thammasat University.
Klieger, P., & Lamond, J. (1994). Significance of tests and properties of concrete and
concrete-making materials (4 ed.). Pensylvania: ASTM publication.
Kochaba, V., Gallucci, E., & Scrivener, K. (2011). Methods for determination of
degree of reaction of slagin blended cement pastes. Cement and Concrete
Research, 42(1), 511-525.
Kolani, B., Buffo-Lacarriere, L., Sellier, A., Escadeillas, G., Boutillon, L., & Linger,
L. (2012). Hydration of slag-blended cements. Cement & Concrete
Composites, 34(1), 1009-1018.
Krishnaiah, S., & Singh, D. (2006). Determination of thermal properties of some
supplementary cementing materials used in cement and concrete. Construction
and Building Materials, 20(3), 193-198.
Kwak, H., & Ha, S. (2006). Non-structural cracking in RC walls: Part II. Quantitative
prediction model. Cement and Concrete Research, 36(4), 761-775.
Lam, L., Wong, Y., & Poon, C. (2000). Degree of hydration and gel/space ratio of
high-volume fly ash/cement systems. Cement and Concrete Research, 30,
747-756.
Log, T., & Gustafsson, S. (1995). Transient plane source (TPS) technique for
measuring thermal transport properties of building materials. Fire Mater,
19(1), 43-49.
Luan, Y., Ishida, T., Nawa, T., & Sagawa, T. (2012). Enhanced model and simulation
of hydration process of blast furnace slag in blended cement. Journal of
Advanced Concrete Technology, 10(1), 1-13.
Luke, K., & Glasser, F. (1988). Internal chemical evolution of the chemical evolution
of the constitution of blended cements. Cement and Concrete Research, 18(4),
495-502.
Lumley, J., Gallop, R., Moir, G., & Taylor, H. (1996). Degrees of reaction of the slag
in some blends with Portland cement. Cement and Concrete Research, 26(1),
139-151.

118
Maekawa, K., & Ishida, T. (2002). Modeling of structural performances under
coupled environmental and weather actions. Materials and Structures,
35(254), 591-602.
Matsuka, T., Suzuki, Y., Sakai, K., & Fukudome, K. (2010). Low-carbon concrete
using ground granulated blast-furnace slag and fly ash. Cement Science and
Concrete Technology, 64(1), 295-302.
Merzouki, T., Bouasker, M., Khalifa, N., & Mounanga, P. (2013). Contribution to the
modeling of hydration and chemical shrinkage of slag-blended cement at early
age. Construction and Building Materials, 44(1), 368-380.
Muhammad Ejaz Shabab, K. S. (2013). Effect of mineral admixtures on the properties
of mass concrete- A review. International journal of advanced structures and
geotechnical engineering.
Neville, A. (1995). Properties of Concrete. London: Longman.
Neville, A., & Brooks, J. (1987). Concrete Technology. Essex: Addison Wesley
Longman.
Ng, P. (2014). Temperature rise control for massive Concrete pours and semi-
adiabatic curing test for evaluation of adiabatic temperature rise of concrete.
Hong Kong: Hong Kong Concrete Institute.
Nili, M., & Salehi, A. (2010). Assessing the effectiveness of pozzolans in massive
high-strength concrete. Construction and Building Materials, 24(1), 2108-
2116.
Ogawa, K., Uchikawa, H., Takemoto, K., & Yasui, I. (1980). The mechanism of the
hydration in the system C3S-pozzolana. Cement & Concrete Research, 10(5),
683-696.
Okura, A., & Imaoka, M. (1979). Heat properties of three phase diagram of glass and
slag. Production Research, 31(3), 186-189.
Oner, A., & Akyuz, S. (2007). An experimental study on optimum usage of GGBS for
the compressive strength of concrete. Cement and concrete composites, 29(1),
505-514.
P, D., Shui, Z., W, C., & C, S. (2013). Efficiency of mineral admixtures in concrete:
Microstructure, compressive strength and stability of hydrate phases. Applied
Clay Science, 83(1), 115-121.
Poppe, A., & Schutter, G. (2005). Cement hydration in the presence of high filler
contents. Cement & Concrete Research, 35(12), 2290-2299.

119
Powers, T. (1960). Physical properties of cement paste. Fourth International
Symposium on the Chemistry of Cement, 1, pp. 577-613. Washington D.C.
R & D department I, T. C. (2014). Results for adiabatic temperature rise profiles for
Korean GGBS.
R & D department II, T. C. (2014). Verification of performance of CEM II concrete
applied for the construction of cement silo of SCMC. Singapore.
RILEM Commiision, 4.-C. (1981). Properties of set concrete at early ages. Materials
and Structures, 14(84), 399 - 401.
Roller, K. (2000). Heat and mass transfer. Ohio: Prentice Hall.
Ruiz, J., Schindler, A., Rasmussen, R., Kim, P., & Chang, G. (2001). Concrete
temperature modeling and strength prediction using maturity concepts in the
FHWA HIPERPAV software. Seventh international conference on concrete
pavements, (pp. 9-13). Florida.
Saengsoy, W. (2003). Simulation of Thermal Properties and Adiabatic Temperature
Rise of Fly Ash Concrete, Master Thesis. Sirindhorn International Institute of
Technology, Thammasat University.
Saengsoy, W., & Tangtermsirikul, S. (2003). Model for predicting temperature of
mass concrete. 4th Regional Symposium on Infrastructure Development in
Civil Engineering. Bangkok.
Saengsoy, W., Tangtermsirikul, S., & Jitvutikrai, P. (2003). A study on specific heat
of paste, mortar, and no-fine concrete containing fly ash. Research and
Development Journal of the Institute of Engineering Thailand, 14(2), 19-26.
Sagawa, T., & Nawa, T. (2009). Hydration reaction of blast furnace slag cement
including expansive agent. Japan Concrete Institute, 31, pp. 181-186.
Sagawa, T., & Nawa, T. (2014). Quantitative determination of blast-furnace slag
content in slag-blended cement by combination method of heat-treatment and
XRD/Rietveld analysis. Cement Science and Concrete Technology, 68(1), 38-
45.
Santhikumar, S., Kishi, T., & Maekawa, K. (1993). Heat generation model for mixed
Portland cement, blast furnace slag, and fly-ash concrete. 4th East Asia-
Pacific Conference on Structural Engineering and Construction, (pp. 1449-
1454). Tokyo.
Sarker, P., Jitvutikrai, P., Tangtermsirikul, S., & Kishi, T. (1999). Modeling of
temperature rise in concrete using fly ash. Concrete Model Code for Asia
IABSE Colloquium, 80, pp. 126-132. Phuket.

120
Schutter, G. (2002). Finite element simulation of thermal cracking in masive
hardening concrete elements using degree of hydration based material laws.
Computers and Structures, 80(1), 2035-2042.
Schutter, G., & Taewe, L. (1995). Specific heat and thermal diffusivity of hardening
concrete. Magazine of Concrete Research, 47(172), 203-208.
Shinwa, N., Hanehara, T., Ito, T., & T, O. (2009). Quantitative analysis of slag
content in cement and cement paste by the combination of selective resolving
methods. Japan Concrete Institute, 31, pp. 49-54.
Shui, Z., Zhang, R., Chen, W., & Xuan, D. (2010). Effects of mineral admixtures on
the thermal expansion properties of hardened cement paste. Construction and
Building Materials, 24(1), 1761-1767.
Sioulas, B., & Sanjayan, J. (2000). Hydration temperatures in large high-strength
concrete columns incorporating slag. Cement and Concrete Research, 30(11),
1791-1799.
Slag Cement Association, S. (2002). Slag cement and fly ash. Woodstock.
Tada, K., Lim, J., Doraipandian, L., Hayakawa, T., & Tanaka, S. (2014).
Experimental strength and heat evolution of concrete using fly ash in the
Southeast Asian Environment. 6th International Conference of Asian Concrete
Federation, (pp. 272-275). Seoul.
Tangtermsirikul, S., & Saengsoy, W. (2002). Simulation of free water content of paste
with with fly ash. Research and Development Journal of the Institute of
Engineering Thailand, 13(4), 1-10.
Thomas, M. (2007). Optimizing the use of fly ash in concrete. Illinois: Portland
Cement Association.
Uysal, M., & Akyunsu, V. (2012). Durability performance of concrete incorporating
Class F and Class C fly ashes. Construction and Building Materials, 34(1),
170-178.
Viet, T. (2013). Effect of minearl admixtures on mechanical, physical and thermal
properties of concrete and mortar, Master Thesis. Sirindhorn International
Institute of Technology, Thammasat University.
Viet, T., Sahamitmongkol, R., & Tangtermsirikul, S. (2014). Effect of pozzolanic
materials on thermal properties and compressive strength of hardened mortar
and concrete. The sixth Asia-Pacific Young Researchers and Graduates
Symposium, (pp. 97-102).
121
Wang, X., & Linger, H. (2010). Modelling the hydration of concrete incorporating fly
ash or slag. Cement and Concrete Research, 40(1), 984-996.
Wangchuk, S. (2003). Workability prediction model : Effect of water reducing
admixtures and slump loss, Master Thesis . Sirindhorn International Institute
of Technology, Thammasat University.
Young, J., Mindess, S., Gray, R., & Bentur, A. (1998). The Science and Technology of
Civil Engineering Materials. New Jersey: Prentice Hall.
Zhu, J., Zhong, Q., Chen, G., & Li, D. (2012). Effect of particle size of blast furnace
slag on properties of portland cement. Procedia engineering, 27(1), 231-236.

122
Appendices
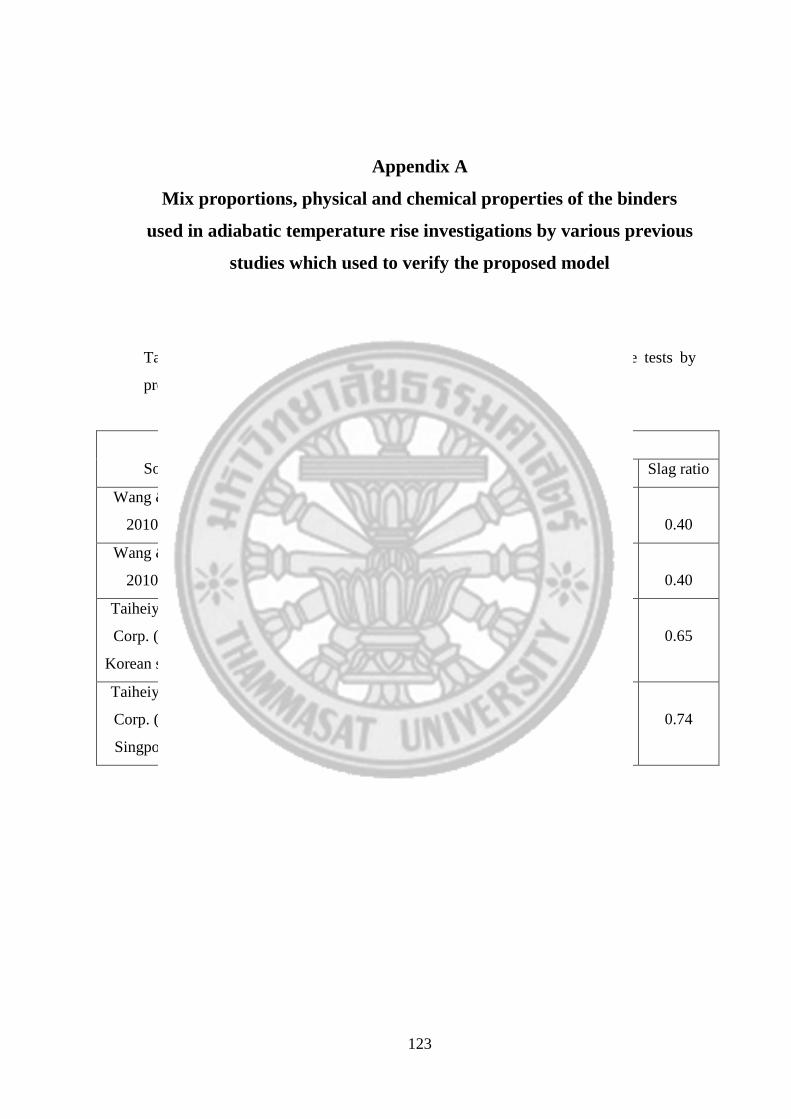
123
Appendix A
Mix proportions, physical and chemical properties of the binders
used in adiabatic temperature rise investigations by various previous
studies which used to verify the proposed model
Table A1 Mix proportions of concrete used in adiabatic temperature rise tests by
previous studies
Source
Mix proportions (kg/m3)
Cement Slag Water Sand Gravel w/b Slag ratio
Wang & Linger,
2010: Mix 1
1
240
1
160
1
157
6
645
1
1129
0
0.392
0.40
Wang & Linger,
2010: Mix 2
1
180
1
120
1
148
6
757
1
1129
0
0.493
0.40
Taiheiyo Cement
Corp. (testing of
Korean slag, 2014)
1
115
1
215
1
165
6
772
1
1079
0
0.50
0.65
Taiheiyo Cement
Corp. (testing in
Singpore, 2014)
1
91
1
259
1
160
6
845
1
980
0
0.46
0.74

124
Table A2 Mix proportions of concrete used in adiabatic temperature rise tests by Tada
et al. (2014)
Source
Mix proportions (kg/m3)
Cement Slag Water Sand Gravel w/b Slag ratio
s=0.00, w/b=0.40 400 0 160 798 1000 0.40 0.00
s=0.00, w/b=0.65 254 0 165 834 1094 0.65 0.00
s=0.50, w/b=0.40 206 207 165 736 1047 0.40 0.50
s=0.50, w/b=0.60 137 138 165 897 1001 0.60 0.50
s=0.65, w/b=0.40 145 268 165 734 1044 0.40 0.65
s=0.65, w/b=0.60 96 179 165 858 1038 0.60 0.65
s=0.75, w/b=0.40 103 310 165 732 1041 0.40 0.75
s=0.75, w/b=0.60 69 206 165 895 995 0.60 0.75
Table A3 Physical properties of binders used in adiabatic temperature rise tests by
previous studies
Source Binder type Blaine fineness
(cm2/g)
Specific gravity
(g/cm3) Ig. Loss (%)
Wang & Linger,
2010
Cement I 3380 3.15 2
Slag 4250 2.90 0.8
Taiheiyo Cement
Corp. (testing of
Korean slag,
2014)
Cement I 3320 3.15 1.7
Slag 4070 2.98 1.09
Taiheiyo Cement
Corp. (testing in
Singpore, 2014)
74% slag
blended
cement
3560 3.10 0.67
Tada et al. (2014) Cement I 3320 3.16 1.7
Slag 4220 2.89 0.96

125
Table A4 Chemical properties of binders used in adiabatic temperature rise tests by
previous studies
Source Binder
type
Chemical composition (% by weight)
SiO2 Al2O3 Fe2O3 CaO MgO SO3
Wang & Linger,
2010
Cement I -
Slag 33.4 15 0.5 43.1 6.6 0
Taiheiyo
Cement Corp.
(testing of
Korean slag,
2014)
Cement I
20.65 5.66 2.93 63.10 2.50 2.07
Slag 3
32.72
1
13.14
0
0.40
4
44.24
5
5.09
2
2.10
Taiheiyo
Cement Corp.
(testing in
Singpore, 2014)
74% slag
blended
cement
2
27.05
1
11.24
1
1.51
5
50
5
5.55
2
2.95
Tada et al.
(2014)
Cement I 20.65 5.66 2.93 63.10 2.50 2.07
Slag 34.54 14.06 0.29 44.38 5.59 0

126
Appendix B
Physical and chemical properties of fly ash and mix proportions of
concrete used in semi-adiabatic temperature rise, initial slump, and
compressive strength experimental investigations
Table B1 Physical properties of fly ash
Physical properties Fly ash
Specific gravity 2.27
Fineness (cm2/g) 3490
Loss on ignition (%) 1.9
Table B2 Chemical properties of fly ash
Chemical
properties
%
SiO2 Al2O3 Fe2O3 CaO MgO SO3
Fly ash 66.8 22.6 3.1 1.1 0.4 0.1

127
Table B3 Mix proportions of the concrete cast for measuring semi-adiabatic
temperature, initial slump, and compressive strength
Mix Cement
(kg/m3)
Fly ash
(kg/m3)
Slag
(kg/m3)
Water
(kg/m3)
Sand
(kg/m3)
Gravel
(kg/m3)
W40 S/R00 421.6 - - 168.6 798.7 1029.2
W40 R30 280.6 120.2 - 160.3 798.7 1029.2
W40 R50 194.0 194.0 - 155.2 798.7 1029.2
W40 S50 206.5 - 206.5 165.2 798.7 1029.2
W40 S65 143.7 - 266.9 164.2 798.7 1029.2
W40 S75 102.2 - 306.7 163.6 798.7 1029.2
W50 S/R00 369.9 - - 184.9 798.7 1029.2
W50 R30 247.7 106.2 - 176.9 798.7 1029.2
W50 R50 171.9 171.9 - 171.9 798.7 1029.2
W50 S50 181.7 - 181.7 181.7 798.7 1029.2
W50 S65 126.5 - 234.9 180.7 798.7 1029.2
W50 S75 90.1 - 270.14 180.1 798.7 1029.2
W60 S/R00 329.6 - - 197.7 798.7 1029.2
W60 R30 221.7 95.0 - 190.0 798.7 1029.2
W60 R50 154.4 154.4 - 185.2 798.7 1029.2
W60 S50 162.2 - 162.2 194.6 798.7 1029.2
W60 S65 112.9 - 209.8 193.7 798.7 1029.2
W60 S75 80.5 - 241.4 193.0 798.7 1029.2

128
Appendix C
Analysis of the tested semi-adiabatic temperature profile
characteristics
Table C1 Initial temperature, peak temperature, time to attain peak temperature, and
heating and cooling slopes of all tested concrete mixes for semi-adiabatic temperature
Mix
Initial
temp.
(°C)
Peak
temp.
(°C)
Time to
attain peak
temp. (°C)
Temp at 90
hours (°C)
Heating
slope
(°C/day)
Cooling
slope
(°C/day)
W40 S/R00 31.5 71.0 16.7 40.1 2.4 0.4
W40 R30 32.1 61.6 19.2 40.3 1.5 0.3
W40 R50 31.9 51.5 23.8 39.5 0.8 0.2
W40 S50 31.1 65.5 17.5 39.7 2.0 0.4
W40 S75 31.6 56.1 15.2 36.9 1.6 0.3
W50 S/R00 30.7 66.3 16.8 40.2 2.1 0.4
W50 R30 30.3 56.0 19.5 40.3 1.3 0.2
W50 R50 29.6 47.5 24.8 38.3 0.7 0.1
W50 S50 30.4 60.2 19.0 41.2 1.6 0.3
W50 S75 31.1 54.5 15.8 37.1 1.5 0.2
W60 S/R00 30.5 61.0 17.2 40.6 1.8 0.3
W60 R30 30.7 51.5 22.5 40.0 0.9 0.2
W60 R50 31.3 46.9 26.3 38.0 0.6 0.1
W60 S50 31.0 57.2 21.3 41.5 1.2 0.2
W60 S75 31.3 51.7 20.2 37.6 1.0 0.2

129
Appendix D
Parameters used for the cement, fly ash, and slag to verify the initial
slump and 28-day compressive strength models
Table D1 Parameters used for the cement, fly ash, and slag to verify the initial slump
model
Binder Cement Fly ash Slag
Specific gravity 3.16 2.27 2.89
Fineness (cm2/g) 3570 3490 4330
Loss on ignition (%) 2.06 1.9 0.96
Water retain-ability 0.225 0.19 0.25
Angularity factor (ψ) 1.4 1.2 1.55
Table D2 Parameters used for the cement, fly ash, and slag to verify the 28-day
compressive strength model
Binder Cement Fly ash Slag
Specific gravity 3.16 2.27 2.89
Fineness (cm2/g) 3570 3490 4330
Loss on ignition (%) 2.06 1.9 0.96
CaO (%) 63.4 1.1 43.26
Angularity factor (ψ) 1.4 1.2 1.55