modelling and remote sensing of land surface
TRANSCRIPT

1 23
Journal of the Indian Society ofRemote Sensing ISSN 0255-660XVolume 40Number 3 J Indian Soc Remote Sens (2012)40:399-409DOI 10.1007/s12524-011-0158-3
Modelling and Remote Sensing of LandSurface Temperature in Turkey
Mehmet Şahin, B. Yiğit Yıldız, OzanŞenkal & Vedat Peştemalcı

1 23
Your article is protected by copyright and all
rights are held exclusively by Indian Society of
Remote Sensing. This e-offprint is for personal
use only and shall not be self-archived in
electronic repositories. If you wish to self-
archive your work, please use the accepted
author’s version for posting to your own
website or your institution’s repository. You
may further deposit the accepted author’s
version on a funder’s repository at a funder’s
request, provided it is not made publicly
available until 12 months after publication.
RESEARCH ARTICLE
Modelling and Remote Sensing of Land SurfaceTemperature in Turkey
Mehmet Şahin & B. Yiğit Yıldız & Ozan Şenkal &Vedat Peştemalcı
Received: 28 September 2010 /Accepted: 15 August 2011 /Published online: 14 September 2011# Indian Society of Remote Sensing 2011
Abstract This study introduces artificial neural net-works (ANNs) for the estimation of land surfacetemperature (LST) using meteorological and geo-graphical data in Turkey (26–45°E and 36–42°N). Ageneralized regression neural network (GRNN) wasused in the network. In order to train the neuralnetwork, meteorological and geographical data for theperiod from January 2002 to December 2002 for 10stations (Adana, Afyon, Ankara, Eskişehir, İstanbul,İzmir, Konya, Malatya, Rize, Sivas) spread overTurkey were used as training (six stations) and testing(four stations) data. Latitude, longitude, elevation andmean air temperature are used in the input layer of thenetwork. Land surface temperature is the output.However, land surface temperature has been estimatedas monthly mean by using NOAA-AVHRR satellitedata in the thermal range over 10 stations in Turkey.
The RMSE between the estimated and ground valuesfor monthly mean with ANN temperature(LSTANN)and Becker and Li temperature(LSTB-L) method valueshave been found as 0.077 K and 0.091 K (trainingstations), 0.045 K and 0.003 K (testing stations),respectively.
Keywords Generalized regression neural network .
Land surface temperature . Satellite data
Introduction
Land surface temperature (LST) is an important factorcontrolling most physical, chemical, and biologicalprocesses on Earth. Knowledge of land surface temper-ature is necessary for many environmental studies andmanagement activities of the Earth’s resources (Li andBecker 1993). In order to monitor macro-scale spatialchanges in surface temperature, scanners designed forsensing in the thermal bands are placed onboardplatforms for remote sensing of the Earth’s resourcesfrom space (Sabins 1997). The extensive applicationand significant importance of temperature in environ-mental studies and management is the main forcedriving the study of LST in remote sensing. With theavailability of thermal sensing data, such as channels 4and 5 of Advanced Very High Resolution Radiometer(AVHRR) data as well as Landsat Thematic Mapper 6(TM6), the study of LST has become one of the hottesttopics in remote sensing during the last two decades(Vogt 1996). Thus, two approaches have been devel-
J Indian Soc Remote Sens (September 2012) 40(3):399–409DOI 10.1007/s12524-011-0158-3
M. Şahin (*)Siirt Vocational School, Siirt University,56100 Siirt, Turkeye-mail: [email protected]
B. Y. YıldızKaraisalı Vocational School, Çukurova University,01770 Karaisalı, Adana, Turkey
O. ŞenkalFaculty of Education Department of Computer Educationand Instructional Technology, Çukurova University,01330 Sarıçam, Adana, Turkey
V. PeştemalcıPhysics Department, Çukurova University,01330 Sarıçam, Adana, Turkey
Author's personal copy
oped to recover land surface temperature from multi-spectral thermal infrared (TIR) imagery (Schmugge etal. 1998). The first approach utilizes a radiative transferequation to correct the at-sensor radiance to surfaceradiance, followed by an emissivity model to separatethe surface radiance into temperature and emissivity(Schmugge et al. 1998). The second approach appliesthe split-window technique for sea surfaces to landsurfaces, assuming that the emissivity in the channelsused for the split window is similar (Dash et al. 2002).Land surface brightness temperatures are then calcu-lated as a linear combination of the two channels.
A study was undertaken to retrieve land (soil–vegetation complex) surface temperature (LST) over aarea in India using thermal bands (channel 4 and 5) ofAVHRR. The LST values were compared with nearsynchronous soil and air temperature measurements.The estimated LST of a semi-arid mixed agriculturalbarren values were near midway between air temper-ature (AT) and soil surface temperature (ST) withmean bias of −2.9 K and 7.0 K respectively in winter.However, in the summer, the LST values were foundto be closer to ST, which may be due to lowerfractional vegetation cover and NDVI (Bhattacharyaand Dadhwal 2003). So this study showed that thereis a relationship between land surface temperature,soil temperature and air temperature.
Although land surface temperature (LST) can begenerally estimated with reasonable accuracy by usingsatellite data, it is not possible to get same successful incloudy days. So, a new method is necessary to retrieveland surface temperature. For this purpose, ArtificialNeural Networks (ANN) was applied as a new methodwhich used latitude, longitude, elevation and monthlymean air temperature.
Artificial Neural Networks (ANN) have beenapplied to many different environmental sectors,especially in meteorological forecast (Gardner andDorling 1998; Aires et al. 2002). Govindaraju(2000a, b) reports a number of studies which haveused ANNs to forecast rainfall over a short timeinterval. It is clear from many studies that usage ofANN method is suitable and applicable for estimatingglobal solar radiation especially for regions wherevery large distances exist between meteorologicalstations and also having abundant solar energy(Kalogirou 2001; Bechrakis and Sparis 2004).
The objective of the present study is to apply theLSTANN, LSTB-L methods in collaboration with each
other for the prediction of the land surface tempera-ture of the target station using neighboring measuringstations. This will show that these methods can beapplied to predict the land surface temperature forany location around sampled measuring stations.The studies which have used LSTANN, LSTB-L
method show a general perspective of land surfacetemperature in Turkey.
Methodology and Data Sources
In this study, the ANN is used to model the LST fromnear-surface air temperature and geographic information.In addition, the LSTB-L method is used to retrieve theLST from National Oceanic and Atmospheric Admin-istration/Advanced Very High Resolution Radiometer(NOAA/AVHRR) data. The LSTB-L method is pre-sented for the determination of monthly global landsurface temperature from the NOAA/AVHRR satellitedata, which provide wide coverage together withadequate spatial resolution (around 1.1 km at the nadir).
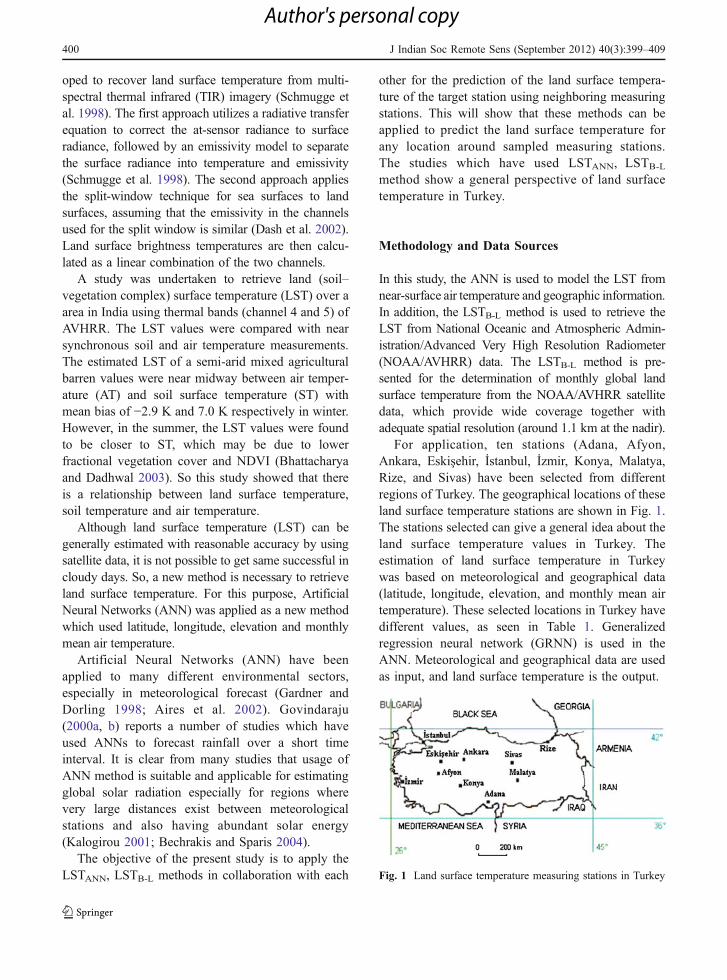
For application, ten stations (Adana, Afyon,Ankara, Eskişehir, İstanbul, İzmir, Konya, Malatya,Rize, and Sivas) have been selected from differentregions of Turkey. The geographical locations of theseland surface temperature stations are shown in Fig. 1.The stations selected can give a general idea about theland surface temperature values in Turkey. Theestimation of land surface temperature in Turkeywas based on meteorological and geographical data(latitude, longitude, elevation, and monthly mean airtemperature). These selected locations in Turkey havedifferent values, as seen in Table 1. Generalizedregression neural network (GRNN) is used in theANN. Meteorological and geographical data are usedas input, and land surface temperature is the output.
Fig. 1 Land surface temperature measuring stations in Turkey
400 J Indian Soc Remote Sens (September 2012) 40(3):399–409
Author's personal copy

Split-Window Method
The temporal resolution of NOAA-12-14-15images is at the same location which is scannedby the satellite 5 cloudless days of every month.The satellite images were received in a raw imageand zipped data format. They were unzipped andprocessed with the software ‘Quorum to Level1B’in order to convert this raw image data to Level1Bformat, so that remote sensing software can beapplied for processing. Radiometric and geometriccalibrations were applied first to the images tocorrect the deficiencies and flaws that could resultfrom the imaging sensor in the platform (satellite).Then, land surface temperature is predicted withLSTB-L method. Usage of these methods is moresuitable for large places. Both methods are applica-ble in any region for the very large distancesbetween the stations.
Split-window algorithms for the retrieval of LSTfrom NOAA-AVHRR data have been proposed bydifferent scholars in the last decades (Vogt 1996). Thealgorithm given by Becker and Li (1990) is worthy ofdetailed description since it has been used in manystudies (Franca and Cracknell 1994) on the study ofLST. The algorithm requires
– brightness temperatures in channels 4 (T4) and5 (T5)
– the mean emissivity in these channels, ε=(ε 4+ ε 5)/2=0.975
– the spectral emissivity difference, Δε=ε 4 -ε 5=−0.005 (Caselles et al. 1997; Chrysoulakis et al.2001).
Becker and Li (1990) presented a local split-window algorithm for viewing angles of up to 46°from nadir, given as follows:
TBec ker�Li�1990 ¼ A0 þ PT4 þ T5
2þM
T4 � T52
ð1Þ
where A0, P, and M are coefficients influenced by anumber of factors in the process of radiance trans-mission from the ground to the sensor. For NOAA/AVHRR data, coefficient A0=1.274 and A2=0.15616,A3=−0.482, B1=6.26, B2=3.98, B3=38.33. Later, Liand Becker (1993) modified their algorithm into ageneral one keeping the form of Eq. 1. The onlydifference in the modified algorithm is that thecoefficients are determined in terms of water contentcalculated from a radiance simulation using the LOW-TRAN 7 program (Caselles et al. 1997). Based onBecker and Li (1990), a generalized split-windowalgorithm has been developed by Wan and Dozier(1996). The form of the algorithm is the same as Eq. 2,but the coefficients P and M are given as follows:
P ¼ A1 þ A21� "
"þ A3
$"
"2ð2Þ
M ¼ B1 þ B21� "
"þ B3
$"
"2ð3Þ
where A1~A3 and B1~B3 are parameters estimatedby the method given by Li and Becker (1993). Thedifference is that Wan and Dozier (1996) defined A1in their model as a variable while Becker and Li(1990) defined it as a constant equal to 1. Similarly,the parameters are determined by regression analysisof the brightness temperature data to be simulatedground data of standard atmosphere given by LOW-
Stations Latitude (°N) Longitude (°E) Elevation (m) The mean airtemperature (K)
The mean land surfacetemperature (K)
Adana 36.59 35.21 27 290.31 291.07
Afyon 38.44 30.35 1001 280.84 282.10
Ankara 39.57 32.53 891 283.60 283.08
Eskişehir 39.47 30.34 786 278.79 282.30
İstanbul 41.01 28.59 0 287.33 287.10
İzmir 38.26 27.10 29 289.83 289.60
Konya 37.58 32.33 1031 282.13 283.57
Malatya 38.21 38.19 948 283.08 284.43
Rize 41.02 40.31 9 286.06 287.45
Sivas 39.45 37.01 1600 277.69 280.53
Table 1 Geographical andmeteorological parametersfor the stations
J Indian Soc Remote Sens (September 2012) 40(3):399–409 401
Author's personal copy

TRAN 7 program, based on many assumptions onsuch variables as atmospheric state and viewingangles. (Qin and Karnieli 1999). The mean landsurface temperature for ten stations over Turkey hasbeen determined using the LSTB-L method.
Artificial Neural Networks
Artificial neural networks (ANNs) are informationprocessing systems that are non-algorithmic, non digital,and intensely parallel (Dinçer et al. 1996). The use ofANNs for modeling and prediction purposes hasbecome increasingly popular in recent decades (Çamet al. 2005). Researchers have been applying the ANNmethod successfully in various fields such as mathe-matics, engineering, medicine, economics, meteorology,psychology and neurology as well as in the predictionof mineral exploration sites, in electrical and thermalload predictions, in adaptive and robotic control. ANNshave been trained to overcome the limitations ofconventional approaches to solving complex problems.This method learns from given examples by construct-ing an input–output mapping in order to performpredictions (Kalogirou 2000).
Generalized Regression Neural Network (GRNN)proposed by Speckt (1991) does not require aniterative training procedure as in back propagationmethod. It approximates any arbitrary functionbetween input and output vectors, drawing the functionestimate directly from the training data. Furthermore, it isconsistent; that is, as the training set size becomes large,
the estimation error approaches zero, with only mildrestrictions on the function. The GRNN is used forestimation of continuous variables, as in standardregression techniques. It is related to the radial basisfunction network and is based on a standard statisticaltechnique called kernel regression. By definition, theregression of a dependent variable y on an independent xestimates the most probable value for y, given x and atraining set. The regression method will produce theestimated value of y which minimizes the mean-squarederror. GRNN is a method for estimating the jointprobability density function (pdf) of x and y, given onlya training set. Because the pdf is derived from the datawith no preconceptions about its form, the system isperfectly general. If f(x,y) represents the known jointcontinuous probability density function of a vectorrandom variable, x, and a scalar random variable, y, theconditional mean of y given X (also called theregression of y on X) is given by:
E y Xj½ � ¼
R1�1
yf X; yð ÞdyR1
�1f X; yð Þdy
ð4Þ
When the density f(x,y) is not known, it mustusually be estimated from a sample of observations ofx and y. The Probability estimator f(X,Y) is basedupon sample values X and Y of the random variablesx and y, where n is the number of sample observationsand p is the dimension of the vector variable x:
f X;Yð Þ ¼ 1
2pð Þðpþ1Þ=2sðpþ1Þ1
n�Xni¼1
exp�ðX� XiÞT X� Xið Þ
2s2
" #exp
�ðY� YiÞ22s2
" #ð5Þ
Land surface temperature
Pattern layer Output layer Input layer
Latitude
Longitude
Elevation
Air temperature
Summation layerFig. 2 Topology of ageneralized regressionneural network (GRNN)artificial neuralnetworks (ANN)
402 J Indian Soc Remote Sens (September 2012) 40(3):399–409
Author's personal copy
A physical interpretation of the probability esti-mate f(X, Y) is that it assigns sample probability ofwidth σ for each sample Xi and Yi, and the probabilityestimate is the sum of those sample probabilities(Speckt 1991). Defining the scalar function Di
2
D2i ¼ X� Xi
� �TX� Xi� � ð6Þ
and performing the indicated integrations yields thefollowing:
Y Xð Þ ¼Pni¼1
Yi exp�D 2
i2s2
� �
Pni¼1
exp�D 2
i2s2
� � ð7Þ
The resulting Eq. 7 is directly applicable toproblems involving numerical data. When thesmoothing parameter σ is made large, the estimateddensity is forced to be smooth and in the limitbecomes a multivariate Gaussian with covariance σ2I.On the other hand, a smaller value of σ allows theestimated density to assume non-Gaussian shapes, butwith the hazard that wild points may have too great aneffect on the estimate (Speckt 1991). The GRNNconsists of four layers: input layer, pattern layer,summation layer and output layer. The input units arein the first layer. The second layer has the patternunits and the outputs of this layer are passed on to thesummation units in the third layer. The final layercovers the output units (Cigizoğlu and Alp 2006).
Mohandes et al. (2004) state that during thetraining procedure, the weights of the connectionsbetween neurons are adjusted in order to achieve the
desired input/output relation of the network. Thisprocedure goes on until the difference between theactual output of the network and the desired output isequal with a specified remainder value. Here, thecriterion is put forward as the network output whichshould be closer to the value of desired output. Thistraining procedure has to be repeated for the rest ofthe input–output pairs existing in the training data.Input variables have been used to validate the ANN.
Results and Discussions
ANN is used for modeling land surface temperature inTurkey. MATLAB software has been used to train theLSTANN on a personal computer. A GRNN structureGRNN (4, 1.0, 1) corresponds to 4 input nodes, aspread value equal to 1.0 and a single output node.The selected LSTANN structure is shown in Fig. 2.This network consists of input layer, pattern layer,summation layer and output layer. The stations used
Fig. 3 Comparison between measured and estimated monthlymean land surface temperature using LSTB-L method in trainingstations
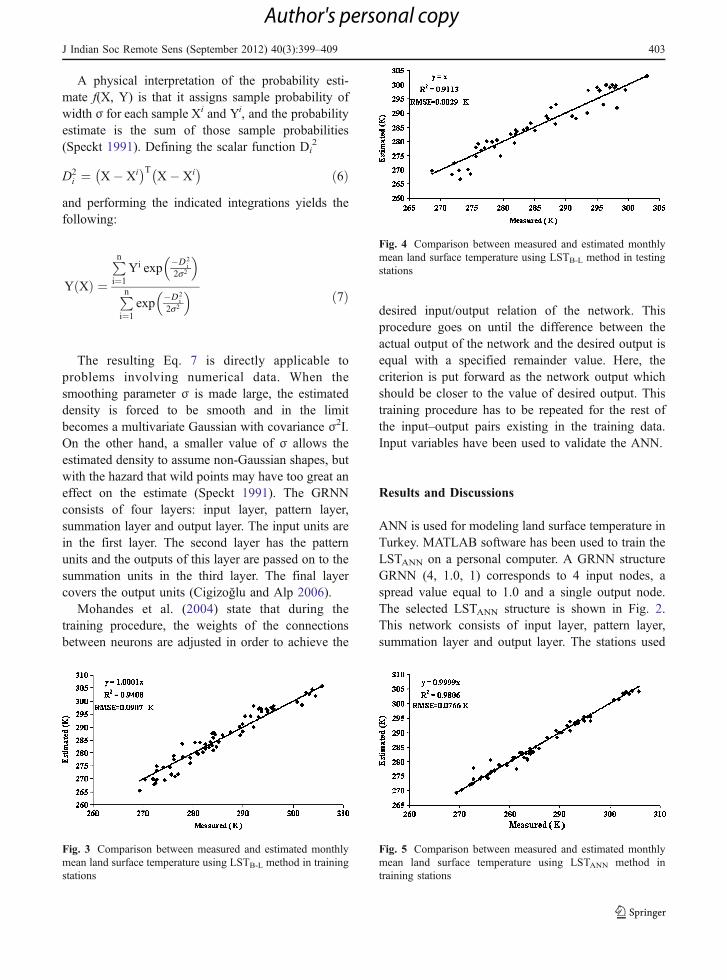
Fig. 4 Comparison between measured and estimated monthlymean land surface temperature using LSTB-L method in testingstations
Fig. 5 Comparison between measured and estimated monthlymean land surface temperature using LSTANN method intraining stations
J Indian Soc Remote Sens (September 2012) 40(3):399–409 403
Author's personal copy
for training data are at Adana, Afyon, Ankara,Eskişehir, İzmir, Sivas. In test data, stations, İstanbul,Konya, Malatya and Rize are used. In order to trainthe neural network, meteorological and geographicaldata measured by the Turkish State MeteorologicalService for the period from January 2002 to December2002 in Turkey from the above ten stations were used astraining and testing data. Inputs for the network arelatitude, longitude, elevation and monthly mean airtemperature; output is land surface temperature. Inaddition, the monthly mean land surface temperaturedata were measured with land thermometer from TurkishState Meteorological Service. The LSTANN structure andweights of neurons could help to understand therelationship between air and surface temperature.Separately, the method of LSTB-L was proposed forthe estimation of monthly global land surface temper-ature values from meteorological satellite data. Land
surface temperature (LST) was estimated as a monthlymean by using the LSTB-L method over ten stations inTurkey. It is suggested in this study that both methodsdescribing the LST throughout a diurnal cycle verywell. Data of Turkish State Meteorological Service aredeficient throughout a nocturnal cycle than a diurnalcycle in Turkey.
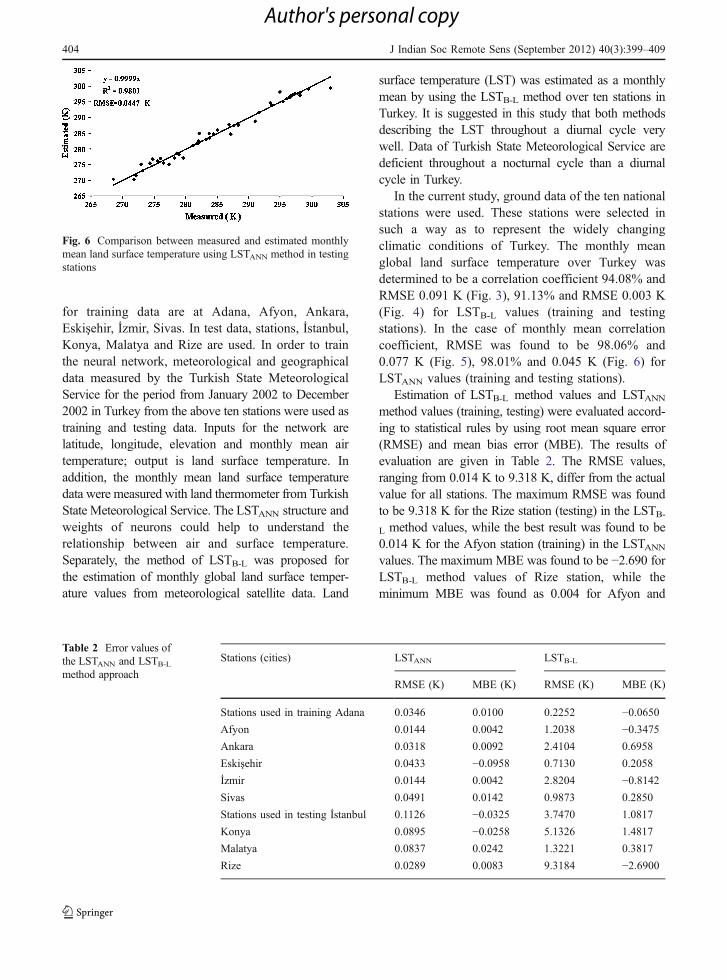
In the current study, ground data of the ten nationalstations were used. These stations were selected insuch a way as to represent the widely changingclimatic conditions of Turkey. The monthly meanglobal land surface temperature over Turkey wasdetermined to be a correlation coefficient 94.08% andRMSE 0.091 K (Fig. 3), 91.13% and RMSE 0.003 K(Fig. 4) for LSTB-L values (training and testingstations). In the case of monthly mean correlationcoefficient, RMSE was found to be 98.06% and0.077 K (Fig. 5), 98.01% and 0.045 K (Fig. 6) forLSTANN values (training and testing stations).
Estimation of LSTB-L method values and LSTANNmethod values (training, testing) were evaluated accord-ing to statistical rules by using root mean square error(RMSE) and mean bias error (MBE). The results ofevaluation are given in Table 2. The RMSE values,ranging from 0.014 K to 9.318 K, differ from the actualvalue for all stations. The maximum RMSE was foundto be 9.318 K for the Rize station (testing) in the LSTB-L method values, while the best result was found to be0.014 K for the Afyon station (training) in the LSTANNvalues. The maximum MBE was found to be −2.690 forLSTB-L method values of Rize station, while theminimum MBE was found as 0.004 for Afyon and
Stations (cities) LSTANN LSTB-L
RMSE (K) MBE (K) RMSE (K) MBE (K)
Stations used in training Adana 0.0346 0.0100 0.2252 −0.0650Afyon 0.0144 0.0042 1.2038 −0.3475Ankara 0.0318 0.0092 2.4104 0.6958
Eskişehir 0.0433 −0.0958 0.7130 0.2058
İzmir 0.0144 0.0042 2.8204 −0.8142Sivas 0.0491 0.0142 0.9873 0.2850
Stations used in testing İstanbul 0.1126 −0.0325 3.7470 1.0817
Konya 0.0895 −0.0258 5.1326 1.4817
Malatya 0.0837 0.0242 1.3221 0.3817
Rize 0.0289 0.0083 9.3184 −2.6900
Table 2 Error values ofthe LSTANN and LSTB-Lmethod approach
Fig. 6 Comparison between measured and estimated monthlymean land surface temperature using LSTANN method in testingstations
404 J Indian Soc Remote Sens (September 2012) 40(3):399–409
Author's personal copy

İzmir stations. Moreover, another significant point inthis table, the performance values of the training aregenerally better than the performance values of thetesting. Figures 7 and 8 shows a comparison betweenmeasured, LSTANN and LSTB-L values for the tenstations (training and testing stations).
In literature, lots of algorithms have been pro-pounded by Price(1984), Becker(1987), Vidal (1991),Prata(1994, 1993), Sobrino et al. (1996, 1994), Coll etal.(1994), Becker and Li(1995), Coll and Caselles
(1997). These studies indicated that it is possible toretrieve LST at a reasonable accuracy (RMSE of 1–3 K) from current operational and research satellite-borne visible/infrared radiometers. This study hasshowed that LSTANN and LSTB-L methods are moresuccessful than lots of algorithms which were used inliterature to get land surface temperature.
Using the LSTANN and LSTB-L methods is a cheapand effective way to estimate monthly global landsurface temperature and construct a land surface
Adana
260
270
280
290
300
310
41 2 3 5 6 7 8 9 10 11 12
Months
41 2 3 5 6 7 8 9 10 11 12
Months
41 2 3 5 6 7 8 9 10 11 12
Months
Mea
n L
and
Surf
ace
Tem
pera
ture
(K
)
260
250
270
280
290
300
310
Mea
n L
and
Surf
ace
Tem
pera
ture
(K
)
260
250
270
280
290
300
310
Mea
n L
and
Surf
ace
Tem
pera
ture
(K
)Measured
Backer and L
ANN
Afyon
Ankara
Fig. 7 Comparison for theland surface temperaturebetween the LSTANN,LSTB-L and measuredvalues (training stations)
J Indian Soc Remote Sens (September 2012) 40(3):399–409 405
Author's personal copy

temperature database. The LSTANN model, which needsno satellite data, was used to estimate the monthly meanat ground level. On the other hand, since the othermethod needs no ground data and presents valuableresults, it can be applied to any region. The applicationof these methods is suitable particularly for placeswhere the distances between the stations are very large.
Conclusion
A generalized regression neural network (GRNN) wasused to estimate monthly land surface temperature by
using meteorological and geographical data. Thegeneration of a typical land surface temperature issignificant for the calculations concerning many landsurface temperature methods. By using the LSTANNand LSTB-L methods, a production of land surfacetemperature was used at over ten stations in Turkey.The monthly mean values were found as 0.077 K and0.091 K (training stations), 0.045 K and 0.003 K(testing stations), respectively. According to theresults of these ten locations, correlation valuesindicate a relatively good agreement between theobserved LSTANN values and the predicted satellitevalues. So, LSTANN and LSTB-L methods are sug-
Eski ehir
250
260
270
280
290
300
Mea
n L
and
Surf
ace
Tem
pera
ture
(K
)
zmir
250
260
270
280
290
300
310M
ean
Lan
d Su
rfac
e T
empe
ratu
re (
K)
Sivas
240
250
260
270
280
290
300
Mea
n L
and
Surf
ace
Tem
pera
ture
(K
)
41 2 3 5 6 7 8 9 10 11 12
Months
41 2 3 5 6 7 8 9 10 11 12
Months
41 2 3 5 6 7 8 9 10 11 12
Months
Fig. 7 (continued)
406 J Indian Soc Remote Sens (September 2012) 40(3):399–409
Author's personal copy

gested to researchers who study on topics which arerelated to land surface processes, combining surface-atmosphere interactions, energy fluxes between theatmosphere and the ground, estimation of radiationbudgets in heat balance studies, climatology, human-
environment interactions, hydrology systems, ecolo-gy, greenhouse effect, biogeology, agricultural appli-cations such as evaluating water requirements forwheat and determining frost areas for citruses in thefuture.
stanbul
260
270
280
290
300
310
1 2 3 4 5 6 7 8 9 10 11 12
Months
Mea
n L
and
Surf
ace
Tem
pera
ture
(K)
Measured
Backer and Li
ANN
Konya
250
260
270
280
290
300
310
1 2 3 4 5 6 7 8 9 10 11 12
Months
1 2 3 4 5 6 7 8 9 10 11 12
Months
1 2 3 4 5 6 7 8 9 10 11 12
Months
Mea
n L
and
Surf
ace
Tem
pera
ture
(K
)
Malatya
250
260
270
280
290
300
310
Mea
n L
and
Surf
ace
Tem
pera
ture
(K
)
250
260
270
280
290
300
310
Mea
n L
and
Surf
ace
Tem
pera
ture
(K
)
Rize
Fig. 8 Comparison for theland surface temperaturebetween the LSTANN,LSTB-L and measuredvalues (testing stations)
J Indian Soc Remote Sens (September 2012) 40(3):399–409 407
Author's personal copy
References
Aires, F., Chédin, A., Scott, N. A., & Rossow, W. B. (2002). Aregularized neural net approach for retrieval of atmosphericand surface temperature with the IASI instrument. Journal ofApplied Meteorology, 41, 144–159.
Bechrakis, D. A., & Sparis, P. D. (2004). Correlation of windspeed between neighboring measuring stations. IEEETransactions on Energy Conversion, 19, 400–406.
Becker, F. (1987). The impact of spectral emissivity on themeasurement of land surface temperature from a satellite.International Journal of Remote Sensing, 11, 369–394.
Becker, F., & Li, Z. L. (1990). Towards a local split windowmethod over land surface. International Journal of RemoteSensing, 11, 369–393.
Becker, F., & Li, Z. L. (1995). Surface temperature andemissivity at various scales: Definition, measurement andrelated problems. Remote Sensing of Environment, 12,225–253.
Bhattacharya, B. K., & Dadhwal, V. K. (2003). Retrieval andvalidation of land surface temperature (LST) from NOAAAVHRR thermal images of Gujarat, India. InternationalJournal of Remote Sensing, 24, 1197–1206.
Çam, E., Arcaklıoğlu, E., Çavusoğlu, A., & Akbıyık, B. (2005). Aclassification mechanism for determining average windspeed and power in several regions of Turkey using artificialneural networks. Renewable Energy, 30, 227–239.
Caselles, V., Coll, C., & Valor, E. (1997). Land surfaceemissivity and temperature determination in the wholeHAPES- Sahel area from AVHRR data. InternationalJournal of Remote Sensing, 18, 1009–1027.
Chrysoulakis, N., Proedrou, M., & Cartalis, C. (2001).Variations and trends in annual and seasonal means ofprecipitable water in Greece as deduced from radiosondemeasurements. Environmental Toxicology and Chemistry,84(1–4), 1–6.
Cigizoğlu, H. K., & Alp, M. (2006). Generalized regressionneural network in modelling river sediment yield.Advances in Engineering Software, 37, 63–68.
Coll, C., & Caselles, V. (1997). A split-window algorithm forland surfaces temperature from Advanced Very High-Resolution Radiometer data: validation and algorithmcomparison. Journal of Geophysical Research, 102,16697–16713.
Coll, C., Sobrino, J. A., & Valor, E. (1994). On theatmospheric dependence of the split-window equationfor land surface temperature. International Journal ofRemote Sensing, 15, 105.
Dash, P., Gottsche, F. M., Olesen, F. S., & Fischer, H. (2002).Land surface temperature and emissivity estimation frompassive sensor data: Theory and practice-current trends.International Journal of Remote Sensing, 23(13), 2563–2594.
Dinçer, I., Dilmaç, Ş., Ture, I. E., & Edin, M. (1996). A simpletechnique for estimating solar radiation parameters andits application for Gebze. Energy Conversion andManagement, 37(2), 183–198.
Franca, G. B., & Cracknell, A. P. (1994). Retrieval of land andsea surface temperature using NOAA-11 AVHRR data innorth-eastern Brazil. International Journal of RemoteSensing, 15, 1695–1712.
Gardner, M. W., & Dorling, S. R. (1998). Artificial neuralnetworks (the multiplayer perceptron)—a review ofapplications in the atmospheric sciences. AtmosphericEnvironment, 32, 2627–2636.
Govindaraju, R. S. (2000a). Artificial neural network inhydrology, I: preliminary concepts. Journal of HydrologicEngineering, 5(2), 115–123.
Govindaraju, R. S. (2000b). Artificial neural network inhydrology, II: hydrological applications. Journal ofHydrologic Engineering, 5(2), 124–137.
Kalogirou, S. A. (2000). Applications of artificial neural-networks for energy systems. Applied Energy, 67, 17–35.
Kalogirou, S. A. (2001). Artificial neural networks in renew-able energy systems applications: a review. Renewable &Sustainable Energy Reviews, 5, 373–401.
Li, Z. L., & Becker, F. (1993). Feasibility of land surfacetemperature and emissivity determination from AVHRRdata. Remote Sensing of Environment, 43, 67–85.
Mohandes, M. A., Halawani, T. O., Rehman, S., & Hussain, A.A. (2004). Support vector machines for wind speedprediction. Renewable Energy, 29, 939–947.
Prata, A. J. (1993). Land surface temperatures derived from theadvanced very high resolution radiometer and thealong-track scanning radiometer. I. Theory. Journal ofGeophysical Research, 98, 16689–16702.
Prata, A. J. (1994). Land surface temperatures derived from theAdvanced Very High Resolution Radiometer and thealong-track scanning radiometer. 2. Experimental resultsand validation of AVHRR algorithms. Journal ofGeophysical Research, 99, 13025–13058.
Price, J. C. (1984). Land surface temperature measurementsfrom the split window channels of the NOAA-7/AVHRR.Journal of Geophysical Research, 89, 7231–7237.
Qin, Z., & Karnieli, A. (1999). Progress in the remote sensingof land surface temperature and ground emissivity usingNOAA-AVHRR data. International journal of remotesensing, 20(12), 2367–2393.
Sabins, F. F. (1997). Remote Sensing: Principles and Interpre-tation (3rd ed.). NewYork: W.H. Freeman.
Schmugge, T., Hook, S. J., & Coll, C. (1998). Recoveringsurface temperature and emissivity from thermal infraredmultispectral data. Remote Sensing of Environment, 65,121–131.
Sobrino, J. A., Li, Z. L., Stoll, M. P., & Becker, F. (1994).Improvements in the split window technique for landsurface temperature determination. IEEE Transactions onGeoscience and Remote Sensing, 32, 243–253.
Sobrino, J. A., Li, Z. L., Stoll, M. P., & Becker, F. (1996).Multi-channel and multi-angle algorithms for estimat-ing sea and land surface temperature with ATSR data.International Journal of Remote Sensing, 17, 2089–2114.
Speckt, D. F. (1991). A generalized regression neural network.IEEE Transactions on Neural Networks, 2, 568–576.
408 J Indian Soc Remote Sens (September 2012) 40(3):399–409
Author's personal copy

Vidal, A. (1991). Atmospheric and emissivity correction of landsurface temperature measured from satellite using groundmeasurements or satellite data. International Journal ofRemote Sensing, 12, 2449–2460.
Vogt, J. V. (1996). Land surface temperature retrieval fromNOAA-AVHRR data. In G. D’Souza, A. S. Belward,& J.-P. Malingreau (Eds.), Advances in the Use of
NOAA-AVHRR data for Land Applications (pp. 125–151). Dordrecht, The Netherlands pp: Kluwer AcademicPublishers.
Wan, Z., & Dozier, J. (1996). A generalized split-windowsalgorithm for retrieving land surface temperature fromspace. IEEE Transactions on Geoscience and RemoteSensing, 34, 892–905.
J Indian Soc Remote Sens (September 2012) 40(3):399–409 409
Author's personal copy