international journal of remote sensing modelling …cnspci/references/salvaggio1990.pdf ·...
TRANSCRIPT

PLEASE SCROLL DOWN FOR ARTICLE
This article was downloaded by: [Rochester Institute of Technology]On: 9 July 2010Access details: Access Details: [subscription number 915935561]Publisher Taylor & FrancisInforma Ltd Registered in England and Wales Registered Number: 1072954 Registered office: Mortimer House, 37-41 Mortimer Street, London W1T 3JH, UK
International Journal of Remote SensingPublication details, including instructions for authors and subscription information:http://www.informaworld.com/smpp/title~content=t713722504
Modelling scanning and staring imaging infrared sensors using a staticperformance modelC. Salvaggioab; S. Israela; Y. T. Kanga; M. L. Bartholomewa; D. M. Pokrzywkaa; J. S. Davisc; M. J. Duggina
a College of Environmental Science and Forestry, State University of New York, Syracuse, New York,U.S.A b Digital Imaging and Remote Sensing Laboratory, Center for Imaging Science, RochesterInstitute of Technology, Rochester, New York, U.S.A c Ball Aerospace Systems Group, SystemsEngineering Division, Albuquerque, New Mexico, U.S.A
To cite this Article Salvaggio, C. , Israel, S. , Kang, Y. T. , Bartholomew, M. L. , Pokrzywka, D. M. , Davis, J. S. and Duggin,M. J.(1990) 'Modelling scanning and staring imaging infrared sensors using a static performance model', InternationalJournal of Remote Sensing, 11: 12, 2311 — 2328To link to this Article: DOI: 10.1080/01431169008955177URL: http://dx.doi.org/10.1080/01431169008955177
Full terms and conditions of use: http://www.informaworld.com/terms-and-conditions-of-access.pdf
This article may be used for research, teaching and private study purposes. Any substantial orsystematic reproduction, re-distribution, re-selling, loan or sub-licensing, systematic supply ordistribution in any form to anyone is expressly forbidden.
The publisher does not give any warranty express or implied or make any representation that the contentswill be complete or accurate or up to date. The accuracy of any instructions, formulae and drug dosesshould be independently verified with primary sources. The publisher shall not be liable for any loss,actions, claims, proceedings, demand or costs or damages whatsoever or howsoever caused arising directlyor indirectly in connection with or arising out of the use of this material.
INT. J. REMOTE SENSING, 1990, VOL. II, NO. 12, 2311-2328
Modelling scanning and staring imaging infrared sensors using a staticperformance model
c. SALVAGGIOtt, s. ISRAEq, Y. T. KANGt,M. L. BARTHOLOMEWt, D. M. POKRZYWKAt,J. s. DAVIS§ and M. J. DUGGINt
t College of Environmental Scienceand Forestry, State University of New York,308 Bray Hall, Syracuse, New York 13210, U.S.A.t Digital Imaging and Remote Sensing Laboratory, Center for Imaging Science,Rochester Institute of Technology, One Lomb Memorial Drive, Rochester, NewYork 14623, U.S.A.§Ball Aerospace Systems Group, Systems Engineering Division, 2901 JuanTabo, N.E., Suite 235, Albuquerque, New Mexico 87112, U.S.A.
(Received 12 May 1989; in final form 11 October 1989)
Abstract. The introduction of mathematical modelling concepts to assess sensorperformance is a necessary part of the graduate curriculum in remote sensingscience. In this way, the concepts of sensor design and performance assessmentunder various imagingconditions can be best understood. In this paper, a graduateclass project is described in which a static performance model was used to predictthe minimum detectable temperature performance, the minimum resolvabletemperature performance and the recognition performance of scanning and staringfocal plane array (FPA) infrared imaging sensors with three different detectormaterials. Different seasonal, atmospheric, cold shieldangle, target-to-backgroundtemperature contrast, bandpass and noise parameters were considered. Suchstudies are highly labour-intensive and (as in this case) may involveseveral hundredmodelling runs. However, such projects provide a 'real world' experience for thosewho will design, use and analyse the data from imaging sensors. We present thispaper as an approach to providing an in-depth understanding of sensor designconcepts and limitations.
I. IntroductionThe analysis of image forming systems has been studied by many workers. Some
have been interested in the number of line pairs/rum necessary to discriminate militarytargets from background for given signal-to-clutter (SCR) ratios (e.g. Weathersby andSchmieder 1984). Analytical studies have been performed by several groups. The workofJohnson (1958) was useful but dealt with image intensifiers. This work was extendedby Ratches (1976) in developing the Night Vision Laboratories Static PerformanceModel (NVLSPM) for thermal imaging systems. The NVLSPM is for thermal imagingdevices where performance is defined for static (non-time varying) parameters controlling detection, recognition and identification for a given system, atmosphere and targetas a function of range. The target, atmosphere, device and observer behaviour aredescribed by equations which result in prediction of system noise equivalent temperature difference (NE~T), minimum resolvable temperature difference (MRT) andminimum detectable temperature difference (MDT). Detection and recognition arethen based on these quantities through algorithms using the required signal-to-noiseratio (SNR) and empirical resolution criteria. The NVLSPM does not, however,
0143-1161/90 $3.00 © 1990 Taylor & Francis Ltd
Downloaded By: [Rochester Institute of Technology] At: 12:57 9 July 2010

2312 C. Salvaggio et al.
consider focal plane array (FPA) charged-coupled devices (CCD) in the form proposedby Ratches et al. (1975) and Ratches (1976). It is designed for night vision devices, firstgeneration FURs, etc. The NVLSPM output assumes a TV monitor, viewed in realtime by an operator.
Discussion of models used to specify similar types of thermal imagers is set out in aguide to preparing specifications for thermal imaging systems by a tri-service workinggroup under the sponsorship of the Joint Technical Coordinating Group-ThermalImaging Systems (JTCG-TIS). This is reported by Wood et al. (1976). Overington(1976, 1982) has done a great deal of work on the psychophysiology and neurophysiology of human vision. He has put together a set ofwidely applicable conceptual modelsof photopic visual performance. This suite ofmodels is called ORACLE and the modelhas been implemented not only on mainframe computers, but also on desk-tops(Overington and Greenway 1987). Performance estimates have been consideredtheoretically (Emmons 1977, Jamieson 1976). Studies have been reported of optimization of the spectral (electromagnetic wavelength) bandpasses and peak wavelengths forinfrared system optimum performance (Eldering 1964, Longshore et al. 1976).Considerations have been given to optimizing images obtained from sensing devices.For example, Fried (1981) and Fried and Williams (1977) have considered means ofcorrecting a sequence of images in order to enhance a target which may be moving,using a method known as pseudoregistration. Fried and Williams (1977) haveconsidered clutter leakage approximations for staring mosaic sensors with simultaneous line-of-sight (LOS) drift and jitter. Such approximations are taken to applywhen LOS motion is a fraction of a pixel-per-frame time. These concepts have alsobeen pursued by Barry and Klop (1982) and Patterson et al. (1986). Overington andGreenway (1987) discuss a method of edge detection, based upon the human eye,which is capable of enabling sub-pixel (i.e. sub-resolution) detection accuracy, wherethe receptors are hexagonal in shape of the focal plane.
Borg et al. (1986) describe an updated version of the Night Vision LaboratoriesNVLSPM. The updated version was written for the US Army Missile Command(MICOM) and is called MI2SPM (MICOM Infrared Imaging Systems PerformanceModel). We shall concentrate here upon the sensor model, since this model has beendeveloped for FPAs as well as scanning sensors.
The sensor model must account for sensitivity and resolution of the system.Sensitivity is related to noise. Sensor noise can be quantified by noise equivalent power(NEP) and NE.1.T from mean background. The preferred measure is NE.1.T. NE.1.Tand the modulation transfer function (MTF) combine to determine the MDT or theMRT. The MDT or MRTequations are used to represent the thermal imaging system,depending upon whether the situation involves a resolved target image, allowing theoperator to recognize target features amidst background clutter (where MRT is thecriterion) or whether the detection of an unresolved hot spot against a uniformbackground is required, in which case MDT is the criterion. The MDT and MRTcalculations in the MI2SPM follow the same principles as in the NVLSPM. For FPAs,the user can specify the cold shield angle, quantum efficiency and detector mode(photovoltaic or photoconductive) at the keyboard. The code calculates an ideal D*( T,f) and scales it for cold shield angle, quantum efficiency and the detector mode.
In this paper, we describe a graduate class experiment in which the MI2SPM codewas used to compare scanning and staring sensors with different detector materials. Weshall describe the model according to the major modules into which the code is divided.Modelling studies of this kind involve several hundred model runs and provide an
Downloaded By: [Rochester Institute of Technology] At: 12:57 9 July 2010

Static performance modelling of infrared sensors 2313
excellent opportunity for advanced-level graduate students in remote sensing to obtainin-depth understanding of the factors controlling sensor design and performance.
2. Use of the MI2SPMThe target module allows the user to specify a scene consistmg of a simple
rectangular target of uniform temperature with an average difference in temperaturefrom a constant temperature background. The radiance from this scene is thenpropagated along a horizontal path through an assumed homogeneous atmosphere.The atmosphere is defined according to the major aerosol composition (size anddistribution) by three specified atmospheric input values; air temperature, relativehumidity, and visibility. Here the absorbing atmosphere is defined by the temperatureand relative humidity and the scattering atmosphere by the visibility, a functionprimarily of aerosol number density. A scattering and absorbing transmittanceparameter are separately computed for the defined atmosphere and the totalatmospheric transmittance is determined as the product of these separate components.The baseline atmospheric model used for these predictions is TABLOW - a modifiedversion of the Air Force Geophysics Laboratories LOWTRAN 6 transmittance/pathradiance code. The NVLSPM operates along a horizontal path, which eliminates someinaccuracies inherent in the layering concept present in the LOWTRAN 6 code. Itshould be noted that LOWTRAN 6 and therefore TABLOW are single scatteringmodels. This infers that as energy is scattered from the beam between the target and thesensor, energy is lost. No energy is allowed to be scattered back into the beam fromadjacent energy paths. However, empirical approximations within TABLOW doprovide improvement over LOWTRAN 6 in the calculation of path radiance.Furthermore, no time-dependent variations in atmospheric transmission, target-tobackground radiance values or dispositions are considered. For this reason, the modelis referred to as a static performance model.
Once the contrast has been attenuated by the atmosphere by source attenuationand by the addition of path radiance, the model predicts the transfer and noisecharacteristics of the sensing system under consideration. The current version of theMI2SPM code will allow either a conventional scanning sensor or an FPA CCO to besimulated. The model predicts transfer characteristics according to an evaluation ofthe MTF functions ofthe following system components; atmosphere, line-of-sitejitter,optics, detector, system electronics, display, and/or the observer's eye. These components are accounted for when the sensing system is either a scanner or a FPA CCO. Inaddition to these individual MTFs mentioned, in the case ofa FPA CCO the followingcomponent MTFs are also included; FPA discrete sampling, charge transfer efficiency,over-exposure, and image reconstruction. These components are cascaded together foreach spatial frequency according to
MTF,y"em = MTFatmo*MTFl.o.,*MTFoptics*...*MTFeye
This cascaded MTF function is used to define the effect of radiometric contrasttransfer efficiency through the specified system for each spatial frequency.
The noise characteristics of the sensing system are defined by the NE~T of thedetector. NE~T is defined as the peak root-mean-squared (r.m.s) noise for a particularelectronic bandpass. This noise is due to excitation of electrons into the conductionband of the semiconductor used for the detector due to thermal induced vibrations atthe molecular level. A noise power spectrum for the particular detector material canalso be defined as a function of frequency. The limiting noise for a sensing system can
Downloaded By: [Rochester Institute of Technology] At: 12:57 9 July 2010

2314 c. Salvaggio et at.
be specified as detector noise, shot noise or white noise. This choice will be made as afunction of the material from which the detector is made and the conditions of theengagement being analysed.
Sensor parameters such as focallength,f-number, optical transmission, blur circlediameter, instantaneous field-of-view (lFOV) in both the x- and y-directions forindividual detectors as well as the entire array (for linear arrays and FPAs), array size,peak detectivity (D*( T,f)), spectral distribution of D* ( T,f), cold shield angle, framerate, overscan ratio and scan efficiency need to be defined for a scanning system. In thecase ofan FPA, the last three parameters above can be excluded and the following mustbe defined; IFOV of the array in the x- and y-directions, x and y image reconstructionfilter frequencies to allow a continuous image to be reconstructed from the sampledimage, single detector charge transfer efficiency, the number of transfer gates, and thedetector readout time. These sensor parameters allow the model to predict the signallevel produced for a static, staring system. A wide range of detector materials can bemodelled provided that all the necessary detector specific parameters are definable.
Once the energy transfer is completed from the target through the atmosphere andsensor, the model will predict the minimum detectable temperature and minimumresolvable temperature as a function of target size and spatial frequency, respectively.MDT for a system is defined as the minimum temperature difference that is necessaryfor an observer (or electronic device) to be able to perceive a thermal target against itsbackground: different size square or round targets have different associated MDTvalues. This quantity represents the threshold detection capability ofa system. MRT isdefined as the minimum difference in temperature needed to resolve a standard 4-bartarget with a 7: I aspect ratio oriented perpendicular to the scan line or to either axis ofan FPA CCD.
We shall first consider the detection situation where the target is distant, but hot,such as an aircraft against a sky background. Here we use MDT as the detectioncriterion. The signal-to-noise ratio is calculated using the MDT equation and varieswith the range of the target. The relationship between the signal-to-noise ratio and theprobability of detection is obtained from empirical data, such as that of Rosell andWilson (1974). A relationship between range and probability of detection is thencalculated for 'hot-spot' detection, in which the target is hot enough to make one IFOVdifferent from the background. Under these conditions, detection is a function ofsignal-to-noise ratio and not the sensor's ground resolution.
A second situation is also considered, where the observer needs a small amount ofresolution to see edges or internal features to distinguish the target from backgroundclutter. Here, MRT is the criterion for target detection used to calculate the signal-tonoise ratio. The range is determined for various levels of probability ofdetection in thesame manner as for the case of 'hot-spot' detection.
Recognition is a higher-order discrimination problem: it is defined as the ability toidentify specific objects in a class of similar objects. The difficulty encountered inrecognition varies with the level ofdetail needed to make the above identifications. TheM12SPM code uses the Johnson (1958) criteria as a means of measuring recognitionperformance. A bar pattern is considered, based on the target's critical dimension anddifference in temperature from the background. The number of cycles to be resolvedacross a target's critical dimension are computed and compared with the Johnsoncriteria, so as to determine recognition probability. The 'critical' dimension is generallytaken to be the minimum dimension of a protected image of the target as seen by theobserver. Since a 'cycle' corresponds to a resolved dark element and an adjacent bright
Downloaded By: [Rochester Institute of Technology] At: 12:57 9 July 2010

Static performance modelling of infrared sensors 2315
element, being able to resolve, for example, six elements across the target's criticaldimension (the Johnson criterion for 50 per cent probability of recognition) corresponds to three cycles across the target's critical angular subtense.
Recognition probability varies with range and atmospheric transmission.Transmission effects will reduce the overall scene contrast and therefore reduce thepeak-to-peak radiance variations between the bars, as well as reducing their angularseparation, therefore reducing the probability of recognition. As with detection.performance, recognition performance is calculated using the model in the X-, y- and45-degree orientation directions of the sensor with the target.
The following section defines the target-sensor scenarios which were modelled forthis research. Two midwave infrared detector materials, indium antimonide, JnSb (aphotodetector) and plantinum silicide, PtSi (a Schottky-barrier diode), were usedalong with a thermal infrared detector material, mercury--eadmium-teluride, HgCdTe.The relative performance of these detector materials in scanning and staring (FPA)sensors will be presented and compared in the results section.
3. Experimental approachEvaluations were to be made of three detector materials; JnSb and PtSi in the
midwave infrared (MWJR, 3·5-4·3JIm)and HgCdTe in the longwave infrared (LWJR,10·0-12'5 JIm). These detector materials were used in the following sensor configurrations; JnSb in a scanner with a 16 element bank of detectors oriented perpendicularto the scan direction and also as a 128 x 128 element staring FPA; PtSi as a staring128 x 128 element FPA; and HgCd'Te as both a scanner with a 16-element bank ofdetectors oriented perpendicular to the scan direction and as a staring 128 x 128element FPA. Each of the five sensor configurations were presented with an identicalseries of imaging scenarios and their detection and recognition performances evaluatedand compared. The imaging scenarios included a range of values for the followingparameters; season, aerosol composition, target-to-background temperature difference, NE,1.T for the particular sensor, cold shield angle and sensor bandpass.
The input deck for each run contains numerous card images for the PC-basedversion of the MI2SPM used here (Davis, personal communication, 1988). All inputdecks used in this study are available from the authors upon request. Each input cardimage begins with a four-letter descriptor indicating the type of information defined.Following the four-letter descriptor, the rest of the card is divided into a number offields. Each field specifies an input parameter for the program. The input deck is notlimited to one run: many different scenarios can be placed in a batch mode withoutinteractive user interface. The program contains default values for most input deckparameters. The default values can be accepted if the user has no information referringto the particular sensor/detector combination being modelled (these default valuescorrespond to a HgCdTe detector). 'Typical' detector data was obtained from theliterature and from Borg (personal communication, 1988).
For each of the three detectors and sensor types, the target size, backgroundtemperature, visibility and the latitude ofimaging were held constant. The independentvariables were season, aerosol composition, target-to-background temperature difference, NE,1.T, cold shield angle, and bandpass in terms of a lower and upperwavelength. Range was computed for a 95 per cent or greater probability of detectionor recognition (conservative and optimistic cases were both considered).
The target simulated a T-65 tank viewed from the side; approximated by a 6·5 by2·5 m rectangular target of constant temperature. The background temperature was set
Downloaded By: [Rochester Institute of Technology] At: 12:57 9 July 2010
2316 C. Salvaggio et al.
at 20°C. The imaging occurred in a mid-latitude environment with a visibility of 13 km.The seasonal variation was limited to summer and winter conditions while the aerosolcomposition was limited to either rural or urban. The seasonal and aerosol values areinput parameters for TABLOW which computes environmental specifications basedon a collection of empirical data. The target-to-background temperature differenceallowed the probability of a target being distinguishable from its background to beobserved. The observed radiance at the sensor for a target and its background dependsupon the average temperature field present in the ground resolution cell. The values fortarget-to-background temperature difference were set at 2·5°C, 5°C, 10°C, and 15°C.Cold shield angle was taken to be 30° or the minimum angle subtended by the detectorarray for each sensing system. Only one bandpass was modelled in the thermal infraredregion, 10·0 to 12·5Ilm. In the MWIR region, the radiation observed by a sensor isboth reflected and emitted. The 3·5 to 4·31lm bandpass was treated as a whole as well astwo sub-intervals, 3·5 to 3·91lm and 3·9 to 4·31lm. The band separation was carried outin order to evaluate split band performance differences.
The comparison of the effects of each independent variable was carried out asfollows. For each sensing system, the mean of the four dependent range variablesmentioned previously was computed as a function ofeach of the independent imagingparameters, season, aerosol, etc., for each bandpass. The difference in these meanvalues for each dependent variable was checked for statistical significance at aconfidence level of 0·05. For the case where the independent variable took on only twovalues, a two-sample student's r-test was used while for cases where the independentvariables took on three or more levels, a two-way analysis of variance was employed.These results are presented graphically in the following section.
4. ResultsThe MI2SPM infrared modelling code was executed under a number of different
imaging conditions. Three detector materials; InSb, PtSi and HgCdTe were eachmodelled in a 128 x 128 element staring FPA sensor. InSb and HgCdTe were alsomodelled in a scanning device.
In order to perform a comparison of the detector materials and sensing configurations, six independent variables were modified in a systematic process. Theseindependent variables included target-to-background temperature difference (~T),
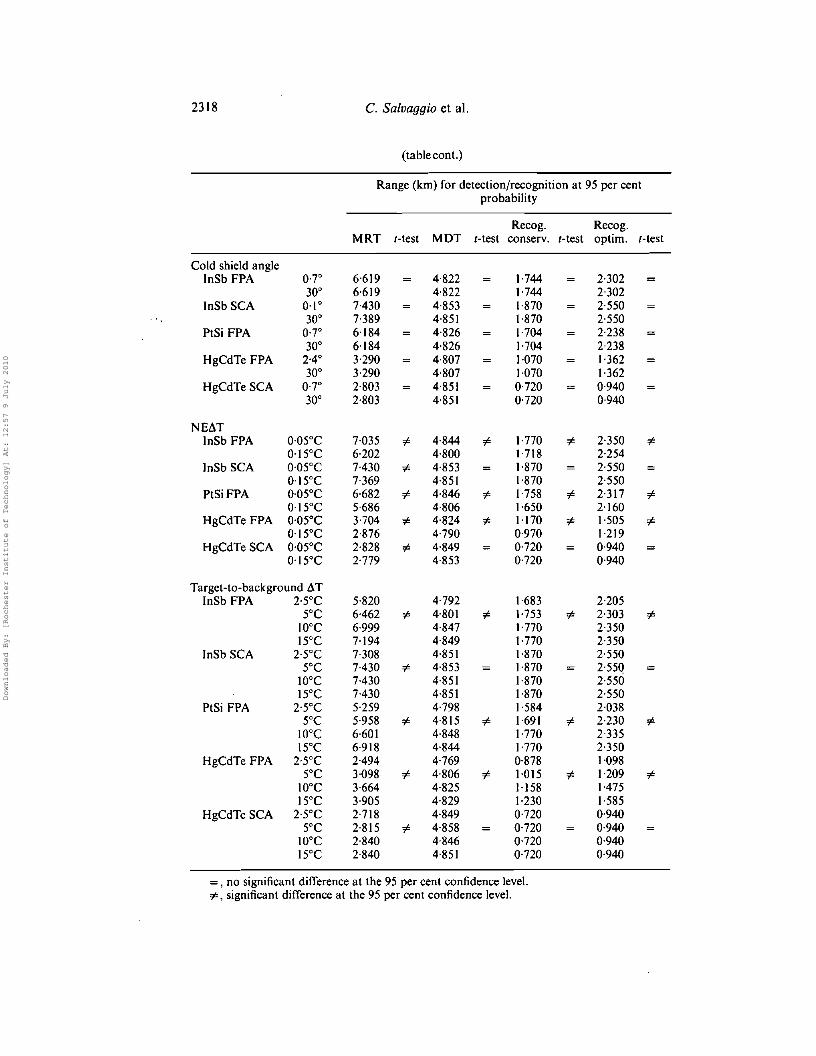
NE~T, season, aerosol composition, cold shield angle and bandpass (in the case of theInSb and PtSi detector materials). The effect of these six parameters was observed onfour dependent variables. These quantities were the maximum 'ranges allowable tomaintain a 95 per cent confidence level of the near field-of-view MRT, and MDT andboth conservative and optimistic recognition performance. -
The manner in which this data was analysed involved determination of the mean ofeach of the dependent variables (ranges) as a function of the discrete values of theindependent variables. For example, the mean values for the four range variables wasfound while the season variable was set as summer and also as winter. The averaginginvolved many different values of range for which there was a number of differentcombinations of the remaining five independent values. This will tend to indicate whateffect, if any, the parameter held constant presented to these range variables. In thecase where the independent variable was bi-valued, a two-sample student's r-test wasused to test for equality of the mean values at a confidence level of0·95 (0( =0·05). In thecases where the independent variable took on more than two values (e.g. for ~ Tandbandpass), a two-way analysis of variance (ANOVA) was used to test ifall the means
Downloaded By: [Rochester Institute of Technology] At: 12:57 9 July 2010

Static performance modelling of infrared sensors 23\7
were equal (note that failure of this test means that at least one mean value was notequal). The resulting means and statistical test results appear in the table. It shouldbe noticed that the column labelled t-test states the results of either the r-test or two-way ANOVA, whichever was applicable for the particular independent variable. An'=' sign indicates that no significant difference due to the independent variableexisted at a 90 per cent confidence level while a '#' sign indicates that the variable didhave a significant effect.
Summary of range data obtained at 95 per cent probability of detection/recognition for thefollowing scenario parameters.
Range (km) for detection/recognition at 95 per centprobability
Recog. Recog.MRT r-test MDT r-test conserv. r-test optim. r-test
SeasonInSb FPA Summer 6·568 4·821 1·743 2·302
Winter 6·669 4·823 1·745 2·302InSb SCA Summer 7·393 4·851 1·870 2·550
Winter 70406 4·852 1·870 2·550PtSi FPA Summer 6·117 4·826 1·700 2·23\
Winter 6·250 4·827 1·708 2·245HgCdTe FPA Summer 2·988 "# 4·829 "# 1·050 1·316
Winter 3·592 4·785 1·090 1·407HgCdTeSCA Summer 2·779 "# 4·847 0·720 0·940
Winter 2·828 4·855 0·720 0·940
AerosolInSb FPA Urban 6·604 4·824 \·744 2·302
Rural 6·633 4·821 \·744 2·302InSb SCA Urban 7·393 4·850 1·870 2·550
Rural 70406 4·854 1·870 2·550PtSi FPA Urban 6·174 4·826 1·704 2·236
Rural 6·194 4·826 1·704 2·240HgCdTe FPA Urban 3·276 4·808 ',070 1·362
Rural B04 4·807 1·070 1·362HgCdTe SCA Urban 2·803 4·850 0·720 0·940
Rural 2-803 4·852 0·720 0·940
BandpassInSb FPA 3'5-3-9 I'm 6·790 4·822 1·754 2·326
3·9-4·3 I'm 6·424 "# 4·819 1·732 "# 2·278 "#3·5-4·3 I'm 6·642 4·825 1·745 2·303
InSb SCA 3'5-3'91,m 70418 4·849 1·870 2·5503·9-4,3 I'm 7·381 "# 4-854 1·870 2·2503,5-4·3 I'm ? ? ? ?
PtSi FPA 3'5-3-9 I'm 6·382 4·827 1·723 2·2653·9-4·3 I'm 5·948 "# 4·824 1·684 "# 2·208 "#3'5-4,3 I'm 6·223 4·828 1·704 2·243
HgCdTe FPA IQ-12'5I'm 3·290 4·807 1·070 1·362HgCdTeSCA IQ-12·5I'm 2·803 4·851 0·720 0·940
=, no significant difference at the 95 per cent confidence level.if', significant difference at the 95 per cent confidence level.
Downloaded By: [Rochester Institute of Technology] At: 12:57 9 July 2010
2318 C. Salvaggio et al.
(table cont.)
Range (km) for detection/recognition at 95 per centprobability
Recog. Recog.MRT I-test MDT r-test conserv. r-test optim. r-test
Cold shield angleInSb FPA 0·7' 6·619 4·822 1·744 2-302
30' 6·619 4·822 1·744 2-302InSb SCA 0·1' 7-430 4·853 1·870 2·550
30' 7·389 4·851 1·870 2·550PtSi FPA 0·7' 6·184 4·826 1·704 2·238
30' 6·184 4·826 1·704 2·238HgCdTe FPA 2·4' 3·290 4·807 1·070 1·362
30' 3·290 4·807 1·070 1·362HgCdTeSCA 0·7' 2·803 4·851 0·720 0·940
30' 2·803 4·851 0·720 0·940
NEIlTInSb FPA 0'05'C 7·035 #- 4·844 #- 1·770 #- 2·350 #-
0'15'C 6·202 4·800 ]·718 2·254InSb SCA 0'05'C 7·430 #- 4·853 1·870 2·550
0'15'C 7·369 4·851 1·870 2·550PtSiFPA 0'05'C 6·682 #- 4·846 #- 1·758 #- 2·317 #-
0'15'C 5·686 4·806 1·650 2·160HgCdTe FPA 0'05'C 3·704 #- 4·824 #- 1·170 #- 1·505 #-
0'15'C 2-876 4·790 0·970 1·219HgCdTeSCA 0'05'C 2·828 #- 4·849 0·720 0·940
0'15'C 2·779 4·853 0·720 0·940
Target-to-background llTInSb FPA 2·5'C 5-820 4·792 1·683 2·205
5'C 6·462 #- 4·801 #- 1·753 #- 2·303 #-10'C 6·999 4·847 ],770 2·35015'C 7·194 4·849 1·770 2·350
InSb SCA 2·5'C 7·308 4·851 1·870 2·5505'C 7-430 #- 4·853 1·870 2'55<1
IO'C 7-430 4·851 1·870 2·55015'C 7-430 4·851 1·870 2·550
PtSi FPA 2·5'C 5·259 4·798 1·584 2·0385'C 5·958 #- 4-815 #- 1·691 #- 2·230 #-
IO'C 6·601 4·848 1·770 2·33515'C 6·918 4·844 1·770 2·350
HgCdTe FPA 2·5'C 2·494 4·769 0·878 1·0985'C 3·098 #- 4·806 #- 1-015 #- 1·209 #-
10'C 3·664 4·825 1,]58 1·47515'C 30905 4·829 1·230 1·585
HgCdTe SCA 2·5'C 2·718 4·849 0·720 0·9405'C 2-815 #- 4·858 0·720 0·940
IO'C 2·840 4·846 0·720 0·94015'C 2·840 4·851 0·720 0·940
=, no significant difference at the 95 per cent confidence level.#-, significant difference at the 95 per cent confidence level.
Downloaded By: [Rochester Institute of Technology] At: 12:57 9 July 2010
Static performance modelling of infrared sensors 2319
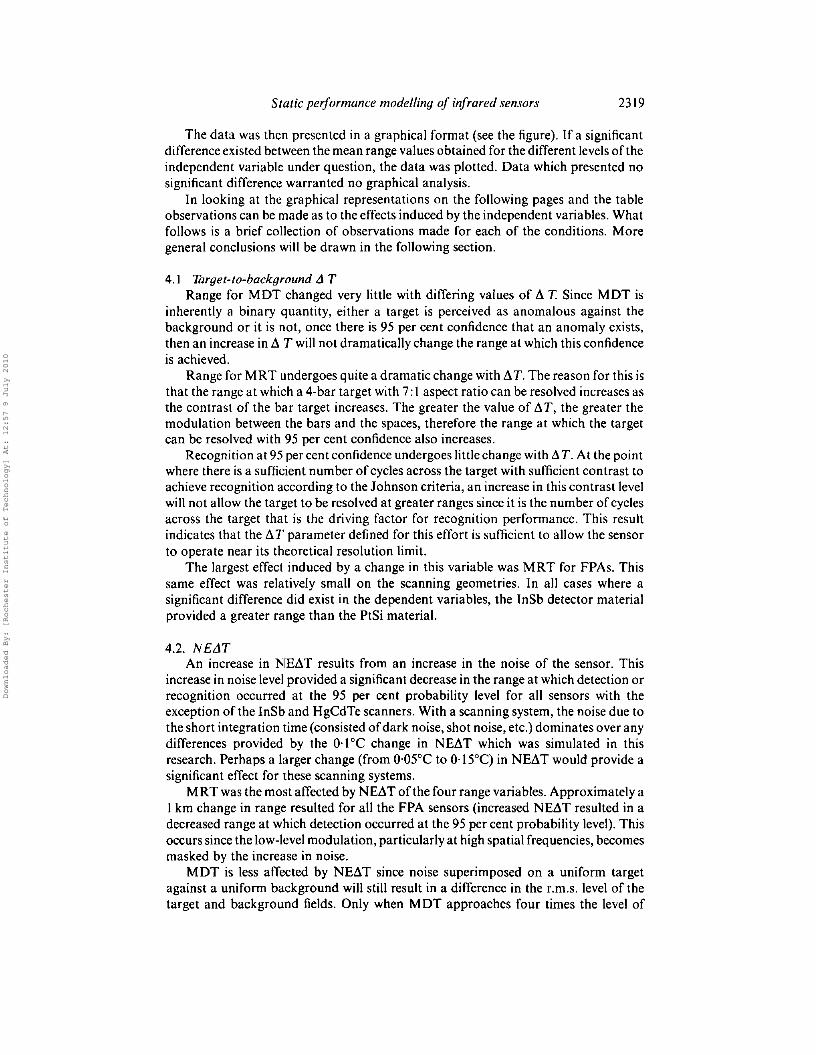
The data was then presented in a graphical format (see the figure). If a significantdifference existed between the mean range values obtained for the different levelsof theindependent variable under question, the data was plotted. Data which presented nosignificant difference warranted no graphical analysis.
In looking at the graphical representations on the following pages and the tableobservations can be made as to the effects induced by the independent variables. Whatfollows is a brief collection of observations made for each of the conditions. Moregeneral conclusions will be drawn in the following section.
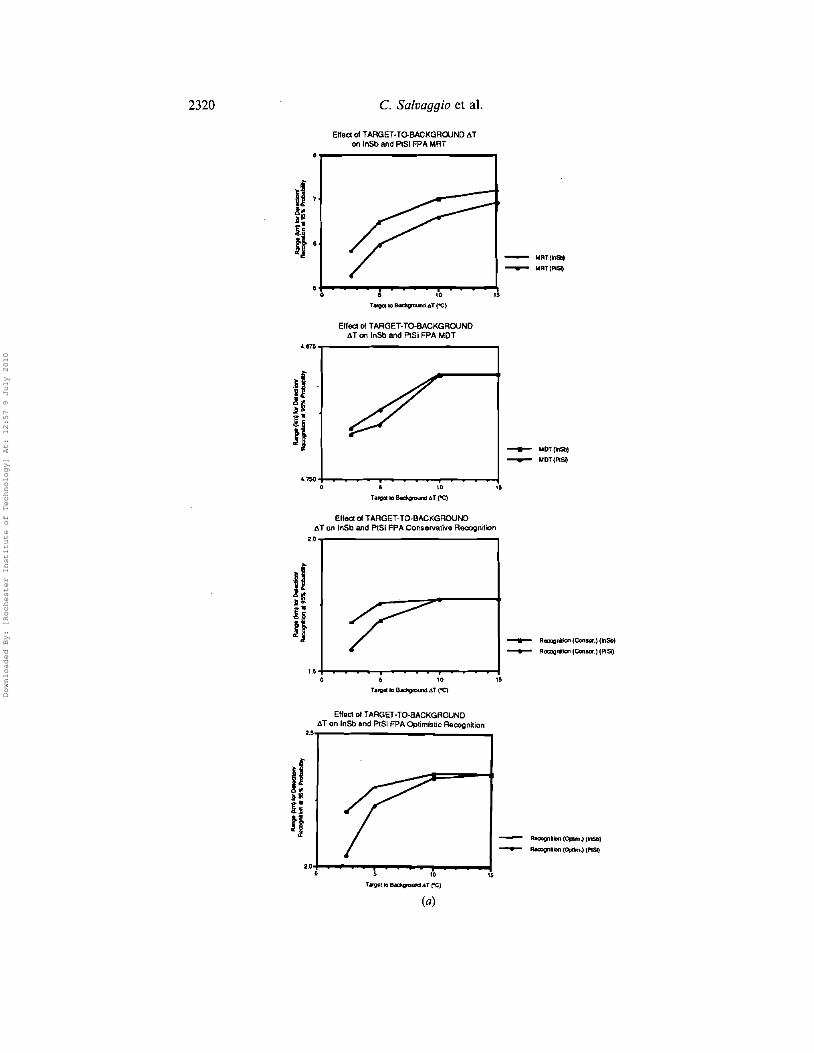
4.1 Tarqet-to-backqround A TRange for MDT changed very little with differing values of ~ T Since MDT is
inherently a binary quantity, either a target is perceived as anomalous against thebackground or it is not, once there is 95 per cent confidence that an anomaly exists,then an increase in ~ T will not dramatically change the range at which this confidenceis achieved.
Range for MRT undergoes quite a dramatic change with ~T. The reason for this isthat the range at which a 4-bar target with 7: I aspect ratio can be resolved increases asthe contrast of the bar target increases. The greater the value of ~T, the greater themodulation between the bars and the spaces, therefore the range at which the targetcan be resolved with 95 per cent confidence also increases.
Recognition at 95 per cent confidence undergoes little change with ~T. At the pointwhere there is a sufficient number ofcycles across the target with sufficient contrast toachieve recognition according to the Johnson criteria, an increase in this contrast levelwill not allow the target to be resolved at greater ranges since it is the number of cyclesacross the target that is the driving factor for recognition performance. This resultindicates that the ~T parameter defined for this effort is sufficient to allow the sensorto operate near its theoretical resolution limit.
The largest effect induced by a change in this variable was MRT for FPAs. Thissame effect was relatively small on the scanning geometries. In all cases where asignificant difference did exist in the dependent variables, the InSb detector materialprovided a greater range than the PtSi material.
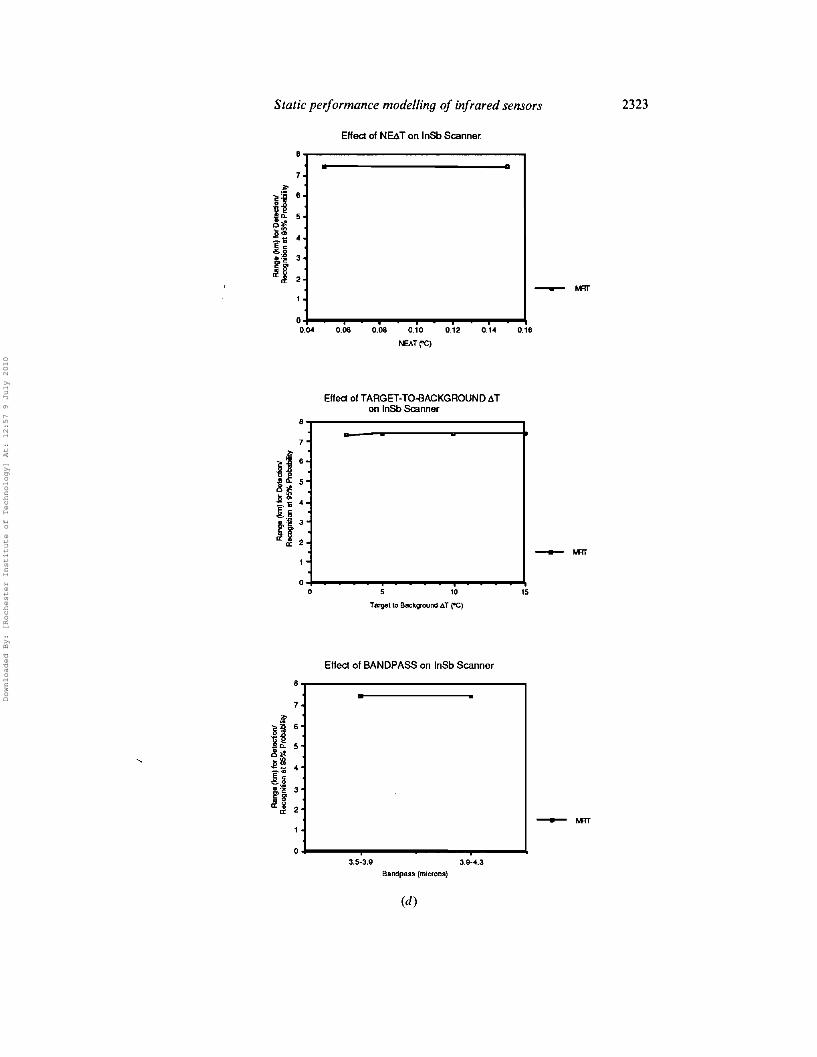
4.2. NE.1TAn increase in NE~T results from an increase in the noise of the sensor. This
increase in noise level provided a significant decrease in the range at which detection orrecognition occurred at the 95 per cent probability level for all sensors with theexception of the InSb and HgCdTe scanners. With a scanning system, the noise due tothe short integration time (consisted ofdark noise, shot noise, etc.) dominates over anydifferences provided by the O' I°C change in NE~T which was simulated in thisresearch. Perhaps a larger change (from O'05°C to O·15°q in NE~T would provide asignificant effect for these scanning systems.
MRTwas the most affected by NE~Tofthe four range variables. Approximately aI km change in range resulted for all the FPA sensors (increased NE~T resulted in adecreased range at which detection occurred at the 95 per cent probability level). Thisoccurs since the low-level modulation, particularly at high spatial frequencies, becomesmasked by the increase in noise.
MDT is less affected by NE~T since noise superimposed on a uniform targetagainst a uniform background will still result in a difference in the r.m.s. level of thetarget and background fields. Only when MDT approaches four times the level of
Downloaded By: [Rochester Institute of Technology] At: 12:57 9 July 2010
2320 C. Salvaggio et al.
Eft.", of TARGET·TQ.BACKGRClUND 6Ton InSb andPtSIFPAMAT
MRT(~
......... MRT{PlSl)
"• '0
T-V«IO~ATI"C)
'-!'o---.,...---~--~
Effect 01TARGET-lO-BACKGROUND~T on InSb and PlSi FPA MDT...1575,.. .....,
____ MOT(kISb)
........- "OT(AS)
Effecta TARGET-TO·BACKGROUNDo:\T on lnSb and PtSi FPA Conservali'f'e RecogniUon
2.0r--------------,
"
--.- Amagnilion (Con_.) (InSb)
--.- Fl~rilionlCon_·l(PlS)
Effectof TARGET-TO·BACKGROUND.6T on InSb and PtSi FPA Optimistic Recognition2.s,,... ....,
Reoognrlon (Oplm.) (.-.st.)
-.... Recx9JlJon (OJ:tlm.) [PIS/)
"2.ofO----.!"""'---.,.....__~
(a)
Downloaded By: [Rochester Institute of Technology] At: 12:57 9 July 2010

Static performance modelling of infrared sensors 2321
Effect of NE6.Ton In$band PtSI FPA MAT
MRT(InSb)
........ MRT(PlSl)
0.180.140.120."0."·o~...........,.-..,....- ...- .......- ...--~
Effoctof NEb.Ton loSb and PtSi FPAMDT
.."r--------------,
0.16o.oe 0.10 D.n (1.14rEbT ("Cj
0."
4,7!50+-_....,--....~....,__...,..~....,r-~_1
0.0"
Effect orN~T on InSb and PlSi FPA Conservative Recognition
• :::
-.- RooDgn!llon lCon_.) (~Sb)
--.- ReoDgnlb'lICon.,.) (PtSQ
0.18O.IZ 0.1.o.oe 0.10
NEATt'Cl0."
,+-~""'-T"""~r--r-......,............\0."
Effectof NEATon InSb and P!.Si FPA OptimisticReCOQnhlon
,,.-------------,
-..... Rocognllon (OpIlm.) ~)
.......- fWocIgnllOll(OpUm.) (PIS/)
0.160.06 0.08 0.10 0.12 0.14
NEAr("Cl
a....._ .........,,.........""""....._ ...._-10.04
(b)
Downloaded By: [Rochester Institute of Technology] At: 12:57 9 July 2010
2322 C. Salvaggio et al.
Effect of BANDPASS on InSb and PISi FPA MRT
7.0T""----------------,
______ MRT(InSb)
_ MAT(P1SQ
s.s-l----,--~--r_----.,....--l3.5·3.9 3.5-4.3
Bandpass (microns)
3.9-4.3
Effeclof BANDPASS on InSb andPISi FPA Conservative Recognition
2.0,------------------,
a•...
--- RlW:OgniUon (Conser.) (Instl)
-..- Recognition(Consaf.) (PlSJ)
1.5 .......----.,...--~---r-__--.......-____43.5-3.9 3.5-4.3
Bandpass (microns)
3.9-4.3
Effect of BANDPASS on InSb andPtSi FPA Oplimistic Recognition
2.ST""-----------------,
-
---- RgeOgnition (Oplim.) (lnSb)
-..... R9COQnition (Clltim.1(Pt5ij
2.0 +-----.--~--r_----"T""----l3.5-3.9 3.5-4.3
Bandpass (microns)
(c)
3.9-4.3
Downloaded By: [Rochester Institute of Technology] At: 12:57 9 July 2010
Static performance modelling of infrared sensors 2323
Effed of NEAT on InSb Scanner.
--0.160.140.120.10
NEAT ("C)
0.080.06o+--...,.-""""ll""""_..,..__--,...-.....0.04
Efled ofTARGET-TO-BACKGRQUND6Ton InSb Scanner
-- ...,.
'5roTarget to Back~und 6T (OC>
0 ...... ...... .... ....
•
Effect of BANDPASS on InSb Scanner
8T'""'"-------------....,
--0-1---..,.------_--"'"
3.5-3.9 3.9-4.3
Bandpass(microns)
(d)
Downloaded By: [Rochester Institute of Technology] At: 12:57 9 July 2010
2324 C. Salvaggio et al.
Effect of SEASON on HgCdTe FPA
8r_-------------....,
".
"G! 6'6
~£ 5 •.l! ~ •I" ..&{ 3 -~e
2.. - """"-- .-Dr
0Summer Winter
Season
Effect of NEt.T on HgCdTe FPA
•...
:-I
_MlT_ MJT
~ Reoognitton (ConselVativGJ
-.- Recognition (Optimistic)
0,06 0,08 0.10 0.12
NEAT("C)
0.14 0.16
Effecl ofTARGET-TO-BACKGROUND <l.Ton HgCdTe FPA
8-r----------------,
_MlT_ MJT
__ R&COgnttlon (ConSGrvatlvo)
--.-. Recognition (Optimistic)
1510
Target to Background 6T (ac)
1 -
O+---~~r_-~--r_---,.."..-\o
(e)
Downloaded By: [Rochester Institute of Technology] At: 12:57 9 July 2010

Static performance modelling of infrared sensors 2325
Effect of SEASON on HgCdTe SCanner
• •_ t.fU
o-l-----,.----~---"'T""--~Summer Winter
Season
Effecl of NE&T on HgCdTe Scanner
8...-----------------.7
_ t.fU
0.160.140.08 0.10 0.12
NE"-T("C)
0.06o+-~__r~~T'"""~......~-r_- ......-""""'0.04
Effect ofTARGET-TO-BACKGROUND &Ton HgCdTe Scanner
B-r-------------...,7
--1 •
15105o+-----T'"""----r_-~~......-I
oTargette Background AT("C)
(f)
Downloaded By: [Rochester Institute of Technology] At: 12:57 9 July 2010
2326 C. Salvaggio et al.
NE~T will the value ofNE~T become a problem (since a signal-to-noise level offour isthe criterion for detection with a 95 per cent probability of being correct).
Recognition is dominated by the spatial distribution of contrast boundaries andtherefore a sufficiently low value ofNE~T is required to discriminate these boundariesso as to be able to achieve recognition.
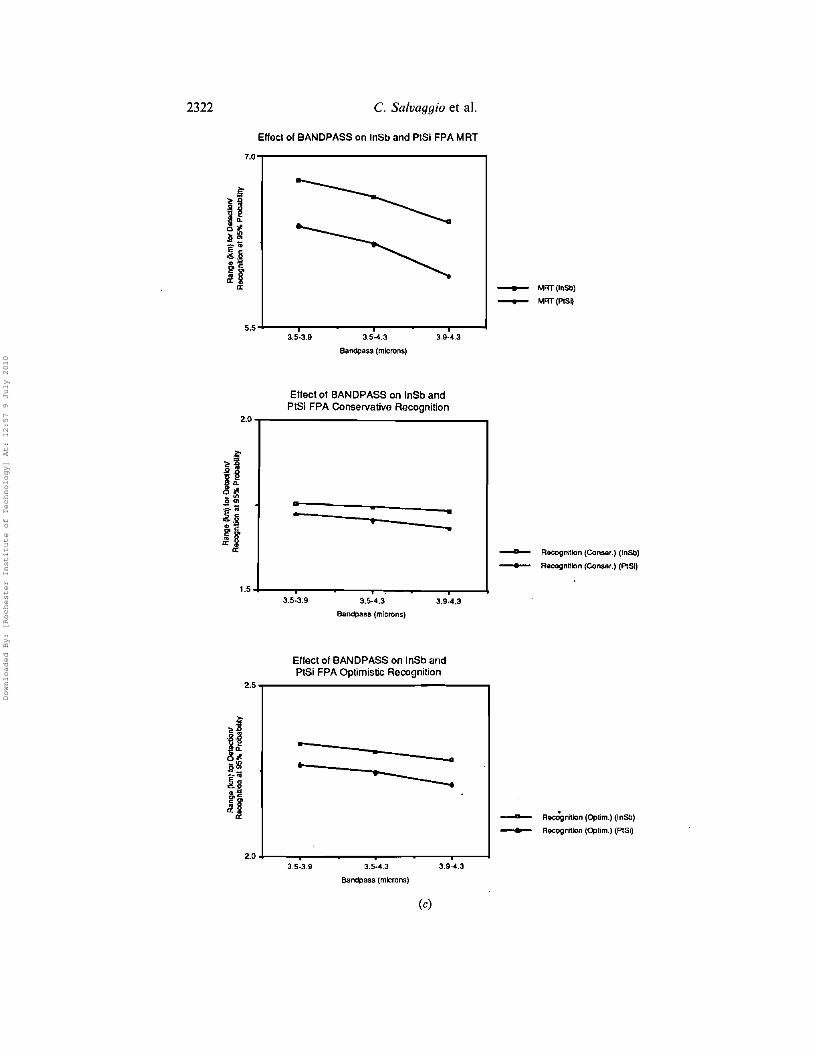
4.3. BandpassThe bandpass was only changed with midwave IR sensors. The bandpass 3·5 to
4·4Jlm was used as were two sub-intervals, 3·5 to 3·9 and 3·9 to 4·3Jlm. These splitbands provided a significant difference in MRT for both conservative and optimisticrecognition performance. The reason for this difference was the dramatic change inresolved energy in these two bandpasses. The 3·5 to 3·9Jlm bandpass records a higherreflected energy component than the 3·9 to 4·3 Jlm bandpass. This led to the increase inthe range at which detection at the 95 per cent probability occurred for these variables.
The most significant effect resulted in the MRT range for the FPAs. Approximatelya O' 5 km difference in the range at which detection could be expected with a 95 per centprobability resulted from the change in bandpass with the 3·5 to 3·9Jlm bandpassresulting in the best performance. The 3·5 to 4·3 Jlm bandpass yielded, as would beexpected, results which fell amidst the two sub-divisions of this bandpass.
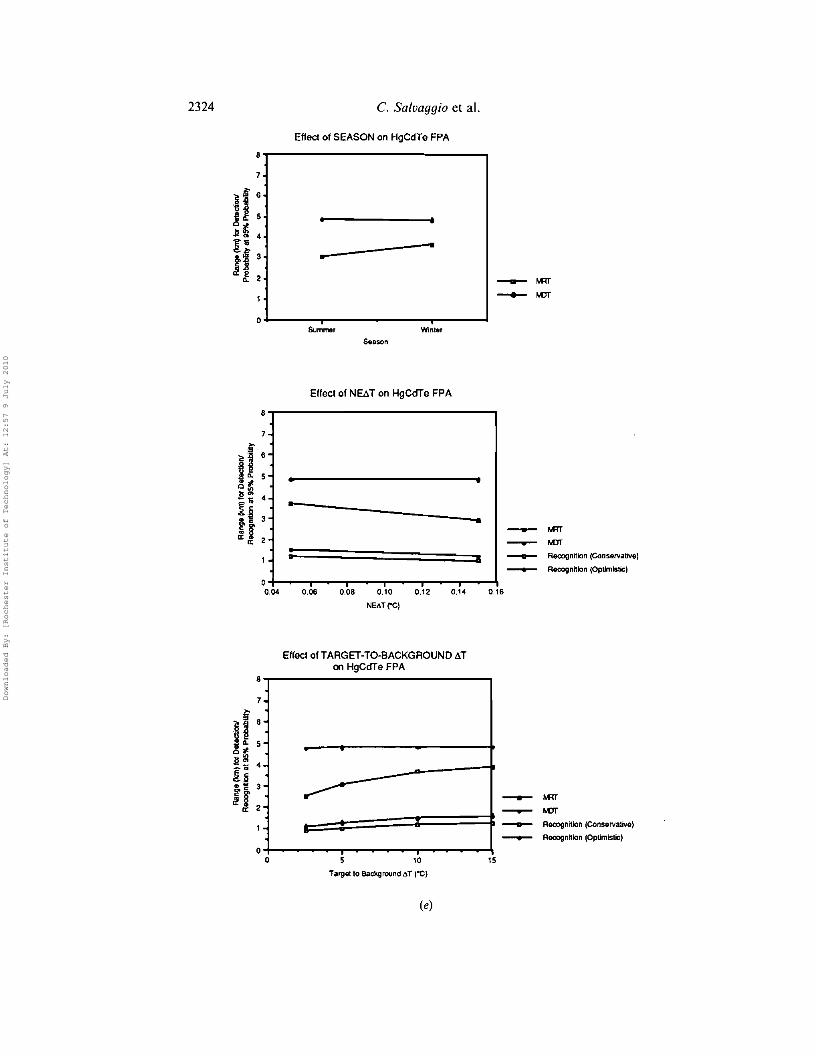
4.4. SeasonThe effect which resulted from a change in season (winter and summer) on the
HgCdTe FPA and scanning sensors was very small (the difference most likelyoccurring as a result of the cooler winter air contributing less to the path radiance).This seasonal change resulted in a 0·5 km change in range for 95 percent probability ofdetection for the FPA while the change observed for the HgCdTe scanning system wasan order of magnitude less. Season could have a greater effect if the model includedinteractions of the surrounding environment with the target and background (i.e,convective cooling, wind effects, etc.).
4.5. AerosolThis independent variable had no effect on the ranges computed. The visibility was
held constant throughout this study at J3 km and the relative humidity did not change.Therefore it can be observed that the different aerosol constituents in an urban andrural atmosphere had no effect on the performance of the systems.
4.6. Cold shield angleThis variable also had no effect on the ranges determined. The values for cold shield
angle which were used consisted of a value which was slightly larger than theacceptance angle of the sensor as well as a value which was significantly larger. Sinceneither of these angles impinged on the incoming signal, it is not surprising that noeffect was observed. With the much larger cold shield angle, one might expect that strayradiation may playa role in affecting the quality of the image, however this was notindicated by our study. In effect, cold shield angle modifies D* as D*'=(D*(sin 0 where, is the cold shield half-angle.
5. ConclusionsThe M l2SPM model demonstrated a number of factors which must be taken into
consideration when dealing with a thermal infrared imaging system. The correlations
Downloaded By: [Rochester Institute of Technology] At: 12:57 9 July 2010

Static performance modelling of infrared sensors 2327
between the independent variables and the resulting range data calculated from themfor 95 per cent probability of detection and recognition varied between the detectormaterials, [nSb, PtSi, and HgCdTe, and with sensor geometry (FPA or scanner).Although no definitive statement can be made from the test scenarios about all thermalinfrared imaging systems, specificobservations revealed a number of factors importantfor consideration.
Of the six independent variables, two of these-aerosol characteristic for thescenarios modelled and cold shield angle-showed little or no effect upon the rangesfor 95 per cent detection and recognition probability. However, only urban and ruralscenarios were considered; had a marine environment been considered it would beexpected that a change would have been seen. Aerosol characteristics for this exampleare based upon typical mid-latitude urban and rural values. Seasonal variation causedsome changes in detection and recognition probability. Both the season and aerosoltype are inputs into the transmission model. Since the visibility for all scenariosremained the same, any increase in the amount of aerosols within a given bandpasswould not affect the performance. Cold shield angle is the limiting aperture fordetector. The simulated scenarios used cold shield angles which were always largerthan the acceptance angle of the detector. Since all the detector elements in both caseswere fully illuminated, the results did not differ.
Two interesting outcomes are noticed. First, the scanner systems were less sensitiveto the changes in the independent variables than the FPA systems. For a scanner usingthe same material as an FPA no difference in range performance was perceivedbetween these sensors in the t-test analysis for detection or for conservative andoptimistic target recognition performance. Secondly, the only difference in the resultsbetween the conservative and optimistic recognition performance was an increase inrange and not a variation among these recognition parameters as determined by the ttest analysis.
The seasonal variation affected only the thermal detector, HgCdTe, not the MWIRdetectors. Seasonal variation is an input into the transmission model. The winterscenarios resulted in greater ranges for 95 per cent detection and recognitionprobability in all comparisons. However, in both seasons, background temperaturewas held constant at 20°C. Sincecolder air contributes lesspath radiance and hence hasa less degrading effect on contrast, these results are not unreasonable. Therefore, itappears that detection and recognition performance is inversely proportional to airtemperature.
The bandpass was divided into two in the MWIR region: the bandpassesconsidered were 3·5--4·3 Ilm, 3,5-3·9 Ilm and 3·9--4·3 Ilm. It was hypothesized that thedifferent proportions of emitted and reflected radiance in the different bandpassregions could be used as a discriminator. The longer wavelength bandpass (3'9--4· 3 Ilm)exhibited a longer range for 95 per cent confidence in discriminating MDT and MRT,for both conservative and optimistic recognition.
NE~T affected the performance of FPAs for all detectors, but affected the scannersonly in detection performance based upon the MRT criterion. The NE~T variesinversely with dwell time, detector area and directly with the objective f-number.Therefore, as the NE~T increases, the detection performance will decrease due to thefact that the signal-to-noise ratio willdecrease so the target will be less distinguishablefrom the background.
As for investigations involving changes in NE~T, the impact on detection andrecognition performance oftarget- to-background temperature difference will be based
Downloaded By: [Rochester Institute of Technology] At: 12:57 9 July 2010

2328 Static performance modelling of infrared sensors
on the sensitivity of the system to discriminate an anomaly from noise. The greater thetarget-to-background temperature, the better the detection performance.
A final, and most important point is that a project of this nature is helpful tograduate students in so far as they gain insight into the entire remote sensing system.This includes an understanding of all those factors modulating the spatial frequenciesand electromagnetic wavelength characteristics of the upwelling radiance field, and ofthe impact of these factors on the detection and recognition performance ofan infraredimaging sensor. It is recommended that such studies be included in graduatecurriculum for students of remote sensing science.
ReferencesBARRY, P. E., and KLOP, M., 1982, Jitter suppression: A data processing aproach. Proceedings of
the International Society for Optical Engineering (SPIE), 366, 2-9.BORG, E. J., DAVIS, J. E., and THOMPSON, B. D., 1986, Modeling approaches to thermal imaging
systems. Proceedings of the International Society for Optical Engineering (SPIE), 636,.2-16.
EWERtNG, H. G., 1964, The theory of optimum spatial filtering. Infrared Physics, 4, 231-237.EMMONS, R. B., 1977, Thermal imaging systems performance estimates. Infrared Physics, 17,
415-418.FRIED, D. L., 1981, Spatial filtering for clutter rejection in (moving) point target detection.
Proceedings of the International Society for Optical Engineering (SPI E), 268, 156-157.FRIED, D. L., and WILLIAMS, R. D., 1977, Formalism development and sample evaluation of the
mean-square background clutter leakage for a HALO type processor. ReportNo. TR-239. Optical Sciences Company, Los Angeles, California.
JAMIESON, J. A., 1976, Passive infrared sensors: limitations on performance. Applied Opticis, IS,891-909.
JOHNSON, J., 1958, Analysis of image forming systems. Proceedings of the Image IntensifierSymposium, Warfare Vision Branch, held in Fort Belvoir, Virginia, on 6-7 October 1958.
. LONGSHORE, R., RAIMONDI, P., and LUMPKIN, M., 1976, Selection of detector peak wavelengthfor optimum infrared system performance. Infrared Physics, 16, 639-647.
OVERINGTON, I., 1976, Vision and Acquisition (London: Pentech Press).OVERINGTON, I., 1982, Towards a complete model of photopic visual threshold performance.
Optical Engineering, 21, 2-13.OVERINGTON, I., and GREENWAY, P., 1987, Practical first-difference edge detection with sub-pixel
accuracy. Image and Vision Computing, S, 217-224.PATTERSON, T. J., CHABRIES, D. M., and CHRISTIANSEN, R. W., 1986, Image processing for target
detection using data from a staring mosaic infrared sensor in geosynchronous orbit.Optical Engineering, 2S, 166-172.
RATCHES, J. A., 1976, Static performance model for thermal imaging systems. OpticalEngineering, IS, 525-530.
RATCHES, J. A., LAWSON, W. R., OBERT, L. P., BERGEMANN, R. J., CASSIDY, T. W., andSWENSON, J. M., 1975, Night Vision Laboratory static performance model for thermalviewing systems. US Army Electronic Command, Night Vision Laboratory, FortBelvoir, Virginia, ECOM-7043.
ROSELL, F. A., and WILSON, R. H., 1974, Performance synthesis of electro-optical sensors.AFAL-TR-74-104, Air Force Avionics Laboratory, Wright Patterson Air Force Base,Ohio.
WEATHERSBY, M. R., and SCHMIEDER, D. E., 1984, An experiment quantifying the effect ofclutteron target detection. Proceedings of the International Society for Optical Engineering(SPIE), SIO, 26-33.
WOOD, J. T., BENTZ, W. J., POHLE, T., and HEPFER, K., 1976, Specification of thermal imagers.Optical Engineering, 15, 531-536.
Downloaded By: [Rochester Institute of Technology] At: 12:57 9 July 2010