modeling of electrical interactions with sofcs library/research/coal...cfc/bt/gtri perc/uic emi/vt...
TRANSCRIPT

PERC/UICCFC/BT/GTRI EMI/VT
Modeling of Electrical Interactions with SOFCs
Project Investigators• S.K. Mazumder
– University of Illinois (PERC/UIC)
• M. von Spakovsky & D. Nelson– Virginia Tech (EMI/VT)
• C. Haynes – Georgia Tech (CFC/BT/GTRI)
Industrial Collaborators• D. Herbison & V. Tchkalov
– Synopsys
• Joseph Hartvigsen – Ceramatech
SECA Modeling & Simulation Team – Integration Meeting
October 15, 2002
NETL, Pittsburgh

PERC/UICCFC/BT/GTRI EMI/VT
APU Overview
• Meet customer requirements, but also add new features– Pre-heat and Pre-cool– Engine-off electrical accessories– Remote and emergency power
• Peak power of 4-5 kWe for LDV• Could reduce peripherals fuel consumption by
50 %• Largest benefit for applications with high idle
times

PERC/UICCFC/BT/GTRI EMI/VT
Key APU RequirementsKey APU Requirements
• Common fuel, small, lightweight
• High system efficiency, low emissions
• Start-up in less than 3 minutes
• Maintenance, durability, cost consistent with application (commercial, RV, luxury, first applications?)
• Noise

PERC/UICCFC/BT/GTRI EMI/VT
SOFC APU Sizing
Typical vehicle APU application:
Maximum power = 5000 We (100 %)Average power = 1500 We (30 %)Minimum power = 500 We (10 %)

PERC/UICCFC/BT/GTRI EMI/VT
Transient ResponseDifferent time constants - fast to slow:
• Electrochemistry – instantaneous (sufficiently fast to assume quasi-stationary behavior)
• Stack electrical response – fraction of a second
• Thermal-hydraulic response – seconds (e.g., POX) to minutes (e.g., SMR)
• Load response with some energy storage - 1 sec
• Start up time - 10 sec to 3 min
• PES electrical response - msec

PERC/UICCFC/BT/GTRI EMI/VT
OBJECTIVES (Phases I and II)• Develop fully transient nonlinear, unified models for SOFC planar configurations, different PESs, and a variety of BOPS components
•Develop a prototypical software package (Phase II) for industry to understand the dynamics of SOFC stack, power electronics, and system interactions
• Implement models in the SaberDesigner and gProms dynamic simulation and optimization environments
• Demonstrate the feasibility of integrating these models into an overall systems-analysis and optimization tool (Phase I)
•Conduct parametric studies (Phase I) and optimizations (Phase II) to determine control strategies and their effects on cell reliability, efficiency, and power density; as well as system response and configuration, and component designs.

PERC/UICCFC/BT/GTRI EMI/VTPERC/UIC
SOFC Power-Electronics Subsystem (PES):
Fuel Processor
Fuel-Cell Stack
Water Management
Air System
Power-Electronics
System
Fuel In
Wat
er O
ut
Air In Heat Out E
xhau
st
Fuel
Application Load
PESSOFCSS
Thermal Management
Heat Out
Exhaust Out
BOPS

PERC/UICCFC/BT/GTRI EMI/VT
Technical Issues: PES
• To investigate the impact of critical parameters of a closed-loop PES, which can negatively affect the performance and integrity of a SOFC stack for a given application load {Phase I (set cases); Phase II (experimental verifications of Phase-I results and extension to generalized analysis)}
– Circuit and control parameters of the power converters– Topological architectures (standalone, cascaded, or distributed).– Switching schemes (that is, whether the converters are operated with
PWM, soft switching, interleaving etc.)– Application load (converter and stationary/non-stationary loads)
PERC/UIC

PERC/UICCFC/BT/GTRI EMI/VT
Impact of Parametric Variations on Ripple: An “Illustration” for a DC-DC Converter
By simply varying “only one” parameter (load in this case), the voltage and current ripples of the converter change drastically. In reality, more than one parameter can vary simultaneously.
VR
CR
VR
CR
VR
CR
VR
VR: Voltage rippleCR: Current ripple

PERC/UICCFC/BT/GTRI EMI/VT
Technical Issues: PES
• To investigate the steady-state and dynamic interaction problems due to the integration of the SOFCSS and PES for a given application load {Phase I (set cases); Phase II (experimental verifications of Phase-I results and extension to generalized analysis)}
– Fast- and slow-scale scale instabilities in ripple dynamics– Impact of variations in SOFC output voltage on PES– Effect of time-varying perturbations of the stationary/non-stationary
loads and PES on the SOFC

PERC/UICCFC/BT/GTRI EMI/VT
Technical Issues: PES
• To determine the criteria for the synthesis of an optimal power-electronic converter (for a given SOFC), which can increase the lifetime and efficiency of the fuel cell {Phase II (robust)}
– What type of converter topology should one choose, for a given application load, so that the performance and efficiency of the SOFC can be maximized? (A SOFC can be interfaced to an application load using multiple converter topologies. The severity of the interactions among the subsystems is not the same for all the topologies.)
– How should one optimize an existing power-electronics system so that it has minimal negative effect on the SOFC?

PERC/UICCFC/BT/GTRI EMI/VT
R&D Approach: PES
• Unified Model of PES• Power-electronic systems are “hybrid systems”; they comprise discontinuous
differential equations, discrete differential equations, functional differentialinclusions, digital automata, impulsive differential equations, non-smooth differential equations, ordinary and even partial differential equations
• Unified framework is an indexed collection of dynamical systems along with a map for transitions among them that can account for “any” dynamical model of a PES and predict fast- and slow-scale ripple dynamics
Conventional Averaged Models of PES cannot account for all ripple dynamics and in many cases predict incorrect stability results.

PERC/UICCFC/BT/GTRI EMI/VT
R&D Approach: PES
System Interaction using “Bifurcation” Analyses
When does a nominal system loose stability?
What is the mechanism of the instability?
What happens after the
instability (post-instability
dynamics)?For variations in one or more parameters, when
can one expect the ripple magnitude and frequency
of the PES to change?
How conservative should the PES design be?
• Are the “new” voltage and current ripples
dangerously high for the SOFC?

PERC/UICCFC/BT/GTRI EMI/VT
Previous Successes: SOFCSS - Modeling TSOFC Transients with Lagrangian Approach
• At “t*=0+” the load increases and current initially “spikes” up
• The reactants supply, however, does not change
• A new steady state is reached wherein the hydrogen profile is decreased along the anode due to reactant depletion
0 0.25 0.5
0.75 1
1.25 1.5
1.75 2
Par
tial P
ress
ure
(atm
)
0 0.2 0.4 0.6 0.8 1 Dimensionless Length Along Cell
t/T=0
t/T=0.333
t/T=0.667
t/T=1
Axial H2 Partial PressuresAs a Function of Time
t*

PERC/UICCFC/BT/GTRI EMI/VT
• Reactants’ inlet flow properties are the same
• The fuel elements’ exit properties depend upon their locations at t*=0+
• Steady state is regained when element 3 exits (t*=1), because every successive element will then pass along the cell “seeing” only the new operating potential
Fuel Cell
1234
Fuel Stream
Oxidant Stream
t = 0+
Previous Successes: SOFCSS - Modeling TSOFC Transients with Lagrangian Approach
PERC/UICCFC/BT/GTRI EMI/VT
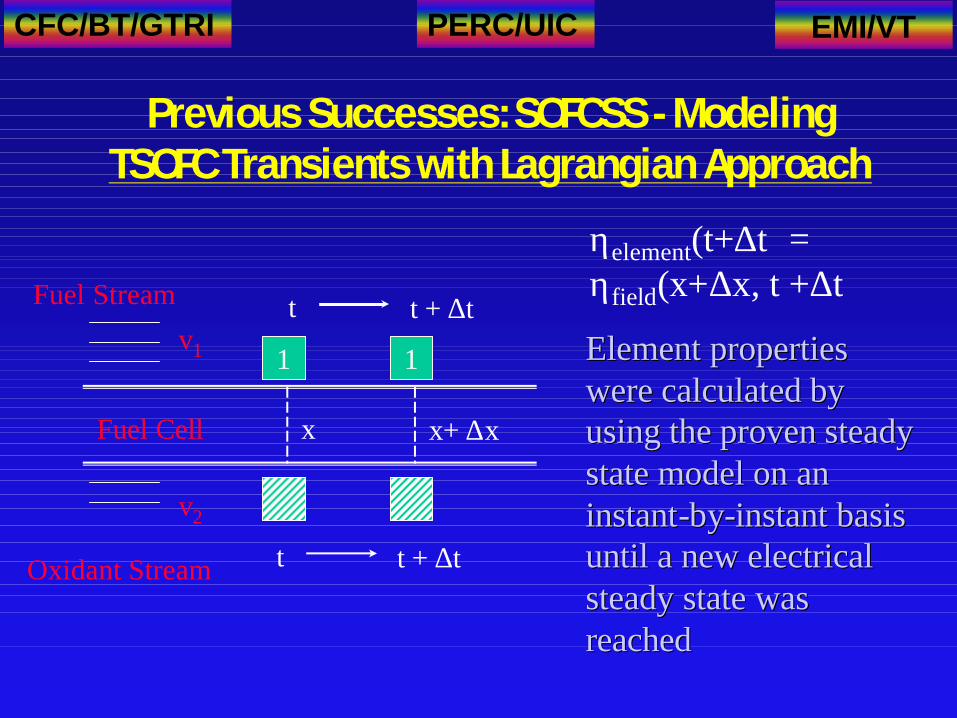
Previous Successes: SOFCSS - Modeling TSOFC Transients with Lagrangian Approach
� ηelement(t+∆t) =ηfield(x+∆x, t +∆t)
Element properties Element properties were calculated by were calculated by using the proven steady using the proven steady state model on an state model on an instantinstant--byby--instant basis instant basis until a new electrical until a new electrical steady state was steady state was reachedreached
Fuel Cell
11
Fuel Stream
Oxidant Stream
x
t + ∆t t
x+ ∆x
t t + ∆t v1
v2

PERC/UICCFC/BT/GTRI EMI/VT
360
400
440
480
520
84%
87%
90%
93%
96%
0 0.2 0.4 0.6 0.8 1 t*=t/T
Current, Fuel Utilization TransientsDependence on Dimensionless Time
Fuel utilization
Current (Amps)
• Current spikes up, yet the fuel supply remains invariant due to the decoupling of the cell
• Fuel utilization thus increases; this causes current (and power) to decrease from t*=0+
values, until a new steady state “match” occurs at the new voltage (t*=1)
Previous Successes: SOFCSS - Modeling TSOFC Transients with Lagrangian Approach

PERC/UICCFC/BT/GTRI EMI/VT
R&D Approach: SOFCSS- Need Enhancements to Transient Model
Resolution of operating environment via model(s)Extensive communication with SECA teammates
regarding cell sensitivity issues (e.g., “electrochemical fatigue” parameters??)
• Dynamic response to current rippleSuperposition applied to original Lagrangian
approach wherein multiple, periodic stimuli (as opposed to initial stimulus) serve as the “forcing function”
• Cell reliability under load variation

PERC/UICCFC/BT/GTRI EMI/VT
Previous Work Modeling the SOFCSS/BOPSPrevious Work Modeling the SOFCSS/BOPS
PEMFC based PEMFC based TES modelTES model
SOFC Stack SOFC Stack modelmodel
SOFC Stack Subsystem SOFC Stack Subsystem (SOFCSS) transient & (SOFCSS) transient &
steady state modelssteady state models
SOFC System SOFC System (SOFCSS + BOPS) (SOFCSS + BOPS) steady state modelsteady state model

PERC/UICCFC/BT/GTRI EMI/VT
Air
Combustion Gases
Water
Heat Recovery
Anode
CathodeB
E
AH
C
G
D
I
F
HX III
HX V
HX IV
HX I
HX II
HX VI
Methane
Previous Work: System (SOFCSS/BOPS) ModeledPrevious Work: System (SOFCSS/BOPS) Modeled
Assumptions:Assumptions:
• Pure methane
•Air humidity fixed at 65%and 298 °K, 1 atm
• Cell temperature 1273°K

PERC/UICCFC/BT/GTRI EMI/VT
Previous Work: BOPSPrevious Work: BOPS
PrePre--reforming modelreforming model: SMR and shift reactions – kinetic / equilibrium / geometry based
∫=
= −=
4
4
4
0
CHi,
XX
X CHBcrtubes
reactorCH
reactor rdX
)An(
nL
ρ
Gas turbine, combustor, heat exchangers Gas turbine, combustor, heat exchangers : thermodynamic / geo-metry based models
Fuel Processing andenergy recovery model
Pre-reforming CombustorGas TurbineHeatExchangers

PERC/UICCFC/BT/GTRI EMI/VT
Previous Work: System (SOFCSS/BOPS) ResultsPrevious Work: System (SOFCSS/BOPS) ResultsSimulation in the Simulation in the
Synthesis/Design modeSynthesis/Design modeFixed cell power at different
cell voltages
• The model works and can be used for trade-off analysis or large-scale optimization
• The model gives coherent and interesting results
The parameters studied:
•Methane conversion during pre-reforming
• Steam to carbon ratio
• Cell pressure
• Fuel utilization
0
1000
2000
3000
4000
5000
6000
7000
8000
9000
0.4 0.45 0.5 0.55 0.6 0.65 0.7 0.75 0.8 0.85
C e l l v o l t a g e [ V ]
SMR , 60%
SMR , 30%
Cell , 30%,60%
Influence of methane conversion
•High methane conversion during pre-reforming is not recommended
• There is a cell voltage where the total cost of the cell and the SMR is a minimum
Cell voltage [V]Le
ngth
[m
m]

PERC/UICCFC/BT/GTRI EMI/VT
400
900
1400
1900
2400
2900
3400
0.4 0.45 0.5 0.55 0.6 0.65 0.7 0.75 0.8 0.85
C e l l v o l t a g e [ V ]
SMR , 2.8
Cell , 3.5
SMR , 3.5
Cell , 2.8
Influence of the steam to carbon ratio
• Better to work at a low steam to carbon ratio
• However, lower limit of the steam to carbon ratio exists because of carbon deposition
Previous Work: System (SOFCSS/BOPS) ResultsPrevious Work: System (SOFCSS/BOPS) Results
• At higher pressure, equipment cost decreases
• At higher pressure, system efficiency decreases
Influence of the cell pressure
300
800
1300
1800
2300
2800
3300
3800
4300
0.4 0.45 0.5 0.55 0.6 0.65 0.7 0.75 0.8 0.85Cell voltage
Cel
l le
ngth
[m
m]
0.4
0.45
0.5
0.55
0.6
0.65
0.7
0.75
0.8
0.4 0.45 0.5 0.55 0.6 0.65 0.7 0.75 0.8 0.85
Cell voltage [V]
Eff
icie
ncy
Cell , 15 bar
SMR , 25 bar
SMR, 15 bar
Cell , 25 bar
15 bar
25 bar
44 CHCHmethane
cellGTsystemelec nMLHV
PP +=η
Cell voltage [V] Cell voltage [V]
Cell voltage [V]
Leng
th [
mm
]
Leng
th [
mm
]E
ffic
ienc
y

PERC/UICCFC/BT/GTRI EMI/VT
Previous Work: System (SOFCSS/BOPS) ResultsPrevious Work: System (SOFCSS/BOPS) ResultsInfluence of fuel utilization
0
0.1
0.2
0.3
0.4
0.5
0.6
0.7
0.8
0.4 0.45 0.5 0.55 0.6 0.65 0.7 0.75 0.8 0.85
Cell voltage [V]
Eff
icie
ncy
Cell, 75%
Cell, 85%
System, 75%System, 85%
44 CHCHmethane
cellcellelec nMLHV
P=η
1200
1300
1400
1500
1600
1700
1800
1900
2000
0.4 0.45 0.5 0.55 0.6 0.65 0.7 0.75 0.8 0.85
Cell voltage [V]
Inle
t exp
and
er te
mp
erat
ure
[K]
Expander inlet temperature
75%
85%
0
2000
4000
6000
8000
10000
12000
0.4 0.45 0.5 0.55 0.6 0.65 0.7 0.75 0.8 0.85
Cell voltage [V]
SM
R le
ng
th [m
m]
75%
85%
200
400
600
800
1000
1200
1400
1600
0.4 0.45 0.5 0.55 0.6 0.65 0.7 0.75 0.8 0.85
Cell voltage [V]
Len
gth
[mm
]
85%
75%
Cell voltage [V]Cell voltage [V]
Cell voltage [V]
Cell voltage [V]
Eff
icie
ncy
SMR
leng
th (m
m)
Cel
l len
gth
(mm
)
Tem
pera
ture
(o K)

PERC/UICCFC/BT/GTRI EMI/VT
SupersonicPenetration
Combat Air Patrol
Loiter
Descend and Land
Warm-up and Takeoff
Accelerate and Climb
Subsonic Cruise Climb
Descend
CombatEscapeDashClimb
Subsonic Cruise Climb
Descend
Deliver expendables
Source: Mattingly et al, 1987
n System: Advanced Air-to-Air Fighter (PS-ECS-FLS-VC/PAOS-AFS) –Synthesis/design optimized with 553 degrees of freedom
Previous Work: Integrated System-level Synthesis / DesignOptimization - ILGO
n System: Fuel Cell Based Total Energy System (SS-FPS-EHPS)– Synthesis/design optimized with 39 degrees of freedom
Fuel ProcessingSub-system
(FPS)
ElectricHeat PumpSub-system
(EHPS)
Stack Sub-system(SS)
TESFPSE&
airQ&
EHPSE&
netE&
2Hn&
fueln&
EHPSQ& SSQ&
FPSQ&
PERC/UICCFC/BT/GTRI EMI/VT
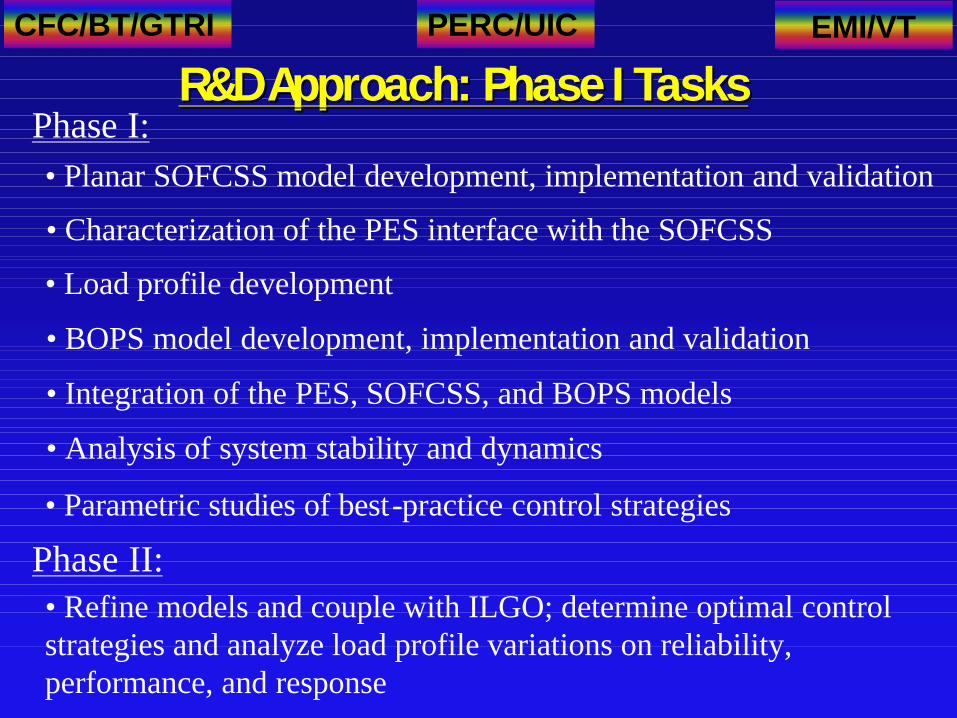
R&D Approach: Phase I TasksR&D Approach: Phase I Tasks
• Planar SOFCSS model development, implementation and validation
• Parametric studies of best-practice control strategies
• Analysis of system stability and dynamics
• Refine models and couple with ILGO; determine optimal control strategies and analyze load profile variations on reliability, performance, and response
• Characterization of the PES interface with the SOFCSS
• Load profile development
• BOPS model development, implementation and validation
• Integration of the PES, SOFCSS, and BOPS models
Phase I:
Phase II:

PERC/UICCFC/BT/GTRI EMI/VT
R&D Approach
Collaboration with DOE Labs and SECA partners is critical to an effective Phase I !!!
• Integration within (i.e. UIC, Va. Tech and Ga. Tech) • Integration without (i.e. SECA teammates)