model-based prognostics - laas · • our definition of model-based prognostics refers simply to...
TRANSCRIPT
Model-Based Prognostics
Matthew Daigle
Prognostics Center of Excellence
Intelligent Systems Division
NASA Ames Research Center

INTRODUCTION
• NASA – Aeronautics & Space
• Ames Research Center – Aeronautics research
– Mission operations (Kepler, LADEE)
– Synthetic biology
– Quantum computing
• Intelligent Systems Division – Robotics
– Automatic control
– Planning & scheduling
– Collaborative systems
– Systems health
• Discovery & Systems Health Technical Area – Diagnostics & Prognostics Group
– Prognostics Center of Excellence
11 JULY 2014 NASA AMES RESEARCH CENTER :: PROGNOSTICS CENTER OF EXCELLENCE 2

OUTLINE
• Part I: Fundamentals of Model-Based Prognostics – What is prognostics?
– Why prognostics?
– Problem formulation
– Prognostics architecture
• Part II: Algorithms & Advanced Concepts – Modeling approaches
– Estimation algorithms
– Prediction algorithms
– Uncertainty quantification
– Distributed prognostics
– Prognostics and decision making
11 JULY 2014 NASA AMES RESEARCH CENTER :: PROGNOSTICS CENTER OF EXCELLENCE 3

Part I
Fundamentals of Model-Based Prognostics

WHAT IS PROGNOSTICS?
• Prognostics is the process in which the occurrence of some system event is predicted, e.g., – Predict when/if a mission
objective is achieved
– Predict when a component no longer meets desired functional requirements
• With knowledge of when the event will occur, we can take some sort of action to optimize operations
11 JULY 2014 NASA AMES RESEARCH CENTER :: PROGNOSTICS CENTER OF EXCELLENCE 5

SYSTEMS HEALTH MANAGEMENT
• Prognostics is often viewed as a fundamental technology within system health management (SHM)
– Prognostics can be informed by diagnostics, and feeds into health-based decision making
• In the SHM context, we predict end of life (EOL) and remaining useful life (RUL) of systems and components
• EOL occurs when functional requirements are no longer met, e.g.,
– Battery end of discharge
– Valve fails to open/close
– Degraded pump efficiency
11 JULY 2014 NASA AMES RESEARCH CENTER :: PROGNOSTICS CENTER OF EXCELLENCE 6

EXAMPLE: BATTERIES
• Batteries are ubiquitous – laptops, mobile phones, electric cars, electric aircraft
• Prognostics can be used to – Predict end of discharge
• how long device/system can be used
• when to charge
– Predict end of usable capacity • when to replace the battery
• Such predictions can be very useful, but this is, in general, a difficult problem
11 JULY 2014 NASA AMES RESEARCH CENTER :: PROGNOSTICS CENTER OF EXCELLENCE 7

WHY PROGNOSTICS?
11 JULY 2014 NASA AMES RESEARCH CENTER :: PROGNOSTICS CENTER OF EXCELLENCE 8
Home
Base
Objective #1
Objective #2
Objective #3
Objective #4
Electric Aircraft
Example: UAV Mission
Visit waypoints to accomplish science objectives. Predict aircraft battery end of discharge to determine
which objectives can be met. Based on prediction, plan optimal route. Replan if prediction changes.
Prognostics:
Full discharge
before mission
completion
WHY PROGNOSTICS?
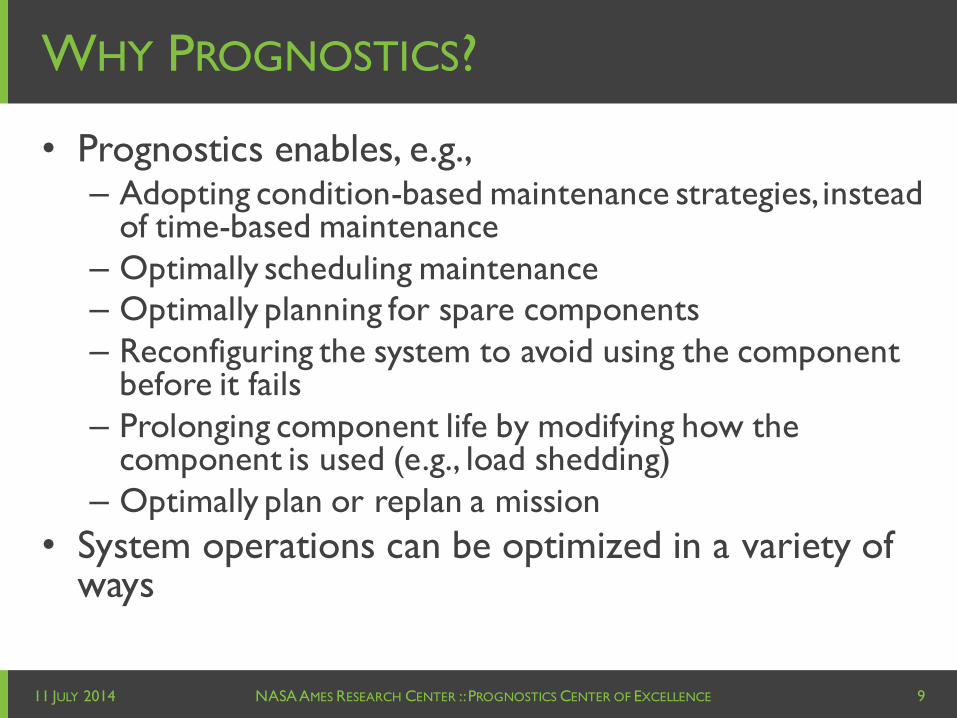
• Prognostics enables, e.g., – Adopting condition-based maintenance strategies, instead
of time-based maintenance
– Optimally scheduling maintenance
– Optimally planning for spare components
– Reconfiguring the system to avoid using the component before it fails
– Prolonging component life by modifying how the component is used (e.g., load shedding)
– Optimally plan or replan a mission
• System operations can be optimized in a variety of ways
11 JULY 2014 NASA AMES RESEARCH CENTER :: PROGNOSTICS CENTER OF EXCELLENCE 9

WHAT IS MODEL-BASED PROGNOSTICS?
• Prognostics approaches often differentiated between “model-based” and “data-driven” – These terms are not very useful… all approaches use models of some kind, and all are
driven by data
– “Model-based” typically refers to approaches using models derived from first principles (e.g., physics-based)
– “Data-driven” typically refers to approaches using models learned from data (e.g., NNs, GPR)
• Our definition of model-based prognostics refers simply to approaches that use mathematical models of system behavior – When available, knowledge from first principles, known physical laws, etc, should be
used to develop models
– When a large amount of data is available (for both nominal and degraded behavior), models can be learned from the data
• Models are typically developed from a mix of system knowledge and system data
• Models are typically adapted online in some fashion
11 JULY 2014 NASA AMES RESEARCH CENTER :: PROGNOSTICS CENTER OF EXCELLENCE 10

PROBLEM FORMULATION
• System described by
– x: states, θ: parameters, u: inputs, y: outputs, v:
process noise, n: sensor noise
• Define system event of interest E
• Define threshold function, that evaluates to true
when E has occurred
11 JULY 2014 NASA AMES RESEARCH CENTER :: PROGNOSTICS CENTER OF EXCELLENCE 11

PROBLEM FORMULATION
• Interested in predicting E – E.g., battery voltage falls
below cutoff voltage to define end-of-discharge
• System starts at some state in region A, eventually evolves to some new state at which E occurs and moves to region B
• TE defines the boundary between A and B
• Must predict the time of event E, kE, and the time until event E, ΔkE
11 JULY 2014 NASA AMES RESEARCH CENTER :: PROGNOSTICS CENTER OF EXCELLENCE 12
A B
Current
State at t
Future State
at t’
State Space
TE

PROBLEM FORMULATION
• Define kE
• Define ΔkE
• May also be interested in the values of some system
variables at kE
• Goal is to compute kE and its derived variables
11 JULY 2014 NASA AMES RESEARCH CENTER :: PROGNOSTICS CENTER OF EXCELLENCE 13

UNCERTAINTY
• System actually takes one path out of many possible paths to region B – System dynamics are
stochastic (modeled as process noise)
– Future system inputs are stochastic (many possible future usage profiles, system disturbances)
• So, kE is a random variable, and we must predict its probability distribution – Adds complexity to the
problem
11 JULY 2014 NASA AMES RESEARCH CENTER :: PROGNOSTICS CENTER OF EXCELLENCE 14
A B
Current
State at t
Future State
at t’
Future State
at t’’
Future State
at t’’’
State Space
TE

UNCERTAINTY
• Goal of prognostics algorithm is to predict true distribution of kE – A misrepresentation of true
uncertainty could be disastrous when used for decision-making
• Prognostics algorithm itself adds additional uncertainty – Initial state not known exactly
– Sensor and process noise (stochastic processes with unknown distributions)
– Model not known exactly
– System state at kP not known exactly
– Future input trajectory distribution not known exactly
11 JULY 2014 NASA AMES RESEARCH CENTER :: PROGNOSTICS CENTER OF EXCELLENCE 15
p(kE)
True p(kE)
(what algorithm
should produce)
Predicted p(kE)
(what algorithm
actually produces)
Uncertainty added by
algorithm should be
minimized

CONSTITUENT PROBLEMS
• In order to compute kE, we need to know
– What is the system state at kP?
– What potential inputs will the system have from kP to kE?
– What model describes the system evolution?
– What is the process noise distribution?
– What is the future input trajectory distribution?
• Prognostics is often split into two sequential
problems
– Estimation: determining the system state at kP
– Prediction: determining kE
11 JULY 2014 NASA AMES RESEARCH CENTER :: PROGNOSTICS CENTER OF EXCELLENCE 16

PROGNOSTICS ARCHITECTURE
• System gets input and produces output
• Estimation module estimates the states and parameters, given system inputs and outputs – Must handle sensor noise
– Must handle process noise
• Prediction module predicts kE
– Must handle state-parameter uncertainty at kP
– Must handle future process noise trajectories
– Must handle future input trajectories
– A diagnosis module can inform the prognostics what model to use
11 JULY 2014 NASA AMES RESEARCH CENTER :: PROGNOSTICS CENTER OF EXCELLENCE 17
System Estimation Prediction
u(k) u(k), y(k) p(x(k),θ(k)) p(kE)

EXAMPLE: BATTERIES
11 JULY 2014 NASA AMES RESEARCH CENTER :: PROGNOSTICS CENTER OF EXCELLENCE 18
Predict end of discharge, defined by a voltage threshold.
Assume a prediction model: V(k) = V0 - m k.
Estimate m at each time of prediction.
Time
Voltag
e
In order to obtain accurate predictions, we need to understand the system!
EOD Voltage Threshold

Part II
Algorithms & Advanced Concepts

WHAT KIND OF MODELS?
• Models for prognostics require the following features
– Describe dynamics in nominal case (no aging/degradation)
– Describe dynamics in the faulty/degraded/damaged case
– Describe dynamics of aging/degradation
11 JULY 2014 NASA AMES RESEARCH CENTER :: PROGNOSTICS CENTER OF EXCELLENCE 20
Time
Voltag
e
• What are the dynamics
describing discharge?
• What model parameters
change as a result of aging?
• How do the aging
parameters change in time?
Aging
EOD Voltage Threshold

EXAMPLE: BATTERIES
Discharge
Positive electrode is cathode
Negative electrode is anode
Reduction at pos. electrode:
Li1-nCoO2 + nLi+ + ne- LiCoO2
Oxidation at neg. electrode:
LinC nLi+ + ne- + C
Current flows + to –
Electrons flow – to +
Lithium ions flow – to +
Charge
Positive electrode is anode
Negative electrode is cathode
Oxidation at pos. electrode:
LiCoO2 Li1-nCoO2 + nLi+ + ne-
Reduction at neg. electrode:
nLi+ + ne- + C LinC
Current flows – to +
Electrons flow + to –
Lithium ions flow + to –
11 JULY 2014 21 NASA AMES RESEARCH CENTER :: PROGNOSTICS CENTER OF EXCELLENCE

EXAMPLE: BATTERY MODELING
• Lumped-parameter, ordinary differential equations
• Capture voltage contributions from different sources – Equilibrium potential Nernst equation with Redlich-Kister expansion
– Concentration overpotential split electrodes into surface and bulk control volumes
– Surface overpotential Butler-Volmer equation applied at surface layers
– Ohmic overpotential Constant lumped resistance accounting for current collector resistances, electrolyte resistance, solid-phase ohmic resistances
• TE defined using a voltage cutoff – TE is crossed once V<VEOD
11 JULY 2014 22 NASA AMES RESEARCH CENTER :: PROGNOSTICS CENTER OF EXCELLENCE

BATTERY MODEL VALIDATION
Nominal 2A Discharge Curve “Open-Circuit” Discharge Curve
Rover Battery Discharge Curve
Model matches well for open-circuit,
nominal discharge, and variable-load
discharges on the rover.
Spike in predicted voltage is due to gap in
data (incorrect sample time being fed to
model).
11 JULY 2014 23 NASA AMES RESEARCH CENTER :: PROGNOSTICS CENTER OF EXCELLENCE

2000 4000 6000 8000
2.5
3
3.5
4
Current (A)
Volt
age
(V)
A aging
aging!
Aaging
Cycle 16
Cycle 26
Cycle 36
Cycle 46
Cycle 56
Cycle 66
Cycle 76
Cycle 86
Cycle 96
Cycle 106
Cycle 116
Cycle 126
Cycle 136
Cycle 146
Cycle 156
Cycle 166
Cycle 176
Cycle 186
BATTERY AGING
• Contributions from both decrease in mobile Li ions (lost due to side reactions related to aging) and increase in internal resistance – Modeled with decrease in “qmax” parameter,
used to compute mole fraction
– Modeled with increase in “Ro” parameter capturing lumped resistances
Measured
Simulated
11 JULY 2014 24 NASA AMES RESEARCH CENTER :: PROGNOSTICS CENTER OF EXCELLENCE

ESTIMATION PROBLEM
• First problem of prognostics is state-parameter estimation – What is the current system state and its associated
uncertainty?
– Input: system outputs y from k0 to k, y(k0:k)
– Output: p(x(k),θ(k)|y(k0:k))
• There are several algorithms that accomplish this, e.g., – Kalman filter (linear systems, additive Gaussian noise)
– Extended Kalman filter (nonlinear systems, additive Gaussian noise)
– Unscented Kalman filter (nonlinear systems, additive Gaussian noise)
– Particle filter (nonlinear systems)
11 JULY 2014 NASA AMES RESEARCH CENTER :: PROGNOSTICS CENTER OF EXCELLENCE 25

UNSCENTED KALMAN FILTER
• The UKF is an approximate nonlinear filter, and assumes additive, Gaussian
process and sensor noise
• Handles nonlinearity by using the concept of sigma points
– Transform mean and covariance of state into set of samples, called sigma
points, selected deterministically to preserve mean and covariance
– Sigma points are transformed through the nonlinear function and recover
mean and covariance of transformed sigma points
• Number of sigma points is linear in the size of the state dimension
11 JULY 2014 NASA AMES RESEARCH CENTER :: PROGNOSTICS CENTER OF EXCELLENCE 26
Unscented
transform
x
x
Pxx
x
Pxx
Symmetric Unscented Transform

UNSCENTED KALMAN FILTER
• Kalman filter equations extended to use sigma points
• Has medium computational complexity and covers a very large class of dynamics, but is an approximate filter
11 JULY 2014 NASA AMES RESEARCH CENTER :: PROGNOSTICS CENTER OF EXCELLENCE 27
Update Step Prediction Step

PARTICLE FILTER
• Particle filters can be applied to general nonlinear processes with non-Gaussian noise – does not restrict the dynamics in any way – But is an approximate filter,
and is stochastic in nature
• Approximate state distribution by set of discrete weighted samples (i.e., particles):
– Suboptimal, but approach optimality as N ∞
• Approximates posterior as
11 JULY 2014 NASA AMES RESEARCH CENTER :: PROGNOSTICS CENTER OF EXCELLENCE 28
w
x
t
Distribution
evolves in time
State represented with
discrete probability
distribution

PARTICLE FILTER
• Begin with initial particle population
• Predict evolution of particles one step ahead
• Compute particle weights based on likelihood of given observations
• Resample to avoid degeneracy issues – Degeneracy is when small number of particles have high weight and the rest have very low weight
– Avoid wasting computation on particles that do not contribute to the approximation
11 JULY 2014 NASA AMES RESEARCH CENTER :: PROGNOSTICS CENTER OF EXCELLENCE 29
w
x
Initial Particle Population
w
x
Predict Evolution
w
x
Compute Weights
w
x
Resample

JOINT STATE-PARAMETER ESTIMATION
• Joint state-parameter estimation is performed within a filtering framework by augmenting the state vector with the unknown parameter vector
• Must assign an evolution to the parameters, typically a random walk
• The particle filter adopts this equation directly, but for the Daum and UKF filters, it is represented in the corresponding diagonal of the process noise matrix
• Selection of variance of random walk noise is important – Variance must be large enough to ensure convergence, but small enough
to ensure precise tracking
– Optimal value depends on unknown parameter value
– Should tune online to maximize performance
11 JULY 2014 NASA AMES RESEARCH CENTER :: PROGNOSTICS CENTER OF EXCELLENCE 30

VARIANCE CONTROL
• ξ values tuned initially for maximum possible wear rates
• Try to control the amount of relative spread of parameter estimate to a desired level (e.g., 10%) – Since it is relative, applies equally to any
wear parameter value
– Can use relative median absolute deviation (RMAD), relative standard deviation (RSD), among others
• Several stages to control adaptation – Convergence: Control to large spread (eg
50%) until threshold reached (eg 60%)
– Tracking: Control to desired spread (eg 10%)
• Control based on percent error between actual spread and desired spread with parameter P – Increase random walk variance if
parameter variance is too low, else decrease
11 JULY 2014 NASA AMES RESEARCH CENTER :: PROGNOSTICS CENTER OF EXCELLENCE 31
Proportional control
based on error between
actual and desired relative
spread Move to next stage
when threshold
crossed

PREDICTION PROBLEM
• Second problem of prognostics is prediction – What is kE and what is its uncertainty?
– Input: p(x(k),θ(k)|y(k0:k))
– Output: p(kE)
• Most algorithms operate by simulating samples forward in time until E
• Algorithms must account for several sources of uncertainty besides that in the initial state – A representation of that uncertainty is required for the
selected prediction algorithm
– A specific description of that uncertainty is required (e.g., mean, variance)
11 JULY 2014 NASA AMES RESEARCH CENTER :: PROGNOSTICS CENTER OF EXCELLENCE 32

UNCERTAINTY REPRESENTATION
• To predict kE, need to account for following sources of uncertainty: – Initial state at kP:
– Parameter values for kP to kE:
– Inputs for kP to kE:
– Process noise for kP to kE:
• These are all trajectories… – Difficult to represent directly uncertainty in trajectories, instead
represent indirectly through concept of surrogate variables • Surrogate variables are random variables that parameterize a trajectory
• Describe probability distributions for these variables
• Sample these random variables to sample a trajectory
– For example, if trajectory is constant selected from some distribution, we sample that variable, i.e, u(k) = c, for all k>kP
• Or, u(k) = c1k+ c2k2, …
11 JULY 2014 33 NASA AMES RESEARCH CENTER :: PROGNOSTICS CENTER OF EXCELLENCE

PROGNOSTICS ARCHITECTURE (REVISITED)
System receives System receives
inputs, produces
outputs
Estimate current
state and parameter
Estimate current
state and parameter
values
Use surrogate Use surrogate
variable
distributions
Predict probability Predict probability
distributions for kE,
ΔkE
1 1 2 2
3 3 4 4
11 JULY 2014 34 NASA AMES RESEARCH CENTER :: PROGNOSTICS CENTER OF EXCELLENCE

PREDICTION
• The P function takes an initial state, and a parameter, an input, and a process noise trajectory – Simulates state forward using f until E is
reached to computes kE for a single sample
• Top-level prediction algorithm calls P – These algorithms differ by how they
compute samples upon which to call P
• Monte Carlo algorithm (MC) takes as input – Initial state-parameter estimate
– Probability distributions for the surrogate variables for the parameter, input, and process noise trajectories
– Number of samples, N
• MC samples from its input distributions, and computes kE
• The “construct” functions describe how to construct a trajectory given surrogate variable samples
11 JULY 2014 NASA AMES RESEARCH CENTER :: PROGNOSTICS CENTER OF EXCELLENCE 35

INPUT SAMPLING METHODS
• Exhaustive – Sample entire input space (if finite and not too large)
• Random – Sample randomly from input space (a sufficient number of times)
• Unscented Transform – Transform mean and covariance of state into set of samples, called sigma points,
selected deterministically to preserve mean and covariance
– Sigma points are transformed through the nonlinear function and recover mean and covariance of transformed sigma points
– Number of sigma points is linear in the dimension of the space being sampled
11 JULY 2014 NASA AMES RESEARCH CENTER :: PROGNOSTICS CENTER OF EXCELLENCE 36
Unscented
transform
x
x
Pxx
x
Pxx
Symmetric Unscented Transform
EXAMPLE: BATTERIES
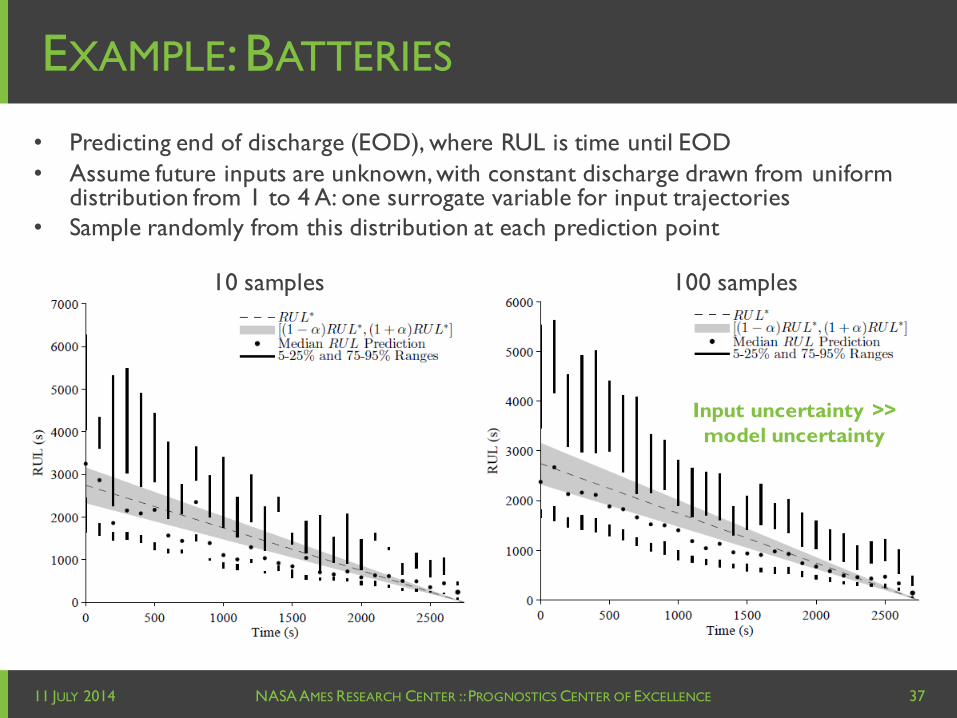
• Predicting end of discharge (EOD), where RUL is time until EOD
• Assume future inputs are unknown, with constant discharge drawn from uniform distribution from 1 to 4 A: one surrogate variable for input trajectories
• Sample randomly from this distribution at each prediction point
10 samples 100 samples
11 JULY 2014 NASA AMES RESEARCH CENTER :: PROGNOSTICS CENTER OF EXCELLENCE 37
Input uncertainty >>
model uncertainty

EXAMPLE: BATTERIES
• Can sample from future input trajectories using unscented transform
• For selected tuning parameter, sigma points correspond to mean and bounds of uniform distribution
• Simulate forward three trajectories for each prediction point
• Mean and variance of RUL distribution match closely those obtained through random sampling
11 JULY 2014 NASA AMES RESEARCH CENTER :: PROGNOSTICS CENTER OF EXCELLENCE 38
Get same mean/variance as with sampling
approach at 3% of the computational cost
(3 samples vs 100 samples)
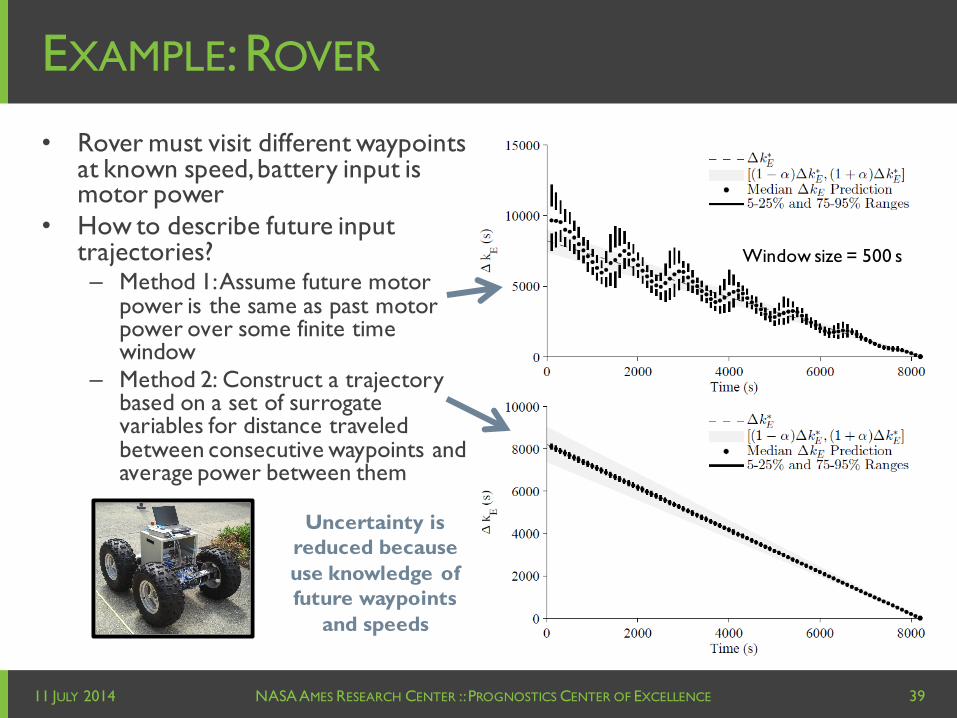
EXAMPLE: ROVER
• Rover must visit different waypoints at known speed, battery input is motor power
• How to describe future input trajectories? – Method 1: Assume future motor
power is the same as past motor power over some finite time window
– Method 2: Construct a trajectory based on a set of surrogate variables for distance traveled between consecutive waypoints and average power between them
11 JULY 2014 NASA AMES RESEARCH CENTER :: PROGNOSTICS CENTER OF EXCELLENCE 39
Window size = 500 s
Uncertainty is
reduced because
use knowledge of
future waypoints
and speeds

SYSTEM-LEVEL PROGNOSTICS
• Most prognostics approaches focus
on components, and not the systems
they reside in
• For the rover, we want to predict a
system-level event, i.e., when the
rover can no longer provide enough
power to the motors
– Cell-level event: end of discharge
(EOD)
– Battery-level event: EOD (when
any one cell within the battery
reaches EOD)
– Rover-level event: EOD or end
of mission (EOM) (when any
single battery at EOD)
11 JULY 2014 NASA AMES RESEARCH CENTER :: PROGNOSTICS CENTER OF EXCELLENCE 40
Motors
Cell
Level Battery
Level
Rover Level

SYSTEM-LEVEL PROGNOSTICS
• In order to make accurate system-level predictions, we cannot ignore the interactions of the different components – The rover commands determine the local future inputs to the
battery cells, so ignoring this interaction adds prediction uncertainty, a system-level perspective is required
• The problem formulation remains the same, only the model changes – Have local events Ei, where global event E occurs when any of
the local events occurs
– For each Ei, can define a local TEi
– TE can be composed from the TEis
• Can simply use the previous algorithms
11 JULY 2014 NASA AMES RESEARCH CENTER :: PROGNOSTICS CENTER OF EXCELLENCE 41

DISTRIBUTED PROGNOSTICS
• … but the previous algorithms do not scale!
• A distributed solution is needed for large-scale systems, and for system-level prognostics problems
• Propose to decompose the global prognostics problem, by decomposing the global model, into local independent subproblems for local submodels – Use structural model decomposition
• Independent subproblems are trivially distributed and parallelized
11 JULY 2014 NASA AMES RESEARCH CENTER :: PROGNOSTICS CENTER OF EXCELLENCE 42
System Size System Size
Estimation
(UKF)
Prediction

STRUCTURAL MODEL DECOMPOSITION
• Model = (X,θ,U,Y,C), set of states X, parameters θ, inputs U, outputs Y, constraints C
• Submodel = (Xi,θi,Ui,Yi,Ci), set of states Xi, parameters θi, inputs Ui, outputs Yi, constraints Ci
– Variables can be assigned as local inputs if their values are known (e.g., they are measured)
• Find minimal submodels that satisfy a certain set of requirements – For distributed estimation, Yi is a singleton, Ui
chosen from U and Y- Yi, generate one submodel for each sensor (for each y in Yi)
– For distributed prognostics, Ui chosen from UP, the set of variables whose future values may be hypothesized a priori, generate one submodel for each TEi constraint
• Approach related to Analytical Redundancy Relations (ARRs), Possible Conflicts (PCs), …
11 JULY 2014 43 NASA AMES RESEARCH CENTER :: PROGNOSTICS CENTER OF EXCELLENCE
u11
u21
u31
u41
y11 y2
1
Ci

f23
MODEL DECOMPOSITION ALGORITHM
• Unobserved State variables: x1, x2, x3
• Observed variables – Inputs: u1
– Outputs: f1, f12, f2, f23, f3
11 JULY 2014 NASA AMES RESEARCH CENTER :: PROGNOSTICS CENTER OF EXCELLENCE 44
x1 x2
f f1 f f2
f f12 uu1 x3
f f3
f f23 dx1/dt dx2/dt dx3/dt
Let’s assume f23 is not observed
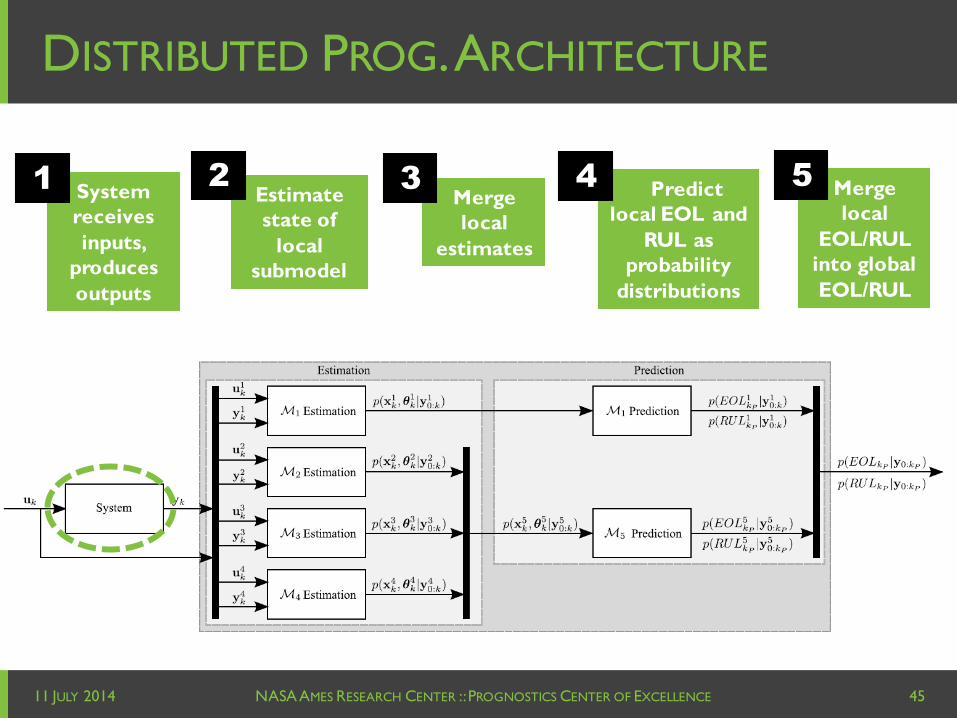
DISTRIBUTED PROG. ARCHITECTURE
11 JULY 2014 45 NASA AMES RESEARCH CENTER :: PROGNOSTICS CENTER OF EXCELLENCE
System
receives
inputs,
produces
outputs
Estimate
state of
local
submodel estimates
Merge
local
estimates
local EOL and
Predict
local EOL and
RUL as
probability
distributions
1 1 2 2 3 3 4 4
EOL/RUL
into global
Merge
local
EOL/RUL
into global
EOL/RUL
5 5

EXAMPLE: ROVER
• Estimation – One local estimator per cell, taking
measured battery current as input and estimating cell voltage
• Prediction – Use load power as an input for
prediction, since for a given motor speed power is constant but current changes with battery voltage
– If cells are balanced in voltage, then current split evenly between parallel sets of cells, and can have local predictors for each cell
– Otherwise (in general), the prediction problem cannot be decomposed, because the current input to each cell depends on the voltages of the other cells
11 JULY 2014 NASA AMES RESEARCH CENTER :: PROGNOSTICS CENTER OF EXCELLENCE 46
Motors
iLoad
V1,
V2,
…
V24

PROGNOSTICS & DECISION-MAKING
• We employ prognostics in order to inform some type of action
• Autonomous vehicles like UAVs and rovers receive command sequences from humans – E.g., as a set of waypoints with
scientific objectives to achieve at each
• Unexpected situations can cause the vehicle to go into a safe mode while engineers diagnose the problem, which might take a long time
• An autonomous decision-making system that includes automated diagnosis and prognosis in making optimal decisions can save time, money, and increase mission value
11 JULY 2014 47 NASA AMES RESEARCH CENTER :: PROGNOSTICS CENTER OF EXCELLENCE

ROVER TESTBED
• Developed rover testbed for hardware-in-the-loop testing and validation of control, diagnosis, prognosis, and decision-making algorithms
• Skid-steered rover (1.4x1.1x0.63 m) with each wheel independently driven by a DC motor
• Four lithium-ion battery packs provide power to the wheels
• Separate battery pack powers the data acquisition system
• Onboard laptop implements control software
• Flexible publish/subscribe network architecture allows diagnosis, prognosis, decision-making to be implemented in a distributed fashion
Controlling Laptop Batteries
Data Acquisition and
Power Distribution
Motors
Phone
11 JULY 2014 48 NASA AMES RESEARCH CENTER :: PROGNOSTICS CENTER OF EXCELLENCE

SIMULATION TESTBED
11 JULY 2014 NASA AMES RESEARCH CENTER :: PROGNOSTICS CENTER OF EXCELLENCE 49

INTEGRATED ARCHITECTURE
1. Rover receives control inputs (individual wheel speeds) and sensors produce outputs
2. Low-level control modifies wheel speed commands to move towards a given waypoint in the
presence of diagnosed faults
3. Diagnoser receives rover inputs and outputs and produces fault candidates
4. Prognoser receives rover inputs and outputs and predicts remaining useful life (RUL) or rover
and/or its components (eg, batteries, motors)
5. Decision maker plans the order to visit the waypoints (science objectives) given diagnostic and
prognostic information. It can also selectively eliminate some of the waypoints if all of them are
not achievable due to vehicle health or energy constraints.
11 JULY 2014 50 NASA AMES RESEARCH CENTER :: PROGNOSTICS CENTER OF EXCELLENCE

DECISION-MAKING
• Responsible for determining the ordered set of waypoints that the rover should visit to optimize mission objectives
• Inputs : – Estimated pose
– Unordered set of potential waypoints
– Remaining useful life of batteries, motors, rover
– Diagnosis result
• Outputs – Ordered set of waypoints
• The challenge is in exploring the (potentially) very large search space quickly – Probabilistic Policy Generator (PPG) is based on the principles of Probability
Collectives
– Most conventional optimization methods reason directly over the values x in a search space X in order to minimize an objective function f(x)
– In PPG, reasoning is performed over the probability distribution P(X) that indicates the likelihood of f(x) being minimized in a particular region of X.
– PPG is multi-objective and can work with constraints set for state variables
11 JULY 2014 NASA AMES RESEARCH CENTER :: PROGNOSTICS CENTER OF EXCELLENCE 51

DEMO
• Demonstration…
11 JULY 2014 NASA AMES RESEARCH CENTER :: PROGNOSTICS CENTER OF EXCELLENCE 52

CONCLUSIONS
• Model-based prognostics is a growing research area consisting of several problems – Model building
– Estimation
– Prediction
– Uncertainty quantification
– System-level and distributed prognostics
– Integration with diagnosis & decision-making
• Goal has been to develop formal mathematical framework, and a modular architecture where algorithms can easily be substituted for newer, better algorithms
11 JULY 2014 NASA AMES RESEARCH CENTER :: PROGNOSTICS CENTER OF EXCELLENCE 53

REFERENCES
• S. Sankararaman, M. Daigle, and K. Goebel, "Uncertainty Quantification in Remaining Useful Life Prediction using First-Order Reliability Methods," IEEE Transactions on Reliability, vol. 63, no. 2, pp. 603-619, June 2014.
• M. Daigle, A. Bregon, and I. Roychoudhury, "Distributed Prognostics Based on Structural Model Decomposition," IEEE Transactions on Reliability, vol. 63, no. 2, pp. 495-510, June 2014.
• M. Daigle and C. Kulkarni, "A Battery Health Monitoring Framework for Planetary Rovers," 2014 IEEE Aerospace Conference, March 2014. (best paper award)
• M. Daigle and C. Kulkarni, "Electrochemistry-based Battery Modeling for Prognostics," Annual Conference of the Prognostics and Health Management Society 2013, pp. 249-261, October 2013.
• M. Daigle and S. Sankararaman, "Advanced Methods for Determining Prediction Uncertainty in Model-Based Prognostics with Application to Planetary Rovers," Annual Conference of the Prognostics and Health Management Society 2013, pp. 262-274, October 2013.
• E. Balaban, S. Narasimhan, M. Daigle, I. Roychoudhury, A. Sweet, C. Bond, and G. Gorospe, "Development of a Mobile Robot Test Platform and Methods for Validation of Prognostics-Enabled Decision Making Algorithms," International Journal of Prognostics and Health Management, vol. 4, no. 1, May 2013.
• M. Daigle and K. Goebel, "Model-based Prognostics with Concurrent Damage Progression Processes," IEEE Transactions on Systems, Man, and Cybernetics: Systems, vol. 43, no. 4, pp. 535-546, May 2013.
• I. Roychoudhury, M. Daigle, A. Bregon, and B. Pulido, "A Structural Model Decomposition Framework for Systems Health Management," Proceedings of the 2013 IEEE Aerospace Conference, March 2013.
• M. Daigle, A. Bregon, and I. Roychoudhury, "A Distributed Approach to System-Level Prognostics," Annual Conference of the Prognostics and Health
• M. Daigle, A. Saxena, and K. Goebel, "An Efficient Deterministic Approach to Model-based Prediction Uncertainty Estimation," Annual Conference of the Prognostics and Health Management Society 2012, pp. 326-335, September 2012. Management Society 2012, pp. 71-82, September 2012.
11 JULY 2014 NASA AMES RESEARCH CENTER :: PROGNOSTICS CENTER OF EXCELLENCE 54