model 1 – adjust for age, gender, race, chs clinical sites, education
TRANSCRIPT

Physical activity, physical fitness and leukocyte telomere length. 1
Luisa Soares-Miranda1, Fumiaki Imamura
2, David Siscovick
3,4, Nancy Swords Jenny,
5, 2
Annette L Fitzpatrick 4, Dariush Mozaffarian
6. 3
4
5
1. Research Center in Physical Activity Health and Leisure, Faculty of Sport University of 6
Porto, Porto, Portugal 7
2. MRC Epidemiology Unit, Institute of Metabolic Science University of Cambridge School 8
of Clinical Medicine Cambridge Biomedical Campus, United Kingdom 9
3. New York Academy of Medicine, New York 10
4. Department of Epidemiology, University of Washington, Seattle, WA, USA 11
5. Department of Pathology, University of Vermont College of Medicine, Burlington, 12
Vermont, USA. 13
6. Friedman School of Nutrition Science and Policy, Tufts University, Boston, MA, USA 14
15
Corresponding Author: Luisa Soares-Miranda, [email protected] 16
Research Centre in Physical Activity, Health and Leisure, Faculty of Sport - University of Porto, 17
Rua Dr.Plácido Costa, 91 4200.450 Porto, Portugal. 18
Tel: +35122 04 25 246, Fax: +351225500689 19
20

2
Abstract 21
Introduction-The influence of physical activity (PA) and physical fitness (PF) at older ages 22
on changes in telomere length (TL), repetitive DNA sequences that may mark biologic aging, 23
is not well-established. Few prior studies have been conducted in older adults, these were 24
mainly cross-sectional, and few evaluated PF. 25
Methods-We investigated cross-sectional and prospective associations of PA and PF with 26
leukocyte TL among 582 older adults (age 73±5 y at baseline) in the Cardiovascular Health 27
Study, having serial TL measures and PA and PF assessed multiple times. Cross-sectional 28
associations were assessed using multivariable repeated-measures regression, in which 29
cumulatively averaged PA and PF measures were related to TL. Longitudinal analyses 30
assessed cumulatively averaged PA and PF against later changes in TL; and changes in 31
cumulatively averaged PA and PF against changes in TL. 32
Results-Cross-sectionally, greater walking distance and chair test performance, but not other 33
PA and PF measures, were each associated with longer TL (p-trend=0.007, 0.04 respectively). 34
In longitudinal analyses, no significant associations were observed between PA and PF with 35
change in TL. In contrast, changes in leisure-time activity and chair test performance were 36
each inversely associated with changes in TL. 37
Conclusions-Cross-sectional analyses suggest that greater PA and PF are associated with 38
longer TL. Prospective analyses show that changes in PA and PF are associated with 39
differences in changes in TL. Even so, even later in life, changes in certain PA and PF 40
measures are associated with changes in TL, suggesting that leisure-time activity and fitness 41
could reduce leukocyte telomere attrition among older adults. 42
43
Key words: elderly, exercise, fitness, biological aging, DNA 44
45
46

3
Introduction 47
Telomere length (TL), repetitive sequences of DNA placed at the ends of eukaryotic 48
chromosomes that act as “caps” protecting genomic integrity and stability (46), has received 49
attention as a potential marker of biologic aging. (4, 20) Leukocyte TL in humans has been 50
associated with age-related diseases, disease biomarkers and mortality.(4, 5, 9, 11, 12, 30, 32) 51
For example, in the Cardiovascular Health Study, shorter TL was associated with higher risk 52
of CVD, with age-related disease burden and mortality. (5, 11, 12, 32) 53
Shortening of TL may be predominantly influenced by oxidative stress and 54
inflammation.(33) It has been hypothesized that higher levels of physical activity (PA) and 55
physical fitness (PF) may delay TL shortening, potentially through anti-inflammatory and 56
anti-oxidative mechanisms.(22, 41) Greater PA and PF are consistently associated with lower 57
morbidity and mortality from chronic diseases (1), supporting a potential “anti-aging” effect. 58
Yet, only limited epidemiologic evidence supports an influence on PA or PF on TL. Among 59
prior studies, some observational(7, 8, 17, 18, 21, 28, 34, 48) and 1 intervention (26) studies 60
suggested favorable roles of PA or PF for TL profiles, but other observational (6, 47) and 61
intervention (36, 42) studies did not. In addition, all of the observational studies assessed only 62
cross-sectional associations of a single PA or PF measure, limiting conclusions on long-term, 63
cumulative PA or PF. The 2 interventional studies were also of short duration (3-6 months), 64
limiting inference on effects of long-term PA or PF. No prior studies separately measured 65
both PA and PF and assessed whether each of PA and PF was independently associated with 66
TL. For example 2 of 4 prior studies had small samples sizes (N<65), limiting statistical 67
power to detect associations; and none separately evaluated both PA and PF to determine 68
their potential independent associations with TL. Finally, few of these prior studies were 69
conducted in older adults (18, 28, 34, 47), a particularly relevant population in which to study 70
aging since old age is associated with a high prevalence of chronic diseases and consequently 71

4
a possibly accelerated rate of telomere shortening. A recent 6-month randomized controlled 72
physical activity trial in 68-year-old, sedentary and overweight subjects, suggested that 73
reduced siting time, but not greater time spent exercising, was associated with telomere 74
lengthening. (38) However, this study had a small sample size (N=49). (38) 75
To address these issues and determine whether long-term PA and PF are associated with 76
TL and TL attrition later in life, we investigated the cross-sectional and prospective 77
associations of PA and PF with TL in a community-based cohort study of older US adults. 78

5
Methods 79
Population 80
The design and recruitment of the Cardiovascular Health Study have been 81
described.(13, 44) Briefly, 5,201 ambulatory, non-institutionalized men and women 82
≥65 years of age were randomly selected and enrolled from Medicare eligibility lists 83
in 4 US communities in 1989-90; and an additional 687 black participants were 84
similarly recruited and enrolled in 1992. The institutional review committee at each 85
center approved the study, and all participants provided informed consent. From 86
1989-90 to 1998-99 participants were followed by annual study visits. Standardized 87
evaluations included physical examination, diagnostic testing, laboratory evaluation, 88
and questionnaires on health status, medical history, and cardiovascular risk 89
factors.(13, 27, 44) Blood was collected and stored during most visits, and DNA 90
collected from those participants that provided consent to use genetic material. 91
Individuals from each enrollment phase were included in the present study if they 92
consented the use of their DNA, had at least 12 mg DNA available, had stored 93
leukocytes for additional DNA preparation, and had measures of PA and PF info at 94
baseline. Characteristics of individuals included in this analysis were generally similar 95
to the whole cohort. 96
97
Assessment of PA and PF 98
PA was assessed at multiple serial visits (Supplementary Figure 1, SDC, 99
Timeline). Usual leisure-time activity was assessed using a modified, validated 100
Minnesota Leisure-Time Activities questionnaire, which has been associated with risk 101
of multiple disease outcomes in this cohort. (23) The questionnaire evaluated 102
frequency and duration of 15 different activities during the prior 2 weeks, including 103

6
gardening, mowing, raking, swimming, hiking, aerobics, tennis, jogging, racquetball, 104
walking, golfing, bicycling, dancing, calisthenics, and exercise cycling.(37) Each 105
activity was defined as having an intensity value in metabolic equivalent task (MET) 106
units,(43) and participant responses regarding types, frequency, and duration of each 107
activity were used to calculate weekly energy expenditure (kcal/week) from leisure-108
time activity. Usual exercise intensity was also assessed, with responses including no 109
exercise or low, medium, or high intensity of exercise.(37) Usual walking habits, 110
including average walking pace (gait speed), and distance walked, were assessed 111
annually at each follow-up visit. We evaluated these metrics in pre-specified 112
categories, including: usual pace walked (<2, 2-3 and >3 mph), blocks walked 113
(quintiles), exercise intensity (none, low, medium and high) and leisure-time activity 114
(quintiles). A previously defined walking score was also evaluated based on the 115
combination of walking pace and walking distance.(23) 116
PF was also assessed at multiple serial visits (Supplementary Figure 1, SDC, 117
Timeline), including based on 15-ft walk (sec), grip strength (kg) and chair stands 118
(sec). In the 15-ft walk, a trained examiner measured the time needed for each 119
participant to walk a 15-ft course (4.5m) at his or her usual pace. Grip strength was 120
measured in the dominant hand using a hand-held JAMAR dynamometer, recording 121
the force in kg for the best of 3 attempts at maximal squeeze. For the chair stand, a 122
trained examiner recorded how quickly each participant performed 5 consecutive 123
chair stands (standing up, with arms folded across the chest, from a seated position on 124
a 45-cm-tall chair), timed to the nearest tenth of 1 sec. We evaluated each PF 125
measure separately and, similar to the walking score, also constructed a summary 126
measure based on all 3 PF measures (each in quintiles) to better capture the full 127
variation of PF within the cohort. 128

7
129
Measurement of telomere length 130
TL (kilo base pairs, kbp) was measured as the mean length of the terminal 131
restriction fragments in peripheral leukocytes.(4, 11, 25) A total of 582 older adults 132
consented for DNA preparation and use, had at least 12 g of available DNA, and had 133
stored leukocytes for additional DNA preparation in both 1992-93 and 1997-98 and 134
were included in the present analysis of TL change. TL was measured using the 135
Southern blot method as previously described.(3, 25) Each sample was analyzed twice 136
on different gels on different occasions, with mean value used for statistical analyses. 137
The Pearson correlation coefficient for these duplicates was 0.97, with mean CV for 138
pair sets of 1.5%. The laboratory conducting the TL measurements was blinded to all 139
participant characteristics. 140
DNA integrity was assessed through electrophoresis of 0.5 g of DNA on 1.0 141
ethidium bromide. These measures suggested some degradation, which would 142
attenuate the ability to detect differences in TL changes over time, especially over 143
only 5 years (1992-93 to 1997-98). 144
145
Covariates 146
Information on a wide range of covariates was obtained during study visits, including 147
demographics, education, income, detailed smoking habits, alcohol use, usual dietary 148
habits, body mass index (BMI), medication use, hypertension, diabetes and presence 149
or absence of coronary heart disease, congestive heart failure.(13) Body mass index 150
was calculated as weight (kg)/height (m)2. Hypertension status was defined as either 151
not present (systolic blood pressure <140 mmHg and diastolic blood pressure <90 152
mmHg and no use of antihypertensive medication), borderline (systolic pressure 140–153

8
159 mmHg or diastolic pressure 90–94 mmHg and no use of antihypertensive 154
medication), or definite (systolic pressure ≥160 mmHg or diastolic pressure ≥95 155
mmHg or use of antihypertensive medication). Diabetes mellitus was classified using 156
the American Diabetes Association criteria (21) as not present, impaired fasting 157
glucose, or definite diabetes. Myocardial infarction was diagnosed using an algorithm 158
including cardiac symptoms as chest pain, abnormal cardiac enzyme concentrations, 159
and serial electrocardiogram changes. Fatal CHD included deaths not meeting criteria 160
for myocardial infarction if occurring within 72 h of chest pain or with previous 161
history of ischemic heart disease. CHD includes MI, angina, angiplasty, bypass and 162
death due to atheroscleriotic. Strokes were classified as ischemic if there was 163
evidence of focal brain deficit without evidence of primary hemorrhage; hemorrhagic 164
if there was bloody spinal fluid on lumbar puncture or evidence of blood in the 165
subarachnoid space, ventricles, or parenchyma on brain imaging or at surgery or 166
autopsy that did not appear consistent with hemorrhage into an infarction; or 167
unknown type if information was insufficient for classification.(19) CVD was defined 168
as combined incident stroke, fatal and nonfatal MI and coronary heart disease death. 169
170
Statistical Analysis 171
Cross-sectional associations of PA and PF with TL were assessed using 172
multivariable repeated-measures linear regression, utilizing measures of TL in both 173
1992-93 and 1997-98 and accounting for within-person correlation. To minimize 174
misclassification (measurement error) and also better represent long-term effects of 175
habitual PA and PF, we took advantage of repeated measures of PA to PF to perform 176
cumulative updating (averaging of serial values) (Supplementary Figure 1, SDC, 177
Timeline). When PA or PF were missing, the existing values were carried forward. 178

9
Cumulatively averaged PA and PF measures from 1989-93 were related to TL in 179
1992-93; and cumulatively averaged PA and PF from 1993-98 were related to TL in 180
1997-98. PA measures were assessed as categorical (indicator) variables; with tests 181
for trend evaluated by entering PA categories as ordinal variables. 182
Longitudinal analyses of PA and PF with TL change were assessed using 183
multivariable linear regression. Cumulatively averaged PA and PF from 1989-93 184
were related to the subsequent change in TL between 1992-93 and 1997-98; and 185
changes in cumulatively averaged PA and PF between 1989-93 and 1993-98 were 186
related to changes in TL between 1992-93 and 1997-98. The TL rate of change was 187
calculated in bp/year, as (LTL1997-98 – LTL1992-93)/follow-up years. 188
To minimize confounding, we adjusted models for major demographic factors 189
including age, sex, race, study enrollment site, education, income, smoking status, and 190
usual dietary habits, including consumption of total energy, omega-3 polyunsaturated 191
fatty acids, omega-6 polyunsaturated fatty acids, and dietary fiber.(6, 10) We also 192
evaluated factors which could be plausible biologic intermediates (i.e., on the putative 193
causal pathway between PA and TL), including, body-mass index, waist 194
circumference, fasting glucose, insulin, inflammatory markers, prevalent diseases, 195
including T2DM and CVD. 196
In additional analyses, we evaluated both PA and PF measures in the same model 197
to assess their independent associations with TL. To minimize the possibility of 198
reverse causation (poor health causing low PA/PF), we performed sensitivity analyses 199
restricted to participants reporting only good, very good, or excellent overall health 200
and also having no limitation in activities of daily living or instrumental activities. 201
Because in some participants (45%) the measured change in TL was positive 202
(potentially representing measurement error, given that TL is not generally expected 203

10
to increase), we also performed sensitivity analyses evaluating change in TL as a 204
binary variable (any attrition, yes/no) and as a continuous variable but with any 205
observed increases recoded as 0 (no change). We assessed potential interaction by age, 206
sex, race and BMI by including a cross-product term of each potential modifier and 207
each PA/PF measure in the regression model, evaluating significance of interaction 208
using the Wald test. Analyses were performed using Stata 10.0 (College Station, Tx), 209
two-tailed alpha=0.05. 210
211

11
Results 212
213
At baseline, mean age was 73±5 years, and 62 % of participants were women 214
(Table 1). About 1 in 5 participants had prevalent CHD, and 1 in 7 had prevalent 215
diabetes. Participants spent an average of 1045±1446 kcal per week on leisure-time 216
activities and 35% engaged in moderate intensity PA. On average, participants 217
walked 41±65 blocks per week, with 67% having a pace above 2 mph. The mean time 218
needed to complete a distance of 15 ft and 5 chair stands was 5.5±2.0 and 14.8±4.9 219
seconds, respectively. Additionally, the mean hand grip strength was of 27.5±9.8 kg. 220
Overall at baseline, TL ranged from 5.1 to 8.6 kb, with mean±SD of 6.3±0.6 kb 221
and median 6.3 kb. Mean TL change, calculated as TL1997-98-TL1992-93, was -222
0.012±0.18 kb between 1992-93 and 1997-98, an annualized attrition of -2.44 bp/year. 223
224
Cross-sectional analysis of PA and PF and TL 225
In cross-sectional multivariable-adjusted analyses, greater reported walking 226
distance and a better chair test performance were associated with longer TL (p-227
trend=0.007 and 0.04 respectively) (Table 2). Additionally, a better overall fitness 228
score was associated with a trend toward longer TL (p-trend=0.09). In contrast, 229
walking pace, leisure-time activity, time to complete a 15-ft walk, and hand grip 230
strength were not significantly associated with TL. Analysis included only 231
participants with excellent, very good and good health status and those with no 232
limitations in activities of daily living or instrumental activities generated similar 233
results. 234
235
Longitudinal analysis of PA and PF and change in TL 236

12
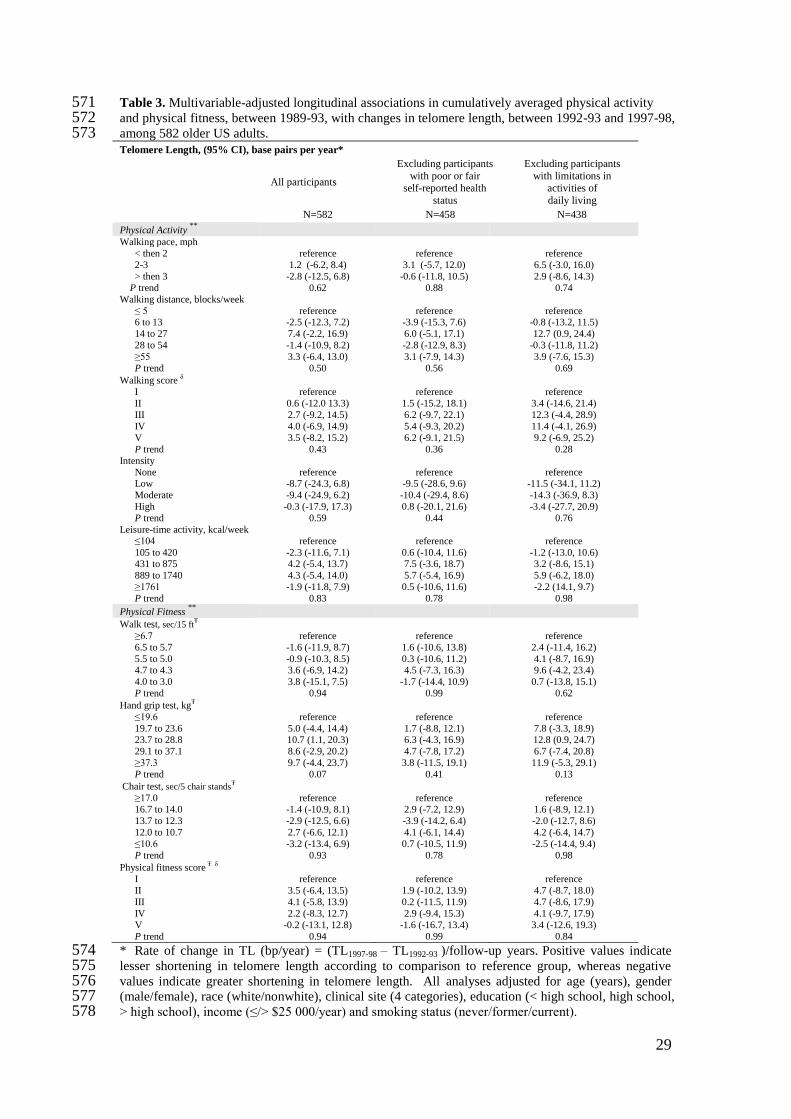
In multivariable longitudinal analyses, no significant associations were observed 237
between PA and PF from 1989-93 and subsequent 5-year change in TL (Table 3). 238
Results including only participants with good or better health status and without 239
limitations in activities of daily living or instrumental activities were generally similar. 240
In secondary analyses evaluating change in TL as a binary variable (attrition, yes/no) 241
or as a continuous variable but with any observed increases re-coded as 0, no 242
significant associations were observed between PA and PF from 1989-93 and 243
subsequent 5-year change in TL (Supplementary Table 1 and 2, SDC, additional 244
statistical analyses). 245
246
Longitudinal analysis of changes in PA and PA and change in TL 247
When we evaluated changes in PA and PF and changes in TL, change in leisure-248
time activity was associated with a trend toward less shortening in TL (p-trend=0.07), 249
and change in chair test performance was associated with less shortening in TL (p-250
trend=0.04). For example, each 1000 kcal/week of increased leisure-time activity was 251
associated with a trend toward 2.2 bp/year less attrition (95%CI: -0.18, 4.6); and each 252
one second change in the time needed to complete 5 chair stands was associated with 253
0.9 bp/year less attrition in TL (95% CI: 0.04 1.8). Other PA measures such as 254
walking pace, walking distance and walking score, and other PF measures such as the 255
walk test, hand grip test, and overall PF score, were not significant associated with 256
change in TL. When we excluded participants with poor self-reported health status or 257
having any limitations in activities of daily living or instrumental activities, 258
associations of changes in leisure-time activity and chair test performance with 259
change in TL were strengthened in magnitude (2.8 bp/year and 1.2 bp/year, 260
respectively) and statistical significance (p-trend=0.04 and 0.02, respectively). Results 261

13
were generally similar in sensitivity analyses recoding any observed increases in TL 262
to no change (Supplementary Table 3, SDC, additional statistical analyses). 263
264
Results were not appreciably altered in several sensitivity analyses, including 265
further adjustment for both PA and PF measures to assess their independent 266
associations with TL or further adjustment for baseline characteristics that could be 267
either confounders or mediators of these relationships (see Methods). Additionally, 268
we performed cumulative averaging with 50% weight given to most recent PA/PF 269
measure, with similar results to the equal weight cumulative averaging (data not 270
shown). 271

14
Discussion 272
In this large prospective study among older adults, average age 73 years at their 273
first measurement of TL, cross-sectional analyses suggested that greater walking 274
distance as well as chair test performance are associated with longer TL. Furthermore, 275
prospective analyses have shown that changes in leisure-time activity and in chair test 276
performance are associated with differences in change in TL. The lack of prospective 277
associations of other PA and PF metrics could be due to measurement error in TL due 278
to DNA degradation, which would have diminished the ability to detect changes. 279
Even so, even later in life, changes in certain PA and PF are associated with TL, 280
suggesting that greater leisure-time activity and fitness could reduce leukocyte 281
attrition among older adults. 282
Telomeres are cap-like nucleoproteins at chromosome ends, which protect genome 283
from degradation and interchromosomal fusion(16, 35). In the normal cellular process, 284
a small portion of telomeric DNA is lost with each cell division, when a limit length is 285
achieved cell undergoes apoptosis.(35) Normally with aging chromosomes become 286
increasingly impaired due to DNA damage, eventually leading to apoptotic signals 287
and cell death; however, telomeres can prevent or delay such damage.(16) It has been 288
hypothesized that certain lifestyles factors may accelerate telomere shortening and 289
consequently affect health, healthy aging, and longevity.(35) Shorter TL is associated 290
with several age-related diseases, (39) including cardiovascular diseases and type 2 291
diabetes.(11) Our observed findings of longer telomeres with some measures of 292
greater PA and PF at baseline and less telomere attrition with some measures of 293
changes in PA and PF longitudinally suggest that PA and PF could influence 294
pathways related to TL. Such an effect could, for example, partly account for the 295
beneficial associations of PA and PF with many age-related diseases. (39) (35) 296

15
Biologic plausibility of our findings is supported by the putative pathways of telomere 297
loss, which are thought to be related to cumulative burdens of oxidative stress and 298
inflammation (2, 14), and the pathways of benefits of regular PA, which include 299
upregulation of antioxidant defense systems (15) and reduced chronic systemic 300
inflammation. (41) By these and other pathways, PA may reduce oxidative DNA 301
damage; (33, 39) for example, duration of exercise has been inversely correlated with 302
biomarkers for DNA and telomere damage and with p16 expression, a biomarker for 303
cellular aging.(39) Interestingly, a bout of acute exercise increases production of free 304
radicals, dependent on intensity and duration.(15) This pro-oxidant response may be 305
necessary for activation of beneficial anti-oxidant and other cellular defense systems 306
(29), by means of which habitual, long-term PA, such as we evaluated in this study, 307
may lead to beneficial physiological adaptations.(15) 308
Another possible explanatory pathway might be through an upregulation of 309
telomerase reverse transcriptase that seems to occur after exercise. (14) For example, 310
mechanisms for beneficial effects of omega-3 fatty acids and PA on survival after 311
acute myocardial infarction could relate to elevation in telomerase expression, 312
resulting in higher regeneration potential (31, 45). Although controversial, some 313
evidence suggests that leucocyte TL could actually elongate over a decade (24); 314
however, others believe that apparent elongation is mainly due to measurement error 315
(40). No consensus seems to exist concerning this potential for lengthening of 316
telomeres; further studies on this topic are needed. 317
In the present work we observed similarities and differences in cross-sectional 318
versus prospective analyses as for example, walking distance but not leisure-time 319
activity in cross-sectional analyses was associated with longer TL; conversely in 320
prospective analyses leisure-time activity but not walking distance was associated 321

16
with differences in change in TL. Interestingly, chair test was associated with both 322
cross-sectional and prospective analyses. The reasons for these specific associations 323
are unknown and our novel findings highlight the need for further investigation of 324
how different types of PA and different measures of PF may influence TL. 325
The American College of Sports Medicine and American Heart Association 326
recommend that older adults engage in at least in 30 min of moderate PA on most 327
days of the week.(1) Our results support these general guidelines by suggesting that 328
long-term PA may influence telomere dynamics later in life. 329
Previous studies of PA and TL have provided inconsistent results; and only 4 were 330
conducted in older adults. (18, 28, 34, 47) Of these, one cross-sectional study among 331
2,006 older Chinese participants reported no association between PA and TL(47); the 332
other 3 studies, also cross-sectional but conducted in much smaller samples (N=32 to 333
204), found positive associations between PA and TL.(18, 28, 34) Our results are 334
consistent with these latter 3 cross-sectional studies and also with other cross-335
sectional studies, conducted among middle age and younger participants, linking 336
higher PA to longer TL.(7, 8, 17, 18, 21, 28, 34, 48) Our findings build upon and 337
expand these previous results by evaluating both cross-sectional and longitudinal 338
associations of PA, PF and TL, including changes in both, in a well-established cohort 339
of older US adults. 340
Our analysis had several strengths. Information on PA, PF, TL and other risk 341
factors was prospectively assessed using standardized methods. Participants were 342
randomly selected and enrolled from Medicare eligibility lists in several US 343
communities, providing a community-based sample of older adults. Serial measures 344
of PA allowed evaluation of cumulatively updated PA, reducing misclassification and 345
providing a better measure of longer-term PA. Serial measures also allowed the novel 346

17
evaluation of how changes in PA relate to changes in TL. Prospective analyses as well 347
as sensitivity analyses excluding less healthy participants reduced the potential for 348
reverse causation, and adjustment for a wide range of covariates minimized the 349
potential impact of confounding. 350
Potential limitations were also present. Measurement error in TL, and in particular 351
TL change, would diminish the ability to detect associations, which would cause 352
underestimation of the magnitude and statistical significance of our findings. 353
Additionally, the TL quantification technique used is a less sensitive method to 354
identify subtle differences between individuals and requires high-quality DNA. We 355
evaluated several different PA and PF indices, increasing the possibility of chance 356
findings. However, several of our findings are consistent with other studies; and one 357
could consider each PA or PF and TL association a separate hypothesis. Borderline p 358
values should be interpreted with caution, with careful attention to both internal 359
consistency and biological plausibility. PA measures were obtained from self-report, 360
and may appropriately reflect relative ordering (ranking) of participants but not 361
precise quantitative levels of energy expenditure. Although a range of covariates were 362
available and evaluated as potential confounders and findings were similar in 363
sensitivity analyses, residual confounding due to unknown or incompletely measured 364
factors cannot be excluded. The assessments of PA, PF, and TL were subject to 365
random error and biological variability, which would attenuate findings toward the 366
null. The prospective associations of cumulatively updated PA with TL could also 367
partly reflect the effects of PA earlier in life; in contrast, the associations of changes 368
in PA with TL would not be confounded by PA at younger ages. Different 369
participants had different number of exposure measures and thus possible different 370
precision of the exposure. Results were attained from older, predominantly white 371

18
Americans and may not be directly generalizable to other populations. Furthermore, 372
our results may only be generalized to leukocyte TL, since it may not reflect TL 373
dynamics in other tissues. Conversely, leukocyte TL is the most commonly measured 374
TL metric, and has been associated with diverse exposures and disease endpoints in 375
prior studies. 376
In sum, our results suggest that greater walking distance and chair test 377
performance are cross-sectionally associated with longer TL; and that changes in 378
leisure-time activity and in chair test performance are associated with differences in 379
change in TL. These results suggest that PA and PF may have a role in the regulation 380
of telomere length during the aging process. 381
382

19
Acknowledgments 383
The authors express their gratitude to the CHS participants. A full list of participating 384
CHS investigators and institutions is at http://www.chs-nhlbi.org. 385
This research was supported by contracts HHSN268201200036C, 386
HHSN268200800007C, N01 HC55222, N01HC85079, N01HC85080, N01HC85081, 387
N01HC85082, N01HC85083, N01HC85086, and grant U01HL080295 from the 388
National Heart, Lung, and Blood Institute (NHLBI), with additional contribution from 389
the National Institute of Neurological Disorders and Stroke (NINDS). Additional 390
support was provided by R01AG023629 the National Institute on Aging (NIA). A full 391
list of principal CHS investigators and institutions can be found at CHS-NHLBI.org. 392
Luisa Soares-Miranda is supported by the Portuguese Foundation of Science and 393
Technology (FCT), SFRH/BPD/76947/2011, PTDC/DES/099018/2008 - 394
FCT/FCOMP-01- 0124-FEDER-009573, and The Research Centre in Physical 395
Activity Health and Leisure is supported by UID/DTP/00617/2013. 396
Dr Imamura received support from the Medical Research Council Epidemiology Unit 397
Core Support (MC_UU_12015/5). 398
The funders had no role in study design or conduct; data collection, management, 399
analysis, or interpretation; or manuscript preparation, review, or approval. 400
Results of the present study do not constitute endorsement by ACSM. 401
402
Conflict of Interest Disclosures 403
None of the authors have a conflict of interest in relation to this manuscript. 404
405
Supplemental Word Content 1. pdf 406
407

20
References 408
409
410
411
1. American College of Sports Medicine, Chodzko-Zajko WJ, Proctor DN et al. 412
American College of Sports Medicine position stand. Exercise and physical 413
activity for older adults. Med Sci Sports Exerc. 2009;41(7):1510-30. 414
2. Aviv A. Telomeres and human aging: facts and fibs. Science of aging 415
knowledge environment : SAGE KE. 2004;2004(51):pe43. 416
3. Benetos A, Gautier S, Lafleche A et al. Blockade of angiotensin II type 1 417
receptors: effect on carotid and radial artery structure and function in 418
hypertensive humans. J Vasc Res. 2000;37(1):8-15; discussion 68-70. 419
4. Benetos A, Okuda K, Lajemi M et al. Telomere length as an indicator of 420
biological aging: The gender effect and relation with pulse pressure and pulse 421
wave velocity. Hypertension. 2001;37(2):381-5. 422
5. Burnett-Hartman AN, Fitzpatrick AL, Kronmal RA et al. Telomere-associated 423
polymorphisms correlate with cardiovascular disease mortality in Caucasian 424
women: the Cardiovascular Health Study. Mech Ageing Dev. 425
2012;133(5):275-81. 426
6. Cassidy A, De Vivo I, Liu Y et al. Associations between diet, lifestyle factors, 427
and telomere length in women. Am J Clin Nutr. 2010;91(5):1273-80. 428
7. Cherkas LF, Hunkin JL, Kato BS et al. The association between physical 429
activity in leisure time and leukocyte telomere length. Arch Intern Med. 430
2008;168(2):154-8. 431

21
8. Du M, Prescott J, Kraft P et al. Physical activity, sedentary behavior, and 432
leukocyte telomere length in women. Am J Epidemiol. 2012;175(5):414-22. 433
9. Epel ES, Merkin SS, Cawthon R et al. The rate of leukocyte telomere 434
shortening predicts mortality from cardiovascular disease in elderly men. 435
Aging. 2009;1(1):81-8. 436
10. Farzaneh-Far R, Lin J, Epel ES, Harris WS, Blackburn EH, Whooley MA. 437
Association of marine omega-3 fatty acid levels with telomeric aging in 438
patients with coronary heart disease. JAMA. 2010;303(3):250-7. 439
11. Fitzpatrick AL, Kronmal RA, Gardner JP et al. Leukocyte telomere length and 440
cardiovascular disease in the cardiovascular health study. Am J Epidemiol. 441
2007;165(1):14-21. 442
12. Fitzpatrick AL, Kronmal RA, Kimura M et al. Leukocyte telomere length and 443
mortality in the Cardiovascular Health Study. J Gerontol A Biol Sci Med Sci. 444
2011;66(4):421-9. 445
13. Fried LP, Borhani NO, Enright P et al. The Cardiovascular Health Study: 446
design and rationale. Annals of epidemiology. 1991;1(3):263-76. 447
14. Garatachea N, Pareja-Galeano H, Sanchis-Gomar F et al. Exercise attenuates 448
the major hallmarks of aging. Rejuvenation research. 2015;18(1):57-89. 449
15. Gomes EC, Silva AN, de Oliveira MR. Oxidants, antioxidants, and the 450
beneficial roles of exercise-induced production of reactive species. Oxidative 451
medicine and cellular longevity. 2012;2012:756132. 452
16. Kelly DP. Cell biology: Ageing theories unified. Nature. 2011;470(7334):342-453
3. 454

22
17. Kim JH, Ko JH, Lee DC, Lim I, Bang H. Habitual physical exercise has 455
beneficial effects on telomere length in postmenopausal women. Menopause. 456
2012;19(10):1109-15. 457
18. LaRocca TJ, Seals DR, Pierce GL. Leukocyte telomere length is preserved 458
with aging in endurance exercise-trained adults and related to maximal aerobic 459
capacity. Mech Ageing Dev. 2010;131(2):165-7. 460
19. Longstreth WT, Jr., Bernick C, Fitzpatrick A et al. Frequency and predictors 461
of stroke death in 5,888 participants in the Cardiovascular Health Study. 462
Neurology. 2001;56(3):368-75. 463
20. Lopez-Otin C, Blasco MA, Partridge L, Serrano M, Kroemer G. The 464
hallmarks of aging. Cell. 2013;153(6):1194-217. 465
21. Ludlow AT, Zimmerman JB, Witkowski S, Hearn JW, Hatfield BD, Roth SM. 466
Relationship between physical activity level, telomere length, and telomerase 467
activity. Med Sci Sports Exerc. 2008;40(10):1764-71. 468
22. McArdle A, Jackson MJ. Exercise, oxidative stress and ageing. J Anat. 469
2000;197 Pt 4:539-41. 470
23. Mozaffarian D, Furberg CD, Psaty BM, Siscovick D. Physical activity and 471
incidence of atrial fibrillation in older adults: the cardiovascular health study. 472
Circulation. 2008;118(8):800-7. 473
24. Nordfjall K, Svenson U, Norrback KF, Adolfsson R, Lenner P, Roos G. The 474
individual blood cell telomere attrition rate is telomere length dependent. 475
PLoS Genet. 2009;5(2):e1000375. 476
25. Okuda K, Khan MY, Skurnick J, Kimura M, Aviv H, Aviv A. Telomere 477
attrition of the human abdominal aorta: relationships with age and 478
atherosclerosis. Atherosclerosis. 2000;152(2):391-8. 479

23
26. Ornish D, Lin J, Daubenmier J et al. Increased telomerase activity and 480
comprehensive lifestyle changes: a pilot study. Lancet Oncol. 481
2008;9(11):1048-57. 482
27. Psaty BM, Kuller LH, Bild D et al. Methods of assessing prevalent 483
cardiovascular disease in the Cardiovascular Health Study. Annals of 484
epidemiology. 1995;5(4):270-7. 485
28. Puterman E, Lin J, Blackburn E, O'Donovan A, Adler N, Epel E. The power 486
of exercise: buffering the effect of chronic stress on telomere length. PLoS 487
One. 2010;5(5):e10837. 488
29. Ristow M, Zarse K, Oberbach A et al. Antioxidants prevent health-promoting 489
effects of physical exercise in humans. Proceedings of the National Academy 490
of Sciences of the United States of America. 2009;106(21):8665-70. 491
30. Sampson MJ, Winterbone MS, Hughes JC, Dozio N, Hughes DA. Monocyte 492
telomere shortening and oxidative DNA damage in type 2 diabetes. Diabetes 493
Care. 2006;29(2):283-9. 494
31. Sanchis-Gomar F, Lucia A. Acute myocardial infarction: ‘telomerasing’ for 495
cardioprotection. Trends in Molecular Medicine 2015 Article in Press. 496
32. Sanders JL, Fitzpatrick AL, Boudreau RM et al. Leukocyte telomere length is 497
associated with noninvasively measured age-related disease: The 498
Cardiovascular Health Study. J Gerontol A Biol Sci Med Sci. 2012;67(4):409-499
16. 500
33. Sattelmair JR, Pertman JH, Forman DE. Effects of physical activity on 501
cardiovascular and noncardiovascular outcomes in older adults. Clin Geriatr 502
Med. 2009;25(4):677-702, viii-ix. 503

24
34. Savela S, Saijonmaa O, Strandberg TE et al. Physical activity in midlife and 504
telomere length measured in old age. Exp Gerontol. 2013;48(1):81-4. 505
35. Shammas MA. Telomeres, lifestyle, cancer, and aging. Current opinion in 506
clinical nutrition and metabolic care. 2011;14(1):28-34. 507
36. Shin YA, Lee JH, Song W, Jun TW. Exercise training improves the 508
antioxidant enzyme activity with no changes of telomere length. Mech Ageing 509
Dev. 2008;129(5):254-60. 510
37. Siscovick DS, Fried L, Mittelmark M et al. Exercise Intensity and Subclinical 511
Cardiovascular Disease in the Elderly: The Cardiovascular Health Study. Am. 512
J. Epidemiol. 1997;145(11):977-86. 513
38. Sjogren P, Fisher R, Kallings L, Svenson U, Roos G, Hellenius ML. Stand up 514
for health--avoiding sedentary behaviour might lengthen your telomeres: 515
secondary outcomes from a physical activity RCT in older people. British 516
journal of sports medicine. 2014;48(19):1407-9. 517
39. Song Z, von Figura G, Liu Y et al. Lifestyle impacts on the aging-associated 518
expression of biomarkers of DNA damage and telomere dysfunction in human 519
blood. Aging Cell. 2010;9(4):607-15. 520
40. Steenstrup T, Hjelmborg JV, Kark JD, Christensen K, Aviv A. The telomere 521
lengthening conundrum--artifact or biology? Nucleic acids research. 522
2013;41(13):e131. 523
41. Stewart LK, Flynn MG, Campbell WW et al. The influence of exercise 524
training on inflammatory cytokines and C-reactive protein. Med Sci Sports 525
Exerc. 2007;39(10):1714-9. 526
42. Svenson U, Nordfjall K, Baird D et al. Blood cell telomere length is a dynamic 527
feature. PLoS One. 2011;6(6):e21485. 528

25
43. Taylor HL, Jacobs DR, Schucker B, Knudsen J, Leon AS, Debacker G. A 529
questionnaire for the assessment of leisure time physical activities. Journal of 530
Chronic Diseases. 1978;31(12):741-55. 531
44. Tell GS, Fried LP, Hermanson B, Manolio TA, Newman AB, Borhani NO. 532
Recruitment of adults 65 years and older as participants in the Cardiovascular 533
Health Study. Annals of epidemiology. 1993;3(4):358-66. 534
45. Terai M, Izumiyama-Shimomura N, Aida J et al. Association of telomere 535
shortening in myocardium with heart weight gain and cause of death. 536
Scientific reports. 2013;3:2401. 537
46. Varela E, Blasco MA. 2009 nobel prize in physiology or medicine: telomeres 538
and telomerase. Oncogene. 2010;29(11):1561-5. 539
47. Woo J, Tang N, Leung J. No association between physical activity and 540
telomere length in an elderly Chinese population 65 years and older. Arch 541
Intern Med. 2008;168(19):2163-4. 542
48. Zhu H, Wang X, Gutin B et al. Leukocyte Telomere Length in Healthy 543
Caucasian and African-American Adolescents: Relationships with Race, Sex, 544
Adiposity, Adipokines, and Physical Activity. J Pediatr. 2010. 545
546
547

26
Table 1. Baseline (1992-93) characteristics of 582 older US adults in the Cardiovascular Health Study 548 with longitudinal assessment of physical activity, physical fitness and telomere length. 549 Characteristic
Age, years 73±5
Gender, % male 38
Race, % white 85
Education
< High school, % 24
High school, % 32
> High school, % 43
Annual income ≥ $25,000, % 39
Smoking habits
Former smoker, % 44
Current smoker, % 10
Body mass index, kg/m² 27±5
Prevalent coronary heart disease, % 20
Prevalent congestive heart failure, % 5
Prevalent diabetes mellitus, % 14
Physical activity
Walking pace, mph
< 2, % 33
> 2, % 67
Walking blocks, blocks/week 41±65
Exercise intensity
None, % 8
Low, % 45
Moderate, % 35
High, % 12
Leisure-time activity, kcal/week 1045±1446
Physical fitness
Walk test, sec/15 ft 5.5±2.0
Hand grip test, kg 27.5±9.8
Chair test, sec/5 chair stands 14.8±4.9
Values are mean ± SD (continuous variables) or percentage (categorical variables). 550 Coronary heart disease=history of myocardial infarction, angina, or coronary revascularization. 551 Congestive Heart Failure = according to the presence of following symptoms: sleep on 2 pillows to 552 breathe, awakened at night by trouble breathing, swelling of feet and ankles during the day which goes 553 down overnight. Diabetes =fasting glucose >140 mg/dl, two hour post-oral challenge glucose >200 554 mg/dl, or use of insulin or oral hypoglycemic medications. 555
556

27
Table 2. Multivariable-adjusted cross-sectional associations in cumulatively averaged physical activity 557 and physical fitness, between 1989-90 and 1992-93 and between 1993-94 and 1997-98, with telomere 558 length, from1992-93 and 1997-98, among 1164 older US adults. 559
Telomere Length, (95% CI), base pairs *
All participants
Excluding participants with poor or fair
self-reported health status
Excluding participants
with limitations in
activities of daily living
N=582 N=458 N=438
Physical Activity** Walking pace, mph
< then 2 reference reference reference
2-3 9.5 (-18.3, 37.4) 10.2 (-21.6, 42.0) 11.6 (-21.1, 44.3) > then 3 -19.5 (-67.3, 28.3) -14.1 (-66.6, 38.5) -19.8 (-72.1, 32.5)
P trend 0.78 0.86 0.72
Walking distance, blocks/week ≤ 5 reference reference reference
6 to 13 33.0 (-6.6, 72.6) 54.7 (8.2, 101.2) 17.3 (-32.6, 67.2)
14 to 27 36.9 (-6.9, 80.8) 62.6 (12.6, 112.4) 17.8 (-35.6, 71.2) 28 to 54 46.2 (-1.4, 91.8) 66.6 (13.9,119.3) 24.9 (-30.4, 80.1)
≥55
P trend
79.4 (27.6, 131.3)
0.007
109.6 (50.7, 168.6)
0.002
60.0 (-0.4, 120.4)
0.06 Walking Scoreδ
I reference reference reference
II 17.9 (-26.9, 62.8) 23.2 (-32.3, 78.6) 28.9 (-28.1, 85.9) III 4.3 (-53.1, 61.7) 22.1 (-44.9, 89.0) 17.8 (-51.4, 87.0)
IV 13.3 (-34.7, 61.4) 38.6 (-19.9, 97.1) 28.0 (-30.9, 86.9) V 18.7 (-29.4, 66.8) 37.1(-21.8,96.1) 30.2(-28.8, 89.1)
P trend 0.54 0.95 0.49
Intensity None reference reference reference
Low 28.4 (-14.8, 71.6) 6.0 (-47.6, 59.6) 24.1 (-32.2, 80.3)
Moderate 32.9 (-12.7, 78.6) 10.6 (-44.4, 65.6) 35.6 (-23.5, 94.7) High 58.4 (-4.1, 120.9) 35.9 (-34.7, 106.4) 79.0 (4.2, 153.9)
P trend 0.12 0.33 0.04
Leisure-time activity, kcal/week <104 reference reference reference
105 to 420 34.9 (-4.5, 74.5) 31.9 (-14.3, 78.0) 59.2 (9.9, 108.5)
431 to 875 28.9 (-15.5, 73.4) 27.4 (-24.4, 79.2) 47.6 (-6.7, 101.8)
889 to 1740 35.3 (-11.4, 82.1) 34.6 (-19.3, 88.6) 44.2 (-13.7, 102.1)
≥1761 38.8 (-11.1, 88.7) 35.6 (-20.5, 91.8) 61.8 (2.4, 121.2)
P trend 0.21 0.39 0.31 Physical Fitness**
Walk test , sec/15 ft Ŧ
≥6.7 reference reference reference 6.5 to 5.7 16.2 (-11.9, 8.7) 10.5 (-37.9, 58.8) 14.5 (-33.0, 62.0)
5.5 to 5.0 37.5 (-10.3, 8.5) 41.1 (-11.9, 94.1) 50.7 (-1.6, 103.1)
4.7 to 4.3 46.1 (-6.9, 14.2) 51.7 (-4.4, 107.7) 47.2 (-9.0, 103.4) 4.0 to 3.0 31.5 (-15.1, 7.5) 33.2 (-29.3, 95.6) 25.4 (-37.6, 88.4)
P trend 0.20 0.18 0.41
Hand grip test, kgŦ <19.6 reference reference reference
19.7 to 23.6 -13.9 (-56.4, 28.6) -24.0 (-69.1, 21.1) -5.8 (-53.4, 41.7)
23.7 to 28.8 -1.6 (-56.4, 53.3) -27.3 (-85.8, 31.3) 21.9 (-41.4, 85.4) 29.1 to 37.1 20.1 (-47.5, 87.6) -3.5 (-76.7, 69.6) 42.2 (-35.8, 120.2)
≥37.3 37.9 (-52.9, 128.7) 12.2 (-85.7, 110.1) 35.9 (-66.7, 138.5)
P trend 0.47 0.95 0.36 Chair test, sec/5 chair stands
Ŧ
≥17.0 reference reference reference
16.7 to 14.0 -2.9 (-41.2, 35.3) -16.3 (-60.3, 27.7) -18.5 (-61.3, 24.3) 13.7 to 12.3 8.5 (-34.5, 51.5) 8.4 (-40.6, 57.3) 2.6 (-44.6, 49.8)
12.0 to 10.7 29.7 (-15.2, 74.6) 34.9 (-15.2, 84.9) 18.7 (-31.3, 68.6)
<10.6 39.8 (-7.3, 86.9) 41.2 (-11.8, 94.1) 21.9 (-29.5, 73.4) P trend 0.04 0.02 0.18
Physical fitness score Ŧ δ
I reference reference reference II -11.6 (-50.7, 27.4) -31.7 (-78.2, 14.8) -22.9 (-70.0, 24.2)
III 8.8 (-35.9, 53.6) -18.5 (-72.6, 35.7) 1.0 (-52.7, 54.8)
IV 35.1 (-14.9, 85.1) 16.6 (-42.3, 75.5) 20.0 (-38.6, 78.6) V 31.9 (-28.5, 92.3) 9.8 (-60.3, 80.0) 13.5 (-54.42, 80.7)
P trend 0.09 0.18 0.29
* All analyses adjusted for age (years), gender (male/female), race (white/nonwhite), clinical site (4 560 categories), education (< high school, high school > high school), income (≤/> $ 25 000/year) and 561 smoking status (never/former/current). 562

28
563 ** Cross-sectional (mix-model) analysis according to physical activity and physical fitness cumulative 564 average between 1997-98 and 1992-93. 565 δ
Walking score is an ordinal score based on the combination of walking pace and walking distance. 566 Physical fitness score is an ordinal score based on the combination of performances on the walk test, 567 hand grip test and chair test (each in quintiles). 568 Ŧ
Sample size included ~ 25-40 fewer participants in each analysis due to missing data on the exposure. 569 570
29
Table 3. Multivariable-adjusted longitudinal associations in cumulatively averaged physical activity 571 and physical fitness, between 1989-93, with changes in telomere length, between 1992-93 and 1997-98, 572 among 582 older US adults. 573 Telomere Length, (95% CI), base pairs per year*
All participants
Excluding participants
with poor or fair self-reported health
status
Excluding participants
with limitations in activities of
daily living
N=582 N=458 N=438
Physical Activity **
Walking pace, mph
< then 2 reference reference reference
2-3 1.2 (-6.2, 8.4) 3.1 (-5.7, 12.0) 6.5 (-3.0, 16.0)
> then 3 -2.8 (-12.5, 6.8) -0.6 (-11.8, 10.5) 2.9 (-8.6, 14.3)
P trend 0.62 0.88 0.74
Walking distance, blocks/week
≤ 5 reference reference reference 6 to 13 -2.5 (-12.3, 7.2) -3.9 (-15.3, 7.6) -0.8 (-13.2, 11.5)
14 to 27 7.4 (-2.2, 16.9) 6.0 (-5.1, 17.1) 12.7 (0.9, 24.4)
28 to 54 -1.4 (-10.9, 8.2) -2.8 (-12.9, 8.3) -0.3 (-11.8, 11.2)
≥55 3.3 (-6.4, 13.0) 3.1 (-7.9, 14.3) 3.9 (-7.6, 15.3)
P trend 0.50 0.56 0.69
Walking score δ
I reference reference reference
II 0.6 (-12.0 13.3) 1.5 (-15.2, 18.1) 3.4 (-14.6, 21.4)
III 2.7 (-9.2, 14.5) 6.2 (-9.7, 22.1) 12.3 (-4.4, 28.9)
IV 4.0 (-6.9, 14.9) 5.4 (-9.3, 20.2) 11.4 (-4.1, 26.9)
V 3.5 (-8.2, 15.2) 6.2 (-9.1, 21.5) 9.2 (-6.9, 25.2)
P trend 0.43 0.36 0.28
Intensity
None reference reference reference Low -8.7 (-24.3, 6.8) -9.5 (-28.6, 9.6) -11.5 (-34.1, 11.2)
Moderate -9.4 (-24.9, 6.2) -10.4 (-29.4, 8.6) -14.3 (-36.9, 8.3)
High -0.3 (-17.9, 17.3) 0.8 (-20.1, 21.6) -3.4 (-27.7, 20.9)
P trend 0.59 0.44 0.76
Leisure-time activity, kcal/week
≤104 reference reference reference
105 to 420 -2.3 (-11.6, 7.1) 0.6 (-10.4, 11.6) -1.2 (-13.0, 10.6) 431 to 875 4.2 (-5.4, 13.7) 7.5 (-3.6, 18.7) 3.2 (-8.6, 15.1)
889 to 1740 4.3 (-5.4, 14.0) 5.7 (-5.4, 16.9) 5.9 (-6.2, 18.0)
≥1761 -1.9 (-11.8, 7.9) 0.5 (-10.6, 11.6) -2.2 (14.1, 9.7)
P trend 0.83 0.78 0.98
Physical Fitness **
Walk test, sec/15 ftŦ
≥6.7 reference reference reference
6.5 to 5.7 -1.6 (-11.9, 8.7) 1.6 (-10.6, 13.8) 2.4 (-11.4, 16.2)
5.5 to 5.0 -0.9 (-10.3, 8.5) 0.3 (-10.6, 11.2) 4.1 (-8.7, 16.9) 4.7 to 4.3 3.6 (-6.9, 14.2) 4.5 (-7.3, 16.3) 9.6 (-4.2, 23.4)
4.0 to 3.0 3.8 (-15.1, 7.5) -1.7 (-14.4, 10.9) 0.7 (-13.8, 15.1)
P trend 0.94 0.99 0.62
Hand grip test, kgŦ
≤19.6 reference reference reference
19.7 to 23.6 5.0 (-4.4, 14.4) 1.7 (-8.8, 12.1) 7.8 (-3.3, 18.9) 23.7 to 28.8 10.7 (1.1, 20.3) 6.3 (-4.3, 16.9) 12.8 (0.9, 24.7)
29.1 to 37.1 8.6 (-2.9, 20.2) 4.7 (-7.8, 17.2) 6.7 (-7.4, 20.8)
≥37.3 9.7 (-4.4, 23.7) 3.8 (-11.5, 19.1) 11.9 (-5.3, 29.1)
P trend 0.07 0.41 0.13
Chair test, sec/5 chair standsŦ
≥17.0 reference reference reference 16.7 to 14.0 -1.4 (-10.9, 8.1) 2.9 (-7.2, 12.9) 1.6 (-8.9, 12.1)
13.7 to 12.3 -2.9 (-12.5, 6.6) -3.9 (-14.2, 6.4) -2.0 (-12.7, 8.6)
12.0 to 10.7 2.7 (-6.6, 12.1) 4.1 (-6.1, 14.4) 4.2 (-6.4, 14.7)
≤10.6 -3.2 (-13.4, 6.9) 0.7 (-10.5, 11.9) -2.5 (-14.4, 9.4)
P trend 0.93 0.78 0.98
Physical fitness score Ŧ δ
I reference reference reference
II 3.5 (-6.4, 13.5) 1.9 (-10.2, 13.9) 4.7 (-8.7, 18.0)
III 4.1 (-5.8, 13.9) 0.2 (-11.5, 11.9) 4.7 (-8.6, 17.9)
IV 2.2 (-8.3, 12.7) 2.9 (-9.4, 15.3) 4.1 (-9.7, 17.9)
V -0.2 (-13.1, 12.8) -1.6 (-16.7, 13.4) 3.4 (-12.6, 19.3)
P trend 0.94 0.99 0.84
* Rate of change in TL (bp/year) = (TL1997-98 – TL1992-93 )/follow-up years. Positive values indicate 574 lesser shortening in telomere length according to comparison to reference group, whereas negative 575 values indicate greater shortening in telomere length. All analyses adjusted for age (years), gender 576 (male/female), race (white/nonwhite), clinical site (4 categories), education (< high school, high school, 577 > high school), income (≤/> $25 000/year) and smoking status (never/former/current). 578

30
** Longitudinal analysis according to physical activity and physical fitness cumulative average of 1989-579
90, 1990-91, 1991-92, 1992-93 (or the ones available). 580 δ Walking score is an ordinal score based on the combination of walking pace and walking distance. 581
Physical fitness score is an ordinal score based on the combination of performances on the walk test, 582 hand grip test and chair test (each in quintiles). 583 Ŧ
Sample size included ~ 25-40 fewer participants in each analysis due to missing data on the exposure. 584 585

31
Table 4. Multivariable-adjusted associations of changes in cumulatively averaged physical activity 586 and physical fitness between 1989-93 and 1993-98 with changes in telomere length between 1992-93 587 and 1997-98 among 582 older US adults. 588
Differences in Telomere Length, (95% CI), base pairs per year*
All participants
Excluding participants
with poor or fair
self-reported health status
Excluding participants
with limitations in activities of
daily living
N=582 N=458 N=438
Physical Activity **
Change in walking pace, per each higher mph
(≤-2: 3.3%; -1.5 to -1: 24.3%; 0.5: 15.0%; 0: 44.6%; 0.5:
6.9%; ≥1: 5.9%)***
-0.6 (-4.9, 3.7) -2.0 (-6.9, 2.8) -3.2 (-8.2,1.7)
0.78 0.41 0.20
Change in walking distance, per higher blocks/week
(mean± SD: -7.7 ± 33.5; 10th
percentile: -42.1 ; 90th
percentile: 22.1)
0.04 (-0.05, 0.13) -0.01 (-0.10, 0.1) 0.06 (-0.03, 0.15)
0.40 0.90 0.19
Change in walking score, per 1 higher unitδ
(≤-1.3: 4.1%; -1: 20%; -0.75 to -0.25: 5.7%; 0: 50.8%;
0.27to 0.74: 3.4%; ≥ 2: 16%)***
-1.6 (-5.5, 2.2) -3.1 (-7.5, 1.3) -0.7 (-5.1, 3.8)
0.41 0.17 0.76
Change in leisure-time activity, per higher
1000kcal/week
(mean± SD: -345.9 ± 1238.8; 10th
percentile: -1653.8 ; 90
th percentile: 735)
2.2 (-0.18, 4.6) 2.3 (-0.20, 4.8) 2.8 (0.15, 5.4)
0.07 0.07 0.04
Physical Fitness **
Change in walk test, per 1 higher sec/15 ftŦ
(mean± SD: 0.4±1.9; 10th
percentile: -0.9; 90th
percentile: 1.8)
0.2 (-1.4, 1.8) 0.5 (-1.2, 2.3) 2.1 (-0.5,4.6)
0.80 0.56 0.11
Change in hand grip test, per higher kgŦ
(mean± SD: -0.6 ± 3.6; 10th
percentile: -5.0 ; 90th
percentile: 3.7)
0.4 (-0.5, 1.3) 0.4 (-0.6, 1.4) 0.3 (-0.7, 1.3)
0.37 0.41 0.60
Change in chair test, per 1 higher sec/5 chair standsŦ
0.9 (0.04, 1.8) 1.1 (0.5, 2.2) 1.2 (0.2, 2.2)
(mean± SD: 2.2 ± 3.6; 10th
percentile: -1.7 ; 90th
percentile: 6.5) 0.04 0.04 0.02
Change in physical fitness score, per 1 higher unitŦ δ
(≤-1: 18.7%; 0: 43.9%; ≥1: 37,4%)***
-2.2 (-6.0, 1.6) -2.7 (-6.8, 1.3) -2.4 (-6.6, 1.7)
0.25 0.19 0.25
* Rate of change in TL (bp/year) = (TL1997-98 – TL1992-93 )/follow-up years. Positive values indicate 589 lesser shortening in telomere length, whereas negative values indicate greater shortening in telomere 590 length. All analyses adjusted for age (years), gender (male/female), race (white/nonwhite), clinical site 591 (4 categories), education (< high school, high school, > high school), income (≤/> $25 000/year) and 592 smoking status (never/former/current). 593 **Longitudinal analysis according to physical activity and physical fitness cumulative average 594 difference between 1997-98 and 1992-93. 595 *** Categories of change, and the proportion of participants in each category 596 δ Walking score is an ordinal score based on the combination of walking pace and walking distance. 597
Physical fitness score is an ordinal score based on the combination of performances on the walk test, 598 hand grip test and chair test (each in quintiles). 599 Ŧ
Sample size included ~ 25-40 fewer participants in each analysis due to missing data on the exposure. 600