mmn - st. louis fed · june196j iii reportingbases-(continued)...
TRANSCRIPT

mMn ':,';V.
fev;';;;;::-;i;H|:;:v:,:i;:>;i;i;::::':|:j;j::;'^
'|,n;'l';:;i!:i!:r:;;i;|:;:::':;>g;;::;^^^
H:;||i|


-'•-^V''--^^.^ DEPAR^
LIBRARYRnnivi 50'^n
J UN 2 31972
TREASURY DEPARTMENT


TREASURY DEPARTMENTFISCAL SERVICE. BUREAU OP ACCOUNTS
OFFICE OF THE COMMISSIONERWASHINGTON 25. DC.
OFFICIAL BUSINESS
POSTAGE AND FEES PAIDU.S. TREASURY DEPARTMENT!
BUYAND
HOLDUNITEDS TAT E S
SAVINGS
BONDS

FMEAmMY.MUILMFm
JUNE - 1963
UNITED STRTES TREFISURV DEPRRTMENTOFFICE OF THE SECRETBRV

The Treasury Bulletin is for sale by the
Superintendent of Documents,
U. S. Government Printing Office, Washington 25, D. C.
Subscription per year $8.50 domestic. 111. 00 foreignSingle copy price varies

June 196J
Table of Contents
Page
Trea sury f inane ing opera t ions A-1
Summary of Federal fiscal operations 1
Budget receipts and expenditures 2
Trust accoimt and other transactions..,. 12
Cash income and outgo 17
Account of the Treasurer of the United States 25
Debt outstanding 27
Statutory debt limitation 32
Public debt operations 33
United States savings bonds 59
Ownership of Federal securities 63
Treasury survey of ownership of Federal
securities 65
Market quotations on Treasiory securities 69
Average yields of long-term bonds 72
Monetary statistics 74
National bank reports '7B
International financial statistics 79
Capital movements °^
Corporations and certain other business-type
activities - statements of financial condition.... 92
Cumulative table of contents 125

II Treasury Bulletin
Reporting Bases
Data on receipts, expenditures, and debt which appear
In the "Treasury Bulletin" are based largely on two Treasury
financial reports, the "Dally Statement of the United States
Treasury" and the "Monthly Statement of Receipts and Ex-
penditures of the United States Government." Certain mone-
tary statistics are based at least In part on the "Circula-
tion Statement of United States Money." Where these state-
ments are given as sources for Individual tables, they are
cited by name only. Their respective reporting bases are
described below. For other data In the Bulletin, Informa-
tion on sources or reporting bases Is given In connection
with the tables themselves.
The monthly statement of receipts and expenditures
was first published for February 195^+, and replaced the
dally statement as the primary source of Information on
budget results and other receipt and expenditure data
classified by type of account. At the same time, the
dally statement was changed to a statement of cash deposits
and withdrawals affecting the account of the Treasurer of
the United States. Both publications have provided compar-
ative figures on their respective bases from the beginning
of the flscEil year 1953» The announcement of February 17,
1954, with respect to these reporting changes may be found
In the April 1951+ Issue of the Bulletin.
The monthly statement shows all receipts and expendi-
tures of the Government, Including those made from cash
accounts held outside the United States Treasury. The
information is compiled from reports by the Treasurer of
the United States and by all other collecting and dis-
bursing agencies, including those agencies which maintain
checking accounts in oomfneroial banks. These reports cover
transactions recorded in the accounts of the agenciesduring the reporting period. The net of the transactions
as compiled from these reports is reconciled in the monthly
statement to changes in the balance in the Treasurer's ac-
count and in cash held outside the Treasurer's account and
changes in the public debt outstanding.
Receipts of taxes and customs duties are reported on a
collections basis. Other receipts are reported partially
on a collections basis and partially on a deposits basis.
Expenditures, except Interest on the public debt, are re-
ported on the basis of checks Issued or cash payments made
by disbursing officers. Transactions of an interfund or
Intragovernmental nature are included on the same basis
even though the actual issuance of checks may not be In-
volved. Interest on the public debt is Included on an
accrual basis beginning with figures for June I955 and
the fiscal year 1955. Prior to that, it was included on
a due and payable basis. The same reporting basis as that
in the monthly statement provides the fiscal year figures
for the Treasury's "Combined Statement of Receipts, Expend-
itures and Balances of the United States Government" and
for actual receipts and expenditures in the "Budget of the 1
United States Government."
Beginning with the final statement for the fiscal
year i960, the monthly statement reports totals for net
budget receipts and budget expenditures after deduction
of certain Interfund transactions which are included in
the detail of both budget receipts and budget expenditures.
The transactions deducted consist of interest payments and
minor amounts of certain other payments made by Government
agencies to the Treasury. This reporting change was made in
accordance with the plan stated in the President's Budget
Message of January IS, i960. It does not affect the surplus
or deficit. Figures for earlier periods shown in the Treas-
ury Bulletin were revised to the new reporting basis in the
September I96O Issue, The Interfund transactions deducted
under this procedure do not include payments to the Treas-
ury by wholly owned Government corporations for retirement
of their capital stock and for disposition of earnings.
These capital transfers have been excluded currently from
budget receipts and budget expenditures beginning July 1,
1946, and figia-es for prior fiscal years back through 1932were revised accordingly at that time.
The -daily statement on the new basis was first issued
for February I7, 1954. In the deposits and withdrawals as
shown, no distinction is made as to the type of accounts
(budget, trust, etc.). The deposits are on the basis of
certificates of deposit cleared through the account of the
Treasurer of the United States. Total withdrawals are on
the basis of checks paid or cash disbursements made out of
the Treasurer's account. Some of the withdrawal classi-
fications shown are reported on the basis of mailed reports
of checks Issued and are adjusted by means of clearing ac-
counts to the total of checks paid. Except for relatively
minor amounts, noncash interfund and other Intragovernmental
transactions are excluded. The public debt figures in the
daily statement also are on a "clearance" basis, v;lth the
exception of those issuance and retirement transactions
reported on the basis of telegrams from Federal Reserve
Banks. Noncash debt transactions are Included, however.
The dally statement before February 17, 195'^> covered
not only transactions cleared through the Treasurer's ac-
count but also certain Government agency transactions which
were handled through commercial bank accounts, and included
noncash interfund and other intragovernmental transactions.
It provided information similar to that in the present dally
statement with respect to the status of the Treasurer's ac-
count, and similar to that in the present end-of-month dally
statement with respect to debt issuance, retirement, and
amount outstanding. Receipts and expenditures, however, were
classified by type of account, and the budget results shown

June 196JIII
Reporting Bases - (Continued)
In the dally statement were used as the basis for reflectingthe results under the President's budget program as enactedby the Congress.
Receipts were on the basis of deposits as they clearedthe Treasurer's account. Expenditures cleared through thethe Treasurer's account were reported on two successivebases. Through 1914-6 they were on the basis of checks paidby the Treasurer of the United States. Beginning with I9U7,
expenditures made through the facilities of the TreasuryDepartment's Division of Disbursement were on the basisof checks Issued, while certain others, principally those
of the Department of Defense and Its predecessor organiza-tions, were on the basis of checks paid. Transactions han-
dled through commercial bank accounts, consisting of markettransactions In public debt and guaranteed securities, wereas reported by the agencies. Interest on the public debtwas Included on a due and payable basis beginning withNovember 19U9 and on a checks-paid basis prior to that time.
The circulation statement reflects transactions through
the Treasurer's account which affect monetary stocks of goldand silver and the amounts of coin and currency in the moneysupply of the country. It Is Issued later than the dally
statement, however, and the figures are based on transac-tions consummated during the reporting period even thoughsome may not have cleared the Treasurer's account during
that period.
Note: Where calculations have been made from unrounded figures, the details may not check to the totals shown.


Jane 196 J A^l
Treasury Financing Operatlona
June Financing
In beginning Ite caeb borrowing progrcun for the re-
mainder of 1963. the Treasury announced on June 6 an of-
fering on June 11 of a 4- percent bond to mature In seven
years and two months. The amount offered to the public
was $1-1A billion, or thereabouts; In addition the Sec-
retary of the Treasury offered full allotment on subscrip-
tions up to $100,000 and reserved the right to allot up to
I50 million to Qovernment Investment accounts . Subscrip-
tions were received on June 11 only.
Allotments on the $16.3 billion of subscriptions from
the public totaled $1.9 billion. In view of the large
public subscriptions, none was allotted to Government In-
vestment accounts. Subscriptions for more than $100,000
were allotted 5 percent but not less than |100,000, and
those for $100,000 or less were allotted In full. Pre-
liminary reports of subscriptions received show that there
were $'<-,835 million from savings-type Investor groups,
$7i959 million from commercial banks, and $3,46g million
from all others.
The new bonds are dated June 20,1963, and bear Interest
from that date at the rate of ^ percent per annum, payable
on a semiannual basis on February I5 and August I5, 196*t,
£md thereafter on February 15 and August 15 In each year
until the principal amount becomes payable at their maturity
on August 15, 1970. Bearer bonds with Interest coupons
attached or bonds registered as to principal and Interest
were Issued In denominations of $50Q $1,00Q $5,000, $10,000,
$100,000, and $1,000,000. Subscribers to registered bonds
were required to furnish appropriate Identifying numbers as
required on tax returns and other documents submitted to the
Internal Revenue Service.
Payment for the bonds was required to be made or com-
pleted on or before June 20, I963, or on later allotment.
Any qualified depositary was permitted to make payment by
credit In Its Treasury tax and loan account for bonds al-
lotted to It for Itself and Its customers up to any amount
for idilch It was qualified In excess of existing deposits.
Subscriptions were received without deposit from bank-
ing Institutions for their own account, Federally Insured
savings and loan associations. States, political subdivi-
sions or Instrumentalities thereof, public pension and re-
tirement and other public funds. International organiza-
tions In which the United States holds membership, foreign
central banks and foreign States, and dealers who make
primary markets In Qovernment securities and report dally to
the Federal Reserve Bank of New York their positions with
respect to Government securities and borrowings thereon.
All others were required to accompany their subscriptions
by payment of 10 percent of the amount of bonds applied for.
Subscriptions from commercial banks for their own ac-
count were restricted In each case to an amount not exceed-
ing 10 percent of the combined amount of time and savings
deposits. Including time certificates of deposit, or 25
percent of the combined capital, surplus and undivided
profits of the subscribing bank, whichever was greater.
Commercial banks were asked not to make unsecured loans or
loans oollaterallzed in whole or In part by the bonds sub-
scribed for, to cover the deposits required to be paid when
subscriptions were entered, and were required to make the
usual certification to that effect. All subscribers to the
bonds were required to agree not to purchase or to sell, or
make any agreements with respect to the purchase or sale or
other disposition of the bonds subscribed for under this
offering until after June 11.
Weekly Treasury Bills
Hay Issues of regular weekly bills totaled $10.5
billion, refunding $10.2 billion maturing and providing $0.3
billion of new cash. In the eleven months of the fiscal
year I963, new money financing through Increasing weekly
bills (Including a strip of $1.0 billion issued November 15),
has totaled $5.5 billion. New bill Issues In May consisted
of five 13-week Issues of $1.3 billion each and five 26-week
Issues of $0.g billion each. Except for the 13-week bills
dated May 3I, which mature In 90 days, all the Issues have
91-day or lg2-day maturities. Average rates of discount are
shown In the following table.
13-week

A-2 Treasury Bulletin
Treasury Financing Ooeratlons - (Continued)
Foreign Series and Foreign Currency Series
In May the Treasury Issued six certificates of In-
debtedness of the foreign series totaling |123 million and
three bonds of the foreign currency series totaling $33
million.
The certificates were Issued at various Interest rates,
ranging from 2.0 percent for the shortest term of 46 days
to 2.90 percent, 2.95 percent, and 3-00 percent for the five
three-month Issues. As of May "}! the outstanding foreign
series securities totaled $5^3 million.
Of the new foreign currency bonds, one was an 18-month
2.82 percent Issue denominated In Swiss francs. The other
two were denominated In Belgian franos, both with two-year
maturities, one bearing Interest at 3-26 percent, Eind the
other, at 3-22 percent. These were the first Instances of
such borrowing In Belgian francs.
Foreign currency series securities outstanding May "}!,
1963, aggregated $630 million. In addition to Belgian and
Swiss currencies the securities sire denominated In Austrian
Bohllllngs, Italian lire, and Oerman marks.
Note: Details of Treasury financing operations are shown elsewhere in this issue of the Bulletin in the tables on public debt operations.

June 196J
SUMMARY OF FEDERAL FISCAL OPERATIONS
(In millions of dollars)
Period
Fiscal years:1950195119521953195419551956195719581959196019611962
1963 (Est.)..
1964 (Est.)..
Calendar years:
195019511952
1953195419551956195719581959196019611962
Months
:
1961-JulyAugSept....
GotNovDeo
1962-JanFebUbt
AprMayJune. . .
.
July. . .
.
AugSept....
OctNovDec
1963-Jan
Feb
Mar
AprMay
1963 to date.
Budget receipts and expenditxires
Net
receipts
V
36,42247,48061,28764,67164,42060,20967,85070,56268,55067,91577,76377,65981,409
85,50086,900
37,23552,87764,70563,65460,93863,11970,61671,74968,26272,73879,51878,15784,709
2,9826,3678,945
3,U16,4247,967
5,3576,7299,104
5,7547,024
11,615
3,5667,089
10,053
3,0307,0278,360
5,5337,3059,663
5,7356,953
74,315
Expend-itxires
1/
39,54443,97065,30374,12067,53764,38966,22468,96671,36980,34276,53981,51587,787
94,31198,802
37,65756,23670,54772,81164,62265,89166,83871,15775,34979,77877,56584,46391,907
6,3227,6316,771
7,7967,4857,160
7,3956,8587,749
7,2897,2298,102
7,2528,5417,327
8,5248,0707,572
8,0136,7637,806
7,5907,470
84,927
Surplus
,
ordeficit(-)
-3,122
3,510-4,017-9,449-3,117-4,1801,6261,596
-2,819-12,427
1,224-3,856-6,378
-8,811-11,903
-422
-3,358-5,842-9,157-3,683-2,7713,779
592-7,088-7,0401,953
-6,306-7,199
-3,340-1,2652,174
-4,655-1,060
807
-2,038-1291,356
-1,535-205
3,513
-3,686-1,4522,727
-5,494-1,042
788
-2,480
542
1,857
-1,854-516
-10,612
Net of
trustaccountand othertrans-actions
2/
99679147435328231-194195633
-329-50
-602
436
-693-107
311815-41101739
-259267
1,092-691
23-698
234729
-66
-120
44
-154317258
-152381
-145
132258-317
208-59
-126
-15
106457
-126
404-270
269-223
625
Clearing
account,etc. 2/
483-2L4-401-250-303284522
-523530-6
-145507448
-20-100
87-106-319-209-34376-21
224109
-237154204183
-129-498682
140-543
10
333-78978
-384-130
67
-248-304481
189-1,7961,075
635-206864
-260-320
111
Net
increasein
publicdebt, ordecrease(-)
4,587-2,1353,8836,9665,1893,115
-1,623-2,2245,8168,3631,6252,6409,230
5,29312,110
-4232,7117,9737,7773,5822,019-4,W1-1,7308,0257,875-581
5,9527,301
3,4331,310
35
1,9111,350-842
345470-896
8642,222-973
-325
3,966-2,344
2,5693,323
-1,920
-53
1,221-1,645
173
2,038
7,003
NetIncrease in
Treasurer'saccountbalance, ordecrease (-)
2,0471,839-388
-2,2992,096-551331
-956
4,159-4,3992,654-1,3113,736
-4,230
-44762
1,770-1,488
603-635
-11717935562282883
1,015
-101-572
2,936
-2,75963
234
-1,513644
1,293
-924
2,U52,290
-4,0512,151
738
-2,750591
400
-2,024
1,961806
-1,672978
-2,873
Levels, end of period
Treasurer'saccountbalance
5,5177,3576,9694,6706,7666,2166,5465,5909,7495,3508,0056,69410,430
6,2006,200
4,2324,2956,0644,5775,1804,5454,4274,6064,9615,5836,4116,4947,509
6,5936,0208,956
6,1976,2616,494
4,9815,6266,919
5,9958,U110,430
6,3808,5309,268
6,5187,1097,509
5,485
7,4468,252
6,5797,558
7,558
Debt outstanding
Publicdebt
257,357255,222259,105266,071271,260274,374272,751270,527276,343284,706286,331288,971298,201
303,494315,604
256,708259,419267,391275,168278,750280,769276,628274,898282,922290,798290,217296,169303,470
292,404293,714293,750
295,660297,011296,169
296,513296,983296,088
296,952299,174298,201
297,876301,842299,498
302,067305,390303,470
303,417
304,638302,993
303,166305,204
305,204
Guaranteedsecurities
20294652
81
4474
107101111140240
444
600514
24425476
3453
103104109127156330518
239249271
299315330
347371
402
405430444
448470487
486503518
531
541548
562
577
577
TotalFederalsecurities
257,377255,251259,151266,123271,341274,418272,825270,634276,444284,817286,471289,211298,645
304,094316,118
256,731259,461267,445275,244278,784280,822276,731275,002283,031290,925290,373296,499303,988
292,643293,964294,020
295,959297,325296,499
296,860297,354296,489
297,357299,604298,645
298,324302,312299,986
302,553305,893303,988
303,948305,179303,541
303,728305,781
305,781
Subject tolimitation
256,652254,567258,507265,522270,790273,915272,361270,188276,013284,398286,065288,862298,212
303,724315,758
256,026258,794266,821274,671278,256280,348276,276274,564282,607290,513289,971296,061303,616
292,199293,521293,579
295,520296,886296,061
296,422296,917296,054
296,922299,170298,212
297,891301,938299,612
302,181305,521303,616
303,577304,809303,172
303,359305,413
305,413
Source: Actual figures through the fiscal year 1952 and the calendar year
1953 are from the daily Treasury statement, and thereafter from themonthly statement of receipts and expenditures of the Government (for
explanation of reporting bases, see page II); estimates are from the
1964 Budget document, released January 17, 1963, including effectsof proposed legislation. More detail for data on this page will be ^found in succeeding tables.Fiscal year figures beginning with the September 1960 issue of theTreasury Bulletin, and calendar year figures beginning with the June
1961 issue exclude certain interfund transactions from both net budget
receipts and budget expenditures (see page II, 2, and 5). Figures
previously published for these series have been revised to the newreporting basis. The change does not affect the budget surplus or
deficit.Excess of receipts, or expenditures (-). For detail, see pages 10 - 14.
For checks outstanding and telegraphic reports from Federal Reservebanks; public debt interest accrued and unpaid beginning with June
1/
2/
and the fiscal year 1955 (previously included from November 1949 as
interest checks and coupons outstanding); also deposits in transit andchanges in cash held outside the Treasury and in certain other ac-counts beginning with the fiscal year 1954. Net increase, or decrease
(-).
For current month detail and list of acts, see section on "StatutoryDebt Limitation" in each issue of the Bulletin. The limitations in
effect during the period covered by this table and the date when eachbecame effective are as follows: $275 billion on June 26, 1946; 1281billion on August 28, 1954; $278 billion on July 1, 1956; $275billion on July 1, 1957; $280 billion on February 26, 1958; $238billion on September 2, 1958; $290 billion on June 30, 1959; $295billion on July 1, 1959; $293 billion on July 1, I960; $298 billionon July 1, 1961; $300 billion on March 13, 1962; $308 billion on
July 1, 1962; $305 billion on April 1, 1963; and $307 billion on May29, 1963. Under the act approved May 29, 1963, the limitation is
$309 billion from July 1 through August 31, 1963.

Treasury Bulletin
BUDGET RECEIPTS AND EXPENDITURES
Table 1.- Receipts by Principal Sources

June 196J
.BUDGET RECEIPTS AND EXPEaJDITURES
.
Table 2.- Detail of Miscellaneous Receipts by Major Categories
Fiscal yearor month
Total
(In millions of dollars)
InterestDividendsand otherearnings
Realiza-tion uponloans andinvest-ments
Recov-eries andrefunds
Royal-ties
Sale of
Gov-^rn-
mentproperty
Sale of
prod-ucts
Seign-iorage
Fees forpermitsandlicenses
Fees andotherchargesforservicesetc.
Fines,penaltiesand for-feitures
Other
V
1955.1956.
1957.
1958.
1959.
1960.
1961,
1962.
1963 (Est.)
196/i (Est.)
1962- JulyAugSept
OctNovDec
1963-Jan
FebMar
Apr
May
1963 to date...
2,5593,0062,7493,1963,1584,0644,0823,206
4,4104,036
685300517
218225
553
334
488
253
273
205
4,050
408554628745601967942877
877918
89
53
2
1610
332
103
2711
1011
664
252291438674506
1,111805
743
856873
7371
72
916969
71
59
61
7771
785
274296328328587436
1,012371
1,026
539
415 2/2724
242657
41
312 2/78
5030
1,083
410471266322
343114182
154
99128
1796
418
31
420
12
138
6979909396
114121
130133
9-21
9
1010
9
12
-1412
11
13
61
363480387345325392
343263
295316
301627
1755
13
20
1915
240
253313312
304350374330342
380407
276218
282831
29
55
24
2730
359
29234959
445355
58
3949
4
4
4
4
45
3
3
4
43
41
47494953
54
5781
62
6875
4
4
4
4
9
5
395
89
225194160161133111100101
113117
6
76
117
8
14
7
8
13
7
212
1942886
93325
9489
453435
7
5
345
3
7
5
6
5
12
410
15
6620232316
1411
6840
591
1
11
1
5
5
6
5
8
12
11
13
Source: Actual figures through 1961 are from reports to the TreasuryDepartment by disbursing officers and administrative agencies, onthe monthly statement reporting basis (see page II); and from themonthly statement of receipts and expenditures thereafter. Estimatesare from the 1964 Budget document, released January 17, 1963,including effect of proposed legislation.
1/ Consists of miscellaneous taxes (principally the tonnage tax onforeign vessels entering U. S. ports), bullion charges, and gifts
and contributions.
2/ Includes $210 million received from the French Government and $179million from the Italian Government for prepayment of loans.
2/ Includes $375 million for repayment of advances from Federal extendedcompensation account (Temporary Extended Unemployment CompensationAct of 1961, approved March 24, 1961) and a decrease of $93 millionfor transfer of receipts to Commodity Credit Corporation fund.
Footnotes to Table 1 - (Continued)
6/
2/8/
2/
iS/
u/
Includes adjustments as follows for: Income taxes not withheld, October 12/-$4 million, January -$4- million, and March -$2 million; Income taxeswithheld, October -$1^2 million, January -$67 million, and March -$1^million; transfers to Federal Old-Age and Survivors Insurance Trust Fund,October +413A million, January +$62 million, and March +$19 million; andtransfers to Federal Disability Insurance Trust Fund, October +$12 million,January +$9 million, and March -$2 million. See also footnote 9.
interest on refunds is included in expenditures in Table 3.
The principal amounts for refunds of employment taxes and certainexcise taxes (highway) are excluded from the transfers of tax
receipts shown herein, and are included with refunds of internalrevenue receipts, applicable to trust accounts. 13/Amounts appropriated to the Federal Old-Age and Survivors Insurance
Trust Fund are equivalent to the amounts of taxes collected anddeposited for old-age insurance. Amounts transferred currently forappropriation to the trust fund are based on estimates of old-ageinsurance tax receipts made by the Secretary of the Treasury (<;2
U.S.C. 4.01 (a)), and are adjusted in later transfers on the basis ofwage and self-employment Income records maintained in the SocialSecurity Administration.The Federal Disability Insurance Trust Fund was established by the
Social Security Act Amendments of 1956, approved August 1, 1956 {/^U.S.C. -401 (b)). The act appropriated to the trust fund ajuounts
equivalent to specified percentages of the wages and self-employmentincome, respectively, which are taxed for old-age insurance, and 14/provided that the amounts appropriated should be transferred fromtime to time to the trust fund on the same basis as transfers to the
Federal Old-Age and Survivors Insurance Trust Fund . Rates of tax \p/were increased by the percentages appropriated to the Federal Disa-
bility Insurance Trust Fund, the increase being applicable to wages
paid and taxable years beginning after December 31, 1956. 16/Amounts are appropriated to the Railroad Retirement Account equal to
the amount of taxes under the Railroad Retirement Tax Act deposited 17/in the Treasury, less refunds, during each fiscal year (65 Stat. 222
and 66 Stat. 371) and transfers are made currently. *
The Qnployment Security Act of 1960, approved September 13, 1960 (^U.S.C. 1101), established in the Unemployment Trust Fund an admin-istration account, and appropriated for credit to that account,beginning with fiscal 1961, amounts equivalent to taxes collectedand deposited under the Federal Unemployment Tax Act. The taxreceipts are transferred currently on the basis of estimates by the
Secretary of the Treasury, with later adjustments as necessary.From that account are to be paid the administrative expenses of theemployment security program. Previously the corresponding amountswere included, respectively, in budget receipts and budgetexpenditures
.
The Highway Revenue Act of 1956, as amended, (23 U.S.C. 120, note)established a Highway Trust Fund from which are to be made, asprovided by appropriation acts. Federal-aid highway expendituresafter June 30, 1956, and before October 1, 1972. The act appro-priated to this fund amounts equivalent to specified percentages of
receipts from certain excise taxes on motor fuels, motor vehicles,
tires and tubes, and use of certain vehicles, and provided that theamounts appropriated should be transferred currently to the trustfund on the basis of estimates by the Secretary of the Treasury withproper adjustments to be made in subsequent transfers. Before fiscal
1957 corresponding excise tax receipts were included in net budgetreceipts and Federal-aid highway expenditures were included in
budget expenditures.For content, see Table 4. These transactions are included in the
detail of both budget receipts and expenditures, but are deductedfrom the totals (see Reporting Bases, p. II).
Figures in this column differ from those published under the same
caption prior to the September 1960 Treasury Bulletin because of the
exclusion of certain interfund transactions (see footnote I4).
Transfers reduced by $300 million to adjust those made earlier on
basis of estimates (see footnote 9).Reflects gross amounts based on reimbursements by trust accounts for
refunds of taxes which were made in previous months or fiscal years.
Less than $500,000.

Treasury Bulletin
, BUDGET RECEIPTS AND EXPENDITURES
,
INTERNAL REVENUE COLLECTIONS BY PRINCIPAL SOURCES
Source Infernal Revenue Service collection reports For explanafton of difference in reporting basis from budget receipts through 1954^see the TreasuryBulletin for July 1962, p 80, and the Annual Report of the Secretary of the Treasury for 1961 p 495
* Beginning with the fiscal year 1955, includes undistributed depository receipts and unapplied collections. The whole amount ofsuch receipts for excisetaxes IS included under "Other excise foxes
"
Office of (h« S«er«lorj of tht Traosury

June 196J
. BinXxET RECEIPTS AND EXPENDITURES
Table 3.- Expenditures by Agencies
(in millions of dollars)
Fiscal yearor month
1955 ,
1956 ,
1957 ,
1953 ,
19591960 ,
1961 ,
1962 ,
1963 (Est.)
1964 (Est.)
1962-July ,
August. ...
SeptCTiber,
October. .
.
November.
,
December.
,
1963-January.
.
February.
,
March
April. . .
,
May
1963 to date..
Legis-lativeBranch
65
85
9799U812613-;
153
159155
15
13
171513
914
9
9
14
136
Judiciary
30
3739
44474952
57
6569
5
45
6
45
6
46
7
5
56
ExecutiveOfficeof thePresident
910101156
567029
2531
2
2
2
1
3
2
3
22
2
2
21
Fundsappropriatedto thePresident
4,3814,4734,1154,0814,1091,764 i/1,8082,053
4,3594,375
140188154
266229263
323236346
415391
3,400
Agri-cultureDepart-ment
4,6365,1775,0064,8757,0915,4195,9296,669
7,4936,565
6881,174677
1,023623789
598
323524
453467
7,341
CommerceDepart-ment
1,0771,293
562 2/645382
539498594
745895
5758
37
8672
35
52
6555
50
57
624
Defense Department
Military
35,53235,79138,43939,06241,23342,82444,67748,205
48,30051,000
3,6924,2083,823
4,3604,3314,031
4,1773,8034,122
4,0854,076
44,259
Civilfunctions
548
573639733807902971999
1,1061,U0
88
113104
122
11289
866272
80
91
1,019
Health,Education,andWelfareDepartment
1,9932,0712,2952,6453,0923,4033,6854,215
5,0485,742
450404389
412390363
469436384
441405
4,542
InteriorDepart-ment
515512572
666751690801908
1,0541,165
72
114119
9389
74
938564
6880
950
JusticeDepart-ment
182
216214229250258284294
317337
2631
23
242625
262532
2626
291
LaborDepart-ment
394412418567
1,016
549831 V620
239433
231865
6261
55
68-229
34
22
32
PostOfficeDepart-ment 1/
356463518674774525
914797
802
554
6
9582
4635
58
4713741
52
67
666
StateDepart-ment
136142179206272247258307
457361
495322
74
3737
3636»
2425
393
riscal yearor month
Treasxjry Department
Interest
Onpublicdebt j/
Onrefundsof taxes
Other
6/
AtomicEnergyCom-mission
FederalAviationAgency
2/
Genera
1
ServicesAdminis-tration
Ifousing
andHomeFinanceAgency
NationalAero-nauticsand SpaceAdm. 8/
VeteransAdmini-stration
Otherinde-pendentagencies
District
of
Col\imbia
2/
Total byagencies
Less:
Inter-fiind
trans-actions
13/
Totalbudgetexpend-itures
11/
1955.
1956.
1957.
1958.
1959.
1960.
1961.1962.
1963 (Est.).
1964 (Est.).
1962-JulyAugust. ..
.
September.
October. .
,
November.
.
December.
.
1963-January. .
.
February.
.
March
April.
May...
6,3706,7877,2447,6077,5939,1808,9579,120
9,70010,020
828794807
814808840
858
809
825
823
823
62
54
5774
6976
8368
7171
6
8
5
13
4
3
46
7
1963 to date 9,030 68
368879748765
2,178 12/875987985
1,0401,141
7510782
628084
106
87
86
91112
973
1,8571,6511,9902,2682,5412,6232,7132,806
2,8702,850
243234209
243228212
240
2U226
227240
2,517
441508638698
791801
577356
62
5459
76
52
62
5661
668
973523570425359408387U5
532
594
284835
454239
32
38
38
4426
417
12939
-23199
1,152309502
739
1,088695
20958
3
-15
99153
44-99
U2
-131-39
424
145401744
1,257
2,4004,200
135187140
187187187
233194250
271280
2,253
4,4054,7314,8055,0985,2325,2505,4015,392
5,5325,470
441491400
439442444
485
444404
365
434
4,789
529601911 12/940956224794937
607355
-2710474
88101-92
33
4375
111
-211
299
22222625
31285072
8386
30
5
2
54
64,57066,54069,43371,93680,69777,23382,16988,419
94,957 a/99,482 iV
7,3318,5867,327
8,5368,0777,772
8,106
6,7887,809
7,598
7,473
85,403
181
315467567355694
654633
646679
78
451
12
7
200
93
25
3
476
64,38966,22468,96671,36980,34276,53981,51587,787
94,311 M/98,802 li/
7,2528,5417,327
8,5248,0707,572
3,013
6,7637,806
7,590
7,470
84,927
Source: Actual figures are from the monthly statement of receipts and ex-
penditures of the Government (for explanation of reporting bases, see
page II); estimates are from the 1964 Budget document, released
January 17, 1963, including effects of proposed legislation.
Note: Figures in this table are for agencies as constituted at the time
the expenditures were made, and therefore do not necessarily represent
functions which are confiarable over a period of time. For expenditures
by functions on a consistent basis, see Table 6. Agency shifts are
reflected in this table as follows: Beginning 1957, Alaska Road
Construction from "Interior Department" to "Commerce Department," and
Federal intermediate credit banks and production credit corporations
as indicated in footnote 12; beginning 1958, Federal Facilities Corpo-
ration (remaining functions) from "Treasiu-y Department" to "General
Services Administration," and Infonjational Media Guaranty Fund from
"Funds appropriated to the President" to "Independent agencies";
beginning 1959, Federal Civil Defense Administration from "Independent
agencies" to "Executive Office of the President," Civil AeronauticsBoard from "Commerce Department" to "Independent agencies," CivilAeronautics Administration from "Commerce Department" and AirwaysModernization Board from "Independent agencies" to the "FederalAviation Agency," National Advisory Commission for Aeronautics from
"Independent agencies" to "National Aeronautics and Space Administra-tion"; from fiscal 1960 through November 1962, military assistance
from "Funds appropriated to the President" to "Defense Department,
military," and thereafter under "Funds appropriated to the President";
and beginning 1962, subscriptions to international institutions from"Treasury Department" to "Funds appropriated to the President."
1/ Consists of net expenditures of the Postal Fund, reflecting the
change in classification of Post Office transactions to a public
enterprise revolving fund basis, and beginning fiscal 1960 payment
for public services.Remaining footnotes on following page.

Treasury Bulletin
BUDGET RECEIPTS AND EXPENDITURES
Table 4.- Interfund Transactions Excluded from Both Net Budget Receipts and Budget Expenditures(In millions of dollars)
Fiscalyear ormonth
Interest payments to the Treasury l/
Totalinter-est
Coinmod-
ityCreditCorp.
Export
-
ImportBank of
Washing-ton 2/
HousingandHomeFinanceAgency
y
PanamaCanalCompany
SmallBusinessAdmin.
Tennes-see
ValleyAuthor-ity
Veterans'
Admin-istration
i/
UnderDefensePro-ductionAct y
Other
6/
Reim-burse-ment byPanamaCanalCompany
2/
Federalinter-mediatecreditbanks'fran-chisetax 8/
Chargesforauditsof
variousagencies
19551956 ,
1957 ,
1958 ,
1959 ,
1960 ,
1961 ,
1962 ,
1963 (Est.)
196.; (Est.)
1962-July ,
August . . .
,
September,
October. .
,
November.December,
1963-January.
.
February.
.
March. . . .
,
AprilMay
1963 to date..
181
315467567355694654633
646679
78
451
12
7
200
9325
3
173297456557342682640620
631662
78
451
7
200
9025
3
60175340421181
465410330
318316
2
5
172
26252431
41464357
53
55
514847453990118146
155176
73
11
176
11
9
9
9
9
1010
1
1
3
7
7
15
14
2027
20
1014
192332
40
50
55
24
15
20243042356
1920
717109
12
U1312
1516
476 465 183
2
30
80
158
24
47 11
Source: See Table 2.
1/ By Government agencies operated as revolving funds; on loans (see "DebtOutstanding," Table 6) and other interest-bearing U. S. investments.Excludes transactions under Defense Production Act.Consists of payments by: Office of the Administrator for collegehousing, urban renewal, prefabricated housing loans for 1955, and publicfacility loans beginning 1957; Federal National Mortgage Association;and Public Housing Administration,Direct loan program.By various agencies for programs under the Defense Production Act,
Consists of payments by: Reconstruction Finance Corporation for 1955;Colorado River Dam Fund, Boulder Canyon project; Virgin Islands Corpo-
^
6/
1/
8/
ration; Bureau of Federal Credit Unions; Civil Defense Program Fund;Farmers' Home Administration: Agricultural Credit Insurance Fund(formerly the Farm Tenant Mortgage Insurance Fund) beginning 1956,and the direct loan account, both established pursuant to Title III
of the Agricultural Act of 1961, approved August 8, 1961; Information-al Media Guaranty Fund beginning 1959; Federal Ship Mortgage InsuranceFund beginning 1960; and St, Lawrence Seaway Development Corporationbeginning I960.For net cost of Canal Zone Government, less tolls on Governmentvessels, and for part of treaty payment for use of Canal Zone,
Realization on the Government's investment.Less than 1500,000.
Footnotes to Table 3,- (Continued!
2/
i/A/
1/
2/
8/
2/10/
Beginning 1957, Federal aid for highways is excluded from budget ex-penditures and included in trust account expenditures (see Table l).
Adjusted for reclassification.Beginning with fiscal 1961, administrative expenses of the employ-ment security program are handled as trust account expenditures
rather than budget expenditures, pursuant to the Einployment SecurityAct of 1960, approved September 13, I960 (-42 U.S.C. llOl); see
Table 1, footnote 12.
Reported on an accrual basis effective June 30. 1955,Includes Reconstruction Finance Corporation except beginning July 1,
195<;, certain functions transferred: Under Reorganization Plan No. 2
of 195^ (15 U.S.C. 609, note) to the Export-Import Bank, the FederalNational Mortgage Association, and the Small Business Administration;and under Executive Order 10539, as amended, (15 U.S.C. 603, note)
to the General Services Administration. The corporation was abolished
at the close of June 30, 1957, by Reorganization Plan No. 1 of 1957,
and its remaining functions were transferred to the Housing and HomeFinance Administrator, Administrator of General Services, Administratorof Small Business Administration, and Secretary of the Treasury.Established pursuant to the Federal Aviation Act of 1958 (^9 U.S.C.
1341 (a)), approved August 23, 1958.Established pursuant to the National Aeronautics and Space Act of1958 (42 U.S.C. 2472 (a)), approved July 29, 1958.Consists of Federal payment and loans and advances.For content, see Table 4. These transactions are included in the
11/
12/
U/
u/u/
detail of both budget receipts and budget expenditures, but are de-ducted from the totals (see Reporting Bases, p. II).
Figures in this column differ from those published under the samecaption prior to the September 1960 Treasury Bulletin because of theexclusion of certain interfund transactions (see footnote 10).Effective January 1, 1957, the production credit corporations weremerged in the Federal intermediate credit banks, pursuant to the FarmCredit Act of 1956, approved July 26, 1956 (12 U,S.C. 1027), and oper-ations of the merged agencies (as mixed-ownership corporations) wereclassified as trust enterprise funds (see "Trust Account and OtherTransactions," Table 3); previously the operations of the banks and the
corporations, respectively, were classified as public enterprise fundsand were included net in budget expenditures.Includes $1,375 million paid to the International Monetary Fund for theadditional United States subscription, authorized by an act approvedJune 17, 1959, consisting of $344 million in gold (see "MonetaryStatistics," Table 3) and $1,031 million in special notes. The specialnotes of the United States issued to international institutions arenonnegotiable and noninterest-bearing and are payable on demand. See
also "Cash Income and Outgo," Table 5 and "Debt Outstanding," Table 1.
Totals include allowance for contingencies of $75 million.
Totals Include $175 million allowance for contingencies and $200million for con^iarability pay adjustment.
Less than $500,000.

June 196J
BUDGET RECEIPTS AND EXPENDITURES
Table 5.- Summary of Appropriations and Author Izat lone. Expenditures, and Balances, by Agencies,as of April 30, 1963
(In millions of dollars; negative figures are deductions in the columns in which they appear)
Agency
Unexpendedbalancesbrought forwardJuly 1, 1962
1/ 2/
Additional, fiscal year 1963 to date
Increase
Appropria t ions
2/
Authorizationsto expend fromdebt receipts ^
Other authori-zations ^ Total
Transfers,borrowings,investments
6/
Legislative BranchThe JudiciaryExecutive Office of the PresidentFunds appropriated to the President 2/Agricxilture Department,Commerc e Depa rtmentDefense Department:Military functionsCivil functionsUndistributed foreign transactions
Health, Education, and Welfare DepartmentInterior DepartmentJustice DepartmentLabor DepartmentPost Office DepartmentState DepartmentTrea sury DepartmentAtomic Energy CommissionFederal Aviation AgencyGeneral Services AdministrationHousing and Home Finance AgencyNational Aeronautics and Space AdministrationVeterans' AdministrationOther Independent AgenciesDistrict of Columbia - Federal payment and loans to.
Total
79
5
3
12,9833,9041,060
28,697356
1,83245136
230373130416
1,205585
53412,8641,158
85010,898
96
78,745
14761
23
6,5136,648
793
49,5661,086
4,5321,073
307325
907414
10,7943,135
766579635
3,6735,2531,235
59
3,527
544
418
200
1,174
426
12
1
-20
-338
-282
15661
236,5137,234
805
49,5661,086
4,5321,091
307325907415
10,7943,135
746579715
3,6735,4531,241
59
99,418
Agency
Deductions, fiscal year 1963 to date
Expenditures
Rescissions,cancellations,and otheradjustments 8/
Unexpended balances April 30, 1963
Undisbursedappropria-
Unused author-izations to
expend fromdebt receipts
Unfundedcontractauthori-zations
Invest-mentsheld
2/
Total 2/
Legislative BranchThe JudiciaryExecutive Office of the PresidentFunds appropriated to the President 2/Agriculture DepartmentCommerce DepartmentDefense Department:Military functionsCivil functionsUndistributed foreign transactions
Health, Education, and Welfare DepartmentInterior DepartmentJustice DepartmentLabor DepartmentPost Office DepartmentState DepartmentTreasury DepartmentAtomic Energy CommissionFederal Aviation CommissionGeneral Services AdministrationHousing and Home Finance AgencyNational Aeronautics and Space AdministrationVeterans' AdministrationOther Independent AgenciesDistrict of Columbia - Federal payment and loans to.
Adjustment to monthly statement of receipts and
expenditures of the Government
Total
Deduct: Certain interfxind transactions
Total budget expenditures
122
51
19
3,0096,874
567
40,188927-2
4,137870265180
599368
9,1302,276607391
4631,9724,355
51053
77,930
473
77,457
Source: Bureau of Accounts. Details for the current fiscal year to date
are shown In Bureau of Accounts report "Budgetary Appropriations and
Other Authorizations, Expenditures and Unexpended Balances."
Includes same categories as shown at end of current period.
Although not expended, a substantial portion of these amounts is
obligated for outstanding purchase orders and contracts for equipment
and supplies, for payrolls, and for similar items.
Includes reappropriations.Consists of authorization by law for Government-owned enterprises to
borrow (1) from the Treasury (to expend from public debt receipts),
or (2) from the public (to expend from debt receipts).
Consists of new contract authorizations, established by law for the
current fiscal year, net of current appropriations to liquidate
either current or prior contract authorizations,
6/ Consists of transfers between appropriations; net borrowings from or
13128
2
56
3
223
75
15
7
10,3951,369
756
38,075505
2
2,22755474
375681177
1,8262,063697709883
2,8591,5441,260
99
67,229
6,0922,802
300
10
16
250
8,209
3009,630
27,608
36
93231
97
27
3,050
11
3,547
846
103672
1,628
111157
16,4874,2641,293
38,075515
2
2,22766774
375681178
2,0762,063
724
709
12,9882,8591,947
11,57399
100,011
1/2/
i
i/
8/
2/
10/
repayments to (-), the Treasury and the public under authority to
expend from debt receipts; and net investment in, or sale of (-),
public debt securities and certain guaranteed securities issued by
Government enterprises.Includes Military assistance formerly shown under Defense Department.
Consists of transfers to, or restorations from (-), the surplus fund;
rescissions, cancellations, or adjustments of borrowing authority
and contract authority; capital transfers to miscellaneous receipts;
and other adjustments.Public debt securities and certain guaranteed securities issued by
Government enterprises.Represents the difference between this report based on accounts sub-
mitted by certain disbursing officers and corresponding preliminary
data used in the monthly statement of receipts and expenditures of the
Government. * Less than $500,000.

Treasury Bulletin
BUDGET RECEIPTS AND EXPENDITURES ,
Table 6.- Expenditures and Balances by Functions
(Fiscal years; in millions of dollars)

June 196J
BUDGET RECEIPTS AND EXPENDITURES
.
Table 6.- Expenditures and Balances by Functions - (Continued)
(Fiscal years; in millions of dollars)
FvuictionaFunctioncodenumber
1958 1959 1960 1961 1962
1963 through April 1/
ExpendituresUnexpendedbalances endof period 2/
Interest:
Interest on the public debt «
Interest on refunds of receiptsInterest on uninvested funds
Total interest
General government:
Legislative functionsJudicial functions »
Executive direction and management , , . .
,
Central fiscal operationsGeneral property and records management,.Central personnel managementProtective services and alien controlOther general government
Total general government
Undistributed
Total
Less: Certain interfund transactions included in both
expenditures and receipts
Budget expenditures (see table 3)
8518=-2
853
901902903Q04905':>06
908910
7,60774
7,689
89
4419
502
24584
23369
1,284
71,936
567
71,369
7,59369
9_
7,671
102
472156629595
25586
1,466
80,697
355
80,342
9,18076
10
9,266
109492055837284
263
1,542
77,233
694
76,539
8,957

10 Treasury Bulletin
BUDGET RECEIPTS AND EXPENDITURES.
Table 7.- Detail of Excise Tax Receipts(In thousands of dollars)
Type of Tax
Fiscal yearFirst three quartersof fiscal year
1962 1963
Third quarter of
fiscal year
1962(Jan. -Mar. 1962)
1963(Jen. -Mar. 1963)
Alcohol taxes: 1/
Distilled spiritsWinesBeer
Total alcohol taxes
Tobacco taxes: 1/
CigarsCigarettesOther
Total tobacco taxes
Documentary and certain other stamp taxes:
Documentary stamp taxes j/Playing cardsSilver bullion sales or transfers
Total Documentary and certain other stamp taxes
Manufacturers' excise taxes:
Gasoline ^Lubricating oil, etc
Tires , tubes, and tread rubber ^Passenger automobiles, chassis, bodies, etcTrucks and buses, chassis, bodies, etc. ^Parts and accessories for automobiles, trucks, etcRadio and television sets, phonographs, components, etcRefrigerators, freezers, air-conditioners, etc
Electric, gas, and oil appliances •
Pistols and revolvers ,
Phonograph recordsMusical instrumentsSporting goods (other than fishing rods, creels, etc.).Fishing rods, creels, etc,Business and store machinesCameras, lenses, film, and projectorsElectric light bulbs and tubesFirearms (other than pistols and revolvers), shellsand cartridges
Mechanical pencils, pens, and lightersMatches
Total manufacturers' excise taxes
Retailers' excise taxes:
FursJewelry, etcLuggage , etcToilet preparations
Total retailers' excise taxes
2,3U,7<;697,803800,252
3,212,801
49,6041,923,540
17,974
1,991,117
141,2908,046
14
U9,350
2,370,30374,296
279,5721,228,629236,659188,819L48,98955,92064,4831,549
22,82318,11314,7106,25398,30525,26832,924
14,9859,0355,165
4,896,802
29,226168,49868,182131,743
397,649
2,423,33099,922818,030
3,341,282
49,726 2/1,956,527
19,483
2,025,736
150,6398,625
55
159,319
2,406,00172,931
360,3381,300,344256,275197,227171,71754,63665,5741,762
24,29919,03615,4586,03281,71025,30633,990
14,9128,1384,653
5,120,340
30,921173,60868,599
142,792
415,920
1,811,04376,808
591,785
2,479,636
36,6111,455,197
14,457
1,506,264
113,4406,475
14_
119,929
1,862,71455,313
269,018924,209185,237145,042129,05340,55449,2801,323
17,67014,34412,0043,816
62,91621,74025,404
13,2306,5603,474
3,842,902
24,187142,38657,203
113,095
336,371
1,868,92476,154
596,679
2,541,757
36,4231,477,799
13,659
1,527,881
102,6546,434
96
109,184
1,919,40456,650305,750
1,U3,815221,221170,442136,91544,66949,2261,255
20,60215,00313,9023,93957,15221,84926,924
14,0606,6733,098
4,232,551
22,604145,72360,154123,124
351,605
526,48426,595172,194
725,273
10,249456,562
4,609
471,420
38,7822,467
9
41,258
599,51717,35690,035
403,72163,98151,58852,38410,36016,302
4327,5896,1833,5111,343
19,6677,9599,829
3,2912,4791,109
1,368,637
14,32367,90626,34246,581
155,152
536,25924,401175,908
736,568
9,813474,310
4,347
488,469
35,0452,381
17
37,444
620,65216,70599,260477,89179,09361,36948,89411,18616,830
4417,9926,5304,5121,139
20,3077,25310,777
3,4212,535
969
1,497,756
13,48968,24625,52949,566
156,832
Footnotes at end of table. (Continued on following page)

June 196J 11
BUDGET RECEIPTS AND EXPENDITURES .
Table 7.- Detail of Excise Tax Receipts - (Contlnuedl
(In thousands of dollars)
Type of tax
Fiscal year
1961 1962
First three quartersof fiscal year
1962 1963
Third quarter of
fiscal year
1962
(Jan.-Mar. 1962)1963
(Jan.-Mar. 1963)
Miscellaneous excise taxes:
Admissions to theaters, concerts, etc
Admissions to cabarets, roof gardens, etcClub dues and initiation fees
Toll telephone service, telegraph, cable, radio, etc.,wire mileage service, wire and equipment serviceGeneral telephone serviceTransportation of oil by pipeline ^Transportation of personsTransportation of property (including coal) ^Use of safe deposit boxesCoconut and other vegetable oils processed 6/SugarDiesel and special motor fuels ^ 2/Narcotics and marihuana, including occupational taxes.
Coin-operated amusement devicesCoin-operated gaming devicesBowling alleys, pool tables, etc
Wagering occupational tax
WagersUse tax on highway motor vehicles weighing over
26,000 pounds VAdulterated and process or renovated butter, filledcheese, and imported oleomargarine
Firearms transfer and occupational taxes
Total miscellaneous excise taxes
Total received with returns and from sale of stamps
Undistributed depositary receipts 8/
Unapplied collections
Total excise taxes
36,67933,60364,357
3-43,894
483,408387
264,2621,3066,581
8991,81888,8561,107
5,53518,3754,317
6416,682
45,575
2
51
1,497,526
12,145,245
-81,639
696
12,064,302
38,38235,03768,300
344,764489,155
49260,052
568
6,5465
95,158103,556
1,0894,79414,8244,184
580
5,349
79,761
32
66
1,552,250
12,614,848
98,351
38,977
12,752,176
30,44626,76749,664
264,444373,891
35
212,066465
4,6534
75,80177,108
6403,155
10,9043,074449
4,100
65,311
31
41
1,203,047
9,488,649
18,885
2,044
9,509,578
33,21530,04249,758
275,931389,952
6
203,954337
4,78714
76,12885,971
658
3,44512,2083,703387
3,956
80,139
3
38
1,254,633
10,017,611
5,103
1,951
10,024,664
8,5729,10714,251
94,208134,036
11
69,319152
1,4601
23,42026,189
9824864024382
l,186r
13,523
2
12
396,758
3,158,497
-43,177
38
3,115,358
9,1549,91214,871
86,799125,532
1
54,35180
1,5577
23,28430,825
174267882
29957
1,328
18,624
10
378,014
3,295,083
-78,133
124
3,217,074
Source: Internal Revenue Service reports. The figures shown include
collections for credit to special accounts for certain island posses-
sions. Floor stocks taxes are included with the related classes of tax. 5/1/ Full detail on a monthly basis is available from the Internal Revenue
Service. 6/
2/ Beginning October 1, 1961, the Bureau of Custom's was authorized to
accept and deposit payments of internal revenue taxes on tobacco items
imported or brought into the United States (26 C.F.R. 275.62).
Collections of this type by Customs during October 1961 were included
with reporting on class E cigars.
2/ Taxes on issuance and transfers of capital stock and of corporate 2/securities (bonds, debentures, etc.), deeds of conveyance, and 3/
policies Issued by foreign insurers,
i/ Beginning with the fiscal year 1957, collections reflect the provisions »
of the Highway Revenue Act of 1956, approved June 29, 1956 (23 U.S.C.
120 note).Repealed effective August 1, 1958, by an act approved June 30, 1958
(26 U.S.C. 4294 note).The tax of 3 cents per pound, applicable to the first domestic
processing of coconut oil and other vegetable oils, which was
suspended from October 1, 1957, through June 30, 1963, under acts
approved August 30, 1957, May 29, 1959, and April 22, 1960, is further
suspended until June 30, 1966, under an act approved October 23, 1962
(26 U.S.C. 4511 (a)).
Excludes diesel fuel not for use In highway vehicles.
Amount of excise tax depositary receipts Issued, less amount received
with returns and distributed by detailed class of tax.
Less than $500. r Revised.

12 Treasury Bulletin
TRUST ACCOUNT AMD OTHER TRANSACTIONS.
Table 1.- Summary of Trust Account and Other Transactions
(In millions of dollars)
Fiscal year
or month
Net receipts,expendituresfrom trustand other tra
actions
count
Trust and deposit fund accounts
Excess of
receipts, orexpenditures (-)
Net
receipts
1/2/
Net
expenditures
1/ 2/
Net sale, or investment
(-), by Governmentagencies in public debtsecurities j/
Net sale, or redemption(-), of securities of
Government agencies in
the market
1955
195619571958 -
19591960 ,
19611962 ,
1963 (Est.)...
1964 (Est.)
1962-July ,
August ...
September
October. .,
November
,
December,
1963-January.
.
February.March, , ,
.
April..,.,May
231-194195633-329-50
-602
436
-693-107
208-59-126
-15106
457
-126
404-270
269-223
991 V2,2501,409262
-1,511-359565213
-2771,511
-664
1,365-739
-821
485-127
-1,483
873-104
-277
2,647
9,47011,607
U,30116,15316,76920,34223,58324,325
26,86329,540
1,1943,4471,622
1,3772,5311,684
994
3,3652,128
1,7574,662
8,479 V9,35712,89215,89218,28120,700 y23,01824,111
27,14028,029
1,8592,0822,362
2,1972,0471,811
2,4772,4922,232
2,0352,015
-1,362 i/-2,617-2,300
-1971,112-714-435-435
-773-2,077
992-1,470
572
796-382626
1,396-452
43
616
-2,827
602 i/173
1,08556771
1,023-733658
357459
-119
4641
10
3
-42
-39
-17-209
-70
-44
Source: Actual figures are from the monthly statement of receipts andexpenditures of the Government (for explanation of reporting bases,see page II); estimates are from the 1964 Budget document, releasedJanuary 17, 1963, including effects of proposed legislation.
l/ Certain intertrust fund transactions are excluded from both receiptsand expenditures beginning with the July 1961 issue of the Bulletin,For detail see Table 6.
2/ Beginning with the February 1963 Bulletin amounts for refunds of taxes
(principal only) have been deducted from receipts, and therefore
are excluded from expenditures.
j/ Also includes guaranteed securities (see Table 4).
^ Effective July 1, 1955, security transactions of Government-sponsoredenterprises are included in deposit fxind account expenditures (net)
and excluded from net investment by Government agencies in publicdebt securities (see Table 4) and from net redemption or sale of
obligations of Government agencies in the market (see Table 5).Figures for 1955 have been revised to the new classification basis,
^ Adjusted for reclassification of certain repayments of advances fromthe general fund.
Table 2.- Trust Account Receipts(In millions of dollars)
Fiscal yearor month
FGASITrustFund 1/
Fed. Dis-abilityIns,
TrustFund
RailroadRetire-mentAccount
Unem-ploymentTrustFund
National
ServiceLife In-suranceFund
Govern-
mentLifeInsur-ance Fund
Federalemployees'retirementfunds
HighwayTrustFund 1/
Othertrustaccounts
2/
Totaltrustaccounts
1/
Less:
Intertrustfundtrans-actions j/
Nettrustaccountreceipts
V V19551956
195719581959196019611962
1963 (Est,)
1964 (Est,)
1962-July
August , , ,
,
September.
October, .
.
November,
.
December,
.
1963-January, ,.
February,,March
AprilMay
5,5356,9377,1017,8248,109
10,36011,82412,011
13,78115,569
4091,848
840
5201,256
743
1671,826
1,232
8682,771
339943929 1/
1,062 1/1,0831,092
1,1411,177
3615676
4410881
18141
85
76
201
700739723695758
1,4031,0511,081
1,1111,219
13
1682
52
1384
53
16
96
1,4251,7281,9121,8551,9972,7033,803 6/3,985
4,0424,288
188
88
162
489153
209820125
213945
590649608640634643668664
681680
45
4237
4339
35
52
3841
4138
78
736967636158
54
5448
3
1
1
2
1
1
2
1
1
1
2
7081,025
1,3971,4581,7411,7662,0332,086
2,1602,339
149159137
171163lU167149161
171208
1,4822,0442,0882,541 V2,8002,955
3,2243,310
281332288
277220282
261234279
258
308
449467681638585711
779925
1,1601,364
7379
104
143188194
10986
152
115
98
9,48511,619
U,31116,16416,90421,250 1/24,09824,853
27,35429,994
1,195
3,4591,623
1,3782,5451,685
9983,3782,130
1,759
4,666
16
12
1011
135908515528
491454
1
121
1
141
4131
1
3
9,47011,60714,30116,15316,76920,342 ^23,58324,325
26,86329,540
1,1943,4471,622
1,3772,5311,684
9943,3652,128
1,757
4,662
Source: See Table 1,
1/ See Table 1, footnote 2.
2/ Includes principally District of Columbia receipts from taxes and fromFederal contributions, loans, and grants; funds appropriated to thePresident - mutual security trust funds; Indian tribal funds; in-
crement resulting from reduction in the weight of the gold dollar; andthe Railroad Unemployment Insurance Administration Fund throughNovember 1958 (for treatment after November 1958, see Table 10,published quarterly),
2/ For content see Table 6, These transactions are Included in the detail
i/
^
of both trust receipts and trust expenditures, but are deducted fromthe totals.Excludes certain intertrust fund transactions consisting mainly of
financial interchanges between trust funds resulting in receipts andexpenditures (see footnote 3),See Table 1, footnote 5.
Beginning fiscal 1961, tax receipts under the Federal Unemployment TaxAct are transferred currently to an administration account in the
Unemployment Trust Fund pursuant to the Biiployment Security Act of
1960, approved September 13, I960 (42 U.S.C. 1101 (b)); see "Budget
Receipts and Expenditures," Table 1, footnote 12.

JtLtie 196J 13
TRUST ACCOUNT AND OTHER TRANSACTIONS
,
Table 3.- Trust and Deposit Fund Account Expenditures
(in millions of dollars; negative figures are excess of credits)
Fiscal yearor month
Trust accounts, etc.
Federal Old-Ageand SurvivorsInsurance TrustFund 1/
FederalDisabilityInsuranceTrust Fund
RailroadRetirementAccount
Unemploy-mentTrustFund
NationalService LifeInsuranceFund
GovernmentLifeInsuranceFund
Federalemployees'ret ireraentfunds
HighwayTrustFund 1/
Federal NationalMortgage Assoc, 2/
Financingby Treasury
Otheroperations
19551956195719581959196019611962
1963 (Est.)...
1964 (Est.)...
1962-JulyAugust . .
.
September
October.
.
November.December.
1963-January.
.
February.March, . .
.
April. . .
.
May
4,4365,4856,6658,0419,38011,07311,75213,270
14,51815,331
1,1461,1571,157
1,1731,1671,163
1,1141,1821,199
1,2091,217
1
181361 1/561 V746
1,089
1,2461,319
939493
989698
165
98102
100100
585611682730778
1,1361,1241,135
1,1121,099
88
9988
8910190
90101
91
9192
1,9651,3931,6443,1483,0542,7364,734 i/3,906
3,7503,770
205204218
213240280
418
748422
359233
538512515
544562582
707626
792488
53
52
43
50
4539
279
4141
38
35
8487861208083
9496
78
58
107
4
18
5
6
430507591699792896
9551,063
1,2261,354
949695
9895
95
94
9598
100100
9661,5122,6132,945 2/2,6202,784
3,0003,391
239317279
349308267
220
153196
173216
-93-9441
3
-42
42-16
-64
30*
12-16-51
-1
84
-57
63
9206929102176946-73317
250485
-33-5
25
8
3
-11
-49-119
-151
-169-164

u Treasury Bulletin
TRUST ACCOUNT AND OTHER TRANSACTIONS.
Table 4.- Net Investment by Government Agencies In I*ubllc Debt Securities
(In millions of dollars; negative figures are excess of sales)
Fiscal year
or monthTotal 1/
Trust accounts
Totaltrustaccounts
2/
FederalOld-Age andSurvivorsI ns''ranee
Trust Fund
FederalDisabilityInsuranceTrust Fund
RailroadRetire-mentAccount
Unemploy-mentTrustFund
NationalServiceLifeInsuranceFund
GovernmentLifeInsuranceFund
Federalemployees'retirementfunds
HighwayTrustFund
Federa
1
intermedi-ate creditbanks j/
Othertrustaccounts
1955.1956.
1957.
1958.1959.
1960.1961.
1962.
1963 (Est.).
1964 (Est.).
1962-July.
.
AugustSeptember
October.NovemberDecember
196 3-January.February,
March.
April.May...
1,3622,617 5/2,300
197-1,112
714435435
7732,077
-992
1,470-572
-796382
-626
-1,396452-43
-6162,827
1,2362,5162,263
106-1,214
548286244
4781,703
-1,013
1,449-520
-847369
-612
-1,433446-39
-6212,747
1,241 V1,463220-499
-1,290-726-225
-1,089
-73479
-852
752-369
-655
135-386
-881
33755
-5261,703
325729552
49428521
-104-145
-67
45-4
-46-4
-72
-69
10
-2
-15
53
14112136
-33-35264-78-63
-1
120
-72-6
-55
-66-20-67
-47-32-20
-78
3
-545258274
-1,255-1,011
-41-952
72
293519
-79622
-109
-126286-118
-296
5
-168
-216760
7313589957662
-44
44
-111192
-10-7-9
-5-3-5
-226-2
-2
-1-16-16-56-17-21-35-44
-26-9
-6
-4
-3
-4-2
-5
-15
-3
-4
-5
-3
3U548803671958871
1,0631,034
939985
55
6341
746447
70
61
47
9580
404418-393-428
233202
224-91
-15
-11
-41-90
5
17
69
69
100
50
99
-100
14
85/2836
4572
4166
-2
53
32-16
22
3-10
12
1
-U20
99

June 196J 15
. TEUST ACCOUNT AND OTHKR TRANSACTIONS .
Table 5,- Net Redemption or Sale of Obligations of Government Agencies in the Market
(In millions of dollars; negative figures are excess of sales)
Fiscal yearor month
Total 1/
Securities guaranteed by the United States
Totalguaranteed
Public enterprise funds
FederalFarmMortgageCorpo-ration
Federa
1
HousingAdminis-tration
HomeOwners'LoanCorpo-ration
Trustenterprisefund
D. C.
stadiumfund
Securities not guaranteed by the United States
Total notguaranteed
1/
Public enterprise funds
Federalinterme-diatecreditbanks 2/
FederalNationalMortgageAsso-ciation 2/
HomeOwners'LoanCorpo-ration
19551956195719581959 ,
1960 ,
1961 ,
1962 ,
1963 (Est.)...
196A (Est.)
1962-JulyAxigust, ,,
September
October.
.
November
.
December.
1963-January,
,
February.
March,. .
.
April. ..
.
May
-602-173
-1,085-567-71
-1,023733
-658
-357-459
119-46-41
-10-3
42
3917
209
70
44
37-30-33
6
-10-29-100-204
-Ul71
-3-22-18
1
-16-15
-13-10-7
-14-15
37-30-33
6-10-28-81-204
-Ul71
-3-22-18
1
-16-15
-13-10-7
-14-15
-19
-639-144
-1,052-573-61
-994833-454
-216-530
123-24-24
-11
1357
5227
217
84
58
-69-44136
-570
-2336
797
Fiscal yearor month
19551956195719581959196019611962
1963 (Est. )...
1964 (Est.)...
1962-JulyAugust . .
.
September
October,
,
November,December.
1963-January..February.March. . .
.
April. . .
.
May
Securities not guaranteed by the United States - (Continued)
Public enterprisefunds - (Cont.
)
TennesseeValleyAuthority
-50-95
-50
Trust enterprise funds
Federalintermediatecreditbanks 2/
-238-225
58
FederalNationalMortgageAssociation ^
-100-950-115-125
-99486
-359
-216-480
123-24-24
-11
1357
52
27217
84
58
Source: See Table 1,
1/ Excludes net transactions of Government-sponsored enterprises (see
Table 3).
2/ Classified as a public enterprise fund prior to January 1, 1957; as
trust enterprise fund January 1, 1957, to January 1, 1959; and as a
Memorandum
Gr emment-sponsored enterprises
TotalGovernment-sponsoredenterprises
-269-872-86
167-1,222
-723-195
-1,122
-400-565
-382-254
6
-3956822
280
19495
-1
-288
Banksforcooperatives
10-23-46-20-86-46-52-48
-40-40
-528
-5
-25
25
Federalhomeloanbanks
-226-588191282-554-284200-750
-200
-312-126-25
-448
282
260
M9102
-123
Federalintermediatecreditbanks 2/
-340-144-124-132
-160-150
-70-26
20
906747
-3
-57
-55
-92
-102
Government- sponsored enterprise thereafter,
2/ Management and liquidating functions,
^ Secondary market operations,* Less than $500,000,
Federallandbanks
-53-261-230-95-242-250-220-192
-200-175
-50
3
-321
-34
1
»
-64

16
THUST ACCOUNT AND OTHER TRAMSACTIONS
.
Table 6.- Intertrust Fund Transactions Excluded from Both
Net Trust Account Receipts and Net Trust Account Expenditures

Jane 196) 17
CASH INCCME AND OUTGO
The cash Income and outgo data appearing In the Treas-
ury Bulletin, beginning with the February I956 Issue, are
on a basis consistent with receipts from and payments to
the public as derived In the 1957 and subsequent Budgets
of the United States (In the Budget for 1963 In Special
Analysis 3). Reconciliation to cash deposits and with-
drawals In the account of the Treasurer of the United States
Is shown on the same basis as In the Budget documents.
There Is also shown the amount of net cash borrowing from,
or repayment of borrowing to, the public. By these arrange-
ments, data In accordance with the Budget olasslflcatlone
are made available month by month. Figures for back years
have been revised where necessary In order to make them as
nearly comparable with current Budget classifications as
available data will permit. For this reason certain of the
figures differ somewhat from those published In earlier
Budget documents as well as In the Bulletin.
The Bureau of the Budget series of cash transactions
Is designed to provide Information on the flow of money
between the public and the Federal CJovernment as a whole,
and therefore Includes transactions not cleared through
the Treasurer's account. Receipts and payments include
transactions both In budget accounts »nd In trust and de-
posit fund accounts. Operations of Government-sponsored
enterprises are Included In payments on a net basis ae re-
flected In Treasury reports. Major Intragovemmental trans-
actions which are reoorted as both expenditures and receipts
are excluded from both. Noncash Items representing the
obligation of the Oovernment to make payments In the future
also are eliminated from expenditures but are added later
when actual payments are made. These Items consist of
certain Interest accrued on the public debt, expenditures
Involving the Issuance of a few special public debt securi-
ties, and clearing accounts. Receipts from the exercise
of monetary authority are excluded as not representing cash
received from the public. Federal cash borrowing from the
public includes net borrowing by the Treasury through public
debt transactions and also net borrowing by Government
agencies and Government-sponsored enterprises through sales
of their own securities. It excludes changes in the public
debt which do not represent direct cash borrowing from the
public. The net effect of all these transactions with the
public Is reflected in changes in the balance in the Treas-
urer's account and in cash held outside the Treasury.
Cash transactions through the Treasurer's account are
similar in general concept to those included in the Bureau
of the Budget series, but are limited in coverage to trans-
actions which affect the balance in that account. On the
other hand, they Include receipts from the exercise of
monetary authority, which are excluded from receipts from
the public In the Bureau of the Budget series.
Period
Fiscal yea
19551956195719581959196019611962
1963 (Est.).
1964 (Est.).
1961-Jan.-June..July - Dec.
Total
1962-Jan.-June..July - Dec.
Total
1962- JulyAugust . . , .
September.
October,,
,
November,
,
December,
.
1963-January, ,,
February, ,
March
April.
May. .
.
1963 to date.
Table 1.- Summary of Federal Government Caph Transactions with the Public
(In millions of dollars)
Net cash transactions with thepublic other than borrowing
Federal re-ceipts fromthe public 1/
67,83677,08782,10581,89281,66095,07897,242101,887
108,431112,196
53,24944,680
97,929
57,20749,023
106,229
4,56710,32811,140
4,1509,2899,548
6,28510,35211,548
7,251
11,327
95,787
Federal pay-ments to thepublic 1/
70,53772,61680,00683,41294,80494,30199,528107,711
116,774122,477
50,84053,898
104,738
53,81358,136
111,950
9,31410,5778,639
10,14910,0219,436
8,8308,776
8,997
9,728
9,991
104,458
Excess of
receipts, orpayments (-)
-2,7024,4712,099-1,520
-13,144777
-2,286-5,824
-8,343-10,281
2,408-9,217
-6,809
3,393-9,1U
-5,720
-4,747-249
2,501
-5,998-732112
-2,5441,57b
2,552
-2,476
1,336
-8,671
Plus: Net cashborrowing fromthe public, orrepayment (-)
Source: Actual figures are based on the monthly statement of receipts
and expenditures of the Ciovernment and the daily Treasury statement
(for explanation of reporting bases, see page II); estimates are from
the 1964 Budget document released January 17, 1963, Including effects
of proposed legislation.
1,809-4,366-3,1005,7608,6781,821698
9,621
3,99410,232
-2,4269,180
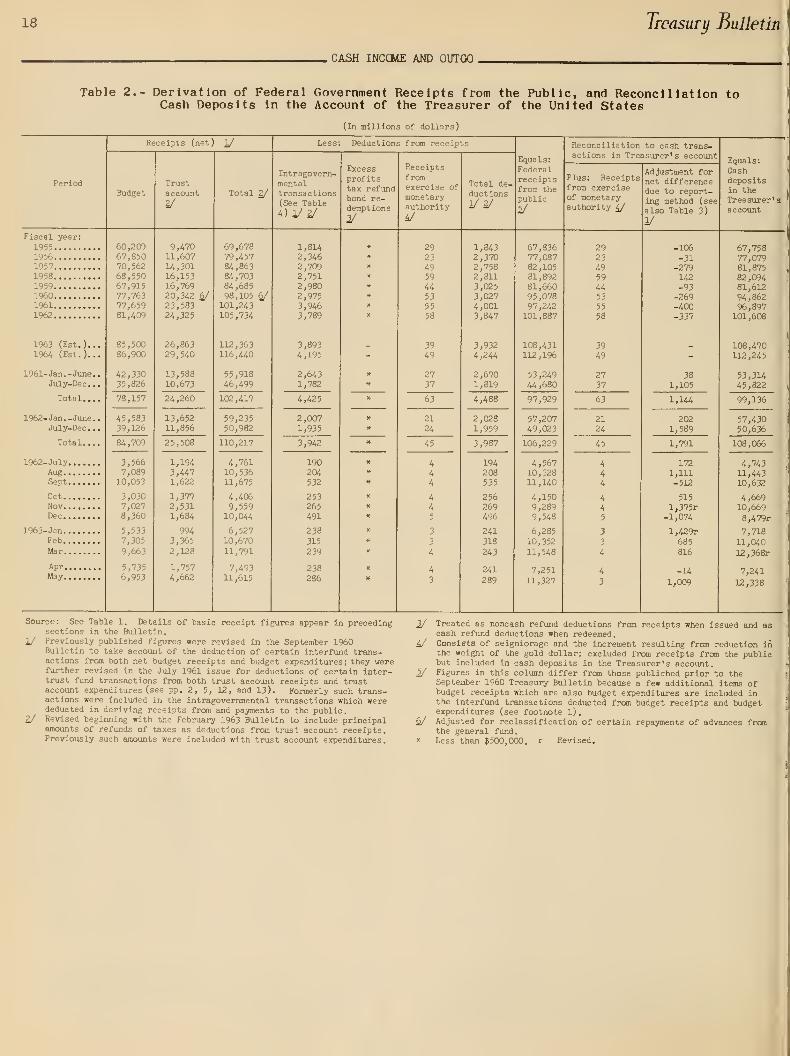
18 Treasury Bulletin
. CASH INCCME AND OUTGO ,
Table 2.- Derivation of Federal Government Receipts from the Public, and Reconciliation toCash Deposits In the Account of the Treasurer of the United States
(In millions of dollars)
Fiscal year:
19551956195719581959196019611962
1963 (Est.)..
1964 (Est.)..
1961-Jan. -June.July-Dec .
.
Total...
1962-Jan.-June.July-Dec .
.
Total...
1962-JulyAugSept
OctNovDec
1963-JanFeb
Mar
AprMay
Receipts (net) 1/
Budget
60,20967,85070,56268,55067,91577,76377,65981,409
85,50086,900
42,33035,826
78,157
45,58339,126
84,709
3,5667,089
10,053
3,0307,0278,360
5,5337,305
9,663
5,7356,953
Trustaccount
2/
9,47011,607U,30116,15316,76920,342 6/23,58324,325
26,86329,540
13,58810,673
24,260
13,65211,856
25,508
1,1943,4471,622
1,3772,5311,684
9943,365
2,128
1,7574,662
Total 2/
69,67879,45784,86384,70384,68598,105 6/101,243105,734
112,363116,440
55,91846,499
102,417
59,23550,982
110,217
4,76110,53611,675
4,4069,559
10,044
6,52710,670
11,791
7,49311,615
Less: Deductions from receipts
Intragovern-mentaltransactions(See Table4) 1/2/
1,8142,3462,7092,7512,9802,9753,9463,789
3,8934,195
2,6431,782
4,425
2,0071,935
3,942
190204532
253265491
238315
239
238286
Excess
profitstax refundbond re-demptions
2/
Receiptsfromexercise of
monetaryauthority
29
234959
4453
5558
3949
2737
63
21
24
45
Total de-
duct ions
Va/
1,8432,3702,7582,8113,0253,0274,0013,847
3,9324,244
2,6701,819
4,488
2,0281,959
3,987
194208535
256269496
241318
243
241
289
Equals:
Federalreceiptsfrom thepublic
67,83677,08782,10581,89281,66095,07897,242101,887
108,431112,196
53,24944,680
97,929
57,20749,023
106,229
4,56710,32811,140
4,1509,2899,548
6,28510,352
11,548
7,251
11,327
Reconciliation to cash trans,
actions in Treasurer's account
Plus; Receiptsfrom exerciseof monetaryauthority 4/
292349594453
55
58
39
49
2737
63
2124
45
Adjustment fornet differencedue to report-ing method (seealso Table 3)
1/
-106-31-279142-93-269-400-337
381,105
1,144
2021,589
1,791
172
1,111-512
515l,375r
-1,074
1,429t685
816
-14
1,009
Equals:Cashdepositsin theTreasurer'saccount
67,75877,07981,87582,09481,61294,86296,897101,608
108,470112,245
53,3M45,822
99,136
57,43050,636
108,066
4,74311,44310,632
4,66910,6698,479r
7,718
11,040
12,368r
7,241
12,338
Source: See Table 1, Details of basic receipt figures appear in preceding J/sections in the Bulletin.
1/ Previously published figures were revised in the September 1960 VBulletin to take account of the deduction of certain interfund trans-actions from both net budget receipts and budget expenditures; they werefurther revised in the July 1961 issue for deductions of certain inter- 5/trust fund transactions from both trust account receipts and trustaccount expenditures (see pp. 2, 5, 12, and 13). Formerly such trans-actions were included in the intragoverranental transactions which werededucted in deriving receipts from and payments to the public.
2/ Revised beginning with the February 1963 Bulletin to Include principal 6/amounts of refunds of taxes as deductions from trust account receipts
.
Previously such amounts were included with trust account expenditures. *
Treated as noncash refund deductions from receipts when issued and ascash refund deductions when redeemed.Consists of seigniorage and the increment resulting from reduction inthe weight of the gold dollar; excluded from receipts from the publicbut included in cash deposits in the Treasurer's account.Figures in this column differ from those published prior to theSeptember 1960 Treasury Bulletin because a few additional items ofbudget receipts which are also budget expenditures are included inthe interfund transactions deducted from budget receipts and budgetexpenditures (see footnote 1).Adjusted for reclassification of certain repayments of advances frcmthe general fund.Less than $500,000. r Revised,

June 196J 19
CASH INCCME AND OUTGO
Table 3.- Derivation of Federal Government Payments to the Public, and ReconciliationCash Withdrawals from the Account of the Treasurer of the United States
to
(In millions of
Fiscal year:
19551956195719581959196019611962
1963 (Est.)...
196-4 (Est.)...
1961- Ja n . -June .
,
July - Dec.
Total...
1962-Jan. -June..July - Dec.
Total
1962- JulyAugSept
OctNovDec
1963-JanFeb
Mar
AprMay
Expenditures
Budget
1/
6/;,389
66,22463,96671,36980,34276,53981,51587,787
94,31198,802
41,29843,165
84,463
44,62247,286
91,907
7,2528,5417,327
8,5248,0707,572
8,013
6,7637,806
7,5907,470
Trustanddepositfundaccount1/ 2/
2/
8.4809,358 8/
12,89315,89318,28220,698 2/23,01624,109
27,H028,029
12,67912,010
24,689
12,09912,357
24,456
1,8592,0822,362
2,1972,0471,811
2,4772,4922,232
2,0352,015
Government-sponsoredenterprise(net)
2/ i/
9832445
-6291,290487-236
1,094
135352
-159769
610
325694
1,019
33121345
-48-135
-264
-187
269292
Total
72,96675,90681,90486,63499,91597,724 2/104,295112,990
121,586127,184
53,81855,945
109,763
57,04560,338
117,383
9,44210,8379,733
10,6739,9829,671
9,8213,9919,351
9,8939,776
Less: Deductifrom expenditures
Intra-
govem-mentaltrans-actions(SeeTable 4)
1/ 2/
1,3142,3462,7092,7512,9802,9753,9463,789
3,8934,195
2,6431,782
4,425
2,0071,935
3,942
190204532
253265491
238315
239
238286
Accruedinterestand othernoncashexpend-itures(See
Table 5)
615
943-811470
2,131449821
1,490
919512
334265
599
1,225266
1,491
-62
55562
272-305-256
753-101
615
-73-501
Equals:Federalpay-mentsto thepublic
5/
70,53772,61680,00683,41294,80494,30199,528107,711
116,774122,477
50,84053,898
104,738
53,81358,136
111,950
9,31410,5778,639
10,14910,0219,436
8,8308,7768,997
9,7289,991
Reconciliation to cash transactionsin the Treasurer's account
Less: Payments to the publicnot reflected in theTreasurer's account
Cash heldoutsidetheTreasury
312202-5
-140234
222-118
274-199
74
81-4
-85
52-60
3957-6
-57-73245
-100
208
Proceeds of
sales in themarket of agencyobligations andpublic debtsecurities (SeeTable 6)
230399549506646520622866
497339
836
527477
1,004
9917352
485352
10^6
99
88
163
Clearingaccounts
6/
-175-294
-1,9041,327-306
309-5101,259
306
1,153
1,458
107569
675
44160
5
-276428
-114
963-266
-264
520
Adjustmentfor netdifferencedue toreportingmethod(See alscJ
Table 2)
1/
-106-31
-279
U2-93-269-400-337
1

20 Treasury Bulletin
CASH INCCME AND OUTGO
Table 4.- Intragovernmental Transactions Excluded from Both Receipts and Payments
(In millions of dollars)
Period
Fiscal year:
19551956195719581959196019611962
1963 (Est.)..1964 (Est.)..
1961-Jan.-June.July - Dec
Total...
1962-Jan.-June.July -Dec.
Total...
1962-JulyAugust ....September.
October. .
.
November,
.
December,
,
1963-January. .
.
February.
.
March
AprilMay
,
Budget re-ceipts whichare alsotrust fundexpenditures1/ 2/
3036
'i5
56
59696979
568505
176
46
33398
430
6
5
349
4268
25
38364
20
7
Budget receiptswhich are alsoGovernment-sponsoredenterpriseexpenditures
Trust fund receipts which arealso budget expenditures
Interest oninvestment h\
public debtsecurities
1,1731,2071,3181,3421,3151,3271,4041,423
1,4591,543
980431
1,410
993429
1,422
31
7
4043303
9
3911
4061
Intereston unin-vestedtrustfunds
5
5
6
8
9101010
1112
Payrolldeductions foremployees
'
retirement ^
439574644662746747841848
878948
439419
429447
876
73
76
67
837771
82
71
79
83
83
Other
166521695681846819
1,6191,423
9711,183
1,043876
2/
1,919
548652
1,199
107
84108
125119109
122-182
84
94
134
Total
2/ 6/
1,8U2,3462,7092,7512,9802,9753,9463,789
3,8934,195
2,6431,782
4,425
2,0071,935
3,942
190204532
253265491
238315
239
238
286
Source: See Table 1.
1/ Includes reimbursements for administrative expenses by the JederalOld-Age and Survivors and the Federal Disability Insurance trust ^funds, and beginning 1961, the Unemployment Trust Fund; reimbursementsfor refunds of employment and certain excise taxes (highway) throughfiscal I960; reimbursement by the District of Columbia; FederalNational Mortgage Association for payment of dividends, interest, etc.,under secondary market operations; and Federal intermediate creditbanic franchise tax and repayment of capital stock to the Treasuryafter December 1956 and before January 1959.
2/ See Table 2, footnote 2. 6/2/ Consists of payment of franchise tax by banks for cooperatives, and
also by Federal intermediate credit banks beginning January 1959.a/ Includes relatively small amounts of deductions from salaries paid by
trust funds and Government-sponsored enterprises , Beginning with 7/fiscal 1958 excludes deductions from salaries of District of Columbia
employees, and beginning with fiscal 1959 excludes voluntary contri-butions .
Consists of payments to employees ' retirement funds representingemploying agency. Federal Government, and Government corporation sharesof contributions; payments to the Railroad Retirement Account (forcreditable military service), the Unemployment Trust Fund, veterans'life insurance funds. Judicial Survivors Annuity Fund, trust fund fortechnical services and other assistance under the agricultural conserv-ation program, and District of Columbia; and awards of Indian ClaimsCommission.Figures in this column differ from those previously published becausebudget receipts which are also budget expenditures, and trust fundreceipts which are also trust fund expenditures are no longer included;see Tables 2 and 3.Adjusted for reclassification of certain repayments of advances fromthe general fund. * Less than $500,000.

June 196) 21
CASH INCCME AND OlTrGO,
Table 5.- Accrued Interest and Other Noncash Expenditures Excluded from Payments(In millions of dollar
Period
Net accruedinterest onsavings bondsand discounton Treasurybills 1/
Otheraccruedinterest onpublic debt
2/
Noncash -
ofpubl-:-
ciiditures involving issuancesecurities 2/
Adjustedservicebonds ^
Armed Forcesleave bonds ^
Special notes to - 6/
InternationalMonetary Fund
InternationalDevelopmentAssociation
Inter-AmericanDevelopmentBank
Clearingaccountforchecksoutstandingsetc. 2/
Total
Fiscal year:
19551956195719581959196019611962
1963 (Est.)...
196.4 (Est.)...
1961-Jan. - JuneJuly - Dec.
Total....
1962-Jan. - JuneJuly - Dec.
Total
1962- JulyAugustSeptember.
.
October. . .
.
November. .
.
December. .
.
1963- January....
February. .
.
March
AprilMay
497456388254801341222641
619610
42428
2682
39
9376
1326
18
-258211
156175
-674-4501,361259258171
295
27-108
58
58
36-22
58
55
7025
25
-55238
-55';
576-105-281279548
-100-100
525-348
470 -48
213415
-192407
627 215
-81 ^8 25
279345 36
3070
896-1,006
624 36 100 -110
10176
21
91
5372
78
48
11
71
J3
544-459424
409-560
49
551-629
484
412-578
335
-17-15-15
16-5
58-22
3015
25
-707103117
-258120
-381
141496134
-57150
615943
-811
4702,131
449821
1,490
919512
334265
599
1,225266
1,491
-62
55562
272-305-256
753-101615
-73-501
Source: See Table 1.
1/ Accrued interest on savings bonds. I.e., the difference between the ^purchase price and the current redemption value, and the discount on
bills at the time of issuance^ less interest paid on savings bonds and 6/bills redeemed.
2/ Net increase, or decrease (-), in accrued liability except for 1955which includes the net change in public debt interest checks and
coupons
.
^ Treated as noncash expenditures at the time of issuance of the securi- 7/ties and as cash expenditures at the time of their redenptions; netissuance, or redenption (-). *
4/ Issued in 1936 in exchange for adjusted service certificates held
by veterans of World War I. The bonds matured in 1945.Issued in 1947 in payment for accumulated leave. The last of thesebonds matured in 1951.Parts of the United States subscriptions to the InternationalMonetary Fund, the International Development Association, and theInter-American Development Bank were paid in nonnegotiable noninterest-bearing notes of the United States, payable on demand. See "BudgetReceipts and Expenditures," Table 3, footnote 13.Checks outstanding less deposits in transit, and changes in otheraccounts; net increase, or decrease (-).
Less than $500,000.

22 Treasury Bulletin
CASH INCOME AND OUTGO
Table 6.- Derivation of Federal Government Net Cash Debt Transactions with the Public,and Reconciliation to Net Cash Debt Transactions through the Account of the
Treasurer of the United States
(Net borrowing, or repayment of borrowing (-); in millions of dollars)
Period
Change in public debt and agency obligations held by the public
Public debt
increase, ordecrease (-)
Plus: Net sale of obligationsof Government enterprises inthe market
Public andtrust enter-prise funds
Government-sponsoredenterprises
Less: Net investment in Federalsecurities by Government agencies }/
Trust fundsPublicenterprisefunds
Government-sponsoredenterprises
Equals:
Increase insecuritiesheld by thepublic, ordecrease (-)
Fiscal year:
19551956 ,
1957 ,
1958 ,
1959 ,
1960 ,
19611962 ,
1963 (Est.)
196<; (Est.)
1961-Jan. - June.
July - Dec,
Total
1962-Jan. - June,
July - DecTotal
1962- JulyAugustSeptember. .
,
October. ,,,,
November, . .
,
December, , .
,
1963-JanuaryFebruary. . .
,
March
AprilMay
3,115-1,623-2,2245,8168,3631,6252,6409,230
5,29312,110
-1,2467,198
5,952
2,0325,269
7,301
-325
3,966-2,344
2,5693,323
-1,920
-531,221
-1,645
173
2,038
602173
1,08556771
1,023-733658
357459
-240394
154
263-62
202
-119
4641
10
3
-42
-39-17
-209
-70
-44
26987286
-1671,222
723195
1,122
400565
180506
686
616935
1,552
382
254-6
395-68-22
-280-194-95
1
288
1,2362,516 2/2,262
105-1,215
551289246
4781,703
677-1,260
-583
1,507-1,175
332
-1,0131,449-520
-847369
-612
-1,433446-39
-621
2,747
12b
1013691
102166
149191
295374
36
39
75
15240
192
2221
-53
5113
-U376
-4
5
79
171
549
a461-68
23643228
265212
339-263
75
291241
532
51
41-51
44367
-310
3897092
-268
-4
2,454-3,743-3,3925,560
10,8372,4181,234
10,544
5,01310,844
-2,3589,583
7,225
9617,037
7,998
8792,755
-1,685
3,3272,810 2/
-1,048 ]/
636488
-1,999
988
-541
Footnotes at end of table. (Continued on following page)

June 196J 23
CASH INCdffi AND OUTGO
Table 6.- Derivation of Federal Government Net Cash Debt Transactions with the Public,and Reconciliation to Net Cash Debt Transactions through the Account of the
Treasurer of the United States - (Continued)
(Net borrowing, or repayment of borrowing (-); in millions of dollars)
Period
Fiscal year;
19551956195719581959196019611962
1963 (Est.)...
1964 (Est.)...
,1961-Jan. - JuneJuly - Dec.
Total....
1962-Jan. - JuneJuly - Dec.
Total....
1962-JulyAugustSeptember..
October...
.
November. .
.
December..
.
1963-January. ...
February. ,
.
March
AprilMay
Less: Deductions for noncash and other transactions
Netaccruedinterestonsavingsbonds andTrea surybills V
497456388254801341222641
619610
42428
470
213415
627
10176
21
91
5372
78
4811
71
33
Adjustedservicebonds 6/
Issuance of public debt securities represent-ing expenditures, or refunds of receipts 2/
ArmedForcesleavebonds
6/
-7-6
-4-2
-2-1-1
Special notes to
InternationalMonetaryFund 6/
156175
-674-4501,361259258171
295
27-108
-81
279345
624
335
10
-17
-15-15
16
-5
InternationalDevelopmentAssociation 6/
58
58
36-22
58
58
36
36
58-22
Inter-AmericanDevelopmentBank 6/
55
7025
25
25
.30
70
100
3015
25
Excessprofitstaxrefundbonds 7/
Total
deduc-tions
644623
-292-2002,160
597536923
1,019612
68402
470
521
865
1,386
101
41121
121
1,548 2/1,337 i/
61
}}
-4
37
28
Equals:
Net cashborrowingfrom thepublic , orrepayment(-)
1,809-4,366-3,1005,7608,6781,821698
9,621
3,99410,232
-2,4269,130
6,755
4406,172
6,612
773
2,344-1,706
3,2061,262289
575
901-568
Less:
Transactionsnotreflectedin
theTreasurer'
s
account 8/
230399549506646520622866
497339
836
527477
1,004
9917352
43
5352
10
96
99
88
163
Equa Is
:
Net cashborrowingthroughtheTreasurer'saccount, orrepayment (-)
1,579-4,765-3,6485,2533,0321,301
76
8,755
3,99410,232
-2,9238,841
5,913
-37
5,695
5,608
6782,171-1,758
3,1581,209 2/236
564
359
-2,094
813-731
Source; See Table 1.
1/ In this table, in accordance with treatment in Budget documents, netinvestment in United States securities by Government-sponsored enter- 5/prises includes a small amount by other enterprises regarded asrepresenting net transactions with the public. In Table 3 under 6/"Trust Account and Other Transactions," these amounts are includedwith other trust accounts. 7/
2/ Does not include investments representing acquired securities amount-ing to $1,643,070 (par value) and donation of securities amounting 8/to $45,800 (par value). 2/
i/ Includes $1,412 million of 2-3/4 percent Treasury bonds of 1960-65acquired by Treasury in the November 15, 1962 refunding and held ina Treasury suspense account until maturity on December 15, 1962. »
^ Accrued discount on savings bonds and bills, which is included in the
principal of the public debt, less interest paid on savings bonds andbills redeemed.Treated as noncash transactions at the time of issuance and as cashtransactions at the time of redenqstion; net issuance, or redemption (-).Excluded from borrowing because the transactions are treated asexpenditures in Table 5.
Excluded from borrowing because the transactions are treated asdeductions from receipts in Table 2.
Market transactions in public debt securities and agency obligations.Includes balance in the account "Payment for 2-3/4 percent Treasurybonds of 1960-65 called for redemption on December 15, 1962."See footnote 3.
Less than $500,000.

24 Treasury Bulletin \
CASH INCCME AND OUTGO
Table 7.- Summary of Cash Transactions through the Account of the Treasurerof the United States
(in millions of dollars)
Period
Net cash transactions other than borrowing
Deposits and withdrawals (budget,trust, and other accounts)
Cash
depositsCash with-drawals 1/
Excess of deposits,or withdrawals (-)
Clearingaccounts
2/
Total nettransactions
Plus: Net cash borrow-
ing, or repayment ofborrowing (-
)
EquaIs : Trea surer '
s
account balance, in-crease, or decrease (-)
Fiscal year:
19551956195719581959196019611962
1963 (Est.)...
1964 (Est.)...
1961-Jan. - Jxine
July - Dec.
Total
1962-Jan. - JuneJuly - Dec.
Total
1962- JulyAugustSeptember..
October. . ..
November. ..
December. .
.
1963-January....February. .
.
March
April
May
1963 to date
67,75877,07981,87582,09481,61294,86296,897101,608
108,470112,245
53,31445,822
99,136
57,43050,635r
108,065r
4,74311,44310,632
4,66910,6698,479r
7,71811,04012,368r
7,241
12,338
101,340
69,71371,69077,27985,01593,73693,81797,774
107,886
116,694122,477
50,41456,016
106,429
53,51359,820r
113,334r
9,38411,9048,196
10,582ll,011r8,743r
10,192
10,4019,203
9,46311,U8
110,226
-1,9555,3904,596
-2,921-12,124
1,044-877
-6,278
-8,224-10,232
2,900-10,194
-7,294
3,916-9,185
-5,269
-4,641-4612,436
-5,913-343-264
-2,474
6393,166
-2,222
1,190
-8,886
-175-294
-1,9041,827-306
309-5101,259
306
1,153

June i96J 25
, ACCOUNT OF THE TREASURER OF THE UNITED STATES ,
Source and Availability of the Balance in the Treasurer's Account
The account of the Treasurer of the United States re-
flects not only budget receipts and expenditures but alsotrust, deposit fund, and public debt transactions.
The working cash of the Treasury is held mainly in
Treasurer's accounts with Federal Reserve Banks and branches.
As the balances In these accounts become depleted, they are
restored by calling In (transferring) funds from the tax and
loain accounts with thousands of commercial banks throughout
the country.
Deposits to tax and loan accounts occur In the normal
course of business under a uniform procedure applicable to
all banks whereby cuetomere of banks deposit with them tax
payments and funds for the purchase of Government securltlee.
In most cases the transaction Involves merely the transfer of
money from a customer' s account to the tetx and loan account In
the same bank. On occasions, to the extent authorized by the
Treasury, banks are permitted to deposit In these accountsproceeds from subscriptions to public debt securities enteredfor their own account as well as for the account of their
customers.
The tax and loan account system permits the Treasuryto leave funds In banks and In the communities In which theyarise until such time as the Treasury needs the funds for Its
operations. In this way the Treasury Is able to neutralizethe effect of Its fluctuating operations on bank reserves
and the economy.
A detailed description of the Treasury's depositarysystem may be found In the Annual Report of the Secretary
of the Treasury for 1955, pages 275-2S4.
Table 1.- Status of the Account of the Treasurer of the United States
(In millions of dollars)
End of
fiscalyear ormonth
Assets
Treasury operating balance
Availablefunds in
FederalReserveBanks
Tax and loanaccounts in
specialdepositaries
Gold inTrea suryfund
Totaloperatingbalance
Silver,coin, andcurrency
Unclassifiedcollections,etc.
In FederalReserveBanks inprocess of
collection
In otherdepositaries
Totalassets
Liabilities
1/
Balance in
account of
Treasurerof U. S.
19551956195719581959
19601961
1962
1961-December,
1962-JulyAugust . .
.
September
October.
.
November.December.
1963-January.
.
February,March...
.
April
May
380522
498/;iO
535
504408612
465
390478400
513
585597
821
841909
952
651
4,3654,6334,0828,2183,744
6,4585,4538,815
5,157
5,0897,2107,919
5,1315,7286,092
3,678
5,5806,466
4,340
5,992
493501489401101
106109121
118
120125116
130116126
112
128
116
127
118
5,2395,6565,0699,0304,380
7,0685,9699,548
5,740
5,6007,8138,435
5,7746,4286,8U
4,612
6,5497,491
5,420
6,761
187159190259306
253179
U7
181
165165167
161155162
182197
195
181
170
9337374963
58
6470
5776
76
5874
93
91 i/52
55
79
77
343421302287273
337222
303
173
251178310
2442U234
240278211
515
245
500438440365429
375335441
391
373367363
351341284
361370299
385
304
6,3626,7126,0379,9905,451
8,0926,76910,509
6,566
6,4468,5999,350
6,5897,2127,586
5,4857,4468,252
6,5797,558
146 2/166447240100 y8775
79
66
6981
71
10377
6,2166,5465,5909,7495,350
8,0056,69410,430
6,494
6,3808,5309,268
6,5187,1097,509
5,4857,4468,252
6,5797,558
2/
2/
Source: Daily Treasury statement,
1/ Includes reserves and other deposits of the Board of Trustees, PostalSavings System, and uncollected items, exchanges, etc., throughDecember 1962. Effective January 1963 balances of the Postal Savings
System fxinds were transferred to deposit fund accounts and became
demand obligations of the Treasury. Balances of these funds, there-
fore, are no longer liabilities within the general account of the
Treasurer. Uncollected items, exchanges, etc., also previously shown
as liabilities were combined with "Ifticlasslf led collections, etc," shown
under assets. Post Office Department and postmasters' disbursing
accounts also are included through November 1954. (See footnote 2),
Treasurer's checks outstanding are included through June 1958, after
which they are included in the balance in the Treasurer's account.
(See footnote 3).
2/ Beginning December 1954, Post Office Department and postmasters'
disbursing accounts are not treated as liability accounts of the
Treasurer of the United States, but are classified and treated as
other disbursing accounts, in accordance with the change in methodof reporting Post Office transactions (see "Budget Receipts and Ex-
penditures," Table 3), A; adjustment of -$207 million in the balance
in the Treasurer's account (and in the "clearing account") reflects
this change,
2/ Through June 1958, the balance of the Treasurer was reduced when
Treasurer's checks were issued and the amount of the checks was
carried as a liability until paid. Effective July 1958, the balance
is not reduced until the checks are paid, a procedure also applying
to checks drawn on the Treasurer by Government disbursing officers
and agencies,
^ Amounts shown, beginning January 1963, are net of uncollected items,
exchanges, etc. Previously these items were included under liabilities.

26 Treasury Bulletin
. ACCOUNT OF THE TREASURER OF THE UNITED STATES
,
Table 2.- Analysis of Changes In Tax and Loan Account Balances
(In millions of dollars)
Fiscal yearor month
Credits
Proceeds from sales of securities 1/
Savingsbonds
Retire-mentplanbonds
Taxantici-pationsecurities
Other
Taxes
Withheldandexcise 2/
Income (by
specialarrange-ment ) 2/
Totalcredits
With-drawals
Balance
End of
period
During period
High Low Average
19551956195719581959
196019611962
1961-December.
1962-JulyAugust . ,
.
September
October,.Noveniber.
December.
1963-January.
.
February.
March.. ,
.
AprilMay
3,8102,9762,8242,668
2,6792,7872,725
225
227211180
200196209
317243
231
237237
5,9776,0355,0432,9227,581
7,7847,6135,898
8,167786
6,56813,51313,164
7,9201,7883,774
1,9891
2,963
20,53823,89726,70927,88129,190
33,05934,51137,519
3,491
1,5144,5573,986
1,3544,2423,933
1,4324,8104,281
1,4885,053
2,9674,6114,1527,9035,919
6,0539,M26,521
1,539
61
1,312
34
1,596
44
1,763
30
42,07439,14045,44855,04458,520
57,49655,84256,438
5,256
1,8036,7585,479
4,5534,4385,738
1,7935,053
6,275
1,7555,290
42,54538,87146,00050,90862,994
54,78256,84753,076
5,029
5,5284,6374,770
7,3423,8415,374
4,2063,152
5,388
3,882
3,637
4,3654,6334,0828,2183,744
6,4585,4538,815
5,157
5,0897,2107,919
5,1315,7283,092
3,6785,580
6,466
4,340
5,992
7,2995,4866,0788,8698,055
6,4587,6538,889
5,512
8,7437,6317,919
9,4875,8246,188
5,886
5,580
6,746
5,648
6,884
1,9101,103
8131,078912
1,3901,1611,531
2,171
5,0894,0074,452
5,1314,0562,735
3,458
3,569
2,656
2,535
4,736
3,9913,3732,9873,2463,638
4,1034,1514,457
3,869
6,3355,8836,201
6,8495,0124,560
4,095
4,351
4,823
3,4975,899
Source: Office of Fiscal Assistant Secretary; figures are on basis of
telegraphic reports,l/ Special depositaries are permitted to make payment in the form of a
deposit credit for the purchase price of U, S. Government obligationspurchased by them for their own account, or for the account of theircustomers who enter subscriptions through them, when this method of
payment is permitted under the terms of the circulars inviting sub-
scriptions to the issues,
2/ Taxes eligible for credit consist of those deposited by taxpayers inthe depositary banks, as follows: Withheld income tax beginningMarch 1948; taxes on employers and employees under the Federal
Insurance Contributions Act beginning January 1950, and under theRailroad Retirement Tax Act beginning July 1951; and a number of
excise taxes beginning July 1953.
2/ Under a special procedure begun in March 1951, authorization may begiven for Income tax payments, or a portion of them, made by checksof $10,000 or more drawn on a special depositary bank, to be creditedto the tax and loan account in that bank. This procedure is
followed during some of the quarterly periods of heavy tax payments,* Less than $500,000,

Jane 196J 27
.DEBT ODTSTANDING.
Knd of
fiscalyear or
month
Table 1.- Summary of Federal Securities
(in millions of dollars)
Total outstanding
Total 1/Publicdebt 2/
Guaran-teedsecuri-ties
i/
Interest-bearing debt
Publicdebt
Guaran-teedsecuri-ties
2/ i/
Matured debt and debt bearing no interest
Total
Public debt
Total Matured
Special notes to - ^Inter-nationalMonetaryFund
Inter-nationalDevelopmentAssociation
Inter-AmericanDevelop-ment Bank
Other
6/
Guaranteedsecuri-ties i/(matured)
1955
1956195719581959196019611962
1961-Deoember.
.
1962-JulyAxjgust ....
September.
October. .,
November.
.
December..
1963-January. ,
.
February.
.
March
AprilMay
274,418272,825270,634276,444284,817286,471289,211298,645
296,499
298302299
302
305303
303305
303
303
305
,324,312,986
,553,893,988
,948,179
,541
,728
,781
274,374272,751270,527276,343284,706286,331288,971298,201
296,169
297,876301,842299,498
302,067305,390303,470
303,417304,638302,993
303,166
305,204
4474
107101111140240444
330
448470487
486503518
531541548
562
577
271,785269,956268,592274,798281,944283,380285,911294,886
293,019
294,363298,372296,057
298,630301,886299,726
299,858301,107299,525
299,750301,762
271,741269,883268,486274,698281,833283,241285,672294,442
292,689
293,918297,904295,571
298,145301,384299,209
299,332300,571298,978
299,189301,186
4373
106101110139240444
330
445468486
485502
517
526537
547
561
576
2,6342,8692,0421,6462,8733,0903,3003,759
3,480
3,%03,9393,929
3,9234,0074,262
4,0904,0724,016
3,978
4,019
2,6332,8682,0421,6462,8733,0903,2993,759
3,480
3,9583,9383,927
3,9224,0064,261
4,0854,0684,015
3,9774,018
589666529597476445349438
463
343342332
297299551
393391
354
298345
1,5671,7421,068618
1,9792,2382,4962,667
2,388
2,9623,0023,002
3,0023,012
3,012
2,9952,9802,965
2,9812,976
58115
115
115115115
115173151
151151
151
151151
55
25
55
55
55
85100125
125
125
125
125
125
477460444430417407396484
488
483423423
422422422
421
421420
421421
Source: Daily Treasury statement.
2/ Includes certain obligations not subject to statutory limitation. For
amounts subject to limitation, see page 1,
2/ Includes debt incurred for advances to certain wholly owned Governmentagencies in exchange for which their obligations were Issued to the
Treasury (see Table 6),
2/ Held outside the Treasury.
4/ Consists of Federal Housing Administration debentxires, and also D. C.
Armory Board stadium bonds beginning July 1959.
^ Special notes of the United States issued to the International MonetaryFund, the International Development Association, and the Inter-AmericanDevelopment Bank in payment of part of the U. S, subscription to each.
6/ For current month detail, see "Statutory Debt Limitation," Table 2.» Less than $500,000.
Table 2.- Computed Interest Charge and Computed Interest Rate on Federal Securities
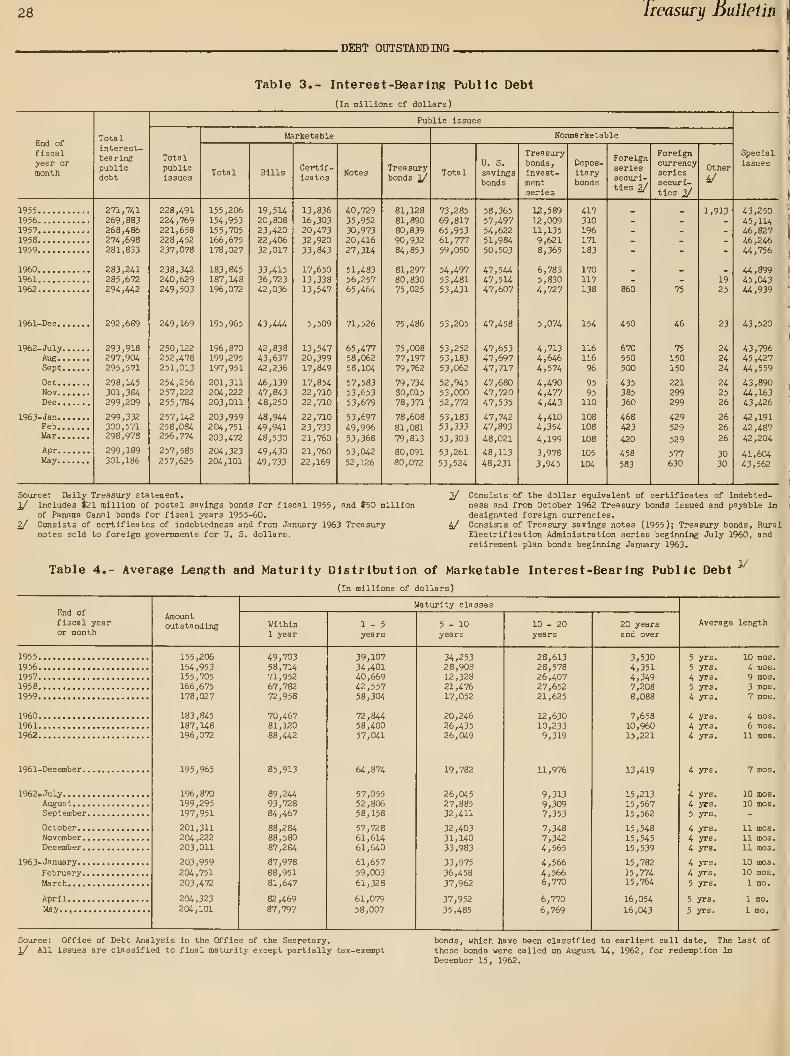
28 Ireasury nulletin
.DEBT OUTSTANDING.
Table 3.- Interest-Bearing Public Debt
(In millions of dollars)
End of
fiscalyear ormonth
Totalinterest-bearingpublicdebt
Public issues
Totalpublicissues
Marketable
Certif-icates
NotesTrea surybonds 1/
Nonmarketable
TotalU. S.
savingsbonds
Treasurybonds
,
invest-mentseries
Depos-itarybonds
Foreignseriessecuri-ties 2/
Foreigncurrencyseriessecuri-ties y
Other
Specialissues
195519561957 ,
19581959
196019611%2
1961-Dec.
1%2-JulyAug.
Sept
Oct.Nov.
Dec.
1963-Jan.Feb.Uar.,
Apr.
May.
271,741269,883268,486274,698281,833
283,241285,672294,442
292,689
293,918297,904295,571
298,M5301,384299,209
299,332300,571298,978
299,189301,186
228,491224,769221,658228,452237,078
238,342240,629249,503
249,169
250,122252,478251,013
254,256257,222255,784
257,M2258,084256,774
257,585257,625
155,206154,953155,705166,675178,027
183,845187,US196,072
195,965
196,870199,295197,951
201,311204,222203,011
203,959204,751
203,472
204,323204,101
19,5U20,80823,42022,40632,017
33,41536,72342,036
43,4^4
42,83843,63742,236
46,13947,84348,250
48,94449,94148,530
49,43049,733
13,83616,30320,47332,92033,843
17,65013,33813,547
5,509
13,54720,39917,849
17,85422,71022,710
22,71023,73321,760
21,760
22,169
40,72935,95230,97320,41627,3U
51,48356,25765,464
71,526
65,47758,06258,104
57,58353,65353,679
53,69749,996
53,368
53,042
52,126
81,12881,89080,83990,93284,853
81,29780,83075,025
75,486
75,00877,19779,762
79,73430,01578,371
78,608
81,081
79,813
80,091
80,072
73,28569,81765,95361,77759,050
54,49753,48153,431
53,205
53,25253,18353,062
52,94553,00052,772
53,18353,333
53,303
53,261
53,524
58,36557,49754,62251,98450,503
47,54447,51447,607
47,458
47,65347,69747,717
47,68047,72047,535
47,74247,893
48,021
48,113
48,231
12,58912,00911,1359,6218,365
6,7835,8304,727
5,074
4,7134,6464,574
4,4904,4774,443
4,4104,354
4,199
3,978
3,945
417310196171183
170117138
154
11611696
95
95110
108108
108
105
104
860
450
670550500
435385360
468423
420
458
583
75
46
75
150150
221299299
429529
529
577630
1,913
23
24
2A24
242526
26
26
26
3030
43,25045, lU46,82746,24644,756
44,89945,04344,939
43,520
43,79645,42744,559
43,89044,16343,426
42,191
42,48742,204
41,60443,562
Source: Dally Treasury statement. 2/1/ Includes $21 million of postal savings bonds for fiscal 1955, and $50 million
of Panama Canal bonds for fiscal years 1955-60.
2/ Consists of certificates of indebtedness and from January 1%3 Treasury 4/notes sold to foreign governments for U, S. dollars.
Consists of the dollar equivalent of certificates of indebted-ness and from October 1962 Treasury bonds issued and payable in
designated foreign currencies.Consists of Treasury savings notes (1955); Treasury bonds, RuralElectrification Administration series beginning July 1960, andretirement plan bonds beginning January 1963.
Table 4.- Average Length and Maturity Distribution of Marketable Interest -Bearing Public Debt
(In millions of dollars)
1/
End of
fiscal yearor month
Amountoutstanding
Maturity classes
Within1 year
1-5years
5-10years
10 - 20years
20 yearsand over
Average length
1955
1956195719581959
196019611962
1961-December.
1962=JulyAugust . .
.
September
October.
.
November.December.
1963-January..
February.
,
March,, .,
AprilMay......
155,206154,953155,705166,675178,027
183,845187,148196,072
195,965
196,870199,295197,951
201,311204,222203,011
203,959
204,751203,472
204,323204,101
49,70358,7U71,95267,78272,958
70,46781,12088,4«
85,913
89,2U93,72884,467
88,28488,58087,284
87,97888,95181,647
82,46987,797
39,10734,40140,66942,55758,304
72,84458,40057,041
64,874
57,05552,80658,158
57,72861,6U61,640
61,657
59,00361,328
61,07958,007
34,25328,90812,32821,47617,052
20,24626,43526,049
19,782
26,04527,88532,411
32,40331, WO33,983
33,97536,458
37,962
37,952
35,485
28,61328,57826,40727,65221,625
12,63010,2339,319
11,976
9,3139,3097,353
7,3487,3424,565
4,5664,5666,770
6,770
6,769
3,5304,3514,3497,2088,088
7,65810,96015,221
13,419
5 yrs.
5 yrs.
4 yrs.
5 yrs.
4 yrs.
yrs.
yrs.
yrs.
4 yrs.
10 mos.
4 mos.
9 mos,
3 mos.7 mos.
4 mos.
6 mos,
11 mos.
7 mos.
15,21315,56715,562

June 196J 29
.DEBT ODTSTAMDING.
Table 5.- Special Public Debt Issues to United States Government Investment Accounts
(In millions of dollars)
End of fiscalyear or month

30 Treasury Bulletin
DEBT OUTSTANDING
Table 6.- Treasury Holdings of Securities Issued by Government
Corporations and Other Agencies
(In miliions of dollars)
End of
fiscalyear ormonth
Total
AgencyforInter-nationalDevelop-ment 1/
Agriculture Department
CommodityCreditCorpo-ration
RuralElectri-ficationAdminis-tration
Secretary:Farmers*HomeAdminis-trationprograms
3/
Export-ImportBank ofWash-ington
y
Housing and HomeFinance Agency
Adminis-trator
i/
Federa
1
NationalMortgageAssoci-ation ^
PublicHousingAdmin-istra-tion
SaintLawrenceSeawayDevelop-mentCorpo-ration
Tenn.ValleyAuthor-ity
Veterans*Adminis-tration:Directloanprogram
UnderDefenseProductionActof 19506/
Other
2/
1955195619571958
1959196019611962
1961-December.
1%2-JulyAugust , .
.
September
October.
.
November,December.
1963-January.
.
February,March. . .
.
AprilMay
16,17520,04922,73121,85925,34325,63626,01128,634
27,527
27,83627,51627,912
28,55028,48428,748
28,92728,78128,847
29,04029,077
1,2091,2131,1981,1881,1641,1381,1071,062
1,093
830830830
829829818
818818817
817817
7,60811,19013,38311,52812,87412,70411,53412,990
11,952
12,H511,77812,123
12,59812,45112,884
12,92612,92112,769
13,01713,325
2,2072,3432,5192,7282,9233,1553,3323,484
3,423
3,5743,5743,574
3,6543,6543,572
3,6523,6523,742
3,742
3,742
162151265256323369456854
695
885888913
%1983973
988991
1,015
1,0401,040
1,3101,2391,2051,5281,9371,6361,6981,830
2,000
1,7831,7961,804
1,8061,8411,680
X,6521,6431,650
1,700
1,498
130165282476730977
1,2131,567
1,356
1,6201,6761,689
1,7301,7461,778
1,8481,868
1,882
1,935
1,990
1,9661,9541,7411,5022,3512,3383,2023,167
3,333
3,2663,1983,173
3,1333,1393,166
3,1773,0503,058
2,876
2,783
61
38413527293232
30
3272
93
444183
28
28
97
58
25
3
16
4897
112118121121
121
121121121
121121121
121
122
122
122
123
U
252525
25
5050
5050
491584733780930
1,1801,3301,530
1,530
1,5801,5801,580
1,6401,6401,640
1,690
1,6901,690
1,7301,730
1,0021,1441,2941,7231,9501,9701,9641,976
1,971
1,9781,9821,989
1,9871,9871,986
1,979
1,9251,925
1,9231,923
1411
211822212222
22
222222
222222
222229
2929
Source: Daily Treasury statement. ^Note: These securities were issued to the Treasury in exchange for ad-
vances by the Treasury from public debt receipts xinder congressionalauthorization for specified government corporations and other agencies ^to borrow from the Treasury, Further detail may be found in the 1961Annual Report of the Secretary of the Treasury, page 736, and the 1962Combined Statement of Receipts, Expenditures and Balances of the UnitedStates Government, page 514.
1/ And predecessor agencies. Beginning fiscal 1957 figures exclude notes 6/previously issued by the Administrator in connection with informationalmedia guaranties. The obligations for these notes was assumed by theDirector of the United States Information Agency, pursuant to the actapproved July 18, 1956 (22 U.S.C. U42), and the notes together withothers issued for the same purpose are included in "Other." 2/
2/ Farm housing and other loan programs, and Agricultural Credit InsuranceFund (formerly Farm Tenant Mortgage Insurance Fund),
2/ Includes securities transferred from the Reconstruction Finance Corpo-ration, but excludes securities issued under the Defense ProductionAct.
Consists of notes issued to borrow for; The urban renewal program(formerly slum clearance program );> college housing loans; and publicfacility loans beginning fiscal 1956,Consists of liabilities taken over by the Association from theAdministrator in accordance with the act approved August 2, 1954, andnotes issued by the Association under authority 'of that act (12 U.S.C.1719 (c), 1720 (d), and 1721 (d)) and also securities transferredfrom the Reconstruction Finance Corporation.Consists of notes of: The Administrator, General Services Administra-tion, for defense materials procurement; the Secretary of Agriculture;the Secretary of the Interior (Defense Minerals Exploration Adminis-tration); the Export-Import Bank of Washington through March 1962;and the Secretary of the Treasury.Consists of notes issued by the: Secretary of the Treasury; £taiall
Business Administration, fiscal years 1955-57; United States Informa-tion Agency for informational media guaranties beginning fiscal 1957(see footnote 5); Secretary of Commerce (Maritime Administration) for
the Federal Ship Mortgage Insurance Fund fiscal years 1959-61, and
March 1963; Virgin Islands Corporation beginning fiscal 1960; and
District of Columbia Commissioners for the Stadium Sinking Fxmd
beginning June 1962.

June 196J30.
.DEBT OUTSTANDING.
Table 7.- Interest-Bearing Securities Issued by Federal Agencies But Not
Guaranteed by the United States Government
(In millions of dollars)
End of fiscalyear or month
Banks forcooperatives
Federalhome loanbanks l/
Federalintermediatecredit banks
Federal landbanks 2/ 2/
Federal NationalMortgage Association
Managementand liquidat-ing issues
All otherissues
TennesseeValleyAuthority
19551956195719581959
196019611962
1961-December.
1962- JulyAugust , .
.
September
October.
.
November.December.
1963-January.
.
February,March. . ,
.
April....May
2,8763,8895,0135,4236,708
8,4077,7659,332
8,574
9,5939,8659,883
10,29310,21310,133
9,8009,5789,267
9,1859,415
110
133179199284
330382
430
434
430482474
480480504
504
480480
490489
341929738
456992
1,2591,0551,797
1,571
2,1082,2332,257
2,7072,7072,707
2,4242,1642,014
1,912
2,035
793834924
1,1591,456
1,6001,7231,855
1,535
1,9361,9501,930
1,842
1,7741,727
1,7291,787
1,842
1,935
2,037
1,0611,322
1,5521,6461,888
2,1372,3572,550
2,431
2,5502,5962,596
2,6282,6282,628
2,628
2,661
2,661
2,661
2,725
570
570570797797
797
100100
1,0501,1651,290
2,2842,1982,556
2,453
2,4352,4582,481
2,4922,4792,422
2,370
2,3432,126
2,043
1,984
50
145
U5145145
U5U5145
145
145U5
U5M5
Source: Office of Debt Analysis and agency reports. 2/
Note: The securities shown in the table are public offerings.
2/ The propri-etary Interest of the United States in these banks ended 2/in July 1951.
The proprietary interest of the United States in these banks ended
June 1947.Figures do not include secxirities which are issued for use as collateral
for commercial bank borrowing and not as a part of public offerings.
Includes small amounts owned by Federal land banks.

32 Treasury Bulletin
.STATUTORY DEBT LIMITATION.
The Second Liberty Bond Act (3I U.3.C. J^Jh), ae amended
by an act approved June 30, 1959. provldee that the face a-
fflount of obligations leeued under authority of that act, and
the face amount of obligations giiarantood as to principal and
Interest by the United Statoe (except guaranteed obligations
held by the Secretary of the Treasury jshall not exceed In the
aggregate t2S3 billion outstanding at any one time. The cor-
responding limitation In effect under the act of June 26,19't6,
was $275 billion and that under the act of September 2, 1958,
was $2S3 billion. In addition, temporary Increases have been
authorized as follows: $6 billion from August 26, 1954-, through
June 30, 1956 (acts of August 28, 195lt, and June 30, 1955);
13 billion from July 1, I956, through June 30, I957 (aot of
July 9, 1956); 15 billion from February 26, I958, through
June 30, 1959 (act of February 26, I95S); $10 billion from
July 1, 1959, through June 30, i960 (act of June 30, 1959); $8
billion from July 1, I96O, through June 30, 196I (act of June
30, i960); $13 billion from July 1, 196I, through March 12,
1962, and I15 billion from March 13 through June 30, 1962(acts
of June 30, 1961, and March 13, 1952); $23 billion from July
1, 1962, through March 31, 1963, $20 billion from April 1
through May 28, 1963, $22 billion from May 29 through June
30, 1963, and $21+ billion from July 1 through August 31, 1963
(acts of July 1, 1962, and Hay 29, I963). Obligations Issued
on a discount basis redeemable before maturity at the option
of the owner are Included In the statutory debt limitation
at current redemption values.
Table 1.- Status Under Limitation May 31, 1963(In millions of dollars)
Maximum amount of securities which may be outstanding at any one time under limitation imposed by the actof June 30, 1959 (31 U.S.C. 757b)j as increased temporarily by the act of May 29, 1963
Amount of securities outstanding subject to such statutory debt limitation:U. S, Government securities issued under the Second Liberty Bond Act, as amended.Guaranteed securities held outside the Treasury , ,
304,836577
Total amount of securities outstanding subject to statutory debt limitation.
Balance issuable under limitation
307,000
305,413
1,587
Source: Daily Treasury statement.
Table 2.- Appllcatlon of Limitation to Public Debt and Guaranteed SecuritiesOutstanding May 31, 1963
(In millions of dollars)
Class of securitySubject to statutorydebt limitation
Not subject to statutorydebt limitation
Totaloutstanding
Public debt:
Interest-bearing securities:Marketable:
Trea sury billsCertificates of Indebtedness.Treasury notesTreasury bonds
49,73322,16952,12680,072
Total marketable. 204,101Nonmarketable:Foreign series:
Certificates of indebtednessTrea sury notes
Foreign currency series:Certificates of indebtednessTreasury bonds
U. S, savings bonds (current redemption value).U. S, retirement plan bondsDepositary bondsTreasury bonds, investment seriesTreasury bonds, R. E. A. series
Total nonmarketable
400183
25605
48,231
104
3,94530
53,524
Special issues to Government agencies and trust funds
Total interest-bearing securities
Matured securities on which interest has ceasedDebt bearing no interest:
United States savings stampsExcess profits tax refund bondsSpecial notes of the United States:
International Monetary Fund seriesInternational Development Association seriesInter-American Development Bank series
United States notes (less gold reserve)Deposits for retirement of national bank and Federal Reserve Bank notes.Other debt bearing no interest
Total debt bearing no interest
Tota 1 public debt
Guaranteed securities: 1/
Interest-bearingMatured
43,562
301,186
342
541
2,976151125
3,307
304,836
5761
Total guaranteed securities
Total public debt and guaranteed securities.
577
305,413
-

June 196J 33
PUBLIC DEBT OPERATIONS.
Table 1.- Maturity Schedule of Interest-Bearing Public Marketable SecuritiesOutstanding May 31, 1063
Other Than Regular Weekly Treasury Bills
(In millions of dollars)
Yearand

34 Ireasury Bulletin
PUBLIC DEBT OPERATIONS
Table 1.- Maturity Schedule of Interest-Bearing Public Marketable SecuritiesOutstanding May 31, 1963
Other Than Regular Weekly Treasury Bills - (Continued)
(In millions of dollars)

Jane 196J35
PUBLIC DEBT OPERATIONS
Issue date
Regular weekly bills:
1963-Jan.
Jan 10.
Jan,
Jan. 2A.
Jan. 31.
Feb.
Feb.
Feb.
Feb.
Mar.
Mar.
Mar.
Apr.
Apr.
Apr.
Apr.
May
May
May
May
May
U.
21...
28..
U.
21,
28.
lip.
18p.
25p.
2p.
9p.
16p.,
23p.,
31p..
Table 2.- Offerings of Treasury Bills
(Amounte In millions of dollars)
Maturitydate
Tax anticipation bills:
1%2-Oct.1963-Feb.
Mar.
Other bills:
1%2-Jan.Apr.JulyOct.
1%3-Jan.Apr.
3..
6..22..
15..
15..
15..15..
15..
15p.
1963-Apr.July
Apr.July
Apr.July
Apr.July
MayAug.
MayAug.
KayAug.
MayAug.
MayAug.
JuneSept.
JuneSept.
JuneSept.
JuneSept,
JulyOct.
JulyOct.
JulyOct.
JulyOct.
Aug.Oct.
Aug.Nov.
Aug.Nov.
Aug.Nov.
Aug.Nov.
45
1111
1818
2525
2
1
16
15
2322
3129
6
5
1312
2019
2726
5
3
11
10
1817
25
2A
1
31
Deacrlption of new issue
8
7
15
U22
21
2929
1963-Mar.JuneJune
1963-Jan.Apr,JulyOct.
1964-Jan.Apr.
22
2424
15
15
15
15
15
15
Number ofdays tomaturity 1/
91183
91182
91182
91182
91182
91182
91182
91182
92182
91182
91182
91182
91182
92182
91182
91182
91182
91182
91182
91182
91182
90182
17013894
365365365365
365366
Amount ofbidstendered
2,220.01,339.5
2,196.31,541.6
2,363.11,250.0
2,253.51,352.8
2,035.41,197.2
1,911.71,338.2
2,426.71,270.3
2,343.91,496.4
1,956.11,207.5
1,981.01,406.8
2,042,11,428,7
2,335,91,305.4
2,132.51,458.7
2,080.91,454.1
2,292.01,553.2
2,351.61,485.0
2,258.61,670.4
2,054.41,667.7
2,119.31,714.6
2,397.21,583.3
2,179.61,472.5
2,034.21,411.2
5,945.82,061.82,442.2
3,650,93,453,73,722.34,535.0
5,244.44,047.6
Amount of bids accepted
Totalamount
1,301.1800.5
1,300.9800.5
1,301.1800.0
1,302.1800.3
1,300.5800.0
1,300.8799.2
1,303.3800.0
1,300.3800.4
1,300.1800.2
1,301.3800.5
1,300.4800.3
1,301.3800.6
1,300.8800.0
1,300.5800.0
1,302.0801.4
1,300.7300.4
1,300,2801.1
1,301.7801.0
1,301.0801,8
1,301,5800,7
1,301,7800,4
1,302,4801,3
3,005,21,000,71,502,3
2,001,32,008,82,003,62,500.1
2,4%.22,500.8
On competi-tive basis
1,092.1759.3
1,006.9736.6
969.1729.3
1,038.4739.5
1,067.1751.2
1,067.0747.7
1,033.4741.2
1,051.1746.6
1,087.5754.0
1,069.9751.1
1,034.1743.1
1,019.0736.5
1,053.9749.6
1,078.0746.3
1,031.7741.2
991.3732.6
1,057.1739.2
1,083.3743.5
1,078.9747.1
1,054.6732.1
1,079.9742.1
1,109.3752.1
2,440.4958.4
1,455.0
1,810.81,841.31,778.92,315.1
2,252.92,310.0
On nonconpeti-tive basis 2/
Source: Bureau of the Public Debt. Preliminary figures are from subscrip-tion and allotment reports; final figures are on "clearance" basis indaily Treasury statement.
1/ The 13-ueek bills represent additional issues of bills with an originalmaturity of 26 weeks. 2/
2/ For 13-week issues, tenders for $200,000 or less, and for 26-week(Continued on following page)
208.941.2
294.063.8
331.970.7
263.760.8
233.448.8
233.851.5
269.958.8
249.253.8
212.646.2
231.449.4
266.357.1
282.364.1
247.050.4
222.553.7
270.360.2
309.467.8
243.161.9
218.357.5
222.154.7
246.968.6
221.858.4
193.149.2
564.842.347.3
190.4159.5224.7185.1
243.2190.7
In
exchange
133.453.3
113.722.8
82.9M.2
135.250.5
82.221.5
102.343.2
52.922.9
126.642.4
121.6
45.1
122.359.5
103.518.6
175.654.3
147.354.0
125.743.6
136.453.3
16.5
3.9
93.333.4
92.731.5
150.958.2
13.44.4
141.764.1
157.42.8
138.780.116.3
190.0
38.684.1
Amountmaturing onissue dateof newoffering
1,300.5700.2
1,301.4700.1
1,300.3800.2
1,300.5803.0
1,301.1800.4
1,300.9800.5
1,302.3804.0
1,300.1799.9
1,300.4800.3
1,300.3800.4
1,300.7800.7
1,301.0800.6
1,309.1700.1
1,301.1701.1
1,300.9700.6
1,301.1700.0
1,302.700.
1,300.5700.8
1,300.8702.3
,303.
701.
1,300.3800.0
1,300.1800.7
3,005.2
1,501.72,000.52,003.52,003.5
2,001.32,000.8
Total ofunmaturedissues out-standing afternew issues
16,919.219.921.1 2/
16,918.820.021.4 1/
16.919.5 ,
20.021.3 i/
16,921.120.018.6 2/
16,920.420.018.2 2/
16,920.320,016.9 2/
16,921.320,013.0 2/
16,921.420,013.5 2/
16,921.220.013.4 2/
16,922.220.013.5 2/
16,921.920,013.0 2/
16,922.220,013.0 y16,914.020,113.0
16,913.420,211.9
16,9U.520,312.7
16,9U.220,413.1
16,912.320,513.9
16,913.520,61A.l
16,913.720,713.6
16,911.920,812.9
16,913.320,813.4
16,915.620,813.9
3,005.24,005.92,502.9
8,008.78,009.08,009.18,505.7
9,000.69,500.6
Issues, beginning June 11, 1959, tenders for 1100,000 or less fromany one bidder are accepted in full at average price of acceptedcompetitive bids; for other issues, the corresponding amount isstipulated in each offering announcement.Includes "strip" bills issued November 15, 1%2,

36 Treasury Bulletin
PUBLIC DEBT OPERATIONS
Table 2.- Offerings of Treasury Bills - (Contlnuedl
Issue date
On total bids accepted
Average priceper himdred
Equivalent averagerate ^
On coopetitlve bids accepted
High
Price per hundred Equivalent rate ^Low
Price per hundred Equivalent rate it/
Regular weekly bills
;
1963-Jan. 3
Jan. 10
Jan. 17
Jan. ZA
Jan. 31
Feb. 7
Feb. U
Feb. 21 ,
Feb. 28
Mar. 7
Mar. U ,
Mar. 21 ,
Mar. 28 ,
Apr. 4p ,
Apr. lip ,
Apr. 18p ,
Apr. 25p
May 2p ,
May 9p ,
May 16p ,
May 23p ,
May 31p ,
Tax anticipation bills
1962-Oct. 3 ,
1963-Feb. 6 ,
Mar. 22
Other bills:
1962-Jan. 15
Apr. 15
July 15 ,
Oct. 15 ,
1963-Jan. 15Apr. 15p
f99.260198.492
(99.262
\98. 500
/99.271\ 98. 518
f 99. 261
198.496
/ 99. 363\98.498
f99.£55\98.486
f99.256\98.486
f99.266\98.499
("99.267
\98.523
/99.268[98.515
("99.275
\98.518
/99.266\98.506
i'99.262
\98.495
J'99.253198.492
[99.264198.495
J99.2631,98.478
(99.271
198.492
f99.268198.489
f99.2661.98.487
[99.266198.488
[99.2611.98.481
[99.257198.455
98.765
98.87799.254
96.58897.01296.69896.989
96.94396.887
(Percent)
2.9262.%6
2.9202.966
2.8842.932
2.9232.976
2.9172.972
2.9472.995
2.9442.995
2.9052.969
2.8702.922
2.8972.938
2.8702.931
2.9022.955
2.9192.977
2.9222.982
2.9132.978
2.9173.010
2.8842.982
2.8972.989
2.9052.993
2.9032.990
2.9223.005
2.9733.055
2.616
2.9292.855
3.3662.9433.2572.969
3.0153.062
§/
2/
2/
99.27098.506
99.26798.508
99.27598.528
99.27198.518
99.26798.507
99.26698.500
99.26298.492
99.27098.506
99.27698.530
99.27498.522
99.28098.526
99.27598.513
99.27098.502 iC/
99.26898.498
99.26798.500
99.26698.484 U/99.27598.496 12/
99.27498.494 12/
99.27098.496
99.27098.494
99.27098.490
99.260 iV98.462
98.820 ly
98.89199.261
96.6U W97.OU96.730 12/97.019 12/
96.958 12/%.899 22/
(Percent)
2.8882.939
2.9002.951
2.8682.912
2.8842.931
2.9002.953
2.9042.967
2.9202.983
2.8882.955
2.8332.908
2.8722.924
2.8482.916
2.8682.941
2.8882.963
2.8642.971
2.9002.967
2.9042.999
2.8682.975
2.8722.979
2.8882.975
2.8882.979
2.8882.987
2.9603.042
2.499
2.8932.830
3.3402.9183.2252.940
000050
99.25998.488
99.25998.496
99.27098.513
99.26098.493
99.26098.489
99.25198.481
99.25598.482
99.26498.494
99.26298.514
99.26498.510
99.27098.513
99.26598.502
99.26098.492
99.25198.489
99.26398.493
99.26198.476
99.27098.491
99.26698.488
99.26498.485
99.26598.487
99.26098.478
99.25598.453
98.757
98.87399.251
96.57297.00296.68296.980
96.93896.881
(Percent)
2.9312.974
2.9312.975
2.8882.941
2.9272.981
2.9272.989
2.9633.005
2.9473.003
2.9122.979
2.8882.939
2.9122.947
2.8882.941
2.9082.963
2.9272.983
2.9312.989
2.9162.981
2.9243.015
2.8882.985
2.9042.991
2.9122.997
2.9082.993
2.9273.011
2.9803.060
2.632
2.9402.869
3.3812.9573.2732.979
3.0203.068
^ Bank discount basis.
^ Except $50,000 at 99.300, and $300,000 at 99.274.
6/ Except $514,000 at 98.533.
2/ Except $1,050,000 at 99.292.
a^ Except $175,000 at 99.288.
2/ Except $300,000 at 98.518.ig/ Except $100,000 at 98.508, and $133,000 at 98.506.
11/ Except $375,000 at 98.490, and $716,000 at 98.488.
12/ Except $125,000 at 98.503, $90,000 at 98.500, and $450,000 at 98.499.
12/ Except $500,000 at 98.498.
14/
Yl/
18/12/
22/p
Except $1,000,000 at 99.274, $800,000 at 99.270, and $300,000 at
99.265.Except $100,000 at 98.962, and $3,000,000 at 98.834.Except $20,000 at 97.000, $100,000 at 96.852, $1,000,000 at 96.654,and $3,000,000 at 96.624.Except $50,000 at 96.852, $200,000 at 96,806, $100,000 at 96.800,
$25,000 at 96.781, $400,000 at 96.756, and $2,000,000 at 96.745.Except $500,000 at 97.029.Except $100,000 at 97.000, and $200,000 at 96.982.
Except $50,000 at 96.%9, $500,000 at 96.945, and $500,000 at 96.909.
Preliminary.

June 196J37
PUBLIC DEBT OPERATIONS
Table 3.- New Money Financing through Regular Weekly Treasury Bills i/
(Dollar amounts in millions)
Description of issue
Issuedate
1957-January 31....
February 7. . .
.
February 14....February 21....February 28....
March 7....March U....
December 19 ...
.
December 26,,,,
1958-January 2,,,,January 9...,January 16,,.,January 23...,
March 13
September 11 ...
.
September 18....September 25....
October 2....October 9....October 16,,,,October 23,,,,October 30...,
November 6....November 13 ...
.
December 11.,,,
December 18, . .
,
December 26.,..
1959-January 2
January 8....
January 15....
March 5,,,.
March 12 2/-
March 19
March 26....
August 13 ...
.
August 20.,.,
August 27, , ,
,
1960.Jtey 19
May 26
June 2,.,.
1961-January 19....
January 26...,
February 2....
March 30..,.
Matxrrlty
date
1957-May
MayMayMayMay
JuneJune
1958-MarchMarch
916
2331
6
13
2027
3
1017
2-i
12
December 11December 18December 26
AprilAprilAprilApril
June
1959-JanuaryJanuaryJanuaryJanuaryJanuary
MarchJune
MarchJiuie
AprilJuly
AugustNovember
SeptemberDecember
AprilJuly
MayAugust
15
2229
February 5
February 13
March 12
June 11
1918
2625
2
2
April 9
July 9
1616
3
AprilJuly
JuneSeptember
June 11September 10
June 18September 17
June 25September 24
1959-November 121960-February 11
1959-November 191960-February 18
1959-November 271960-February 25
1960-August 18November 17
2525
11
1961-April 20July 20
2727
43
June 29September 28
Number of
days tomaturity
91
91919192
9191
9191
91919191
91
919192
9291919191
9192
91182
91182
90181
90181
91182
91182
91182
91182
91182
91182
91182
91182
92182
91182
91183
91182
91182
91182
91182
91182
Amountof bidstendered
$2,624
2,6262,7192,5802,741
2,7692,830
2,3482,416
2,3882,4302,6822,751
2,436
2,5502,6362,576
2,2912,3823,0882,9872,872
2,8142,857
2,4071,073
2,476764
2,394834
2,479755
2,508680
2,178734
2,090724
2,254967
2,019727
2,122671
1,866875
1,853790
1,964693
1,809961
1,834897
1,820996
1,889995
1,9861,082
2,0571,082
1,9241,046
Amountof bidsaccepted
$1,700
1,7001,7001,8001,802
1,8001,802
1,7001,700
1,7001,7001,7011,702
1,700
1,8001,8001,800
1,8011,8001,8031,8001,803
1,8021,801
1,600400
1,600400
1,601400
1,600400
1,599400
1,600401
1,500400
1,301400
1,301400
1,300400
1,200400
1,200400
1,200400
1,200500
1,200500
1,101500
1,101400
1,100500
1,101500
1,100500
Average rateon bidsaccepted 2/
(Percent
)
3,283
3,1333.0573.1823.288
3.2463.239
3.1403.173
2.7532.8582.5912.587
1.532
2.3592.6042.511
2.9202.6682.9272.8042.647
2.6492.774
2.8053.081
2.9043.095
2,7393.017
2.6902.920
2.6782.959
2.8083.034
2.8163.111
3.0623.375
2,7633.058
2.7663.093
3.1503.690
3.4173,782
3.8244.152
3.7934.000
3.4973.867
3.1843.495
.358
.530
2.2302.422
2.2992.497
2,3922,576
New moneyincrease, ordecrease (-)
$99
9999200202
200202
10098
101100100100
-100
100
9999
10110010499102
102101
200
200
201
199
199
197
101
101
100
100
199
199
204
97
96
100
99
200
201
99
Footnotes at end of table. (Continued on following page)

38

June 196J

40 Treasury Bulletin
PUBLIC DEBT OPERATIONS
Table 3.- New Money Financing through Regular Weekly Treasury BlllsJ/- (Continued)
(Dollar amounts In millions)
Description of issue

lune 196J 41
PUBLIC DEBT OPERATIONS
Table 4.- Offerings of Public Marketable Securities Other ThanRegular Weekly Treasury Bills
Date subscrip-tion booksopened or billtenders received

42 Treasury Bulletin
PUBLIC DEBT OPERATIONS
Table 4.- Offerings of Public Marketable Securities Other ThanRegular Weekly Treasury Bills - (Continued)
Date subscrip-

June i96J A3
PUBLIC DEBT OPERATIONS.
Table 4.- Offerings of Public Marketable Securities Other ThanRegular Weekly Treasury Bills - (Continued)
Date subscrip-tion booksopened or billtenders received
Dateof
issueDescription of security 1/
Period to finalmaturity(years, months,days) 2/
Amount of sub-
scriptions tendered
Cash 2/ Exchange
Amount Issued
Forcash 2/
In exchange
Allot-mentratio
9/20/61
8/
10/2/61
10/10/61
11/6/61
11/9/61
11/20/61
1/9/62
1/15/62
2/5/62
2/19/62
3/20/62
8/
V9/62
4/10/62
A/30/b2
7/10/62
7/30/62
9/10/62
9/26/62
8/
10/9/62
10/29/62
11/7/62
11/19/62
1/8/63
1/9/63
1/30/63
2/4/63
2/25/63
3/14/63
9/27/61
10/1/61
5/15/61
10/16/61
' 11/15/6111/15/60
^ 12/2/57
11/15/61
6/23/60
1/15/62
10/1/57
f 2/15/62
t2/15/62
r 3/1/62I 1/23/59
2/14/58
L 10/3/60
3/23/62
4/1/62
4/18/62
4/15/62
5/15/625/15/625/15/62
7/15/62
8/15/628/15/628/15/62
9/15/629/15/62
10/3/62
10/1/62
10/15/62
11/15/6211/15/6211/15/62
11/15/62
5/15/621/23/59
1/17/63
1/15/63
2/6/63
2/15/634/18/62
3/15/635/15/6212/2/571/23/59
2/6/63
2.705^ Bill
1-1/2^ Note
3-1/4^ Note
2.975!C Bill
3-1/4? Note
3-3/4^ Bond
3-7/8? Bbnd
2.277? Bills
3-7/8? Bond
3.366? Bill
4? Bond
3-1/2? Certificate
4? Note
4? Bond
4? Bond
3-1/2? Bond
3-1/2? Bond
2.896? Bill
1-1/2? Note
3-3/4? Bond
2.943? Bill
3-1/4? Certificate3-5/8? Note
3-7/8? Bond
3.257? Bill
3-1/2? Certificate
4? Bond
4-1/4? Bond
3-3/4? Note
4? Bond
2.616? Bill
1-1/2? Note
2.969? Bill
3-1/8? Certificate3-1/2? Note
4? Bond
2.866? Bill
3-7/8? Bond
4? Bond
4? Bond
3.015? Bill
2.929? Bill
3-1/4? Certificate
3-3/4? Bond
3-5/8? Note3-7/8? Bond
3-7/8? Bond
4? Bond
2.855? Bill
6/22/62 - Tax ant. ^(At auction)
10/1/66-EO
5/15/63-D - ReopeningIssued at
99.875
10/15/62 - At auction
2/15/63-E5/15/66 -
11/15/74 -
fl2/7/61-"l
1.1/25/62 J
5/15/68
ReopeningIssued at 99.75ReopeningIssued at 99.00
"Strip" of 8
series 50/(At auction)
ReopeningIssued at 99.50
1/15/63 - At auction
10/1/69 - ReopeningIssued at 99.75
2/15/63-A8/15/66-A
8/15/712/15/8O - Reopening2/15/90 - Reopening11/15/98 - Reopening
9/21/62 - Tax ant. 1/(At auction)
4/1/67-EA
8/15/68
4/15/63 - At auction
5/15/63-B2/15/66-B - Issued at 99.8011/15/71 - Issued at 99.50
7/15/63 - At auction
8/15/63-C2/15/69
8/15/87-92 - Issued at 101
8/15/67-A8/15/72
3/22/63
lO/l/67-EO
10/15/63
11/15/63-Dll/15/65-B
2/15/72
ri/l7/63-"l "Strip" of 10
\3/2l/63 J series 6^(At auction)
ll/l5/7l\ Reopenings2/15/80J Issued at
99.50
At auction 67/
At auction
Tax ant. ^(At auction)
At auction
2/15/88-93
1/15/64
6/24/63
2/15/64-A
Tax ant. V(At auction)
8/15/68 - Reopening
2/15/67-B11/15/71 - Reopening11/15/74 - Reopening2/I5/8O - Reopening
6/24/63 - Tax ant. V(Reopening
)
ly
ly
4y
268d
5y
7m
ly
3m6m
13y
46. 5d
(Average)
6y
Ty
iy
9y17y27y36y
6y
3y9y
6y
iy9y
9y
5m
ly
84m
ly6m
5imllimlllm8|m
182d
5y
4m
ly
ly9m6m
ly
ly6m
30y
11m11m
170d
5y
ly
ly
3y3m
94. 5d
(Average)
8y17y
30y
5y
3y8ylly16y
2m
Im
ly
138d
ly6m
11m8m8m11m
94d
(In millions of dollars)
5,131 - 2,511
5,687
3,756
1,519
3,650
1,619
3,593
6,827
3,454
3,719
20,155"
6,743315J
5,942
4,535
2,410
250
5,244
2,062
18/
2,442
357
3,6422,384
517
320 ^
6,8624,454
2,806563900
933
270
6,6863,1U1,204
5,2822,579
457
4,8563,2862,344
34pJ—
^
6,741p2,490p
4,287pl,515pl,074pl,131p
2,295
2,003 28/
800
357
3,6422,384
517
-

4/ Treasury Bulletin
PUBLIC DEBT OPERATIONS
Table 4.- Offerings of Public Marketable Securities Other ThanRegular Weekly Treasury Bills - (Continued)
Date subscrip-tion booksopened or billtenders received

Jane 196J 45
PUBLIC DEBT OPERATIONS
Footnotes to Table 4 - (Continued)
23/ Subscriptions from savings-type Investors totaled $720 million andwere allotted 70 percent. Subscriptions from commercial banks fortheir own account totaled #470 million and were allotted 35 percent.Subscriptions from all other investors totaled $610 million and wereallotted 15 percent. Subscriptions for #25,000 or less were allottedin full when accompanied by 100 percent payment at the time of enter-ing the subscriptions. All other subscriptions for #5,000 wereallotted in full. Subscriptions for more than #5,000 were allottednot less than #5,000. In addition, #50 million of the bonds wasallotted to Government investment accounts. Savings-type investorswere given the privilege of paying for the bonds allotted to them ininstallments up to April 23, 1959 (not less than 25 percent byJanuary 23, 1959, the issue date; 50 percent by February 24, 1959;75 percent by March 23, 1959; and full payment by April 23, 1959).
2V Subscriptions for #100,000 or less were allotted in full. Subscrip-tions for more than #100,000 were allotted 50 percent but in no caseless than #100,000. In addition, #100 million of the notes wasallotted to Government investment accounts,
25/ Subscriptions from savings-type investors totaled #240 million andwere allotted 65 percent. Subscriptions from commercial banks fortheir own account totaled #941 million and were allotted 35 percent.Subscriptions from all other investors totaled #322 million and wereallotted 20 percent. Subscriptions for #25,000 or less from savings-type investors and commercial banks, and for #10,000 or less fromall others, were allotted in fxill. Subscriptions for more thanthese minimums were allotted not less than the minimums. In addi-tion, #50 million of the bonds was allotted to Government invest-ment accounts.
26/ Full-paid subscriptions of #25,000 or less, totaling #941 million,were allotted in full. Subscriptions from savings-type investors
totaled $1,361 million and were allotted 45 percent. Subscriptionsfrom commercial banks for their own account totaled #6,390 millionand were allotted 8 percent, but not less than #1,000 on any one
subscription. Subscriptions from all other investors totaled
#2,433 million and were allotted 5 percent, but not less than #1,000on any one subscription. In addition, #100 million of the noteswas allotted to Government investment accounts,
27/ Holders of approximately #1,600 million of Series F and G savings
bonds issued in 1948, which mature in 1960, were offered in exchange
the 4-3/4/8 notes, with certain adjustments as of December 15, 1959,at a price of 99-3/4)f, Smaller denominations of savings bonds could
be exchanged for the next higher multiple of #1,000 of the notes upon
payment of any cash difference. Cash payments amounted to #3 million.
28/ Issued as a rollover of maturing one-year bills.
29/ Savings-type Investors were given the privilege of paying for the
bonds in installments up to June 15, 1960 (not less than 40 percent
by April L4, the delivery date; 70 percent by May 15; and full
payment by June 15). In addition to the amounts allotted to the
public, #100 million of the bonds was allotted to Government in-
vestment accounts,
30/ Subscriptions for #100,000 or less were allotted in full. Subscrip-
tions for more than #100,000 were allotted 30 percent but in no case
less than #100,000. In addition, $27.4 million of the notes was
allotted to Government investment accounts.
31/ Subscriptions for #25,000 or less were allotted in full. Subscrip-
tions for more than #25,000 were allotted 85 percent but in no case
less than #25,000. In addition, #71 million of the notes was
allotted to Government investment accounts.
32/ Subscriptions were permitted to be made with payment in cash or in
4-3/4)8 Treasury notes maturing August 15, 1960 (see Table 6, foot-
note 22), In addition, in order that holders of 3-5/8;f Federal
National Mortgage Association notes maturing August 23, 1960, might
have an opportunity to reinvest the proceeds, the Secretary of the
Treasury, in behalf of the Association, offered to purchase such
notes on August 15, 1960, at par and accrued interest to the extent
that such subscriptions were allotted and the proceeds from the par
amount of the notes were applied to payment, in whole or in part,
for the new securities,
33/ Combined total includes #80 million allotted on subscriptions from
holders of the Federal National Mortgage Association notes maturing
August 23, 1960 (see footnote 32),
34/ Consists of allotments on subscriptions f'-om holders of Treasury
notes maturing August 15, 1960,
35/ Subscriptions from States, political subdivisions, or instrumentalities
thereof, public pension and retirement and other public funds, inter-
national organizations in which the United States holds membership,
foreign central banks and foreign States, Government investment
accounts, and the Federal Reserve Banks as provided in the offering
circular, totaled #6,285 million and were allotted in full. Sub-
scriptions subject to allotment totaled #11,104 million and were
allotted in full up to and including #25,000; all others were allotted
13 percent but in no case less than #25,000.
J6/ Subscriptions totaled #1,181 million from savings-type investors and
#100 million from Government investment accounts; both were allotted
-25 percent. Subscriptions from commercial banks for their own accounts
totaled #2,708 million and were allotted 20 percent. Subscriptions
from all others totaled #1,190 million and were allotted 15 percent.
Subscriptions for #5,000 or less were allotted in full; subscriptions
for more than #5,000 were allotted not less than #5;000.
37/ In addition to the amounts allotted to the public, there wasallotted to Government investment accounts #131.3 million of the3-l/2!6 bonds of 1980, #215,9 million of the 3-1/2J6 bonds of 1990,and #236,5 million of the 3-1/2* bonds of 1998.
38/ Holders of approximately #750 million of Series F and G savings bondsissued in 1949, which mature in 1960, were offered in exchange the
A% bonds, with certain adjustments as of December 15, 1960, at a priceof IOO2, Smaller denominations of savings bonds could be exchangedfor the next higher multiple of #500 of the bonds upon payment of anycash difference. Cash payments amoimted to #365,375,
39/ Subscriptions were permitted to be made with payment in cash or in
4-7/8)6 Treasury certificates maturing February 15, 1961 (see Table 6,
footnote 17).40/ Consists of allotments on subscriptions from holders of certificates
of Indebtedness maturing February 15, 1961.
41/ Subscriptions from States, political subdivisions or instrumentalities
thereof, public pension and retirement and other public funds, inter-
national organizations in which the United States holds membership,
foreign central banks and foreign States, Government investmentaccounts and the Federal Reserve Banks, as provided in the offeringcircular, totaled $4,364 million and were allotted in full. Sub-
scriptions subject to allotment totaled $14,619 million: those
up to and including $10,000 were allotted in full; all others were
allotted 20 percent but in no case less than $10,000.42/ In addition to the amounts allotted to the public, there was allotted
to the Federal Reserve Banks and Government investment accounts
#39 million of the 3-3/8)8 bonds of 1966, and #540 million of the
3-5/8)8 bonds of 1967.43/ Subscriptions were permitted to be made with payment in cash or in
the 4-3/4)6 Treasury certificates or 3-5/8)8 Treasury notes, bothmaturing May 15, 1961 (see Table 6, footnote 20).
44/ Consists of allotments on subscriptions from holders of certificates
of indebtedness and Treasury notes maturing May 15, 1961.
45/ There were allotted in full all subscriptions totaling about #2,379million for the certificates and #1,258 million for the notes, from
States, political subdivisions or instrumentalities thereof, public
pension and retirement and other public funds, international organiza-
tions in which the United States holds membership, foreign central
banks and foreign States, Government investment accounts, and the
Federal Reserve Banks, as provided in the offering circulars. Sub-
scriptions from all other investors were subject to allotment and
totaled $11,445 million for the certificates which were allotted
27 percent, and $11,631 million for the notes which were allotted
12 percent; subscriptions for $25,000 or less were allotted in full,
and subscriptions for more than $25,000 were allotted not less than
#25,000.46/ Sale of a "strip" of Treasury bills, consisting of an additional
$100 million for cash of eighteen series of weekly Treasury bills
maturing from August 3, 1961, to November 30, 1961.
47/ In addition to the amounts allotted to the public, there was allotted
to the Federal Reserve Banks and Government investment accounts.
$480.4 million of the 3-1/2)6 bonds of 1980, #160.6 million of the
3-1/2)8 bonds of 1990, and #289.5 million of the 3-1/2)6 bonds of 1998.
48/ Subscriptions for #100,000 or less were allotted in full. Subscrip-
tions for more than $100,000 were allotted 37 percent but in no case
less than $100,000, In addition, #100 million of the notes was
allotted to Government investment accounts,
49/ Includes #2 million allotted to Government Investment accounts of the
3-1/4^ notes, #4 million of the 3-3/4S8 bonds of 1966, and #136 million
of the 3-3/458 bonds of 1974,
50/ Sale of a "strip" of Treasury bills, consisting of an additional #100
million for cash of eight series of weekly Treasury bills maturing
from December 7, 1961, to January 25, 1962.
51/ Holders of approximately $970 million of Series F and G savings bonds
issued in 1950, which mature in 1962, were offered in exchange the
3-7/8)6 bonds with certain adjustments as of December 15, 1961, at a
price of 99,50, Smaller denominations of savings bonds could be ex-
changed for the next higher multiple of $500 of the bonds upon pay-
ment of any cash difference. Cash payments amounted to $309,000.
52/ Subscriptions for #50,000 or less were allotted in full. Subscrip-
tions for more than #50,000 were allotted 60 percent but in no case
less than #50,000, In addition, #100 million of the bonds was
allotted to Government investment accounts,
53/ Includes #3,411 million allotted to Federal Reserve Banks and Govern-
ment investment accounts of the 3-1/2)6 certificates and #1,518
million of the 4)6 notes.
54/ In addition to the amounts allotted to the public, there was allotted
to Government investment accounts #385 million of the 4)6 bonds of
1971, $177 million of the 4)8 bonds of 1980, $218 million of the 3-1/2?
bonds of 1990, and $221 million of the 3-l/2!8 bonds of 1998.
55/ Issued for cash and in exchange for tax anticipation bills maturing
March 23, 1962 (see Table 6, footnote 22).^ Subscriptions for $50,000 or less were allotted in full. Subscrip-
tions for more than $50,000 were allotted 15 percent but In no case
less than $50,000. In addition, $100 million of the bonds was
allotted to Government Investment accounts.
57/ Includes $2,166 million allotted to Federal Reserve Banks and Govern-
ment investment accounts of the 3-1/4)6 certificates, $14 million of
the 3-5/8)6 notes, and $64 million of the 3-7/8)6 bonds.
Footnotes continued on following page.

46 Trreasury Bulletin'
PUBLIC DEBT OPERATIONS
Footnotes to Table 4 - (Continued)
^6/ Subscriptions were permitted to be made with payment In cash or in 65/the A% notes or }-l/A% notes, both maturing August 15, 1962 (see
Table 6, footnote 23).
59/ Consists of allotments on subscriptions from holders of Treasury 66/notes maturing August 15, 1962.
60/ Subscriptions from States, political subdivisions or instrumentalities
thereof, public pension and retirement and other public funds, inter-
national organizations in which the United States holds membership,
foreign central banks and foreign States, Government investment
accounts, and the Federal Reserve Banis totaled $4,760 million for
the certificates and were allotted in full, in accordance with the
offering circular. Subscriptions from all others totaled $15,395 67/million and were allotted 12-1/2 percent with subscriptions for
$50,000 or less allotted In full and those for more than $50,000allotted not less than $50,000.
61/ Subscriptions for the A% bonds totaled $6,743 million and were 68/allotted 22 percent with subscriptions for $100,000 or less allotted
in full and those for more than $100,000 allotted not less than$100,000. In addition, $100 million of the bonds was allotted to 69/Government investment accounts,
62/ All subscriptions for the A-l/i% bonds were allotted in full. In
addition, $50 million of the bonds was allotted to Governmentinvestment accounts. Savings-type investors were given the privilegeof paying for the bonds allotted to them in Installments up to 70/October 15, 1962 (not less than 30 percent by August 15, 1962, theissue date; 60 percent by September 15, 1%2; and full payment byOctober 15, 1962).
63/ In addition to the amounts allotted to the public, there were allotted 71/
to Government investment accounts $21 million of the 3-3/A% notesand $320 million of the A% bonds.
bi/ Includes $3,796 million allotted to Federal Reserve Banks and Govern- jg/ment investment accounts of the J-l/8% certificates, $1 million of
the 3-l/2){ notes, and $6 million of the 4/f bonds.
Sale of a "strip" of Treasury bills, consisting of an additional$100 million for cash of ten series of weekly Treasury bills maturingfrom January 17, 1963, to March 21, 1%3.Holders of approximately $458 million of Series F and G savingsbonds which mature in 1963 and 1964 were offered in exchange eitherthe 3-7/8^ bonds or the 45^ bonds with certain adjustments as of
December 15, 1962, at a price of 99.50. Smaller denominations of
savings bonds could be exchanged for the next higher multiple of
$500 of the bonds upon payment of any cash difference. Cash payments
amounted to about $93,000 for the 3-7/8;f bonds and about $101,000for the 4if bonds.The bonds were sold to a syndicate on the basis of competitive biddingfor reoffering to the public. The winning bid was $99.85111 per$100 of face amount for a A% coupon, resulting in a net basis cost
to the Treasury of 4.008210i8, calculated to maturity.Includes $3,921 million allotted to Federal Reserve Banks and Govern-
ment Investment accounts of the J-l/^% certificates and $15 millionof the 3-3/4St bonds.
In addition to the amoxints allotted to the public, there wereallotted to Government Investment accounts $19.8 million of the
3-5/8!e notes, $29.6 million of the 3-7/8$ bonds of 1971, $151.9million of the 3-7/8$ bonds of 1974, and $123.9 million of the
A% bonds of 1980.The bonds were sold to a syndicate on the basis of competitive biddingfor reoffering to the public. The winning bid was $100.55119 per $100of face amount for a 4-l/8$ coupon, resulting in a net basis cost to
the Treasury of 4.093145$, calculated to maturity.Includes $3,327 million allotted to Federal Reserve Banks and Govern-ment investment accounts of the 3-l/4$ certificates, and $85 millionof the 3-5/8$ notes.Subscriptions for $100,000 or less were allotted in full. Subscrip-
tions for more than $100,000 were allotted 5 percent but in no case
less than $100,000. p Preliminary.
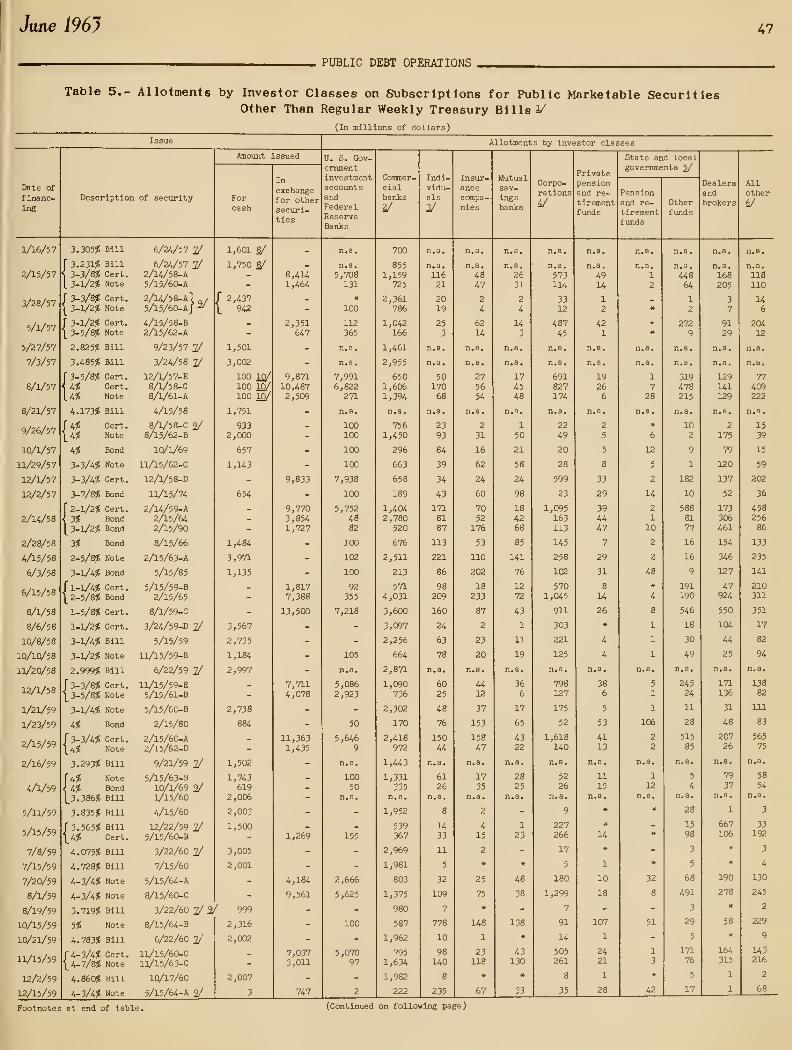
June 196J 47
PUBLIC DEBT OPERATIONS
Table 5.- Allotments by Investor Classes on Subscriptions for Public Marketable SecuritiesOther Than Regular Weekly Treasury Bills i/
(In millions of dollars)
Issue

Treasuru Bulletin
PUBLIC DEBT OPERATIONS
Table 5.- Allotments by Investor Classes on Subscriptions for Public Marketable SecuritiesOther Than Regular Weekly Treasury Bl lis i^- (Continued)
(In millions of dollars)
Issue

June 196J 49
PUBLIC DEBT OPERATIONS
Table 5.- Allotments by Investor Classes on Subscriptions for Public Marketable SecuritiesOther Than Regular Weekly Treasury BlllsV- (Continued)
(In millions of dollars)
Issue

Treasury Bulletin
PUBLIC DEBT OPERATIONS
Table 6.- Disposition of Matured Public Marketable SecuritiesOther Than Regular Weekly Treasury Bills

June 196J 51
PUBLIC DEBT OPERATIONS
Table 6.- Dlpposltlon of Matured Public Marketable SecuritiesOther Than Regular Weekly Tren^ ry Bills - (Continued)

52 Treasury Bulletin I
PUBLIC DEBT OPERATIONS
Table 6.- Disposition of Matured Public Marketable SecurltOther Than Regular Weekly Treasury Bills - (Continued)
les

June 196J 53
PUBLIC DEBT OPERATIONS
Table 6.- Disposition of Matured Public Marketable SecuritiesOther Than Regular Weekly Tre"' ny Bills - (Continued)

54 Treasury Bulletin
PUBLIC DEBT OPERATIONS.
Table 6.- DlppopltlOther Than Regul
on of Matured Public Marketable Securlar Weekly Treasury Bllle - (Continued)
ties

June 196J 55
PUBLIC DEBT OPERATIONS
Footnotes to Table 6
Source: Bureau of the Public Debt. Preliminary figures are from sub-scription and allotment reports ; final figures are on "clearancebasis" in daily Treasury statement.
1/ Original call and maturity dates are used.
2/ All by investors other than Federal Reserve Banks
.
2/ Two issues of bills, maturing January 16, 1957, and February 15, 1957respectively, were rolled over into two issues of tax anticipationbills, both maturing June 24, 1957.
^/ Tax anticipation issue; for detail of offerings beginning 1957, seeTable 4; for amounts redeemed for taxes and for cash see "Note" below.
5/ During June and July 1958, $491 million of the 2-i/8% Treasury bondsof 1965 was purchased by the Treasury for retirement under section19 of the Second Liberty Bond Act, as amended (31 U.S.C. 754a).
V Called on May 14, 1958, for redemption on September 15, 1958.7/ Represents amount which owners exercised the option to redeem on
August 1, 1959 (see Table 4, footnote 9).8/ Holders of the 4^ notes, who had the option to redeem at par on
February 15, 1960, by giving notice not later than November 16, 1959,were permitted to exchange their holdings on November 15, 1959, forthe 4-7/8^ notes.
2/ Rolled over into a one-year bill (see Table 4)
.
10/ Amount which owners exercised the option to redeem on February 15,1960 (see Table 4, footnote ll).
11/ Advance refunding offering. Pursuant to the provisions of section1037 (a) of the Internal Revenue Code of 1954 as added by Public Law86-346, approved September 22, 1959, the Secretary of the Treasuryhas declared that no gain or loss shall be recognized for Federalincome tax purposes upon the exchange of the eligible outstandingsecurities solely for the new securities. For tax purposes, there-fore, the investor will carry the new securities on his books at the
same amount as he had been carrying the eligible securities exchanged.
Gain or loss, if any, upon the obligations surrendered in exchange
will be taken into account upon the disposition or redemption of the
new obligations
.
Holders of 2-1/2^ Treasury bonds maturing November 15, 1961, wereoffered the option to exchange the bonds during the period from
June 8, 1960, to June 13, 1960, inclusive, subject to allotment if
subscriptions exceeded by 10 percent the offering limits of $3.5billion for the notes and $1.5 billion for the bonds.
Holders of the maturing notes were not offered preemptive rights to
exchange their holdings, but were permitted to present them in pay-
ment or exchange, in whole or in part, for the 3-1/8$ certificates or
the 3-7/8if bonds, which were offered in an aggregate of around
$8-3/4 billion. For detail of offering, see Table 4.
Excess of maturing 4-3/4? Treasury notes over allotments of new
securities on subscriptions from holders of those notes (see Table 4,
footnotes 32 and 34).Reopening of an earlier issue
.
Holders of 2-1/2S6 Treasury bonds maturing June 15, 1967, December 15,
1968, June 15, 1969, and December 15, 1969, were offered the option
to exchange the bonds during the period from September 12. 1960, to
September 20, 1960, inclusive, the first for 3-1/2* bonds' of 1980,
the second for 3-l/2if bonds of 1990, and the other two for 3-1/2*
bonds of 1998, subject to allotment if the combined total of sub-
scriptions for the bonds of 1990 and 1998 exceeded an outside limit
of $4.5 billion.17/ Holders of the maturing certificates were not offered preemptive
rights to exchange their holdings, but were permitted to present
them in payment or exchange, in whole or in part, for the 3-1/4*
notes offered in the amount of around $6.9 billion. For detail of
offering, see Table 4.
18/ Excess of maturing 4-7/8* certificates over allotments of new
securities on subscriptions from holders of those certificates
(see Table 4, footnotes 39 and 4O)
.
12/
12/
li/
16/
19/ From March 20 through March 22, 1961, owners of 2-1/4* bonds of June15, 1959-62, 2-1/4* bonds of December 15, 1959-62, 2-5/8* notesmaturing February 15, 1963, and 2-1/2* bonds maturing August 15, 1963,were granted the option of exchanging their holdings. The firstthree were exchangeable for a new 3-5/8* bond due November 15, 1967,and the last for a new 3-3/8* bond due November 15, 1966. Exchangeswere subject to allotment if subscriptions exceeded $5 billion forthe bonds of 1967 or $3 billion for the bonds of 1966.
20/ Holders of the maturing certificates and notes were not offeredpreemptive rights to exchange their holdings, but were permitted topresent them in payment or exchange, in whole or in part, for the$5,250 million offering of 3* certificates or the $2,500 millionoffering of 3-1/4* notes. For detail of offering, see Table 4.
21/ Excess of maturing 4-3/8* certificates and 3-5/8* notes overallotments of new securities on subscriptions from holders of thosecertificates and notes (see Table 4, footnotes 43 and 44).
22/ $1,569 million were redeemed for cash and $168 million were ex-changed for the tax anticipation bills dated March 23, 1962 (seeTable 4).
23/ Holders of the maturing notes were not offered preemptive rightsto exchange their holdings, but were permitted to present themin payment or exchange, in whole or in part, for the $6,500million offering of 3-1/2* certificates, the $1,500 millionoffering of 4* bonds, or the $750 million offering of 4-1/4*bonds. For detail of offering, see Table 4.
24/ Excess of maturing 4* notes and 3-1/4* notes over allotmentsof new securities on subscriptions from holders of those notes(see Table 4, footnotes 58 and 59).
25/ From September 10 through September 12, 1962, owners of securitiesmaturing February 15, 1963 (3-1/2* certificates, 2-5/8* notes,3-1/4* notes), and May 15, 1963 (3-1/4* certificates, 3-1/4* notes,
4* notes) were granted the option of exchanging their holdings,subject to allotment if subscriptions exceeded the offering limitsof $6 billion for the notes and $3 billion for the bonds.
26/ Called on August I4, 1962, for redemption on December 15, 1962.
p Preliminary.
Note: Information on retirementin footnote 4, in millions
of tax anticipation issues referred to
of dollars
:
Date ofretirement

56 Treasury Bulletin
PUBLIC DEBT OPERATIONS
Table 7.- Foreign Series Securities (Nonmarke table)Issued to Foreign Monetary Authorities

June 196J 57
PUBLIC DEBT OPERATIONS
Table 7.- Foreign Series Securities (Nonmarketable)Issued to Foreign Monetary Authorities - (Continued)
(Payable In U. S. Dollars)
Month of
activitySecurity Issue
dateMaturitydate
Interestrate
Amount
Issued Retired Outstanding
May, Certificates of indebtedness
5/6/635/20/635/20/635/2^635/29/635/31/63
8/6/638/20/638/20/638/26/638/29/637/16/63
(Percent)
2.902.952.952.953.002.00
(In millions of dollars)
25
2510
2515
25
';83
508518
543558583
Source: Daily Treasury statement.

58

June 196J

60 Ireasury Bulletin
.UNITED STAIES SAVIHGrS BONDS.
Table 3.- Sales and Redemptions by Periods, Series E through K
(In millions of dollars)
Sales 1/Accrueddiscount
Sales plusaccrueddiscount
Redemptions 1/
Total Salesprice j/
Accrueddiscount 2/
Amount outstanding
Interest-bearingdebt
Series E and H combined
Fiscal years:
19^1-195-4 V- •
1955 V195619571958 ,
195919601961 ,
1962
Calendar years:
1941-19541955 ,
1956 ,
1957 ,
1958 ,
1959 ,
19601961 ,
1962 ,
Months:
1962-July ,
August , , ,
,
September,
October. ,,
November.December.
,
1963-January. .
.
February.
.
March
AprilMay ,
73,9795,2255,2604,6134,6704,5064,3074,4644,421
76,3525,3685,0434,5074,6894,3204,3504,5394,278
358360301
360327295
525
425
397
4U410
8,0611,123
1,1U1,1331,1611,1741,1941,2541,331
8,6261,1131,1241,1431,1781,1691,2241,2931,372
134106113
107107129
136
108
110
106106
82,0406,3486,3745,7465,8315,6805,5015,7175,753
84,9776,4816,1675,6495,8675,4895,5745,8325,650
4924664U466434424
661533
507
519516
4^,5584,5444,7305,1765,1875,1075,5024,6274,603
46,7444,6524,8325,4694,8565,5194,9964,4844,636
398386360
366335308
481353
364
409375
42,0583,9114,0694,4444,4324,3104,6163,9063,873
43,9463,9984,1624,6864,1294,6364,2023,7813,882
330323302
306282259
391293
307
344315
2,500633661732755797886721731
2,798654670783727883794703754
676358
61
5448
906057
6560
37,48239,28540,92941,49842,U242,71642,71543,80644,955
38,23340,06341,39841,57842,58942,55943,13744,48545,499
45,04945,13045,184
45,28445,38345,499
45,67945,85946,002
46,11246,253
Series F, G, J, and K combined ^Fiscal years:
1941-1954 y..1955 V1956195719581959196019611962
Calendar years:
1941-195419551956195719581959196019611962
Months:
1962-JulyAugust . .
.
September
October.
.
November.December.
1963-January, .
.
February.
,
March. . . .
,
April
May
29,8481,249
586268
30,47290747598
729108100
8365
544632
27
784
10392
7458
52
382925
30,577

Jane 1961
Table 3.- Sales

62 Treasury Bulletin
.UNITED STATES SAVINGS BONDS.
Table 4.- Redemptions of Matured and Unmatured Savlngp Bonds
(In millions of dollars) —i
Total V
Matured
TotalSeries E
and HOther
Unmatured
Total Series E and H OtherUnclassified11/
Fiscal years:
19511952
1953195419551956195719581959196019611962
Calendar years:
1951
19521953195-i
19551956195719581959196019611962
Months:
1962-JulyAugust . .
.
September
October,
.
November.December.
1963-January.
,
February.
.
March
AprilMay
6,1375,1095,6216,5157,2517,8468,9588,5447,2498,5575,8195,716
5,6515,0746,U96,9857,3018,2649,6307,2558,7726,7325,5955,602
453429402
514402460
558398
405
446408
817792
1,7612,7473,9414,2634,1153,7303,6214,1262,6732,593
772
1,0152,3183,1714,2304,2464,1563,3934,7013,0332,5552,387
138106186
179176
333
241179
206
173182
38702
1,1281,4871,8261,9171,9711,9061,9962,3041,7331,668
254968
1,3281,5002,0471,8912,0841,6912,4331,9441,6331,656
10886
153
148145110
138155
U8118155
77990
633 6/1,260 6/2,1152,3452,1441,8241,6251,822 2/940 S/925 2/
51847990 6/
1,6722,1832,3552,0721,7022,268 7/1,089 2/922 8/730 2/
8/
10/
302033
31
31
223 10/
102 10/24 10/58 10/
55 10/27
5,3004,3163,8593,5893,3943,4674,6574,7393,7784,6413,3583,070
4,9144,0253,7993,0573,6663,8995,2073,8414,5203,9383,1003,002
237210215
243286252
266234
233
232293
4,2583,3042,9552,7152,7752,7853,1323,1953,2353,2853,0752,875
3,8173,0962,8822,4642,9762,9203,3223,0913,4453,1U2,8992,827
222195214
230274232
253224
224
221283
1,0421,012904874619682
1,5261,544
5431,356283196
1,097929917593689979
1,886750
1,075825201175
15
15
2
1312
20
12
10
9
11
11
191
179-84116185
75
-150-210-212
53
-35
3431
757-59512026622
-449-239-60213
77113
1
92-60-125
52
-15
-34
41-67
Source: Daily Treasury statement; Office of Debt Analysis in the Officeof the Secretary.
Note: In these tables sales of Series A-F and J bonds are included at issue ^price, and redemptions and amounts outstanding at current redemptionvalue. Series G, H, and K are included at face value throughout.Matured bonds which have been redeemed are included in redemptions.Matured F and G bonds outstanding are included in the interest-bearingdebt \intil all bonds of the annual series have matured, and are thentransferred to matured debt upon which interest has ceased. ^
1/ Sales and redemption figures include exchanges of minor amounts of (1)matured Series E bonds for Series G and K bonds from May 1951 throxighApril 1957 and (2) Series F and J bonds for Series H bonds beginning 6/January 1960; however, they exclude exchanges of Series E bonds forSeries H bonds, which are reported in Table 3. 2/
2/ Details by series on a cumulative basis and by periods for Series Ar-D
combined will be found in the February 1952 and previous issues of the 8/Treasury Bulletin.
j/ Because there is a normal lag in classifying redemptions the distribu- 2/tion of redemptions between sales price and accrued discount has beenestimated. Beginning with the Treasury Bulletin of March 1961 the 10/method of distributing redemptions between sales price and accrueddiscount has been changed to reflect the distribution shown in final 11/
reports of classified redemptions. All periods shown have beenrevised on this basis.Reductions were made in issues and redemptions of Series E, H, F, G,J, and K bonds in July 1954 to compensate for the erroneous inclusionof reissue transactions in June 1954 as reported in the daily Treasurystatement. The amounts involved were as follows: $18 million forissues of Series E and H, $17 million for issues of Series F, G, J,
and K, and $35 million for unclassified retirements.Series F and G sales were discontinued April 30, 1952, and Series J
and K sales were discontinued April 30, 1957. Sales figures afterApril 30, 1957, represent adjustments.Includes exchanges of Series 1941 F and G savings bonds for 3-1/4/6
marketable bonds of 1978-83.Includes exchanges of Series 1948 F and G bonds for 4-3/4!f marketablenotes of 1964.Includes exchanges of Series 1949 F and G bonds for 4/f marketablebonds of 1%9.Includes exchanges of Series 1950 F and G bonds for 3-7/85t marketablebonds of 1968.
Includes exchanges of Series 1951 and 1952 F and G bonds for3-7/858 marketable bonds of 1971 and 4!f marketable bonds of 1980.Represents changes in the amounts of redemptions not yet classifiedbetween matured and unmatxared issues. * Less than $500,000.

Jane 196J 63
OWhfERSHIP OF FEDERAL SECURITIES.
Table 1.- Dlstrlbutlon of Federal Securities by Classes of Investors and Types of Issues(In millions of dollars)

64 Treasury Bulletin
.OWNERSHIP OF TEDERAL SECURITIES.
Table 3.- Estimated Ownership of Federal Securities(Par values l/ in billions of dollars)
End of
month
TotalFederalsecuritiesoutstand-ing 2/
Held by banks
Commer-cialbanks
2/
FederalReserveBanks
U. S,
GovernmentInvestmentaccounts
Held by private nonbank investors
Total
Individuals ^
Total
Savings bonds
SeriesE and H
Otherseries ^
Othersecu-rities
Insurancecompanies
Mutualsav-
ingsbanks
Corpora-tions ^
Stateandlocalgovern-ments
Foreignand inter-national
2/
1939-Dec .
.
19^0-June.Dec.
1941-June.Dec.
1942-June.Dec.
1943-June.Dec.
1944-June.Dec.
1945-June.Dec.
1946-Feb.June.
Dec.
2/
1947-June.Dec.
1948-June.Dec.
1949-June.Dec.
1950-June.Dec.
1951-June.Dec.
1952-June.Dec.
195 3-June.Dec.
1954-June.Dec.
195 5-June.Dec.
1956-June.Dec.
1957-June.Dec.
1958-June.Dec.
1959-June.Dec.
1960-June.Dec.
1961-June.Dec.
1962-Jan..Feb..Mar..Apr..May..June.July.Aug..Sept.Oct..Nov.,
Dec..
1963-Jan..Feb..Mar..Apr p
47.6
48.550.9
55.364.3
77.0112.5
140.8170.1
202.6232.1
259.1278.7
279.8269.9259.5
258.4257.0
252.4252.9
252.8257.2
257.4256.7
255.3259.5
259.2267.4
266.1275.2
271.3278.8
274.4280.8
272.8276.7
270.6275.0
276.4283.0
284.8290.9
286.5290.4
289.2296.5
296.9297.4296.5297.4299.6298.6298.3302.3300.0302.6
305.9
304.0303.9305.2303.5
303.7
15.9
16.117.3
19.721.4
26.041.1
52.259.9
68.477.7
84.290.3
93.884.474.5
70.068.7
64.662.5
63.066.8
65.661.8
58.461.6
61.163.4
58.863.7
63.669.2
63.562.0
57.359.5
56.2
59.5
65.367.5
61.
60.
55.362.1
62.567.2
67.866.664.065.365.265.064.564.564.665.9
65.466.566.065.163.964.2
2.5
2.52.2
2.22.3
2.66.2
7.211.5
M.918.8
21.824.3
22.923.823.3
21.922.6
21.423.3
19.318.9
18.320.8
23.023.8
22.924.7
24.725.9
25.024.9
23.624.8
23.824.9
23.024.2
25.426.3
26.026.6
26.527.4
27.328.9
28.528.429.129.229.629.729.830.429.830.2
30.5
30.8
30.330.6
31.031.2
6.5
7.17.6
8.5
9.5
10.612.2
U.316.9
19.121.7
24.927.0
28.029.130.9
32.834.4
35.337.3
38.339.4
37.839.2
41.042.3
44.345.9
47.648.3
49.349.6
50.551.7
53.554.0
55.655.2
55.954.4
54.6
53.7
55.355.1
56.1
54.5
53.854.254.553.755.956.5
55.557.156.456.1
57.9
55.654.555.1
55.154.3
22.7
22.823.9
25.031.0
37.753.0
67.081.7
100.2IIA.O
128.2136.6
135.1132.6130.7
133.7131.3
130.7129.7
132.2132.1
135.6134.9
132.9131.8
130.3
133.4
135.0137.3
133.3135.1
136.7U2.3
138.3138.2
135.9136.1
129.9134.8
142.6150.3
M9.3145.8
U3.3U5.9
146.8
U8.3U9.0H9.1148.8U7.6148.5150.4149.1150.4152.1
151.1153.1154.4153.6154.0
10.110.6
11.2
13.6
17.823.7
30.937.6
46.153.3
59.164.1
64.163.364.2
66.665.7
65.865.5
66.666.3
67.466.3
65.464.6
64.365.2
66.164.8
64.763.4
65.064.7
66.265.5
65.664.0
63.763.0
65.368.0
68.264.9
63.465.2
65.465.465.765.565.265.265.665.765.965.866.066.266.666.767.4
66.8
.2
1.1
3.76.9
11.316.0
21.125.5
29.130.7
30.830.430.3
30.831.0
31.632.2
33.133.8
34.534.5
34.534.7
34.935.3
36.036.7
37.538.2
39.340.1
40.941.4
41.541.6
42.142.5
42.642.4
42.542.9
43.644.2
44.444.444.544.544.644.644.744.844.944.945.045.145.345.545.6
45.7
1.9
2.62.8
3.44.2
5.46.5
7.98.7
10.110.7
11.612.2
12.513.113.9
U.715.2
15.515.6
15.715.5
15.415.1
14.6
14.4
14.113.8
13.212.7
12.111.7
10.910.2
9.48.7
7.66.6
5.95.2
4.53.5
3.12.7
2.52.2
2.22.22.12.12.02.02.02.02.01.91.91.3
1.7
1.71.6
1.6
8.2
7.57.8
7.68.2
8.710.3
11.712.9
U.917.1
18.521.2
20.819.920.1
21.119.4
18.617.6
17.817.0
17.616.7
16.315.5
15.716.0
16.815.4
15.113.5
14.8
U.5
15.915.4
16.515.8
15.715.3
18.322.1
17.418.8
18.818.319.113.913.518.518.918.919.119.019.119.319.619.620.1
19.5
6.3
6.56.9
7.18.2
9.211.3
13.115.1
17.319.6
22.724.0
24.424.924.9
24.623.9
22.821.2
20.520.1
19.818.7
17.116.5
15.716.0
16.015.9
15.415.3
15.014.6
13.613.2
12.712.5
12.212.7
12.612.5
12.011.9
11.411.4
11.611.511.511.511.511.311.511.511.411.511.511.5
11.5
11.411.211.1
3.1
3.13.2
3.43.7
3.94.5
5.36.1
7.38.3
9.610.7
11.111.511.8
12.112.0
12.011.5
11.611.4
11.610.9
10.29.8
9.69.5
9.59.2
9.18.8
8.78.5
3.43.0
7.97.6
7.47.3
7.36.9
6.6
6.3
6.36.1
6.2
6.36.66.36.36.36.36.36.36.16.16.1
6.16.1
6.36.1
2.2
2.12.0
2.04.0
4.910.1
12.916.4
20.221.4
23.322.2
19.917.315.3
13.714.1
13.614.8
15.816,8
18.419.7
20.120.7
18.819.9
18.621.5
16.619.2
18.323.5
17.719.1
16.818.6
14.818.8
20.322.3
21.019.9
19.719.4
20.421.420.220.420.819.319.820.9
18.819.721.519.820.821.420.5
20.7
.4
.5
.6
.7
.9
1.0
1.52.1
3.2
4.3
5.36.5
6.76.56.3
7.17.3
7.87.9
8.08.1
8.78.8
9.49.6
10.411.1
12.012.7
13.9
U.4
14.715.4
16.116.3
16.816.6
16.316.5
16.918.0
13.313.7
19.313.7
19.019.119.519.619.719.719.919.919.819.619.319.519.9
19. 9r
20.120.6
.2
.2
.2
.2
.4
.4
.8
1.31.5
1.41.7
2.02.4
2.42.22.1
3.42.7
2.62.8
2.92.9
3.54.3
4.24.3
4.75.3
5.75.9
6.06.3
6.87.5
7.97.8
7.67.6
6.57.7
10.112.0
12.313.0
12.713.4
12.913.013.613.313.5U.lU.214.615.115.4
15.415.315.3
15.2
15.315.6
Source: Office of Debt Analysis in the Office of the Secretary. i/i/ United States savings bonds, Series A-F and J, are included at ^
current redemption value. ^2/ Securities issued or guaranteed by the U. S. Government, excluding 2/
guaranteed securities held by the Treasury.
2/ Consists of commercial banks, trust companies, and stock savings 8/banks in the United States and in Territories and island possessions.Figures exclude securities held in trust departments. 2/
Includes partnerships and personal trust accounts.Discontinued series. See savings bonds tables.Exclusive of banks and ins\irance companies.Consists of the investments of foreign balances and internationalaccounts in the United States.Consists of savings and loan associations, nonprofit Institutions,
corporate pension trust funds, and dealers and brokers.Immediate postwar debt peak. p Preliminary. r Revised.
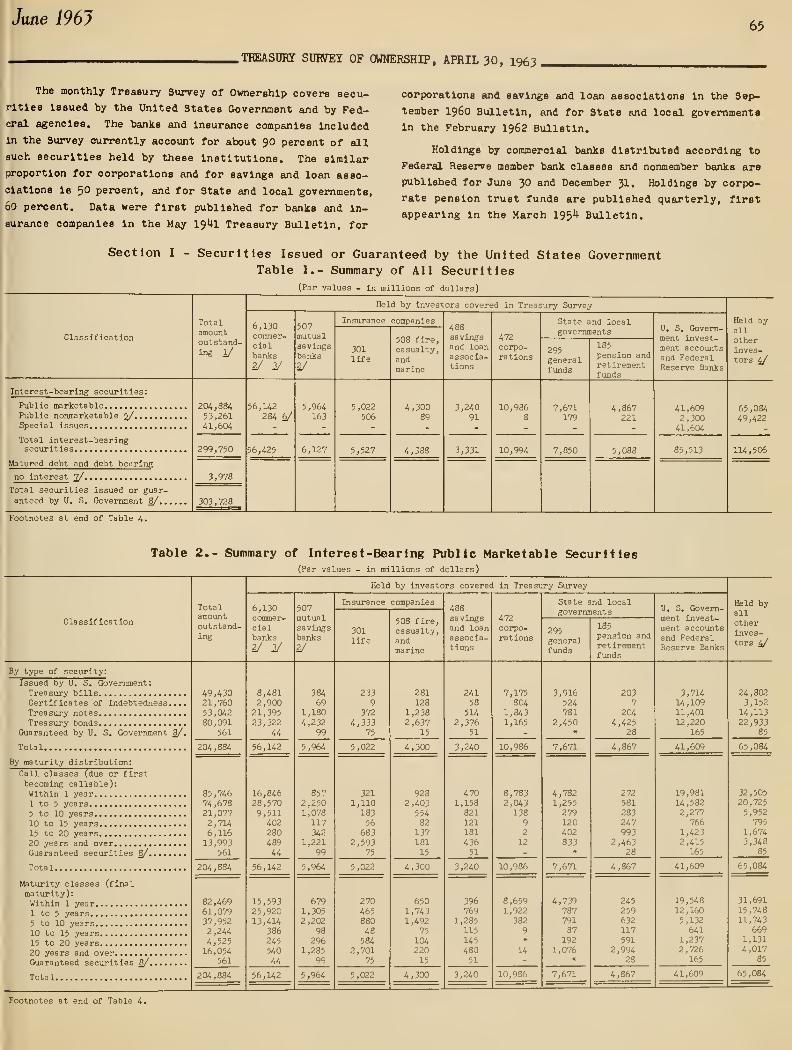
June 196J 65
.TKEASDEI SUWET OF OWNERSHIP, APRIL 30, 1963 ,
The monthly Treasury Survey of Ovmershlp covers secu-rities Issued by the United States Sovernment eind by Fed-eral agencies. The banks and Insurance companies Included
In the Survey currently account for about 90 percent of all
such securities held by these Institutions. The similar
proportion for corporations and for savings and loan asso-
ciations is 50 percent, and for State and local governments,
60 percent. Data were first published for banks and in-
surance companies in the May I9IH Treasury Bulletin, for
corporations and savings and loan associations in the Sep-
tember i960 Bulletin, and for State and local governments
in the February 196a Bulletin.
Holdings by commercial banks distributed according to
Federal Reserve member bank classes and nonmember banks are
published for June 30 B.ni December 3I. Holdings by corpo-
rate pension trust funds are published quarterly, first
appearing in the March 195!^ Bulletin.
Section I - Securities Issued or Guaranteed by the United States GovernmentTable 1.- Summary of All Securities
(Par values - in millions of dollars)
Classification
Totalamountoutstand-ing 1/
6,130commer-cialbanks
2/ 2/
507mutualsavingsbanks
2/
Held by investors covered in Treasury Survey
Insurance companies
301life
508 fire,casualty,andmarine
savingsand loanassocia-tions
472corpo-rations
State and localgovernments
295generalfunds
185pension andretirementfunds
U, S, Govern-ment invest-ment accountsand FederalReserve Banks
Interest-bearing securities :
Public marketablePublic nonmarketable ^Special issues
Total interest-bearingsecurities
Matured debt and debt bearing
no interest 2/Total securities issued or guar-
anteed by U. S. Government 8/.
,
Footnotes at end of Table 4.
204,88453,26141,604
56,142284 6/
5,964163
5,022506
4,30089
299,750 56,425 6,127 5,527 4,388
3,24091
3,331
10,986 7,671179
4,867221
10,994 7,850 5,C
3,978
303,728
41,6092,300
41,604
85,513
Table 2.- Summary of Interest -Bearing Public Marketable Securities(Par values - In millions of dollars)
Classification
Totalamountoutstand-ing
Held by investors covered in Treasury Survey
6,130commer-cialbanks
2/ 2/
507mutualsavingsbanks
2/
Insxirance companies
301life
508 fire,casualty,andmarine
488savingsand loanassocia-tions
472corpo-rations
State and localgovernments
295general
185pension andretirementfunds
U. S. Govern-ment invest-ment accountsand FederalReserve Banks
By type of security:
Issued by U, S, Government:Treasury billsCertificates of indebtedness,,,,Treasury notesTreasury bonds
Guaranteed by U, S, Government 8/,
Tota 1
By maturity distribution:
Call classes (due or firstbecoming callable):Within 1 year1 to 5 years5 to 10 years10 to 15 years15 to 20 years20 years and overGuaranteed securities 8/
Total
Maturity classes (finalmaturity):Within 1 year1 to 5 years5 to 10 years10 to 15 years15 to 20 years20 years and overGuaranteed securities 8/
Tota 1
Footnotes at end of Table 4.
49,43021,76053,04280,091
561
204,884
85,74674,67821,0772,7146,11613,993
561
204,884
82,46961,07937,9522,2444,52516,054
561
2ai,884
8,4812,900
21,39523,322
44
56,142
16,84628,5709,511
40228048944
56,W2
15,59325,92013,414
386
24554044
56,142
38469
1,1804,232
99
5,964
8572,2501,078117342
1,22199
5,964
6791,3052,202
98296
1,28599
5,9d4
2339
372
4,33375
5,022
3211,110
18356
6832,593
75
5,022
27046588048584
2,70175
5,022
281128
1,2382,637
15
4,300
9282,403
55482
13718115
4,300
6501,7431,492
75
10422015
4,300
24158
5142,376
51
3,240
4701,158821121181
43651
3,240
396769
1,285115
14548051
3,240
7,175804
1,8431,165
10,986
8,7832,043
13892
12
10,986
8,6591,922
3829*
14
10,986
3,916524781
2,450
7,671
4,7821,255279120402833
7,671
4,73978779187
1921,076
7,671
2037
204
4,42528
4,867
272581
283247993
2,46328
4,867
245259632117591
2,99428
4,867
3,71414,10911,40112,220
165
41,609
19,98114,5822,277
766
1,4232,415
165
41,609
19,54812,1605,132641
1,2372,726
165
41,609

66 Treasury Bulletin
.TEEASDRY SUWEY OF OWNERSHIP, APRIL 30, 1963
Section I - Securities Issued or Guaranteed by the United States GovernmentTable 3.- Interest-Bearing Public Marketable Securities by Issues
(Far values - in millions of dollars)
Issue
Totalamountoutstand-ing
Held by investors covered in Treasury Survey
6,130commer-cialbanks
2/ J/
507mutualsavingsbanks
2/
Insurance companies
301life
508 fire,casualty,andmarine
488savingsand loanassocia-tions
472corpo-rations
State and localgovernments
295generalfunds
185
pension andretirementfunds
U. 0,, Govern-ment invest-ment accountsand FederalReserve flanks
Treasury bills:
Regular weekly:May 1963 - July 1963.
Aug. 1963 - Oct. 1963.
Tax anticipation:June 1963
Other:July 1963Oct. 1963Jan. 1964Apr. 1964
Total Treasury bills
Certificates of indebtedness:
3-1/4S6 May 1963-B3-1/2 Aug. 1963-C3-1/8 Nov. 1963-D3-1/4 Feb. 1964-A
Total certificates of
indebtedness
Treasury notes:
^% May 1963-B3-1/4 May 1963-D4-7/8 Nov. 1963-C3-3/4 May 1964-D4-3/4 May 1964-A5 Aug. 1964-B3-3/4 Aug. 1964-E4-7/8 Nov. 1964-C4-5/8 May 1965-A3-1/2 Nov. 1965-B3-5/8 Feb. 1966-B
4 Aug. 1966-A3-5/8 Feb. 1967-B3-3/4 Aug. 1967-A1-1/2 Oct. 1963-EO1-1/2 Apr. 1964-EA1-1/2 Oct. 1964-EO1-1/2 Apr. 1965-EA1-1/2 Oct. 1965-EO1-1/2 Apr. 1966-EA1-1/2 Oct . 1966-EO1-1/2 Apr. 1967-EA1-1/2 Oct. 1967-EO1-1/2 Apr. 1968-EA
Total Treasury notes
Treasury bonds:
2-l/2Sf June 1962-672-1/2 Aug. 19632-1/2 Dec. 1963-683 Feb. 19642-1/2 June 1964-692-1/2 Dec. 1964-692-5/8 Feb. 19652-1/2 Mar. 1965-702-1/2 Mar. 1966-713-3/4 May 19663 Aug. 19663-3/8 Nov. 19662-1/2 June 1967-722-1/2 Sept. 1967-723-5/8 Nov. 19672-1/2 Dec. 1967-723-7/8 May 19683-3/4 Aug. 1968
4 Feb. 19694 Oct. 1969
4 Aug. 19713-7/8 Nov. 19714 Feb. 1972
4 Aug. 19723-7/8 Nov. 19744-1/4 May 1975-853-1/4 June 1978-83
27,02210,404
2,503
2,0042,5002,4962,501
49,430
5,2845,1814,5546,741
21,760
,183
,027,011
,893
,933,316,019
,195,113
,954,380
,454,287
,282506457490466315675357270457
3
53,042
,462
,461,815
,634,632
,543,682
,421
,410,597,024,852
,317,952
,604,785
,460,747,844,538,806
,760
,344,579
,244470,591
3,4872,013
284556716
1,174
8,481
1,100476187
1,136
2,900
4441,217
9611,970
531
3381,909
710679
1,8981,5561,5632,5683,299233160204222146279207147156
21,395
594393659803801679
2,364378149
1,820656831147922
1,274168734
2,3351,154663
1,2371,1871,295
90538616
35
18578
10
17483313
384
19
137
30
4124
14164
102
9453
129116234110778
145
2
102
2
1
2
2
1,180
577
12112
2762312'.
156102112162875
839580
11511368
1661161511631859818
46
125
40
50
3
11
233
3
2
9
3
17131
7
12
1
1
5
4
2
3
416
4
1442
6
112
372
78
434
9212128138119171
13
461042
125177
5
2213
133176
489
99
15671
13
7
20151
281
495
15
59
128
1721811575756
65
5469
104636612014520302715
8
302011
2
1,238
120
3615836
160115
21915488100
346938
13013195985918
847592646575
732
12642
1622
2410
241
345
58
1338
24412112
402131
2623539764*
2
2
514
208
54136270
58
363267273754
73L22
83
591514774
93178105115115
7
37
3,3391,325
1,441
173226277393
7,175
26766
110362
804
204198
79
74
60537014
10156
839481
14114115011462
101685091
1,843
66191584821
393512621
4512
U9
53
3316
1
8112
6
101216
9
2,507639
31517020478
3,916
17811570
160
524
21
1475396
491985
73
48
3433
31
22
635
1
781
152629464488
7371
64291421
462380
14964132
19487126358733
210
17814
203
2411
54
232
52
17
1
1
1
12
204
7
192
3652
13693610
5
11
3813
338556
4
4
58214453
43117129401
2,206867
24
86
24596192
3,714
2,6113,8013,7743,923
14,109
74
848332302
2,860219
1,7622,335
40221
1471,719
91
270
3
15
2043572301L2509538474778388
33436
19412876
773209396298138
33346719057
398641125186
Footnotes at end of Table 4, (Continued on following page)

June 196J

68

June 196J 69
MARKET QUOTATIONS ON TREASURY SECURITIES, MAY 31, 1963
Current market quctatlons shown here are over-the-
counter closing bid quotations In the New York market
for the last trading day of the month, as reported to
the Treasury by the Federal Reserve Bank of Nev; York.
The securities listed Include all regulau-ly quoted public
marketable securities Issued by the United States Treas-
ury. Outsteindlng issues which are guaranteed by the United
States Government are excluded.
Table 1.- Treasury Bills
Amount o
ing (mil

70

June 196J71
MARKET QUOTATIONS ON TREASURY SECURITIES, MAY 31, 1963
lUoo1-"
oo o(D
o

72 Ireasury nulletin
.avera:>e yields of long-te3M bonds.
Table 1.- Average Yields of Taxable Treasury and Moody's Aaa Corporate Bonds by Periods
(Percent per annum)
Treasurybonds 1/
Moody's Aaa
corporatebonds
Tree surybonds 1/
Moody' s Aaa
corporatebonds
Treasurybonds 1/
Moody's Aaacorporatebonds
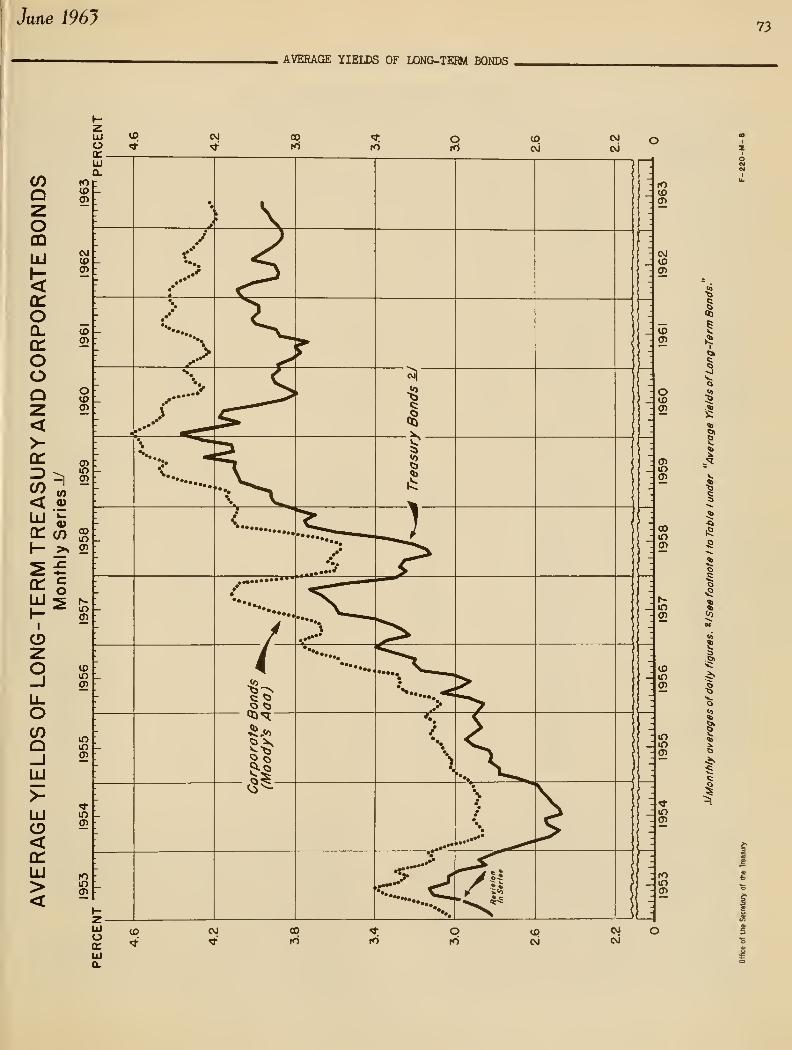
June 196J73
AVERAGE YIELDS OF LONGwTERM BONDS

74 Treasury Bulletin
.MONETARY STATISTICS.
Table 1.- Money In Circulation(In millions of dollars except per capita figures)
End of fiscalyear or month
Totalmoney in
circula-tion 1/
Paper money 2/
Totalpapermoney
Goldcertif-icates
Silvercertif-icates
Treasurynotes of
1890
UnitedStatesnotes
FederalReservenotes
FederalReserveBanknotes
Nationalbanknotes
19551956195719581959
1960,
1%1 ,
1962 ,
1961-December.
,
1962-JulyAugust....September.
October, ,
,
November.
.
December.
.
1963-January. ..
February.
.
March
April
30,22930,71531,08231,17231,914
32,06532,40533,770
33,918
33,86933,93233,893
34,10934,78235,338 2/
34,09334,286
34,513
34,645
28,37228,76729,04029,07129,699
29,72629,94331,117
31,336
31,19731,24531,192
31,38232,02632,557
31,334
31,513
31,718
31,818
34
333332
31
303029
30
292020
202020
2020
20
20 i/
2,1702,M82,1622,2002,155
2,1272,0942,009
2,120
1,9801,9451,943
1,9471,9572,001
1,859
1,848
1,842
1,844 i/
319318321
317316
318318318
314
317318316
318318315
303310
313
3U
25,61826,05526,32926,34227,029
27,09427,35328,622
28,731
28,73428,84228,792
28,97629,61230,102
29,03329,218
29,426
29,523 6/
163
147133120110
1009285
89
84
8382
82
81
81
80
80
79
79
676462
5957
56
54
53
54
53
3838
3838
38
37
37
37
37

Jane 196J75
MONETARY SlATISTICS
Table 2.- Monetary Stocks of Gold and Silver(Dollar amounts in millions)
End of fiscalyear or month
19551956195719581959196019611962
1961-December.
1962-JulyAugust. ,,
September
October,.November,December.
196 3- January,,
February,
March,,,,
April, . .
.
Gold
($35 perfine ounce)
21,677.621,799.122,622.921,356.219,704.619,322.217,550.216,435.2
16,889.0
16,U7.416,097.616,067.4
15,977.915,976.915,973.1
15,928.015,877.9
15,877.5
15,876.9
Silver(l.29t perfine ounce)
3,922.43,994.54,116.64,306.04,414.14,394.54,346.54,317.4
4,303.6
4,317.24,316.84,317,2
4,317,24,317,04,318,2
4,318,24,318,5
4,318.4
4,317.9
Ratio of silver to
gold and silver in
monetary stocks(in percent)
15.315.515.416.818.318.519.920.8
20.3
21.121.221.2
21,221,321,3
21,321,421.4
21.4
Source: Circulation Statement of United States Money,
silver monetary stock see Table 4,
For detail of 1/ See Table 3, footnote 3.
Table 3.- Gold Assets and Liabilities of the Treasury
(in millions of dollars)
End of calendar year or month

76 Treasury Bulletin
MONETARY STATISTICS.
Table 4.- Components of Sliver Monetary Stock(In millions of dollars)
End of calendaryear or month
Silver held In Treasury
Securing silver certificates 1/
Silverbullion 2/
Silverdollars
In Treasurer's account
Subsidiarycoin 2/
Silverbullion V
Silver outsideTrea sury
Silverdollars 1/
Subsidiarycoin j/
Totalsilverat tl.29+per fineounce
19551956195719581959196019611962
1962-JulyAu^st , ,
,
September
October,
,
November.December.
1963-January.
.
February.
March. ..
.
April....
2,194.42,208.92,212.92,245.02,251.42,252.12,237.52,139.1
2,180.52,167.62,156.0
2,U5.62,139.12,139.1
2,126.22,il;.6
2,112.0
2,101.6
253.5236.3219.0202.7182.3161.2130.194.0
113.7110.5107.1
103.5100.194.0
89.788.1
81.6
77.6
15.72.38.2
U.93.22.63.63.4
5.46.27.5
4.93.73.4
8.18.0
5.4
6.8
17.963.092.3U8.3127.488.224.229.7
30.930.831.6
32.534.429.7
30.729.6
31.3
27.8
235.4252.2269.3285.4305.5326.5357.3392.5
373.5376.6380.0
383.6387.0392.5
396.8398.2404.8
408.5
1,283.21,338.21,402.61,446.21,513.41,576.01,650.51,756.0
1,707.31,720.01,730.7
1,743.51,749.41,756.0
1,764.01,778.2
1,781.6
1,794.8
3,930.14,064.14,185.44,362.54,382.74,375.64,308.64,318.2
4,317.24,316.84,317.2
4,317.24,317.04,318.2
4,318.2
4,318.54,318.4
3,317.9
Source: Circulation Statement of United States Money; Office of theTreasurer of the United States.
1/ Valued at $1.29+ per fine ounce.
2/ Includes silver held by certain agencies of the Federal Government.
2/ Valued at $1.38+ per fine ounce.
i/ Includes bullion at cost, bullion valued at $1.29+ per fine ounceheld for coinage, and bullion valued at $1.38+ per fine ounce heldfor recolnage of subsidiary silver coins.

June i96J 77
MONETARY STATISTICS,
Table 5.- Seigniorage
(Cumulative from January 1, 1935 - in millions of dollars)
End of calendaryear or month
1935 ,
1936 ,
19371938 ,
1939 ,
1940 ,
19411942 -
194319441945 ,
19461947 ,
19481949 ,
1950 ,
19511952 ,
1953195419551956 ,
1957 ,
1958 ,
1959 ,
1960 ,
19611962
1962- JulyAugust , , ,
,
September,
October.
.
November
.
December.
1963- Janxiary,
.
February.
March. . .
.
April, . . ,,
May
Seigniorageon coins(silver andminor) 2/
18.546.163.769.591.7122.2182.1245.7299.6362.3429.5491.9520.5559.2578.7596.6642.3694.2742.2792.9807.0839.6890.3932.0981.6
1,038.51,101.7i,l;6.9
1,126.91,130.61,134.1
1,137.71,141.81,146.9
1,150.11,152.7
1,156.9
1,160.61,163.4
Sources of seigniorage on silver bullion revalued i/
Misc. silver(incl. silverbullion heldJune 14, 1934)
484848484848484848.748.748.748.743.748.748.748.748.748.748.748.748.748.748.748.748.748.748.748.7
48.748.748.7
48.
48.
48.
48.
48.
48.
48.748.7
Silver Pur-chase Actof June 19,1934
226.2302.7366.7457.7530.7562.7580.4584.3584.3584.3701.6832.1832.1832.2833.6833.7833.7833833833833833833.7833.7833.7833.7833.7833.7
833.
833.
833.
833.7833.7833.7
833.7833.7833.7
833.7833.7
Nationalizedsilver(Proc. ofAug. 9, 1934)
34.534.734.734.734.734.734.734.734
34
34
34343434.734
343434
3434.734.734.734.734.734.734.734.7
34,
34.
34,
34.
34.
34.7
34.734.734.7
34.734.7
Newly mined silver 2/
Proclamationof Dec. 21,1933
16.836.058.074.987.387.687.687.687.687.687.687.687.687.687.687.687.687.687.687.687.687.687.
87.
87.'
87.
87.
87.
87.687.687.6
87.687.687.6
87.687.6
37.6
87.6
87.6
Acts of
July 6, 1939,and July 31, 1946
4.225.748.363.665.365.465.566.574.584.693.5104.7114.6125.4134.7
U3.8150.8155.2156.4166.0167.9167.9167.9167.9
167.9167.9167.9
167.9167.9167.9
167.9167.9
167.9
167.9167.9
Totalseigniorageon silverreva lued 2/
326.2422.1508.
616.705.
759.
799.
818.
820.
820.
938.1,069.61,077.61,087.31,098.11,109.31,119.21,130.01,139.31,148.41,155.41,159.81,161.01,170.61,172.51,172.51,172.51,172.5
1,172.51,172.51,172.5
1,172.
1,172,
1,172,
1,172.51,172.5
1,172.5
1,172.51,172.5
Potentialseigniorage onsilver bullionat cost in
Treasurer'saccount _2/
274.9397.5541.6758.8950.6
1,055.81,089.01,048.2967.3717.3333.2161.2146.8129.9127.21118157
346
U.350.072.9114.098.370.812.617.3
16.816.816.8
16.816.817.3
17.317.4
17.4
17.417.3
Source: Bureau of Accounts,
1/ These items represent the difference between the cost value and the
monetary value of silver bullion revalued and held to secure silver
certificates.
2/ Total of seigniorage on coins and on newly mined silver, beginning
with that for July 1959, is included under coins; the breakdown is
not available after June 1959.
2/ The figures in this column are not cumulative; as the amount of
bullion held changes, the potential seigniorage thereon changes.

78 treasury nulletin
. NATIONAL BANK REPORTS
Table 1.- Earnings, Expenoefi, and Dividends for Calendar Years 1958 through 1962
(Dollar amounts in thousands)

June 196J 79
.INTERNATIONAL FINANCIAL STATISTICS.
Table 1.- U. S. Gold Stock, and Holdings of Convertible ForeignCurrencies by U. S. Monetary Authorities
(In millions of dollars)
End of calendaryear or month
Total gold stockand foreign currencyholdings
Gold stock 1/
Trea sury Total 2/
Foreigncurrencyholdings 2/
19531954195519561957
19581959196019611962.
1962-July ,
August, .. ,
September,
October, ,
,
November,
,
December,
.
1%3-January , ,
,
February,
.
Uarch
AprilMay p
22,09121,79321,75322,05822,857
20,58219,50717,80417,06316,156
16,67816,56216,531
16,36416,21616,156
16,10216,02316,078
16,04616,010
22,03021,71321,69021,94922,781
20,53419,45617,76716,88915,978
16,14716,09816,067
15,97815,97715,978
15,928
15,87815 ,878
15,877r15,798
22,09121,79321,75322,05822,857
20,58219,50717,80416,94716,057
16,18216,13916,081
16,02616,01416,057
15,97415,89115,946
15,91415,855
116
99
496423450
33820299
128132132
132155
Note: The United States also has certain drawing rights on the Inter- 1/
national Monetary Fund, in which the United States has a quota of
$4,125 million. In accordance with Fund policies, these drawing
rights include the right to draw virtually automatically an amount
equal to the sum of the United States gold subscription to the Fund 2/($1,031.2 million) and the Fund's net use of dollars; on May 31,
1%3, these two amounts totaled $1,104.6 million. Under appropriate
circumstances the United States could draw an additional amount equal 2/to the United States quota. P
Includes gold sold to the United States by the International MonetaryFund with the right of repurchase, the proceeds of which are Investedby the Fund in U. S. Government securities; as of May 31, l%3,thleamounted to $800 million.
Includes gold in Exchange Stabilization Fund, which is not Included
in Treasury gold figures shown in "Circulation Statement of United
States Money." See "Monetary Statistics," Table 3.
Includes holdings of Treasury and Federal Reserve System.
Preliminary. r Revised.
Table 2.- U.S. Treasury Nonmarke table Notes and Bonds
Issued to Official Institutions of Foreign Countries

80 Treasury Bulletin
. CAPITAL MOVEMENTS,
Data relating to capital movemente between the United
3tatei and foreign countries have been collected since
1935, pursuant to Executive Order 656O of January I5, ISJi^,
Executive Order IOO33 of February S, 1949, and Treasury
regulations promulgated thereunder. Information on the
principal types of data and the principal countries Is re-
ported monthly, and Is published regularly In tYe 'Treasury
Bulletin.' 3upplement£iry Information Is published less
frequently. Reports by banks, bankers, securities brokers
and dealers, and Industrial and commercial concerns In the
United States are made Initially to the Federal Reserve
Banks, which forward consolidated figures to the Treasury.
Beginning April 195'*. data reported by banks In the Terri-
tories and possessions of the United States are Included
In the published data.
The term "foreigner' as used In these reports covers
all Institutions and Individuals domiciled outside the
United States and Its Territories and possessions, the
official Institutions of foreign countries, wherever
such Institutions may be located, and International organ-
izations. "Short-term" refers to original maturities of
one year or less, and "long-term" refers to all other
maturities. A detailed discussion of the reporting cov-
erage, statistical presentation, and definitions appeared
In the June 195'*' Issue of the "Treasury Bulletin, " pages
IV^-^-y. As a result of changes In presentation Introduced
In that Issue, not all breakdowns previously published
will be exactly comparable to those now presented.
The first three sections which follow are published
monthly. They provide summaries, by periods and by coun-
tries, of data on short-term banking liabilities to and
claims on foreigners £ind transactions In long-term securi-
ties by foreigners, and present detailed breakdowns of the
latest available preliminary data.
Section IV provides supplementary data In six tables
which appear at less frequent Intervals. Table 1, short-
term foreign liabilities and claims reported by nonf Inan-
clal concerns, Is published quarterly In the February, May,
August, and November lisuea of the Bulletin. Table 2,
long-term foreign liabilities and claims reported by banks
and bankers, and Table 3, estimated gold reserves and
dollar holdings of foreign countries and International
Institutions, are published quarterly In the March, June,
September, and December Issues. Table k, foreign credit
and debit balances In brokerage accounts, appears semi-
annually In the March and September Issues. Table 5,
short-term liabilities to foreigners In countries and
areas not regularly reported separately by banking in-
stitutions, Is presented annually, appearing In the April
Issue through 195S and In the March Issue thereafter.
Table 6, purchases and sales of long-term securities by
foreigners during the preceding calendar year, also appears
annually, from 1959 through 1962 In the May Issue, and
in the April Issue beginning 1963.
Section I - Summary by Periods
Table 1.- Net Capital Movement Between the United States and Foreign Ckjuntrles
(In millions of dollars; negative figures indicate a net outflow of capital from the United States)

June 196J 81
.CAPITAL MOVaiENTS,
Section I - Summary by PeriodsTable 2.- Short-Term Banking Liabilities to and Claims on Foreigners
{Position at end of period in millions of dollars)
End of calendaryear or month
Short-term liabilities to foreigners
Total 1/
Payable in dollars
Foreignofficial
1/
Otherforeign
Internationaland regional
1/
Payable inforeigncurrencies
Short-term claims on foreigners
Payable in dollars
Loans to
foreignbanks
Other
Payable in
foreign cur-rencies
ig-iS
19-V6
19i'7
19481949195019511952195319541955195619571958 ,
19591960 ,
1%1 ,
1961 2/ -
1962
1962-JulyAugust , . .
September
October.
.
November,December,
1963-January,
,
February.March p,
,
April p..
6,883,16,480,37,116,47,718,07,618.08,644.89,302,210,546,111,648,412,918.613,600U,93915,15816,159,
19,388,21,271,
22,450.
4,179.33,043.91,832.12,836.32,908.13,620.33,547.64,654.25,666.96,770.16,952.88,045.4 2/7,916.6 2/8,664,99,154,310,212.3
10,893.2
2,678.22,922.02,972.72,947,03,001,03,451,74,041.24,245.64,308.44,335.44,726.55,392.8 2/5,665.3 2/5,890.86,999.16,934.47,655.0
473,72,262,01,864.31,657.81,527.81,641.11,584.91,629.41,769.91,881.11,452.11,517.31,544.03,158.14,011.8
3,751.7
25.540.649.770.451.044,972,261.443.743.240.348.859.059.477.2
113.1150.4
392.8708.3948,9
1,018,7827,9898.0968.4
1,048.7904.5
1,386.51,548.51,945.72,199,4
2,542.02,624.03,614.24,745.8
100.
319.292,361,222,151,177,,
122.
156,
206.328.
405.385.
439.4497.6524.3699.4
245.0290.5490,6557,1494,3506.3699.4847.5646.5969.0
1,056.51,390.81,666,51,904.91,909.22,610,33,460.8
47.598.1165.4100.4110,8240,691.878.4101.6211.0163.9149.6U7.3197.7217.2479,6585.6
22,532.6
25,002.1r
23,622.824,158.124,524,0
25,211.325,196.025,002. Ir
24,938.824,980.125,130.3
25,313,0
10,893.3
11,910.3
10,639.810,881,311,431.7
11,805.811,898,211,910, 3r
11,515,711,441.311,716.1
11,880.1
7,737.3
7,801.0
7,967.88,015.87,895.8
8,118.17,990,27,801,0
8,159,28,336.88,288.5
8,300.4
3,751.7
5,U7.5
4,835.55,014.84,942.7
3
5
5
150.4
U3,4
179.7
5,0055,095
5,M7
5,099.85,051.94,982.4
5,016.6
246.
253.
282.212.
M3.
164.
150.
143.
4,803,8
5,100.5r
4,877.3r4,833,4r4,810.9r
4,955. 4r
4,865. 7r
5,100.5r
4,885.5,003.
5,050.
115.9 i/ 5,234.3
709.2
952.6
827.7818.3801.6
815.7823,6952,6
844.
853.853.
.9
.4
.4
825,2
3,508,3
3,603,8r
3,559.6r
3, 552, Or3,516,4r
3,511,4r3,470,2r3,603.8r
3,531,Lr
3,616,43,634,7
3,830,2
586.3
544,0
490,1463.1492.8
628.3571.8544.0
509. 7r
533,2562,1
579,0
1/
2/
Data exclude nonnegotlable, nonlnterest-bearing special U, S. notes 2^
held by the Inter-American Development Bank and the International
Development Association. Beginning May 1960, data for Latin American
regional organizations and beginning July 1962, data for European
regional organizations (except the Bank for International Settlements Vand the European Fund) are reclassified from "Foreign official" to
"International and regional" in this summary table. P
Beginning in August 1956 and again in April 1957, certain accounts r
previously classified as "Other foreign" are included in "Foreign official."
Differs from 1961 end-year data on the preceding line by inclusion
of liabilities and claims reported by banks initially included as of
June 30, 1962, and starting with the March 1963 Bulletin, included
beginning December 31, 1961.
Includes $25.5 million representing reported liabilities to foreign
official institutions.Preliminary.Revised.

82 Treasury Bulletin
. CAPITAL MOVMENTS.
Section I - Summary by PeriodsTable 3.- Purchases and Sales of Long-Term Domestic Securities by Foreigners
(In millions of dollars; negative figures indicate a net outflow of capital from the United States)
Ca lendaryear ormonth
U, S. Governmentbonds and notes 1/
Purchases SalesNetpurchases
Corporate and other
Bonds 2/
Purchases SalesNetpurchases
Purchases SalesNet
purchases
Totalpurchases
Totalsales
Net pur-chases of
domesticsecurities
.1946 ,
19<i7
1948194919501951195219531954195519561957 ,
19581959196019611962
1962-July.
.
Aug..,Sept.,
Oct..,Nov..
.
Dec...
1963-Jan...
Feb..,Mar p,
Apr p.
414.5344.8282.4430.0
1,236.4673.6533.7646.0800.9
1,341.1883.4666.1
1,223.91,216.91,729.61,743.71,779.9
145.6135.1326.6
76.6251.1
167.4
217.6
123.3475.3
58.4
684.2283.3330.3333.6294.3
1,356.6231.4728.0792.7812.1
1,018.3718.3
1,187.6528.0
1,603.01,231.52,507.9
119.3346.5334.1
110.3318.5105.1
90.1176.4
436.8
46.2
-269.761.5
-47.996.4
942.1-683.0302.3-82.0
8.2529.0
-135.0-52.136.3
688.9126.6512.2
-728.0
26.3-211.4
-7.5
-33.7-67.562.3
127.5-53.1
38.5
12.2
2/
2/107.7120.0200.1212.
a
289.7324.7287.1310.2361.4368.8442.4316.9307.7
17.719.518.1
25.722.424.8
36.520.515.3
17.7
2/108.3141.6188.5197.4283.6296.0251.8258.9344.0296.2392.3416.1359. Or
31.119.924.5
27.330.837. Or
27.718.1
15.1
16.7
2/2/2/
-.6-21.611.715.36.1
28.735.351.317.372.650.1
-99.2-51. 3r
-13.4-.4
-6.4
-1.6-8.4
-12. 2r
8.82.5
.2
1.0
367.6226.1369.7354.1666.9739.8650.2589.1
1,115.11,561.21,619.51,306.41,397.32,224.41,976.53,067.32,260.2r
150.5139.9106.9
129.2187 .'9
170.4r
178.0
162.8
161.5
255.5
432.1376.7514.1375.3664.0619.5649.2533.9980.2
1,433.71,363.51,163.81,453.61,861.51,774.82,744.62,U9.Lr
168.9136.2115.5
133.1167.1174. 5r
174.6172.2
161.3
218.6
-64.5-150.6-144.3-21.2
2.9120.3
1.055.2
135.0127.5256.0142.6-56.3362.9201.7322.7lll.lr
-18.43.8-8.6
-3.920.8-4.1r
3.4-9.5
.2
36.9
782.1570.9652.2784.1
2,011.11,533.31,384.01,447.92,205.73,227.02,790.02,282.82,982.53,810.14,148.55,127.84,347.8r
313.8294.5451.6
231.5461.4
362. 6r
432.2306.6
652.1
331.6
1,116.3659.9844.4708
1,0662,1171,0691,4592,0562,541.82,633.62,141.02,985.22,685.73,770.14,392.25,016. Or
319.3502.6474.1
270.7516.4316. 6r
292.5
366.7
613.2
281.5
-334.2-89.1-192.2
75.2
944.4-584.3314.9-11.5
U9.3685.2156.4HI.
8
-2.71,124.4
378.4735.7
-668.2r
-5.5-208.1-22.5
-39.2-55.146. Or
139.7-60.1
38.9
50.2
Note: Excludes transactions in noninarketable U. S. Treasury notes,foreign series, and U. S. Treasury bonds, foreign currency series.
See "International Financial Statistics," Table 2.
1/ Through 1949 includes transactions in corporate bonds.
2/ Through 1949 included with transactions in U. S. Government bondsand notes. p Preliminary. r Revised.
Table 4.- Purchases and Sales of Long-Term Foreign Securities by Foreigners
(In millions of dollars; negative figures indicate a net outflow of capital from the United States)
Calendar year
or month
Foreign bonds
Purchases SalesNetpurchases
Foreign stocks
Purchases SalesNet
purchases
Totalpurchases
Totalsales
Net purchasesof foreignsecurities
1946194719481949195019511952
1953195419551956195719581959196019611962
1962- JulyAugust . . .
.
September.
October...November.
.
December.
.
1963-January. .,
February.
.
March p. .
.
April p. .
.
755.9658.7211321589500495542792
693606699.0889.0945.6882.9801.9
1,093.3
64.350.1
43.5
250.870.559.6
56.061.584.3
119.0
490.4634.3291.4311.5710.2801.0677.4621.5841.3509.4991.5
1,392.01,915.11,457.61,445.01,262.42,037.3r
88.664.8
100.4
419.0201.1216. 6r
313.7214.2170.6
179.0
265.524.5-79.8
9.8-121.0-300.6-182.1-79.0-48.8183.9
-385.0-693.1
-1,026.1-512.0-562.1-460.4
-944. Or
-24.4-14.7-56.8
-168.2-130.7-157.0r
-257.7-152.7-86.3
-60.1
65.257.181.788.3
173.8272.3293.9310.1393.3663.6749.2592.8467.2566.1509.1595.7702.0
47.948.343.9
58.269.461.3
58.050.260.2
66.1
65.642.696.770.8
198.2348.7329.6303.464A.9877.9875.2621.9803.7803.8591.7965.6805. 9r
38. 3r
64.339.5
41. Ir
47.560.9
73.2
-.414.6
-15.018.0
-24.4-76.4-35.8
6.8-251.6
-2U.3-126.1-29.1-336.4-237.7-82.6-370.0-103.9r
9.ir-16.0
4.4
17. Ir
21.8.5
-1.1-8.9
-11.9
-7.2
821.2715.9293.3410.1763.0772.7789.1852.7
1,185.81,356.91,355.71,291.81,356.21,511.71,392.01,397.61,795.3
112.298.387.5
309.0139.8120.9
IM.O111.7144.6
185.0
556.1676.8388.2382.3908.4
1,149.71,007.0924.9
1,486.11,387.31,866.82,014.02,718.82,261.52,036.72,228.02,843.2r
126. 9r129.1139.8
460. Or248.7277.4r
372.8273.3242.8
252.2
265.139.0
-94.827.8
-U5.4-377.0-217.9-72.2-300.4-30.4-511.1-722.1
-1,362.5-749.7-644.7-830.4-l,047.9r
-14. 7r-30.8-52.4
-151. Ir
-108.9-156. 5r
-258.8-161.6-98.2
-67.2
Preliminary.

June 196J 83
CAPITAL MOVMEIJTS ,
Section II - Summary by CountriesTable 1.- Short-Term Banking Liabilities to Foreigners
(Position at end of period 3-. •'•; ilions of dollars)
CountryCalendar year
1959 1960 1961 1962
1962
October November December
1963
January February March p April p
Europe:
AustriaBelgiumCzechoslovakiaDenmarkFinlandFranceGermany, Federal Republic of
GreeceItalyNetherlandsNorvayPolandPortugalRumaniaSpainSwedenSwitzerlandTurkeyU.S.S.R
331. -1
138.1.7
136.570.9
655.31,987.3
186.31,370.3485.295.54.0
137.5.9
86.1212.5969.3
United KingdomYugoslaviaRegional organizations l/.
Other Europe 1/
Total Europe
30.
2.
989.
6.
575.7
8,472.6
2,198.0
Latin America:
ArgentinaBoliviaBrazilChileColombiaCubaDominican RepublicGuatemalaMexicoNetherlands Antilles andSurinam
Panama, Republic of
PeruEl SalvadorUruguayVenezuelaRegional organizations 1/ 2/Other Latin America 1/
Total Latin America j/Asia:
336.824.4150.7184.5216.8163.836.937.1
442.4
87.8129.282.228.061.5276.9
U8.3
2,407.5
China MainlandHong KongIndiaIndonesiaIranIsraelJapanKorea , Republic of
.
PhilippinesTaiwanThailand,Other Asia
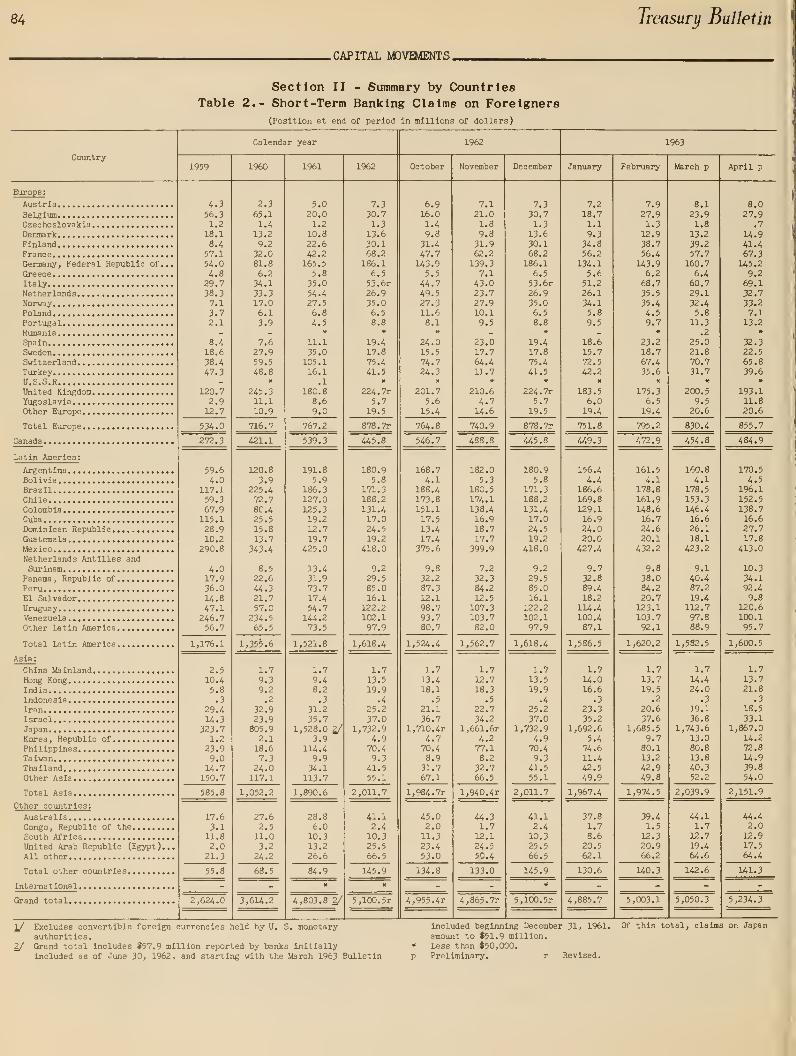
84 Treasury Bulletin
.CAPITAL MOVEMENTS.
Table 2.-
Section II - Summary by CountriesShort-Term Banking Claims on Foreigners

June 196J 85
CAPITAL MOVBffiNTS
.
Section II - Summary by CountriesTable 3.- Net Transactions In Long-Term Domestic Securities by Foreigners
(In thousands of dollars; negative figures Indicate net sales by foreigners or a net outflow of capital from the United States)
Country
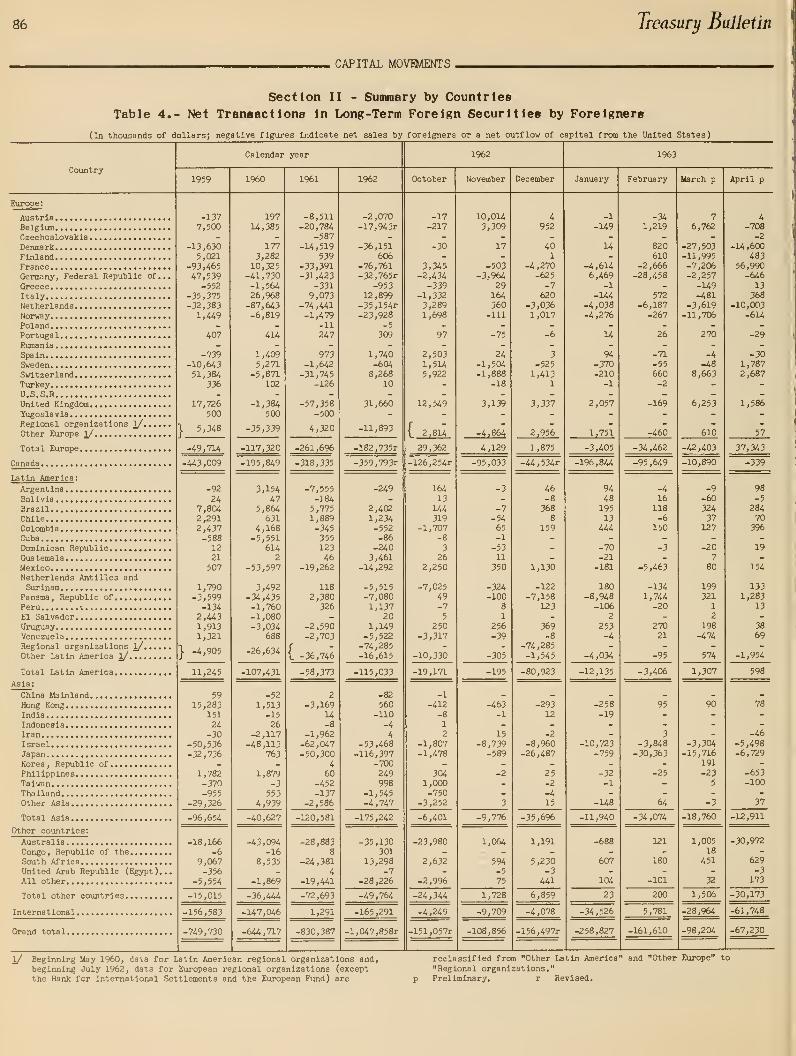
86 Treasury Bulletin
CAPITAL MOVEMENTS .
Section II - Sunmiary by Countries
Table 4,- Net Transactions In Long-Term Foreign Securities by Foreigners
(in thousands of dollars; negative figures indicate net sales by foreigners or a net outflow of capital from the United States)

June 196J 87
«_ CAPITAL MDVQiENTS.
Section III - Preliminary Detallp by CountriesTable 1.- Short-Term Banking Liabilities To Forelgnere &b of April 30, 1963
(Position In thousands of dollars)
Country
Europe:
AustriaBelgiumCzechoslovakiaDenmarkFinlandFranceGermany, Federal Republic of
GreeceItalyNetherlandsNorway ,
PolandPortugalRumaniaSpa inSwedenSwitzerlandTurkeyU.S.S.RUnited KingdomYugoslaviaRegional organizations l/...Other Europe
Total Europe
Canada
Latin America :
ArgentinaBoliviaBrazilChileColombiaCubaDominican RepublicGuatemalaMexicoNetherlands Antilles andSurinam
Panama , Republic of
PeruEl SalvadorUruguayVenezuelaRegional organizationsOther Latin America
Total Latin America
Asia :
China MainlandHong KongIndia
IndonesiaIranIsrael..JapanKorea, Republic of
PhilippinesTa iwanThailandOther Asia
Total Asia
Other countries:
Australia.....Congo, Republic of theSouth AfricaUnited Arab Republic (Egypt)
All other
Total other countries
International
Grand total
Totalshort-termliabilities
276,440208,304
1,15469,09269,615
1,432,9892,455,890
170,8131,120,569284,580131,17^9,860
158,6031,444
169,268480,311751,40620,6912,548
2,064,61210,98118,308
206,310
10,114,967
3,226,488
307,71021,208198,280117,193162,64814,61847,36874,757
639,251
94,203103,286109,71548,58990,866505,312150,797339,901
3,025,702
35,03965,93339,51232,60149,44595,277
2,245,881108,421176,32092,280367,837313,399
3,621,945
U9,37431,69140,19318,784236,374
476,416
4,847,491
25,313,009
Short-term liabilities payable in dollars
To foreign banks and official Institutions
Total
274,116177,486
730
61,93768,059
1,382,2132,413,152
153,3851,094,404263,498102,160
9,544109,757
830137,352468,971602,61418,9762,282
1,523,40110,38518,308
195,010
9,088,570
2,968,995
180,4833,591
116,36836,52171,5721,440
28,33259,470
412,808
42,75215,09136,70632,97631,416
228,933150,797200,152
1,649,413
29,71831,07832,41129,47840,85589,455
2,222,307107,374150,42385,006364,824275,026
3,457,955
144,08630,20136,32917,859
198,027
426,502
4,847,038
22,438,473
Deposits
221,865119,087
62346,10545,027221,369315,90778,956
257,89698,14060,1508,423
101,972617
119,455112,931254,02318,7602,136
1,081,0388,551
15,44149,528
3,238,000
1,590,190
136,9063,556
106,64934,97968,9231,440
24,40319,925211,914
24,39013,88936,46810,78927,084228,61520,697150,623
1,121,250
29,63326,61722,70317,37813,85056,302
1,3M,494104,695140,22870,512167,746200,732
2,164,890
52,39824,12333,16014,661155,024
279,366
530,390
8,924,086
U. S.
Treasurybills andcertif-icates
47,00050,394
14,70016,900
1,072,1361,786,409
33,000694,675154,94023,611
16,000344,500130,238
386,688
76,410
4,847,601
1,361,575
42,355
75
100
28,300108,800
13,517
16,400
1,60010,725
221,872
85
5,10012,10027,0008,886
721,650
82510
191,32933,349
1,000,334
80,8503,1003,0001,220
26,640
114,810
4,309,639
11,855,831
Other
5,2518,005
1071,1326,13288,708310,83641,429141,83310,41818,3991,1217,785213
1,89711,540
218,353216146
55,6751,8342,86769,072
1,002,969
17,230
1,22735
9,6441,5422,549
3,92911,24592,094
4,8451,202238
5,7874,332
318128,50038,804
To all other foreigners
Total
306,291
4,4614,608
5
24,267186,1632,6799,37014,4845,749
40,945
292,731
10,8382,978
1691,978
16,363
32,326
7,009
1,658,556
2,30829,957
4247,1171,556
48,60240,35317,41126,03018,43328,878
316
48,845614
31,88411,271
117,3741,715266
487,032596
10,080
931,062
247,616
126,40517,61281,84780,66591,07613,17819,03615,287
226,153
51,42087,82572,83315,61359,402
276,378
135,901
1,370,631
5,32134,7936,8503,1238,5805,822
23,4971,047
25,8927,2743,013
37,663
162,875
4,2651,4902,251
76337,210
45,979
453
2,758,616
1/ Excludes the Bank for International Settlements and the European
Fund, which remain classified with "Other Europe."
Deposits
2,30224,386
3606,5051,556
41,49435,60817,41123,40813,17527,916
29348,415
61430,13410,13979,4881,695266
143,222596
9,225
518,208
165,531
123,18217,50281,02179,94988,50313,08318,831
U,932219,652
32,02572,05071,127U,60354,535
274,899
121,676
1,297,620
5,321
33,5486,8253,1238,5805,659
23,4361,047
25,5057,2593,013
37,489
160,805
4,1901,3902,249
763
35,897
44,489
353
2,187,006
U. S.
Trea surybills andcertif-icates
533
423
3,2401,615
2,2441,281
76623124
1271,110
16,058
42,337
120
70,001
63,353
126101107135112
9571
1,411
2,42698941
1,340lU
5,010
12,078
209
2015
20115
460
75
100
175
146,067
6
5,03864189
3,8683,130
378
3,977196
306
1,62322
21,82820
301,473
735
Short-termliabilitiespayablein
foreigncurrencies
342,853
18,732
3,0979
719581
2,461
134305
5,090
16,96914,7861,6651,0103,5271,365
9,215
60,933
1,03625
14346
186
174
1,610
2
1,313
1

88 Treasury Bulletin
.CAPITAL MOVEMENTS
Section III - Preliminary Details by Countries
Table 2.- Short-Term Banking Claims on Foreigners as of April 30, 1963 1/
(Position in thousands of aollars)
Country
Totalshort-termclaims
Short-term claims payable in dollars
Loans to:
Foreignbanks andofficialinstitutions
Other
Collectionsoutstandingfor ownaccount anddomesticcustomers
Other
Short-term claims payablein foreign currencies
Total
Deposits of re-porting banksand domesticcustomers withforeigners
Europe:
AustriaBelgiumCzechoslovakiaDenmarkFinlandFranceGermany, Federal Republic of
GreeceItalyNetherlandsNorwayPolandPortuga 1
RumaniaSpain ,
SwedenSwitzerlandTurkeyU.S.S.RUnited KingdomYugoslaviaOther Europe
Total Europe
Canada ,
Latin America:
Argent Ina ,
Bolivia ,
BrazilChile ,
ColombiaCubaDominican RepublicGuatemala ,
MexicoNetherlands Antilles and Surinam,Panama, Republic of
Peru,
El Salvador,
Uruguay ,
Venezuela ,
Other Latin America,,, ,
Total Latin America ,
Asia:
China MainlandHong Kong ,
India ,
IndonesiaIran
,
IsraelJapanKorea , Republic of
PhilippinesTaiwanTha HandOther Asia
Total Asia
Other countries:
AustraliaCongo, Republic of theSouth AfricaUnited Arab Republic (Egypt),.,.All other
Total other coxmtrles
International
Grand total
7,95827,901
726
14,88741,44167,333145,1509,190
69,14032,69533,1677,126
13,2236
32,28222,51365,79139,644
46193,11611,79320,611
855,739
484,908
170,4944,538
196,107152,541138,68516,57627,66317,841
412,96010,282
34,14992,3989,787
120,619100,07695,741
1,600,457
1,72213,68521,771
27818,52533,148
1,867,03614,15772,83214,92139,84254,013
2,151,930
44,4271,983
12,91717,49464,449
141,270
5,234,304
7,70721,351
726
14,16141,35056,018
126,5499,14866,72123,47532,2567,126
13,0866
31,39517,91047,52639,639
4664,71111,77520,118
652,800
282,570
132,1984,538
140,102147,939138,50316,54327,66317,816
403,94610,281
34,U792,3559,731
120,61698,37895,522
1,490,328
1,71713,65321,339
27718,52533,U3
1,819,88;-
14,15772,70014,92139,84253,449
2,103,606
30,6791,983
12,59717,10163,652
126,012
4,655,316
3,3693,350
6942,769
3074,88038,5242,21819,1655,0724,962
3
4,458
5,676735
13,70236,322
3320,5168,9361,473
177,164
10,254
17,682631
38,17025,54643,497
3,9434,687
147,118
436,1167,934
9613,60516,41514,236
339,769
1,7094,1384,710
63
3,2264,1U
424,87011
45,2392,5037,897
18,226
516,706
1,788121311
4,40010,947
17,567
1,061,460
7081,270
431369
13,03630,434
861
5,742422
1,205
307
9,455116
17,242309
3,25353
11,193
101,411
147,014
30,933176
60,12123,66327,555
816200
1,10296,5936,66713,40414,7101,4173,459
13,10121,845
315,762
2,531534
204,18864,901
8,490449797
5,200
87,160
4,0011
1,4231
28,815
34,241
685,533
2,03112,329
32
4,3401,75416,28026,8116,03817,60815,7842,008
1482,211
6
3,0936,6667,1933,008
13
17,243395
3,014
148,005
6,437
45,4703,098
25,97826,54223,41015,72213,7867,349
35,1713,5657,04130,4325,6316,530
50,16933,560
333,454
8
5,6313,1742U
13,9033,838
186,06512,4005,7762,7977,290
24,704
270,300
12,3921,8619,7771,237
17,840
43,107
801,803
1,5994,402
6,62138,92021,82230,780
31
24,2062,197
24,0816,9756,110
13,17110,3939,389
18,6992,3914,433
226,220
113,365
33,113633
15,83372,18844,041
5
9,7344,678
125,0646
7,58639,2792,637
97,02218,69325,831
501,343
1,3037,921
1,37621,003
1,144,0471,74613,1959,172
23,8535,319
1,228,940
12,498
1,03611,4636,050
31,097
2,106,465
2516,550
72691
11,31518,601
422,4199,220
911
137
3374,60318,265
5
123,40518
493
202,939
202,333
38,296
56,0054,602
132
33
259,014
1
2
436
3
1,693219
110,129
5
32
4321
5
47,153
132
564
48,324
13,748
320393797
15,253
578,938
2506,532
72691
9,54813,954
38
2,3349,199
911
137
3304,60114,159
5
112,72718
407
176,517
55,511
38,236
55,7724,385
2219
1,172
19
3
1,22184
100,933
5
17408
5
45,460
129
468
46,492
3,003
221190259
3
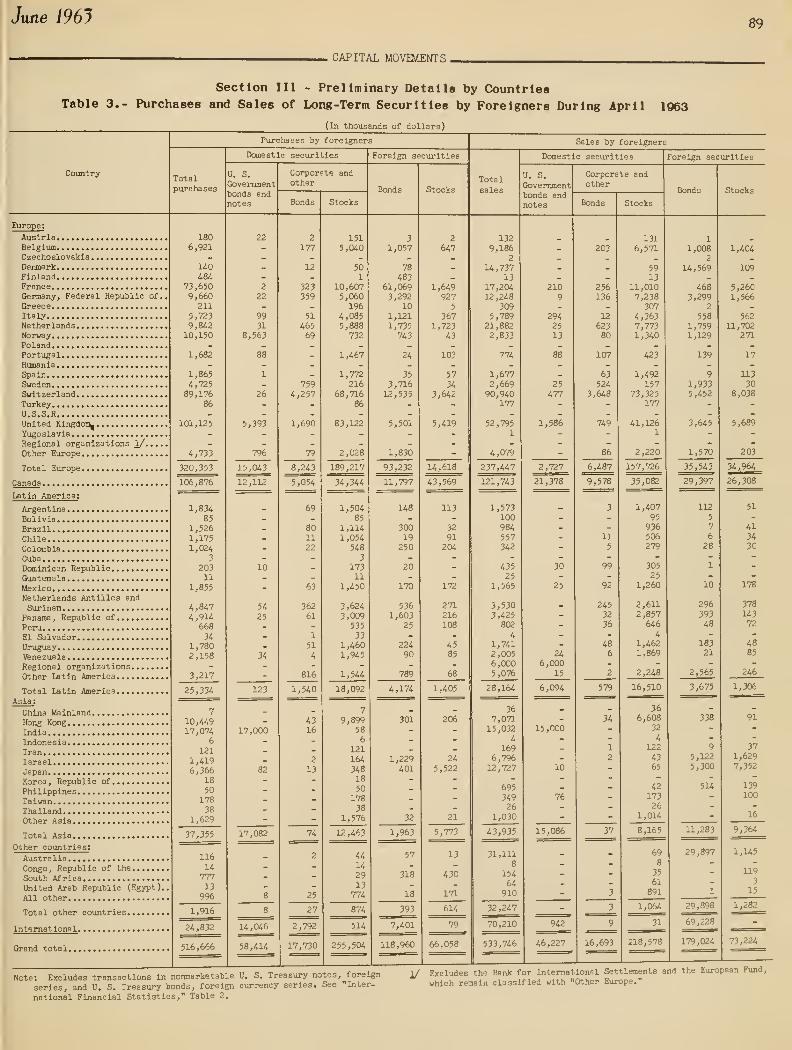
June 196J 89
CAPITAL MOVEMENTS
,
Section III - Preliminary Details by CountriesTable 3.- Purchases and Sales of Long-Term Securities by Foreigners During April 1963
(In thousands of dollars)

90 Treasury Bulletin
CAPITAL MOVEMENTS
,
Section IV - Supplementary Data by Countries
Table 2.- Long-Termi/Llabil It les to and Claims on Foreigners Reported by Banks and Bankers
(Position at end of period in thousands of dollars)
Country
Liabilities to foreigners
1962
March June September December
1963
March p
Claims on foreigners
1962
March June September December
Europe:
Austria ,
Belgium ,
DenmarkFinlandFrance ,
Germany, Federal Republic of
Greece ,
ItalyNetherlands ,
Norway ,
Poland ,
Portugal ,
Spain ,
Sweden ,
Switzerland ,
TurkeyUnited KingdomYugoslaviaOther Europe ,
Total Europe
Canada
Latin America:
ArgentinaBoliviaBrazilChile ,
Colombia
Cuba ,
Dominican RepublicGuatema la
MexicoNetherlands Antillesand Surinam
Panama , Republic of
PeruEl SalvadorUruguayVenezuelaOther Latin America ,
Total Latin America
Asia:
Hong KongIndia
,
IndonesiaIranIsrael
JapanKoreaPhilippinesTaiwan
ThailandOther Asia
Total Asia
Other countries:
AustraliaCongo, Republic of theSouth Africa ,
United Arab Republic (Egypt),
All other
Total other countries
Grand total
877
200
1,077
17
381
75
518
62
62
1,664
18
4,000
18
412
430
1,012
5,030
35
4,004
4,039
17
322 265 165
6380
4656
4755
483 385 285
921 5,423 4,333
4,004
300
4,304
17
192
471,052
1,309
10
10
5,623
43,66438,7117,4923,870
14,456
73,5366,84128,00745,881172,241
3,717846
47,9199,737
57
12,Kl2,0983,326
514,540
289,899
73,41036
272,99725,21437,823
885
11,826164,467
17,696
21,63811,304
355483
250,88882,465
971,487
2,40317,60051,45012,05421,740
30,550
62,343730
3,3542,383
204,607
37,50138,87848,0592,520
45,629
172,587
2,153,120
54,5759,1897,3333,733
24,229
70,1686,69130,24743,194179,070
23,6167,203
45,72210,303
57
12,2251,7741,593
530,922
290,859
69,24436
264,72520,56761,787
885
8,556185,588
7,900
17,86113,229
344951
225,63883,805
961,116
2,65719,24054,90011,19326,521
48,8105
61,208992
3,5449,928
238,998
45,69138,75328,8872,37051,902
167,603
2,189,498
57,1367,763
10,0459,019
20,635
72,1629,972
28,5638,135
189,275
1,00024,1398,699
43,29115,777
5725,9251,720
776
534,089
295,563
69,21250
265,47225,08969,295
884216
9,070208,690
7,631
20,56013,573
372633
224,70373,237
988,687
2,71018,987
11,46328,161
53,8123
61,505884
3,2009,887
190,612
46,16240,00329,1521,595
58,314
175,226
2,184,177
65,42111,76610,02412,93124,496
80,28513,44931,6381,061
201,877
26,59910,24139,09417,563
5725,1861,1194,788
577,595
303,623
61,97478
253,12918,50764,313
884216
9,070194,903
7,524
21,46313,322
4331,504
166,93771,694
885,951
2,99215,030
8,98627,683
74,3433
70,400630
3,61618,403
222,086
43,76035,00323,8741,595
57,544
161,776
2,151,031
l/ Having a maturity of more than one year from date of Issuance;excluding long-term securities,
p Preliminary.

June 196JUU'll^ I. ^ \J
^

92 Ireasury bulletin
. COEPORATIONS AND CERTAIN OTHER BUSHJESS-TTFE ACTIVITIES.
The current financial statements of corporations and
certain other business-type activities of the United States
Government which appear In the "Treasury Bulletin" beginning
with the August 195^ issue are compiled from reports sub-
cltted to the Treasury under Department Circular No. 966,
issued January 3O1 1956> and Supplement No. 1, issued June
1, 1956. The regulations so Issued are pursuant to Section
llU of the Budget and Accounting Procedures Act of 1550
(31 U.3.C. 66b), and represent another step in the program
of comprehensive and Integrated Grovernraent accounting and
financial reporting for which authority was provided in
that act. They supersede Budget-Treasury Regulation No. 3i
Issued under Executive Order No. S512 of August I3, 19'^0,
as amended by Executive Order No. ^OSk of March 3, 15^2,
under which financial statements previously published in
the Bulletin were submitted.
In coverage, Department Circular No. 966 requires
subfflieslon of financial statements by all wholly owned and
mixed-ownership Government corporations specifically in-
cluded in the Government Corporation Control Act, as amended
(31 U.3.C. S^lS, 256); and all other activities of the Gov-
ernment operating as revolving funds for which business-
type public enterprise or intragovemmental fund budgets
are required by the Bureau of the Budget. Other activities
and agencies whose operations, services, or functions are
largely self-liquidating or primarily of a revenue-pro-
ducing nature, and activities and agencies whose operations
result in the accumulation of substantial Inventories, in-
vestments and other recoverable assets, may be brought
under the regulations as agenoy accounting systems are
developed to the point where they are capable of furnish-
ing the financial reports required.
Four kinds of financial statements are called for by
Department Circular No. 966. They are statements of finan-
cial condition, incoine and expense, source and application
of funds, and certain commitments and contingencies. The
statements of financial condition are published qujirterly
and appear as Section I in the series o" tables. The first
cata under the new regulations are for March 3I. 195^. and
were presented In the August 195^ Bulletin. Statements of
Income and expense and source and application of funds are
published semlannuEilly, for June 30 and December Jl report-
ing dates, and appear as Sections II and III. The first of
these statements under the new regulations cover the fiscal
year 195^, and was publlphed in the January 1957 Bulletin.
Within the sections, the agencies are grouped in separate
tables by type, as follows: public enterprise revolving
funds, intragovemmental revolving funds, certain other
activities, deposit funds, and trust revolving funds.
Supplement No. 1 added to the coverage by including
all executive agencies and activities not reporting under
Department Circular No. 966, but required only a statement
of financial condition annually as of June 30« These are
mainly not business-type activities, and those which had
not yet developed formal accounting procedures to provide
complete balance sheet types of statements were authorized
temporarily to report only the asset side. Thus the sup-
plement rounds out provision for the Information on prop-
erties and assets of the United States Government which the
Treasury has been asked to furnish to the Committee on
Government Operations, House of Representatives, for a
continuing study of the assets of the Government. The first
comprehensive reporting under Supplement No. 1 Is for June
30. 1957. and the data were published in the December 1957
issue of the Bulletin as Part B of Table U in Section I.
A summary of loans outstanding for a series of dates
is Included In Section I of the Bulletin presentation be-
ginning with the June I95S Issue. Two classifications of
the loans are shown, one by type and one by agency. Data
prior to 1956 are based on the earlier reporting require-
ments, which provided for complete coverage of Government
lending agencies.

June 1961 93
CORPORATIONS AND CERTAIN OTHER BUSINESS-TYPE ACTIVITIES.
Section I - Statements of Financial ConditionTable 1.- Summary by Specified Classes of Activities, March 31, 1963
(in thousands of dollars)
TotalPublic enterpriserevolving funds(See Table 2)
Intragovemmentalrevolving funds
(See Table 3)
Certain otheractivities(See Table i)
ASSETSCash in banks, on hand, and in transit...Fund balances with the U. S. Treasury l/.
Investments:Public debt securities (par value)Securities of Government enterprises...Unamortized premium, or discount (-).,.Other securities. ......................
Advances to contractors and agents:Government agencies.. ..................Other
Accounts and notes receivable:Government agencies. ...••..••.•.••...••Other (net )
InventoriesAllowance for losses (-)
Accrued interest receivable:
On public debt securitiesOn securities of Government enterprisesOther
Loans receivable:Government agencies*. ..................Other: U. S. dollar loans
Foreign currency loans- ........
.
Allowance for losses (-)....,..Acquired security or collateral (net)....
Land, structures, and equipment..........Accumulated depreciation (-)
Foreign currencies*. •..•........•..**.•.•Other assets (net ).. *.*•..*.*....* .......
Total assets* *..*••*•.*.*••••.«••.******.
LIABILITIES
Accounts payable:Government agencies. ••***..•••*......**Other
Accrued liabilities:Government agencies... *
OtherAdvances from:
Government agencies* ...................Other
Trust and deposit liabilities:Government agencies. .....*.............Other
Bonds, debentures, and notes payable:
Government agencies. .*..*..............Other: Guaranteed by the U. S .*,..
Not guaranteed by the U. S......
Other liabilities (including reserves)...
Total liabilities
WET INVESTMENT
United States interest:Interest-bearing investment:
Capital stock ...•.........••*•*.Borrowings from the U. S. Treasury...
OtherNoninterest-bearing Investment:
Capital stockAppropriations* ......**..*........•*•Capitalization of assets (net)*.**-..
OtherAccumulated net income, or deficit (-),
Deposits of general and special fund
revenues (-)* **.***.,**..*......
Total United States interest
Total liabilities and investment
ANALYSIS OF UNITED STATES INVEgTMENfr
United States investment.***.........*...Accumulated net income, or deficit (-)..*
U. S. investment incl. interagency items.
Interagency items:
Due from Government agencies (-)
Due to Government agencies .*.**
U. S. investment excl. interagency items.
U5,99413,109,479
1,481,317HO, 703-10,159
5,639,653
U,45645,724
1,614,0292,510,30120,872,350-1,132,545
13,452
455,641551,407
36,71026,082,0413,488,246-371 ,649878,074
12,961,905-2,563,940
943,5902,927,441
89,834,220
461,546826,836
483,638456,076
105,87913,974
640,930176,979
161,115367,510145,015,936,180
6,775,678
100,00028,783,4471,141,512
1,048,50038,151,5097,445,93519,427,910
-10,513,102
-2 , 527,170
83,058,542
89,834,220
93,571,645-10,513,102
83,058,542
-2,261,5401,853,109
82,650,111
143,9976,170,764
1,476,180140,703-10,159238,639
201
5,188
740,558295,565
6,311,073-1,132,407
13,4321,131
142,842
33,50016,615,680
888,788-359,812877,968
5,059,465-1,563,469
2,9491,438,995
37,531,769 2,/
73,038429,217
437,093121,214
7131,068
603,566144,902
161,115367,510145,015
2,525,066
5,009,516
100,00023,843,6791,141,512
1,048,50012,244,156
1 ,789,720463,241
-7,994,484
-114,070
32,522,253
37,531,769"
40,516,737-7,994,484
32,522,253
-916,0931,275,525
32,881,685
641
1,189,593
26528,089
844,39887,472
7,382,605-137
Footnotes at end of Table 8.
545,843-244,749
118,571
9,952,591
365,791346,182
603131,659
85,09412,905
2,988210
284,164
1,229,598
664,704288,081
7,690,05380 , 1 56
8,722,994
9,952,591
8,642,83880,156
8,722,994
-844,664454,476
8,332,836
1,3565,749,122
5,137
5,401,015
13,99012,447
29,0732,127,2647,178,672
20
454,510408,565
3,2109,466,3612,599,458
-11,837106
7,356,597-755,722
940,6411,369,875
42,349,860 2/
22,71751,436
45,941203,202
20,072
34,37731 ,868
126,950
536,564
4,939,768
25,242,6505,368,13411,274,616-2,598,774
-2,413,099
41,813,296
42,349,860
U, 412,070
-2,598,774
41,813,296
-500,783123,107
41,435,620

94 Treasury Bulletin
CORPORATIONS AND CERTAIN OTHER BUSINESS-TICPE ACTIVITIES.
Section I - Statements of Financial ConditionTable 2.- Public Enterprise Revolving Funds, March 31, 1963
(In thousands of dollars)

Jane 196J 95
CORPORATIONS AND CERTAIN OTHER BUSINESS-TTfPE ACTIVITIES.
Section I - Statements of Financial CondTable 2.- Public Enterprise Revolving Funds, March 31,
(In thousands of dollars)
itlon
1063 - (Continued
I
Account
Agriculture Department - (Continued)
Fanners' Home Administration
Directloanaccount
Emergencycreditrevolvingfund
Agriculturalcreditinsurancefund
Expansionof defenseproduction
Commerce Department
Aviationwar riskinsurancerevolvingfund
AreaRedevelopnentAdministration
Arearedevelopcnent
fund
InlandWaterwaysCorporation(mliquidation)
ASSETSCash in banks, on hand, and in transit...
Fund balances with the U. S. Treasury 2/.
Investments:Public debt securities (par value).....
Securities of Government enterprises...
Unamortized premium, or discount (-)...
Other securitiesAdvances to contractors and agents:
Government agencies.. ..................Other
Accounts and notes receivable:
Government agencies. ..•.........••.•..•Other (net)
Inventories ..•..•.....•••.•••....•.•..•.•Allovrance for losses (-)
Accrued interest receivable:
On public debt securities.
On securities of Government enterprises
OtherLoans receivable:Government agencies •........•..•.
Other: U. S. dollar loans
Foreign currency loans.. .....••
Allowance for losses (-)
Acquired security or collateral (net)...
Land, structures, and equipment....... ••
Accumulated depreciation (-)
Foreign currenciesOther assets (net ).......... ........>•••
Total assets...... ........••..•••••••••••
LIABILITIES
Accounts payable:
Government agencies. . ..................
OtherAccrued liabilities:
Government agencies. •.«••••••.•*•••••••Other
Advances from:Government agencies. ...................
OtherTrust and deposit liabilities:
Government agencies. .............•...*•
OtherBonds, debentures, and notes payable:
Government agencies ••
Other: Guaranteed by the U. S
Not guaranteed by the U. S
Other liabilities (including reserves)...
Total liabilities
NET INVESTMENT
United States Interest:Interest-bearing investment:
Capita 1 stockBorrowings from the U. S. Treasury...
OtherNoninterest-bearing investment:
Capital stockAppropriations. . ..,...........-..•••'
Capitalization of assets (net)
Other '"/*VAccumulated net income, or deficit (-).
Deposits of general and special fund
revenues (-)..........-.....•.•.-••••
Total United States interest
Total liabilities and investment
ANALYSIS OF UNITED STATES INVESTMEOT
United States Investment....Accxmiulated net Income, or deficit (-).-.
U. S. investment Inol. interagency items.
Interagency Items:
Due from Government agencies (-).......
Due to GoveiTiment agencies.............
U. S. investment excl. interagency items.
Footnotes at end of Table 8.
234,756
1,57020
24,039
905,686
-89,286
48i91
538
1,077,899
2,5371
2,558
597,960
456,079
21,302
1,075,340
1,077,899
1,054,03821 ,302
1,075,340
-1,570
2,537
1 ,076,307
47,022
10
165
2,702
83,698
-16,510
335
197
117,619
11
141
153
205,494364
-88,392
117,466
117,619
205,858-88,392
117,466
-10
11
117,467
3,640
1,108963
365
47,342
300
27
53,745
1,034
203
1U
2.244
3,625 6/
36,970
1,000
12,150
50,120
53,745
37,97012,150
50,120
-1 ,108
203
49,215
476
9,517
27
82
11,667
9,517
66,055
-75,572
12,224
212
72
284
-9,517
66,055-75,572
-9,517
9,517
27
27
27
11,743
197
1 1 ,940
12,224
11,743197
1 1 ,940
212
12,152
(Continued on following page)
2,040
131
4,375
6,547
47
48
7,500
12,298
-13,299
6,499
6,547
19,798-13,299
6,499
6,499

96 Treasury Bulletin
CORPORATIONS AND CERTAIN OTHER BUSINESS-TYPE ACTIVITIES,
Section I * Statements of Financial ConditionTable 2.- Public Enterprise Revolving Funds, March 31, 1963
(in thousands of dollars)
(Continued)
Conmierce Department - (Continued)
Maritime Administration
Federal shipmortgageinsurancefund
Vesseloperationsrevolvingfund
War riskinsurancerevolvingfund
Defense Department
Air ForceDepartment
ArmyDepartment
Defense production guaranties
Navy Department
Laundryservice,NavalAcademy
Defenseproductionguaranties
ASSETSCash in banks, on hand, and in transit,..Fund balances vrLth the U. S. Treasury 2/,Investments:Public debt securities (par value),,...Securities of Government enterprises,,,Ifiiamortized premium, or discount (-),.,
Other securities ,.. .,,..,.•,Advances to contractors and agents:
Government agencies.,,.,,... ,
OtherAccQxints and notes receivable:
Government agencies,,,.,,.,..,,.,,.,.,.Other (net )
Inventories, ,,, .•,.•.,,. .,,.,.,,Allowance for losses (-). ..,,,....
Accrued interest receivable:On public debt securities ...,..,.On securities of Government enterprisesOther
Loans receivable:Government agencies .,.,..,Other: U, S. dollar loans.. , •.,.,.
Foreign currency loans,,,.,.. •••Allowance for losses (-)....•••»•••••
Acquired security or collateral (net).,..Land, structures, and equipment •••Accumulated depreciation (-).,••.•••.,,
Foreign currencies •••,.•••Other assets (net ),.... •.,.,,.*,•., .,,•••
Total assets... •,•••..,.,....,•«.•• •••.,.
LIABILITIES
Accounts payable:Government agencies,.....,,. ..,.,.Other .,,
Accrued liabilities:Government agencies...,. •,.,•.,., •,••••Other
Advances from:Government agencies.,.,.., ••.••,. ••,««,Other
Trust and deposit liabilities:Government agencies....,., •,,••«. ••*•.,Other
Bonds, debentures, and notes payable:Government agenc ies ,....,,.,,... •
Other: Gxiaranteed by the U. S ..,,Not guaranteed by the U. S,,,.,,
Other liabilities (including reserves).,.
Total liabilities
Ngr INVKSTMEm'
United States interest:
Interest-bearing investment:Capital stockBorrowings from the U. S. Treasury.,,Other
Noninterest-bearing investment:Capital stock,.. .,,.Appropriations ,,,.., .,....,•., •••,.••Capitalization of assets (net)....,,.Other ,
Accumxilated net income, or deficit (-),
Deposits of general and special fundrevenues (-)...,,, ...•.,•..,••.••....,
Total United States interest.,..,....,.
Total liabilities and investment
ANALYSIS OF UNITED STATES INVESTMENTUnited States investment...... ,,.,.Accumulated net income, or deficit (-)..,
U, S, investment incl. Interagency Items,
Interagency items:Due from Government agencies (-),.,...•Due to Gbvernment agencies.,,,.....,..,
U, S. investment excl. interagency items.
Footnotes at end of Table 8.
16
689
2,719
28
3
6.795
6,795 6/
6,000
9,261
15,261
22,055
8877,738
158
3,19A1,1U2,726
3,50015,739

June 196J 97
CORPORATIONS AND CERTAIN OTHER BUSINESS-TYPE ACTIVITIES
,
Section I - Statements of Financial ConditionTable 2.- Public Enterprise Revolving Funds, March 31, 1963
(in thousands of dollars)
(Continued)
Defense Dept,-( Continued)
Office ofCivil Defense
Civil defenseprocurementfund
HEW Department
Public HealthService
Operation ofcommissaries,narcotichospitals
Social SecurityAdministration
Bureau ofFederal CreditUnions
Interior Department
Bureau of Indian Affairs
Revolvingfund forloans
Liquidationof Hoonahhousingproject
Office ofTerritories
Loans to
privatetradingenterprises
AlaskaRailroad
AlaskaRailroadrevolvingfund
ASSETSCash in banks, on hand, and in transit,,.
Fund balances with the U. S, Treasury 2/,
Investments:Public debt securities (par value),,.,.
Securities of Government enterprises.,.
Unamortized premium, or discount (-),,.
Other securities.. .....................Advances to contractors and agents:
Government agencies. ,,..«.Other
Accoxints and notes receivable:Government agencies. .,,.,,,,Other (net )
Inventories. ,
Allowance for losses (-)
Accrued interest receivable:
On public debt securitiesOn securities of Government enterprises
OtherLoans receivable:Government agencies, ...,,•,,,,,....>•..
Other: U. S. dollar loansForeign currency loans..,.....,.
Allowance for losses (-)
Acquired security or collateral (net)....
Land, structures, and equipment,,,.,.., ••
Accumulated depreciation (-)•,••«•••,•*Foreign currencies, , .,,•«,••,,,,,,,>,,•••Other assets (net). ..,. ..,
Total assets
LIABILITIES
Accounts payable:Govemment agenc ies,.,,,,,,,,,,,,,.,.,.Other
Accrued liabilities:Government agencies. ....,,,,,.,,,•,,,,,Other
Advances froiD:
Government agencies,,. ...,,, .....,•,,,,
OtherTrust and deposit liabilities:
Government agencies, .., ,,,,,.,
OtherBonds, debentures, and notes payable:
Government agenc ies ,..,•,,,,••.,,•••,«•Other: Guaranteed by the U. S.. ........
Not guaranteed by the U. S
Other liabilities (including reserves),,.
Total liabilities
HEI INVEglMElff
United States interest:
Interest-bearing investment:
Capital stock ..•,.,.,.,,,,.,•
Borrowings from the U. S, Treasury,..
OtherNoninterest-bearing investment:
Capital stock. .,,,,,,,. •>••
Appropriations, . ..,,......., •••*
Capitalization of assets (net)
OtherAccumxilated net Income, or deficit (-).
Deposits of general and special fund
revenues (-),,...,......,,,,.,,•••••••
Total United States Interest
Total liabilities and Investment
ANALYSIS OF UNITED STATES INVESTMEmUnited States investment,,,,,. ,.....••.•-
Accumulated net income, or deficit (-),--
U, S. investment incl. Interagency items.
Interagency items:Due from. Government agencies (-)
Due to Government agencies.,, ,,,,.
U. S. investment excl. Interagency items.
Footnotes at end of Table 8.
1,485
1,533
33
33
1,500
1,500
1,533
1,500
1,500
-8
1,492
45
10
21
26-22
82
20
10
2
50
62
82
12
50
62
63
681,621
16
273
275-142
2,120
27
175
227
352
781
1,339
1,340
2,120
1
,339
1,340
1,340
7,375
15,607
-2,480
20,502
21,799
2,774-4,071
20,502
20,502
24,573-4,071
20,502
20,502
(Continued on following page)
108 173
164
-148
135
187
361
240-105
135
135
240-105
135
135
333
28
361
361
33328
361
361
9,530
951
613
3,370
133,810-24,669
1,699
125,305
55
164
415
37660
-621.
1,764
167,28518,930
-63,7641,090
123,541
125,305
122,4511,090
123,541
-951
431
123,020

98
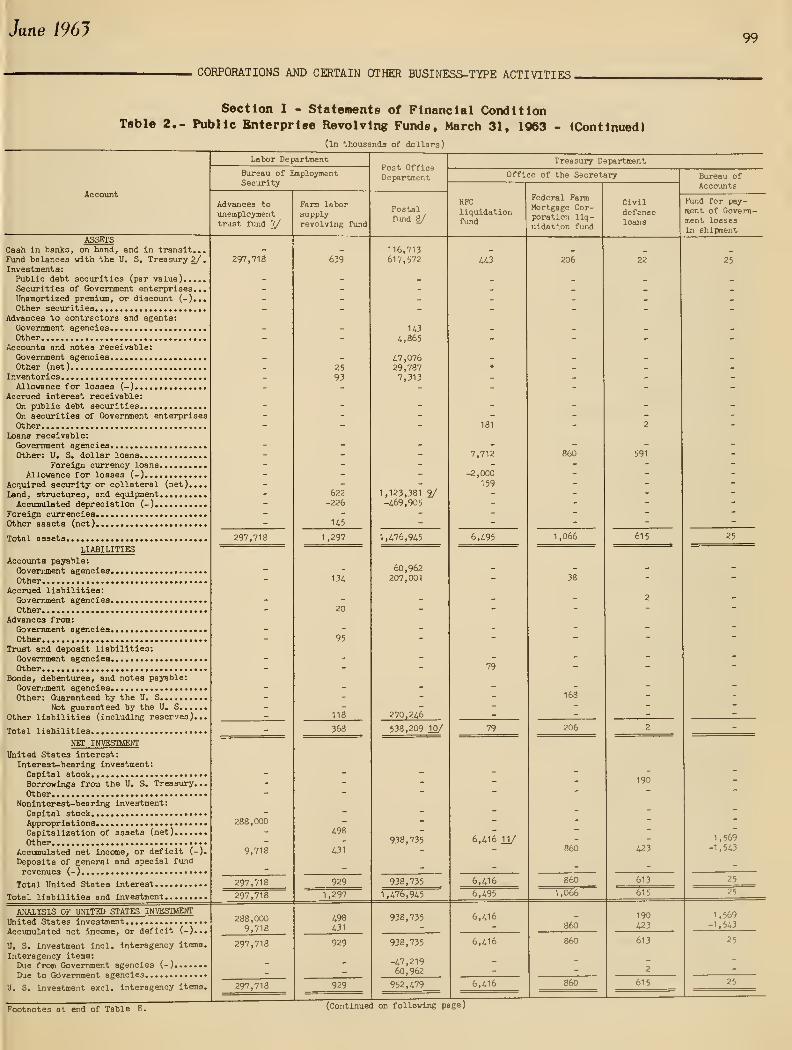
June 196J 99
CORPORATIONS AND CERTAIN OTHER BUSINESS-TYPE ACTIVITIES
,
Table 2.-
Section I - Statements of Financial ConditionPublic Enterprise Revolving Funds, March 31, 1063
(in thousands of dollars)
(Continued)
Account

100

June 1961101

102
or

Jane i96J 103
CORPORATIONS AND CERTAIN OTHER BUSINESS-TYPE ACTIVITIES
.
Section I - Stateaiente of Financial ConditionTable 2.- Public Enterprise Revolving Funds, March 31, 1963
(In thousands of dollars)
(Continued)
Account
Veterans' Administration - (Continued)
Soldiers'andsailors'civilrelief
Veterans'specialterminsurancefund
Vocationalrehabili-tationrevolvingfund
Export-Import Bank of Washington
Regularlendingactivities
Liquidation ofcertain Recon-structionFinance Corpo-ration assets
Expansionof defenseproduction
Farm Credit Administration
Short-termcreditinvestmentfund
Banks forcooperativesInvestmentfund
ASSETSCash in banks, on hand, and tn transit...Fund balances with the U. S, Treasury 2/.
Investments:Public debt securities (par value)Securities of Government enterprises...
Unamortized premium, or discount (-)...
Other securitiesAdvances to contractors and agents:
Government agencies •..
OtherAccounts and notes receivable:Government agencies... .................Other (net
)
Inventories..Allowance for losses (-).............-.
Accrued interest receivable:
On public debt securities
On securities of Government enterprises
OtherLoans receivable:Government agencies. ,...•.•...• *..
Other: U, S. dollar loansForeign currency loans .......•••
Allowance for losses (-)
Acquired security or collateral (net),...
Land, structures, and equipment. .........
Accumulated depreciation (-)...........
Foreign currencies......... ••••....•.•••-
Other assets (net)
Total assets.. •.•••
LIABILITIES
Accounts payable:Government agencies. .•••.•.•••.•••.•••«Other
Accrued liabilities:Government agencies....,*....Other
Advances from:
Government agencies............ -...••.•
OtherTrust and deposit liabilities:
Government agencies.Other
Bonds, debentures, and notes payable:
Government agencies.Other: Guaranteed by the U. S
Not guaranteed by the U, S
Other liabilities (including reserves)...
Total liabilities
NET INVESTMENT
United States interest:Interest-bearing investment:
Capital stock ....,......••-•
Borrowings from the U. S. Treasury...
Other • •
Noninterest-bearing investment:
Capital stock ..••....•• •<
Appropriations ...........-•---•-••-Capitalization of assets (net) ,
Other V'VAccumulated net income, or deficit (-),
Deposits of general and special fund
revenues (-)......-••.-••••"•••••••••
Total United States interest
Total liabilities and investment
ANALYSIS OF UNITED STATES INVEgTMENT
United States investmentAccumulated net income, or deficit (-)...
investment incl. interagency items.U. S.
Interagency items:
Due from Government agencies (-)....
Due to Government agencies
U. S. investment excl. interagency ite
O
2,003
-1,889
2,003-1,889
1U
1U
101,325
2,207
30
1,5^6
10
105,702
977
3,115
87,092
18,610
18,610
105,702
18

104 ireasury nuUetin
CORPORATIONS AND CERTAIN OTHER BUSINESS-TYPE ACTIVITIES,
Section I - Statements of Financial ConditionTable 2.- Public Enterprise Kevolving Funds, March 31, 1963
(in thousands of dollars)
(Continued)
Federal Home Loan Bank Board
Revolvingfund
Federal Sav-ings and LoanInsuranceCorporation
Home Owners'LoanCorporation(liquidated)
Panaina
CanalCompany
SaintLawrenceSeawayDevelopmentCorporation
SmallBusinessAdministration
Revolvingfund
TennesseeValleyAuthority
United StatesInformationAgency
Informationalmediaguaranty fund
ASSETSCash in banks, on hand, and In transit...Fund balances with the U. S. Treasury 2/,Investments:Public debt securities (par value).,,..Securities of Govemment enterprises,,.Unamortized premium, or discount (-),..
Other securitiesAdvances to contractors and agents:
Government agenciesOther
Accounts and notes receivable;Government agencies. •............•.•..•Other (net)
Inventories.,.. .•,••.••..•.•.•••••••Allowance for losses (-).,...
Accrued interest receivable:On public debt securities, ...••...On securities of Government enterprisesOther
Loans receivable:Government agencies. ,,
Other: U. S. dollar loans.........Foreign currency loans
Allowance for losses (-)........Acquired security or collateral (net),,..
Land, structures, and equipmentAccumulated depreciation (-)•.••••••...
Foreign currenc ies. .,....................Other assets (net )•...••.••••.•••••..•••
.
Total a ssets..., ••••.•.••••••. ...........
LIABILITIES
Accovmts payable:Government agencies,,.,,.,.,.,.........Other ,
Accrued liabilities:Government agencies, ..,.,............,«Other
Advances from:Government agencies, ,.,.... ,,,
OtherTrust and deposit liabilities:
Government agenc iesOther
Bonds, debentures, and notes payable:Government agencies. ,.
Other: Guaranteed by the U. S.,,,,Not guaranteed by the U, S
Other liabilities (including reserves).,.
Tota 1 liabilities
Ngr INVESTMENT
United States interest:Interest-bearing investment:Capital stock ...,,. ,.,,,,.,•Borrowings from the U, S, Treasury,.,Other
Noninterest-bearing investment:Capital stock. , •,•,.,,.,.,•, ,....,.••Appropriations .,••••••Capitalization of assets (net),....,.Other
Accumulated net income, or deficit (-).Deposits of general and special fundrevenues (-) .••.••.•..,.,,
Total United States interest..,.,,
Total liabilities and investment,.,,
ANALYSIS OF UNITED gTATES INVESn>ffiNT
United States investment.,,.,,,,.Acc'jmulated net income, or deficit (-)..,
U, S, investment incl. interagency items.Interagency items:Due from Government agencies (-)..Due to Government agencies...
U. S, investment excl, interagency items.
Footnotes at end of Table 8.
1,335
11
1,659
U
307
35
1,621
2,741
281
360703
669,094
-2 ,977
3
18,593
5,613
38,594
513

June 196J 105
. COKPORATIONS AND CKPTAIH OTHER BUSINESS-rYEE ADTIVTTIES.
Section I - Statements of Financial ConditionTable 3.- Intragovernmental Revolving Funds, March 31, 1963
(In thousands of dollars)
AccountTotal
LegislativeBranch
Governnient
PrintingOffice
Agency for
InternationalDevelopment
Acquisitionof propertyrevolvingfund
Agriculture Department
AgriculturalResearchService
Workingcapitalfund
ForestService
Workingcapitalfund
Workingcapitalfund
Commerce Dept.
NationalBureau ofStandards
Workingcapitalfund
ASSBISCash In banlEs, on hand, and In transit....yund balances with the U. S. Treasury 1/ .
.
InTestments:Public debt securities (par value)Securities of Government enterprises....Ubamortlzed premium, or discount (-)....
Other securities (net)
Advances to contractors and agents:Govermaent agenciesOther
Accounts and notes receivable:Govenunent agenciesOther (net)
InventoriesAllowance for losses (-)
Accrued Interest receivable:On public debt securitiesOn securities of Government enterprises.
OtherLoane receivable:GovemDent agenciesOther
Allowance for losses ( - )
Acquired security or collateral (net)
Land, structures, and equipmentAcoiDulated depreciation (-)
Other assets (net)
Total assets
UABILITIESAccounts payable:GoTemjnent agenciesOther
Accrued liabilities:Government agenciesOther
Advances from:GovermDent agencle s
OtherTrust ani deposit liabilities:Gorernment agencies >
OtherBonds, debentures, and notes payable:
Government agenciesOther:GiKranteed by the tjtilted States
Hot guaranteed by the United States
Other liabilities (Including reserves).
Total liabilities
WET mVEgTMHITmited States Interest:
Interest-bearing investment:
Capital stockBorrowings from the U. S. Treasury...
OtherRonlnterest-bearlng Investment:
Capitol stockAppropriationsCapitalization of assets (net)
OtherAcciuulated net Income, or deficit (-).
Deposits of general and special fund
revenues ( -)
Total mited States Interest
Total liabilities and investment
AHALYSIS OF UNITED STATES IKVESTMBfT
Utilted States InvestmentAccvBBulated net Income, or deficit (-).-,
Total Vtoltcd States Investment Including
Interagency itemsInteragency Items:
iy\x from Government agencies (-)
Due to Government agencies
Total United States Investment after
exclusion of Interagency items
Foftnotes at end of Table S.
641
1,189,593
26528,089
844,39887,472
7,382,605-137
545,843-244,749118,571
9,952,591
365,791346,182
603
131,659
85,09412,905
2,988210
284,164
1,229,598
664,704288,081
7,690,053 2/80,156
8,722,994
9.952,591
8,642,83880,156
8,722,994
-844,664454,476
8.332.806
587
9,337
15,51411
30,463
33,607-13,669
356
76,207
107
4,050
123
1,832
1,527
1,634116
5,670
15,060
1,000
33,8159,08517,247
61,147
76,207
43,90117,247
61,147
-15,514
3,391
49.024
4,538
21
1,180
5,739
210
1,180
1,390
5,000
-651
4,349
5,739
5,000-651
4,349
^^349
599
308
109
596-347
1,265
91
71
165
8310
246
665
300284
15
599
1,265
58415
599
-308
174
466
(Continued on following page)
2,481
1,87461
4,077
39,795-18,489
28
29,832
835
1,133
21
288
148
537
2,962
21,970
4,900
26,870
29.832
21 ,970
4,900
26,870
-1,8741,003
26.000
261
13
75816
302
1,070-647
16
1,788
8088
210
131
230
739
400529
120
1,049
1,788
929120
1,049
-758
290
582
13,619
22
73
4,764436
3,370
76,636-24,90122,037
96,056
78
1,472
1,228
10,6586
2,947
16,389
9,62570,186
-144
79,667
96.056
79,811-144
79,667
-4,78610,736
85.617

106 Treasury Bulletin
, COKFORATIONS ASD CERTAIR OTHER B(JSIKBSS-TYFE
Table 3.-
Section I - Statements of Financial ConditionIntragovernmental Revolving Fimds, March 31, 1063
(In thousonda of dollar e)
(Continued)

June 196J 107
. COEPORATIOHS AHD CKRTAIN OTHER BUSINESS-TYPE ACTiViTJJiS.
Table 3.- Int
Section I - Stateaente of Financial Conditionragovernmental Involving Funds, March 31, 1963 - (Continued)
(In thouaacds of dolloro)
Defense Department - (Continued)
ArmyDepartment-(Continued)
Corps ofEngineers
Navy Department
Stockftmd ^
Industrialfund 2/
Marine Corpsstock fund
Health, Education, :^id Welfare Department
Public Health Service
Service andsupply fund
Narcotichospitals
Workingcapital fund
Office ofthe Secretary
Workingcapital fund
Caah In banjca, on hand, and In transit....
Fund balances with the U. S. Treaaury !/• •
InTeetfflenta:
Public debt securities (par value)
Securities of Government enterprleea. . .
.
Ifiiamartlzed premium, or diacount (-)....
Other Becurltles (net)
Advances to contractors and agents:
GoTermnent agenciesOther
Accounts and notes receivable:Government agenciesOther (net)
InventoriesAllowance for losse a ( -
)
Accrued Interest receivable:
On public debt securities
On securities of Government enterprises.
Other '
Loans receivable;Government agenciesOther
Allowance for losses (-)
Acquired security or collateral (net)....
Land, structures, and elulpmentAociDulated depreciation (-)
Other assets (net)
Total aasets
UABIUriESAccounts payable:Government agenciesOther
Accrued liabilities:Government agenciesOther
Advances from:Government agenciesOther
Trust and deposit liabilities:
Government agenc lesther
Bonds, debentures, and notes payable:
Government agenciesOther:Guaranteed by the Itilted States
Not guaranteed by the thited States..
Other liabilities (Including reserves)...
Total liabilities
NET mVESrHHlTUiited States interest:
Interest-bearing investment:
Capital stockBorrowings from the U. S. Treasury...
OtherHonlnterest-bearing Investment:
Capital stockAppropriationsCapitaliiation of aasets (net)
OtherAccuBulated net Income, or deficit (-).
Deposits of general and special fund
revenues ( -)
Total United States interest
Total liabilities and Investment
AHALYSIS OF IHITED STATES IKVESTMHfr
United States investmentAccumulated net income, or deficit (-)...
Total united States investment including
interagency items
Interagency items:
Due from Government agencies (-)
Due to Government agencies
Total United States Investment after
exclusion of Interagency items
Footnotes at end of Table 8.
28,349
18,261
516
7,361
252,722-129,772
1,700
179,138
1,0799,703
4337,417
41.471
60,103
24,52596,282
-1 ,773
119,034
179,138
120,807-1,773
119,034
-18,261
1,512
102,285
69,382
4,501
64,50411,678
1,538,957
220
1,689,242
115,12740,667
12.658
168,451
1,520,791 4/
1,520,791
1.689,242
1,520,791
1,520,791
-64,504115,127
1,571,414
95,754
4,580
97,9831,237
296,162
6,472
502,18
14,63220,141
98,520
4,428
107,697
245,418
280,369-51,172
27,574
256,770
502,183
229,19727,574
256,770
-97,98314,632
173,419
28,264
616
624709
246,172
1,800
278,186
11,32610,953
806
23,085
255,101 V
255,101
278,186
255,101
255,101
-624
11,326
265,803
(Continued on following page)
970
800
1,664
322-178
3,582
135816
98
235
1,284
4501,561
287
2,298
3.582
2,011287
2,298
-803
135
1,630
76
73
350
437-250
686
2
17
12
31
13488
433
655
686
222
433
655
-73
2
584
1
«
147
202
383-191
144
797
129
65
48
13
98
352
225
219
445
797
225219
U5
-148141
438

108 Treasury Bulletin
.CORPORATIONS AND CERTAIN OTHES BUSINESS-TYPE ACTIVITIES.
Table 3.
Section I - Statements of Financial ConditionIntragovernmental Revolving Funds, March 31, 1063
(In thousands of dolleurs)
(Continued)

June 196J 109
.CORPORATIONS AND CERTAIN OTHER BUSINESS-TYPE ACTIVITIES.
Section I - Statements of Financial ConditionTable 3.- Intragovernmental Revolving Funds, March 31, 1963
(In thousands of dollars)
(Continued)
General Services Administration - (Continued)
Generalsupplyfund
Constructionservices,publicbuildings
Workingcapitalfund
Veterans'Administration
Supplyfund
CivilServiceCommission
Investigations
ASSEPSCash In banks ^ on hand, and in transit...Fund balances with the U. S, Treasury 1/.Investments:Public debt securities (par value)Securities of Government enterprises...Unamortized premium, or discount (-)...Other securities (net )
Advances to contractors and agents:Government agenciesOther
Accounts and notes receivable:Government agenciesOther (net )
InventoriesAllowance for losses (-)
Accrued interest receivable:
On public debt securitiesOn securities of Government enterprisesOther
Loans receivable:Government agenciesOtherAllowance for losses (-)
Acquired security or collateral (net)....
Land, structures, and equipmentAccumulated depreciation (-)
Other assets (net)
Tota 1 assets
LIABILITIESAccounts payable:
Government agenciesOther
Accrued liabilities:Government agenciesOther
Advances froo:Government agenciesOther
Trufft and deposit liabilities:Government agenciesOther
Bonds, debentures, and notes payable:
Government agenciesOther:
Guaranteed by the United StatesNot guaranteed by the United States..
Other liabilities (including reserves)...
Total liabilities
NEI INVESTMEhfT
United States Interest:Interest-bearing investment:
Capital stockBorrowings from the U. S. Treasury...
OtherNonlnterest-bearlng Investment:
Capital stockAppropriationsCapitalization of assets (net)
OtherAccumulated net Income, or deficit (-).
Deposits of general and special fund
revenues (-)
Total United States interest
Total liabilities and Investment
AMLYSIS OF UNITED STATES INVESTMEOT
United States investmentAccumulated net income, or deficit (-)...
Total United States Investment including
interagency itemsInteragency items:
Due from Government agencies (-)
Due to Government agencies
Total United States investment after
exclusion of interagency items
27,391
13882
62,2871,013
121,406
51,885-17,0612,385
249,526
3,42925,851
49,43074
10,680
89,464
142,75011,215
-141
6,239
160,062
249,526
153,8236,239
160,062
-62,42552,859
150,496
753
871
1,625
83
401
375
1 ,009
1,868
-406
163
-243
1,625
-406163
-243
-871
458
-656
143
231*
66
609-214
3
840
6
114
142
134
396
150
253-22
63
443
840
38063
U3
-231
148
360
10,666
7820
6,277132
35,165
7U-202
52,880
1,871
9,931
37785
22
12,646
39,986
248
40,234
52,880
39,98624s
40,234
-6,3551,908
35,787
2,646
93
1,4481
1,069
804-527
5,533
95628
788
1,519
4,000
14
4.014
5,533
4,00014
4,014
-1,44898
2,664
Footnotes at end of Table 8.

110 Treasury Bulletin
CORPORATIONS AND CERTAIN OTHER BUSINESS-TYPE ACTIVITIES
.
Section I - Statements of Financial ConditionTable 4.- Certain Other Activities, March 31, 1963
(In thousands of dollars)

June 196J 111
CORPORATIONS AND CERTAIN OTHER BUSINESS-TYPE ACTIVITIES
.
Section I - Statements of Financial ConditionTable 4.- Certain Other Activities. March 31, 1963 - (Continued)
(in thousands of dollars)
Account
KEW Department
Office ofEducation
Loans to
students(World War II)
Interior Department
Office ofTerritories
Alaskapublicworks
BonnevillePowerAdminis-tration
SoutheasternPowerAdminis-tration
SouthwesternPowerAdminis-tration
Justice Department
Immigrationajid Naturali-zationService
Legalactivitiesand generaladministra-tion
ASSETSCash in banks, on hand, and In transit,..
Fund balances with the U. S. Treasury 4/.Investments:Public debt securities (par value),..,.
Securities of Ctovernment enterprises...
Unamortized premium, or discount (-)...
Other securitiesAdvances to contractors and agents:
Government agencies ,.
OtherAcco\mt8 and notes receivable:
Government agencies.
Other (net )
Inventories. .,
Allowance for losses (-)
Accrued interest receivable:
On public debt securities
On securities of Government enterprises
OtherLoans receivable:
Government agencies,
Other: U. S. dollar loans
Foreign currency loans..,,,,,.
Allowance for losses (-) .,,,,
Acquired security or collateral (net),.
Land , structures , and equipment
Accumulated depreciation (-),...
Foreign currencies. ....*,,•,•,*,,,*•,,<
Other assets (net)
Total a ssets,.,,,,,.., -,...,,,,,,•,,,,••
•
LIABILITIES
Accounts payable:Government agencies, ,,,.,,.,,,,..,.,...
OtherAccrued liabilities:
Government agencies ,,,,,,, .,
OtherAdvances from:
Government agencies,
OtherTrust and deposit liabilities:
Government agencies •
OtherBonds, debentures, and notes payable:
Government agencies. ••
Other: Guaranteed by the U. S
Not guaranteed by the U. S
Other liabilities (including reserves)...
Total liabilities
NET INVESTMENT
United States interest:
Interest-bearing Investment:
Capital stock. ...,,,,,,,, .*••••-•••••
Borrowings from the U. S. Treasury,.,
OtherNoninterest-bearlng investment:
Capital stock. ....,,.,,,., ••'
Appropriat ions ,,,.,,.,,..,,.,,*<
Capitalization of assets (net)
Other •••'
Accumulated net income, or deficit (-).
Deposits of general and special fund
revenues (-),......,,,,.,,•••••••••••'
Total United States Interest
Total liabilities and Investment
ANALYSIS OF UNITED STATES INVESTMEhfT
United States investment
Accumulated net income, or deficit (-)...
U. S. investment incl. interagency items.
Interagency items:
Due from Government agencies (-)
Due to Government agencies...,,,,,,..,-
U. S. investment excl. Interagency items,
29
17,527
17,527
609
-579
29
29
609-579
29
17,527
17,527
17,527
17,527
29 17,527
39,013
4,001
195
9,0994,337
506,868-126,621
26,713
463,605
2,639
722608
2,319
6,287
714,22620,683108,499 11/22,450
-408,539
457,319
463,605
434,86822,450
457,319
-4,196722
453,844
508
2,395
95-45
128
3,031
1
12
13
37
04
11,003207-334
149,983
-157,842
3,018
3,081
-146,966149.983
3,018
26
3,044
15,300
Footnotes at end of Table 8.(Continued on following page)
79
1 ,046
664
29,565-7,404
7_
39,258
591
4,32820
199
5,139
35,685948
1,045 11/34.161
-37,721
34.119
39,258
-42
34,161
34,119
-79
4,328
38,369
16
22,394
85
13
337
16,733
3,891
43,468
47
395
9192,830
2,0464,162
5,b3o
16,036
65,96310,188
-44,949
-3,770
27,432
43,468
72,382
-44.949
27,432
-13
3,012
30,431
11921,118
111
54
49
8,950
169,850
200,250
2,459
i,,59
18,943
178,849
197,791
200,250
197.791
197,791
-111
2,459
200,139

112 Treasury Bulletin
CORPORATIONS AND CERTAIN OTHER BUSINESS-TlfPE ACTIVITIES.
Section I - Statements of Financial ConditionTable 4.- Certain Other Activities, March 31, 1963 - (Continued)
(in thousands of dollars)

Jane 196J 113
CORPORATIONS AND CERTAIN OTHER BUSINESS-TYPE ACTIVITIES.
Section I - Statements of Financial ConditionTable 4.- Certain Other Activities, March 31, 1963 - (Continued)
(In thousands of dollars)
Export-ImportBank ofWashington
Agent forcertain MutualSecurity Actloans
FederalConununica-
tionsCommission
FederalMaritimeCommission
FederalMediation andConciliationService
FederalPowerCommission
InterstateCommerceCommission
Paymentof loanguaranties
PanamaCanal
CanalZoneGovernment
ASSETSCash in banks, on hand, and in transit,..Fund balances with the U. S. Treasury 4/.Investments:
Public debt securities (par value).....
Securities of Government enterprises...Unamortized premium, or discount (-)...
Other securitiesAdvances to contractors and agents:
Government agencies ,
OtherAccounts and notes receivable:
Government agencies ....................Other (net)
Inventories ..............................Allowance for losses (-)
Accrued interest receivable:
On public debt securities
On securities of Government enterprises
OtherLoans receivable:
Government agenciesOther: U. S. dollar loans
Foreign currency loans........
Allowance for losses (-)
Acquired security or collateral (net)..
Land, structures, and equipment........
Accumulated depreciation (-).........
Foreign currenciesOther assets (net).. ..••••. ••.•...••.
Total assets.. ••••••••.•..••• •••.••••••*.
LIABILITIES
Accoxints payable:Government agencies. ...»••...••........
OtherAccrued liabilities:
Government agenciesOther
Advances from:Government agencies. . ..................
OtherTrust and deposit liabilities:
Government agenciesOther
Bonds, debentures, and notes payable:
Government agenciesOther: Guaranteed by the U. S.
Not guaranteed by the U. S
Other liabilities (including reserves)...
Total liabilities
NET INVESTMENT
United States interest:
Interest-bearing investment:
Capital stockBorrowings from the U. S. Treasury...
OtherNoninterest-bearlng investment:
Capital stock. ................ ••••••
Appropr ia t ions ............•..Capitalization of assets (net)
Other ••••
Accumulated net income, or deficit (-).
Deposits of general and special fund
revenues (-)..............*••••••••••'
Total United States Interest
Total liabilities and investment
ANALYSIS OF UNITED STATES INVESTMEm
United States investment
Accumulated net income, or deficit (-)...
U. S. investment incl. interagency items.
Interagency items:
Due from Government agencies (-)
Due to Government agencies
U. S. investment excl. Interagency items.
Footnotes at end of Table i
113
3,487
1U,037
U7,636
161,000
3,487
-16,851
U7,63o
U7,636
1W,U93,487
147,63b
147,636
5,899
1468
7
4,471
10,531
539
5,666
1
44038
1,391
8,076
-371
2,826
2,455
10,531
2,455
2,455
-146
441
2,751
1,101
190
1,298
83
82
114
178
456
3,603
ft
-2,757
-5
841
1,298
3,599-2,757
841
•923
1,614
410
2,033
46269
15011
495
971
1,147
-85
1,062
2,033
1,062
1,062
196
1,258
(Continued on following page)
4,144
34943
1,251
5,787
743
6185
1,367
4,420
4,420
5,787
!.,420
14,676
14,676
15/
14,676
14,676
14,676
14,676
128
15,305
4,400
2,919874130
20
52,904-20,320
6,884
63,244
5,654
15
702
4,680
692
11,742
1
1
,907
39,595
51,502
63,244
51,502

lU Ireasury JjuUetin
CORPORATIONS AND CERTAIN OTHER BUSINESS-TYPE ACTIVITIES
.
Table 4.-
Section I - Statements of Financial ConditionCertain Other Activities, March 31, 1063 - (Continued)
(In thousands of dollars)

June 1961115
.CORPORATIONS AND CERTAIN OTHER BUSINESS-TYPE ACTIYTTIES.
Section I - Statements of Financial ConditionTable 5.- Certain Deposit Funds, March 31, 1963
(In thousands of dollare)
AccountTotal
Farm Credit Administration
Banksforcooperatives
Federalintermediatecreditbanks
FederalDepositInsuranceCorporation
Federal HomeLoan BankBoard
Federal home
loan
banks
ASSETS
Cash in baskSy on handf aztd In transit***.**...Ftmd balances vltb ths H. S. Treasuiy J/InvBStaeDts i
Public debt securities (par value)Securities of wholly owned Govt, enterprises.Dnanortized premlumy or discount (-}•.....*..Otber securities
Advances to contractors and agents
;
GovBxment agencies. ....*..*..*.....*Other
InventoriesAllowance for losses (-)
Accounts and other receivables:GovexTunent agencies.Other (net )
loans receivable:Govexment agencies.OUwrAllowance for losses (-)
Acquired security or collateral (net )
land, structures, and equlpaentAccumulated depreciation (-)
Other assets (net) •
Total assets, *....*...
UABILITIES
Accounts and other payables:Goveniment agencies. *.*......*Otber
Advances from:Govemnent agencies ....*.*......*•.••*Other
Trust and deposit liabilities:Govezmnent agencies. ......•....••••••
OtherBonds , debentures , and notes payable i
Government agenciesOtlttr: Guaranteed by the United States
Not guaranteed by the United States,
All otber liabilities (including reserves),,.
Total liabilities
NET rarESTMEMT
Private interest:Capital stockAccuamlated net incoms, or deficit (-).
Total private Interest,
Ihilted States Interest:Interest-bearing Investment:Capital stock ,
Borrowings from the U, S. Treasury
OtherHonlnterest-bearing investment:
Capital stockAppropriations .,..,,,,,,,,. ••«
Gapitallaation of assets (net)
OtherAccumulated net income, or deficit (-)
Deposits of general and special fund revenues (-)
Total United States interest
Total liabilities ai^ investment
AHAHSIS OF UOTTED STATES mTCSTMEMT
Ihited States investmentAceumlated net income, or deficit (-)
Total D. S. investment including interagency items,
Interagency items:Dim from Government agencies (-).. <
Due to Government agencies,.,. '
Total D, S, investment excluding interagency items
85,3644,886
4,874,098
-23,773
59
5
85,339
2,500
5,282,576-8,423
66
9,444-1 ,324
3,879
10,314,695
300
62,U1
206
1,283,735
2,500
4,438,675221,768
6,009,626
1,241,119221,281
1,462,400
200,727
2,641,942
2,842,669
10,314,695
200,7272,641,942
2,842,669
-2,5053,007
2,843,171
1/ See Table 1 , footnote 1
.
2/ See Table 2, footnote 6.
1/ The surplus is not available by law for dividend distribution and is
16,7971
43,051
-271
3
10,074
1,600761,422-7,467
66
548-487
246
825,584
1
5,155
14
503
900
537,375413
54A,362
70,17061,768
131,938
94,838
54,U6
149,283
825,584
94,83854,U6
149,283
-1 ,603
916
148,596
9,57541
111,384
-541
31 ,987
9002,006,547
868-837
966
2,160,889
2
22,859
20
324
1,600
1,898,2154,529
1,927,549
40,51941,319
81,838
105,889
45,613
151,502
2,160,889
105,88945,613
151,502
-900
1,622
152,224
21
1,625
2,735,163
-12,612
59
1
26,409
982-956
8,029
1,135
2,759,857
297671
172
244
216,590
217,973 2/
2,541,884 2/
2,541,884
2,759,857
2,541,884
2,541,884
-1
469
2,542,351
58,9713,219
1,984,500
-10,351
16,869
2,513,625
1,532
4,568,365
33,756
1,282,664
2,003,085236

116 Ireasury nuUetin
.CORPORATIONS AND CEEfCAIN OTHER BUSINESS-TYPE ACTIYITIES.
Section I
Table 6.- Certa
- Statements of Financial
In Trust Revolving Funds,
(In thousands of dollars)
ConditionMarch 31, 1963

June 1961 117
-CORPORATIONS AND CERTAIN OTHER BUSINESS-TYPE ACTIYITIES-
Section I -
Table 6.- Certain TrustStatements of Financial ConditionRevolving Funds* March 31 , 1063 - (Continued)
(In thousands of dollars)
Account
GeneralServicesAdministration
NationalArchivestrust fund
Housing and HomeFinance Agency
Federal NationalMortgage Assoc.
Secondarymarketoperations
Civil Service Commission
Employees'healthbenefitsfund
Employees'lifeinsurancefund
Retiredemployees
'
healthbenefitsfund
FederalCommunicationsCommission
Internationaltelecommxinication
settlements
ASSETS
Cash in banks, on hand, and in transit
Fund balances with the U. S. Treasury 4/..,
Investments:Public debt securities (par value)Securities of Government enterprises..,.
Unamortized premium, or discount (-).,..
Other securitiesAdvances to contractors and agents:
Government agenciesOther
Accounts and notes receivable:
Government agenciesOther (net )
InventoriesAllowance for losses (-)
Accrued interest receivable:
On public debt securities
On securities of Government enterprises.
OtherLoans receivable:Government agenciesOtherAllowance for losses (- )
Acquired security or collateral (net)
Land, structures, and equipment
Accumulated depreciation (-)
Other assets (net)
Total assets
LIABILITIES
Accounts payable:
Government agenciesOther
Accrued liabilities:Government agenciesOther
Advances from:Government agenciesOther
Trust and deposit liabilities:
Government agenciesOther
Bonds, debentures, and notes payable:
Government agenciesOther:
Guaranteed "by the United States
Not guaranteed by the United States..
Other liabilities (including reserves),..
Total liabilities
NET INVESTMENT
Trust interest:Principal of fundCapitalization of assets (net)
Accumulated net Income, or deficit (-).
Total trust interest.
United States interest:
Interest-bearing investment:
Capital stockBorrowings from the U, S, Treasury...
OtherNoninterest-bearing investment:
Capital stockAppropriationsCapitalization of assets (net)
OtherAccumulated net income, or deficit {-),
Deposits of general and special fund
revenues (- )
Total United States interest.
Total liabilities and investment.
Footnotes 1 through 7 on preceding page.
8/ Represents unrealized purchase discounts.
» Less than $500.
209
102
-3
6
65
131
-21
^90
19
^71
471
490
57,048
20,310
7,150237

118 Treasury Bulletin
. CORPORATIONS AND CERTAIN OTHER BUSINESS-TYPE ACTIVITIES.
Section I - Statements of Financial ConditionTable 7.- Loans Outstanding March 31, 1963, Excluding Interagency Loans and Those Made by
Deposit and Trust Revolving Funds, Classified by Types of Loans 1/
(In thousands of dollars)HH-1

Jane 1967119
. CORPORATIONS AMD CERTAIN OTHER BUSINESS-TYEE ACTIYTTIES.
Table 7.
Section I - Statements of Financial Conditionle 7.- Loans Outstanding March 31, 1963, Excluding Interagency Loans and Those Made byDeposit and Trust Revolving Funds, Classified by Types of Loans - (Continued)
V
(in thousands of dollars)
Type of loan and lending agency
To aid industry (Continued)
:
Other loans (Continued)
:
Other purposes (Continued):Housing and Home Finance Administrator:Liquidating programs
Interior Department:Bureau of Commercial Fisheries:
Fisheries loan fundOffice of Minerals Exploration ^Virgin Islands Corporation
,
Small Business Administration:Revolving fund (lending operations)
Treasury Department:Civil defense loans
,
Reconstruction Finance Corporation liquidation fund.
Total to aid industry
To aid education:
Health, Education, and Welfare Department:Loans to institutions and nonprofit schools ^Loans to students in institutions of higher education ^Loans to students (World War II )
Housing and Home Finance Administrator:College housing loans
Total to aid education
To aid States, Territories, etc.:
Commerce Department:Area Redevelopment Administration:
Area redevelopment fundGeneral Services Administration:
Public Works Administration (in liquidation)Health, Education, and Welfare Department:
Public Health Service i/Housing and Home Finance Administrator:
Public facility loansLiquidating programsUrban renewal fund
Interior Department:Bureau of Reclamation ^Office of Territories:
Alaska public worksNational Capital Planning Commission ^Public Housing AdministrationTreasury Department:
Miscellaneous loans and certain other assets
Total to aid States, Territories, etc
Foreign loans:
Expansion of defense production:Export-Import Bank of Washington
Military assistance credit sales:
Defense Department:Air Force DepartmentArmy DepartmentNavy Department
Other purposes:Agency for International Develojment:
Alliance for Progress, development loans
Development loansDevelopment loan fund liquidation account
Loans to United States firms and domestic or foreign
firms in foreign countries
All other loans
Commerce Department:Maritime Administration
Export-Import Bank of Washington:
Regular lending activitiesAgent for certain Mutual Security Act loans
Treasury Department:Miscellaneous loans and certain other assets
Total foreign loans
Footnotes at end of table.
United States dollar loans
Total 2/
4,183
6,4301,702
34
626,956
591
2,502
879,836
3,947290,869
22
1,405,245
1 ,700,083
360
61 ,206
3,727
98,9118,089
144,799
52,317 6/
17,5271,201
164,230
91,2U643,611
32
7,201
32,835113, 1U
13,789408,125215,898
1,460,498
6,409
3,U8,521144,037
3,210,718
9,061,206
Public enterpriserevolving funds
4,183
6,430
34
626,956
591
2,502
755,86;:
1,405,245
1,405,245
360
98,9118,089
144,799
164,230
416,389
32
13,789408,125215,898
3,448,521
4,086,364
Certain otheractivities
1,702
123,975
3,947290,869
22
294,838
61 ,206
3,727
52,317 6/
17,5271,201
91,244
P27 ?2^
7,201
32,835113, 1U
1 ,460,498
6,409
1U,037
3,210,718
4,974,8^
Foreigncurrencyloans 2/
888,788 2/
74,004 8/2,525,454 §/
3,488,246
(Continued on following page;

120 Treasury Bulletin
.CORPORATIONS AHD CERTAIN OTHER BOSINESS-TYFE ACTIVITIES.
Section I - Statements of Financial ConditionTable 7.- Loane Outstanding March 31, 1963, Excluding Interagency Loans and Those Made by
Deposit and Trust Revolving Funds, Classified by Types of Loans - (Continued) j/
(in thousands of dollars)

Jane 1967121
. COKPORATIONS AND CEPTAIN OTHER BUSINESS-TYEE ACTIVITIES.
Section I - Statements of Financial ConditionTable 8.- Loans Outstanding by Periods for All Business-Type Activities
Excluding Interagency Loans but Including Foreign Currency LoansPart A.- Classified by Types of Loans
(In millions of dollars)
End ofperiod
Fiscal years:
19501951
1952
195319541955195619571958195919601961
1962
Calendar years;
19501951
1952
195319541955195619571958
1959I960
1961
1962
Current quarters:
1961 -September 301962-March 31
September 301963-March 31
Total
1/
12,771.713,689.416,066.017,863.418,743.819,420.520,547.521,812.922,893.427,510.729,568.331,527.136,154.9
413.2,595.1966.7,086.0
,575.5,506.3,091.5,755.6,851.1277.7122.6
,849.2,728.2
32,771.3
35,854.936,043.437,867.8
Totalto aidagriculture
3,773.33,674.74,058.24,996.66,389.16,361.76,789.66,827.56,913.48,489.77,797.58,428.39,793.0
3,884.14,161.35,070.36,810.56,929.26,715.46,785.46,681.1
8,684.97,762.58,299.59,453.110,376.5
8,780.710,253.99,422.711,440.8
To aid agriculture
Agriculturalcreditcorporations
573.7751.7865.
B
823.9774.0844.6894.4996.5
1,227.01,547.41,697.81,832.21,998.6
507.1
629.1
671.3589.8635.6686.5733.6928.8
1,160.51,396.41,502.01,651.21,841.9
1,844.21,765.52,015.12,006.5
Cooperativeassociations
1,659.01,958.82,174.32,333.32,467.92,604.42,774.42,979.33,191.63,509.33,748.23,974.44,231.0
1,892.52,171.52,341.12,468.62,589.62,721.72,954.13,152.03,394.23,715.43,948.34,168.04,350.7
4,066.94,231.34,267.84,436.7
Crop, live-stock, andcommodityloans 2/
1,003.1408.6437.7
l',216.5
2,460.52,234.02,452.92,089.21,688.22,526.91,360.71,532.32,272.6
952.4812.8
1,453.83,116.23,026.22,669.72,441.61,840.7
3,333.91,752.81,871.32,486.22,816.9
1,731.02,985.91,772.63,514.9
Farmmortgage
515.9530.1
549.6588.8647.2634.1
275.3314.2359.2454.0504.5558.5661.6
508.8517.1
566.7597.6628.7596.4289.8
357.5399.5484.3530.4608.5768.2
590.4636.1726.2797.6
Other
21.625.530.934.239.544.6392.5
U8.2447.3452.0486.1530.9629.1
23.430.937.338.449.241.2
366.2401.9396.7413.5447.5539.2598.8
548.2635.1641.1
685.0
To aid home owners
Totalto aidhomeowners
1,315.71,809.42,387.42,914.22,814.43,094.83,377.74,380.54,628.25,872.77,563.67,763.28,340.6
1,5282,1412,6032,9302,9063,2043,771
4,7684,8606,7358,0328,2488,244
Mortgageloans
7,903.98,456.98,265.27,818.2
1,290.71,809.1
2,387.32,914.12,814.23,094.6 2/3,302.74,276.04,473.55,641.67,247.07,371.97,874.2
1,525.22,141.42,603.22,929.92,906.63,204.1 2/3,683.14,642.04,671.86,462.17,679.17,807.97,814.9
7,488.87,993.77,810.57,407.0
Other
25.0
.3
.1
.1
.1
.2
74.9 2/104.
154.
231.
316.
391.
466.
3.0.3
.1
.1
.2
.3
88.3 2/126.6188.5
273.0353.1
U0.4429.9
415.1
463.2454.7411.1
End ofperiod
Fiscal years:
19501951
1952
19531954
1955195619571958
195919601961
1962
Calendar years:19501951
1952
195319541955195619571958195919601961
1962
Current quarters:1961 -September 30.
1962-March 31
.
September 30.
1963-March 31.
Footnotes on page 124
To aid industry
Totalto aidindustry
628.0603.1
549.4614.
6
426.7438.5626.9639.6654.2716.8753.6727.7876.1
568,
589.
597.
587.
431.
678.
619.
673.
679.
732,
748797917
748.3846.3892.0879.8
Loans to
railroads
113.0104.785.278.611.912.712.7
12.38.0
7.57.2
6.732.8
109.9100.781.979.011.5
11.2
12.5
18.3
32.632.532.3
Shipmortgageloans
6/
2/
221.0218.6191.0173.8155.2136.8120.7
6/6/&/7/
260.7219.3216.8186.6165.7151.4128.2114.7
133.5123.9117.3122.9
515.0498.4464.2535.9414.7425.8393.2408.
6
455.2535.5591.3584. >
722.5
458.1
488.5515.7508.8
419.8406.
5
387.5446.9485.5559.7589.6637.0770.8
596.5689.974.2.2
724.7
To aid financial institutions
Total to
aid financialinstitutions
453.6824.5653.0718.5677.9
1,019.21,180.61,086.6933.7
1,538.91,801.51,915.62,768.2
824.3814.2864.5951.8869.8
1,419.01,235.51,272.31,300.62,136.12,027.32,708.33,480.0
2,170.42,197.23,047.32,514.6
2.6.1
.1
2.82.27.2
7.2
4.21.8
31.746.1
1 .1
.1
.1
2.3
3.57.37.2
2.31.8
46.546.11.0
46.1
46.1
1.01.0
Insurancecompanies
13.613.75.1
4.53.7
3.4
Mortgageloancompanies
437.4810.7647.9713.9671.4
1,013.51,173.41,079.4929.5
1,537.1
1,769.81,869.42,767.1
810.2800.7859.6947.2863.8
1,412.41,228.21,265.21,298.32,134.31,980.82,662.23,479.0
2,124.32,151.1
3,046.32,513.6
To aideducation
1.21.1
1.8
15.650.381.7113.2209.8374.9585.7830.4,088.8
1,393.5
1.21.1
6.329.765.691.6147.3274.4450.4682.8958.6
1,233.91,599.2
1,184.11,303.81,521.61,700.1
To aidStates,Territories,etc.
422.9560.9732.5732.7332.3255.2226.8243.0270.9310.0348.9402.8528.1
468.0712.3
1,020.2
644.6271.7244.9246.0264.0293.4318.8369.1
423.1630.7
436.2467.8565.2643.6
Foreignloans
4/ y
6,116.36,151.17,617.07,798.47,964.88,032.48,171.68,300.29,046.29,924.710,266.810,991.212,196.3
6,077.86,110.37,736.28,042.68,000.57,988.38,223.58,753.79,509.79,840.010,483.611,753.912,159.7
11,337.212,092.1
12,073.712,549.5
Otherloans
60.764.666.572.988.4136.961.1
125.771.972.3
205.9209.5259.1
61.665.168.489.0100.4I64.4
63.167.672.069.5
204.2230.8319.4
210.5236.9255.7321.3

122 Treasury Bulletin
.CORPORATIONS AND CERTAIN OTHER BUSINESS-TYPE ACTIVITIES.
Section I - Statements of Financial ConditionTable 8.- Loans Outstanding by Periods for All Business-Type Activities
Excluding Interagency Loans but Including Foreign Currency Loans - (Continued)
Part B.- Classified by Agencies(In millions of dollars)
End of periodTotal
V
AgencyforInter-nationalDevelop-ment 8/
Develop-mentloanfund 2/
Agriculture Department
Com-modityCreditCorpo-ration
Farmers
'
HomeAdminis-tration
10/
RuralElectri-ficationAdminis-tration
CommerceDept.
Maritimeactivi-ties
InteriorDept.
Expan-sion ofdefenseprod.
Treasury Department
RFC (in
liqui-dation)
11/
Expan-sion ofdefenseprod.
Other12/
GeneralServicesAdminis-tration
12/
Housing and HomeFinaince Agency
Office

Jane i96l123
CORPORATIONS AND CERTAIN OTHER BUSINESS-TYPE ACTIVITIES,
Footnotes to Table 1
X/ These amounts consist in the main of unexpended balances of generalspecial, and revolving fund accounts against which checks may bedrawn to pay proper charges uhder these funds. The funds are con-sidered as assets of the agencies, but are not assets of the UnitedStates Government since funds must be provided out of cash balancesof the Treasurer of the United States and future receipts to takecare of checks to be issued against the balances.
2/ Includes foreign currency assets, representing loans and otherreceivables recoverable in foreign currency as well as balances offoreign currencies in United States depositaries, aggregating $^,479million in dollar equivalent. These currencies, acquired primarilywithout the payment of dollars, were generated under various Govern-
ment programs, principally the Agricultural Trade Development andAssistance Act of 1954, as amended, and the Mutual Security Acts, asamended. Dollar equivalents are computed for reporting purposes, toprovide a common denominator for the currencies of the many countriesinvolved. Foreign currencies on hand and on deposit and loans undersection IO4 (e) of the Agricultural Trade Developnent and AssistanceAct of 1954, as amended, are stated at the rates as of March 31, 1963,at which the United States could purchase currencies on the market forregular operating purposes. Other loans are stated at the rates atwhich they are to be repaid or at rates in effect when the loans wereextended. Cxirrencies that are dollar denominated or guaranteed as torate of exchange are stated at rates specified in the agreements.
Footnotes to Table 2
_!/ Includes operating and administrative expenses funds.2/ See Table 1 , footnote 1
.
2/ Includes guaranteed loans and certificates of interest aggregating$1,314 million which are held by lending agencies.
4/ Foreign currency assets are included throughout the table (see Table1 , footnote 2)
.
^ Represents dollar equivalents of foreign currencies credited with theUnited States Treasury.
6/ Certain corporations and other business-type activities that have sub-mitted statements of financial condition guarantee and insure loansmade by private financial institutions and insure deposits in banksand savings and loan associations. These commitments are excludedfrom their balance sheets. The major agencies that have these itemsand the amounts thereof are as follows:
AmountActivity (in millions
of dollars)Agriculture Department:
Farmers' Home Administration:Agricultural credit insurance fund 432
Commerce Department:Federal ship mortgage insurance fund 41
5
Housing and Home Finance Agency:Office of the Administrator:
Urban renewal fund (December 31 , 1962) 903Federal Housing Administration 40»687Public Housing Administration:Local housing authority bonds and notes 3|336Local housing authority temporary notes 9iA
Veterans' Administration:Loan guaranty revolving fund (December 31, 1962) 16,122
Export-Import Bank of Washington:Regular lending activities 295
Federal Deposit Insurance Corporation (December 28,
1962) 179,088
Federal Home Loan Bank Board:Federal Savings and Loan Insurance Corporation (De-
cember 31, 1962) 77,349
Interstate Commerce Commission (December 31, 1962) 149Small Business Administration:
Revolving fund (December 31, 1962) 23Defense production guaranties (various agencies) (De-cember 31, 1962) 110
7/ Represents the fund known as "Adjcances to employment security admin-istration account, unemployment trust fund."
8/ Figures are as of March 29, 1963. The assets and liabilities of thisfund exclude resources on order of $192 million as reported by thePost Office Department.
2/ Valued at cost, estimated if not known. Land includes sites held forresale to prospective lessors for which $26 million has been paid orobligated,
10/ Liabilities do not include: (1) undetermined amounts of postage in
the hands of the public which have been accounted for as revenue whensold, and (2) the following types of contingent and future obliga-tions: contingent liabilities for cases pending before the CivilAeronautics Board and for pending suits and damage claims, and com-mitments under long-term leases.
1,1/ Represents equity of the United States Treasury in this fund.12/ The defense production guaranties fund, formerly shown under this
heading, did not have any assets, liabilities or net investment as
of March 31, 1963.
1_3/ Represents purchase money mortgages formerly classified as other
assets (see footnote 1 at end of Table 7).
14/ Represents unrealized purchase discounts.15/ Includes reserves and unrealized equity in the assets of the Defense
Homes Corporation which are being liquidated by the Association.
16/ Interest on this amount is being paid ty the direct loans to veterans
and reserves fund.
17/ Represents accrued interest expense on borrowings from the United
States Treasury Department on which payment has been deferred.
18/ Includes primary and secondary reserves of $644 million. The second-
ary reserve is available for losses only if the primary reserve is
insufficient.
19/ Ccnslsts of net income from power operations of $624 million and net
expense of nonrevenue-producing programs of $257 million.
» Less than $500.
V See Table 1 , footnote 1
,
2/ Consists mainly of capital of the Defense Department stock funds,
representing appropriations and reappropriations, capitalization of
assets, and accumulated net income or deficit. Figures for each of
the three accounts were not shown separately on reports subroitted by
the Department.
Footnotes to Table 3
Excludes capital property such as land, structures, and equipment as
follows: Office of the Secretary, $5 million; Air Force, $1,385
million; Army, $1,535 million; and Navy, $2,784 million.
4/ Represents capital of the fund (see footnote 2).
5/ Figures are as of December 31, 1962, the latest available.
» Less than $500.
Footnotes to Table 4
1/
2/
yu5/
6/
2/8/
Represents the Cooley loan program established pursuant to the Agri- 12/
cultural Trade Development and Assistance Act of 195i, as amended
(7 U.S.C. 1704 (e)). 12/Represents rural housing and other loans, and salaries and expenses.
Consists of military assistance credit sales receivables of the Air
Force, Army, and Navy Departments, IVSee Table 1, footnote 1. IS-'
Includes $161 million representing appropriations to cover undis-
bursed loan agreements financed out of grant appropriations. 1^Includes vessels owned and under construction.
Represents allowance for losses from scrapping of obsolete vessels.
Includes foreign currency funds of $11 million in dollar equivalent
representing appropriations to cover undisbursed loan agreements
financed out of grant appropriations.
Foreign currency assets are included throughout the table (see Table J7/
1 , footnote 2) .
These amounts reflect changes in treatment accorded collections of
interest as deposits to general and special accounts Instead of being
netted against accumulated net income or deficit. IS/
Represents interest on invested capital.
Includes the United States Study Commission - Texas which has been
transferred to the Treasury Department for liquidation.
Represents assets and liabilities of the General Services Adminis-
tration exclusive of trust and revolving funds and strategic and
critical materials.
Figures are as of December 31, 1962, the latest available.
Represents assets and liabilities of the United States Civil Service
Commission exclusive of trust and revolving funds.
Includes stock of the International Bank for Reconstruction and
Development amounting to $635 million; and subscriptions to the
International Monetary Fund, the International Finance Corporation,
the Inter-American Development Bank, and the International Develop-
ment Association amounting to $4,125 million, $35 million, $250 mil-
lion, and $197 million, respectively.
Includes $200 million due under the agreement with Germany dated
February 17, 1953, $474 million due under the agreement with Japan
dated January 9, 1962, and lend-lease and surplus property balances
due the United States in the principal amount of $1,408 million.
Includes loan to the United Kingdom amounting to $3,205 million out-
standing.See Table 2, footnote 6. • Less than $500.

124 Treasury Bulletin
.CORPORATIONS AKD CERTAIN OTHER BUSINESS-TYFE ACTIVITIES.
Footnotes to Table 8
1/ Table 8 relates to all loan programs of Government agencies. It in- 1^,/
eludes not only the United States dollar and foreign currency loanasummarized separately in Table 7, but also the loans made, all in
United States dollars, by deposit funds (Table 5) and trust revolvingfunds (Table 6). Pursuant to an amendment issued June 23, 1960, to
Department Circular No, 966, Table 8 now includes purchase money mort-gages, mortgages purchased from insured lending institutions to preventdefault, and similar long-term paper (see footnote 1 at end of Table 7).
2/ Includes guaranteed loans held by lending agencies.
2/ The major portion of the loans of the Veterans' Administration loanguaranty revolving fund is included under "Mortgage loans" through 1955and under "Other" to aid home owners thereafter (see footnote 19).
4/ Figures representing loans made by the Agency for International Devel-opment (formerly International Cooperation Administration) prior to1952 are not available at this time.
^ Includes guaranteed loans held by lending agencies through December
31 f 1958, and the loan to the United Kingdom.6/ Reports on maritime activities were not received by the United States
Treasury Department during the period from March 31, 19^7, throughMarch 31, 1953. Reorganization Plan No. 21, effective May 2^, 1950,abolished the United States Maritime Commission and transferred itsfunctions into the Department of Commerce.
7/ Reports have been received from the Commerce Department on maritimeactivities for the fiscal year 1953 and thereafter, but no loans werereported prior to December 31, 1955. Beginning with that date, cer-tain mortgage notes are classified as mortgage loans. 1 5/
8/ This Agency was established in the Department of State, and the Inter-national Cooperation Administration and the development loan fund wereabolished on November 3, 1961, pursiiant to the act approved Septemberi, 1961 (75 Stat. /J^5) , and Executive Order No. 10973 dated November 3,I96I , Loans of the abolished agencies were transferred to this Agencyand a new fund for development loans was established. Data for 16/earlier periods are for predecessor agencies,
2/ This fund was abolished on November 3, 1961 (see footnote 8).1.0/ Consists of the emergency credit revolving fund, the agricultural 17/
credit insurance fund (formerly the disaster loans, etc., revolvingfund and the farm tenant mortgage insurance fund, respectively); thefarm housing and other loan programs; the State rural rehabilitationfunds beginning June 30, 1956; and the direct loan account beginningDecember 31, 1961. Prior to June 30, 1956, and December 31, 1961, 18/loans of the agricultural credit insurance fund and the direct loanaccount, respectively, were included in the statements of financialcondition of the nonrevolving fund loan programs.
11/ On September 29, 1953, pursuant to the act approved July 30, 1953 (15U.S.C. 609), the Reconstruction Finance Corporation started liquida-tion of its activities, except those carried on by the Corporationpursuant to Section ^09 of the Federal Civil Defense Act of 1950 (50 22/App. U.S.C. 2261) and expansion of defense production activities car-ried on pursuant to the Defense Production Act of 1950, as amended(50 App. U.S.C. 2091-2094), which had been transferred to the Secre- 20/tary of the Treasury as of September 28, 1953, and as of the close ofbusiness on September 28, 1953, respectively. Effective at the closeof business June 30, 1954, pursuant to Reorganization Plan No, 2 of1954, certain functions and related assets of the Corporation weretransferred to the Export-Import Bank of Washington, the FederalNational Mortgage Association, and the Small Business Administration.Qn July 1, 1954, the remaining activities of the Corporation weretransferred to the Secretary of the Treasury to complete their liquida- 21/tion, pursuant to the act of July 30, 1953, as amended June 29, 195A.The Corporation was abolished effective at the close of business June30, 1957, by Reorganization Plan No, 1, of 1957, and the remaining func- 22/tions of the Corporation were transferred to the Housing and HomeFinance Administrator, Administrator of General Services, Administratorof the Small Business Administration, and the Secretary of the Treasury.
12/ Consists of the loan to the United Kingdom and other miscellaneousloans, Federal civil defense loans beginning December 31, 1953, loansof the Reconstruction Finance Corporation liquidation fund beginningDecember 31, 1957 (see footnote 11), and loans of the Federal FarmMortgage Corporation liquidation fund beginning December 31, 1961 (seefootnote 20)
.
12/ Figures through December 31, 1959, consist of loans of the Public WorksAdministration (in liquidation). Figures beginning June 30, I960,
include also: loans of Federal Facilities Corporation (this Corpo-ration was dissolved September 30, 1961, pursuant to the act of Aug-ust 30, 1961 (75 Stat. 4l9), and the loans are being liquidated by theAdministrator of General Services), the Reconstruction Finance *
Corporation liquidation fund, surplus property credit sales (see foot-note 1 at end of Table 7), and loans acquired pursuant to the DefenseProduction Act of 1950, as amended (50 App. U.S.C. 2091) throughDecember 31, 1960.
Figure for June 30, 1950, consists of Alaska housing loans. Subse-quent figures include also: beginning December 31, 1950, loans forcommunity facilities service (previously included under Public WorksAdministration), prefabricated housing loans (transferred from theReconstruction Finance Corporation) and urban renewal loans author-ized by the Housing Act of 1949, as amended (42 U.S.C. 1452 (a));beginning December 31, 1951, college housing loana authorized by theHousing Act of 1950, as amended (12 U.S.C. 1749); beginning December31, 1954, loans held by the revolving fund established pursuant tothe act approved June 24, 1954 (68 Stat. 295) for liquidation of notonly Alaska housing, community facilities service and prefabricatedhousing loans already included but also loans under the Farm SecurityAdministration program, the public war housing program, and theveterans' re-use housing program, all three of which previously werehandled by the Public Housing Administration; as of December 31,1955, public works planning loans authorized by the Housing Act of1954 approved August 2, 1954 (40 U.S.C. 462); beginning December 31,1956, public facility loans authorized by the Housing Amendments of1955 approved August 11, 1955 (42 U.S.C. 1491); as of December 31,1956, June 30, 1957, and from June 30, I960, through ^farch 31,1963, community disposal operations loans authorized by the AtomicEnergy Community Act of 1955 approved August 4, 1955 (42 U.S.C. 2301note) and Executive Order No. 10657 of February I4, 1956; and begin-ning September 30, 1961, loans for housing for the elderly authorizedby the Housing Act of 1959, as amended (12 U.S.C. 1701q).From June 30, 1956, through March 31, I960, the mortgage notes andsales contracts which had previously been classified as loans wereclassified as other assets and were not included in this table.These mortgage notes and sales contracts have now been reclassifiedas loans, and beginning June 30, I960, are included in this table(see footnote 1 at end of Table 7),Totals include loans of Home Owners' Loan Corporation amounting to
$84,2 million as of June 30, 1950, and $9.6 million as of December 31,1950.The Federal National Mortgage Association Charter Act approved August2, 1954 (12 U.S.C. 1716), authorized the Association to carry onthree functions consisting of management and liquidating functions,secondary market operations, and special assistance functions. Itsactivities ujider these three functions began on November 1, 1954.All figures in this column include the loans of the low-rent publichousing program fund (formerly known as the United States Housing Actprogram). Also included are the homes conversion program as of June30, 1950, the Farm Security Administration and public war housingprograms from June 30, 1950, through June 30, 1954, and the veterans're-use housing program from June 30, 1953, through June 30, 1954 (seefootnote 14)
.
The Veterans' Administration loan guaranty program was converted toa revolving fund effective July 1, 1961, pursuant to the act approvedJuly 14, I960 (74 Stat. 533).From June 30, 1956, through March 31, I960, notes receivable whichhad previously been classified as loans were classified as otherassets and were not included in this table. These notes have nowbeen reclassified as loans, and from June 30, i960, through September30, I96I, were included in this column. On October 4, 1961, thisCorporation was abolished pursuant to the act approved October 4,I96I (75 Stat. 773), and its remaining assets were transferred to the
Secretary of the Treasury for liquidation.Figures include loans for expansion of defense production from June
30, I95I, through June 30, 1953, and Federal civil defense loans asof June 30, 1953 (see footnote 11).
The major portion of the loans is held by: the Inland WaterwaysCorporation; Department of the Interior - Puerto Rico ReconstructionAdministration through December 31, 1954, fisheries loan fund be-ginning June 30, 1957, Indian loans, and Alaska public works loansbeginning June 30, I960; Department of the Army - guaranteed loans(World War II) through December 31, 1957; Office of Education - loansto students and educational institutions as of June 30, 1959, andfrom June 30, I960, through >farch 31, 1963; Federal Savings and LoanInsurance Corporation and Defense Department (military assistancecredit sales) beginning June 30, I960; and agencies reporting loanspursuant to the Defense Production Act of 1950, as amended (50 App,IF.S.C, 2091), which consist of the Departments of the Army beginningJune 30, I95I, Navy beginning December 31, 1951, and Air Force be-ginning June 30, 1956, and the General Services Administration as of
December 31 , 1959.Less than $50,000.

June 1961
.CUMDLATIVE TABLE OF CONTEHTS.
125
July 1962 through June 1963
Reporting bases.
Articles:
Treasury financing operations
Summary of Federal fiscal operations
Budget receipts and expenditures:
Receipts by principal sourcesDetail of miscellaneous receipts by major categoriesChart - Internal revenue receipts by principal sourcesExpenditures by agenciesInterfund transactions excluded from both net budget receiptsand budget expenditures
Summary of appropriations and authorizations, expenditures, andbalances, by agenciesExpenditures and balances by functionsDetail of excise tax receiptsSummary of internal revenue receipts by States, calendar year 1962.
Trust account and other transactions:
Summary of trust account and other transactionsTrust accoxint receiptsTrust and deposit fund account expendituresNet investment by Government agencies in public debt securities....Net redemption or sale of obligations of Government agencies inthe market
Intertrust fund transactions excluded from both net trust accountreceipts and net trust account expenditures
Federal Old-Age and Survivors Insurance Trust FundFederal Disability Insurance Trust FundRailroad Retirement Account.Unemployment Trust FundNational Service Life Insurance FundInvestments of specified trust accounts in public debt securities,by issues (latest date March 31, 1963)
Cash Income and outgo:
Summary of Federal Government cash transactions with the public...Derivation of Federal receipts from the public, and reconciliationto cash deposits In Treasurer's account
Derivation of Federal payments to the public, and reconciliationto cash withdrawals from Treasurer's account................... ...
Intragovemmental transactionsAccrued interest and other noncash expenditxires...... ..............Derivation of Federal net cash debt transactions with the public,and reconciliation to transactions through Treasurer's account....
Summary of cash transactions through Treasurer's account
Account of the Treasurer of the United States:
Status of the Account of the Treasurer of the United States.
Analysis of changes in tax and loan account balances
Debt outstanding:
Summary of Federal securitiesComputed Interest charge and rate on Federal securities
Interest-bearing public debt
Average length and maturity distribution of marketableinterest-bearing public debt
Special public debt issues to U. S. Government investment accounts.
Treasury holdings of securities Issued by Government agencies
Interest-bearing securities issued by Federal agencies but not
guaranteed by the U. S. Government
Statutory debt limitation
Public debt operations:
Maturity schedule of interest-bearing public marketable securities
other than regular weekly Treasury bills
Offerings of Treasury billsNew money financing through regular weekly Treasury bills
Offerings of public marketable securities other than regular
weekly Trea sury billsAllotments by Investor classes on subscriptions for public
marketable securities other than regular weekly Treasury bills
Disposition of matured public marketable securities other than
regular weekly Treasury billsForeign series securities (nonmarketable) issued to foreign
monetary authorities. ••
Foreign currency series securities (nonmarketable) Issued to foreign
monetary authorities
Issue and page number
1962
July
II
A-1
1
9
9
1011
12
13
15
16
16
1717
1815
2021
22
22
23
23
2425
26
28
3032
35
41
45
Aug.
A-1
1
9
91011
13
14
15
15
16
17
18
19
20
2122
23
2426
2728
292930
3031
32
33
34
35
37
39
42
48
52
Sept.
A-1
1
2
3
4
5
6
7
8
10
12
12
1314
15
16
17
18
192021
2224
2526
272728
2829
30
31
32
3335
37
40
46
50
II
A-1
1
101011
12
13
14
15
16
1718
19
2022
2324
25
2526
262728
29
30
31
3335
38
44
48
Nov.
II
A-
1
1
10101112
13
14
1516161718
19
21
222324
25
27
2829
303031
31
32
33
34
35
363840
43
49
53
Dec.
II
A-1
1
1212
13
U15
16
17
18
192021
22
24
2526
272728
282930
31
32
3335
37
40
46
50
1963
A-1
1
10101112
13
U
15
16
171819
2022
2324
252526
262728
29
30
31
33
35
39
46
50
Feb. Apr. May
II
A-1
1
10101112
13
14151616
1718
19
222324
2527
2829
303031
31
32
33
34
35
36
3840
44
51
55
A-1
1
78
10
12
12
13
14
15
16
17
18
192021
22
24
2526
272728
282930
31
32
33
35
37
40
45
48
54
55
II
A-1
1
10
11
11
12
13
14
15
16
17
18
1920
21
23
2425
262627
272829
30
31
32
3436
39
44
47
53
54
A-1
1
101011
12
13
U15
1616
1718
19
20
21
22
2324
2527
2829
30
30
31
31
32
33
34
35
36
38
40
43
48
51
57
58
(Continued on following page)
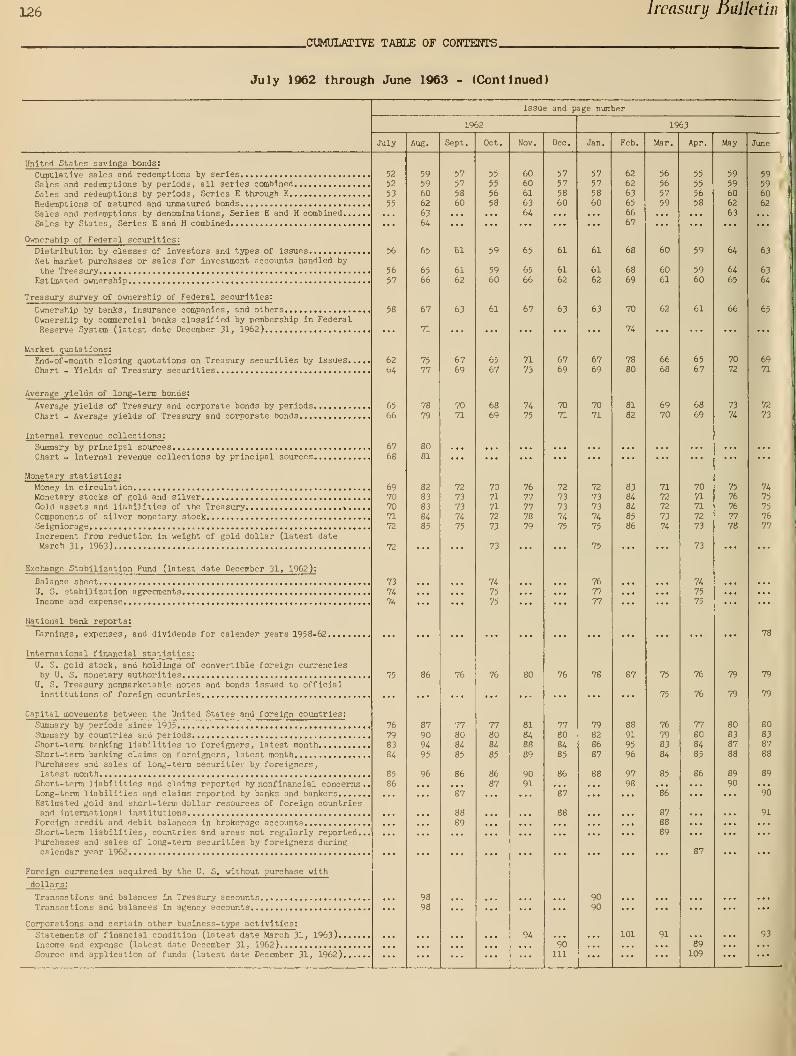
126 Ireasury huUetii.
.CUMULATIVE TABLE OF CONTENTS.
July 1962 through June 1963 - (Continued)
Issue and page number
1962
July Aug. Sept.
1963
Mar. Apr. May June
United States savings bonds:
Cumulative sales and redemptions by series
Sales and redemptions by periods, all series combined
Sales and redemptions by periods, Series E through K
Redemptions of matured and unmatured bonds
Sales and redemptions by denominations. Series E and H combined....
Sales by States, Series E and H combined
Ownership of Federal seciirities:
Distribution by classes of investors and types of Issues
Net market purchases or sales for investment accounts handled by
the Trea suryEstimated ownership
Treasury survey of ownership of Federal securities:
Ownership by banks, insurance companies, and othersOwnership by commercial banks classified by membership in Federal
Reserve System (latest date December 31, 1962)
Market quotations:
End-of-month closing quotations on Treasury securities by issues.
Chart - Yields of Treasury securities
Average yields of long-term bonds:
Average yields of Treasury and corporate bonds by periods.
Chart - Average yields of Treasxory and corporate bonds.,,.
Internal revenue collections:
Summary by principal sourcesChart - Internal revenue collections by principal sources.
Monetary statistics:
Money in circulationMonetary stocks of gold and silverGold assets and liabilities of the TreasuryComponents of silver monetary stockSeigniorageIncrement from reduction in weight of gold dollar (latest dateMarch 31, 1963)
Exchange Stabilization Fund (latest date December 31, 1962):
Balance sheetU, S. stabilization agreementsIncome and expense
National bank reports:
Earnings, expenses, and dividends for calendar years 1958-62
International financial statistics:
U. S. gold stock, and holdings of convertible foreign currenciesby U. S. monetary authorities
U. S. Treasury nonmarketable notes and bonds issued to officialinstitutions of foreign countries ,
Capital movements between the United States and foreign countries:
Summary by periods since 1935Summary by countries and periodsShort-term banking liabilities to foreigners, latest monthShort-term banJiing claims on foreigners, latest monthPurchases and sales of long-term securitler by foreigners,latest month
Short-term liabilities and claims reported by nonfinanclal concerns .
Long-term liabilities and claims reported by banks and bankersEstimated gold and short-term dollar resources of foreign countriesand international institutions
Foreign credit and debit balances in brokerage accountsShort-term liabilities, countries and areas not regularly reported..Purchases and sales of long-term securities by foreigners duringcalendar year 1962
Foreign currencies acquired by the U, S, without purchase with
dollars:
Transactions and balances in Treasury accounts.Transactions and balances in agency accounts,..
Corporations and certain other business-type activities:
Statements of financial condition (latest date March 31, 1963)..Income and expense (latest date December 31, 1962)Source and application of funds (latest date December 31, 1962).
52
52
53
55
56
56
57
58
62
64
65
67
69707071
72
72
73
74
74
75
76
79
8384
85
86
59
5960626364
65
65
66
67
71
75
77
78
79
8081
82
83838485
86
87909495
96
9898
57575860
61
61
62
63
6769
7071
72
73
73
7475
76
778084
85
86
's?
8889
55
55
56
58
59
5960
61
6567
6869
7071
71
72
73
73
7475
75
76
778084
85
86
87
606061
6364
65
6566
67
71
73
7475
7677777879
80
81
84
89
9091
57575860
61
61
62
63
6769
7071
72
73
737475
76
77808485
86
88
57575860
61
61
62
63
6769
7071
72
73
737475
75
76
7777
78
79
828687
88
9090
626263656667
68
68
69
70
74
7880
81
82
83
84
84
8586
87
88
919596
9798
56
5657
59
60
6061
62
6668
6970
7172
72
7374
75
75
76
79
83
84
85
'86
878889
55
55
5658
59
5960
61
6567
6869
7071
7172
73
73
74
75
75
76
76
77808485
86
59
596062
63
64
64
65
66
70
72
73
74
75
76
767778
79
79
80838788
89
90
94 101 91
90111
89109


TREASURY DEPARTMENTFISCAL SERVICE, BUREAU OF ACCOUNTS
OFFICE OF THE COMMISSIONERWASHINGTON 25. DC.
OFFICIAL BUSINESS
POSTAGE AND FEES PAfDU.S. TREASURY DEPARTMENT


^UNO^
4
Treas.HJ10
.kl
1963C.2
U.S. Treasury Dept.
Treasury Bulletin
/

...,i>;;::!i!il.„
iilpi
WWm*',;''.'i".'."lf.{!!a
;;;-:^^;;i:i'.','
y'C- ';:! ;''v.v!';';:''l
U.S. THEASURV LIBRARY
1 0032018