mix mbb questionnaire
TRANSCRIPT

8/2/2019 MIX MBB Questionnaire
http://slidepdf.com/reader/full/mix-mbb-questionnaire 1/22
Introduction
MIX Monitor Data Collection Tool
Please select your language: English
Thank you for pariticipating in an international movement towards standardization, transparency andrelevant benchmarks for the microfinance sector.
In order to provide us with a complete picture of your institution, please fill out each page of thisquestionnaire with the most details possible. The list below is an index that links to the different parts of the questionnaire, which has been divided into small sections for your convenience. The final sectionincludes a list of potential errors or inconsistencies that your data may have generated, as well as anopportunity for you to write any explanatory notes as needed.
General Information
Income Statement
Balance Sheet
Infrastructure
Products and Clients
Portfolio Report
Liabilities Analysis
In-kind subsidies
Final check
A B
1
2
3
4
5
6
7
8
9
10
11
12
1314
15
16
17
18
19
20
21
22
23
24
25
þÿEnglish
8/2/2019 MIX MBB Questionnaire
http://slidepdf.com/reader/full/mix-mbb-questionnaire 2/22
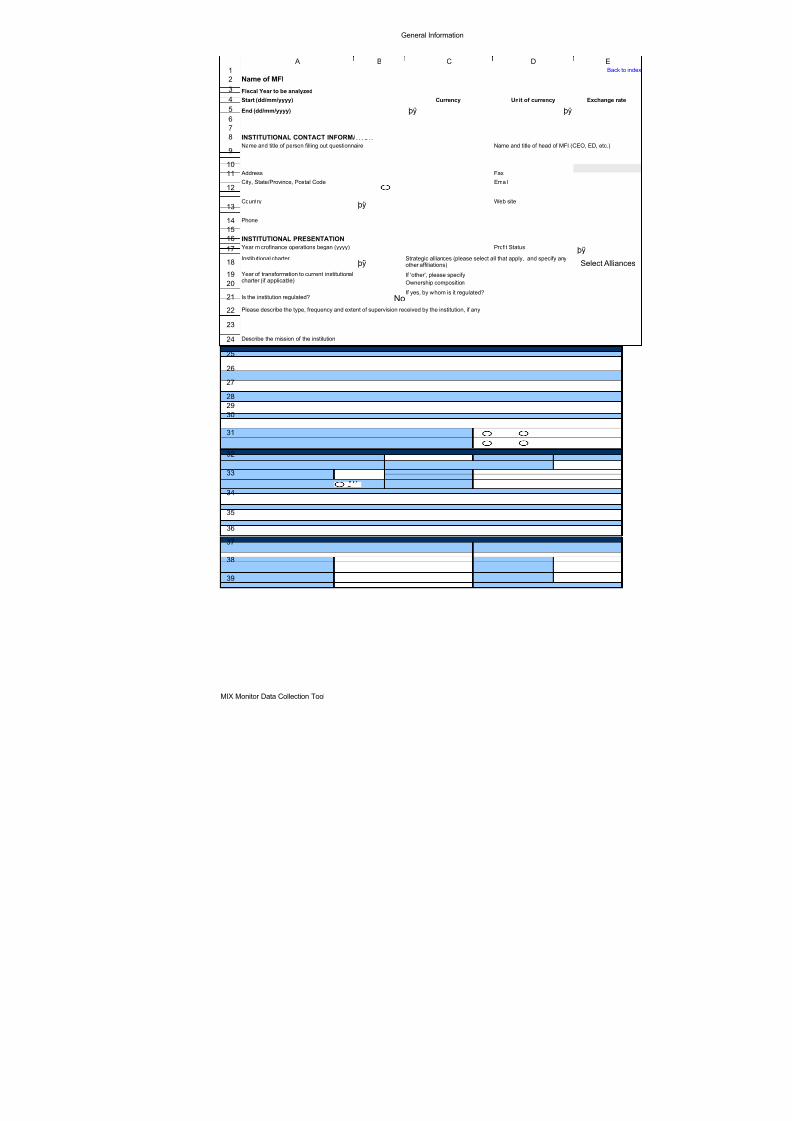
General Information
Name of MFI
Fiscal Year to be analyzed
Currency Unit of currency Exchange raStart (dd/mm/yyyy)
End (dd/mm/yyyy)
INSTITUTIONAL CONTACT INFORMATION
Name and title of person filling out questionnaire Name and title of head of MFI (CEO, ED, etc.)
Address Fax
City, State/Province, Postal Code Email
Country Web site
Phone
INSTITUTIONAL PRESENTATION
Year microfinance operations began (yyyy) Profit Status
Institutional charter
If 'other', please specify
Ownership composition
Is the institution regulated?If yes, by whom is it regulated?
Please describe the type, frequency and extent of supervision received by the institution, if any
Describe the mission of the institution
Describe the main challenges of the institution
ACCOUNTING METHODS
Does your institution use cash or accrual accounting? Which accounts are treated on each basis?
Describe any reserve accounts listed under equity on the Balance Sheet
Can your institution break out total assets between short term assets and long term assets?
Can your institution break out outstanding liabilities between short term and long term?
Back
Strategic alliances (please select all that apply, and specify anyother affiliations)
Year of transformation to current institutionalcharter (if applicable)
Does your institution adjust for the effects of inflation in its audited financial statements and/or in the financial information which you have presented to uif so, how?
Does your institution adjust accounts for the effects of translation/conversion of foreign currencies (including disposition of exchange gains/loss) in its afinancial statements and/or in the financial information which you have presented to us, and if so, how?
Yes No
Yes No
No
Select Allia
A B C D E
12
3
4
5678
9
10
11
12
13
141516
17
18
19
20
21
22
23
24
25
26
27
28
29
30
31
32
33
34
35
36
37
38
39
þÿ þÿ
þÿ
þÿ
þÿ
8/2/2019 MIX MBB Questionnaire
http://slidepdf.com/reader/full/mix-mbb-questionnaire 3/22
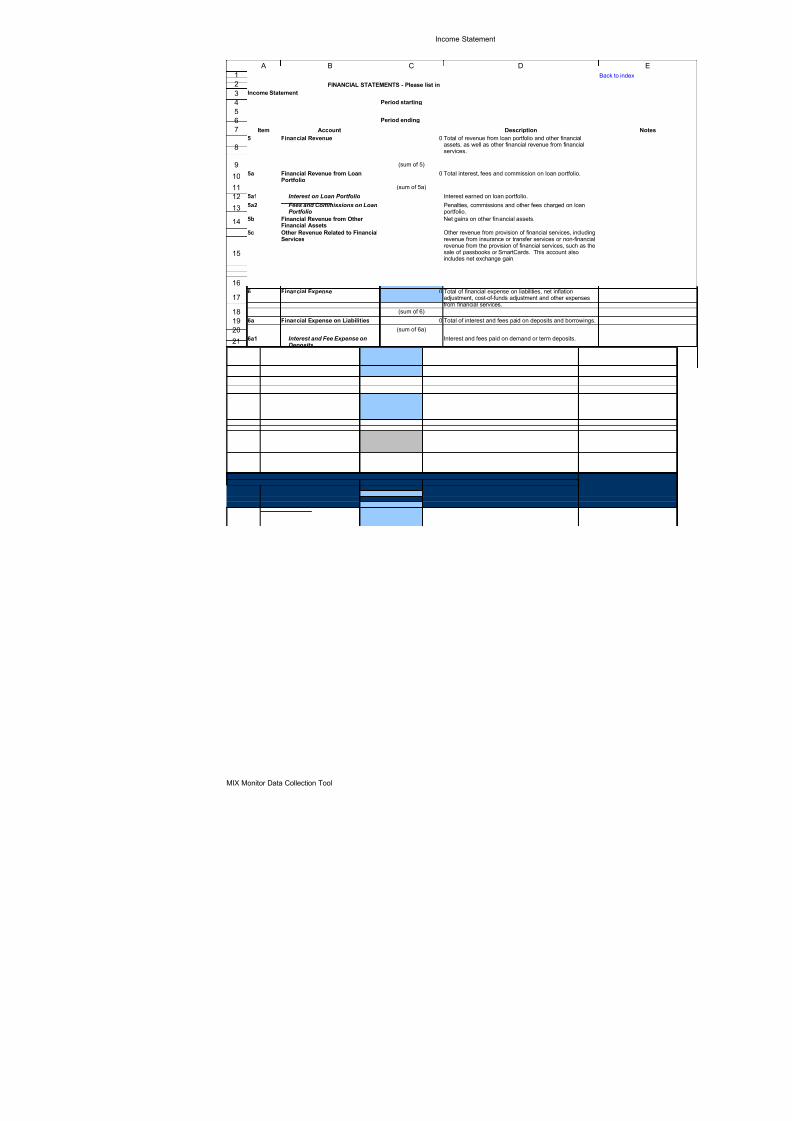
Income Statement
FINANCIAL STATEMENTS - Please list in
Income Statement
Item Account
Period starting
Description
Period ending
5 Financial Revenue 0
(sum of 5)
5a 0 Total interest, fees and commission on loan portfolio.
(sum of 5a)
5a1 Interest on Loan Portfolio Interest earned on loan portfolio.
5a2
5b Net gains on other financial assets.
5c
6 Financial Expense 0
(sum of 6)
6a Financial Expense on Liabilities 0 Total of interest and fees paid on deposits and borrowings.
(sum of 6a)
6a1 Interest and fees paid on demand or term deposits.
6a2 Interest and fees paid on borrowings.
6b Net Inflation Adjustment Expense 0
(sum of 6b)
6b1 Inflation Adjustment Expense Cost of maintaining the value of the institution's equity.
6b2 Inflation Adjustment Revenue Gain on the value of fixed assets due to inflation.
6c
6d Other Financial Expenses
7 NET FINANCIAL INCOME 0 Financial Revenue minus Financial Expense.
(5 less 6)
Back to
Total of revenue from loan portfolio and other financialassets, as well as other financial revenue from financialservices.
Financial Revenue from LoanPortfolio
Fees and Commissions on LoanPortfolio
Penalties, commissions and other fees charged on loanportfolio.
Financial Revenue from Other Financial Assets
Other Revenue Related to FinancialServices
Other revenue from provision of financial services, includingrevenue from insurance or transfer services or non-financialrevenue from the provision of financial services, such as thesale of passbooks or SmartCards. This account alsoincludes net exchange gain.
Total of financial expense on liabilities, net inflationadjustment, cost-of-funds adjustment and other expensesfrom financial services.
Interest and Fee Expense onDeposits
Interest and Fee Expense onBorrowings
Reserved for institutions that use inflation based accounting.Net amount of inflation adjustment.
Subsidized Cost-of-FundsAdjustment Expense
Adjustment expense for difference between market rate andconcessional rate on funding liabilities (reserved for MIXuse).
Other expenses from provision of financial services,including non-financial expenses on financial products, aswell as net exchange depreciation.
A B C D1
2
3
4
567
8
9
10
1112
13
14
15
16
17
1819
2021
22
23
242526
27
28
29303132

8/2/2019 MIX MBB Questionnaire
http://slidepdf.com/reader/full/mix-mbb-questionnaire 4/22
Income Statement
8 Net Loan Loss Provision Expense 0
(sum of 8)
8a Loan Loss Provision Expense Loan Loss Provision Expense for the period.
8b Recovery on Loans Written-off Total recovery on loans written off.
10 Operating Expense 0 Total of Personnel Expense and Administrative Expense.
(sum of 10)
10a Personnel Expense
10b Administrative Expense 0
(sum of 10b)10b1 Rent and Utilities Rent and utility charges.
10b2 Transportation
10b3 Office Supplies Printed matter, supplies, photocopies, books, etc.
10b4 Depreciation and Amortization
10b5 Other Administrative Expenses Other non-personnel administrative expenses.
11 NET OPERATING INCOME 0
(7 less 8 less 10)
12 Net Non-Operating Income 0 Non-operating Revenue less Non-operating Expense.
(sum of 12)
12a Non-Operating Revenue
12b Non-Operating Expense
13 0 Net Operating Income plus Net Non-operating Income.
(11+12)
14 Taxes
15 0 Net Income (before Taxes and Donations) less Taxes.
(13 less 14) (13-14)
16 Donations made to the MFI to subsidize its operations.
17 0
(15+16)
Sum of loan loss provision expense and recovery on loanloss provision.
Salaries, withholdings, fringe benefits and personnel taxespaid on all those who work for the institution.
Total of Rent and Utilities, Transportation, Office Supplies,Depreciation and Other Administrative Expenses.
Transportation of staff to attend to clients and to manageoperations.
Allowance for deterioration, eventual replacement of equipment.
Financial Revenue less Financial Expense, Net Loan LossProvision Expense and Operating Expense.
Revenue from activity unrelated to the MFI's core activity of providing financial services. This could include consultingincome, sale of IT products, or fees for BDS.
Expenses from activity unrelated to the MFIs core activity of providing financial services, such as BDS development
costs or consulting expenses.
NET INCOME (BEFORE TAXESAND DONATIONS)
Includes all taxes paid on Net Income or other measure of profits as defined by local tax authorities.
NET INCOME (AFTER TAXES ANDBEFORE DONATIONS)
Donations to Subsidize FinancialServices
NET INCOME (AFTER TAXES ANDDONATIONS)
Net Income (after Taxes and before Donations) plusDonations.
Back to i
ccts Irrecouvrabl
A B C D
33
34
35
36373839
40
41
4243
44
45
46
47
48
49
50
51
52
53
54
55
56
57
5859
60
61
62
63
6465
66
67
6869

8/2/2019 MIX MBB Questionnaire
http://slidepdf.com/reader/full/mix-mbb-questionnaire 5/22
Balance Sheet
MIX Monitor Data Collection Tool
FINANCIAL STATEMENTS - Please list in
Balance Sheet As of
Item Account Description
Assets
1a Cash and Due from Banks
1b Reserves in Central Bank Cash reserves in a central bank.
1c Short Term Financial Assets
1d Net Loan Portfolio 0 Gross Loan Portfolio minus Loan Loss Reserve.
(sum of 1d)
1d1 Gross Loan Portfolio
1d2 Loan Loss Reserve
1e Interest Receivable
1f
1g Long Term Financial Assets Long term investments not convertible to cash within 12 months.
1h Net Fixed Assets
1 TOTAL ASSETS 0 Total of all net asset accounts.
(sum of 1)
Cash, petty cash, balances in banks, including non-interest bearingdeposits.
Treasury bills and other short term investments, including interest-bearing deposits, convertible to cash within 12 months. Usually used inliquidity management.
All outstanding principal for all outstanding client loans, includingcurrent, delinquent and restructured loans, but not loans that have beenwritten off. It does not include interest receivable. It does not includeemployee loans.
The portion of the gross loan portfolio that has been expensed(provisioned for) in anticipation of losses due to default. This itemrepresents the cumulative value of the loan loss provision expense, lessthe cumulative value of loans written off.
Interest receivable on all asset accounts. Recorded by institutionsusing accrual accounting.
Accounts Receivable and Other Assets
Accounts receivable, notes receivables and other receivables. Thisincludes all receivables other than client loan accounts, includingemployee loans.
The purchase value of property, plant and equipment, less accumulateddepreciation. This includes intangibles, such as MIS development or
goodwill, less accumulated amortization.
A B C D
2
3
4
5
6
7
8
9
10
11
12
13
14
15
16
171819

8/2/2019 MIX MBB Questionnaire
http://slidepdf.com/reader/full/mix-mbb-questionnaire 6/22
Balance Sheet
MIX Monitor Data Collection Tool
Liabilities
2a Demand Deposits 0 Total of Voluntary and Compulsory Savings.
(sum of 2a)
2a1 Voluntary Savings
2a2 Compulsory Savings
2b Time Deposits Certificates of deposit or other fixed term deposits.
2c Total Borrowings 0 Total of Commercial and Concessional Borrowings.
(sum of 2c)
2c1
2c2
2d Interest Payable
2e
2 TOTAL LIABILITIES 0 Total of all liability accounts.
(sum of 2)
Demand deposits from the general public and members that are notmaintained as a condition for accessing a current or future loan and areheld with the institution.
Client savings accounts that are maintained as a condition for a currentor future loan and are held with the institution.
Borrowings at Concessional Interest Rates
Principal balance of all borrowings, including overdraft accounts, for which the institution pays a nominal rate of interest that is less than thelocal commercial interest rate.
Borrowings at Commercial Interest Rates
Principal balance of all borrowings, including overdraft accounts, for which the institution pays a nominal rate of interest that is greater thanto or equal to the local commercial interest rate.Interest payable on all liability accounts. Recorded by institutions usingaccrual accounting.
Accounts Payable and Other Liabilities
Other liabilities including tax and salary liabilities, social withholdings,deferred income, other accounts payable, including liabilities that do notfund the portfolio, such as mortgages on real estate.
A B C D
202122
23
24
25
26
27
28
29
30
31
323334

8/2/2019 MIX MBB Questionnaire
http://slidepdf.com/reader/full/mix-mbb-questionnaire 7/22
Balance Sheet
MIX Monitor Data Collection Tool
Equity
3a Paid-in Capital Capital paid by shareholders or members.
3b Donated Equity 0 Accumulated donations.
(sum of 3b)
3b1 Prior Years Accumulated donations from prior periods.
3b2 Current Year 0 Accumulated donations from the current year.
(line 16 from IS)
3c Retained Earnings 0 Accumulated net income after taxes and before donations.
(sum of 3c)
3c1 Prior Years
3c2 Current Year 0
(line 15 from IS)
3d Adjustments 0 Value of all adjustments, including inflation adjustment.
(sum of 3d)
3d1 Inflation Adjustment
3d2
3d3 In-Kind Subsidy Adjustment Value in-kind subsidy adjustment (reserved for MIX use).
3e Reserves
3f Other Equity Accounts Other equity accounts not included elsewhere.
3 TOTAL EQUITY 0 Total of all equity accounts.
(sum of 3)
4 TOTAL LIABILITIES AND EQUITY 0 Total of Total Liabilities and Total Equity.
(2+3)
Accumulated net income after taxes and before donations from prior periods.
Accumulated net income after taxes and before donations from thecurrent year.
Value of inflation adjustment expense (reserved for institutionspracticing inflation-based accounting).
Subsidized Cost of Funds Adjustment
Value of subsidized cost of funds adjustment expense (reserved for MIX use).
Reserves such as those imposed by law or statute. Explain anyreserves used by the institution.
A B C D
3536
37
38
39
40
41
42
43
44
45
46
4748
49
50
51
52
53
54
55
5657
58

8/2/2019 MIX MBB Questionnaire
http://slidepdf.com/reader/full/mix-mbb-questionnaire 8/22
Balance Sheet
MIX Monitor Data Collection Tool
Please provide the following account balances for the previous fiscal year
TOTAL ASSETS, as of
Net fixed assets, as of
Gross Loan Portfolio, as of TOTAL EQUITY, as of
Back to index
A B C D E
5965666768
697071
8/2/2019 MIX MBB Questionnaire
http://slidepdf.com/reader/full/mix-mbb-questionnaire 9/22
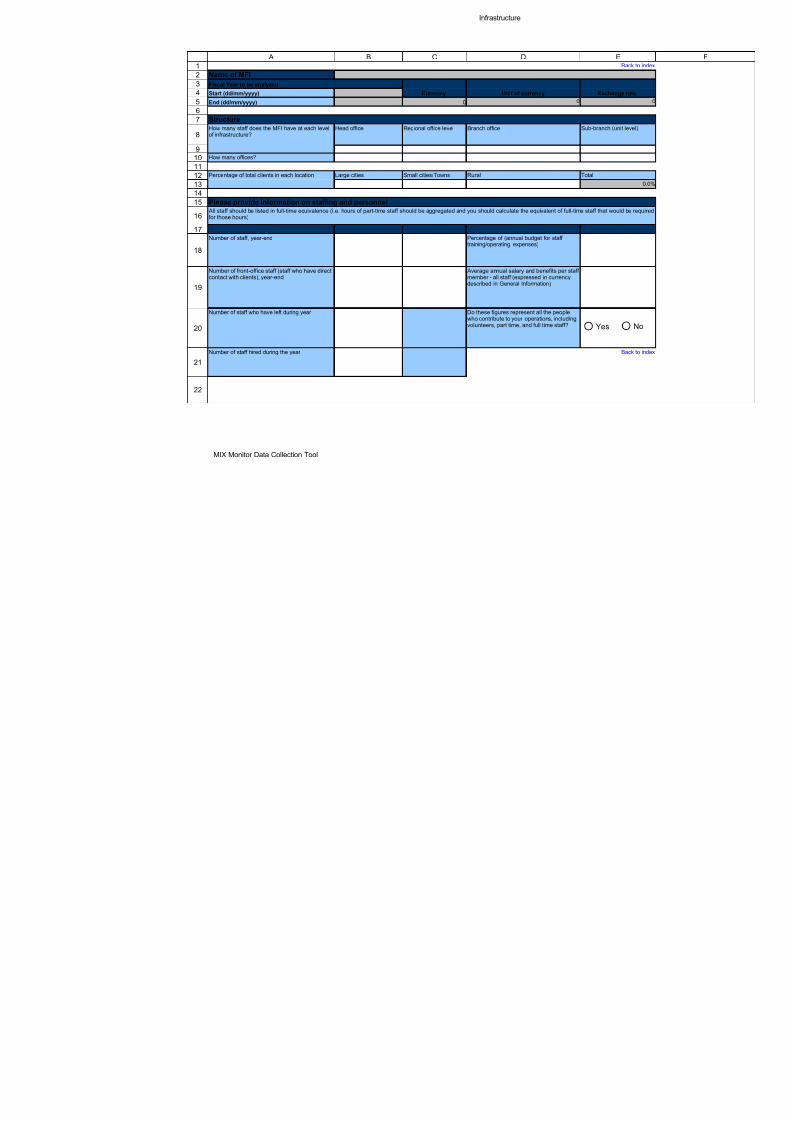
Infrastructure
MIX Monitor Data Collection Tool
Name of MFI
Fiscal Year to be analyzed
Currency Unit of currency ExchangStart (dd/mm/yyyy)
End (dd/mm/yyyy) 0 0
StructureHead office Regional office level Branch office Sub-branch (un
How many offices?
Percentage of total clients in each location Large cities Small cities/Towns Rural Total
Please provide information on staffing and personnel
Number of staff, year-end
Number of staff who have left during year
Number of staff hired during the year
How many staff does the MFI have at each levelof infrastructure?
All staff should be listed in full-time equivalence (i.e. hours of part-time staff should be aggregated and you should calculate the equivalent of full-time staff that woulfor those hours)
Percentage of (annual budget for staff training/operating expenses)
Number of front-office staff (staff who have directcontact with clients), year-end
Average annual salary and benefits per staff member - all staff (expressed in currencydescribed in General Information)
Do these figures represent all the peoplewho contribute to your operations, includingvolunteers, part time, and full time staff? Yes
A B C D E12345
67
8
91011121314
15
16
17
18
19
20
21
22
8/2/2019 MIX MBB Questionnaire
http://slidepdf.com/reader/full/mix-mbb-questionnaire 10/22
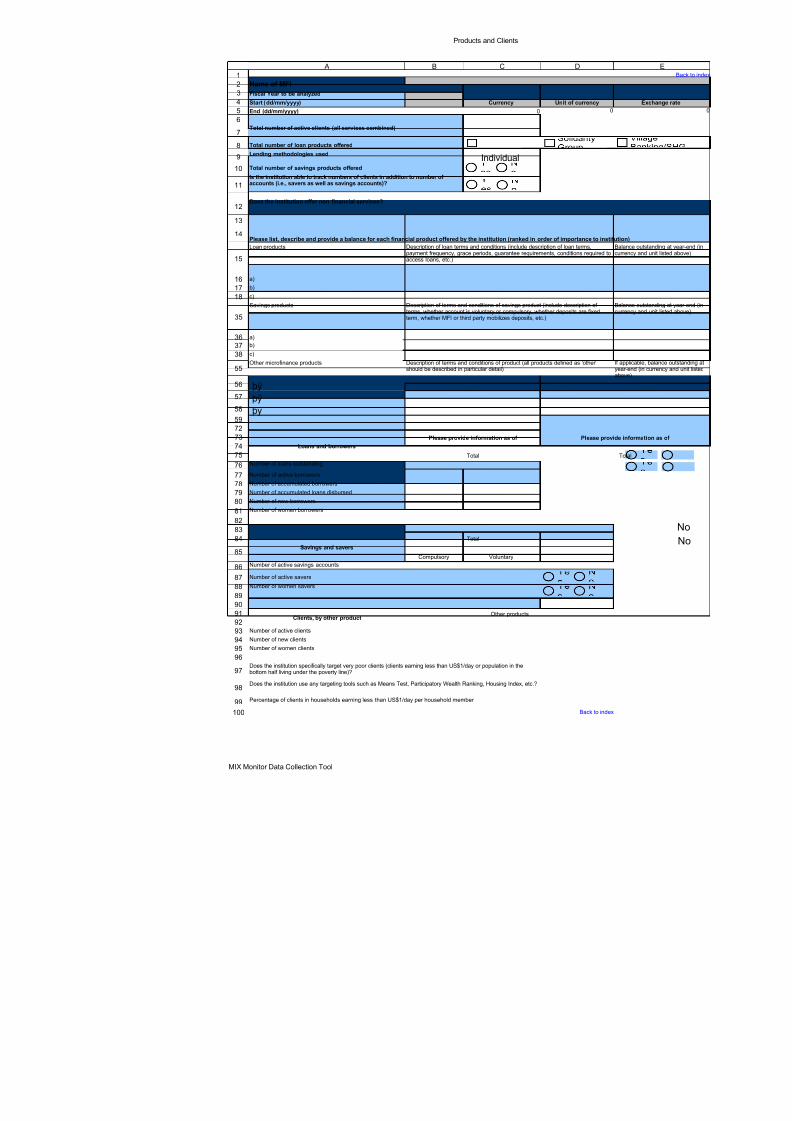
Products and Clients
Name of MFI
Fiscal Year to be analyzed
Currency Unit of currencyStart (dd/mm/yyyy)
End (dd/mm/yyyy) 0 0
Total number of active clients (all services combined)
Total number of loan products offered
Lending methodologies used
Total number of savings products offered
Does the institution offer non financial services?
Please list, describe and provide a balance for each financial product offered by the institution (ranked in order of importance to institu
Loan products
a)
b)
c)
Savings products
a)
b)
c)
Other microfinance products
Loans and borrowers
Please provide information as of Please provide
Total T
Number of loans outstanding
Number of active borrowers
Number of accumulated borrowers
Number of accumulated loans disbursed
Number of new borrowers
Number of women borrowers
Savings and savers
Total
Compulsory VoluntaryNumber of active savings accounts
Number of active savers
Number of women savers
Clients, by other productOther products
Number of active clients
Is the institution able to track numbers of clients in addition to number of accounts (i.e., savers as well as savings accounts)?
Description of loan terms and conditions (include description of loan terms,payment frequency, grace periods, guarantee requirements, conditions required toaccess loans, etc.)
Bacu
Description of terms and conditions of savings product (include description of terms, whether account is voluntary or compulsory, whether deposits are fixedterm, whether MFI or third party mobilizes deposits, etc.)
Bacu
Description of terms and conditions of product (all products defined as 'other'should be described in particular detail)
If yeab
Individual
A B C D
123
4
56
7
8
9
10
11
12
1314
15
161718
35
363738
55
56
57
58
59
72
73
7475
76
77787980
81
82
83
84
85
86
87
88
89
90
919293
þÿ
þÿ
þÿ

8/2/2019 MIX MBB Questionnaire
http://slidepdf.com/reader/full/mix-mbb-questionnaire 11/22
Portfolio Report
Name of MFI
Fiscal Year to be analyzed
Currency Unit of currency ExchangStart (dd/mm/yyyy)
End (dd/mm/yyyy) 0 0
Repayment performance of outstanding Loan Portfolio
Please provide information as of Were there any renegotiated loans on this year's Balance Sheet?
Does the MFI track renegotiated loans separate from non-renegotiated loans?
Aging/Status of portfolio Number of loans Amount - listed in
Current portfolio, on-time (< 30 Days, non-renegotiated loans)
Portfolio balance affected by overdue payments (non-renegotiated loans)
30-90 Days
91-180 Days
181-365 Days
366+ Days
All renegotiated loans
Gross Loan Portfolio - -
Please explain how your institution calculates delinquency (portfolio balance affected by overdue payments) as given in the above table
Please describe precisely your institution's policy regarding provisioning and write-offs
Loan Loss Reserve for FY ended
Loan Loss Reserve for FY ended
Loan Loss Provision Expense for FY ended
Loans written off in FY ended
Ba
Ba
e
A B C D E
123456
7
8
9
10
1112
13
14
15
1617
18
19
20
21
22
23
24
25
262728
29
3031

8/2/2019 MIX MBB Questionnaire
http://slidepdf.com/reader/full/mix-mbb-questionnaire 12/22
Liabilities Analysis
MIX Monitor Data Collection Tool
Name of MFI
Fiscal Year to be analyzed
Currency Unit of currency Exchange rateStart (dd/mm/yyyy)
End (dd/mm/yyyy) 0 0 0
17
Description of institutional borrowings
a)
b)
c)
d)
e)
f)
Total borrowings, current year (Line 2c of Balance Sheet) 0
Total borrowings, as of
Back to index
How many individual borrowings (either commercial or concessional)appear on the current year's Balance Sheet?
Source, including name and description (if possible)
Nominal interest ratepaid on this borrowing
Would you classify this as a liability froma public or private source?
Amount of this liabilityon Balance Sheet
Back to index
A B C D E F
12
345
67
8
9
10
11
12
13
14
15
16
48
49
50
þÿ
þÿ
þÿ
þÿ
þÿ
þÿ
þÿpublic
þÿpublic
8/2/2019 MIX MBB Questionnaire
http://slidepdf.com/reader/full/mix-mbb-questionnaire 13/22
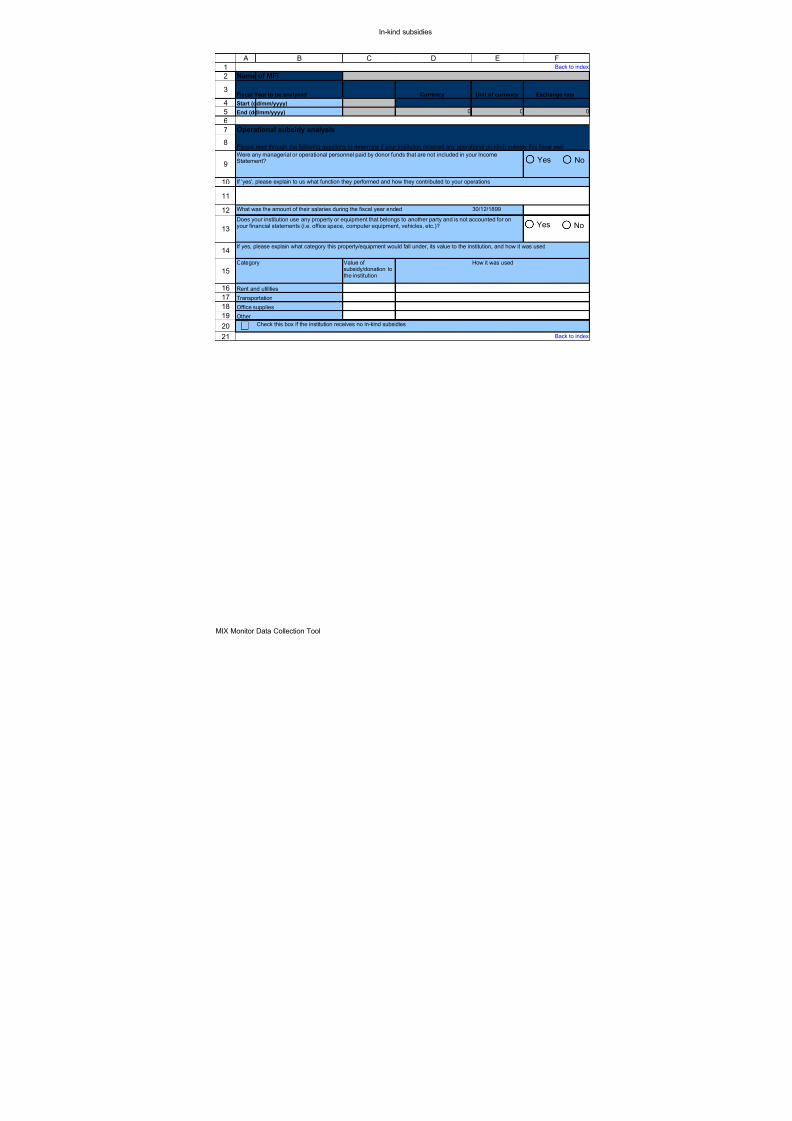
In-kind subsidies
MIX Monitor Data Collection Tool
Name of MFI
Fiscal Year to be analyzed Currency Unit of currency Exchange rate
Start (dd/mm/yyyy)
End (dd/mm/yyyy) 0 0 0
Operational subsidy analysis
Please read through the following questions to determine if your institution received any operational (in-kind) subsidy this fiscal year
If 'yes', please explain to us what function they performed and how they contributed to your operations
What was the amount of their salaries during the fiscal year ended 30/12/1899
If yes, please explain what category this property/equipment would fall under, its value to the institution, and how it was used
Category How it was used
Rent and utilities
Transportation
Office supplies
Other
Check this box if the institution receives no in-kind subsidies
Back to index
Were any managerial or operational personnel paid by donor funds that are not included in your IncomeStatement?
Does your institution use any property or equipment that belongs to another party and is not accounted for onyour financial statements (i.e. office space, computer equipment, vehicles, etc.)?
Value of subsidy/donation tothe institution
Back to index
Yes No
Yes No
A B C D E F
12
3
4
56
7
8
9
10
11
12
13
14
15
16
17
18
19
20
21
8/2/2019 MIX MBB Questionnaire
http://slidepdf.com/reader/full/mix-mbb-questionnaire 14/22
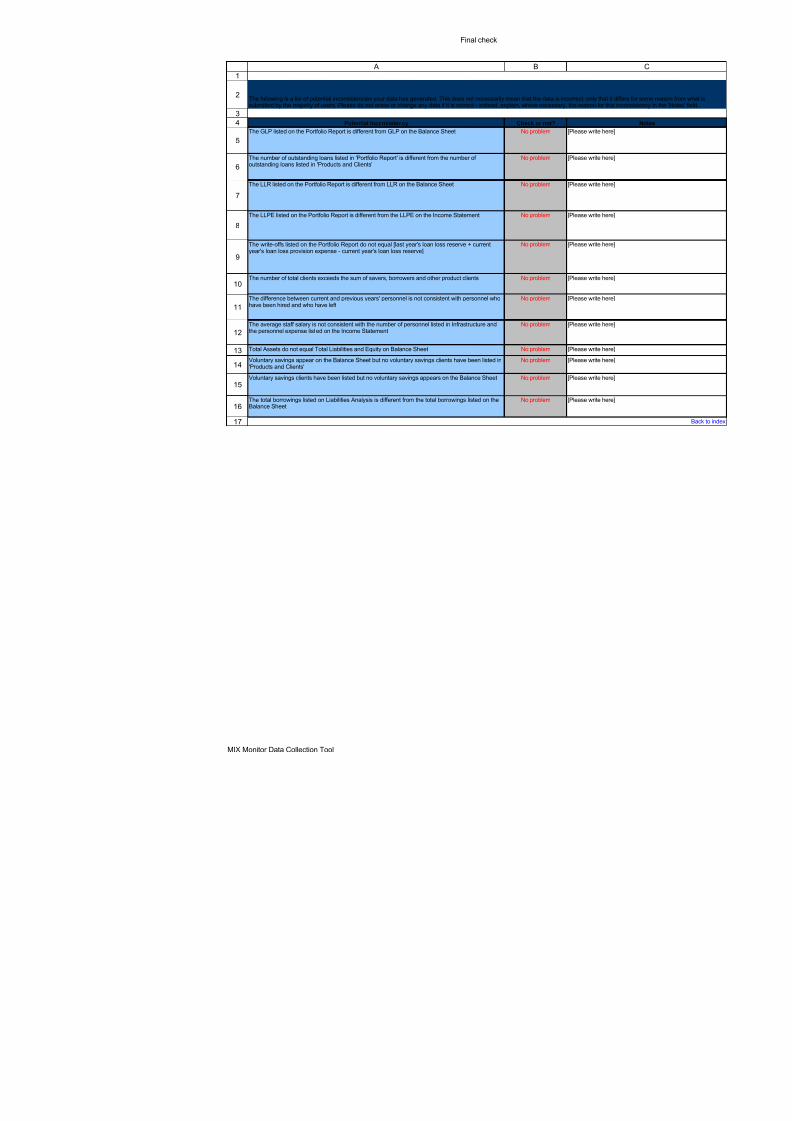
Final check
Potential Inconsistency Check or not?
The GLP listed on the Portfolio Report is different from GLP on the Balance Sheet No problem [Please write here]
No problem [Please write here]
The LLR listed on the Portfolio Report is different from LLR on the Balance Sheet No problem [Please write here]
The LLPE listed on the Portfolio Report is different from the LLPE on the Income Statement No problem [Please write here]
No problem [Please write here]
The number of total clients exceeds the sum of savers, borrowers and other product clients No problem [Please write here]
No problem [Please write here]
No problem [Please write here]
Total Assets do not equal Total Liabilities and Equity on Balance Sheet No problem [Please write here]
No problem [Please write here]
Voluntary savings clients have been listed but no voluntary savings appears on the Balance Sheet No problem [Please write here]
No problem [Please write here]
The following is a list of potential inconsistencies your data has generated. This does not necessarily mean that the data is incorrect, only that it disubmitted by the majority of users. Please do not erase or change any data if it is correct - instead, explain, where necessary, the reason for this i
The number of outstanding loans listed in 'Portfolio Report' is different from the number of outstanding loans listed in 'Products and Clients'
The write-offs listed on the Portfolio Report do not equal [last year's loan loss reserve + currentyear's loan loss provision expense - current year's loan loss reserve]
The difference between current and previous years' personnel is not consistent with personnel whohave been hired and who have left
The average staff salary is not consistent with the number of personnel listed in Infrastructure and
the personnel expense listed on the Income Statement
Voluntary savings appear on the Balance Sheet but no voluntary savings clients have been listed in'Products and Clients'
The total borrowings listed on Liabilities Analysis is different from the total borrowings listed on theBalance Sheet
A B
1
2
34
5
6
7
8
9
10
11
12
13
14
15
16
17

8/2/2019 MIX MBB Questionnaire
http://slidepdf.com/reader/full/mix-mbb-questionnaire 15/22
Label data (language) Page 15No. English
GI1 Name of MFIGI2 Fiscal Year to be analyzedGI3 Start (dd/mm/yyyy)GI4 End (dd/mm/yyyy)GI5 CurrencyGI6 Unit of currencyGI7 Exchange rate
YesNo
INSTITUTIONAL CONTACT INFORMATIONGI8 Name and title of person filling out questionnaireGI9 Name and title of head of MFI (CEO, ED, etc.)GI10 AddressGI11 City, State/Province, Postal CodeGI12 CountryGI13 PhoneGI14 FaxGI15 Email
GI16 Web site
INSTITUTIONAL PRESENTATIONGI17 Year microfinance operations began (yyyy)GI19
GI20 Profit Status-Select one-ProfitNon-profit
GI24 Institutional charter -Please select-
BankCredit Union/CooperativeNon-Bank Financial IntermediaryNon Governmental Organization (NGO)Rural BankOther
GI32 Ownership compositionGI33
Select Alliances
If 'other', please specifyGI34 Is the institution regulated?GI35 If yes, by whom is it regulated?
YesNo
GI38
GI39 Describe the mission of the institutionGI40 Describe the main challenges of the institution
ACCOUNTING METHODSGI40
Year of transformation to currentinstitutional charter (if applicable)
Strategic alliances (please select all thatapply,and specify any other affiliations)
Please describe the type, frequency andextent of supervision received by theinstitution, if any
Does your institution use cash or accrual accounting? Which accounts aretreated on each basis?
A B C
123456789
101112131415161718192021
22232425
26
272829303132
33343536373839
40
414243444546
47
48495051
52

8/2/2019 MIX MBB Questionnaire
http://slidepdf.com/reader/full/mix-mbb-questionnaire 16/22
Label data (language) Page 16GI41
GI42
GI43
GI44
GI45
FINANCIAL STATEMENTS - Please list in
Balance SheetItem Account As of Description Assets
FS1a Cash and Due from Banks
FS1b Reserves in Central Bank Cash reserves in a central bank.
FS1c Short Term Financial Assets
FS1d Net Loan Portfolio Gross Loan Portfolio minus Loan Loss Reserve.
(sum of 1d)
FS1d1 Gross Loan Portfolio
FS1d2 Loan Loss Reserve
FS1e Interest Receivable
FS1f Accounts Receivable and Other Assets
FS1g Long Term Financial Assets Long term investments not convertible to cash within 12 months.
FS1h Net Fixed Assets
FS1 TOTAL ASSETS Total of all net asset accounts.
(sum of 1)
Liabilities
FS2a Demand Deposits Total of Voluntary and Compulsory Savings.
(sum of 2a)
FS2a1 Voluntary Savings
FS2a2 Compulsory Savings
FS2b Time Deposits Certificates of deposit or other fixed term deposits.
Does your institution adjust for theeffects of inflation in its audited financialstatements and/or in the financialinformation which you have presented tous, and if so, how?
Does your institution adjust accounts for the effects of translation/conversion of foreign currencies (including dispositionof exchange gains/loss) in its auditedfinancial statements and/or in thefinancial information which you havepresented to us, and if so, how?
Describe any reserve accounts listedunder equity on the Balance Sheet
Can your institution break out totalassets between short term assets andlong term assets?
Separation of all asset accounts between amountsmaturing within and beyond 12 months
Can your institution break outoutstanding liabilities between shortterm and long term?
Separation of all liability accounts between amountspayable within and beyond 12 months
Cash, petty cash, balances in banks, including non-interest bearingdeposits.
Treasury bills and other short term investments, including interest-bearing deposits, convertible to cash within 12 months. Usuallyused in liquidity management.
All outstanding principal for all outstanding client loans, includingcurrent, delinquent and restructured loans, but not loans that havebeen written off. It does not include interest receivable. It doesnot include employee loans.
The portion of the gross loan portfolio that has been expensed(provisioned for) in anticipation of losses due to default. This itemrepresents the cumulative value of the loan loss provisionexpense, less the cumulative value of loans written off.
Interest receivable on all asset accounts. Recorded by institutionsusing accrual accounting.
Accounts receivable, notes receivables and other receivables.This includes all receivables other than client loan accounts,including employee loans.
The purchase value of property, plant and equipment, lessaccumulated depreciation. This includes intangibles, such as MISdevelopment or goodwill, less accumulated amortization.
Demand deposits from the general public and members that arenot maintained as a condition for accessing a current or future loanand are held with the institution.Client savings accounts that are maintained as a condition for acurrent or future loan and are held with the institution.
A B C
53
54
55
56
57
5859
606162636465
66
67
68
6970
71
72
73
74
75
76
7778798081
82
83
84
8/2/2019 MIX MBB Questionnaire
http://slidepdf.com/reader/full/mix-mbb-questionnaire 17/22
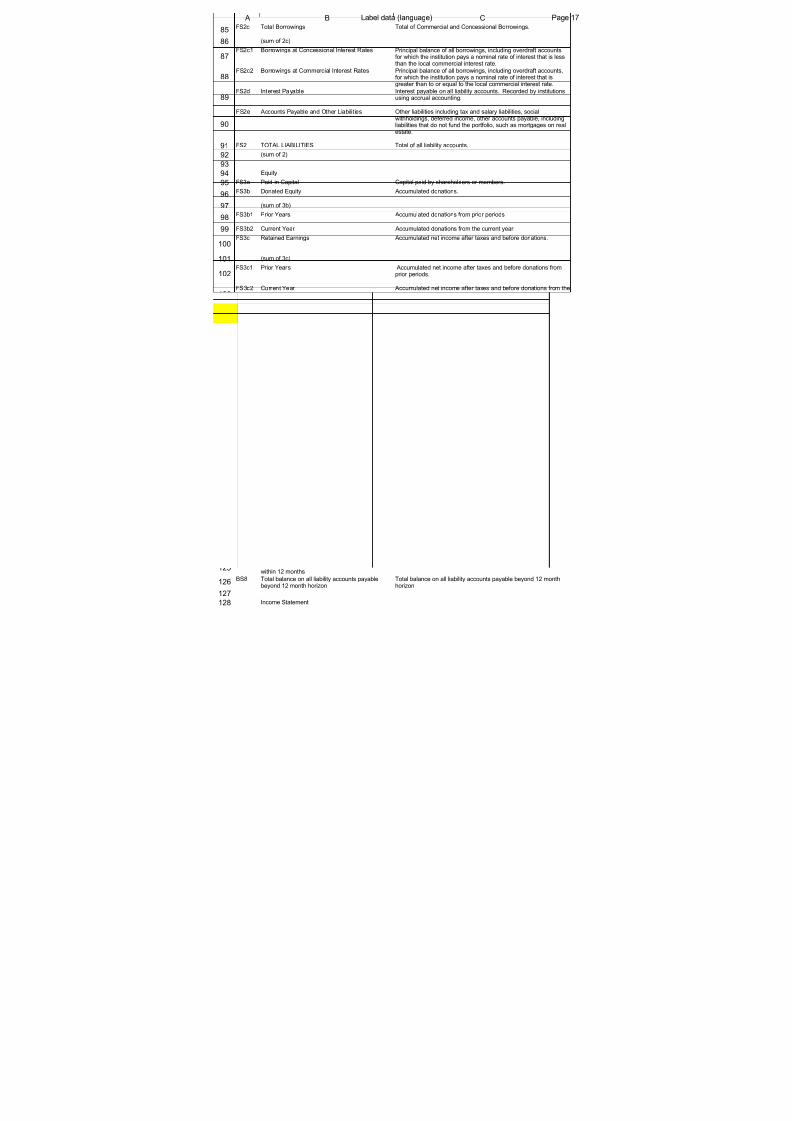
Label data (language) Page 17FS2c Total Borrowings Total of Commercial and Concessional Borrowings.
(sum of 2c)
FS2c1 Borrowings at Concessional Interest Rates
FS2c2 Borrowings at Commercial Interest Rates
FS2d Interest Payable
FS2e Accounts Payable and Other Liabilities
FS2 TOTAL LIABILITIES Total of all liability accounts.
(sum of 2)
Equity
FS3a Paid-in Capital Capital paid by shareholders or members.
FS3b Donated Equity Accumulated donations.
(sum of 3b)
FS3b1 Prior Years Accumulated donations from prior periods.
FS3b2 Current Year Accumulated donations from the current year.
FS3c Retained Earnings Accumulated net income after taxes and before donations.
(sum of 3c)
FS3c1 Prior Years
FS3c2 Current Year
FS3d Adjustments Value of all adjustments, including inflation adjustment.
(line 15 from IS)
(line 16 from IS)(sum of 3d)
FS3d1 Inflation Adjustment
FS3d2 Subsidized Cost of Funds Adjustment
FS3d3 In-Kind Subsidy Adjustment Value in-kind subsidy adjustment (reserved for MIX use).
FS3e Reserves
FS3f Other Equity Accounts Other equity accounts not included elsewhere.
FS3 TOTAL EQUITY Total of all equity accounts.
(sum of 3)
FS4 TOTAL LIABILITIES AND EQUITY Total of Total Liabilities and Total Equity.
BS1 Gross Loan Portfolio, as of
BS2 TOTAL ASSETS, as of
BS3 Net fixed assets, as of
BS4 TOTAL EQUITY, as of
BS5
BS6
BS7 Total balance on all liability accounts payable within 12 months
BS8
Income Statement
Principal balance of all borrowings, including overdraft accounts,for which the institution pays a nominal rate of interest that is lessthan the local commercial interest rate.Principal balance of all borrowings, including overdraft accounts,for which the institution pays a nominal rate of interest that isgreater than to or equal to the local commercial interest rate.Interest payable on all liability accounts. Recorded by institutionsusing accrual accounting.
Other liabilities including tax and salary liabilities, socialwithholdings, deferred income, other accounts payable, includingliabilities that do not fund the portfolio, such as mortgages on realestate.
Accumulated net income after taxes and before donations fromprior periods.
Accumulated net income after taxes and before donations from thecurrent year.
Value of inflation adjustment expense (reserved for institutionspracticing inflation-based accounting).Value of subsidized cost of funds adjustment expense (reservedfor MIX use).
Reserves such as those imposed by law or statute. Explain anyreserves used by the institution.
Please provide the following account balances for the previous fiscal year
Please provide us with the short and long-termbreakout of Total Assets and Total LiabilitiesTotal of all asset accounts maturing at or within 12months
Total of all asset accounts (including gross loan portfolio) maturingat or within 12 months
Total of all asset accounts maturing in more than12 months
Total of all asset accounts (including gross loan portfolio) maturingin more than 12 months
Total balance on all liability accounts payable at or within 12 monthsTotal balance on all liability accounts payablebeyond 12 month horizon
Total balance on all liability accounts payable beyond 12 monthhorizon
A B C
85
86
87
88
89
90
9192939495
96
97
98
99
100
101
102
103
104
105
106107
108
109
110
111
112
113114115
116
117118119120121
122
123
124
125
126
127128

8/2/2019 MIX MBB Questionnaire
http://slidepdf.com/reader/full/mix-mbb-questionnaire 18/22
Label data (language) Page 18Period starting
Period ending
FS5 Financial Revenue
(sum of 5)
FS5a Financial Revenue from Loan Portfolio Total interest, fees and commission on loan portfol io.
FS5a1 (sum of 5a)
FS5a2 Interest on Loan Portfolio Interest earned on loan portfolio.
FS5b Fees and Commissions on Loan Portfolio Penalties, commissions and other fees charged on loan portfolio.
FS5c Financial Revenue from Other Financial Assets Net gains on other financial assets.
FS6 Other Revenue Related to Financial Services
Financial Expense
FS6a (sum of 6)
Financial Expense on Liabilities Total of interest and fees paid on deposits and borrowings.
(sum of 6a)FS6a1 Interest and Fee Expense on Deposits Interest and fees paid on demand or term deposits.
FS6a2 Interest and Fee Expense on Borrowings Interest and fees paid on borrowings.
FS6b Net Inflation Adjustment Expense
(sum of 6b)
FS6b1 Inflation Adjustment Expense Cost of maintaining the value of the institution's equity.
FS6b2 Inflation Adjustment Revenue Gain on the value of fixed assets due to inflation.
FS6c Subsidized Cost-of-Funds Adjustment Expense
FS6d Other Financial Expenses
FS7 NET FINANCIAL INCOME Financial Revenue minus Financial Expense.
(5 less 6)
FS8 Net Loan Loss Provision Expense
(sum of 8)
FS8a Loan Loss Provision Expense Loan Loss Provision Expense for the period.
FS8b Recovery on Loans Written-off Total recovery on loans written off.
FS10 Operating Expense Total of Personnel Expense and Administrative Expense.
(sum of 10)
FS10a Personnel Expense
FS10b Administrative Expense
(sum of 10b)
FS10b1 Rent and Utilities Rent and utility charges.
FS10b2 Transportation
FS10b3 Office Supplies Printed matter, supplies, photocopies, books, etc.
FS10b4 Depreciation and Amortization Allowance for deterioration, eventual replacement of equipment.
FS10b5 Other Administrative Expenses Other non-personnel administrative expenses.
FS11 NET OPERATING INCOME
(7 less 8 less 10)
FS12 Net Non-Operating Income Non-operating Revenue less Non-operating Expense.
(sum of 12)
Total of revenue from loan portfolio and other financial assets, aswell as other financial revenue from financial services.
Other revenue from provision of financial services, includingrevenue from insurance or transfer services or non-financialrevenue from the provision of financial services, such as the saleof passbooks or SmartCards. This account also includes netexchange gain.
Total of financial expense on liabilities, net inflation adjustment,cost-of-funds adjustment and other expenses from financialservices.
Reserved for institutions that use inflation based accounting. Netamount of inflation adjustment.
Adjustment expense for difference between market rate andconcessional rate on funding liabilities (reserved for MIX use).
Other expenses from provision of financial services, including non-
financial expenses on financial products, as well as net exchangedepreciation.
Sum of loan loss provision expense and recovery on loan lossprovision.
Salaries, withholdings, fringe benefits and personnel taxes paid onall those who work for the institution.
Total of Rent and Utilities, Transportation, Office Supplies,Depreciation and Other Administrative Expenses.
Transportation of staff to attend to clients and to manageoperations.
Financial Revenue less Financial Expense, Net Loan LossProvision Expense and Operating Expense.
A B C
129130
131
132
133
134135
136
137
138
139
140
141
142143
144
145
146147
148
149
150
151152
153
154
155
156
157
158
159
160
161162
163
164
165
166
167
168
169
170

8/2/2019 MIX MBB Questionnaire
http://slidepdf.com/reader/full/mix-mbb-questionnaire 19/22
Label data (language) Page 19FS12a Non-Operating Revenue
FS12b Non-Operating Expense
FS13 Net Operating Income plus Net Non-operating Income.
FS14 Taxes
FS15 Net Income (before Taxes and Donations) less Taxes.
(13 less 14)
FS16 Donations to Subsidize Financial Services Donations made to the MFI to subsidize its operations.
FS17 Net Income (after Taxes and before Donations) plus Donations.
Structure
In1 Head office
In2 Regional office levelIn3 Branch office
In4 Sub-branch (unit level)
How many offices?
In5 Head office
In6 Regional office level
In7 Branch office
In8 Sub-branch (unit level)
Percentage of total clients in each location
In9 Large cities
In10 Small cities/Towns
In11 Rural
In12 Number of staff, year-end
In13
In14 Number of staff who have left during year
In15 Number of staff hired during the year
In16 Number of staff, year-end
In17
In18 Number of staff who have left during year
In19 Number of staff hired during the year
In20
In21
In23
PC1
PC2 Total number of loan products offered
PC3 Lending methodologies used
PC4 Total number of savings products offered
PC5
PC6 Does the institution offer non financial services?
Revenue from activity unrelated to the MFI's core activity of providing financial services. This could include consulting income,sale of IT products, or fees for BDS.
Expenses from activity unrelated to the MFIs core activity of providing financial services, such as BDS development costs or consulting expenses.
NET INCOME (BEFORE TAXES ANDDONATIONS)
Includes all taxes paid on Net Income or other measure of profitsas defined by local tax authorities.
NET INCOME (AFTER TAXES AND BEFOREDONATIONS)
NET INCOME (AFTER TAXES ANDDONATIONS)
How many staff does the MFI have at each level of infrastructure?
Please provide information on staffing andpersonnel All staff should be listed in full-time equivalence(i.e. hours of part-time staff should be aggregatedand you should calculate the equivalent of full-timestaff that would be required for those hours)
Number of front-office staff (staff who have directcontact with clients), year-end
Number of front-office staff (staff who have directcontact with clients), year-end
Percentage of (annual budget for staff training/operating expenses) Average annual salary and benefits per staff member - all staff (expressed in currencydescribed in General Information)Do these figures represent all the people whocontribute to your operations, including volunteers,part time, and full time staff?
Total number of active clients (all servicescombined)
Is the institution able to track numbers of clients inaddition to number of accounts (i.e., savers as wellas savings accounts)?
A B C
171
172
173
174
175
176
177
178
179180
181
182
183184185186187188189190191192193194
195196
197
198
199
200
201202
203
204
205
206
207
208
209
210
211212213
214
215

8/2/2019 MIX MBB Questionnaire
http://slidepdf.com/reader/full/mix-mbb-questionnaire 20/22
Label data (language) Page 20
PC7 Loan products
PC8
PC9
PC10 Savings products
PC11
PC12
PC13 Other microfinance products
PC14
PC15
Non-financial services
Describe individually each non-financial service
PC16 Non-financial service
PC17 Number of participants
PC18 Related operational expenses
PC19 Related operational income
PC20 Operational profit (loss) from non-financial service
Total
PC21
PC22
PC23
Loans and borrowers
Total
Please provide information as of
PC25 Number of loans outstanding
PC26 Number of active borrowers
PC27 Number of loans outstanding
PC28 Number of active borrowers
PC29 Number of accumulated borrowers
PC30 Number of accumulated loans disbursed
PC31 Number of new borrowers
PC32 Number of women borrowers
Savings and savers
Total
Compulsory
PC33 Number of active savings accountsPC34 Number of active savers
PC35 Number of women savers
Voluntary
PC36 Number of active savings accounts
PC37 Number of active savers
PC38 Number of women savers
Clients, by other product
Other products
[See 'ProNumber of active clients
[See 'ProNumber of new clients
[See 'ProNumber of women clients
PC42
PC43
Please list, describe and provide a balance for each financial product offered by the institution(ranked in order of importance to institution)
Description of loan terms and conditions (includedescription of loan terms, payment frequency,grace periods, guarantee requirements, conditionsrequired to access loans, etc.)Balance outstanding at year-end (in currency andunit listed above)
Description of terms and conditions of savingsproduct (include description of terms, whether account is voluntary or compulsory, whether deposits are fixed term, whether MFI or third partymobilizes deposits, etc.)Balance outstanding at year-end (in currency andunit listed above)
Description of terms and conditions of product (all' 'If applicable, balance outstanding at year-end (in
How do the non-financial services offered by theinstitution enhance its core savings and loanbusiness?Can this effect be clearly and efficiently measureddue to the separation of accounts?Do the expenses, income and profit amounts givenabove appear on your audited financialstatements? If 'yes', please enter these amounts inlines 12a and 12b of the Income Statement.
Does the institution specifically target very poor clients (clients earning less than US$1/day or population in the bottom half living under thepoverty line)?Does the institution use any targeting tools suchas Means Test, Participatory Wealth Ranking,Housing Index, etc.?
A B C
216
217
218
219
220
221
222
223224225226227228229
230231232233
234
235
236
237238
239240241242243244245246247248249250
251252253254255256257258259
260
261262
263
264

8/2/2019 MIX MBB Questionnaire
http://slidepdf.com/reader/full/mix-mbb-questionnaire 21/22
Label data (language) Page 21PC44
PR1
PR2
Amount - listed in
Number of loans
Percent
Aging/Status of portfolio[See 'Por
[See 'Por
[See 'Por 30-90 Days
[See 'Por 91-180 Days
[See 'Por 181-365 Days
[See 'Por 366+ Days
[See 'Por All renegotiated loans
Gross Loan Portfolio
PR10
PR11
PR12 Loan Loss Reserve for FY ended
PR13 Loan Loss Reserve for FY ended
PR14 Loan Loss Provision Expense for FY ended
PR15 Loans written off in FY ended
LA1
Description of institutional borrowings
[See 'Lia
[See 'Lia Nominal interest rate paid on this borrowing
[See 'Lia
public
private
cannot be classified
[See 'Lia Amount of this liability on Balance Sheet
LA5
LA6 Total borrowings, as of
Operational subsidy analysis
IK1IK2
IK3
IK4
Category
[See In-kiValue of subsidy/donation to the institution
[See In-kiHow it was used[See In-kiRent and utilities
[See In-kiTransportation
[See In-kiOffice supplies
[See In-kiOther
IK9
Percentage of clients in households earning lessthan US$1/day per household member Repayment performance of outstanding LoanPortfolioWere there any renegotiated loans on this year'sBalance Sheet?Does the MFI track renegotiated loans separatefrom non-renegotiated loans?
Current portfolio, on-time (< 30 Days, non-renegotiated loans)Portfolio balance affected by overdue payments(non-renegotiated loans)
Please explain how your institution calculatesdelinquency (portfolio balance affected by overduepayments) as given in the above table
Please describe precisely your institution's policyregarding provisioning and write-offs
How many individual borrowings (either commercial or concessional) appear on the currentyear's Balance Sheet?
Source, including name and description (if possible)
Would you classify this as a liability from a publicor private source?
Total borrowings, current year (Line 2c of BalanceSheet)
Please read through the following questions todetermine if your institution received anyoperational (in-kind) subsidy this fiscal year
Were any managerial or operational personnelIf 'yes', please explain to us what function theyperformed and how they contributed to your operationsWhat was the amount of their salaries during thefiscal year endedDoes your institution use any property or equipment that belongs to another party and is notaccounted for on your financial statements (i.e.office space, computer equipment, vehicles, etc.)?If yes, please explain what category thisproperty/equipment would fall under, its value tothe institution, and how it was used
Check this box if the institution receives no in-kind
A B C
265
266
267
268
269270271
272273
274
275276277278279280
281
282
283284285
286
287
288
289
290291
292293294295
296
297298
299
300
301
302
303
304
305306
307308309310311
312

8/2/2019 MIX MBB Questionnaire
http://slidepdf.com/reader/full/mix-mbb-questionnaire 22/22
Label data (language) Page 22
Potential Inconsistency
Check or not?
Notes
The following is a list of potential inconsistenciesyour data has generated. This does notnecessarily mean that the data is incorrect, onlythat it differs for some reason from what issubmitted by the majority of users. Please do noterase or change any data if it is correct - instead,explain, where necessary, the reason for this
inconsistency in the 'Notes' field.Please check - this is different from GLP onBalance Sheet
The GLP listed on the Portfolio Report is different from GLP on theBalance Sheet
Please check - the number of loans does notequal that listed in the 'Products and Clients'section
The number of outstanding loans listed in 'Portfolio Report' isdifferent from the number of outstanding loans listed in 'Productsand Clients'
Please check - this does not equal the LLR on theBalance Sheet
The LLR listed on the Portfolio Report is different from LLR on theBalance Sheet
Please check - this does not equal the LLPE onthe Income Statement
The LLPE listed on the Portfolio Report is different from the LLPEon the Income Statement
Please check - this is not entirely consistent withabove information
The write-offs listed on the Portfolio Report do not equal [lastyear's loan loss reserve + current year's loan loss provisionexpense - current year's loan loss reserve]
Please check - your total clients exceed the sumof savers, borrowers and other product clients
The number of total clients exceeds the sum of savers, borrowersand other product clients
Please check - this is not entirely consistent withabove information
The difference between current and previous years' personnel isnot consistent with personnel who have been hired and who haveleft
Please check - this information is not consistentwith the difference in personnel between this year and last
The average staff salary is not consistent with the number of personnel listed in Infrastructure and the personnel expense listedon the Income Statement
Please check - this information is not consistentwith the personnel information entered in theIncome StatementPlease check - Total Assets do not equal TotalLiabilities and Equity
Total Assets do not equal Total Liabilities and Equity on BalanceSheet
Please check - voluntary savings appear on theBalance Sheet but you have not listed voluntarysavings clients
Voluntary savings appear on the Balance Sheet but no voluntarysavings clients have been listed in 'Products and Clients'
Please check - you have listed voluntary savingsclients but no voluntary savings appears on theBalance Sheet
Voluntary savings clients have been listed but no voluntary savingsappears on the Balance Sheet
Please check - this does not equal the borrowingslisted on your Balance Sheet
The total borrowings listed on Liabilities Analysis is different fromthe total borrowings listed on the Balance Sheet
A B C
313314315316
317
318
319
320
321
322
323
324
325
326
327
328
329
330