minerals4eu - delivering the european minerals yearbook
TRANSCRIPT
Minerals4EU – WP4 WorkshopDelivering the European Minerals Yearbook
Wednesday 3 December 2014
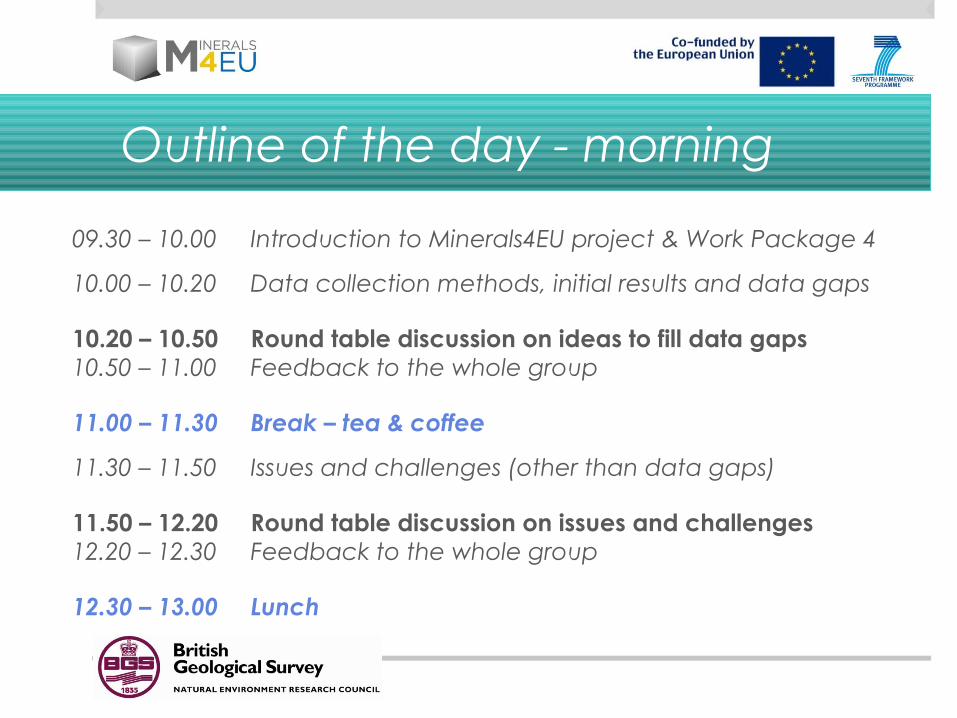
Outline of the day - morning
09.30 – 10.00 Introduction to Minerals4EU project & Work Package 4
10.00 – 10.20 Data collection methods, initial results and data gaps
10.20 – 10.50 Round table discussion on ideas to fill data gaps10.50 – 11.00 Feedback to the whole group
11.00 – 11.30 Break – tea & coffee
11.30 – 11.50 Issues and challenges (other than data gaps)
11.50 – 12.20 Round table discussion on issues and challenges12.20 – 12.30 Feedback to the whole group
12.30 – 13.00 Lunch
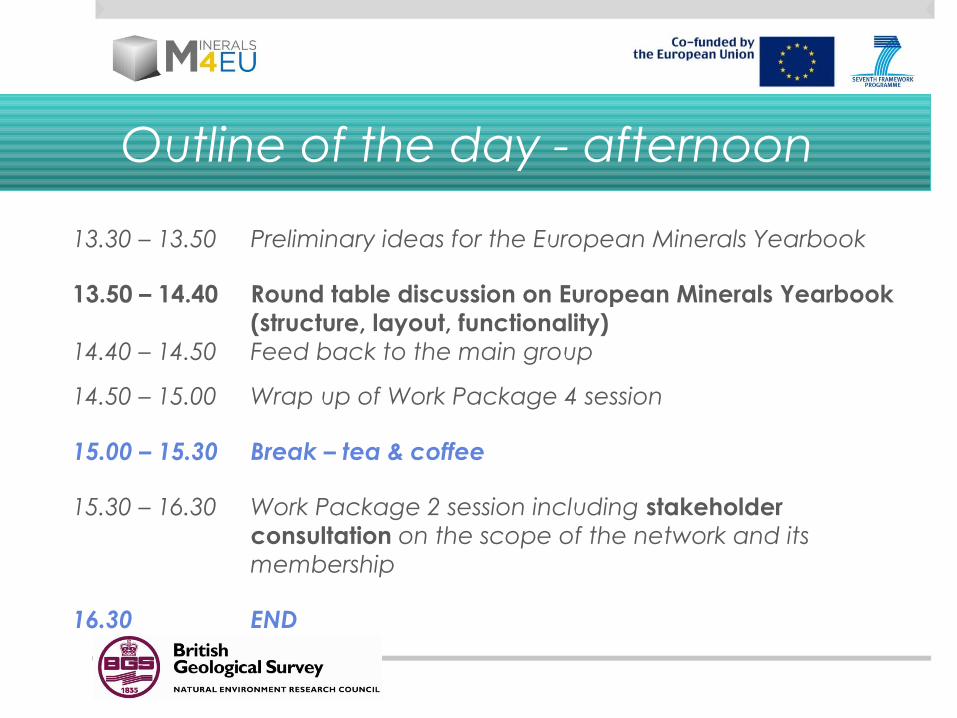
Outline of the day - afternoon
13.30 – 13.50 Preliminary ideas for the European Minerals Yearbook
13.50 – 14.40 Round table discussion on European Minerals Yearbook (structure, layout, functionality)
14.40 – 14.50 Feed back to the main group
14.50 – 15.00 Wrap up of Work Package 4 session
15.00 – 15.30 Break – tea & coffee
15.30 – 16.30 Work Package 2 session including stakeholder consultation on the scope of the network and its membership
16.30 END
Introduction to Minerals4EU
Mineral Intelligence Network for Europe
7th Framework Programme for Research and Technological Development
“The Minerals4EU project is designed to meet the recommendations of the Raw materials Initiative and will develop an EU Minerals Intelligence Network structure delivering a web portal, a European Minerals Yearbook and foresight studies.”
(First sentence of the Description of Work)
Introduction to Minerals4EU
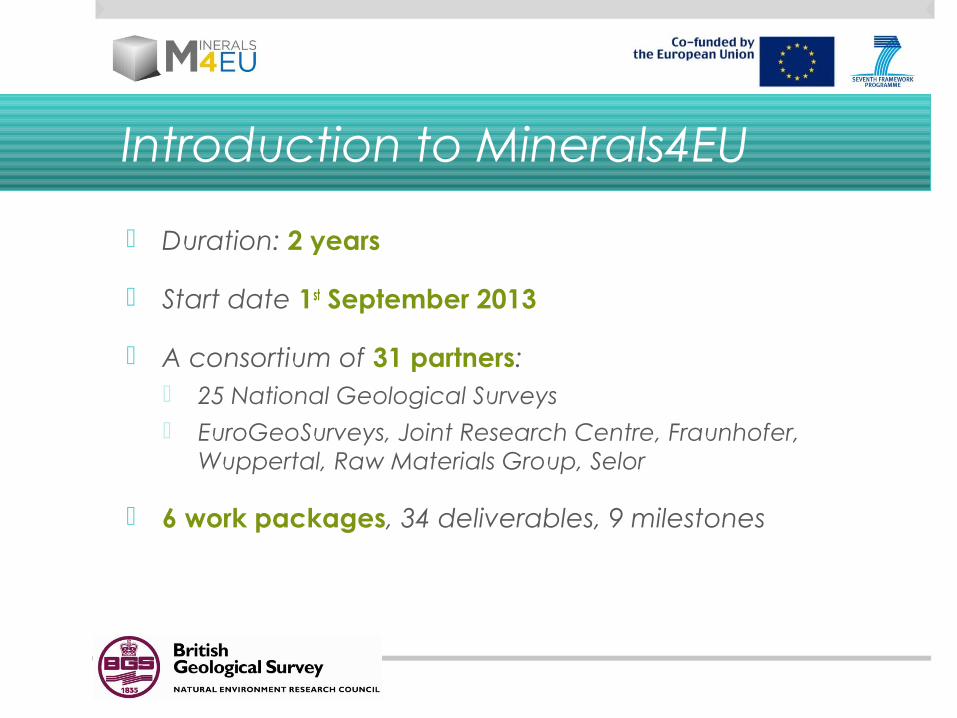
Duration: 2 years
Start date 1st September 2013
A consortium of 31 partners: 25 National Geological Surveys EuroGeoSurveys, Joint Research Centre, Fraunhofer,
Wuppertal, Raw Materials Group, Selor
6 work packages, 34 deliverables, 9 milestones
Minerals4EU – Key points
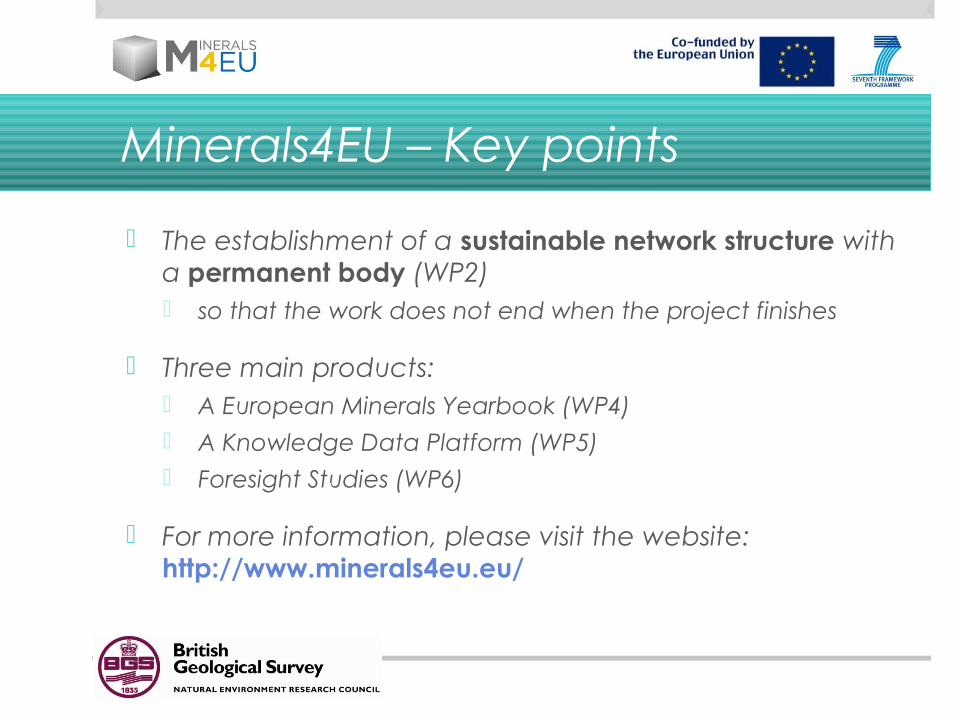
The establishment of a sustainable network structure with a permanent body (WP2) so that the work does not end when the project finishes
Three main products: A European Minerals Yearbook (WP4) A Knowledge Data Platform (WP5) Foresight Studies (WP6)
For more information, please visit the website: http://www.minerals4eu.eu/
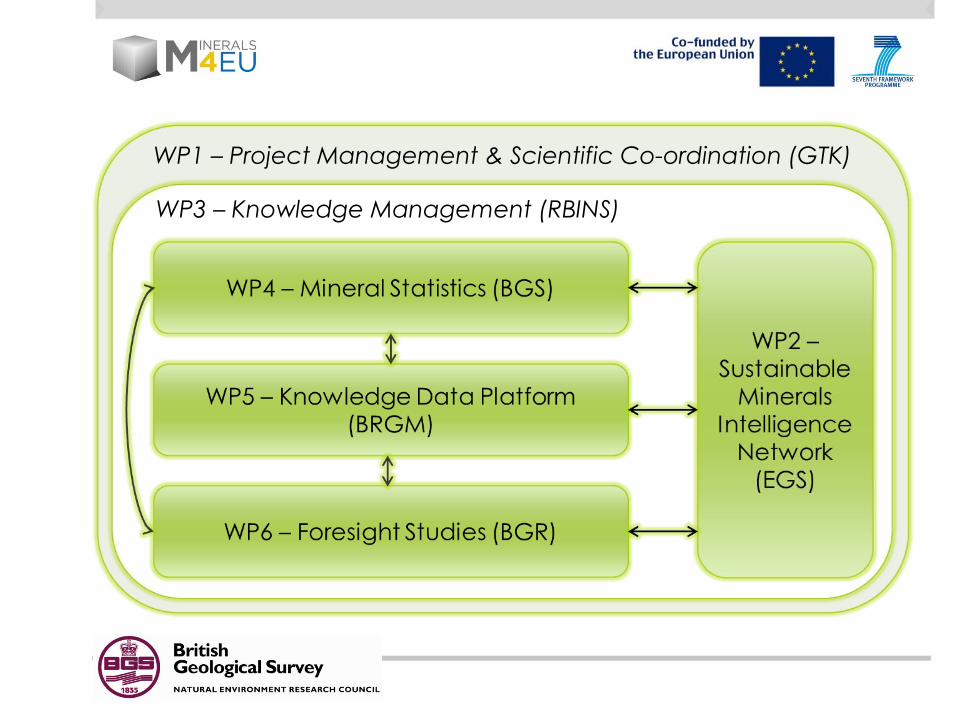
WP1 – Project Management & Scientific Co-ordination (GTK)
WP3 – Knowledge Management (RBINS)
Summary WP4, 5 and 6
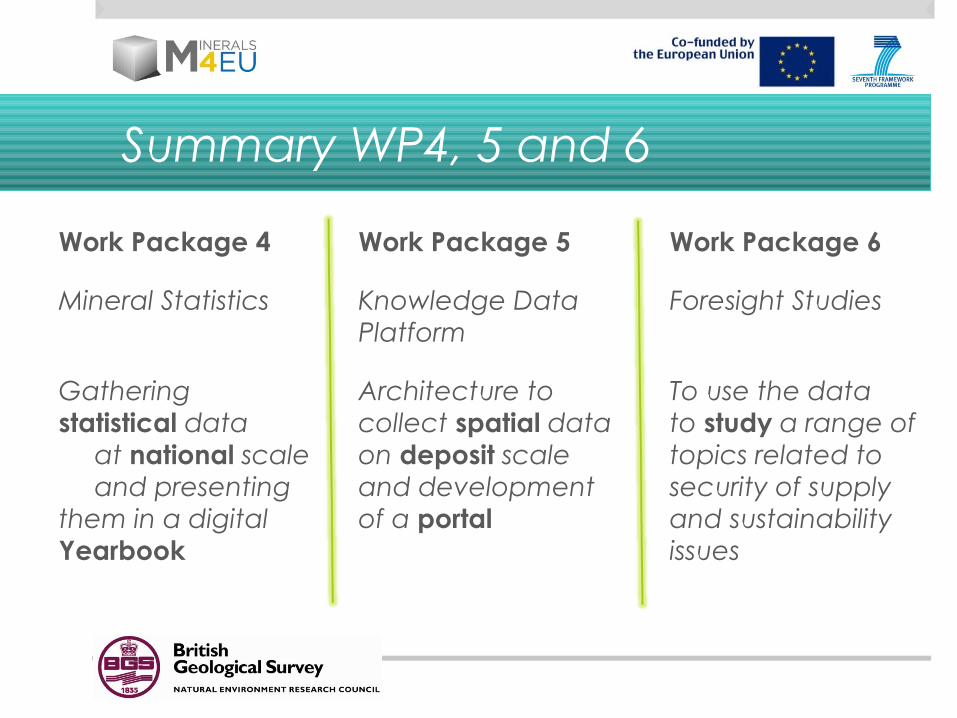
Work Package 4 Work Package 5 Work Package 6
Mineral Statistics Knowledge Data Foresight StudiesPlatform
Gathering Architecture to To use the datastatistical data collect spatial data to study a range of
at national scale on deposit scale topics related to and presenting and development security of supply
them in a digital of a portal and sustainabilityYearbook issues
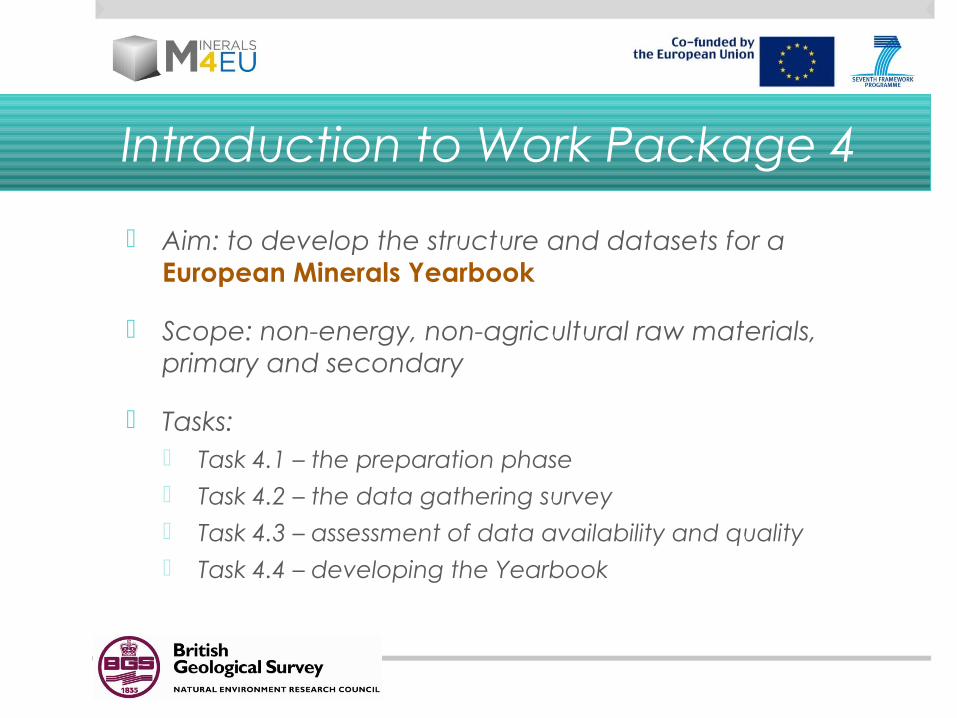
Introduction to Work Package 4
Aim: to develop the structure and datasets for a European Minerals Yearbook
Scope: non-energy, non-agricultural raw materials, primary and secondary
Tasks: Task 4.1 – the preparation phase Task 4.2 – the data gathering survey Task 4.3 – assessment of data availability and quality Task 4.4 – developing the Yearbook
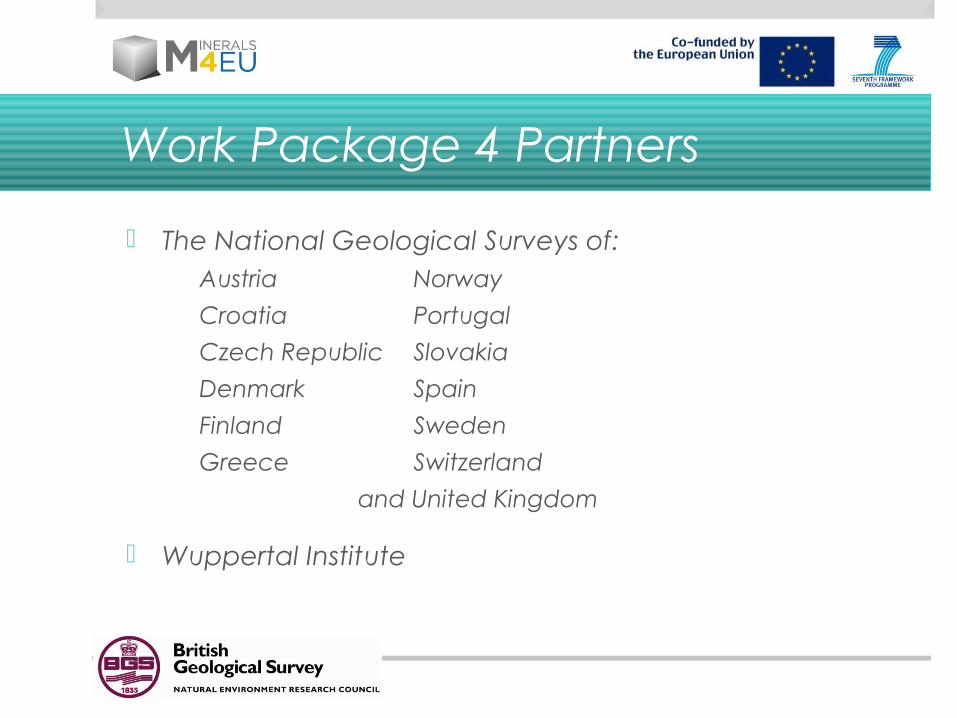
Work Package 4 Partners
The National Geological Surveys of: Austria Norway
Croatia Portugal
Czech Republic Slovakia
Denmark Spain
Finland Sweden
Greece Switzerland
and United Kingdom
Wuppertal Institute
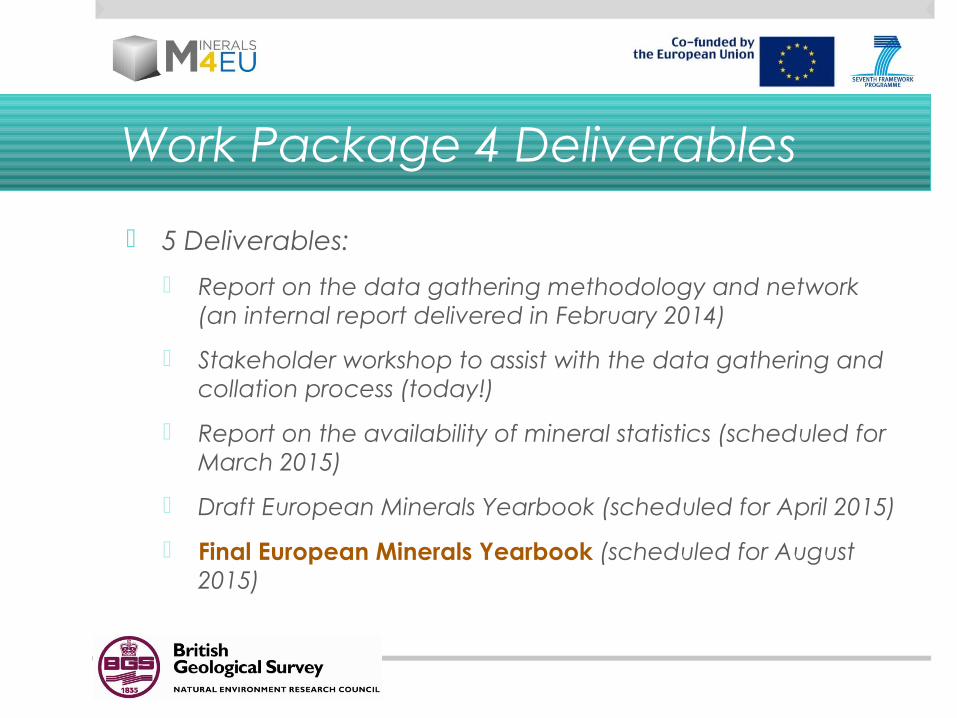
Work Package 4 Deliverables
5 Deliverables:
Report on the data gathering methodology and network (an internal report delivered in February 2014)
Stakeholder workshop to assist with the data gathering and collation process (today!)
Report on the availability of mineral statistics (scheduled for March 2015)
Draft European Minerals Yearbook (scheduled for April 2015)
Final European Minerals Yearbook (scheduled for August 2015)
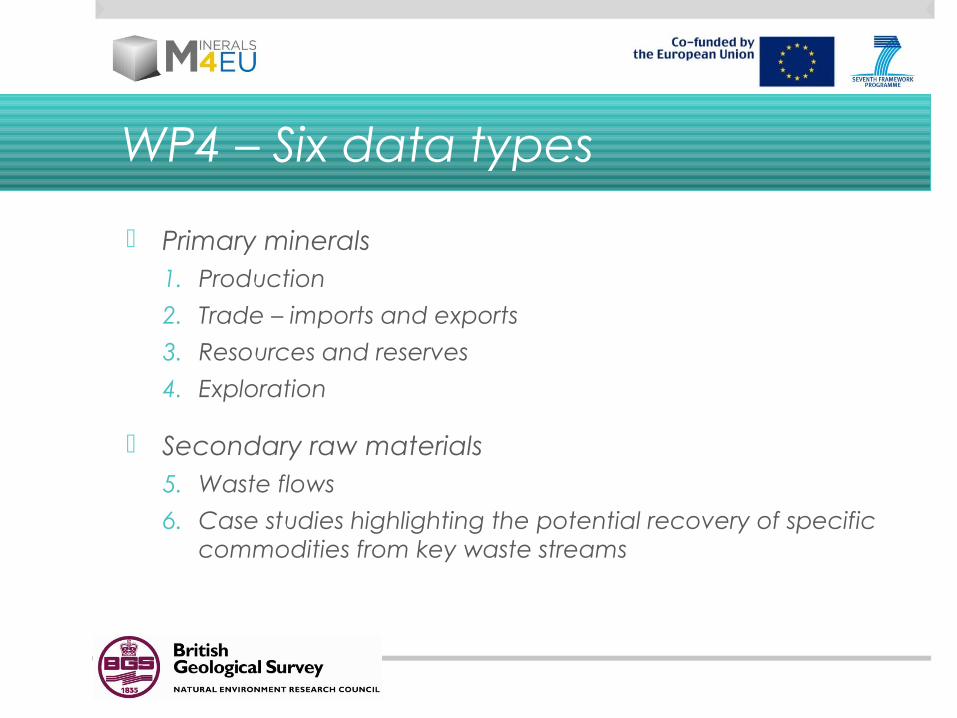
WP4 – Six data types
Primary minerals1. Production
2. Trade – imports and exports
3. Resources and reserves
4. Exploration
Secondary raw materials5. Waste flows
6. Case studies highlighting the potential recovery of specific commodities from key waste streams
Methods, initial results & data gaps
Primary minerals
WP4 data collection methods 1
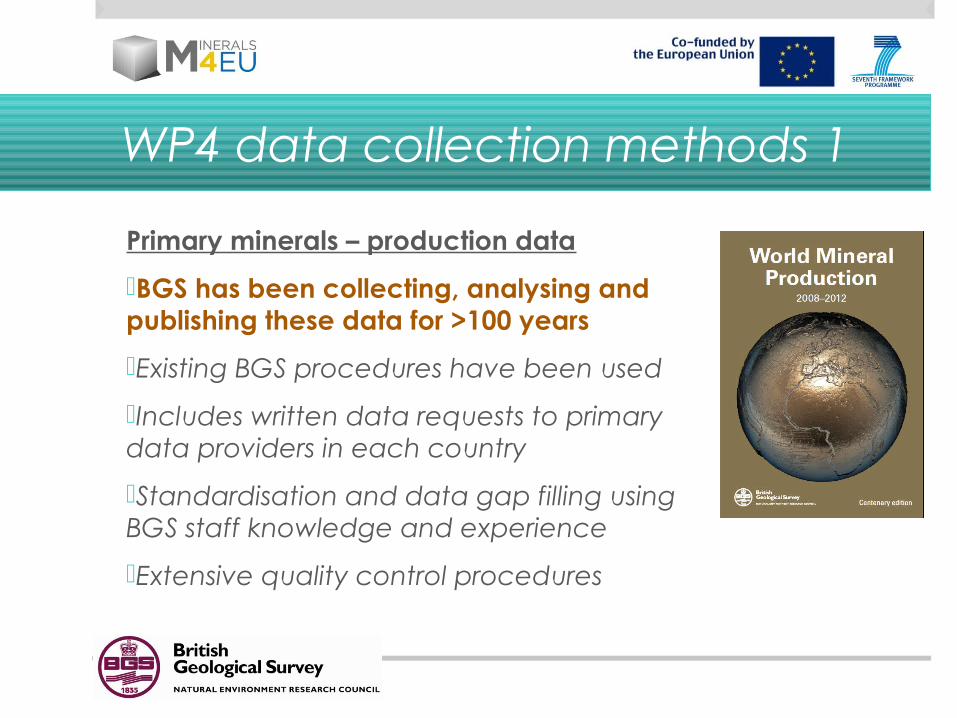
Primary minerals – production data
BGS has been collecting, analysing and publishing these data for >100 years
Existing BGS procedures have been used
Includes written data requests to primary data providers in each country
Standardisation and data gap filling using BGS staff knowledge and experience
Extensive quality control procedures
WP4 data collection methods 2
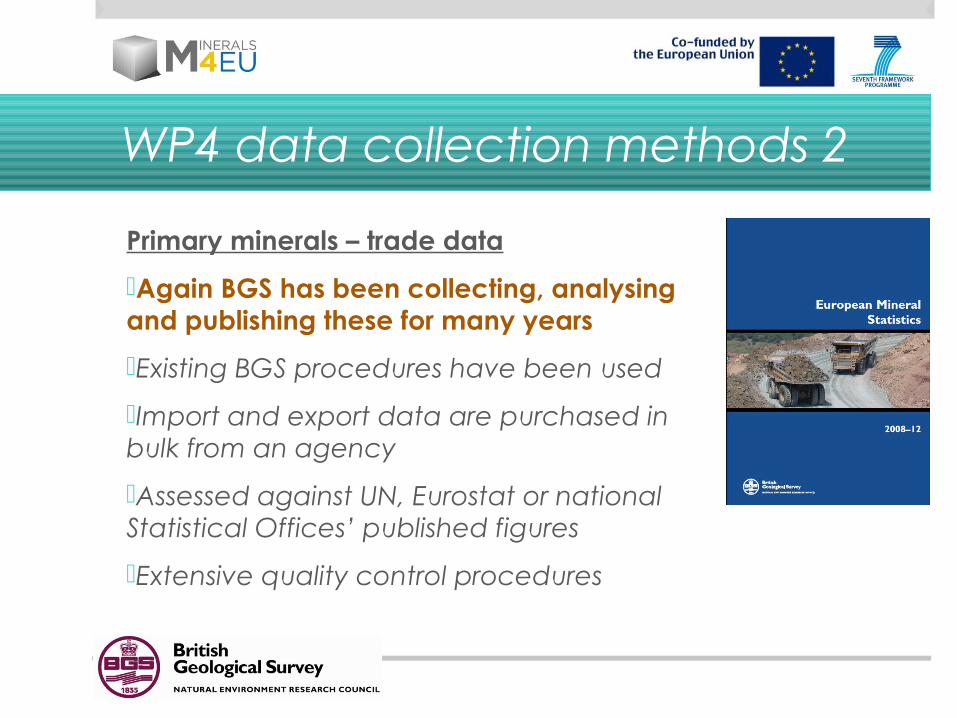
Primary minerals – trade data
Again BGS has been collecting, analysing and publishing these for many years
Existing BGS procedures have been used
Import and export data are purchased in bulk from an agency
Assessed against UN, Eurostat or national Statistical Offices’ published figures
Extensive quality control procedures
WP4 data collection methods 3&4
Primary minerals – resources and reserves, exploration
Two completely new datasets
Questionnaires developed and tested
40 European countries divided amongst the WP4 partners
Each partner contacted organisations within each country using the questionnaires and an accompanying letter from the EC
Central collation by BGS
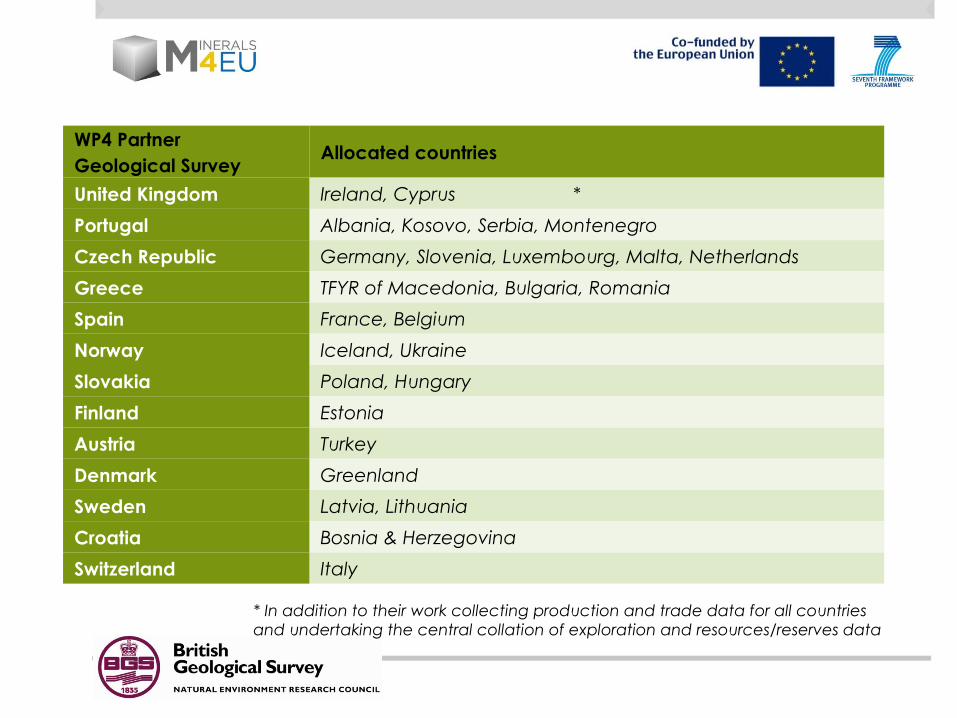
WP4 Partner Geological Survey
Allocated countries
United Kingdom Ireland, Cyprus *
Portugal Albania, Kosovo, Serbia, Montenegro
Czech Republic Germany, Slovenia, Luxembourg, Malta, Netherlands
Greece TFYR of Macedonia, Bulgaria, Romania
Spain France, Belgium
Norway Iceland, Ukraine
Slovakia Poland, Hungary
Finland Estonia
Austria Turkey
Denmark Greenland
Sweden Latvia, Lithuania
Croatia Bosnia & Herzegovina
Switzerland Italy
* In addition to their work collecting production and trade data for all countries and undertaking the central collation of exploration and resources/reserves data
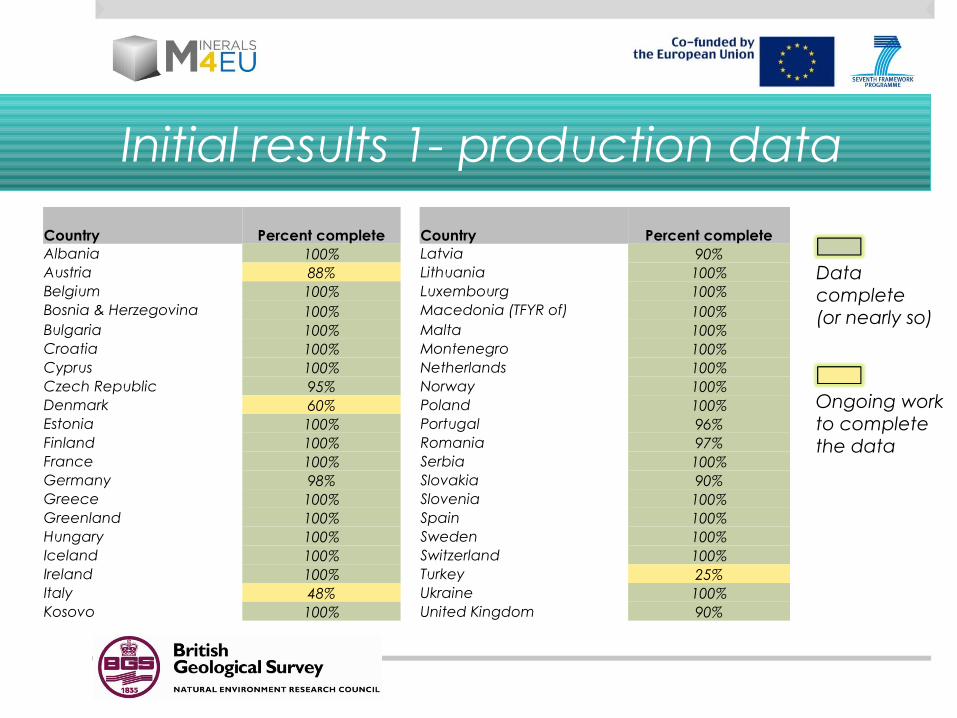
Initial results 1- production data
Country Percent complete Country Percent completeAlbania 100% Latvia 90%Austria 88% Lithuania 100%Belgium 100% Luxembourg 100%Bosnia & Herzegovina 100% Macedonia (TFYR of) 100%Bulgaria 100% Malta 100%Croatia 100% Montenegro 100%Cyprus 100% Netherlands 100%Czech Republic 95% Norway 100%Denmark 60% Poland 100%Estonia 100% Portugal 96%Finland 100% Romania 97%France 100% Serbia 100%Germany 98% Slovakia 90%Greece 100% Slovenia 100%Greenland 100% Spain 100%Hungary 100% Sweden 100%Iceland 100% Switzerland 100%Ireland 100% Turkey 25%Italy 48% Ukraine 100%Kosovo 100% United Kingdom 90%
Data complete (or nearly so)
Ongoing workto completethe data
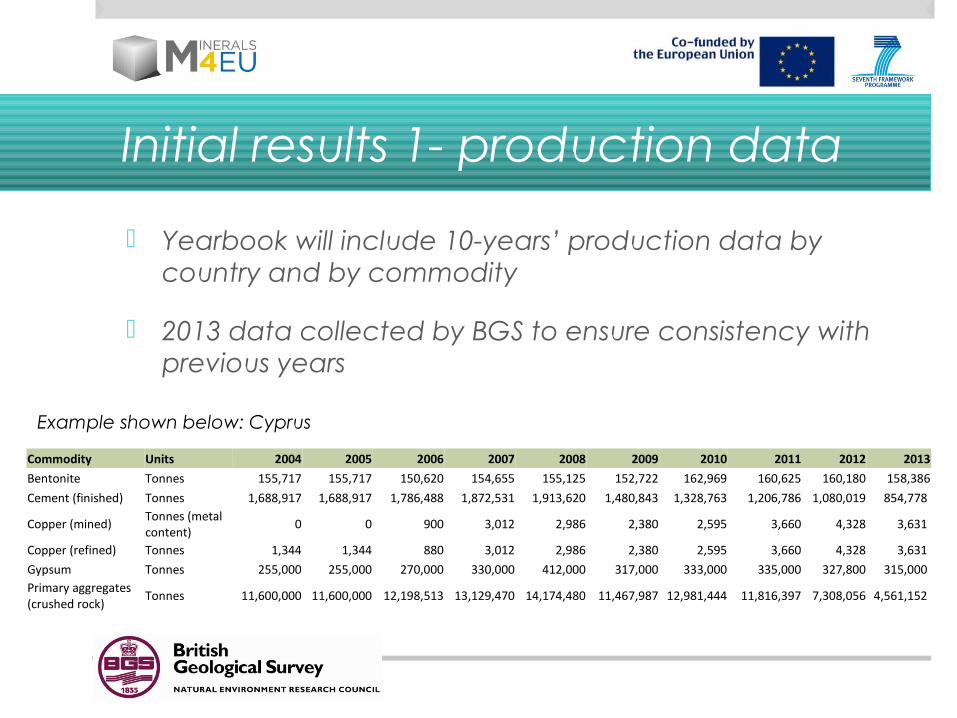
Initial results 1- production data
Yearbook will include 10-years’ production data by country and by commodity
2013 data collected by BGS to ensure consistency with previous years
Commodity Units 2004 2005 2006 2007 2008 2009 2010 2011 2012 2013
Bentonite Tonnes 155,717 155,717 150,620 154,655 155,125 152,722 162,969 160,625 160,180 158,386
Cement (finished) Tonnes 1,688,917 1,688,917 1,786,488 1,872,531 1,913,620 1,480,843 1,328,763 1,206,786 1,080,019 854,778
Copper (mined)Tonnes (metal content)
0 0 900 3,012 2,986 2,380 2,595 3,660 4,328 3,631
Copper (refined) Tonnes 1,344 1,344 880 3,012 2,986 2,380 2,595 3,660 4,328 3,631
Gypsum Tonnes 255,000 255,000 270,000 330,000 412,000 317,000 333,000 335,000 327,800 315,000 Primary aggregates (crushed rock)
Tonnes 11,600,000 11,600,000 12,198,513 13,129,470 14,174,480 11,467,987 12,981,444 11,816,397 7,308,056 4,561,152
Example shown below: Cyprus
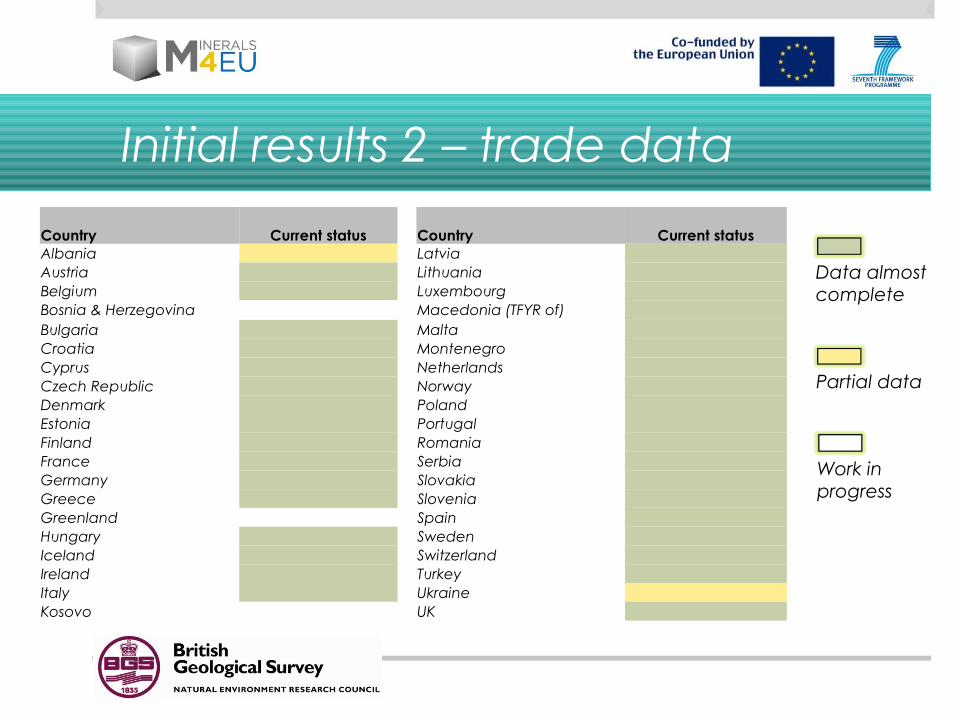
Initial results 2 – trade data
Country Current status Country Current statusAlbania LatviaAustria LithuaniaBelgium LuxembourgBosnia & Herzegovina Macedonia (TFYR of)Bulgaria MaltaCroatia Montenegro Cyprus NetherlandsCzech Republic NorwayDenmark PolandEstonia PortugalFinland RomaniaFrance SerbiaGermany SlovakiaGreece SloveniaGreenland SpainHungary SwedenIceland SwitzerlandIreland TurkeyItaly UkraineKosovo UK
Data almostcomplete
Partial data
Work inprogress
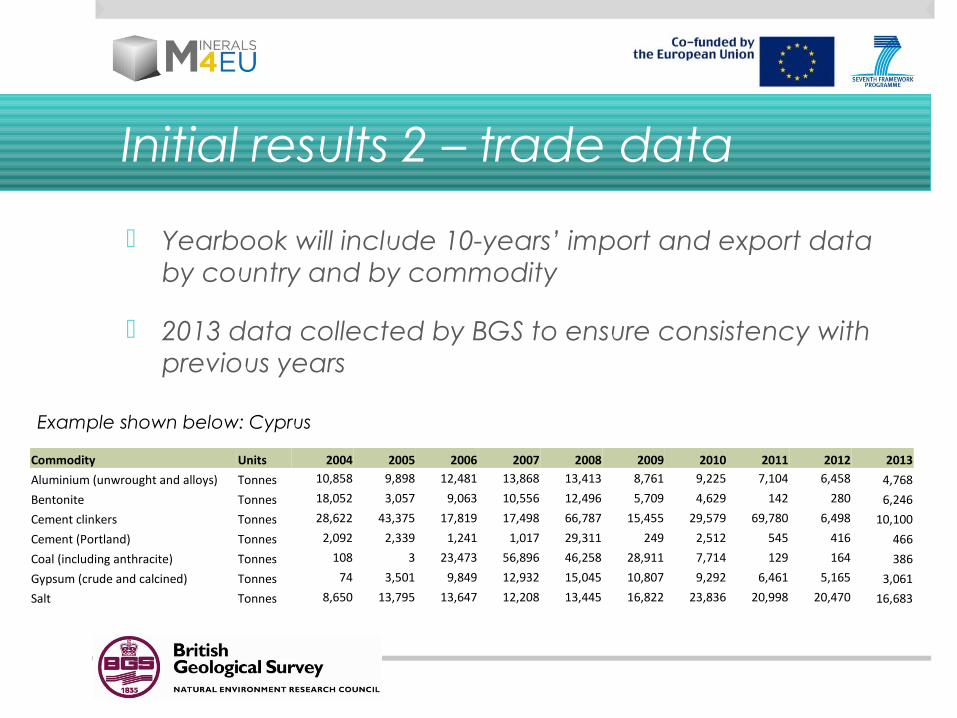
Initial results 2 – trade data
Yearbook will include 10-years’ import and export data by country and by commodity
2013 data collected by BGS to ensure consistency with previous years
Commodity Units 2004 2005 2006 2007 2008 2009 2010 2011 2012 2013
Aluminium (unwrought and alloys) Tonnes 10,858 9,898 12,481 13,868 13,413 8,761 9,225 7,104 6,458 4,768
Bentonite Tonnes 18,052 3,057 9,063 10,556 12,496 5,709 4,629 142 280 6,246
Cement clinkers Tonnes 28,622 43,375 17,819 17,498 66,787 15,455 29,579 69,780 6,498 10,100
Cement (Portland) Tonnes 2,092 2,339 1,241 1,017 29,311 249 2,512 545 416 466
Coal (including anthracite) Tonnes 108 3 23,473 56,896 46,258 28,911 7,714 129 164 386
Gypsum (crude and calcined) Tonnes 74 3,501 9,849 12,932 15,045 10,807 9,292 6,461 5,165 3,061
Salt Tonnes 8,650 13,795 13,647 12,208 13,445 16,822 23,836 20,998 20,470 16,683
Example shown below: Cyprus
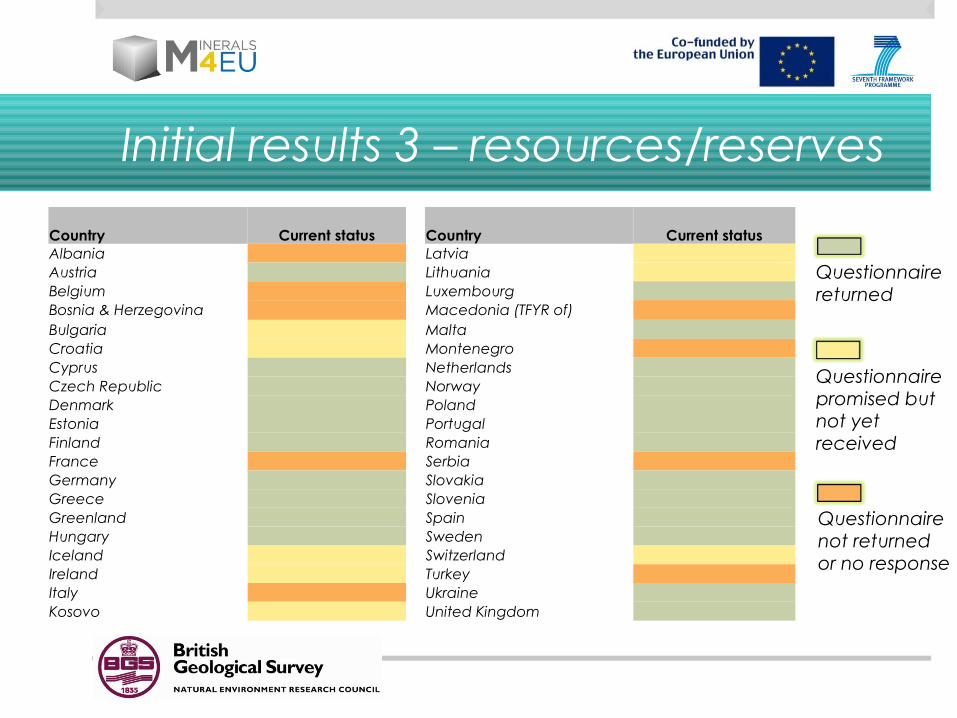
Initial results 3 – resources/reserves
Country Current status Country Current statusAlbania LatviaAustria LithuaniaBelgium LuxembourgBosnia & Herzegovina Macedonia (TFYR of)Bulgaria MaltaCroatia Montenegro Cyprus NetherlandsCzech Republic NorwayDenmark PolandEstonia PortugalFinland RomaniaFrance SerbiaGermany SlovakiaGreece SloveniaGreenland SpainHungary SwedenIceland SwitzerlandIreland TurkeyItaly UkraineKosovo United Kingdom
Questionnairereturned
Questionnairepromised but not yet received
Questionnairenot returnedor no response
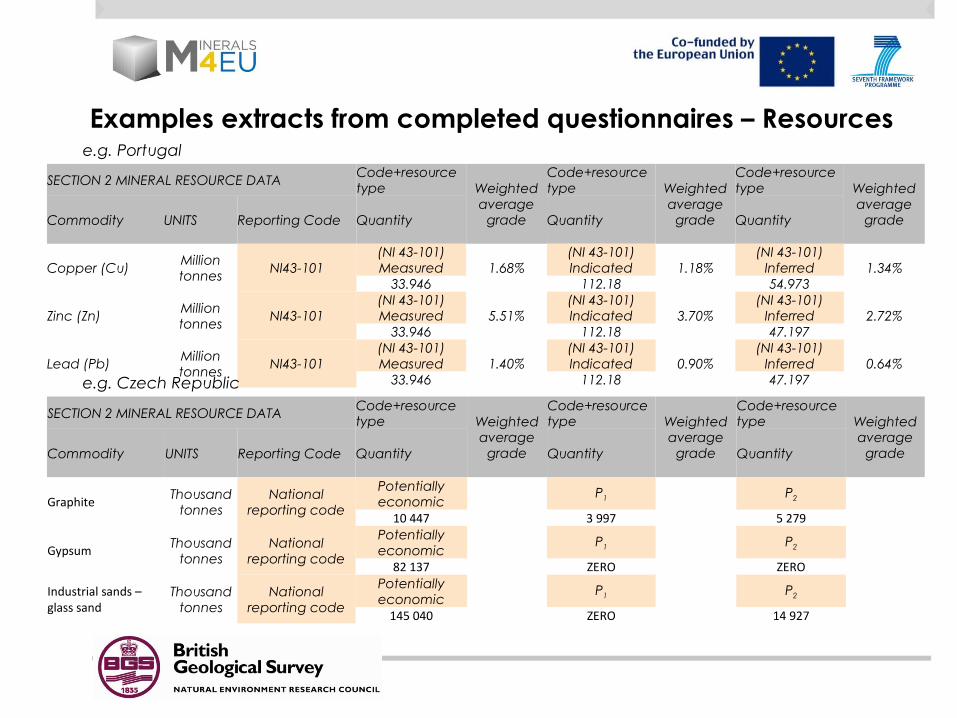
Examples extracts from completed questionnaires – Resources
SECTION 2 MINERAL RESOURCE DATA Code+resource type Weighted
average grade
Code+resource type Weighted
average grade
Code+resource type Weighted
average gradeCommodity UNITS Reporting Code Quantity Quantity Quantity
Copper (Cu)Million tonnes NI43-101
(NI 43-101) Measured 1.68%
(NI 43-101) Indicated 1.18%
(NI 43-101) Inferred 1.34%
33.946 112.18 54.973
Zinc (Zn) Million tonnes
NI43-101(NI 43-101) Measured 5.51%
(NI 43-101) Indicated 3.70%
(NI 43-101) Inferred 2.72%
33.946 112.18 47.197
Lead (Pb) Million tonnes
NI43-101(NI 43-101) Measured 1.40%
(NI 43-101) Indicated 0.90%
(NI 43-101) Inferred 0.64%
33.946 112.18 47.197
SECTION 2 MINERAL RESOURCE DATA Code+resource type Weighted
average grade
Code+resource type Weighted
average grade
Code+resource type Weighted
average gradeCommodity UNITS Reporting Code Quantity Quantity Quantity
Graphite Thousand tonnes
National reporting code
Potentially economic
P1 P2
10 447 3 997 5 279
Gypsum Thousand tonnes
National reporting code
Potentially economic
P1 P2
82 137 ZERO ZERO
Industrial sands – glass sand
Thousand tonnes
National reporting code
Potentially economic
P1 P2
145 040 ZERO 14 927
e.g. Portugal
e.g. Czech Republic
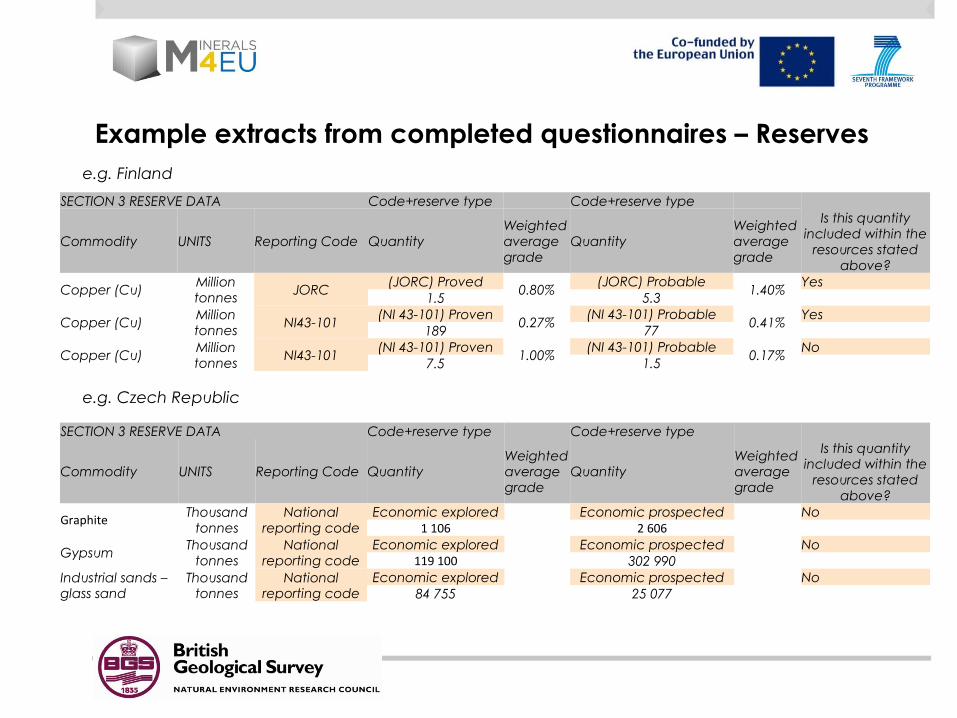
Example extracts from completed questionnaires – Reserves
SECTION 3 RESERVE DATA Code+reserve type Code+reserve typeIs this quantity
included within the resources stated
above?
Commodity UNITS Reporting Code QuantityWeighted average grade
QuantityWeighted average grade
Graphite Thousand tonnes
National reporting code
Economic explored
Economic prospected
No1 106 2 606
GypsumThousand
tonnesNational
reporting codeEconomic explored
Economic prospected
No
119 100 302 990 Industrial sands – glass sand
Thousand tonnes
National reporting code
Economic explored
Economic prospected
No84 755 25 077
SECTION 3 RESERVE DATA Code+reserve type Code+reserve typeIs this quantity
included within the resources stated
above?
Commodity UNITS Reporting Code QuantityWeighted average grade
QuantityWeighted average grade
Copper (Cu)Million tonnes JORC
(JORC) Proved0.80%
(JORC) Probable1.40%
Yes1.5 5.3
Copper (Cu)Million tonnes NI43-101
(NI 43-101) Proven0.27%
(NI 43-101) Probable0.41%
Yes189 77
Copper (Cu)Million tonnes NI43-101
(NI 43-101) Proven1.00%
(NI 43-101) Probable0.17%
No7.5 1.5
e.g. Finland
e.g. Czech Republic
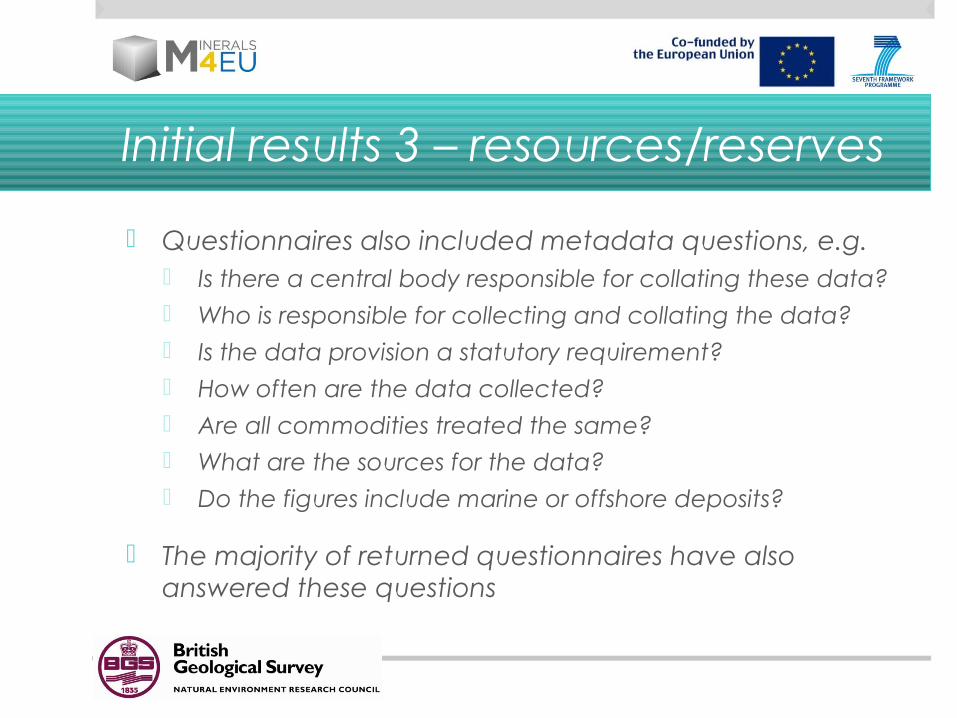
Initial results 3 – resources/reserves
Questionnaires also included metadata questions, e.g. Is there a central body responsible for collating these data? Who is responsible for collecting and collating the data? Is the data provision a statutory requirement? How often are the data collected? Are all commodities treated the same? What are the sources for the data? Do the figures include marine or offshore deposits?
The majority of returned questionnaires have also answered these questions
Initial results 4 – exploration
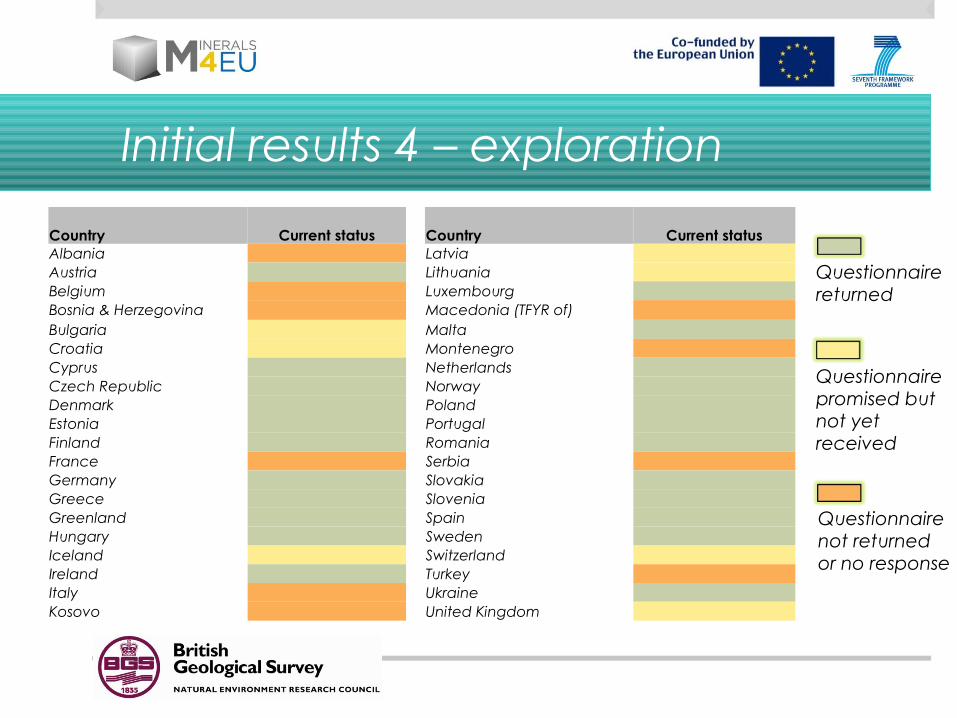
Country Current status Country Current statusAlbania LatviaAustria LithuaniaBelgium LuxembourgBosnia & Herzegovina Macedonia (TFYR of)Bulgaria MaltaCroatia Montenegro Cyprus NetherlandsCzech Republic NorwayDenmark PolandEstonia PortugalFinland RomaniaFrance SerbiaGermany SlovakiaGreece SloveniaGreenland SpainHungary SwedenIceland SwitzerlandIreland TurkeyItaly UkraineKosovo United Kingdom
Questionnairereturned
Questionnairepromised but not yet received
Questionnairenot returnedor no response
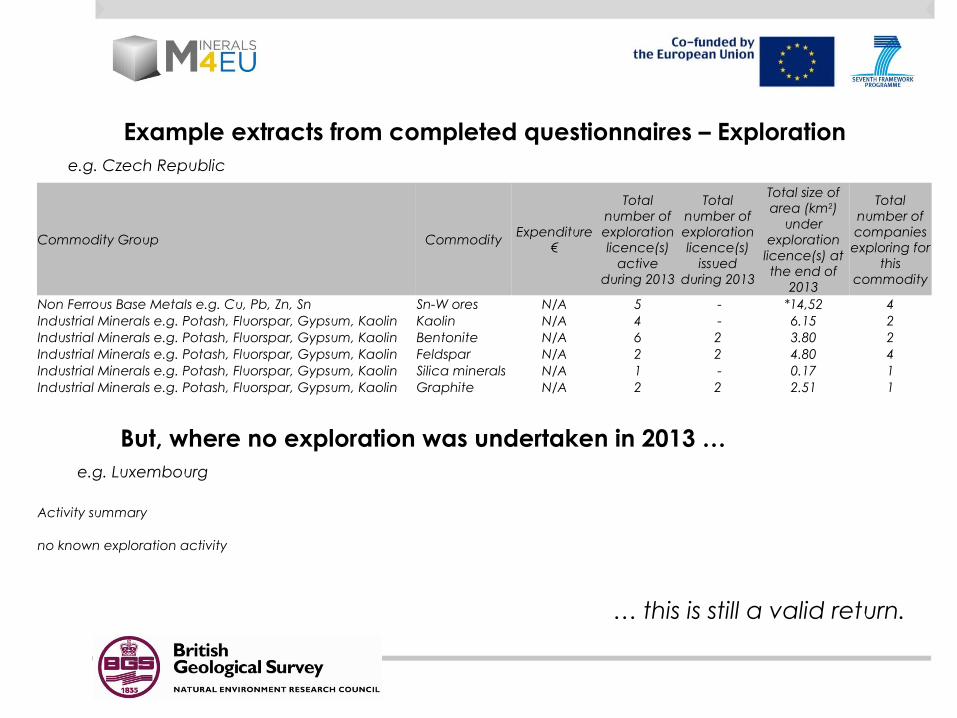
Example extracts from completed questionnaires – Exploration
Commodity Group Commodity Expenditure €
Total number of exploration licence(s)
active during 2013
Total number of exploration licence(s)
issued during 2013
Total size of area (km2)
under exploration
licence(s) at the end of
2013
Total number of companies exploring for
this commodity
Non Ferrous Base Metals e.g. Cu, Pb, Zn, Sn Sn-W ores N/A 5 - *14,52 4Industrial Minerals e.g. Potash, Fluorspar, Gypsum, Kaolin Kaolin N/A 4 - 6.15 2Industrial Minerals e.g. Potash, Fluorspar, Gypsum, Kaolin Bentonite N/A 6 2 3.80 2Industrial Minerals e.g. Potash, Fluorspar, Gypsum, Kaolin Feldspar N/A 2 2 4.80 4Industrial Minerals e.g. Potash, Fluorspar, Gypsum, Kaolin Silica minerals N/A 1 - 0.17 1Industrial Minerals e.g. Potash, Fluorspar, Gypsum, Kaolin Graphite N/A 2 2 2.51 1
Activity summary
no known exploration activity
But, where no exploration was undertaken in 2013 …
… this is still a valid return.
e.g. Czech Republic
e.g. Luxembourg
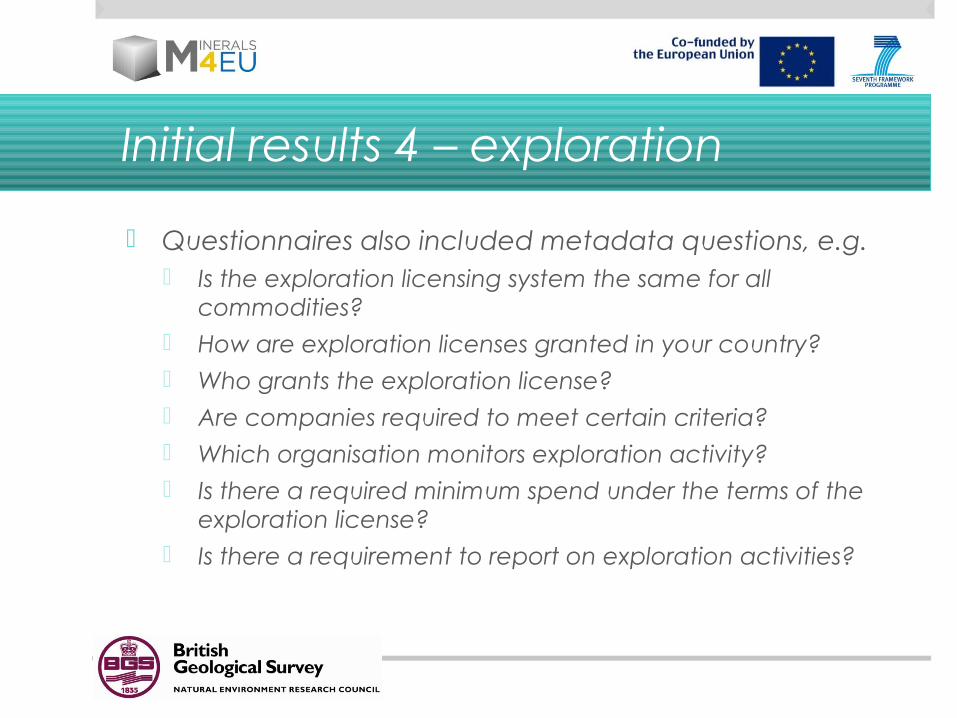
Initial results 4 – exploration
Questionnaires also included metadata questions, e.g. Is the exploration licensing system the same for all
commodities? How are exploration licenses granted in your country? Who grants the exploration license? Are companies required to meet certain criteria? Which organisation monitors exploration activity? Is there a required minimum spend under the terms of the
exploration license? Is there a requirement to report on exploration activities?
Data gaps 1&2 – production/trade
There will be very few
How do we fill them? As much data from primary data providers as possible Seek out alternative contacts (primary data providers) Data from secondary sources Other organisations who do similar work (e.g. USGS) BGS staff estimates, based on trends and non-statistical
information (e.g. a mine closed during the year)
Only as a last resort are figures left as “not available”
Data gaps 3&4 – resources/reserves and exploration Unsurprisingly there are more of them!
Key reasons No response to the request for data Data are confidential No requirement to report data to a central organisation
Questions Are there other reasons? How should we attempt to fill the gaps?
Methods, initial results & data gaps
Secondary raw materials
WP4 data collection methods 5
Secondary raw materials – waste flows
Data availability was known to be an issue
Decision taken to collect statistical data on waste flows from particular segments of European Waste Classification scheme representing mineral waste
Data for most countries extracted from Eurostat, examined in detail by BGS staff
Attempts to fill data gaps for countries not on Eurostat via national Statistics Offices and other sources
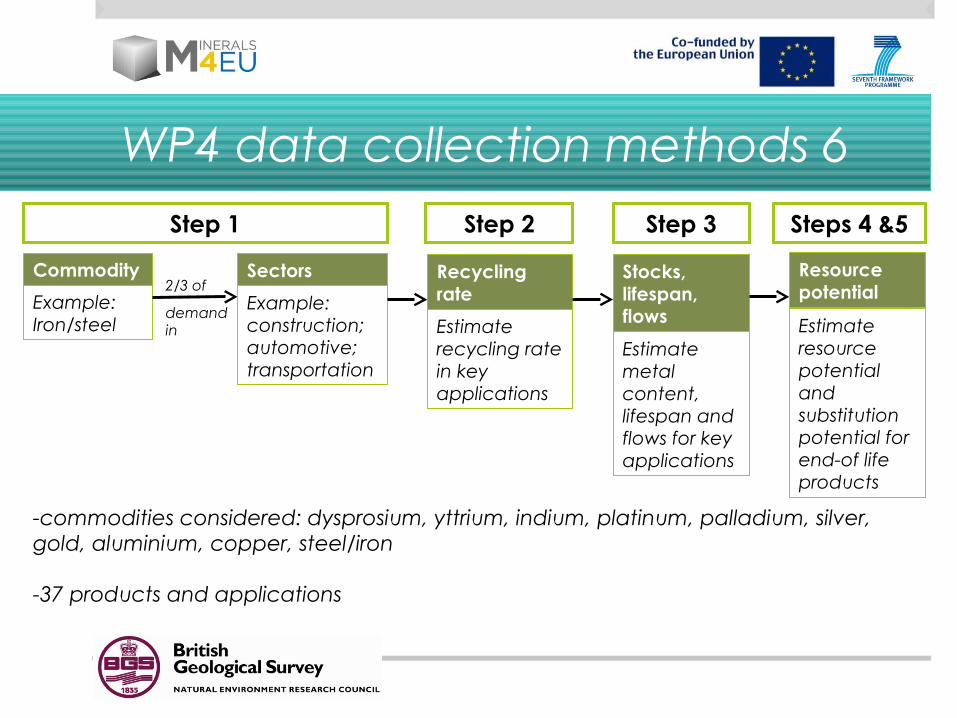
WP4 data collection methods 6
Commodity
Example: Iron/steel
Sectors
Example: construction; automotive; transportation
2/3 of
Estimate recycling rate in key applications
Recycling rate
demand in
Stocks, lifespan, flows Estimate
resource potential and substitution potential for end-of life products
Step 1
Estimate metal content, lifespan and flows for key applications
Resource potential
Step 2 Step 3 Steps 4 &5
-commodities considered: dysprosium, yttrium, indium, platinum, palladium, silver, gold, aluminium, copper, steel/iron
-37 products and applications
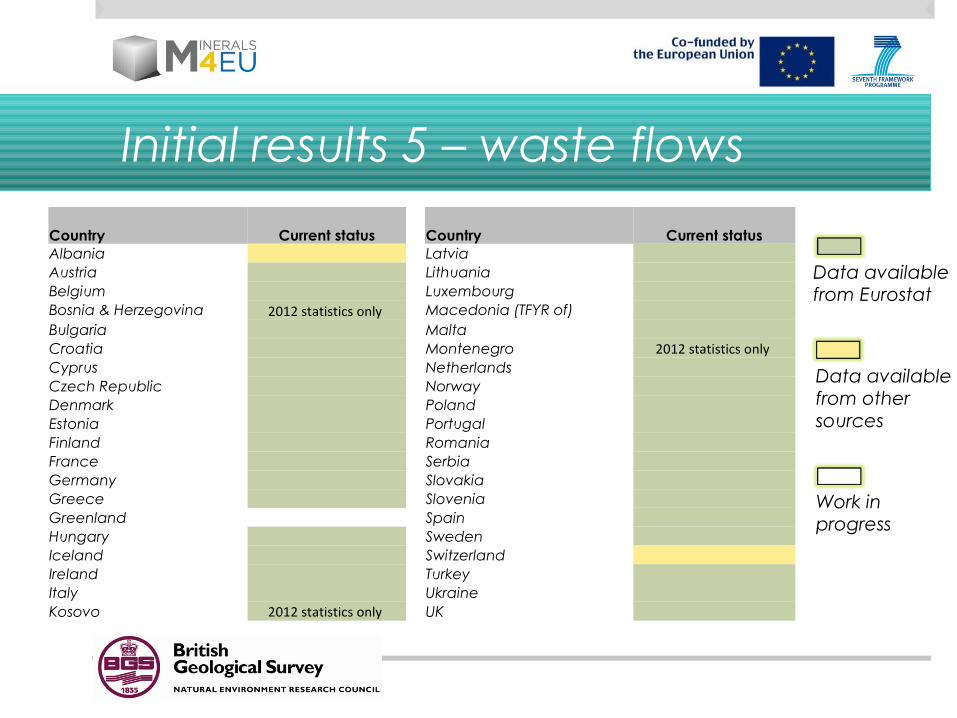
Initial results 5 – waste flows
Country Current status Country Current statusAlbania LatviaAustria LithuaniaBelgium LuxembourgBosnia & Herzegovina 2012 statistics only Macedonia (TFYR of)Bulgaria MaltaCroatia Montenegro 2012 statistics only Cyprus NetherlandsCzech Republic NorwayDenmark PolandEstonia PortugalFinland RomaniaFrance SerbiaGermany SlovakiaGreece SloveniaGreenland SpainHungary SwedenIceland SwitzerlandIreland TurkeyItaly UkraineKosovo 2012 statistics only UK
Data available from Eurostat
Data availablefrom other sources
Work inprogress
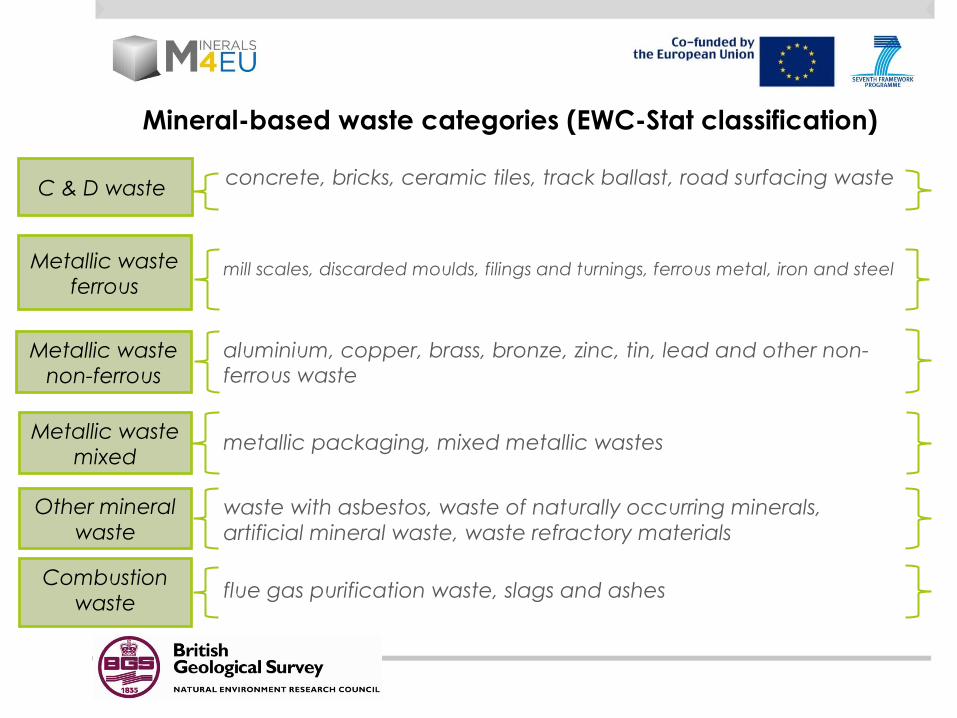
C & D waste concrete, bricks, ceramic tiles, track ballast, road surfacing waste
Metallic waste ferrous
mill scales, discarded moulds, filings and turnings, ferrous metal, iron and steel
Metallic waste non-ferrous
Metallic waste mixed
Other mineral waste
Combustion waste
aluminium, copper, brass, bronze, zinc, tin, lead and other non-ferrous waste
metallic packaging, mixed metallic wastes
waste with asbestos, waste of naturally occurring minerals, artificial mineral waste, waste refractory materials
flue gas purification waste, slags and ashes
Mineral-based waste categories (EWC-Stat classification)
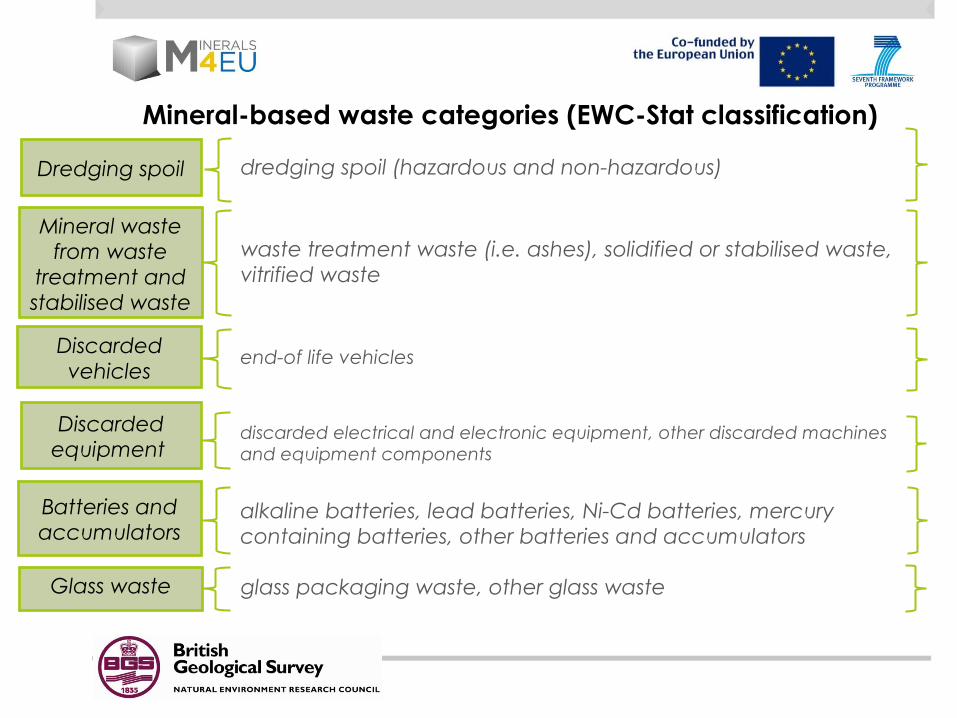
Dredging spoil dredging spoil (hazardous and non-hazardous)
Discarded equipment
Batteries and accumulators
Glass waste
end-of life vehicles
alkaline batteries, lead batteries, Ni-Cd batteries, mercury containing batteries, other batteries and accumulators
glass packaging waste, other glass waste
Mineral-based waste categories (EWC-Stat classification)
Mineral waste from waste
treatment and stabilised waste
waste treatment waste (i.e. ashes), solidified or stabilised waste, vitrified waste
Discarded vehicles
discarded electrical and electronic equipment, other discarded machines and equipment components
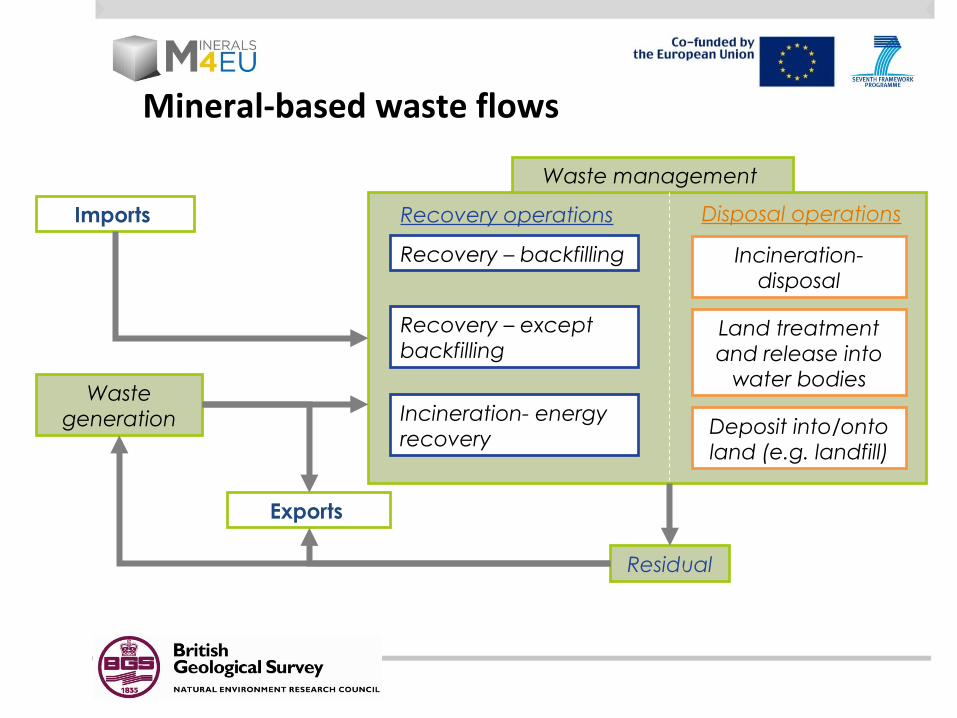
Mineral-based waste flows
Waste generation
Waste management
Recovery – except backfilling
Recovery – backfilling
Incineration- energy recovery
Incineration- disposal
Deposit into/onto land (e.g. landfill)
Recovery operations Disposal operationsImports
Land treatment and release into
water bodies
Exports
Residual
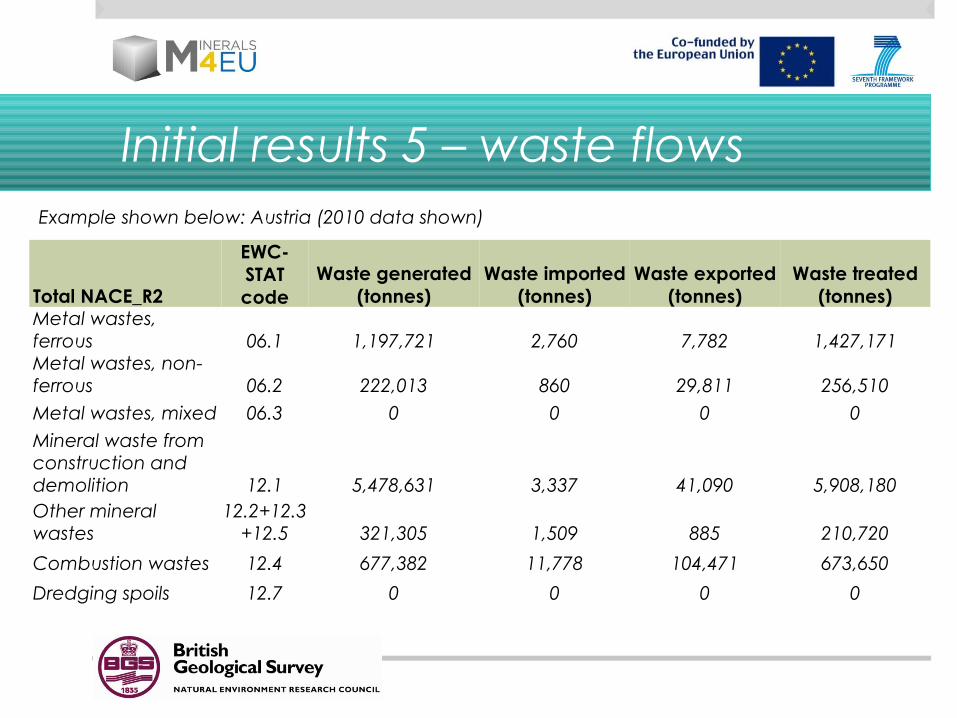
Initial results 5 – waste flows
Total NACE_R2
EWC-STAT code
Waste generated (tonnes)
Waste imported (tonnes)
Waste exported (tonnes)
Waste treated (tonnes)
Metal wastes, ferrous 06.1 1,197,721 2,760 7,782 1,427,171Metal wastes, non-ferrous 06.2 222,013 860 29,811 256,510Metal wastes, mixed 06.3 0 0 0 0Mineral waste from construction and demolition 12.1 5,478,631 3,337 41,090 5,908,180Other mineral wastes
12.2+12.3+12.5 321,305 1,509 885 210,720
Combustion wastes 12.4 677,382 11,778 104,471 673,650
Dredging spoils 12.7 0 0 0 0
Example shown below: Austria (2010 data shown)
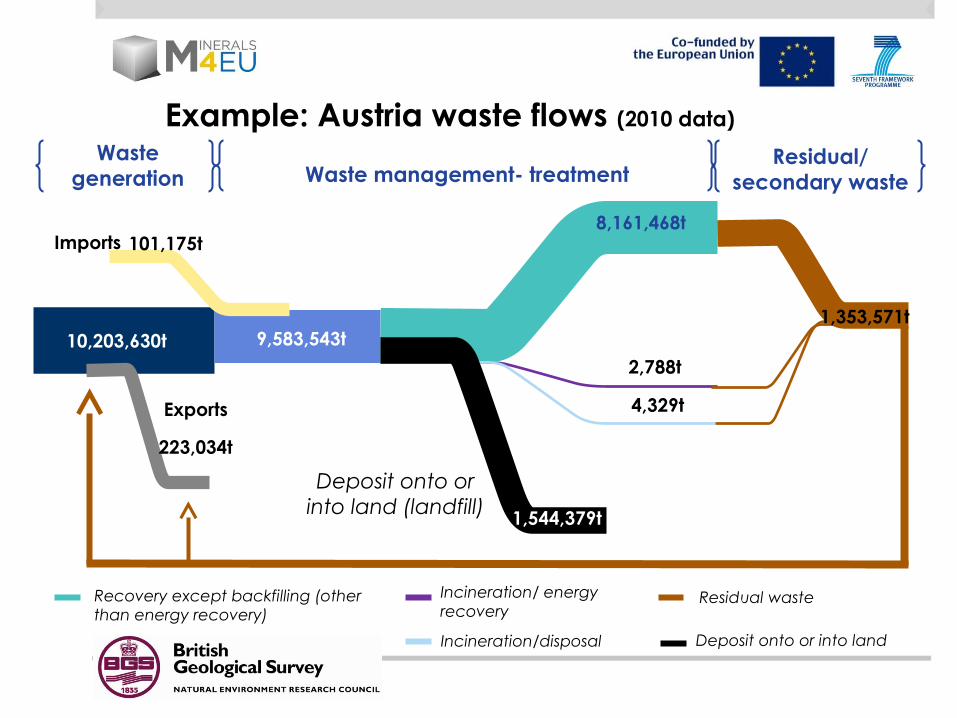
Example: Austria waste flows (2010 data)
Waste generation Waste management- treatment
Imports
Exports
10,203,630t 9,583,543t
Incineration/ energy recovery
Recovery except backfilling (other than energy recovery)
Incineration/disposal
Deposit onto or into land (landfill)
1,353,571t
223,034t
8,161,468t
2,788t
4,329t
Residual/ secondary waste
1,544,379t
Residual waste
Deposit onto or into land
101,175t
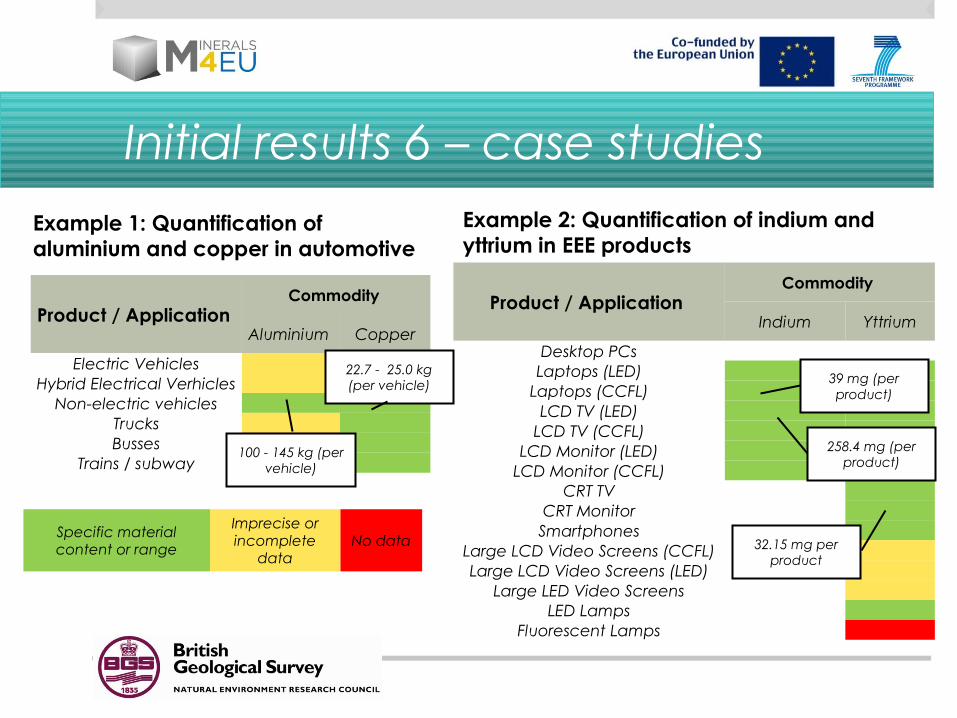
Product / Application Commodity
Indium Yttrium
Desktop PCs Laptops (LED)
Laptops (CCFL) LCD TV (LED)
LCD TV (CCFL) LCD Monitor (LED)
LCD Monitor (CCFL) CRT TV
CRT Monitor Smartphones
Large LCD Video Screens (CCFL) Large LCD Video Screens (LED)
Large LED Video Screens LED Lamps
Fluorescent Lamps
Specific material content or range
Imprecise or incomplete
dataNo data
Example 2: Quantification of indium and yttrium in EEE products
39 mg (per product)
258.4 mg (per product)
32.15 mg per product
Product / Application Commodity
Aluminium Copper
Electric Vehicles Hybrid Electrical Verhicles
Non-electric vehicles Trucks Busses
Trains / subway 100 - 145 kg (per
vehicle)
22.7 - 25.0 kg (per vehicle)
Example 1: Quantification of aluminium and copper in automotive
Initial results 6 – case studies
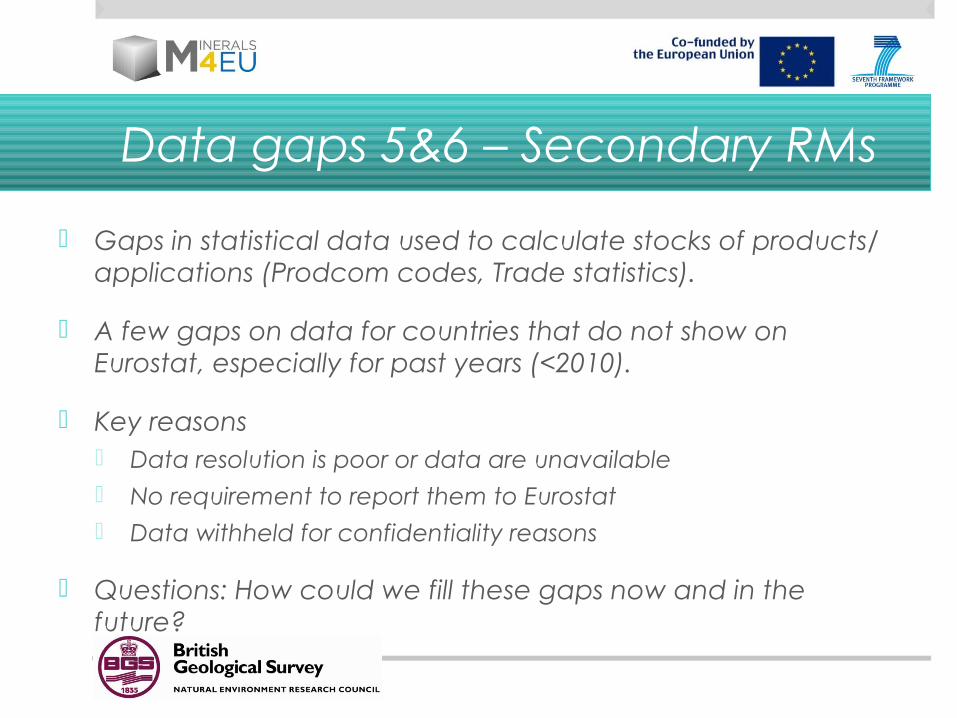
Data gaps 5&6 – Secondary RMs
Gaps in statistical data used to calculate stocks of products/ applications (Prodcom codes, Trade statistics).
A few gaps on data for countries that do not show on Eurostat, especially for past years (<2010).
Key reasons Data resolution is poor or data are unavailable No requirement to report them to Eurostat Data withheld for confidentiality reasons
Questions: How could we fill these gaps now and in the future?
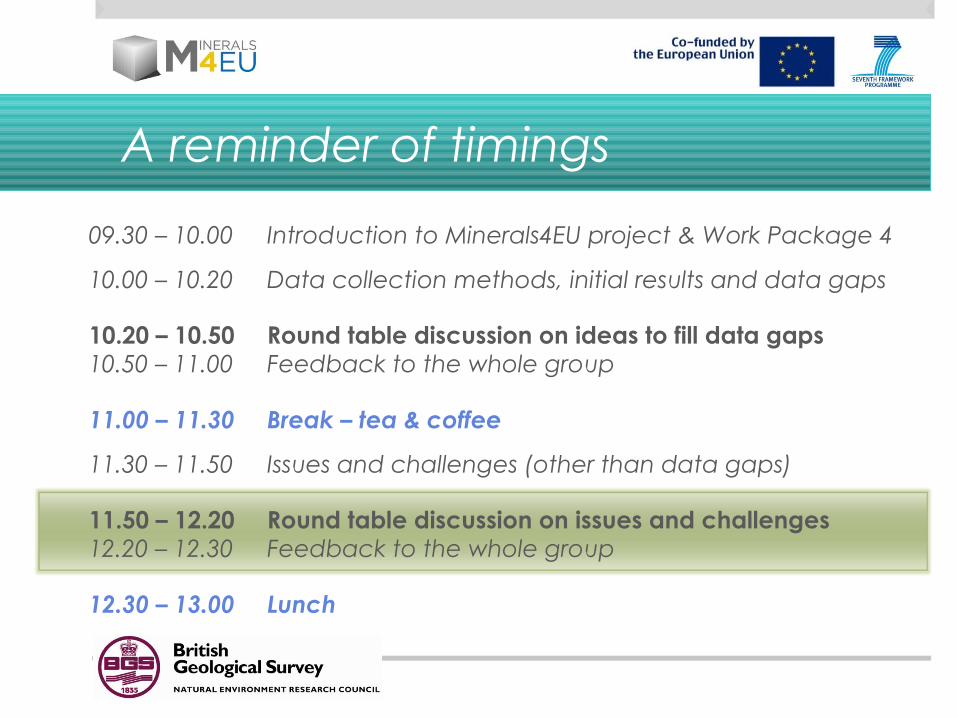
A reminder of timings
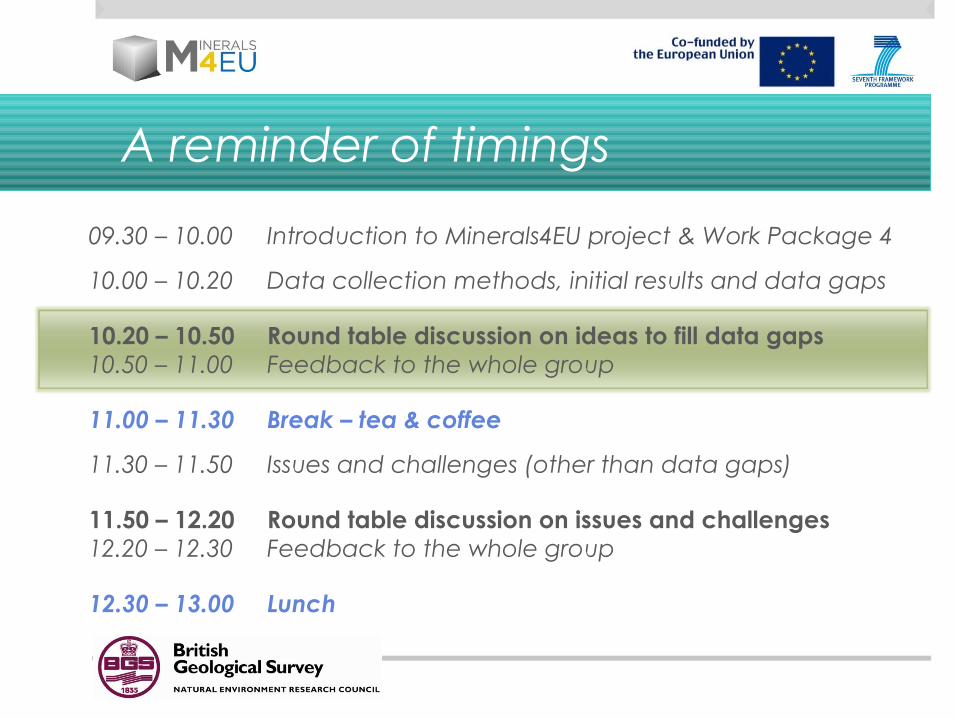
09.30 – 10.00 Introduction to Minerals4EU project & Work Package 4
10.00 – 10.20 Data collection methods, initial results and data gaps
10.20 – 10.50 Round table discussion on ideas to fill data gaps10.50 – 11.00 Feedback to the whole group
11.00 – 11.30 Break – tea & coffee
11.30 – 11.50 Issues and challenges (other than data gaps)
11.50 – 12.20 Round table discussion on issues and challenges12.20 – 12.30 Feedback to the whole group
12.30 – 13.00 Lunch
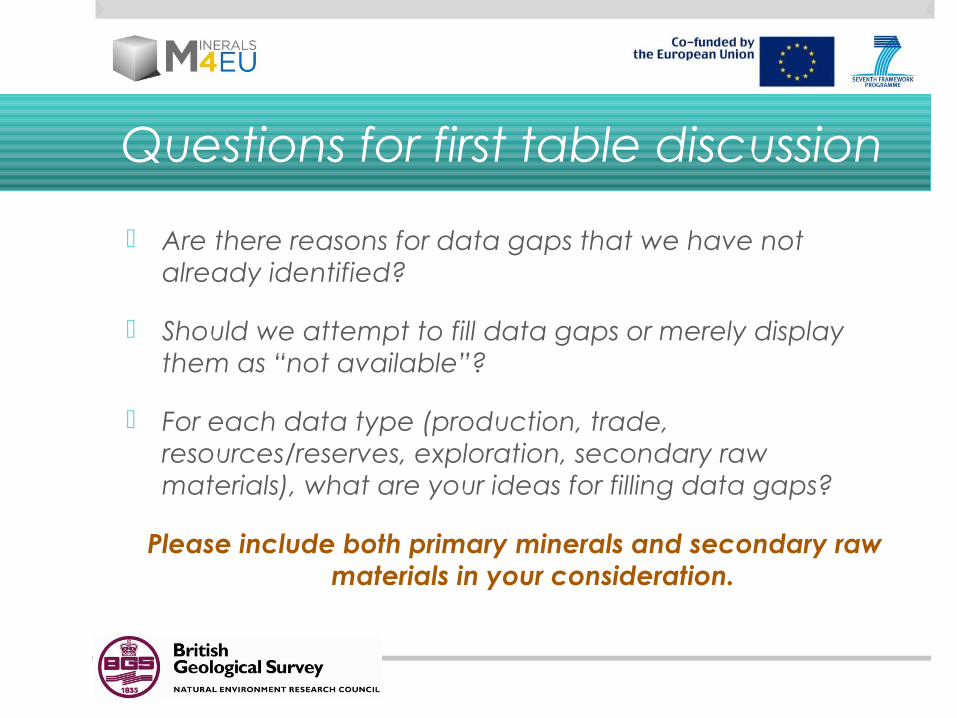
Questions for first table discussion
Are there reasons for data gaps that we have not already identified?
Should we attempt to fill data gaps or merely display them as “not available”?
For each data type (production, trade, resources/reserves, exploration, secondary raw materials), what are your ideas for filling data gaps?
Please include both primary minerals and secondary raw materials in your consideration.
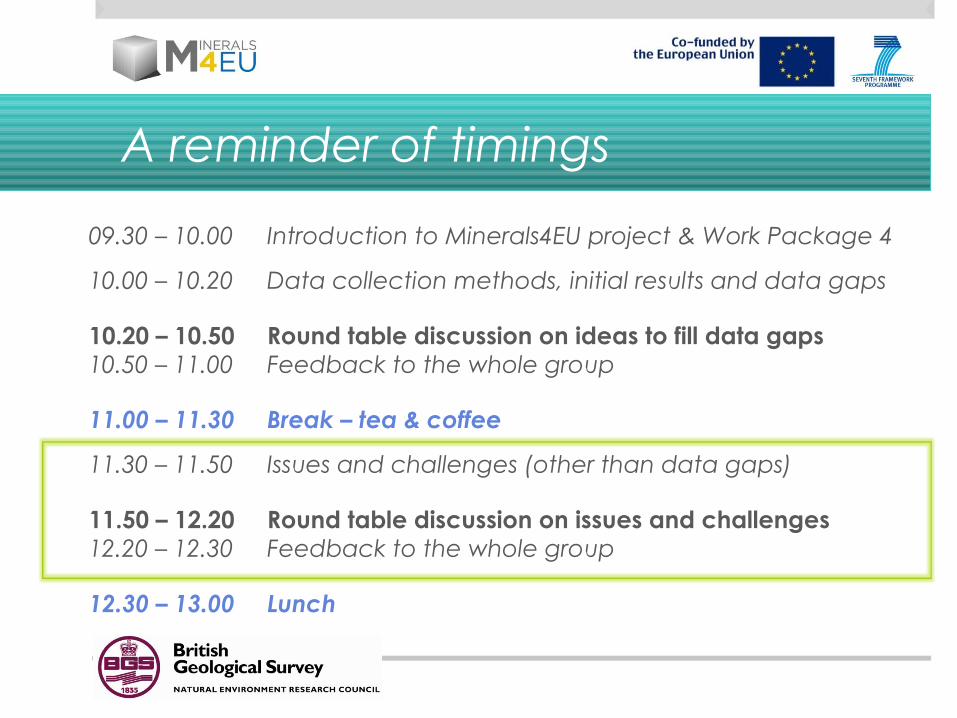
A reminder of timings
09.30 – 10.00 Introduction to Minerals4EU project & Work Package 4
10.00 – 10.20 Data collection methods, initial results and data gaps
10.20 – 10.50 Round table discussion on ideas to fill data gaps10.50 – 11.00 Feedback to the whole group
11.00 – 11.30 Break – tea & coffee
11.30 – 11.50 Issues and challenges (other than data gaps)
11.50 – 12.20 Round table discussion on issues and challenges12.20 – 12.30 Feedback to the whole group
12.30 – 13.00 Lunch
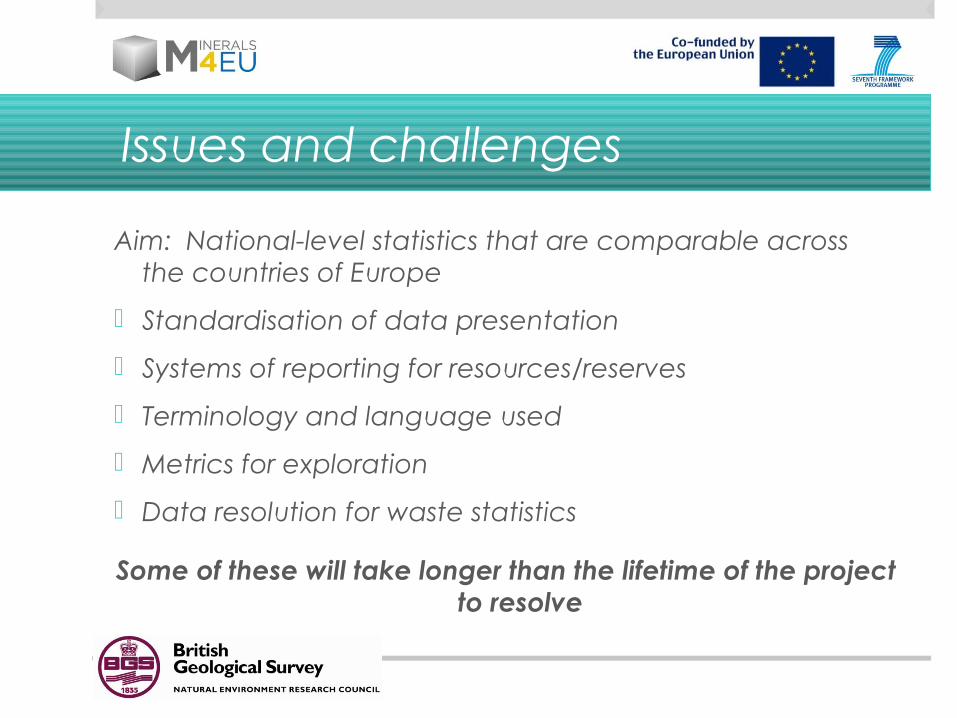
Issues and challenges
Aim: National-level statistics that are comparable across the countries of Europe
Standardisation of data presentation
Systems of reporting for resources/reserves
Terminology and language used
Metrics for exploration
Data resolution for waste statistics
Some of these will take longer than the lifetime of the project to resolve
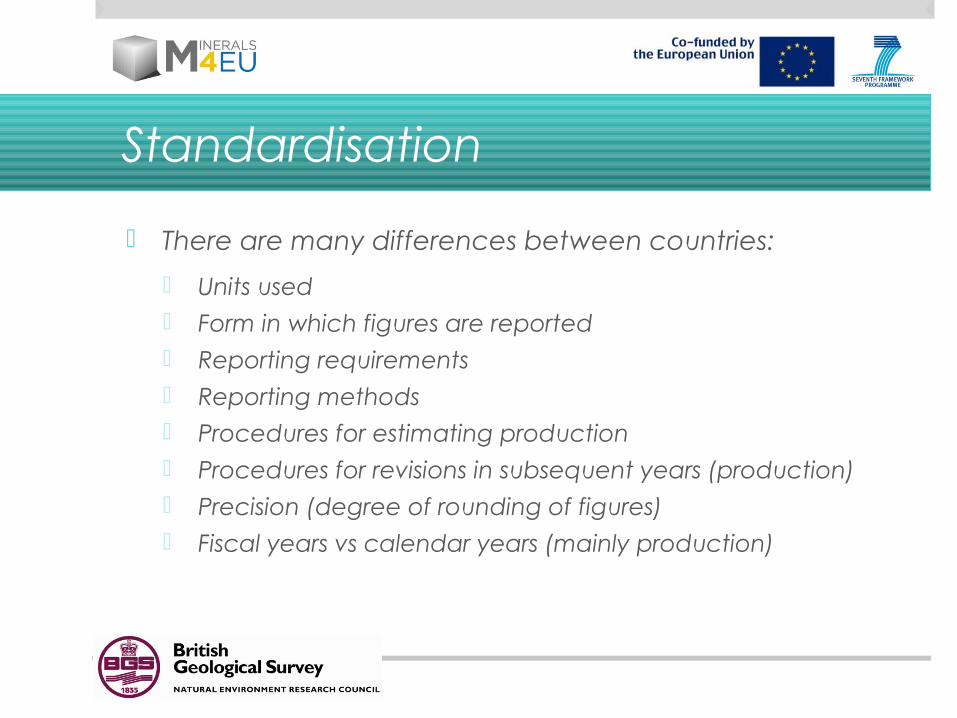
Standardisation
There are many differences between countries:
Units used Form in which figures are reported Reporting requirements Reporting methods Procedures for estimating production Procedures for revisions in subsequent years (production) Precision (degree of rounding of figures) Fiscal years vs calendar years (mainly production)
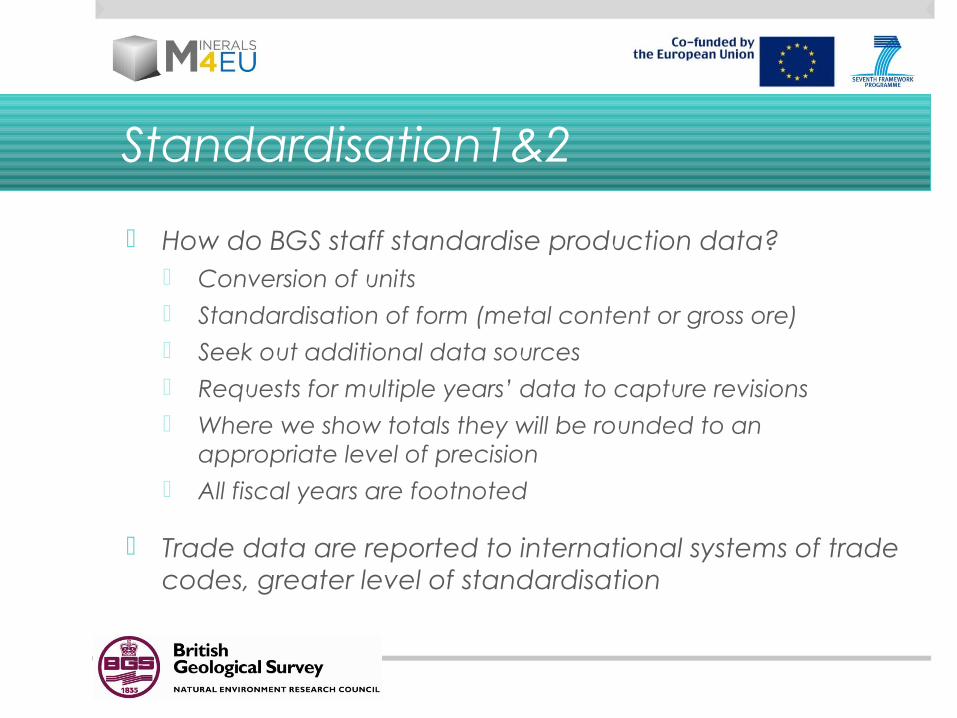
Standardisation1&2
How do BGS staff standardise production data? Conversion of units Standardisation of form (metal content or gross ore) Seek out additional data sources Requests for multiple years’ data to capture revisions Where we show totals they will be rounded to an
appropriate level of precision All fiscal years are footnoted
Trade data are reported to international systems of trade codes, greater level of standardisation
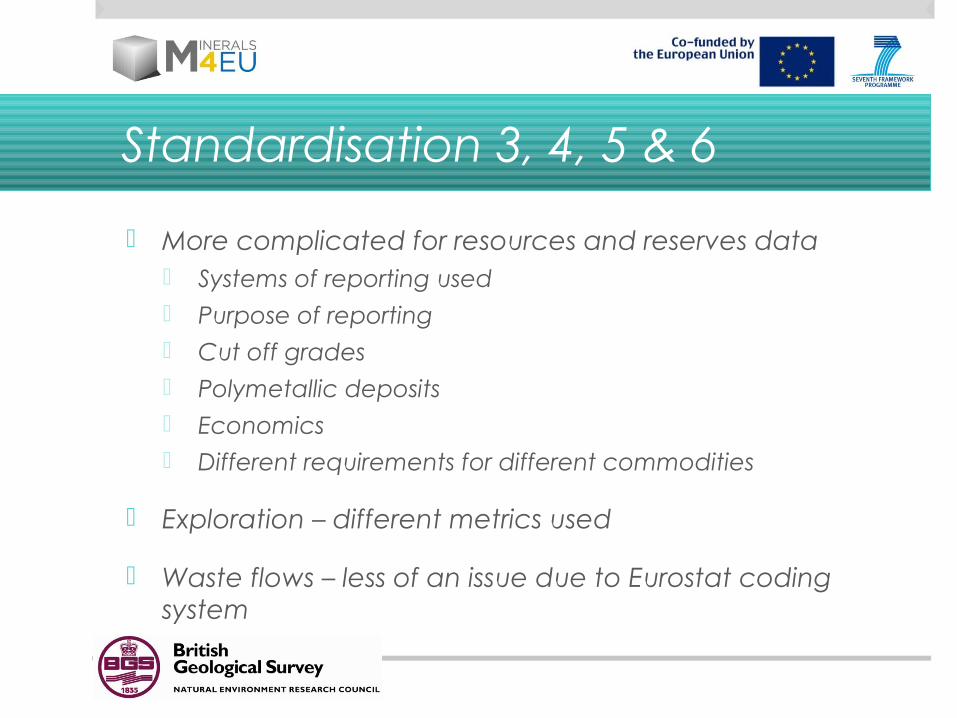
Standardisation 3, 4, 5 & 6
More complicated for resources and reserves data Systems of reporting used Purpose of reporting Cut off grades Polymetallic deposits Economics Different requirements for different commodities
Exploration – different metrics used
Waste flows – less of an issue due to Eurostat coding system
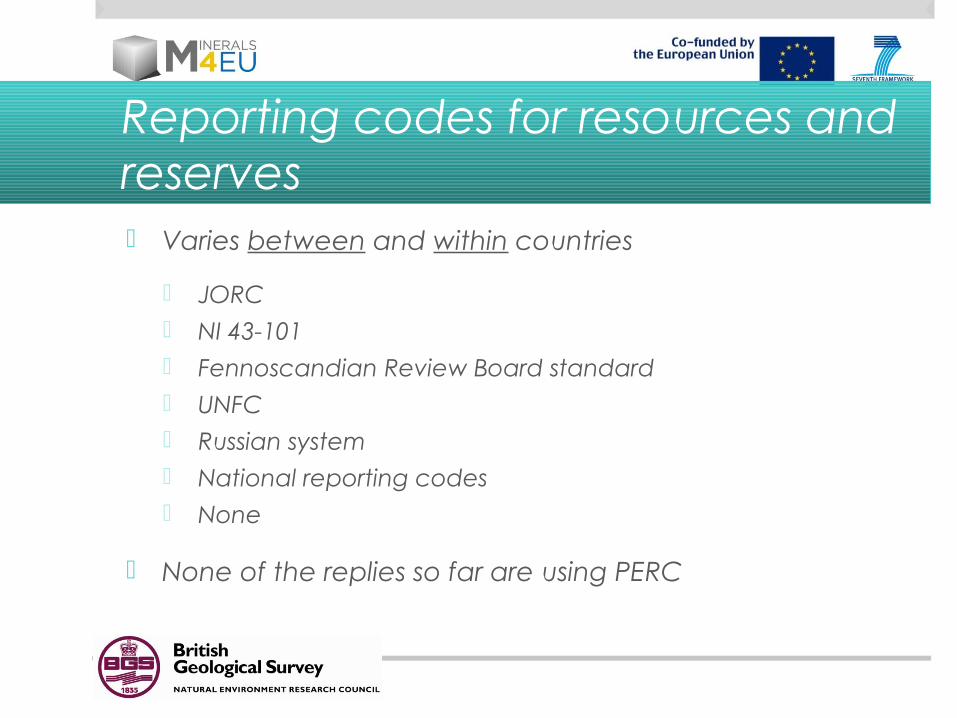
Reporting codes for resources and reserves Varies between and within countries
JORC NI 43-101 Fennoscandian Review Board standard UNFC Russian system National reporting codes None
None of the replies so far are using PERC
Terminology / language 1&2
For production data:
BGS has a standard list of commodity names used in its current publications
Data for other commodities are sometimes received, but are not used
For trade data:
Terms are defined by the coding system, but need careful interpretation

Terminology / language 3
Variation between countries in the use of the terms “resource” or “reserve”
Variation generally expressed in terms of the degree of geological knowledge of a deposit
Variation generally expressed in terms of the degree of current economic viability of a deposit
e.g. ‘known resource’, ‘estimated reserve’
Terminology / language 3&4
Terminology issues surrounding the names given to commodities
Different types of clays used for different purposes Limestone used for crushed rock aggregates or industrial
purposes Construction sand, silica sand, quartz sand, foundry sand,
glass sand, backfilling sand…….
Should we standardise on a common list? Or should we include all the variations country by country?
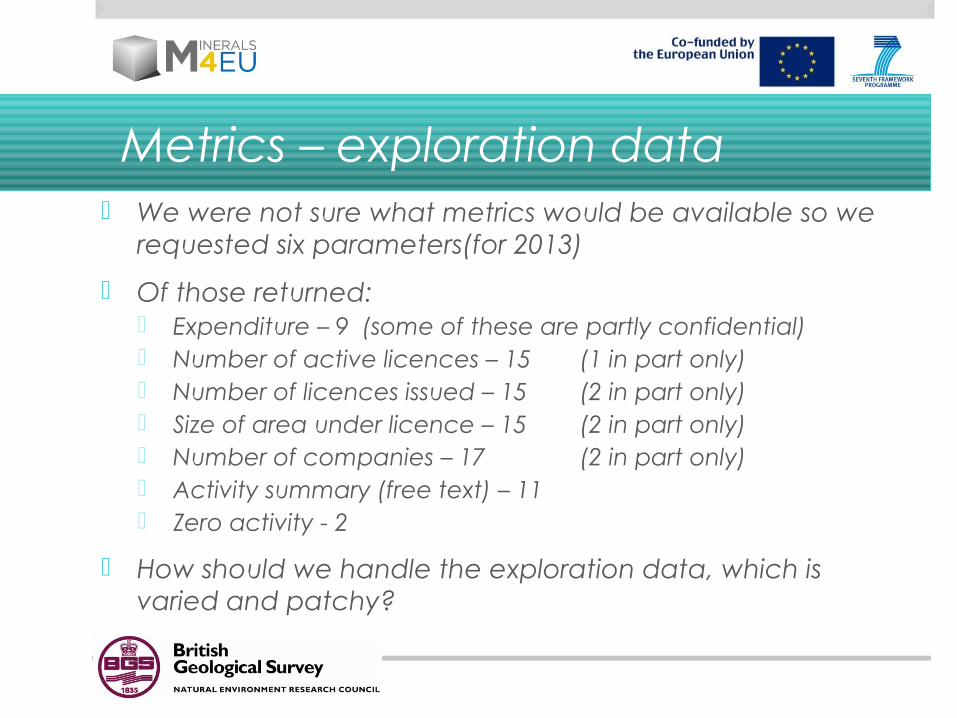
Metrics – exploration data We were not sure what metrics would be available so we
requested six parameters(for 2013)
Of those returned: Expenditure – 9 (some of these are partly confidential) Number of active licences – 15 (1 in part only) Number of licences issued – 15 (2 in part only) Size of area under licence – 15 (2 in part only) Number of companies – 17 (2 in part only) Activity summary (free text) – 11 Zero activity - 2
How should we handle the exploration data, which is varied and patchy?
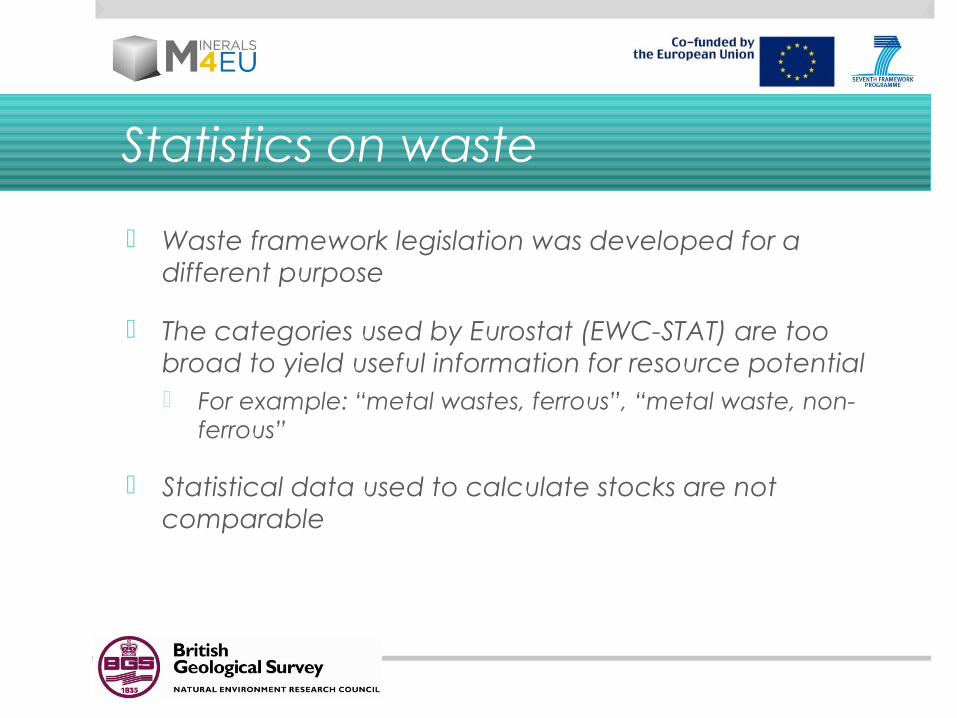
Statistics on waste
Waste framework legislation was developed for a different purpose
The categories used by Eurostat (EWC-STAT) are too broad to yield useful information for resource potential For example: “metal wastes, ferrous”, “metal waste, non-
ferrous”
Statistical data used to calculate stocks are not comparable
A reminder of timings
09.30 – 10.00 Introduction to Minerals4EU project & Work Package 4
10.00 – 10.20 Data collection methods, initial results and data gaps
10.20 – 10.50 Round table discussion on ideas to fill data gaps10.50 – 11.00 Feedback to the whole group
11.00 – 11.30 Break – tea & coffee
11.30 – 11.50 Issues and challenges (other than data gaps)
11.50 – 12.20 Round table discussion on issues and challenges12.20 – 12.30 Feedback to the whole group
12.30 – 13.00 Lunch
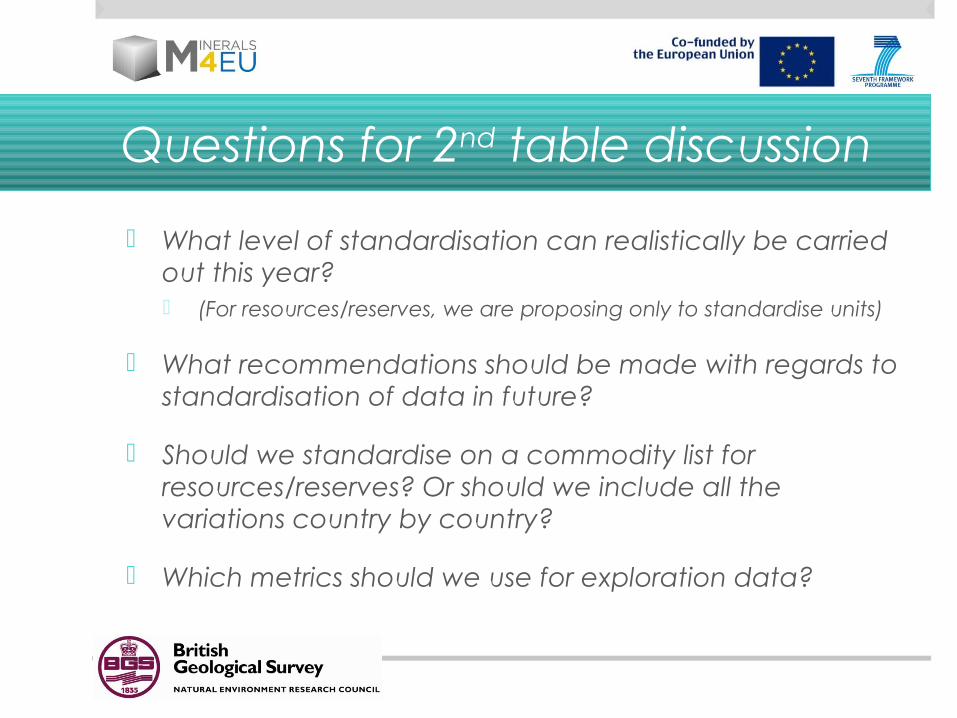
Questions for 2nd table discussion
What level of standardisation can realistically be carried out this year? (For resources/reserves, we are proposing only to standardise units)
What recommendations should be made with regards to standardisation of data in future?
Should we standardise on a commodity list for resources/reserves? Or should we include all the variations country by country?
Which metrics should we use for exploration data?
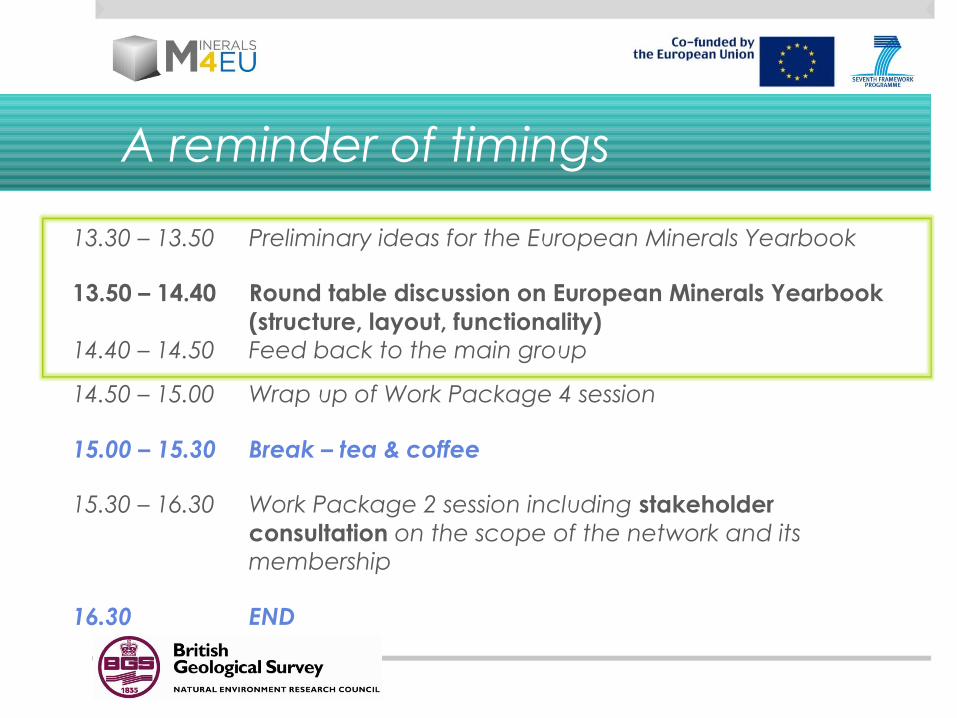
A reminder of timings
13.30 – 13.50 Preliminary ideas for the European Minerals Yearbook
13.50 – 14.40 Round table discussion on European Minerals Yearbook (structure, layout, functionality)
14.40 – 14.50 Feed back to the main group
14.50 – 15.00 Wrap up of Work Package 4 session
15.00 – 15.30 Break – tea & coffee
15.30 – 16.30 Work Package 2 session including stakeholder consultation on the scope of the network and its membership
16.30 END
European Minerals Yearbook
A digital yearbook
Delivered online via a web portal
Open access
National scale statistical data with accompanying notes, explanations and metadata
Glossary
Possibly some diagrams
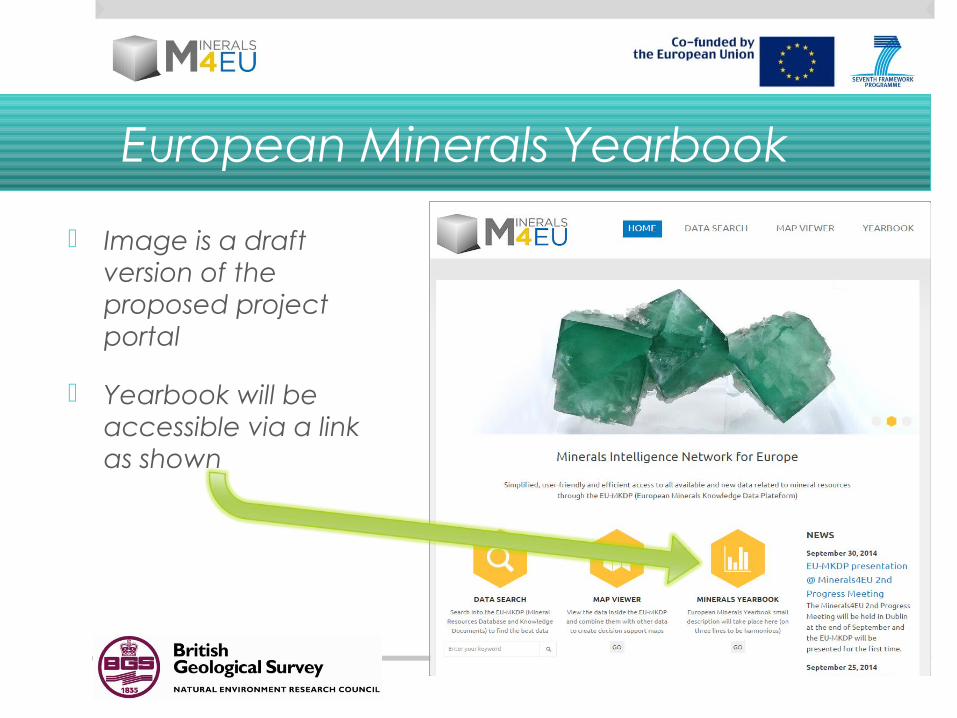
European Minerals Yearbook
Image is a draft version of the proposed project portal
Yearbook will be accessible via a link as shown
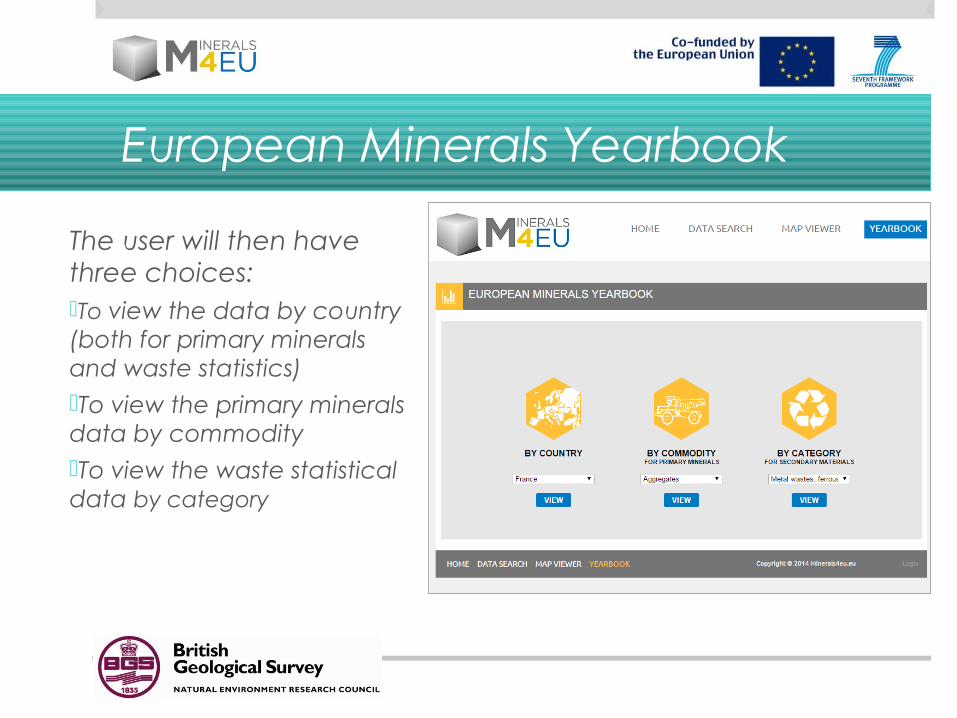
European Minerals Yearbook
The user will then have three choices:To view the data by country (both for primary minerals and waste statistics)To view the primary minerals data by commodityTo view the waste statistical data by category
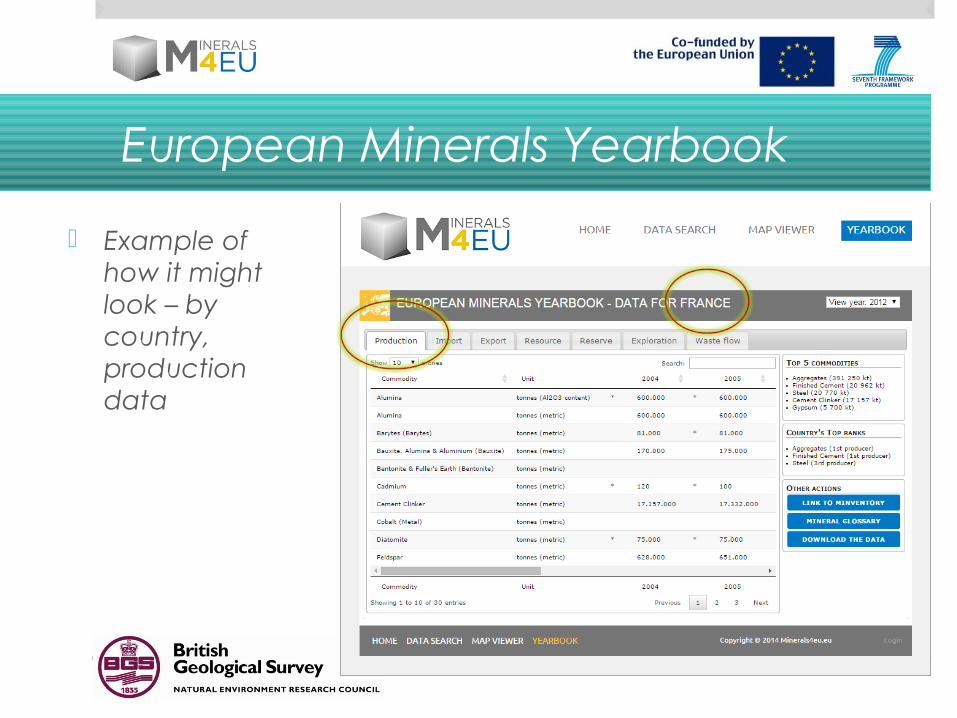
European Minerals Yearbook
Example of how it might look – by country, production data
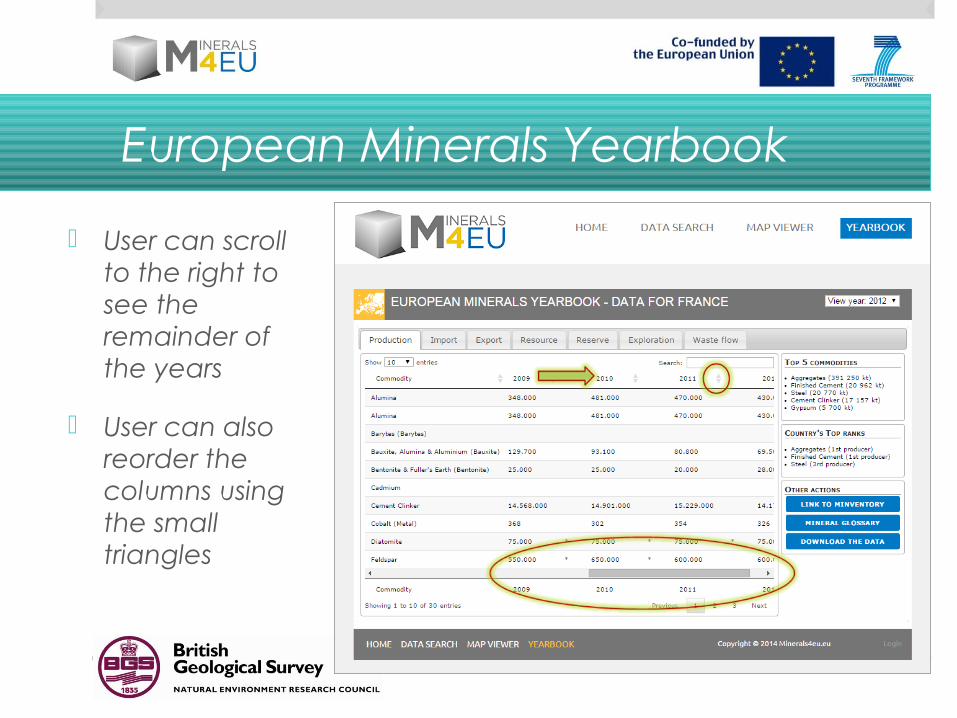
European Minerals Yearbook
User can scroll to the right to see the remainder of the years
User can also reorder the columns using the small triangles
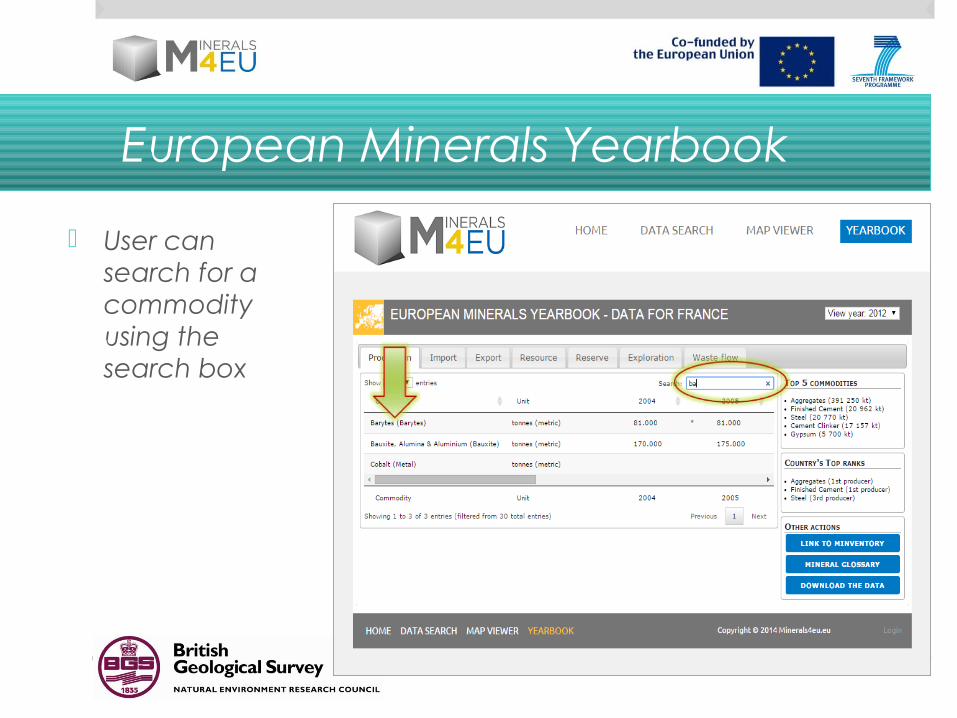
European Minerals Yearbook
User can search for a commodity using the search box
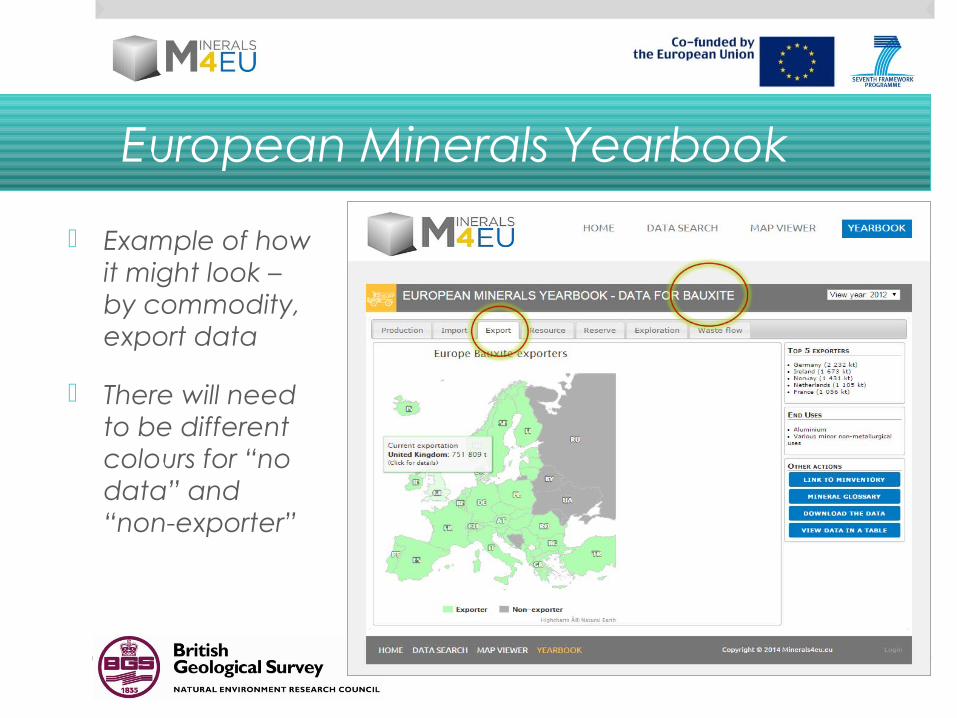
European Minerals Yearbook
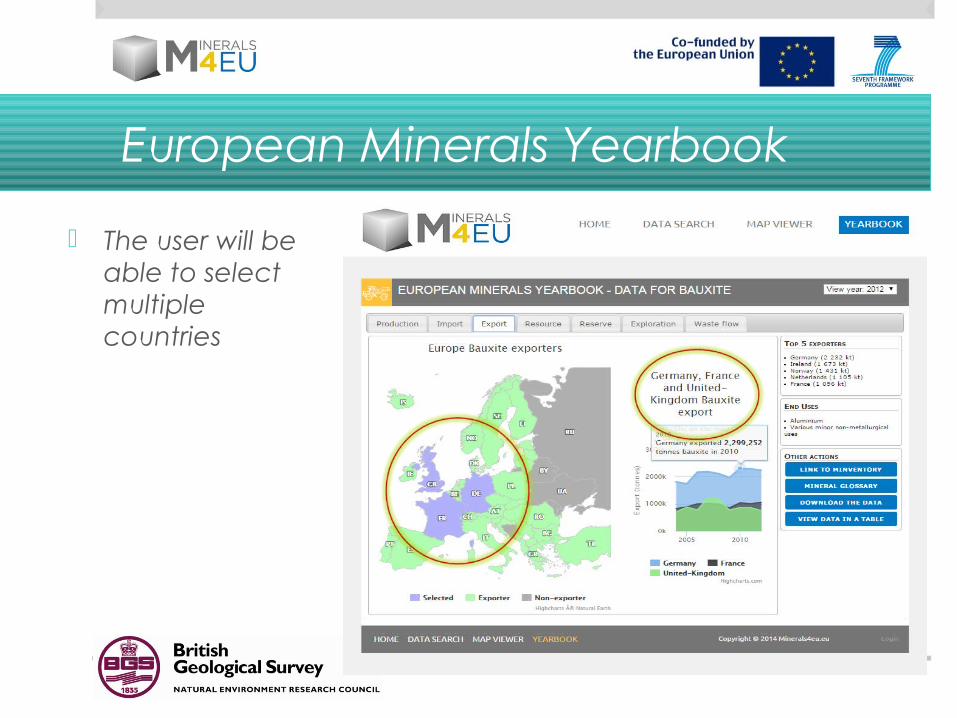
Example of how it might look – by commodity, export data
There will need to be different colours for “no data” and “non-exporter”

European Minerals Yearbook
There could be charts showing trends over ten years
The data can also be viewed in a table using the button
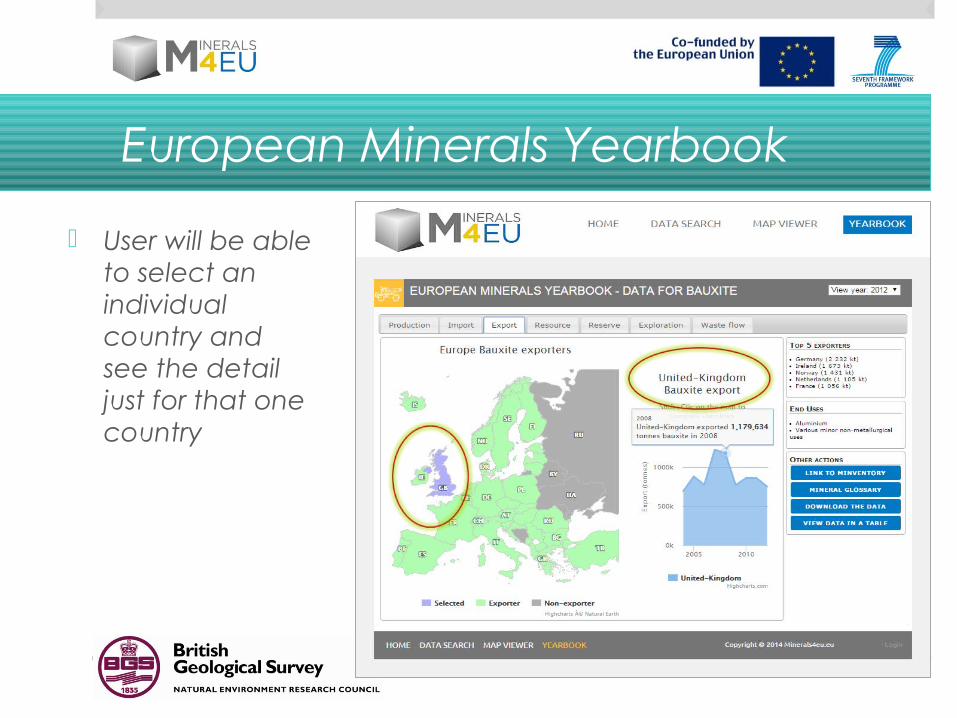
European Minerals Yearbook
User will be able to select an individual country and see the detail just for that one country
European Minerals Yearbook
The user will be able to select multiple countries
European Minerals Yearbook
Tables (where available) will be viewed on screen with the option of opening them in Excel
Data relating to secondary raw materials presented alongside primary minerals
Additional functions that will be available A link to the front page of the Minventory metadata portal A link to a glossary The option of downloading an entire chapter to a pdf
document Links to National Geological Surveys or other data providers
European Minerals Yearbook
Additional functions that could be available in future Top producing countries in the World/Europe ranked Typical end uses shown and/or described More interactive charts or diagrams More analysis of the data, for example pan-European
summaries by commodity or discussion on topics such as import dependence
Increased number of case studies relating to the recovery of commodities from waste streams
A reminder of timings
13.30 – 13.50 Preliminary ideas for the European Minerals Yearbook
13.50 – 14.40 Round table discussion on European Minerals Yearbook (structure, layout, functionality)
14.40 – 14.50 Feed back to the main group
14.50 – 15.00 Wrap up of Work Package 4 session
15.00 – 15.30 Break – tea & coffee
15.30 – 16.30 Work Package 2 session including stakeholder consultation on the scope of the network and its membership
16.30 END
Questions for 3rd table discussion
What are your views on the proposed layout and structure of the digital Yearbook?
What specific information do you consider to be essential for your needs?
What specific functions would you like to see in the first edition of the Yearbook?
What specific functions would you like in future?
Wrap up of WP4 session
WP4 methods, initial results and data gaps Including your ideas for filling those gaps
Issues and challenges Including your ideas on standardisation, terminology and
the metrics for exploration data
Preliminary ideas for the Yearbook Including your views on the structure, layout and functions
Teresa Evi [email protected] [email protected] [email protected]
A reminder of timings
13.30 – 13.50 Preliminary ideas for the European Minerals Yearbook
13.50 – 14.40 Round table discussion on European Minerals Yearbook (structure, layout, functionality)
14.40 – 14.50 Feed back to the main group
14.50 – 15.00 Wrap up of Work Package 4 session
15.00 – 15.30 Break – tea & coffee
15.30 – 16.30 Work Package 2 session including stakeholder consultation on the scope of the network and its membership
16.30 END