united kingdom minerals yearbook 2011 - british geological survey
TRANSCRIPT
United Kingdom Minerals Yearbook 2011
Minerals and Waste Programme
Open Report OR/12/009


BRITISH GEOLOGICAL SURVEY
MINERALS AND WASTE PROGRAMME
OPEN REPORT OR/12/009
Keywords
United Kingdom, minerals, production, imports, exports.
Front cover
Extraction of Lincolnshire Limestone from Melton Ross Quarry. BGS © NERC. Photographer: Don Cameron
Bibliographical reference
N. E. IDOINE, T. BIDE, T. J. BROWN. 2012. United Kingdom Minerals Yearbook 2011. British Geological Survey Open Report, OR/12/009. 104pp.
United Kingdom Minerals Yearbook 2011
Statistical data to 2010
N. E. Idoine, T. Bide, T. J. Brown.
© NERC 2012. All rights reserved Keyworth, Nottingham British Geological Survey 2012

The full range of our publications is available from BGS shops at Nottingham, Edinburgh, London and Cardiff (Welsh publications only) see contact details below or shop online at www.geologyshop.com
The London Information Office also maintains a reference collection of BGS publications, including maps for consultation.
We publish an annual catalogue of our maps and other publications; this catalogue is available online or from any of the BGS shops.
The British Geological Survey carries out the geological survey of Great Britain and Northern Ireland (the latter as an agency service for the government of Northern Ireland), and of the surrounding continental shelf, as well as basic research projects. It also undertakes programmes of technical aid in geology in developing countries.
The British Geological Survey is a component body of the Natural Environment Research Council.
© NERC 2012 All rights reserved
Copyright in materials derived from the British Geological Survey’s work is owned by the Natural Environment Research Council (NERC) and/or the authority that commissioned the work. You may not copy or adapt this publication without first obtaining permission. Contact the BGS Intellectual Property Rights Section, British Geological Survey, Keyworth, e-mail [email protected].
You may quote extracts of a reasonable length without prior permission, provided a full acknowledgement is given of the source of the extract.
All communications regarding the content of this publication should be addressed to the Head of Science, Minerals and Waste, British Geological Survey, Keyworth, Nottingham NG12 5GG
Tel 0115 936 3495 Fax 0115 936 3446
e-mail: [email protected]
British Geological Survey offices
BGS Central Enquiries Desk
Tel 0115 936 3143 Fax 0115 936 3276
email [email protected]
Kingsley Dunham Centre, Keyworth, Nottingham NG12 5GG
Tel 0115 936 3100 Fax 0115 936 3200 email [email protected]
Murchison House, West Mains Road, Edinburgh EH9 3LA
Tel 0131 667 1000 Fax 0131 668 2683 email [email protected]
Natural History Museum, Cromwell Road, London SW7 5BD
Tel 020 7589 4090 Fax 020 7584 8270 Tel 020 7942 5344/45 email [email protected]
Columbus House, Greenmeadow Springs, Tongwynlais, Cardiff CF15 7NE
Tel 029 2052 1962 Fax 029 2052 1963
Maclean Building, Crowmarsh Gifford, Wallingford OX10 8BB
Tel 01491 838800 Fax 01491 692345
Geological Survey of Northern Ireland, Colby House, Stranmillis Court, Belfast BT9 5BF
Tel 028 9038 8462 Fax 028 9038 8461
www.bgs.ac.uk/gsni/
Parent Body
Natural Environment Research Council, Polaris House, North Star Avenue, Swindon SN2 1EU
Tel 01793 411500 Fax 01793 411501 www.nerc.ac.uk
Website www.bgs.ac.uk Shop online at www.geologyshop.com
BRITISH GEOLOGICAL SURVEY

1
Acknowledgements The compilers of this volume are grateful for the help received from the Office for National Statistics, the Department for Business, Innovation and Skills, the Department for Communities and Local Government, the Department of Energy and Climate Change, the Crown Estate Commissioners, The Crown Mineral Agent, the Northern Ireland Department of Enterprise, Trade and Investment and the Isle of Man Department of Economic Development. They would also like to acknowledge the valuable assistance given by the World Bureau of Metal Statistics, the UK Iron and Steel Statistics Bureau, the Mineral Products Association, The Coal Authority and the numerous companies that have generously provided additional information.

2
Contents
Acknowledgements ..................................................................................................................................................... 1
Contents........................................................................................................................................................................ 2
Explanatory notes ........................................................................................................................................................ 4
Tables ............................................................................................................................................................................ 7 Trade in minerals and mineral-based products compared with total trade 2004-2010 ..................................... 7 Balance of trade in minerals and mineral-based products 2006-2010 ............................................................. 8 Approximate value of minerals produced in the UK 2003-2010 .................................................................... 10 UK approximate value of minerals produced onshore and offshore 2003-2010 ........................................... 10 UK mining and quarrying : gross value added 2004-2011 ............................................................................. 11 UK employment in the minerals industry, 2009 and 2010 .............................................................................. 11 UK production of minerals 2005-2011 ............................................................................................................ 12 England production of mineral 2004-2010 ..................................................................................................... 13 Wales production of minerals 2004-2010 ....................................................................................................... 14 Scotland production of minerals 2004-2010 ................................................................................................... 15 Northern Ireland mineral production by county 2010 ..................................................................................... 16 Minerals produced in Northern Ireland, Isle of Man, Guernsey and Jersey 2006-2010 ................................. 16 Number of mineral workings in the UK by commodity .................................................................................... 17 Abrasives, natural .......................................................................................................................................... 18 Aggregates .................................................................................................................................................... 18 Aluminium ...................................................................................................................................................... 23 Aluminium compounds ................................................................................................................................... 23 Antimony ........................................................................................................................................................ 24 Arsenic ........................................................................................................................................................... 24 Asbestos ........................................................................................................................................................ 24 Ashphalt, natural ............................................................................................................................................ 25 Ball clay ......................................................................................................................................................... 25 Barytes ........................................................................................................................................................... 25 Bauxite ........................................................................................................................................................... 26 Bentonite ........................................................................................................................................................ 26 Berylium ......................................................................................................................................................... 26 Bismuth .......................................................................................................................................................... 26 Boron ............................................................................................................................................................. 27 Bricks ............................................................................................................................................................. 27 Bromine ......................................................................................................................................................... 27 Building and dimension stone ........................................................................................................................ 28 Cadmium ....................................................................................................................................................... 28 Cement .......................................................................................................................................................... 29 Chalk (see Limestone) ................................................................................................................................... 52 China clay ...................................................................................................................................................... 29 China stone (see Feldspar) ............................................................................................................................ 43 Chromium ...................................................................................................................................................... 30 Clays .............................................................................................................................................................. 30 Coal ............................................................................................................................................................... 32 Cobalt ............................................................................................................................................................ 35 Coke and breeze ............................................................................................................................................ 35 Copper ........................................................................................................................................................... 36 Crushed rock (also see Aggregates) .............................................................................................................. 36 Diamond ........................................................................................................................................................ 42 Diatomite ........................................................................................................................................................ 42 Dolomite (see Limestone) .............................................................................................................................. 52 Feldspar ......................................................................................................................................................... 43 Fireclay .......................................................................................................................................................... 43 Fluorspar ........................................................................................................................................................ 43 Fuller's earth .................................................................................................................................................. 44 Gas, natural (see Petroleum) ......................................................................................................................... 65 Germanium .................................................................................................................................................... 44 Gold ............................................................................................................................................................... 44 Granite (see Igneous rock) ............................................................................................................................ 46 Graphite ......................................................................................................................................................... 45 Gypsum ......................................................................................................................................................... 45 Hafnium ......................................................................................................................................................... 46 Igneous rock .................................................................................................................................................. 46
3
Insulating materials ........................................................................................................................................ 48 Iodine ............................................................................................................................................................. 48 Iron compounds and earth colours................................................................................................................. 48 Iron ore .......................................................................................................................................................... 49 Iron and steel ................................................................................................................................................. 49 Lead ............................................................................................................................................................... 51 Limestone, dolomite and chalk ...................................................................................................................... 52 Lithium ........................................................................................................................................................... 59 Magnesia ....................................................................................................................................................... 59 Magnesium .................................................................................................................................................... 60 Manganese .................................................................................................................................................... 60 Marble ............................................................................................................................................................ 61 Mercury .......................................................................................................................................................... 61 Mica ............................................................................................................................................................... 61 Molybdenum .................................................................................................................................................. 62 Nepheline syenite .......................................................................................................................................... 62 Nickel ............................................................................................................................................................. 63 Niobium (see Tantalum and Niobium) ............................................................................................................ 85 Peat ............................................................................................................................................................... 63 Perlite ............................................................................................................................................................. 64 Petroleum and natural gas (includes text) (also see Primary fuels) ............................................................... 64 Phosphorus .................................................................................................................................................... 66 Platinum group metals ................................................................................................................................... 66 Potassium compounds ................................................................................................................................... 67 Precious and semi-precious stones (exluding diamonds) .............................................................................. 67 Primary fuels .................................................................................................................................................. 68 Pumice ........................................................................................................................................................... 70 Pyrite .............................................................................................................................................................. 70 Quartz and quartzite ...................................................................................................................................... 70 Radioactive and associated materials ............................................................................................................ 71 Rare earths .................................................................................................................................................... 71 Salt ................................................................................................................................................................. 71 Sand and gravel (see also Aggregates) ......................................................................................................... 72 Sandstone ...................................................................................................................................................... 78 Selenium ........................................................................................................................................................ 80 Sepiolite ......................................................................................................................................................... 80 Silica Sand .................................................................................................................................................... 80 Silicon ............................................................................................................................................................ 82 Sillimanite ...................................................................................................................................................... 82 Silver .............................................................................................................................................................. 83 Slate ............................................................................................................................................................... 83 Strontium ....................................................................................................................................................... 84 Sulphur .......................................................................................................................................................... 84 Talc ................................................................................................................................................................ 84 Tantalum ........................................................................................................................................................ 85 Tellurium ........................................................................................................................................................ 85 Tin .................................................................................................................................................................. 85 Titanium ......................................................................................................................................................... 86 Tungsten ........................................................................................................................................................ 87 Vanadium ....................................................................................................................................................... 87 Vermiculte ...................................................................................................................................................... 88 Zinc ................................................................................................................................................................ 88 Zirconium ....................................................................................................................................................... 89 Diagrams Value of UK minerals production 2010 ................................................................................................................ 9 Value of UK construction and industrial minerals production 2010 .................................................................... 9 GB production of crushed rock aggregates and sand and gravel by region 2010 ............................................. 19 GB production of crushed rock by end-use 2010 .............................................................................................. 37 GB production of sand and gravel by end-use 2010 ......................................................................................... 72
4
Explanatory notes Coverage: Except where otherwise stated all the statistics shown relate to the United Kingdom of Great Britain and Northern Ireland. The Channel Islands and the Isle of Man are also included in the ‘United Kingdom’ overseas trade statistics, but are excluded from the production statistics. The UK part of the Continental Shelf is included in both the overseas trade and the production statistics. All figures for the latest year shown are provisional and subject to revision. Rounding of figures: In tables where figures have been rounded to the nearest final digit, there may be a slight discrepancy between the sums of the constituent items and the total as shown. Units: The statistics in this volume are expressed in metric units. The following factors are given for converting from or into non-metric units: Troy ounce Kilogram 1 = 0.0311035 32.1507 = 1 Pound Kilogram 1 = 0.453592 2.20462 = 1 Hundredweight Kilogram 1 = 50.8023 0.019684 = 1 Long ton Tonne 1 = 1.01605 0.984206 = 1 Square yard Square metre 1 = 0.836127 1.19599 = 1 Cubic yard Cubic metre 1 = 0.764555 1.30795 = 1 UK gallon Litre 1 = 4.54596 0.2199755 = 1 Symbols: The following symbols are used throughout: … Figures not available 0 Quantity less than half the unit shown — Nil nes Not elsewhere specified BGS British Geological Survey Apparent consumption: BGS estimates of apparent consumption of metals are based on the formula: production (primary and secondary) plus imports minus exports. All the main traded forms of the metal are taken into account, for example, ores, concentrates, intermediate products, unwrought metal and alloys, oxides, etc. Figures are given in terms of metal content. No information is available for stock changes. Such estimates of apparent consumption are made for metals for which there are no reported consumption statistics: in this edition data are given for chromium, cobalt, manganese, molybdenum, titanium and zirconium. Trade: Trade figures from INTRASTAT, the system for measuring intra-EC trade became available from 1993. This was introduced following the abolition of customs controls as a result of the Single Market and trade figures are now compiled from data provided directly from companies instead of Customs documents. Extra-EC trade continues to be collected from Customs declarations as before. The transition from one system to another has produced some anomalous figures in terms of the size of the trade in and unit value of certain commodities. These factors should be taken into consideration when evaluating trends. Figures given in this edition are the combined intra and extra-EC trade data.

5
Values of commodities are c.i.f. (Cost, Insurance and Freight) for imports and f.o.b. (free on board) for exports. The terms ‘scrap’, ‘unwrought’ and ‘wrought’ metal include alloys unless these are separately shown. Exclusion of warranty Use by recipients of information provided by the BGS, is at the recipients’ own risk. BGS has taken care to ensure that information provided is as free from error as is reasonably practical. In view of the disparate sources of information at BGS’s disposal, including such material donated to BGS, that BGS accepts in good faith as being accurate, the Natural Environment Research Council (NERC) gives no warranty, expressed or implied, as to the quality, accuracy, performance, and merchantability of the information supplied, or to the information’s suitability for any use whether made known to BGS or otherwise. NERC/BGS accepts no liability whatever in respect of loss, damage, injury or other occurrence however caused. Sources of information In compiling this volume the British Geological Survey has largely relied upon data originally collected by other bodies. A list of the departments and organisations concerned is given below, together with the titles of principal publications that have been used. In many cases the BGS has also been provided with supplementary or unpublished information. Interested readers are strongly advised to consult the original sources themselves wherever possible and in this connection may wish to refer not only to the publications as listed here, but also earlier issues in the same series, some of which were published under different titles. Information about the production of minerals in the United Kingdom is given from 1853 to 1881 in a series of Geological Survey Memoirs entitled Mineral Statistics, by Robert Hunt, Keeper of Mining Records; earlier information for certain metalliferous minerals is also available. Since 1873 all collieries and metalliferous mines have been required by statute to complete annual returns of production, and since 1895 the same has applied to quarries. These returns were made to the Home Office, which, in 1882, was made responsible for the publication of Mineral Statistics. In 1920 responsibility for collection of returns was transferred to the Mines Department (Board of Trade) and statistics were subsequently published in the Annual Reports of the Secretary of Mines. The Mines Department was incorporated into the Ministry of Fuel and Power in 1942 and statistics from 1938 to 1972 were published in their Statistical Digests (subsequently the Digests of Energy Statistics of the Department of Trade and Industry). In 1973 responsibility for the collection of returns relating to most minerals other than fuels was transferred to the Business Statistics Office (formerly part of the Department of Trade and Industry, now the Office for National Statistics). The Department of Energy and Climate Change, collects statistics relating to hydrocarbons (natural gas and crude petroleum). Statistics on coal production are now collected by The Coal Authority. Returns of sand and gravel were collected by the Department of the Environment up to 1974. Details of mineral production in Northern Ireland since 1922 have been obtained by the Northern Ireland Government. 1853–1881 Mineral Statistics, by Robert Hunt, Keeper of Mining Records; Memoirs of the Geological Survey 1882–1896 Mineral Statistics; Home Office 1897–1919 Mines and Quarries: General Report with Statistics; Home Office 1920 Mines and Quarries: General Report with Statistics; Mines Department, Board of Trade 1921–1938 Annual Report of the Secretary of Mines; Mines Department, Board of Trade (Great Britain only from 1922) 1938–1972 Statistical Digest; Ministry of Fuel and Power (Great Britain only) 1973–2009 Digest of United Kingdom Energy Statistics; Department of Energy and climate change (formerly published by
Department for Business Enterprise and Regulatory Reform, Department of Trade and Industry or Department of Energy) 1973–1993 Minerals (PA1007); Central Statistical Office 1994–2010 Mineral Extraction in Great Britain (PA 1007); Office for National Statistics 1922–1949 Annual Report of the Mining and Quarrying industries in Northern Ireland; Ministry of Commerce (Northern
Ireland) 1950–1981 Mineral Production in Northern Ireland; Department of Commerce (Northern Ireland) 1982–1995 Mineral Production in Northern Ireland; Department of Economic Development (Northern Ireland) 1996–1998 Annual Minerals Statement; Department of Economic Development (Northern Ireland) 1999–2010 Annual Mineral Statement; Department of Enterprise, Trade and Investment (Northern Ireland) Department of Energy and Climate Change: Digest of United Kingdom Energy Statistics (annual) Department for Business, Innovation and Skills: Monthly Statistics of Building Materials and Components, BIS website for construction information Office for National Statistics, UK Statistics Authority, Website: www.statisticsauthority.gov.uk or www.statistics.gov.uk, Monthly Digest of Statistics, Mineral Extraction in Great Britain (annual), United Kingdom National Accounts HM Customs and Excise: Overseas Trade Statistics (monthly, quarterly and annual), Guide to the Classification for Overseas Trade Statistics Crown Estate Commissioners, The Crown Mineral Agent

6
Department of Enterprise, Trade & Investment (Northern Ireland), Annual Mineral Statement Department of Economic Development (Isle of Man) Advisory and Finance Committee (Guernsey) UK Iron and Steel Statistics Bureau, Annual Statistics World Bureau of Metal Statistics, World Metal Statistics (monthly) International Fertilizer Industry Association The Kaolin and Ball Clay Association Mineral Products Association (MPA), formerly the Quarry Products Association (QPA) The Coal Authority

Trade in minerals and mineral-based products compared with total trade 2004–2010£ million
SITC section 2004 2005 2006 2007 2008 2009 2010
Imports (c.i.f.)0, 1 Food, beverages, tobacco 21 763.3 23 291.4 24 685.3 26 351.5 30 570.8 31 840.9 33 415.92, 4 Basic materials 6 968.6 7 366.7 8 497.5 10 115.7 11 411.2 8 096.0 10 731.6
of which: Minerals 2 233.4 2 619.9 3 420.9 4 559.3 5 498.4 2 932.5 4 719.33 Fuels and related materials 16 209.1 23 535.0 29 531.8 29 470.4 44 289.5 31 721.3 40 857.5
of which: Mineral-based 15 862.9 23 092.9 29 098.4 29 231.9 43 906.3 31 461.9 40 531.9Manufactured goods:
5, 6 Semi-manufactures 62 171.0 64 754.7 71 723.1 76 718.3 81 638.4 76 663.1 90 246.6of which: Mineral-based 25 272.4 27 017.6 31 348.9 39 877.0 35 062.3 31 135.8 38 973.1
7, 8 Finished manufactures 144 032.6 151 715.1 166 367.3 166 661.7 171 678.0 157 080.1 183 328.19 Other (a) 3 884.1 1 847.1 24 977.9 3 600.3 5 286.0 5 025.7 3 578.3
of which: Mineral-based 2 334.1 221.3 230.5 348.3 490.8 413.8 979.7
Total 255 028.6 272 510.0 325 783.0 312 917.9 344 874.0 310 427.1 362 157.9
All traded goodsof which: Mineral-based 45 702.8 52 951.7 64 098.7 74 016.4 84 957.8 65 944.1 85 204.0As % of all traded goods 17.9 19.4 19.7 23.7 24.6 21.2 23.5
Exports (f.o.b.)0, 1 Food, beverages, tobacco 10 615.2 10 690.2 11 080.1 11 752.6 13 670.8 14 398.2 16 027.42, 4 Basic materials 3 759.6 3 982.7 4 906.1 5 473.8 6 558.5 5 160.0 7 288.5
of which: Minerals 2 064.2 2 186.1 2 893.7 3 372.5 4 141.9 2 998.0 4 556.13 Fuels and related materials 16 795.5 20 131.0 23 976.1 23 147.4 33 595.7 25 399.7 33 416.3
of which: Mineral-based 16 644.7 20 030.0 23 872.3 23 035.7 33 485.2 25 239.0 33 212.1Manufactured goods:
5, 6 Semi-manufactures 56 528.5 60 079.2 65 327.6 68 344.9 76 148.4 71 385.9 79 884.7of which: Mineral-based 22 932.3 25 962.2 28 775.7 30 464.8 33 924.9 27 555.7 33 361.0
7, 8 Finished manufactures 102 050.3 115 724.9 137 485.6 110 304.8 117 063.9 106 773.0 123 510.29 Other (a) 1 605.3 1 910.6 1 599.6 2 157.8 2 717.2 3 669.7 4 526.5
of which: Mineral-based 826.1 878.6 378.1 923.9 863.7 1 555.8 2 177.7
Total 191 354.4 212 518.6 244 375.2 221 069.6 249 644.0 226 625.7 264 449.4
All traded goodsof which: Mineral-based 42 467.4 49 056.9 55 919.7 57 796.9 72 415.7 57 348.5 73 306.9As % of all traded goods 22.2 23.1 22.9 26.1 29.0 25.3 27.7
(a) Including non-monetary gold.
7
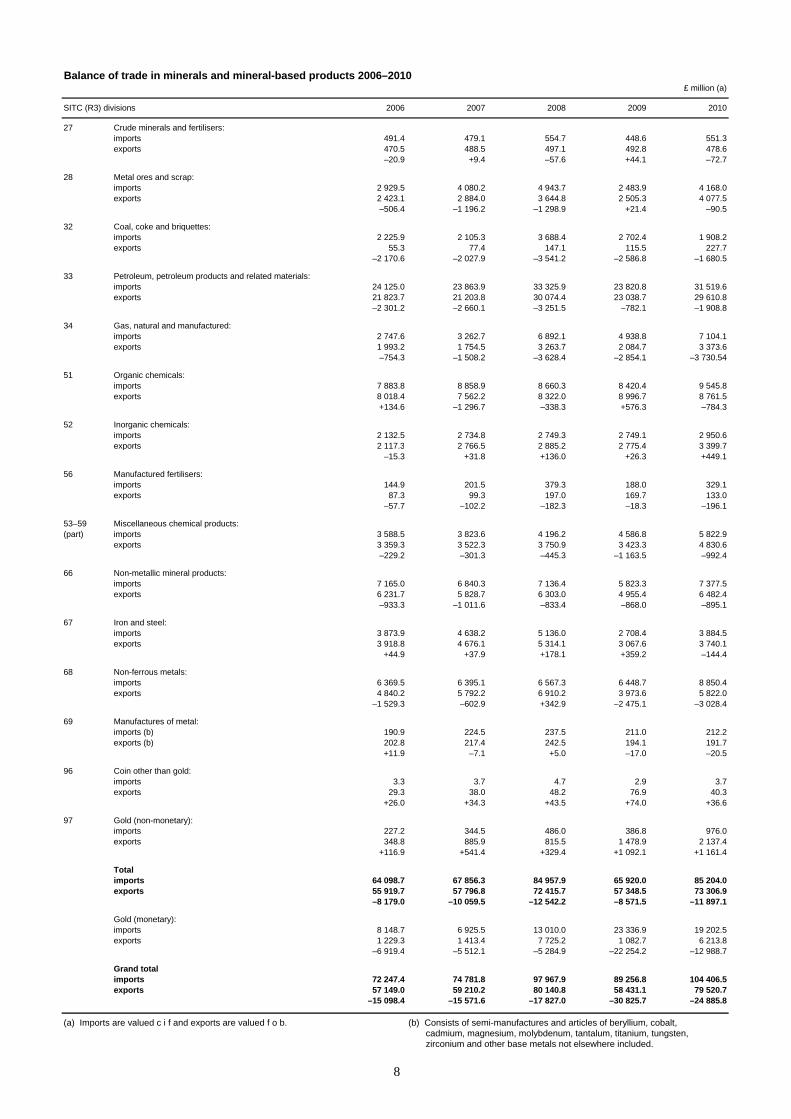
Balance of trade in minerals and mineral-based products 2006–2010£ million (a)
SITC (R3) divisions 2006 2007 2008 2009 2010
27 Crude minerals and fertilisers:imports 491.4 479.1 554.7 448.6 551.3exports 470.5 488.5 497.1 492.8 478.6
–20.9 +9.4 –57.6 +44.1 –72.7
28 Metal ores and scrap:imports 2 929.5 4 080.2 4 943.7 2 483.9 4 168.0exports 2 423.1 2 884.0 3 644.8 2 505.3 4 077.5
–506.4 –1 196.2 –1 298.9 +21.4 –90.5
32 Coal, coke and briquettes:imports 2 225.9 2 105.3 3 688.4 2 702.4 1 908.2exports 55.3 77.4 147.1 115.5 227.7
–2 170.6 –2 027.9 –3 541.2 –2 586.8 –1 680.5
33 Petroleum, petroleum products and related materials:imports 24 125.0 23 863.9 33 325.9 23 820.8 31 519.6exports 21 823.7 21 203.8 30 074.4 23 038.7 29 610.8
–2 301.2 –2 660.1 –3 251.5 –782.1 –1 908.8
34 Gas, natural and manufactured:imports 2 747.6 3 262.7 6 892.1 4 938.8 7 104.1exports 1 993.2 1 754.5 3 263.7 2 084.7 3 373.6
–754.3 –1 508.2 –3 628.4 –2 854.1 –3 730.54
51 Organic chemicals:imports 7 883.8 8 858.9 8 660.3 8 420.4 9 545.8exports 8 018.4 7 562.2 8 322.0 8 996.7 8 761.5
+134.6 –1 296.7 –338.3 +576.3 –784.3
52 Inorganic chemicals:imports 2 132.5 2 734.8 2 749.3 2 749.1 2 950.6exports 2 117 3 2 766 5 2 885 2 2 775 4 3 399 7exports 2 117.3 2 766.5 2 885.2 2 775.4 3 399.7
–15.3 +31.8 +136.0 +26.3 +449.1
56 Manufactured fertilisers:imports 144.9 201.5 379.3 188.0 329.1exports 87.3 99.3 197.0 169.7 133.0
–57.7 –102.2 –182.3 –18.3 –196.1
53–59 Miscellaneous chemical products:(part) imports 3 588.5 3 823.6 4 196.2 4 586.8 5 822.9
exports 3 359.3 3 522.3 3 750.9 3 423.3 4 830.6–229.2 –301.3 –445.3 –1 163.5 –992.4
66 Non metallic mineral products:66 Non-metallic mineral products:imports 7 165.0 6 840.3 7 136.4 5 823.3 7 377.5exports 6 231.7 5 828.7 6 303.0 4 955.4 6 482.4
–933.3 –1 011.6 –833.4 –868.0 –895.1
67 Iron and steel:imports 3 873.9 4 638.2 5 136.0 2 708.4 3 884.5exports 3 918.8 4 676.1 5 314.1 3 067.6 3 740.1
+44.9 +37.9 +178.1 +359.2 –144.4
68 Non-ferrous metals:imports 6 369.5 6 395.1 6 567.3 6 448.7 8 850.4exports 4 840.2 5 792.2 6 910.2 3 973.6 5 822.0
–1 529.3 –602.9 +342.9 –2 475.1 –3 028.4
69 Manufactures of metal:imports (b) 190.9 224.5 237.5 211.0 212.2exports (b) 202.8 217.4 242.5 194.1 191.7
+11.9 –7.1 +5.0 –17.0 –20.5
96 Coin other than gold:imports 3.3 3.7 4.7 2.9 3.7exports 29.3 38.0 48.2 76.9 40.3
+26.0 +34.3 +43.5 +74.0 +36.6
97 Gold (non-monetary):imports 227.2 344.5 486.0 386.8 976.0exports 348.8 885.9 815.5 1 478.9 2 137.4
+116.9 +541.4 +329.4 +1 092.1 +1 161.4
Totalimports 64 098.7 67 856.3 84 957.9 65 920.0 85 204.0exports 55 919.7 57 796.8 72 415.7 57 348.5 73 306.9
–8 179.0 –10 059.5 –12 542.2 –8 571.5 –11 897.1
Gold (monetary):imports 8 148.7 6 925.5 13 010.0 23 336.9 19 202.5exports 1 229.3 1 413.4 7 725.2 1 082.7 6 213.8
–6 919 4 –5 512 1 –5 284 9 –22 254 2 –12 988 76 919.4 5 512.1 5 284.9 22 254.2 12 988.7
Grand totalimports 72 247.4 74 781.8 97 967.9 89 256.8 104 406.5exports 57 149.0 59 210.2 80 140.8 58 431.1 79 520.7
–15 098.4 –15 571.6 –17 827.0 –30 825.7 –24 885.8
(a) Imports are valued c i f and exports are valued f o b. (b) Consists of semi-manufactures and articles of beryllium, cobalt, cadmium, magnesium, molybdenum, tantalum, titanium, tungsten, zirconium and other base metals not elsewhere included.
8

9
Oil
Natural gas
Coal
Construction and industrial minerals
Value of United Kingdom production 2010 (total value £34 373 million)
Limestone and dolomite
Chalk
Sand and gravel
SandstoneSilica sand
Clay and shaleChina clay
Ball clay
Potash
Salt
Gypsum and anhydrite
Miscellaneousminerals
Igneous rock
Value of United Kingdom construction and industrial minerals production 2010 (total value £2671 million)

Approximate value (a) of minerals produced in the United Kingdom 2003–2010£ million
Mineral 2003 2004 2005 2006 2007 2008 2009 2010
Coal 794 800 722 705 708 1 154 973 1 002Natural gas 7 554 7 115 8 902 11 741 9 377 10 612 7 570 7 590Natural gas liquids 1 105 1 037 1 684 1 910 1 749 2 204 … (b) … (b)Crude petroleum 13 365 13 424 16 656 17 935 18 979 25 102 19 075 23 110
Iron ore 0 0 0 0 0 0 0 0Tin — — — — — — — —Gold — — — — 1 3 4 3Other non-ferrous metals 0 0 0 0 0 0 0 0
Sand and gravel 719 722 746 818 811 814 640 630Limestone and dolomite 685 756 687 756 686 777 518 709Igneous rock 366 396 335 374 392 426 336 320Sandstone 133 157 146 143 135 120 106 116Chalk 88 112 112 101 117 93 43 56
Common clay and shale 24 25 27 27 26 19 13 17China clay 168 195 107 64 58 45 33 25Ball clay 43 46 51 81 82 82 80 80Fuller’s earth 4 3 1 — — — — —
Salt 192 217 222 195 285 186 405 530Silica sand 56 67 58 72 69 67 53 57Potash 83 68 72 64 60 61 54 63Fluorspar 6 5 5 7 7 5 3 4Gypsum and anhydrite 17 19 17 19 19 19 19 19
Miscellaneous minerals 39 39 44 49 49 46 48 42
Total 25 441 25 203 30 594 35 061 33 610 41 835 29 973 34 373
At 2006 constant prices
Coal 856 841 744 705 687 1 089 906 933Oil and gas 23 733 22 688 28 085 31 586 29 228 35 772 24 809 28 585Oil and gas 23 733 22 688 28 085 31 586 29 228 35 772 24 809 28 585Metals 0 0 0 0 1 3 4 3Construction and industrial 2 827 2 973 2 711 2 770 2 715 2 604 2 189 2 484 minerals
Total 27 415 26 502 31 540 35 061 32 631 39 467 27 908 32 005
(a) Calculated on an ex-works sales basis. Source: British Geological Survey.(b) Included in gas and petroleum figures.
United Kingdom approximate value of minerals produced onshore and offshore 2003–2010£ million
2003 2004 2005 2006 2007 2008 2009 2010
Onshore 3 519 3 787 3 574 3 673 3 687 3 751 3 174 3 523Offshore 21 839 21 416 27 019 31 387 29 923 38 084 26 798 30 852
Total 25 441 25 203 30 594 35 060 33 610 41 835 29 972 34 375
Source: British Geological Survey.
10

United Kingdom mining and quarrying: Gross value added (a) 2004–2011£ million
2004 2005 2006 2007 2008 2009 2010 2011
Production
Mining and quarrying Mining and quarrying of energy producing materials Mining of coal and lignite 299 270 293 326 307 254 188 245 Extraction of crude petroleum and natural gas 16 219 19 623 22 613 23 417 27 771 19 058 24 044 26 817 Other mining and quarrying 3 302 3 112 3648 3 573 4 390 3 996 4 280 4 583
Total mining and quarrying 19 820 23 005 26 554 27 316 32 468 23 308 28 512 31 645
All industries 1 070 951 1 116 648 1 183 704 1 251 704 1 295 663 1 256 932 … …of which: minerals related (%) 2 2 2 2 3 2 … …
(a) At current basic prices. Source: Office for National Statistics.
United Kingdom employment in the minerals industry, 2009 and 2010Number
Northern Ireland
Northern Ireland
Mineral Mines (d) Quarries Total Mines (d) Quarries Total
Ball clay — … … — — … … —Chalk — 214 214 (b)… — 183 183 (b)…Chert and flint — … … — — … … —China clay — … … — — … … —Clay and shale — 332 332 (b)… — 255 255 (b)…Coal 3 931 2 229 6 097 — 3 752 2 539 6 140 —
2009 2010
Great Britain (a) Great Britain (a)
Coal 3 931 2 229 6 097 3 752 2 539 6 140Dolomite — 301 301 — — 348 348 —Fireclay … … 6 (b)… … 8 8 (b)…Gypsum and anhydrite … … … — … … … —Igneous rock — 1 447 1 447 393 — 1 790 1 790 284Limestone — 2 419 2 419 150 — 2 270 2 270 178Oil and gas — — (c) — — — (c) —Peat — 147 147 — — 219 219 —Potash … … … — … … … —Salt … … … (b)… … … … (b)…Sand and gravel — 2 503 2 503 338 — 2 629 2 629 179Sandstone — 1 102 1 102 223 — 1 081 1 081 184Silica sand — 83 83 — — 206 206 —Silica stone … … … — … … … —Slate … … … — … … … —Soapstone and talc … … … — … … … —Others … … 1 777 176 … … 1 736 172
… … … 1 280 … … … 997
(a) Where more than one mineral is extracted at a mine or quarry all (d) Including surface and underground workers at mines. employment is attributed to the chief mineral.(b) Included with ‘Others’. Sources: Office for National Statistics, Department of Enterprise (c) Oil and Gas UK estimates the workforce employed Trade and Investment (Northern Ireland), The Coal Authority, on the UK Continental Shelf at 350 000, of which 34 000 Department for Business Innovation and Skills. are directly employed by exploration and production companies.
11

United Kingdom production of minerals 2005–2011Thousand tonnes
Mineral 2005 2006 2007 2008 2009 2010 2011
(Estimated)
Coal:
Deep-mined 9 563 9 444 7 674 8 096 7 520 7 390 7 312
Opencast 10 445 8 635 8 866 9 509 9 854 10 426 10 580
Other (a) 490 438 467 449 500 600 600
Natural gas and oil:
Methane (oil equivalent)
Colliery 65 65 62 63 67 63 60
Onshore 151 91 105 92 89 88
Offshore 88 003 79 856 71 957 69 525 59 581 57 036
Crude oil
Onshore 1 648 1 379 1 271 1 248 1 181 941
Offshore 75 530 68 287 69 086 64 249 61 639 57 106
Condensates and other (c)
Onshore 49 41 38 33 32 17
Off h 7 494 6 872 6 180 6 135 5 346 4 898
55 000
58 000
5 000 Offshore 7 494 6 872 6 180 6 135 5 346 4 898
Iron ore 0.4 0.4 0.3 0.1 — — —
Non-ferrous ores (metal content):
Tin — — — — — — —
Lead (h) 0.4 0.4 0.3 0.3 0.3 0.3 0.3
Zinc — — — — — — —
Gold (kg) … … 88 163 187 177 180
Silver (kg) — — 212 398 514 506 500
Chalk (e) 7 105 7 376 7 566 5 874 4 047 3 626 3 500Chalk (e) 7 105 7 376 7 566 5 874 4 047 3 626 3 500
Clay and shale (e) 10 898 10 432 10 104 8 459 5 310 5 934 5 483
Igneous rock (j) (k) 53 104 53 954 58 909 53 489 44 618 44 876 45 000
Limestone (excluding dolomite) 77 596 80 228 83 491 74 143 60 110 60 207
Dolomite (excluding limestone) 11 514 12 101 7 622 5 509 3 164 4 540
Sand and gravel:
Land 75 171 71 418 72 810 66 638 50 973 47 167
Marine (i) 19 495 20 689 20 426 18 833 15 253 14 533
Sandstone 18 685 18 038 16 806 12 255 12 335 11 556 11 500
Slate (g) 928 865 1 428 1 058 683 695 700
65 000
62 000
Ball clay (sales) 1 011 1 015 1 022 1 020 727 1 000 1 000
Barytes 64 48 53 43 36 34 31
Calcspar — — — — — — —
Chert and flint 2 2 1 1 1 1 1
China clay (sales) (d) 1 911 1 762 1 671 1 355 1 060 (h) 1 000 1 000
China stone 2 1 1 0.5 0.5 0.5 0.5
Fireclay (e) 395 228 338 180 129 110 100
Fluorspar (h) 56 50 45 37 19 26 —
Fuller’s earth (sales) (d) (f) 6 — — — — — —
Gypsum (natural) (h) 1 700 1 700 1 700 1 700 1 700 1 700 1 700yp ( ) ( )
Lignite … … … … … … …Peat (000 m3) 1 505 1 593 885 760 887 1 004 1 000
Potash (b) 732 716 712 673 700 700 770
Salt 6 074 5 499 5 600 5 565 6 166 6 666 7 000
Silica sand 4 146 5 174 4 909 4 777 3 755 4 070 4 000
Talc 6 4 3 2 3 3 4
(a) Slurry etc. recovered from dumps, ponds, rivers etc. (k) In addition, the following amounts of igneous rock were produced in
(b) Marketable product (KCl). Guernsey (thousand tonnes): 2005: 129; 2006: 136; 2007: 160; 2008: 139;
(c) Including ethane propane and butane in addition to condensates 2009: 120; 2010: 116; 2011: 156 and Jersey: 2005: 305; 2006: 286; 2007: 295;(c) Including ethane, propane and butane, in addition to condensates. 2009: 120; 2010: 116; 2011: 156 and Jersey: 2005: 305; 2006: 286; 2007: 295;
(d) Dry weight. 2008: 325; 2009: 279; 2010: 253; 2011: 215.
(e) Excluding a small production in Northern Ireland.
(f) BGS estimates based on data from producing companies.
(g) Slate figures include waste used for constructional fill and powder
and granules used in industry. Sources: Office for National Statistics, Department of Business, Innovation
(h) BGS estimate. and Skills, Dept. of Enterprise, Trade & Investment (Northern Ireland),
(i) Including marine-dredged landings at foreign ports (exports); see p.72. Crown Estate Commissioners (marine sand and gravel produced
(j) Excluding a small production of granite in Northern Ireland. for export), and company data.
12
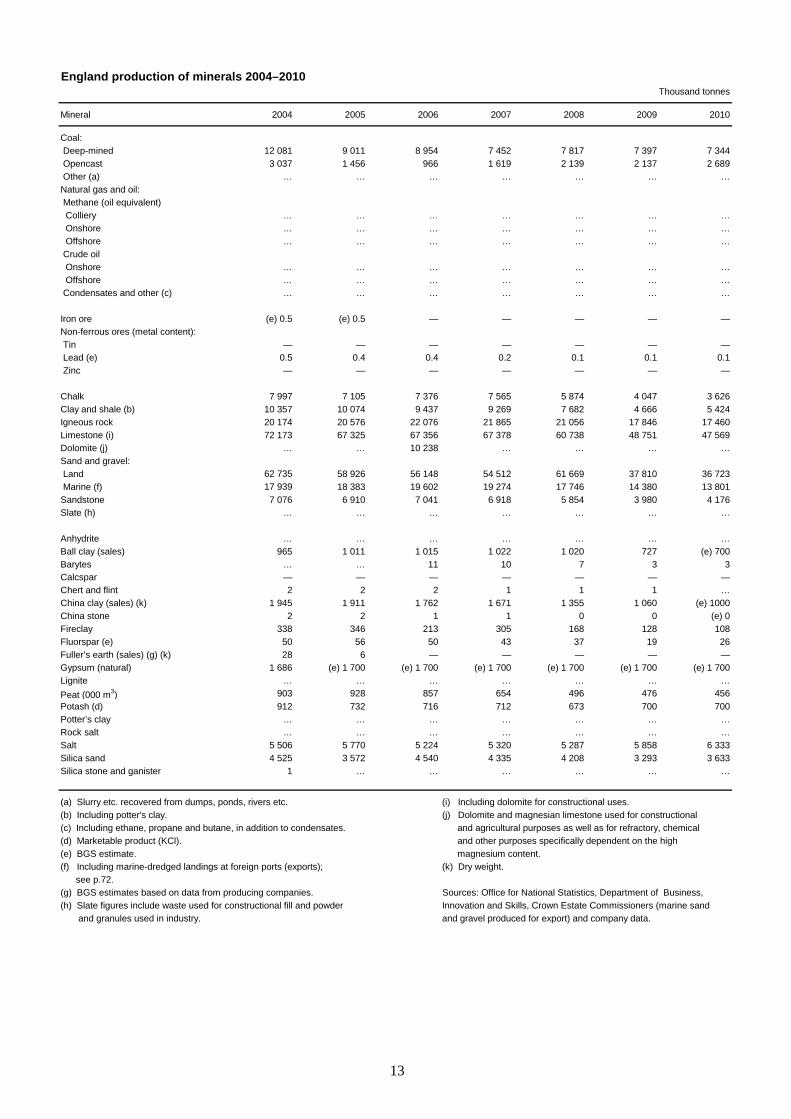
England production of minerals 2004–2010Thousand tonnes
Mineral 2004 2005 2006 2007 2008 2009 2010
Coal:
Deep-mined 12 081 9 011 8 954 7 452 7 817 7 397 7 344
Opencast 3 037 1 456 966 1 619 2 139 2 137 2 689
Other (a) … … … … … … …
Natural gas and oil:
Methane (oil equivalent)
Colliery … … … … … … …
Onshore … … … … … … …
Offshore … … … … … … …
Crude oil
Onshore … … … … … … …
Offshore … … … … … … …
Condensates and other (c) … … … … … … …
Iron ore (e) 0.5 (e) 0.5 — — — — —
Non-ferrous ores (metal content):
Tin — — — — — — —
Lead (e) 0.5 0.4 0.4 0.2 0.1 0.1 0.1
Zinc — — — — — — —
Chalk 7 997 7 105 7 376 7 565 5 874 4 047 3 626
Clay and shale (b) 10 357 10 074 9 437 9 269 7 682 4 666 5 424
Igneous rock 20 174 20 576 22 076 21 865 21 056 17 846 17 460
Limestone (i) 72 173 67 325 67 356 67 378 60 738 48 751 47 569
Dolomite (j) … … 10 238 … … … …
Sand and gravel:
Land 62 735 58 926 56 148 54 512 61 669 37 810 36 723
Marine (f) 17 939 18 383 19 602 19 274 17 746 14 380 13 801
Sandstone 7 076 6 910 7 041 6 918 5 854 3 980 4 176
Slate (h) … … … … … … …
Anhydrite … … … … … … …
Ball clay (sales) 965 1 011 1 015 1 022 1 020 727 (e) 700
Barytes … … 11 10 7 3 3Calcspar — — — — — — —
Chert and flint 2 2 2 1 1 1 …
China clay (sales) (k) 1 945 1 911 1 762 1 671 1 355 1 060 (e) 1000
China stone 2 2 1 1 0 0 (e) 0
Fireclay 338 346 213 305 168 128 108
Fluorspar (e) 50 56 50 43 37 19 26
Fuller’s earth (sales) (g) (k) 28 6 — — — — —
Gypsum (natural) 1 686 (e) 1 700 (e) 1 700 (e) 1 700 (e) 1 700 (e) 1 700 (e) 1 700
Lignite … … … … … … …
Peat (000 m3) 903 928 857 654 496 476 456
Potash (d) 912 732 716 712 673 700 700
Potter’s clay … … … … … … …
Rock salt … … … … … … …
Salt 5 506 5 770 5 224 5 320 5 287 5 858 6 333
Silica sand 4 525 3 572 4 540 4 335 4 208 3 293 3 633
Silica stone and ganister 1 … … … … … …
(a) Slurry etc. recovered from dumps, ponds, rivers etc. (i) Including dolomite for constructional uses.
(b) Including potter's clay. (j) Dolomite and magnesian limestone used for constructional
(c) Including ethane, propane and butane, in addition to condensates. and agricultural purposes as well as for refractory, chemical
(d) Marketable product (KCl). and other purposes specifically dependent on the high
(e) BGS estimate. magnesium content.
(f) Including marine-dredged landings at foreign ports (exports); (k) Dry weight.
see p.72.
(g) BGS estimates based on data from producing companies. Sources: Office for National Statistics, Department of Business,
(h) Slate figures include waste used for constructional fill and powder Innovation and Skills, Crown Estate Commissioners (marine sand
and granules used in industry. and gravel produced for export) and company data.
13
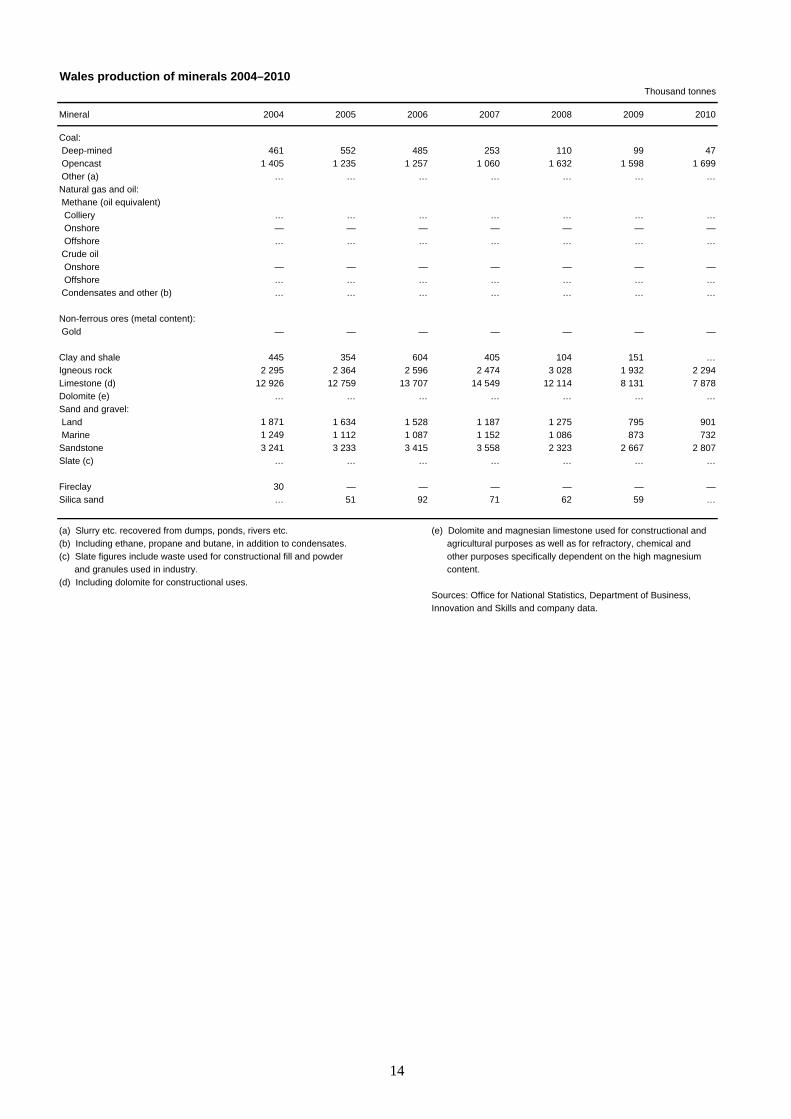
Wales production of minerals 2004–2010Thousand tonnes
Mineral 2004 2005 2006 2007 2008 2009 2010
Coal:
Deep-mined 461 552 485 253 110 99 47
Opencast 1 405 1 235 1 257 1 060 1 632 1 598 1 699
Other (a) … … … … … … …
Natural gas and oil:
Methane (oil equivalent)
Colliery … … … … … … …
Onshore — — — — — — —
Offshore … … … … … … …
Crude oil
Onshore — — — — — — —
Offshore … … … … … … …
Condensates and other (b) … … … … … … …
Non-ferrous ores (metal content):
Gold — — — — — — —
Clay and shale 445 354 604 405 104 151 …
Igneous rock 2 295 2 364 2 596 2 474 3 028 1 932 2 294
Limestone (d) 12 926 12 759 13 707 14 549 12 114 8 131 7 878
Dolomite (e) … … … … … … …
Sand and gravel:
Land 1 871 1 634 1 528 1 187 1 275 795 901
Marine 1 249 1 112 1 087 1 152 1 086 873 732
Sandstone 3 241 3 233 3 415 3 558 2 323 2 667 2 807
Slate (c) … … … … … … …
Fireclay 30 — — — — — —
Silica sand … 51 92 71 62 59 …
(a) Slurry etc. recovered from dumps, ponds, rivers etc. (e) Dolomite and magnesian limestone used for constructional and
(b) Including ethane, propane and butane, in addition to condensates. agricultural purposes as well as for refractory, chemical and
(c) Slate figures include waste used for constructional fill and powder other purposes specifically dependent on the high magnesium
and granules used in industry. content.
(d) Including dolomite for constructional uses.
Sources: Office for National Statistics, Department of Business,
Innovation and Skills and company data.
14
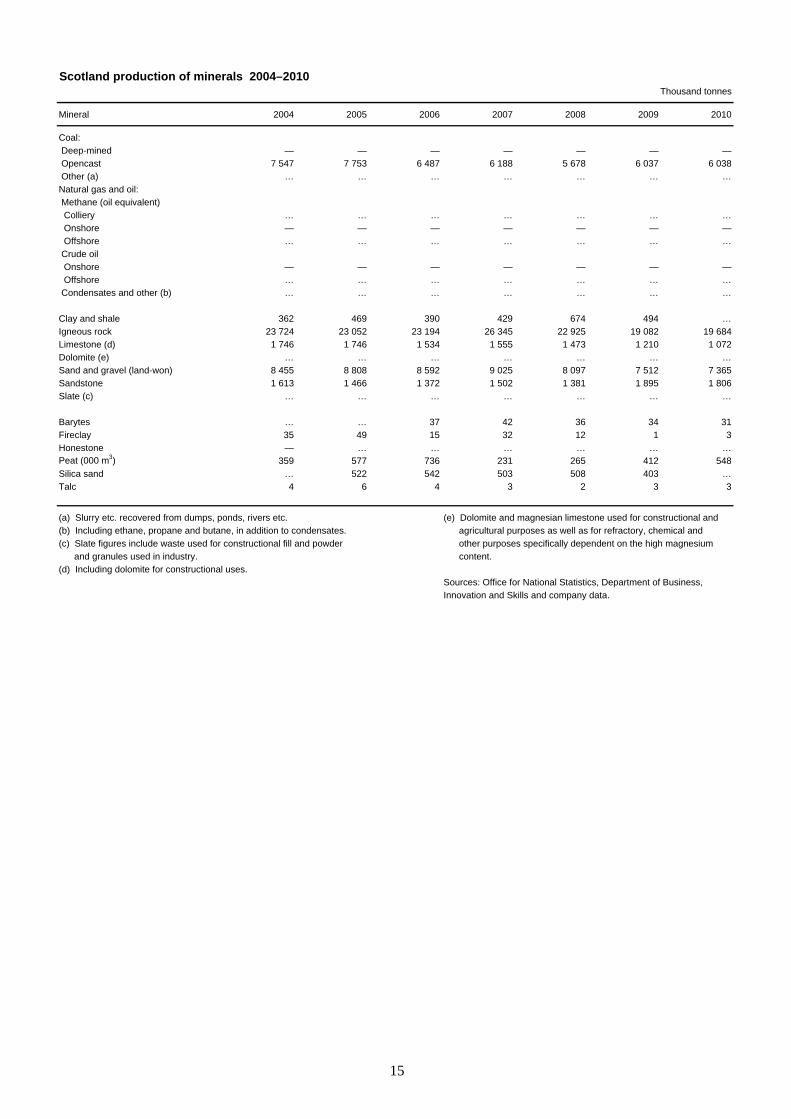
Scotland production of minerals 2004–2010Thousand tonnes
Mineral 2004 2005 2006 2007 2008 2009 2010
Coal:
Deep-mined — — — — — — —
Opencast 7 547 7 753 6 487 6 188 5 678 6 037 6 038
Other (a) … … … … … … …
Natural gas and oil:
Methane (oil equivalent)
Colliery … … … … … … …
Onshore — — — — — — —
Offshore … … … … … … …
Crude oil
Onshore — — — — — — —
Offshore … … … … … … …
Condensates and other (b) … … … … … … …
Clay and shale 362 469 390 429 674 494 …
Igneous rock 23 724 23 052 23 194 26 345 22 925 19 082 19 684
Limestone (d) 1 746 1 746 1 534 1 555 1 473 1 210 1 072
Dolomite (e) … … … … … … …
Sand and gravel (land-won) 8 455 8 808 8 592 9 025 8 097 7 512 7 365
Sandstone 1 613 1 466 1 372 1 502 1 381 1 895 1 806
Slate (c) … … … … … … …
Barytes … … 37 42 36 34 31
Fireclay 35 49 15 32 12 1 3
Honestone — … … … … … …Peat (000 m3) 359 577 736 231 265 412 548
Silica sand … 522 542 503 508 403 …
Talc 4 6 4 3 2 3 3
(a) Slurry etc. recovered from dumps, ponds, rivers etc. (e) Dolomite and magnesian limestone used for constructional and
(b) Including ethane, propane and butane, in addition to condensates. agricultural purposes as well as for refractory, chemical and
(c) Slate figures include waste used for constructional fill and powder other purposes specifically dependent on the high magnesium
and granules used in industry. content.
(d) Including dolomite for constructional uses.
Sources: Office for National Statistics, Department of Business,
Innovation and Skills and company data.
15
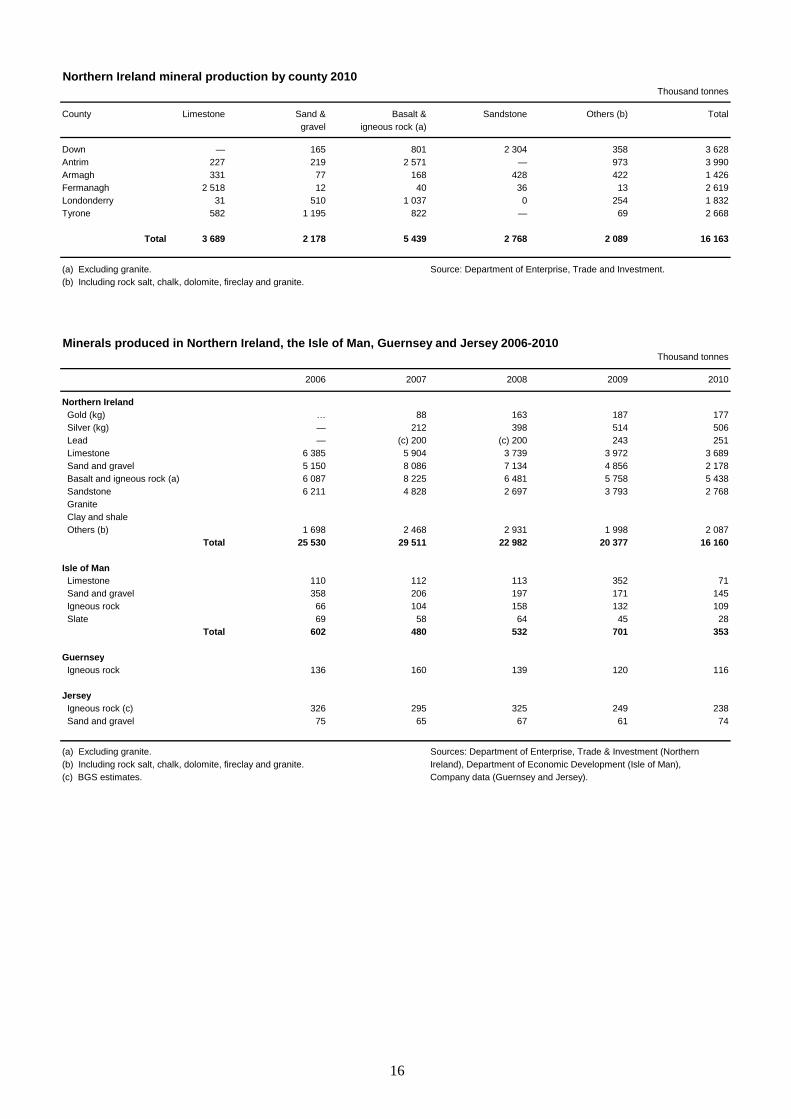
Northern Ireland mineral production by county 2010Thousand tonnes
County Limestone Sand & Basalt & Sandstone Others (b) Totalgravel igneous rock (a)
Down — 165 801 2 304 358 3 628Antrim 227 219 2 571 — 973 3 990Armagh 331 77 168 428 422 1 426Fermanagh 2 518 12 40 36 13 2 619Londonderry 31 510 1 037 0 254 1 832Tyrone 582 1 195 822 — 69 2 668
Total 3 689 2 178 5 439 2 768 2 089 16 163
(a) Excluding granite. Source: Department of Enterprise, Trade and Investment.(b) Including rock salt, chalk, dolomite, fireclay and granite.
Minerals produced in Northern Ireland, the Isle of Man, Guernsey and Jersey 2006-2010Thousand tonnes
2006 2007 2008 2009 2010
Northern Ireland Gold (kg) … 88 163 187 177 Silver (kg) — 212 398 514 506 Lead — (c) 200 (c) 200 243 251 Limestone 6 385 5 904 3 739 3 972 3 689 Sand and gravel 5 150 8 086 7 134 4 856 2 178 Basalt and igneous rock (a) 6 087 8 225 6 481 5 758 5 438 Sandstone 6 211 4 828 2 697 3 793 2 768 Granite Clay and shale Others (b) 1 698 2 468 2 931 1 998 2 087
Total 25 530 29 511 22 982 20 377 16 160
Isle of Man Limestone 110 112 113 352 71 Sand and gravel 358 206 197 171 145 Igneous rock 66 104 158 132 109 Slate 69 58 64 45 28
Total 602 480 532 701 353
Guernsey Igneous rock 136 160 139 120 116
Jersey Igneous rock (c) 326 295 325 249 238 Sand and gravel 75 65 67 61 74
(a) Excluding granite. Sources: Department of Enterprise, Trade & Investment (Northern (b) Including rock salt, chalk, dolomite, fireclay and granite. Ireland), Department of Economic Development (Isle of Man),(c) BGS estimates. Company data (Guernsey and Jersey).
16

Number of mineral workings in the United Kingdom, by commodity (a) (b)Number
CommodityNorth East Yorkshire & North West East West East of Greater South East South West England Wales Scotland Isle of Northern Channel Total
England the Humber England Midlands Midlands England London England England Total Man Ireland Islands
Anhydrite — — — — 1 — — — — 1 — — — — — 1Ball clay — — — — — — — — 18 18 — — — — — 18Barytes — — — 4 — — — — — 4 — 1 — — — 5Calcite — — — 1 — — — — — 1 — — — — — 1Chalk — 17 — 3 — 14 — 19 1 54 — — — 6 — 60Chert — — — — — — — — — 0 1 — — — — 1China clay — — — — — — — — 17 17 — — — — — 17China clay waste — — — — — — — — 13 13 — — — — — 13Clay & shale 5 25 14 19 24 7 — 28 15 137 10 5 — 7 — 159Coal, underground — 4 — 2 1 — — — 1 8 6 — — — — 14Coal, opencast 5 3 1 3 1 — — — — 13 9 24 — — — 46Fireclay — 3 1 1 2 — — — — 7 — 3 — — — 10Flint — 2 — — — 4 — 2 — 8 — — — — — 8Fluorspar 1 1 — 7 — — — — — 9 — — — — — 9Gold — — — — — — — — — 0 — — — 1 — 1Gypsum — — 1 3 1 — — 2 — 7 — — — — — 7Igneous & metamorphic rock 8 — 3 7 4 — — — 18 40 14 114 2 22 3 195Iron ore - ironstone — 2 — — 1 — — 4 — 7 — — — — — 7Lead — — — 3 — — — — — 3 — — — — — 3Limestone / dolomite 19 35 22 53 8 4 — 14 89 244 49 13 2 23 — 331Marble — — — — — — — — — 0 — 1 — — — 1Mine drainage gas — 2 — 1 — — — — — 3 — — — — — 3Natural gas — 10 1 3 — — — 1 1 16 — — — — — 16Oil — — — 22 — — — 22 3 47 — — — — — 47Peat 1 3 9 — — 2 — — 39 54 2 23 — 13 — 92Potash — 1 — — — — — — — 1 — — — — — 1Salt — 1 4 — — 1 1 — 1 8 — — — 6 — 14Sand 6 6 5 2 3 14 2 33 15 86 1 16 — 3 1 107Sand & gravel 12 31 28 43 36 100 27 101 38 416 25 114 3 100 — 658Sandstone 19 54 37 18 22 8 — 6 24 188 27 50 — 6 — 271Silica sand 1 2 5 1 2 15 — 7 1 34 1 6 — — — 41Slate — — 10 — — — — — 8 18 11 — 3 1 — 33Slate waste — — — — — — — — 0 15 — — — — 15Talc — — — — — — — — — 0 — 1 — — — 1Tin — — — — — — — — 2 2 — — — — — 2
Total 77 202 141 196 106 169 30 239 304 1 464 171 371 10 188 4 2 208
(a) As at February 2012. Source: British Geological Survey.(b) Double counting may occur because some workings produce more than one mineral.
Region

18
Abrasives, natural
United Kingdom summary 2006-2010
Commodity 2006 2007 2008 2009 2010 2006 2007 2008 2009 2010 Carats £ thousand
Abrasives
Imports
Natural abrasives
Industrial diamonds 11 884 651 7 524 168 5 127 610 3 321 670 7 299 364 70 193 11 164 12 307 7 623 30 724
Tonnes
Dust and powder of precious and
semi-precious stones 49 49 39 24 27 11 260 10 749 9 352 6 756 11 006
Pumice 97 832 206 353 2 259 1 668 2 062 1 659 2 546 2 013 1 130 1 183
Other 8 106 11 827 13 424 11 748 11 876 1 697 2 532 3 517 2 634 3 012
Carats
Exports
Natural abrasives
Industrial diamonds 13 652 233 4 754 029 6 121 081 4 440 922 2 478 568 18 891 17 485 17 700 13 977 21 248
Tonnes
Dust and powder of precious and
semi-precious stones 16 31 151 27 30 11 288 13 310 12 052 8 315 14 892
Pumice 70 40 76 307 704 227 93 293 534 997
Other 852 1 180 1 339 1 203 1 562 511 612 1 056 1 283 1 890
Aggregates
United Kingdom summary 2006-2010
Commodity 2006 2007 2008 2009 2010 2006 2007 2008 2009 2010 Tonnes £ thousand
Aggregates
Production
Sand and gravel (a) 92 107 000 93 236 000 85 473 000 66 226 000 61 700 000
Crushed rock (b) 145 578 000 148 534 000 127 996 000 104 626 000 94 203 000
Total 237 685 000 241 770 000 213 469 000 170 852 000 155 903 000
Imports
Natural aggregates-
Sand and gravel 634 844 896 715 647 603 444 725 343 749 17 583 18 260 16 043 12 212 10 874
Crushed rock (c) 2 270 355 1 909 733 1 984 383 1 609 546 1 896 201 27 202 27 501 34 449 26 157 30 740
Total 2 905 198 2 806 448 2 631 986 2 054 271 2 239 950 44 785 45 761 50 492 38 369 41 614
Exports
Natural aggregates-
Sand and gravel (d) 9 308 961 8 089 175 7 747 635 6 236 662 6 081 730 45 498 46 624 50 027 48 688 44 819
Crushed rock 5 322 099 5 959 212 5 260 973 4 916 514 4 910 702 25 773 33 637 36 693 36 965 36 490
Total 14 631 060 14 048 387 13 008 608 11 153 176 10 992 432 71 271 80 261 86 720 85 653 81 309
(a) Including production from marine dredging. (d) Principally marine-dredged sand and gravel. (b) Includes small quantities for other purposes in Northern Ireland. Source: HM Revenue and Customs. (c) For a number of years, a significant amount of armourstone However, the Crown Estate Commissioners give the following figures for imports were believed to be wrongly classified as ‘granite, crude’. marine-dredged sand and gravel landed at foreign ports (tonnes): In 2010, this figure was 162 550 tonnes, and this has reduced from 2006: 6 714 659; 2007: 6 649 041; 2008: 6 211 703; 2009: 5 660 522; 1 331 520 tonnes in 2005, suggesting this issue is being addressed. 2010: 5 192 348.

North West
Yorkshire and the Humber
Wales
South West
East Midlands
Scotland
Great Britain production of crushed rock aggregate and sand and gravel by region 2010
Sand and Gravel
Crushed Rock
0 5 10 15 20 25
East of England
South East
West Midlands
North East
North West
Thousand tonnes
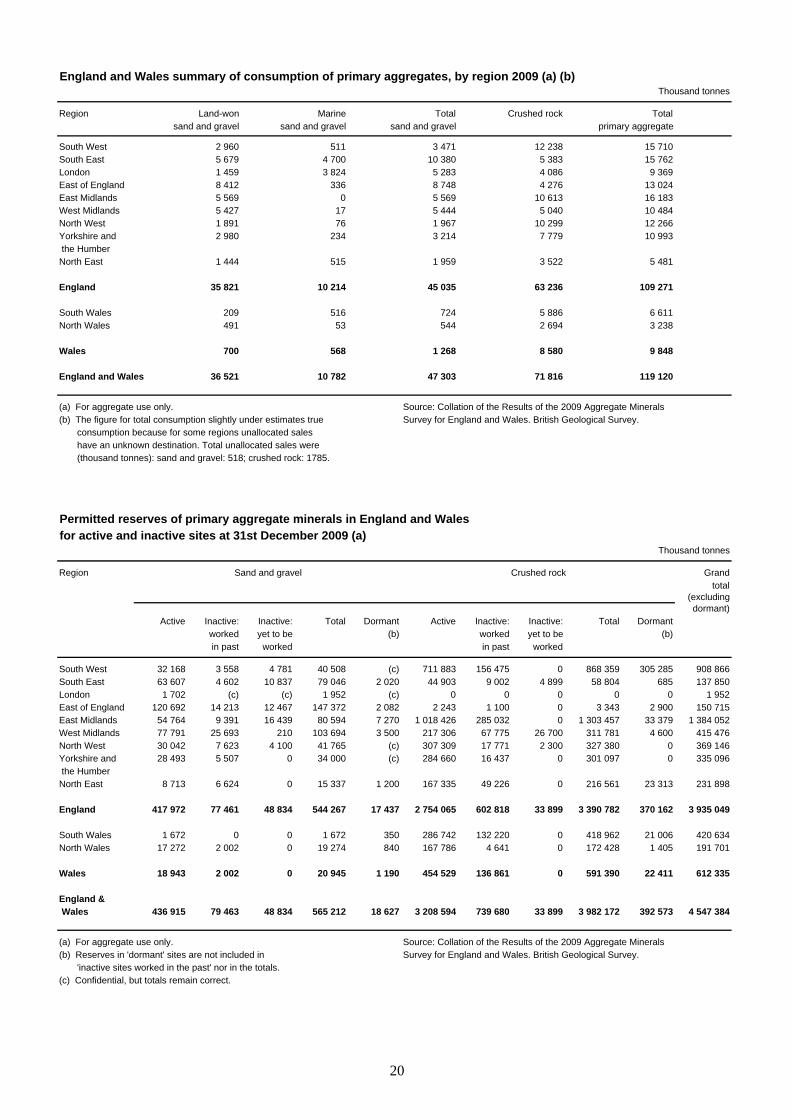
England and Wales summary of consumption of primary aggregates, by region 2009 (a) (b)Thousand tonnes
Region Land-won Marine Total Crushed rock Totalsand and gravel sand and gravel sand and gravel primary aggregate
South West 2 960 511 3 471 12 238 15 710South East 5 679 4 700 10 380 5 383 15 762London 1 459 3 824 5 283 4 086 9 369East of England 8 412 336 8 748 4 276 13 024East Midlands 5 569 0 5 569 10 613 16 183West Midlands 5 427 17 5 444 5 040 10 484North West 1 891 76 1 967 10 299 12 266Yorkshire and 2 980 234 3 214 7 779 10 993 the HumberNorth East 1 444 515 1 959 3 522 5 481
England 35 821 10 214 45 035 63 236 109 271
South Wales 209 516 724 5 886 6 611North Wales 491 53 544 2 694 3 238
Wales 700 568 1 268 8 580 9 848
England and Wales 36 521 10 782 47 303 71 816 119 120
(a) For aggregate use only. Source: Collation of the Results of the 2009 Aggregate Minerals (b) The figure for total consumption slightly under estimates true Survey for England and Wales. British Geological Survey. consumption because for some regions unallocated sales have an unknown destination. Total unallocated sales were (thousand tonnes): sand and gravel: 518; crushed rock: 1785.
Permitted reserves of primary aggregate minerals in England and Walesfor active and inactive sites at 31st December 2009 (a)
Thousand tonnes
Region Grandtotal
(excludingdormant)
Active Inactive: Inactive: Total Dormant Active Inactive: Inactive: Total Dormantworked yet to be (b) worked yet to be (b)in past worked in past worked
South West 32 168 3 558 4 781 40 508 (c) 711 883 156 475 0 868 359 305 285 908 866South East 63 607 4 602 10 837 79 046 2 020 44 903 9 002 4 899 58 804 685 137 850London 1 702 (c) (c) 1 952 (c) 0 0 0 0 0 1 952East of England 120 692 14 213 12 467 147 372 2 082 2 243 1 100 0 3 343 2 900 150 715East Midlands 54 764 9 391 16 439 80 594 7 270 1 018 426 285 032 0 1 303 457 33 379 1 384 052West Midlands 77 791 25 693 210 103 694 3 500 217 306 67 775 26 700 311 781 4 600 415 476North West 30 042 7 623 4 100 41 765 (c) 307 309 17 771 2 300 327 380 0 369 146Yorkshire and 28 493 5 507 0 34 000 (c) 284 660 16 437 0 301 097 0 335 096 the HumberNorth East 8 713 6 624 0 15 337 1 200 167 335 49 226 0 216 561 23 313 231 898 England 417 972 77 461 48 834 544 267 17 437 2 754 065 602 818 33 899 3 390 782 370 162 3 935 049
South Wales 1 672 0 0 1 672 350 286 742 132 220 0 418 962 21 006 420 634North Wales 17 272 2 002 0 19 274 840 167 786 4 641 0 172 428 1 405 191 701
Wales 18 943 2 002 0 20 945 1 190 454 529 136 861 0 591 390 22 411 612 335
England & Wales 436 915 79 463 48 834 565 212 18 627 3 208 594 739 680 33 899 3 982 172 392 573 4 547 384
(a) For aggregate use only. Source: Collation of the Results of the 2009 Aggregate Minerals (b) Reserves in 'dormant' sites are not included in Survey for England and Wales. British Geological Survey. 'inactive sites worked in the past' nor in the totals.(c) Confidential, but totals remain correct.
Sand and gravel Crushed rock
20
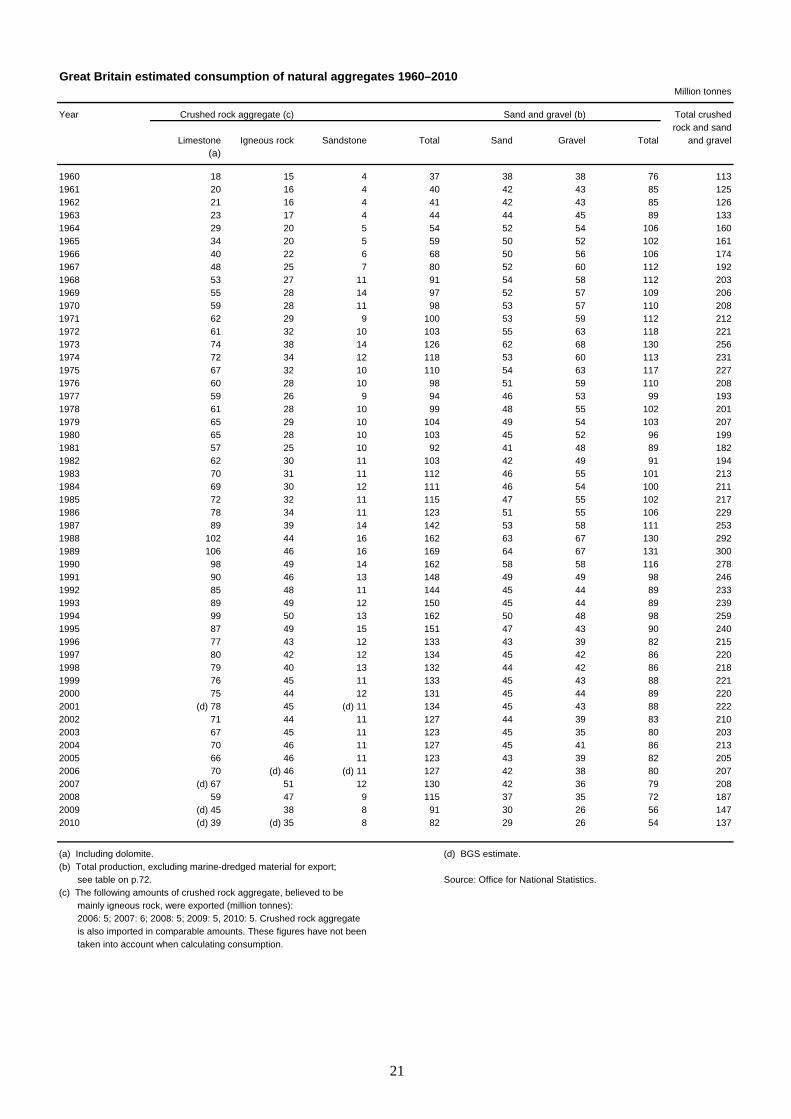
Great Britain estimated consumption of natural aggregates 1960–2010Million tonnes
Year Crushed rock aggregate (c) Sand and gravel (b) Total crushedrock and sand
Limestone Igneous rock Sandstone Total Sand Gravel Total and gravel(a)
1960 18 15 4 37 38 38 76 1131961 20 16 4 40 42 43 85 1251962 21 16 4 41 42 43 85 1261963 23 17 4 44 44 45 89 1331964 29 20 5 54 52 54 106 1601965 34 20 5 59 50 52 102 1611966 40 22 6 68 50 56 106 1741967 48 25 7 80 52 60 112 1921968 53 27 11 91 54 58 112 2031969 55 28 14 97 52 57 109 2061970 59 28 11 98 53 57 110 2081971 62 29 9 100 53 59 112 2121971 62 29 9 100 53 59 112 2121972 61 32 10 103 55 63 118 2211973 74 38 14 126 62 68 130 2561974 72 34 12 118 53 60 113 2311975 67 32 10 110 54 63 117 2271976 60 28 10 98 51 59 110 2081977 59 26 9 94 46 53 99 1931978 61 28 10 99 48 55 102 2011979 65 29 10 104 49 54 103 2071980 65 28 10 103 45 52 96 1991981 57 25 10 92 41 48 89 1821981 57 25 10 92 41 48 89 1821982 62 30 11 103 42 49 91 1941983 70 31 11 112 46 55 101 2131984 69 30 12 111 46 54 100 2111985 72 32 11 115 47 55 102 2171986 78 34 11 123 51 55 106 2291987 89 39 14 142 53 58 111 2531988 102 44 16 162 63 67 130 2921989 106 46 16 169 64 67 131 3001990 98 49 14 162 58 58 116 2781991 90 46 13 148 49 49 98 2461992 85 48 11 144 45 44 89 2331993 89 49 12 150 45 44 89 2391994 99 50 13 162 50 48 98 2591995 87 49 15 151 47 43 90 2401996 77 43 12 133 43 39 82 2151997 80 42 12 134 45 42 86 2201998 79 40 13 132 44 42 86 2181999 76 45 11 133 45 43 88 2212000 75 44 12 131 45 44 89 2202001 (d) 78 45 (d) 11 134 45 43 88 2222002 71 44 11 127 44 39 83 2102003 67 45 11 123 45 35 80 2032004 70 46 11 127 45 41 86 2132005 66 46 11 123 43 39 82 2052006 70 (d) 46 (d) 11 127 42 38 80 2072007 (d) 67 51 12 130 42 36 79 2082008 59 47 9 115 37 35 72 1872009 (d) 45 38 8 91 30 26 56 1472010 (d) 39 (d) 35 8 82 29 26 54 137( ) ( )
(a) Including dolomite. (d) BGS estimate.(b) Total production, excluding marine-dredged material for export; see table on p.72. Source: Office for National Statistics.(c) The following amounts of crushed rock aggregate, believed to be mainly igneous rock, were exported (million tonnes): 2006: 5; 2007: 6; 2008: 5; 2009: 5, 2010: 5. Crushed rock aggregate is also imported in comparable amounts. These figures have not been taken into account when calculating consumption.
21
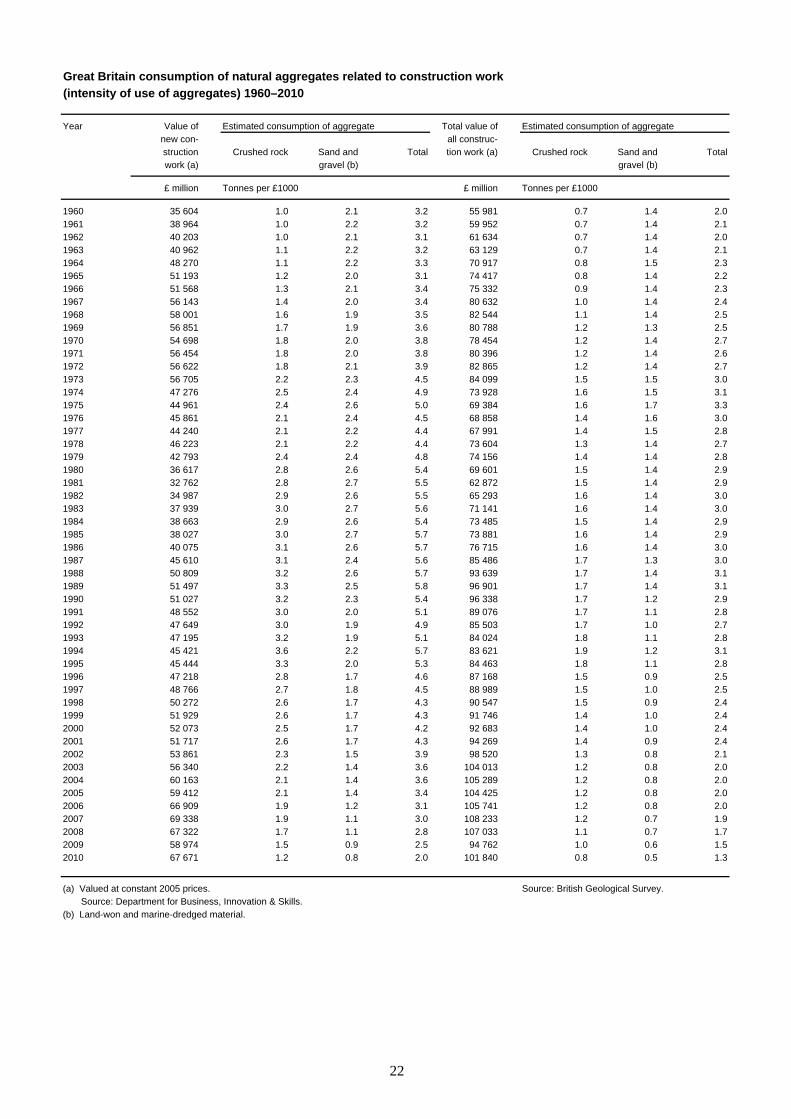
Great Britain consumption of natural aggregates related to construction work
(intensity of use of aggregates) 1960–2010
Year Value of Estimated consumption of aggregate Total value of Estimated consumption of aggregatenew con- all construc-struction Crushed rock Sand and Total tion work (a) Crushed rock Sand and Totalwork (a) gravel (b) gravel (b)
£ million Tonnes per £1000 £ million Tonnes per £1000
1960 35 604 1.0 2.1 3.2 55 981 0.7 1.4 2.01961 38 964 1.0 2.2 3.2 59 952 0.7 1.4 2.11962 40 203 1.0 2.1 3.1 61 634 0.7 1.4 2.01963 40 962 1.1 2.2 3.2 63 129 0.7 1.4 2.11964 48 270 1.1 2.2 3.3 70 917 0.8 1.5 2.31965 51 193 1.2 2.0 3.1 74 417 0.8 1.4 2.21966 51 568 1.3 2.1 3.4 75 332 0.9 1.4 2.31967 56 143 1.4 2.0 3.4 80 632 1.0 1.4 2.41968 58 001 1.6 1.9 3.5 82 544 1.1 1.4 2.51969 56 851 1.7 1.9 3.6 80 788 1.2 1.3 2.51970 54 698 1.8 2.0 3.8 78 454 1.2 1.4 2.71971 56 454 1.8 2.0 3.8 80 396 1.2 1.4 2.61972 56 622 1.8 2.1 3.9 82 865 1.2 1.4 2.71973 56 705 2.2 2.3 4.5 84 099 1.5 1.5 3.01974 47 276 2.5 2.4 4.9 73 928 1.6 1.5 3.11975 44 961 2.4 2.6 5.0 69 384 1.6 1.7 3.31976 45 861 2.1 2.4 4.5 68 858 1.4 1.6 3.01977 44 240 2.1 2.2 4.4 67 991 1.4 1.5 2.81978 46 223 2.1 2.2 4.4 73 604 1.3 1.4 2.71979 42 793 2.4 2.4 4.8 74 156 1.4 1.4 2.81980 36 617 2.8 2.6 5.4 69 601 1.5 1.4 2.91981 32 762 2.8 2.7 5.5 62 872 1.5 1.4 2.91982 34 987 2.9 2.6 5.5 65 293 1.6 1.4 3.01983 37 939 3.0 2.7 5.6 71 141 1.6 1.4 3.01984 38 663 2.9 2.6 5.4 73 485 1.5 1.4 2.91985 38 027 3.0 2.7 5.7 73 881 1.6 1.4 2.91986 40 075 3.1 2.6 5.7 76 715 1.6 1.4 3.01987 45 610 3.1 2.4 5.6 85 486 1.7 1.3 3.01988 50 809 3.2 2.6 5.7 93 639 1.7 1.4 3.11989 51 497 3.3 2.5 5.8 96 901 1.7 1.4 3.11990 51 027 3.2 2.3 5.4 96 338 1.7 1.2 2.91991 48 552 3.0 2.0 5.1 89 076 1.7 1.1 2.81992 47 649 3.0 1.9 4.9 85 503 1.7 1.0 2.71993 47 195 3.2 1.9 5.1 84 024 1.8 1.1 2.81994 45 421 3.6 2.2 5.7 83 621 1.9 1.2 3.11995 45 444 3.3 2.0 5.3 84 463 1.8 1.1 2.81996 47 218 2.8 1.7 4.6 87 168 1.5 0.9 2.51997 48 766 2.7 1.8 4.5 88 989 1.5 1.0 2.51998 50 272 2.6 1.7 4.3 90 547 1.5 0.9 2.41999 51 929 2.6 1.7 4.3 91 746 1.4 1.0 2.42000 52 073 2.5 1.7 4.2 92 683 1.4 1.0 2.42001 51 717 2.6 1.7 4.3 94 269 1.4 0.9 2.42002 53 861 2.3 1.5 3.9 98 520 1.3 0.8 2.12003 56 340 2.2 1.4 3.6 104 013 1.2 0.8 2.02004 60 163 2.1 1.4 3.6 105 289 1.2 0.8 2.02005 59 412 2.1 1.4 3.4 104 425 1.2 0.8 2.02006 66 909 1.9 1.2 3.1 105 741 1.2 0.8 2.02007 69 338 1.9 1.1 3.0 108 233 1.2 0.7 1.92008 67 322 1.7 1.1 2.8 107 033 1.1 0.7 1.72009 58 974 1.5 0.9 2.5 94 762 1.0 0.6 1.52010 67 671 1.2 0.8 2.0 101 840 0.8 0.5 1.3
(a) Valued at constant 2005 prices. Source: British Geological Survey. Source: Department for Business, Innovation & Skills.(b) Land-won and marine-dredged material.
22

23
Aluminium
United Kingdom summary 2006-2010
Commodity 2006 2007 2008 2009 2010 2006 2007 2008 2009 2010 Tonnes £ thousand
Aluminium
Production
Unwrought-
Primary 360 325 364 595 326 900 252 000 186 000
Secondary 204 200 193 900 145 800 129 800 150 000
Consumption
Unwrought-
Primary 362 267 363 480 339 440 270 000 270 000
Secondary 169 983 174 073 369 083 344 400 322 400
Ferro-aluminium (a) 3 030 3 140 2 950 2 190 2 120
Imports
Ash and residues 1 766 2 273 1 136 526 1 001 910 1 516 1 744 418 1 142
Unwrought 169 259 201 262 160 797 304 621 138 975 238 404 284 302 234 827 326 050 204 559
Unwrought alloys 245 496 93 145 93 210 43 601 62 686 147 969 150 316 152 037 60 882 104 767
Scrap 137 626 158 827 145 819 117 651 126 584 120 370 145 358 155 175 94 893 134 400
Exports
Ash and residues 90 5 631 132 24 35 374 1 990 407 85
Unwrought 17 530 30 631 20 690 17 688 43 665 27 142 44 194 31 790 19 211 60 938
Unwrought alloys 331 598 269 523 265 018 305 849 364 612 514 295 420 852 426 355 369 575 626 968
Scrap 385 211 906 831 872 988 422 574 443 466 351 964 491 914 574 214 333 723 549 108
(a) Consumption in the iron and steel industry; ferro-alloy weight.
Aluminium compounds
United Kingdom summary 2006-2010
Commodity 2006 2007 2008 2009 2010 2006 2007 2008 2009 2010 Tonnes £ thousand
Aluminium compounds
Imports
Oxide (alumina) 823 115 787 218 705 033 352 250 229 158 169 916 166 674 169 891 86 601 84 105
Hydroxide 101 126 112 287 110 503 98 516 87 278 22 582 22 834 27 336 25 911 28 869
Fused Oxide (a) 36 099 30 960 50 448 20 646 42 447 13 527 11 779 23 988 11 911 25 305
Fluorides 7 983 4 897 4 553 3 024 2 118 2 938 2 790 3 668 3 405 1 230
Exports
Oxide (alumina) 9 979 9 016 9 517 16 810 5 879 5 094 3 699 3 367 5 458 5 189
Hydroxide (b) 1 900 5 200 5 300 4 400 2 100 800 1 000 2 000 1 600 1 339
Fused Oxide (a) 6 252 8 801 9 329 5 819 11 489 5 335 5 600 7 138 5 581 8 617
Fluorides 0 213 210 156 10 2 92 119 229 67
(a) Artificial corundum. (b) BGS estimates, based on known imports into certain countries.

24
Antimony
United Kingdom summary 2006-2010
Commodity 2006 2007 2008 2009 2010 2006 2007 2008 2009 2010 Tonnes £ thousand
Antimony
Imports
Metal 81 110 98 88 45 380 428 972 566 472
Oxide 2 291 1 917 2 454 1 548 2 598 5 316 5 399 6 272 5 249 12 821
Exports
Metal 27 21 35 75 77 200 169 297 640 903
Oxide 397 379 558 407 490 928 936 1 655 1 203 2 347
Arsenic
United Kingdom summary 2006-2010
Commodity 2006 2007 2008 2009 2010 2006 2007 2008 2009 2010 Tonnes £ thousand
Arsenic
Imports
Elemental 49 70 52 60 7 415 212 240 380 107
Exports
Elemental 1 0 0 0 0 34 3 98 9 9
Asbestos
United Kingdom summary 2006-2010
Commodity 2006 2007 2008 2009 2010 2006 2007 2008 2009 2010 Tonnes £ thousand
Asbestos
Imports
Fibre 0 187 ... 11 … 1 1 ... 1 …
Fabricated asbestos 86 50 53 11 28 786 1 486 1 799 507 1 106
Friction material with a basis of
asbestos etc. 13 199 6 794 7 464 7 392 6 787 41 779 37 129 44 863 32 224 45 011
Articles of asbestos cement etc. 69 731 86 963 65 502 66 397 76 447 24 150 30 496 28 467 28 750 30 790
Exports
Fibre 0 ... ... ... ... 1 ... ... ... ...
Fabricated asbestos 915 132 200 223 79 2 376 1 429 1 886 1 529 964
Friction material with a basis of
asbestos etc. 2 877 3 152 3 453 2 772 3 497 31 927 33 282 45 785 36 490 43 223
Articles of asbestos cement etc. 16 902 18 285 15 994 8 452 11 312 6 803 6 618 7 586 4 952 5 724
25
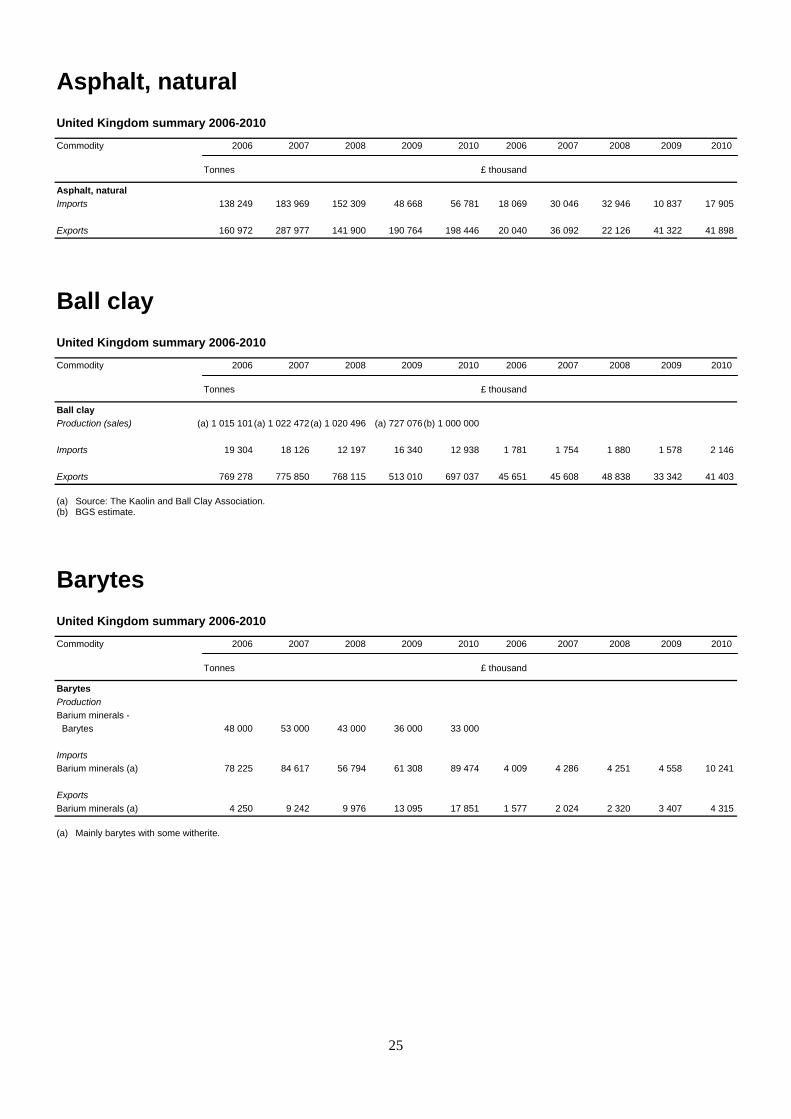
Asphalt, natural
United Kingdom summary 2006-2010
Commodity 2006 2007 2008 2009 2010 2006 2007 2008 2009 2010 Tonnes £ thousand
Asphalt, natural
Imports 138 249 183 969 152 309 48 668 56 781 18 069 30 046 32 946 10 837 17 905
Exports 160 972 287 977 141 900 190 764 198 446 20 040 36 092 22 126 41 322 41 898
Ball clay
United Kingdom summary 2006-2010
Commodity 2006 2007 2008 2009 2010 2006 2007 2008 2009 2010 Tonnes £ thousand
Ball clay
Production (sales) (a) 1 015 101 (a) 1 022 472 (a) 1 020 496 (a) 727 076 (b) 1 000 000
Imports 19 304 18 126 12 197 16 340 12 938 1 781 1 754 1 880 1 578 2 146
Exports 769 278 775 850 768 115 513 010 697 037 45 651 45 608 48 838 33 342 41 403
(a) Source: The Kaolin and Ball Clay Association. (b) BGS estimate.
Barytes
United Kingdom summary 2006-2010
Commodity 2006 2007 2008 2009 2010 2006 2007 2008 2009 2010 Tonnes £ thousand
Barytes
Production
Barium minerals -
Barytes 48 000 53 000 43 000 36 000 33 000
Imports
Barium minerals (a) 78 225 84 617 56 794 61 308 89 474 4 009 4 286 4 251 4 558 10 241
Exports
Barium minerals (a) 4 250 9 242 9 976 13 095 17 851 1 577 2 024 2 320 3 407 4 315
(a) Mainly barytes with some witherite.

26
Bauxite
United Kingdom summary 2006-2010
Commodity 2006 2007 2008 2009 2010 2006 2007 2008 2009 2010 Tonnes £ thousand
Bauxite
Imports (a) 86 882 48 741 57 971 37 461 41 650 6 500 5 421 13 042 13 455 14 147
Exports (a) 28 636 4 276 6 121 3 873 3 140 1 887 1 683 2 137 1 816 1 510
(s) Excluding refractory grade bauxite.
Bentonite
United Kingdom summary 2006-2010
Commodity 2006 2007 2008 2009 2010 2006 2007 2008 2009 2010 Tonnes £ thousand
Bentonite
Imports 173 483 157 388 205 853 140 301 141 849 13 970 11 693 16 658 12 534 13 755
Exports 42 548 47 122 43 261 34 622 41 323 12 549 14 773 15 234 13 828 13 058
Beryllium
United Kingdom summary 2006-2010
Commodity 2006 2007 2008 2009 2010 2006 2007 2008 2009 2010 Tonnes £ thousand
Beryllium
Imports
Metal 306 13 28 3 24 1 752 3 803 1 702 1 308 3 644
Oxides and hydroxides 7 6 11 2 1 502 410 891 207 1
Exports
Metal 8 10 10 0 5 673 2 989 263 113 279
Bismuth
United Kingdom summary 2006-2010
Commodity 2006 2007 2008 2009 2010 2006 2007 2008 2009 2010 Tonnes £ thousand
Bismuth
Imports
Metal 2 347 1 908 1 582 310 366 12 234 23 190 16 140 2 622 3 704
Exports
Metal 2 703 2 588 905 941 427 16 043 28 291 12 763 9 142 7 236
27
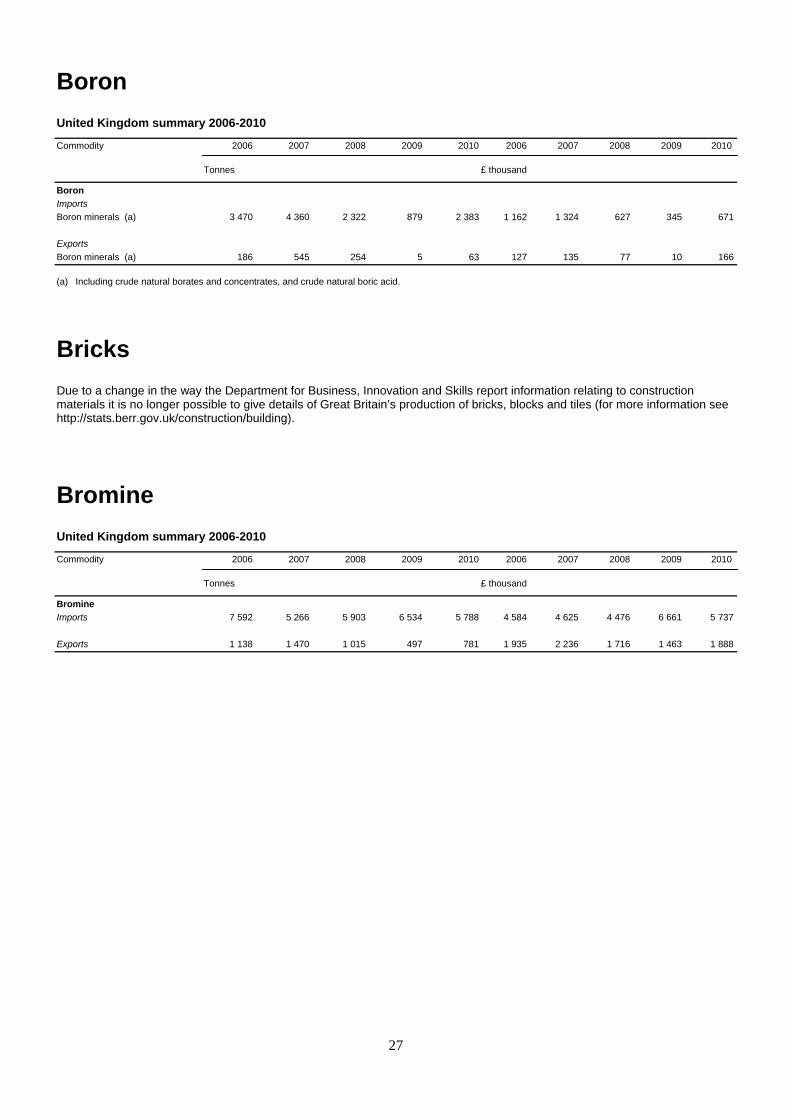
Boron
United Kingdom summary 2006-2010
Commodity 2006 2007 2008 2009 2010 2006 2007 2008 2009 2010 Tonnes £ thousand
Boron
Imports
Boron minerals (a) 3 470 4 360 2 322 879 2 383 1 162 1 324 627 345 671
Exports
Boron minerals (a) 186 545 254 5 63 127 135 77 10 166
(a) Including crude natural borates and concentrates, and crude natural boric acid.
Bricks
Due to a change in the way the Department for Business, Innovation and Skills report information relating to construction materials it is no longer possible to give details of Great Britain’s production of bricks, blocks and tiles (for more information see http://stats.berr.gov.uk/construction/building).
Bromine
United Kingdom summary 2006-2010
Commodity 2006 2007 2008 2009 2010 2006 2007 2008 2009 2010 Tonnes £ thousand
Bromine
Imports 7 592 5 266 5 903 6 534 5 788 4 584 4 625 4 476 6 661 5 737
Exports 1 138 1 470 1 015 497 781 1 935 2 236 1 716 1 463 1 888

28
Building and dimension stone
United Kingdom summary 2006-2010
Commodity 2006 2007 2008 2009 2010 2006 2007 2008 2009 2010 Tonnes £ thousand
Building and dimension stone
Production
Sandstone 434 000 419 000 499 000 722 000 741 000
Igneous rock 150 000 (a) 50 000 279 000 408 000 (a) 600 000
Limestone 379 000 (a) 320 000 307 000 (a) 300 000 (a) 700 000
Dolomite 3 000 (a) 1 000 2 000 (a) 1 000 (a) 1 000
Total (a) 966 000 (a) 790 000 1 087 000 (a) 1 431 000 (a) 2 100 000
Imports
Unworked-
Marble & other calcareous stone 32 609 37 404 37 444 26 787 21 339 17 463 20 144 21 150 16 466 15 556
Granite (b) 491 438 442 911 1 058 054 361 043 270 991 33 622 43 987 54 092 40 792 39 615
Sandstone 255 732 322 530 264 202 202 831 201 490 31 694 41 949 38 988 27 176 33 590
Other stone 116 986 68 726 54 415 48 823 63 655 12 024 10 393 10 983 10 208 12 299
Worked-
Marble & other calcareous stone 100 555 111 039 114 870 100 648 92 078 65 977 63 620 74 273 70 696 59 417
Granite 114 802 114 967 115 495 94 003 95 792 66 403 74 519 80 043 66 539 69 242
Other stone 41 470 64 610 61 324 98 462 87 152 17 632 26 035 27 885 30 246 30 638
Paving stones and flagstones 220 005 297 099 176 448 136 981 181 584 30 337 43 258 30 602 22 748 34 691
Exports
Unworked-
Marble & other calcareous stone 1 549 2 227 1 019 728 822 184 553 264 493 1 221
Granite 2 394 7 634 8 629 5 722 36 657 983 2 125 1 741 1 215 3 211
Sandstone 5 426 1 081 354 243 259 764 269 109 149 226
Other stone 638 8 928 888 276 540 167 419 161 107 134
Worked-
Marble & other calcareous stone 4 068 4 740 2 934 1 603 1 332 6 441 7 319 5 292 3 294 3 310
Granite 517 429 786 1 904 1 449 1 233 627 1 391 2 069 2 031
Other stone 5 958 7 022 7 372 2 797 2 591 4 475 5 860 5 386 5 406 4 983
Paving stones and flagstones 6 669 3 716 2 483 3 321 4 640 1 847 1 125 1 314 1 229 1 379
(a) BGS estimate. (b) Figures in some years believed to be too high. May include aggregates.
Cadmium
United Kingdom summary 2006-2010
Commodity 2006 2007 2008 2009 2010 2006 2007 2008 2009 2010 Tonnes £ thousand
Cadmium
Consumption 20 87 96 96 96
Imports
Metal 129 276 212 246 470 642 1 218 957 827 1 424
Pigments 220 102 104 63 22 299 386 506 255 136
Exports
Metal 7 76 54 25 2 545 46 334 739 440 7 383
Pigments 672 962 537 620 774 6 571 6 546 6 272 7 533 10 217

29
Cement
United Kingdom summary 2006-2010
Commodity 2006 2007 2008 2009 2010 2006 2007 2008 2009 2010 Tonnes £ thousand
Cement
Production
Cement, clinker (a) 10 069 000 10 227 000 9 478 000 6 420 000 6 599 000
Cement, finished (a) 11 469 000 11 887 000 10 071 000 7 623 000 7 882 000
Cubic metres
Ready-mixed concrete 23 029 000 23 548 000 20 051 000 14 069 000 14 038 000
Tonnes
Consumption (home deliveries)
Finished cement (a)(b) 11 221 000 11 638 000 9 937 000 7 474 000 7 767 000
Imports
Portland cement clinkers 516 583 836 788 366 791 206 857 201 308 38 834 59 190 34 947 19 471 20 789
Aluminous cement 13 967 14 770 8 946 8 248 14 779 3 960 3 876 2 698 2 644 4 889
Portland cement 1 397 025 1 534 683 1 731 228 1 718 146 1 759 841 69 931 81 685 93 946 98 170 101 408
Other cement 12 824 11 445 19 378 22 567 77 252 3 244 2 862 4 148 5 345 5 488
Exports
Portland cement clinkers 91 357 28 432 15 071 4 708 5 500 2 510 1 856 1 248 950 1 313
Aluminous cement 69 458 63 756 57 963 42 725 50 689 24 515 22 386 20 022 16 500 23 800
Portland cement 521 784 459 629 230 920 92 628 134 223 31 713 30 877 18 540 10 884 13 357
Other cement 17 400 24 695 35 160 8 635 6 092 3 184 4 354 4 630 2 155 1 870
(a) Great Britain only. (b) Excluding imports.
Chalk (see Limestone)
China clay
United Kingdom summary 2006-2010
Commodity 2006 2007 2008 2009 2010 2006 2007 2008 2009 2010 Tonnes £ thousand
China clay
Production (sales)(a) (b) 1 762 328 (b) 1 671 426 (b) 1 355 365 (b) 1 059 848 (c) 1 000 000
Imports (d) 79 958 54 888 67 349 61 164 82 927 10 007 8 064 12 116 14 028 17 361
Exports (d) 1 859 895 1 723 161 1 186 905 880 929 1 025 298 157 133 146 289 119 536 101 218 115 113
(a) Dry weight. (d) Excludes HS code 2507 00 80 'Other kaolinitic clays' which are shown (b) Source: The Kaolin and Ball Clay Association. in this volume under Ball clay. (c) BGS estimate.
China stone (see Feldspar)

30
Chromium
United Kingdom summary 2006-2010
Commodity 2006 2007 2008 2009 2010 2006 2007 2008 2009 2010 Tonnes £ thousand
Chromium Apparent consumption (a) 39 800 60 300 81 500 18 200 34 100
Consumption in Iron and Steel
Industry (b) 54 670 60 980 68 770 24 100 33 970
Imports
Ores & concentrates 74 907 103 551 117 715 33 867 7 084 4 344 6 698 21 106 6 789 1 901
Ferro-chrome
Under 4% carbon 7 049 11 396 13 250 5 730 7 836 6 607 11 820 31 747 10 517 15 559
4%-6% carbon 399 1 383 1 081 683 50 351 1 094 878 423 37
Over 6% carbon 45 046 34 197 65 360 28 471 50 512 18 869 17 514 75 033 20 200 49 286
Ferro-silico-chrome 350 1 242 128 26 9 128 635 136 59 10
Oxides and hydroxides (c) 7 100 13 000 9 000 3 300 3 400 5 000 9 200 12 400 4 300 6 400
Metal 4 022 2 134 3 099 2 904 3 007 12 883 9 820 15 062 12 132 17 349
Exports
Ores & concentrates 47 178 — 32 507 297 15 37 ... 3 168 103
Ferro-chrome
Under 4% carbon 436 376 461 294 187 582 564 2 018 954 765
4%-6% carbon 938 622 160 39 964 243 371 324 75 411
Over 6% carbon 2 684 1 940 755 1 141 1 252 2 234 2 686 1 379 1 653 1 851
Ferro-silico-chrome 8 35 9 50 22 12 80 24 244 43
Oxides and hydroxides (d) 15 100 12 700 14 500 4 900 1 200 21 100 18 400 33 600 12 200 3 500
Metal 5 123 6 777 6 501 5 058 7 441 20 563 27 595 38 623 33 207 54 158
(a) BGS estimates; see explanatory notes. (c) BGS estimates, based on known exports from certain countries. (b) Chromium content of ferro-alloys. (d) BGS estimates, based on known imports into certain countries.
Clays
United Kingdom summary 2006-2010
Commodity 2006 2007 2008 2009 2010 2006 2007 2008 2009 2010 Tonnes £ thousand
Clays
Production
Clay and shale 10 432 000 10 104 000 8 459 000 5 310 000 5 934 000
Imports
Unspecified clays 75 154 79 697 55 659 87 620 102 136 13 511 15 407 17 332 12 520 16 420
Exports
Unspecified clays 12 998 19 184 15 120 8 702 14 138 2 754 4 608 5 927 2 533 3 591

Great Britain production of clay and shale by end-use 1998–2010Thousand tonnes
Year Bricks, pipes Cement Lightweight Construc- Other uses Totaland tiles aggregate tional use
1998 8 214 2 384 — 1 089 (a) 543 12 2301999 8 270 2 148 — 540 … 11 3552000 7 880 1 939 1 … … 10 8382001 7 574 1 884 33 625 (a) 310 10 4262002 6 985 2 194 … 956 … 10 3062003 7 090 2 215 … 1 181 … 10 6802004 7 629 … — … 234 11 1642005 7 741 1 937 — 798 422 10 8982006 6 772 … — … … 10 4322007 6 869 2 348 — 785 102 10 1042008 4 969 2 013 — 1 318 159 8 4592009 2 797 1 397 — 998 118 5 3102010 … 1 353 — 769 … 5 934
(a) BGS estimate. Source: Office for National Statistics.
31

32
Coal
United Kingdom summary 2006-2010
Commodity 2006 2007 2008 2009 2010 2006 2007 2008 2009 2010 Tonnes £ thousand
Coal
Production
Bituminous (a) 18 517 000 17 070 000 18 053 000 17 874 000 18 417 000
Consumption 67 450 000 62 886 000 58 212 000 48 786 000 51 429 000
Imports
Anthracite 125 011 135 941 213 318 207 327 187 246 9 444 7 769 27 725 25 757 22 711
Bituminous & Other 49 544 012 43 024 560 43 038 043 36 553 574 23 227 529 2 095 699 1 951 342 3 480 141 2 632 676 1 828 525
Total 49 669 023 43 160 501 43 251 361 36 760 900 23 414 775 2 105 143 1 959 111 3 507 866 2 658 434 1 851 236
Briquettes of Coal 9 604 6 127 13 164 6 484 10 489 1 211 1 068 1 348 1 480 1 740
Lignite (including
agglomerated) 1 215 384 986 2 537 777 395 329 507 660 231
Exports
Anthracite 137 353 123 549 165 473 119 472 89 701 10 739 10 474 15 647 15 587 11 701
Bituminous & Other 354 281 419 193 742 582 391 414 615 067 24 795 30 528 80 084 56 545 73 176
Total 491 634 542 742 908 055 510 886 704 768 35 534 41 002 95 730 72 132 84 877
Briquettes of Coal 18 982 26 590 51 782 67 618 88 351 2 073 2 976 7 869 12 142 15 783
Lignite (including
agglomerated) 3 804 2 966 3 157 2 795 3 182 481 410 591 600 621
(a) Including anthracite.

UK supply of coal 2010Thousand tonnes
Anthracite Total
Steam coal Coking coal
Production Mine production 16 397 270 1 150 17 817 Other sources 530 … 70 600Stock change 7 817 -531 -79 7 206
Bituminous
gTotal production … -261 … 25 623
Imports European Union 881 1 72 954 Australia — 3 235 12 3 247 Canada — 434 — 434 Colombia 6 360 66 11 6 437 Indonesia 275 — — 275 China P.R. — — 17 17 South Africa 781 — — 781
Russia 9 356 351 43 9 750 Russia 9 356 351 43 9 750 USA 2 390 2 132 — 4 522 Other countries 87 16 — 103Total imports 20 130 6 235 155 26 520
Total exports -624 -1 -90 -715
Total supply … 5 973 … 51 428
Source: Department of Energy and Climate Change.
Great Britain production of deep-mined and opencast coal 1981–2010Thousand tonnes
Year Deep-mined and opencast
Anthracite Bituminous Total Anthracite Bituminous Total Anthracite Bituminous Total
1981 1 566 108 907 110 473 1 343 13 485 14 828 2 909 122 392 125 3011982 1 406 104 755 106 161 1 478 13 788 15 266 2 884 118 543 121 427
Deep-mined Opencast
1983 1 249 100 493 101 742 767 13 939 14 706 2 016 114 432 116 4481984 256 34 987 35 243 961 13 345 14 306 1 217 48 332 49 5491985 838 74 451 75 289 1 304 14 265 15 569 2 142 88 716 90 8581986 984 89 382 90 366 1 001 13 274 14 275 1 985 102 656 104 6411987 917 85 040 85 957 1 174 14 612 15 786 2 091 99 652 101 7431988 770 82 992 83 762 1 028 16 871 17 899 1 798 99 863 101 6611989 453 79 175 79 628 1 607 17 050 18 657 2 060 96 225 98 2851990 573 72 326 72 899 1 372 16 762 18 134 1 945 89 088 91 0331991 189 73 168 73 357 1 675 16 961 18 636 1 864 90 129 91 9931992 177 65 623 65 800 1 863 16 324 18 187 2 040 81 947 83 9871993 115 50 342 50 457 1 289 15 717 17 006 1 404 66 059 67 463993 5 50 3 50 5 89 5 006 0 66 059 6 631994 … … 31 854 … … 16 804 … … 48 6581995 … … 35 150 … … 16 369 … … 51 5191996 … … 32 223 … … 16 315 … … 48 5381997 … … 30 281 … … 16 700 (a) 2 500 (a) 44 500 46 9811998 … … 25 731 … … 14 315 (a) 2 000 (a) 38 000 40 0461999 … … 20 888 … … 15 275 (a) 2 000 (a) 34 200 36 1632000 … … 17 187 … … 13 412 (a) 2 000 (a) 28 600 30 5992001 … … 17 347 … … 14 166 (a) 2 000 (a) 29 500 31 5132002 … … 16 391 … … 13 148 (a) 2 000 (a) 27 500 29 5392003 … … 15 633 … … 12 126 … … 27 7592004 12 542 11 993 24 5362004 … … 12 542 … … 11 993 … … 24 5362005 … … 9 563 … … 10 445 … … 20 0082006 … … 9 444 … … 8 635 … … 18 0792007 … … 7 674 … … 8 866 … … 16 5402008 … … 8 096 … … 9 509 … … 17 6052009 … … 7 520 … … 9 854 … … 17 3742010 … … 7 390 … … 10 426 … … 17 817
(a) BGS estimate. Source: Department of Energy and Climate Change.
33

United Kingdom regional deep-mined coal production 2006–2011 (a)Thousand tonnes
County/Unitary authority 2006/07 2007/08 2008/09 2009/10 2010/11
Doncaster 58 118 489 730 827
Kirklees 19 14 16 18 8
Rotherham 811 917 1 124 1024 855
Warwickshire 2 247 2 560 3116 2349 3173
Derbyshire 26 24 21 20 23
Nottinghamshire 2 642 2 125 1 938 1735 1737
North Yorkshire 1 908 1 569 1 183 1014 1624
Gloucestershire 0 0 0 0 0
England 7 711 7 327 7 887 6 890 8 247
Rhondda, Cynon Taff 423 145 — — —
Neath Port Talbot 11 19 121 83 43
Torfaen 5 5 4 1 1
Wales 440 168 125 84 44
Scotland — — — — —
United Kingdom 8 150 7 495 8 012 6 974 8 292
(a) Financial years to March. Source: The Coal Authority.
United Kingdom regional opencast coal production 2006–2011 (a)Thousand tonnes
County/Unitary authority 2006/07 2007/08 2008/09 2009/10 2010/11
Barnsley — — — — —
Bolton — 186 257 285 372Calderdale 1 — — 1 —Kirklees — 12 6 2 —
Rotherham 18 — — 4 36
34
Rotherham 18 — — 4 36
Wakefield — 82 187 12 —
Lancashire — — 1 — —
Leicestershire 8 110 441 293 31
Derbyshire — 17 127 488 630
Durham 134 91 — — 192
Newcastle upon Tyne 89 7 — — 62
Northumberland 768 1 306 1 142 1 033 1 438
Leeds — — — 26 71
Telford & Wrekin — — — — 69
Cumbria
England 1 018 1 811 2 161 2 144 2 900
Blaenau Gwent — — — — 14Merthyr Tydfil — 38 447 670 896
Carmarthenshire 32 18 8 — —
Neath Port Talbot 807 665 832 480 497
Powys 412 361 408 416 395
Wales 1 252 1 082 1 695 1 566 1 801
Dumfries & Galloway 233 751 562 624 647
Falkirk 5 — — — —
Midlothian 246 85 258 178 184
West Lothian 495 260 — —
East Ayrshire 3 257 3 380 3 330 2 760 2 524
Fife 1 046 735 748 819 775
North Lanarkshire — — — 2 38
South Lanarkshire 860 710 1 063 1 596 1 647
Scotland 6 143 5 921 5 961 5 979 5 816
United Kingdom 8 412 8 815 9 817 9 689 10 517
(a) Financial years to March. Source: The Coal Authority.
34
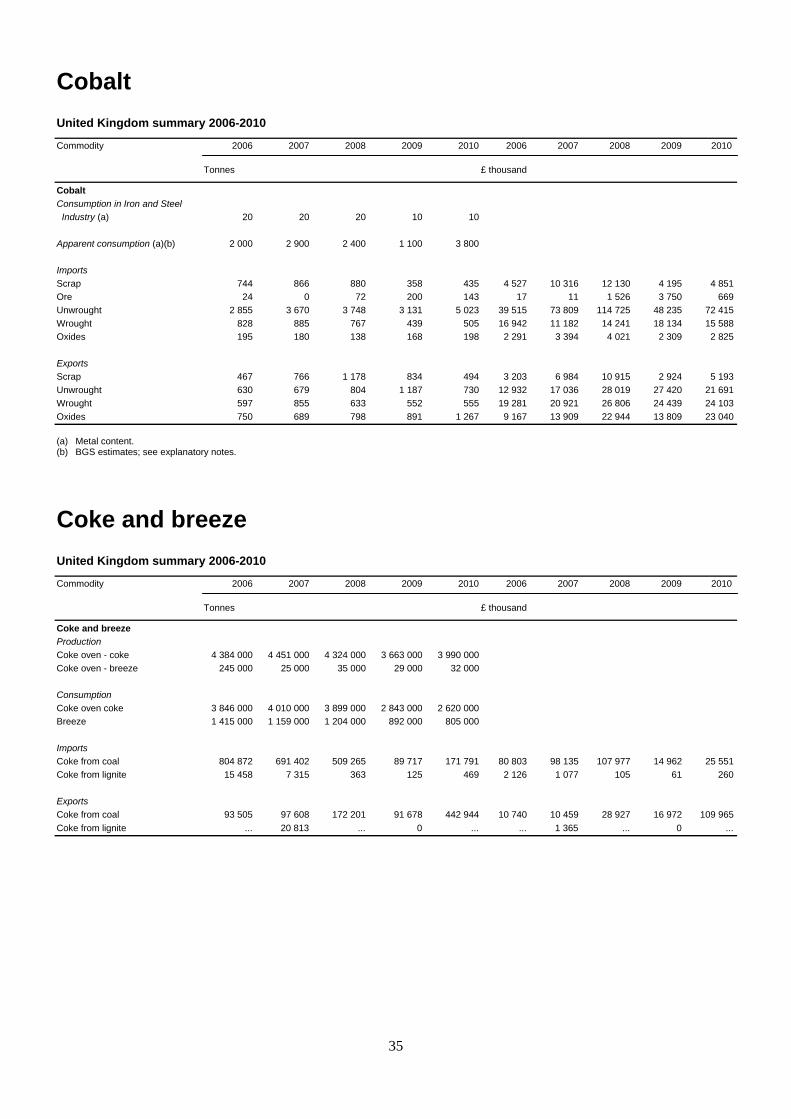
35
Cobalt
United Kingdom summary 2006-2010
Commodity 2006 2007 2008 2009 2010 2006 2007 2008 2009 2010 Tonnes £ thousand
Cobalt
Consumption in Iron and Steel
Industry (a) 20 20 20 10 10
Apparent consumption (a)(b) 2 000 2 900 2 400 1 100 3 800
Imports
Scrap 744 866 880 358 435 4 527 10 316 12 130 4 195 4 851
Ore 24 0 72 200 143 17 11 1 526 3 750 669
Unwrought 2 855 3 670 3 748 3 131 5 023 39 515 73 809 114 725 48 235 72 415
Wrought 828 885 767 439 505 16 942 11 182 14 241 18 134 15 588
Oxides 195 180 138 168 198 2 291 3 394 4 021 2 309 2 825
Exports
Scrap 467 766 1 178 834 494 3 203 6 984 10 915 2 924 5 193
Unwrought 630 679 804 1 187 730 12 932 17 036 28 019 27 420 21 691
Wrought 597 855 633 552 555 19 281 20 921 26 806 24 439 24 103
Oxides 750 689 798 891 1 267 9 167 13 909 22 944 13 809 23 040
(a) Metal content. (b) BGS estimates; see explanatory notes.
Coke and breeze
United Kingdom summary 2006-2010
Commodity 2006 2007 2008 2009 2010 2006 2007 2008 2009 2010 Tonnes £ thousand
Coke and breeze
Production
Coke oven - coke 4 384 000 4 451 000 4 324 000 3 663 000 3 990 000
Coke oven - breeze 245 000 25 000 35 000 29 000 32 000
Consumption
Coke oven coke 3 846 000 4 010 000 3 899 000 2 843 000 2 620 000
Breeze 1 415 000 1 159 000 1 204 000 892 000 805 000
Imports
Coke from coal 804 872 691 402 509 265 89 717 171 791 80 803 98 135 107 977 14 962 25 551
Coke from lignite 15 458 7 315 363 125 469 2 126 1 077 105 61 260
Exports
Coke from coal 93 505 97 608 172 201 91 678 442 944 10 740 10 459 28 927 16 972 109 965
Coke from lignite ... 20 813 ... 0 ... ... 1 365 ... 0 ...

36
Copper
United Kingdom summary 2006-2010
Commodity 2006 2007 2008 2009 2010 2006 2007 2008 2009 2010 Tonnes £ thousand
Copper
Consumption
Unwrought-
Refined 172 092 41 454 42 920 22 800 43 000
Copper in scrap for direct use 120 000 120 000 120 000 120 000 ...
Imports
Ores & concentrates 2 571 1 676 699 581 189 1 537 1 218 1 500 928 968
Matte & cement 15 2 14 1 22 63 51 ... 23 28
Scrap 19 744 21 852 21 132 18 549 27 495 43 789 53 297 53 211 39 973 81 565
Ash and residues 610 1 089 635 217 40 758 1 395 782 156 63
Unwrought-
Unrefined 264 7 401 5 529 3 034 2 039 600 23 350 18 981 14 557 7 898
Refined 183 727 46 820 47 716 45 249 40 708 668 026 170 610 187 844 145 913 202 000
Alloys 5 813 5 488 5 173 3 766 5 379 18 155 18 339 15 991 11 931 19 914
Master Alloys 930 714 548 300 309 3 113 2 827 2 778 1 447 1 859
Exports
Ores & concentrates 12 2 118 68 39 177 36 137 107 152
Matte & cement 515 16 28 14 33 1 864 181 215 118 218
Scrap 311 058 346 361 358 981 429 467 421 868 587 992 646 751 775 054 693 154 1 077 272
Ash and residues 1 168 465 723 832 541 522 196 591 1 407 451
Unwrought-
Unrefined 153 786 3 066 205 185 1 922 4 844 16 062 2 508 2 896
Refined 5 969 8 489 4 850 14 059 8 863 18 721 29 618 20 571 41 963 43 952
Alloys 13 661 12 533 11 603 7 906 6 899 41 189 46 032 45 706 26 335 33 354
Master Alloys 3 590 5 609 6 219 3 933 5 883 14 471 21 354 25 047 12 728 26 087
Crushed rock (see also Aggregates)
United Kingdom summary 2006-2010
Commodity 2006 2007 2008 2009 2010 2006 2007 2008 2009 2010 Tonnes £ thousand
Crushed rock
Production (a) 145 578 000 148 534 000 127 996 000 104 626 000 94 203 000
Imports (b) 2 270 355 1 909 733 1 984 383 1 609 546 1 896 201 27 202 27 501 34 449 26 157 30 740
Exports 5 322 099 5 959 212 5 260 973 4 916 514 4 910 701 25 773 33 637 36 693 36 965 36 490
(a) Includes small quantities for other purposes in Northern Ireland. (b) For a number of years a significant amount of armourstone imports are believed to be wrongly classified as 'granite, crude'. In 2010, this figure was 162 550 tonnes, and this has reduced from 1 331 520 tonnes in 2005, suggesting this issue is being addressed.

Roadstone, coated
Roadstone,uncoated
C t
Other screened
and graded
Other constructional
uses
Armourstoneand gabion
Great Britain production of crushed rock by end-use 2010 (total production 82.3 million tonnes)
37
Railwayballast
Concrete aggregate

Great Britain production of crushed rock by region 1980–2010Thousand tonnes
Year North North Yorks. & West East East of South South England Wales Scotland Great East (a) West (b) the Humber Midlands Midlands England (c) East (d) West Britain
1980 9 948 4 951 10 714 7 364 15 996 658 1 114 21 934 72 679 15 998 13 586 102 5331981 8 677 4 504 9 442 6 713 15 854 534 961 18 763 65 450 14 249 11 681 91 3811982 9 362 4 779 10 108 8 181 17 237 537 1 112 21 175 72 492 16 754 13 602 102 8481983 8 978 5 311 11 481 9 192 19 206 … … 23 178 79 541 18 835 13 706 112 0821984 9 668 5 116 9 557 8 861 19 142 … … 25 107 79 650 16 965 14 063 110 6781985 9 823 5 330 9 444 8 589 21 429 674 1 404 26 510 83 203 17 423 14 370 114 9951986 9 861 5 469 11 201 8 780 23 038 500 1 597 29 194 89 640 17 881 14 844 122 3651987 10 375 5 328 15 407 10 015 26 355 772 1 601 34 443 104 296 20 950 16 990 142 2371988 11 453 6 849 14 885 12 519 32 026 853 2 589 39 108 120 283 23 102 17 629 161 0141989 13 497 7 078 16 895 12 519 32 646 611 3 254 37 589 124 088 23 581 21 125 168 7941990 14 602 7 533 15 449 11 047 34 143 709 1 320 33 073 117 875 22 646 21 094 161 6151991 13 378 6 320 14 269 10 009 29 862 676 1 625 28 037 104 177 22 123 21 707 148 0071992 12 669 5 899 12 812 8 783 29 879 … … 28 564 100 553 21 482 21 932 143 9671993 12 724 6 748 12 734 8 225 31 522 625 1 168 29 848 103 595 23 237 22 743 149 5761994 13 365 7 892 15 576 8 839 33 713 1 705 1 433 32 141 114 665 24 346 22 746 161 7571995 10 930 8 077 15 664 … 31 881 629 … 27 419 103 475 23 139 24 224 150 8381996 10 385 6 448 12 350 6 514 29 001 595 1 210 22 940 89 444 21 273 22 177 132 8941997 10 619 7 086 12 484 6 416 29 925 536 1 352 23 117 91 535 20 585 21 667 133 7871998 10 246 6 348 13 745 6 028 26 933 607 1 358 23 411 88 675 19 903 23 138 131 7161999 9 298 5 829 11 689 5 996 30 724 575 1 343 23 183 88 637 20 429 23 531 132 5982000 5 441 10 381 11 748 5 533 28 679 475 1 624 24 146 88 027 19 044 23 236 130 3072001 6 338 9 601 11 718 5 688 30 780 452 1 984 28 067 94 630 17 765 21 364 133 7592002 5 390 9 426 11 620 5 835 29 604 372 1 068 24 332 87 647 16 724 22 198 126 5682003 6 081 8 887 10 652 5 538 28 443 (e) 350 (e) 1 008 22 998 83 957 16 837 22 092 122 8852004 6 455 9 182 11 457 4 861 28 445 423 1 351 23 479 85 653 16 528 25 494 127 6742005 5 333 7 993 10 875 4 416 27 468 238 1 090 23 180 80 593 16 535 24 732 121 8602006 5 352 8 996 10 811 4 824 29 658 496 1 059 22 526 83 722 18 429 24 744 126 8952007 5 482 9 351 10 834 4 750 28 530 591 1 011 22 374 82 922 18 487 28 168 129 5772008 4 928 7 962 10 045 3 850 24 328 683 1 029 22 355 75 179 15 685 24 215 115 0792009 3 194 5 629 6 868 2 808 21 575 (e) 289 1 085 18 218 59 666 10 542 20 895 91 1032010 3 354 4 329 6 681 2 927 17 036 274 800 14 715 50 115 11 001 21 193 82 309
(a) From 2000, excludes Cumbria. (d) From 2000, excludes Essex, Hertfordshire and Bedfordshire. (b) From 2000, includes Cumbria. (e) BGS estimate.(c) From 2000, includes Essex, Hertfordshire and Bedfordshire.
Source: Office for National Statistics.
38
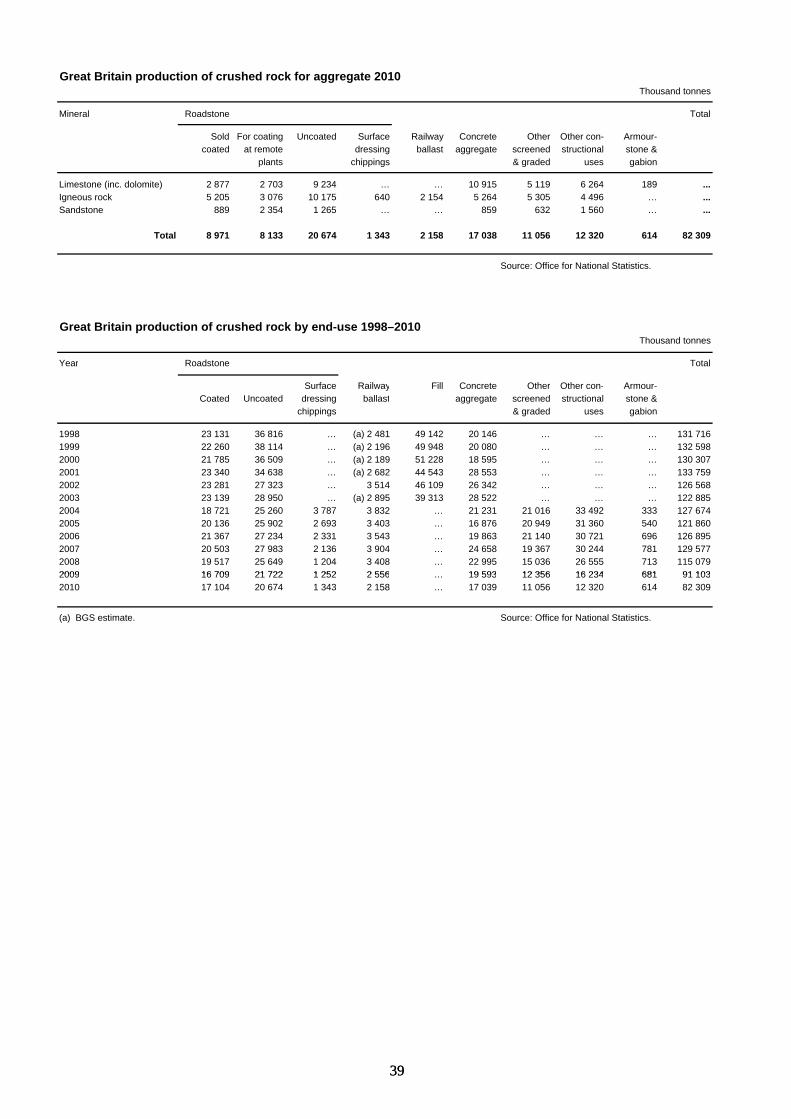
Great Britain production of crushed rock for aggregate 2010Thousand tonnes
Mineral Roadstone Total
Sold For coating Uncoated Surface Railway Concrete Other Other con- Armour-coated at remote dressing ballast aggregate screened structional stone &
plants chippings & graded uses gabion
Limestone (inc. dolomite) 2 877 2 703 9 234 … … 10 915 5 119 6 264 189 ...Igneous rock 5 205 3 076 10 175 640 2 154 5 264 5 305 4 496 … ...Sandstone 889 2 354 1 265 … … 859 632 1 560 … ...
Total 8 971 8 133 20 674 1 343 2 158 17 038 11 056 12 320 614 82 309
Source: Office for National Statistics.
Great Britain production of crushed rock by end-use 1998–2010Thousand tonnes
Year Roadstone Total
Surface Railway Fill Concrete Other Other con- Armour-Coated Uncoated dressing ballast aggregate screened structional stone &
chippings & graded uses gabion
1998 23 131 36 816 … (a) 2 481 49 142 20 146 … … … 131 7161999 22 260 38 114 … (a) 2 196 49 948 20 080 … … … 132 5982000 21 785 36 509 … (a) 2 189 51 228 18 595 … … … 130 3072001 23 340 34 638 … (a) 2 682 44 543 28 553 … … … 133 7592002 23 281 27 323 … 3 514 46 109 26 342 … … … 126 5682003 23 139 28 950 … (a) 2 895 39 313 28 522 … … … 122 8852004 18 721 25 260 3 787 3 832 … 21 231 21 016 33 492 333 127 6742005 20 136 25 902 2 693 3 403 … 16 876 20 949 31 360 540 121 8602006 21 367 27 234 2 331 3 543 … 19 863 21 140 30 721 696 126 8952007 20 503 27 983 2 136 3 904 … 24 658 19 367 30 244 781 129 5772008 19 517 25 649 1 204 3 408 … 22 995 15 036 26 555 713 115 0792009 16 709 21 722 1 252 2 556 19 593 12 356 16 234 681 91 103
39
2009 16 709 21 722 1 252 2 556 … 19 593 12 356 16 234 681 91 1032010 17 104 20 674 1 343 2 158 … 17 039 11 056 12 320 614 82 309
(a) BGS estimate. Source: Office for National Statistics.
39
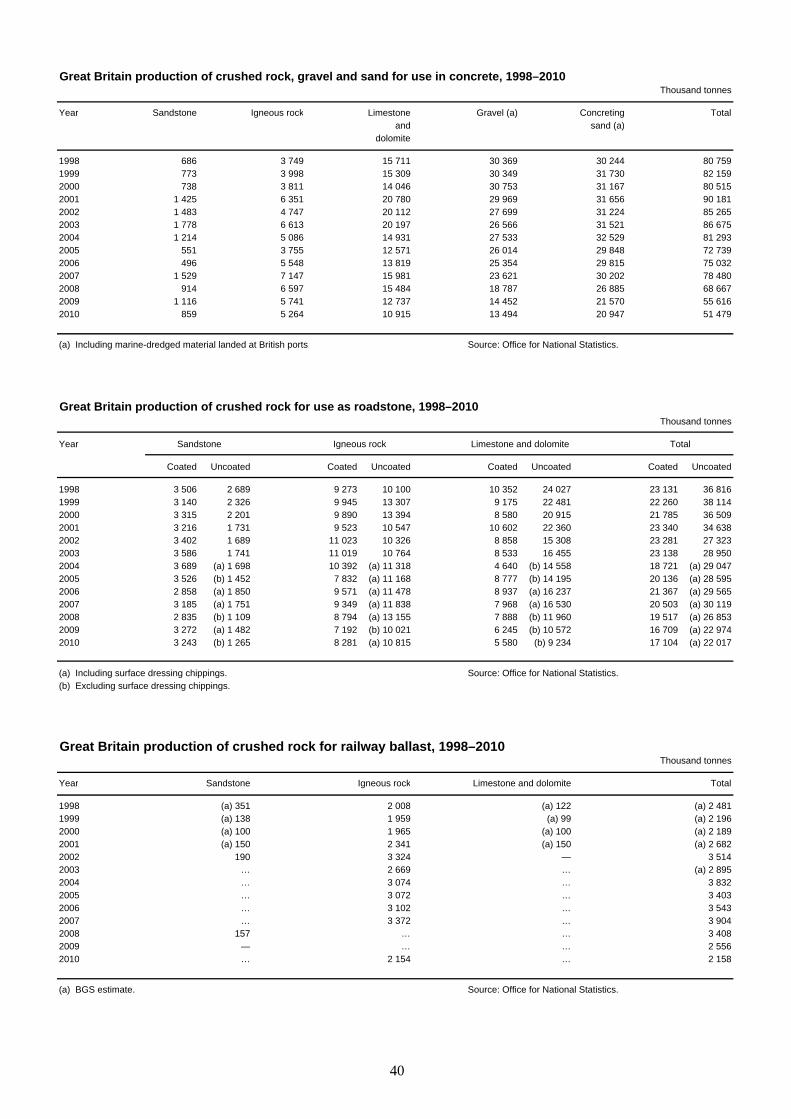
Great Britain production of crushed rock, gravel and sand for use in concrete, 1998–2010Thousand tonnes
Year Sandstone Igneous rock Limestone Gravel (a) Concreting Totaland sand (a)
dolomite
1998 686 3 749 15 711 30 369 30 244 80 7591999 773 3 998 15 309 30 349 31 730 82 1592000 738 3 811 14 046 30 753 31 167 80 5152001 1 425 6 351 20 780 29 969 31 656 90 1812002 1 483 4 747 20 112 27 699 31 224 85 2652003 1 778 6 613 20 197 26 566 31 521 86 6752004 1 214 5 086 14 931 27 533 32 529 81 2932005 551 3 755 12 571 26 014 29 848 72 7392006 496 5 548 13 819 25 354 29 815 75 0322007 1 529 7 147 15 981 23 621 30 202 78 4802008 914 6 597 15 484 18 787 26 885 68 6672009 1 116 5 741 12 737 14 452 21 570 55 6162010 859 5 264 10 915 13 494 20 947 51 479
(a) Including marine-dredged material landed at British ports. Source: Office for National Statistics.
Great Britain production of crushed rock for use as roadstone, 1998–2010Thousand tonnes
Year
Coated Uncoated Coated Uncoated Coated Uncoated Coated Uncoated
1998 3 506 2 689 9 273 10 100 10 352 24 027 23 131 36 8161999 3 140 2 326 9 945 13 307 9 175 22 481 22 260 38 1142000 3 315 2 201 9 890 13 394 8 580 20 915 21 785 36 5092001 3 216 1 731 9 523 10 547 10 602 22 360 23 340 34 6382002 3 402 1 689 11 023 10 326 8 858 15 308 23 281 27 3232003 3 586 1 741 11 019 10 764 8 533 16 455 23 138 28 9502004 3 689 (a) 1 698 10 392 (a) 11 318 4 640 (b) 14 558 18 721 (a) 29 0472005 3 526 (b) 1 452 7 832 (a) 11 168 8 777 (b) 14 195 20 136 (a) 28 5952006 2 858 (a) 1 850 9 571 (a) 11 478 8 937 (a) 16 237 21 367 (a) 29 5652007 3 185 (a) 1 751 9 349 (a) 11 838 7 968 (a) 16 530 20 503 (a) 30 1192008 2 835 (b) 1 109 8 794 (a) 13 155 7 888 (b) 11 960 19 517 (a) 26 8532009 3 272 (a) 1 482 7 192 (b) 10 021 6 245 (b) 10 572 16 709 (a) 22 9742010 3 243 (b) 1 265 8 281 (a) 10 815 5 580 (b) 9 234 17 104 (a) 22 017
(a) Including surface dressing chippings. Source: Office for National Statistics.(b) Excluding surface dressing chippings.
Great Britain production of crushed rock for railway ballast, 1998–2010Thousand tonnes
Year Sandstone Igneous rock Limestone and dolomite Total
1998 (a) 351 2 008 (a) 122 (a) 2 4811999 (a) 138 1 959 (a) 99 (a) 2 1962000 (a) 100 1 965 (a) 100 (a) 2 1892001 (a) 150 2 341 (a) 150 (a) 2 6822002 190 3 324 — 3 5142003 … 2 669 … (a) 2 8952004 … 3 074 … 3 8322005 … 3 072 … 3 4032006 … 3 102 … 3 5432007 … 3 372 … 3 9042008 157 … … 3 4082009 — … … 2 5562010 … 2 154 … 2 158
(a) BGS estimate. Source: Office for National Statistics.
Sandstone Igneous rock Limestone and dolomite Total
40
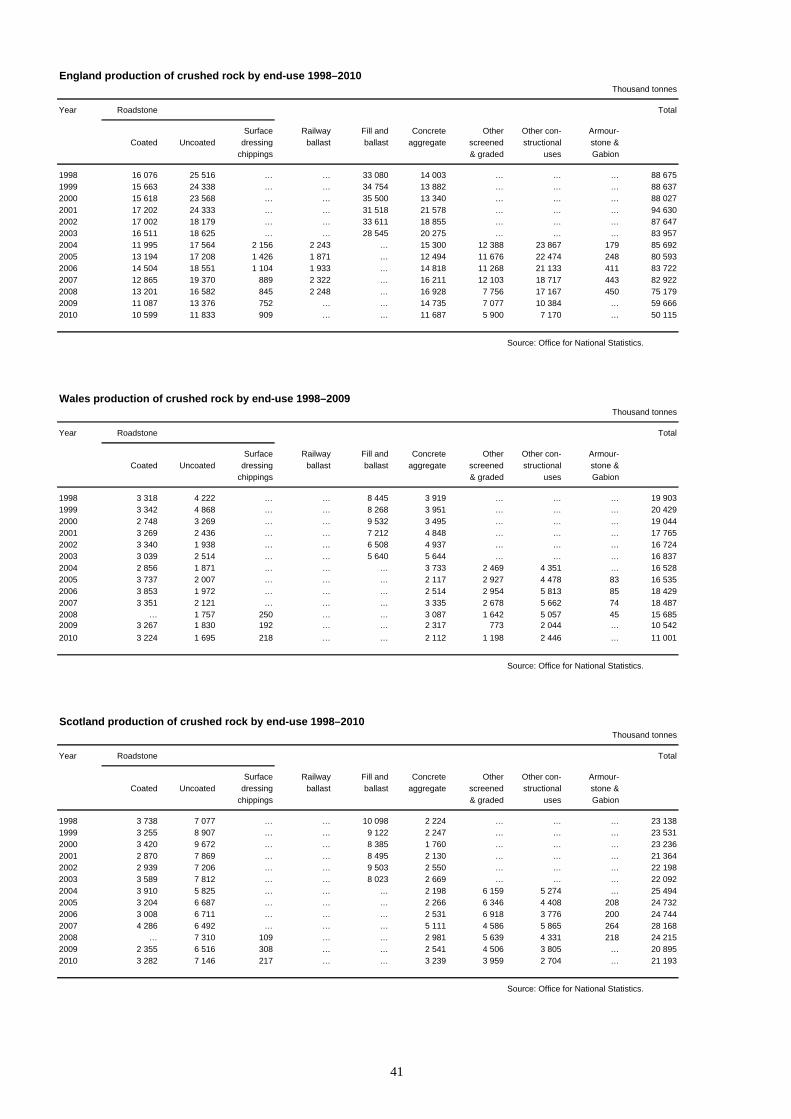
England production of crushed rock by end-use 1998–2010Thousand tonnes
Year Roadstone Total
Surface Railway Fill and Concrete Other Other con- Armour-Coated Uncoated dressing ballast ballast aggregate screened structional stone &
chippings & graded uses Gabion
1998 16 076 25 516 … … 33 080 14 003 … … … 88 6751999 15 663 24 338 … … 34 754 13 882 … … … 88 6372000 15 618 23 568 … … 35 500 13 340 … … … 88 0272001 17 202 24 333 … … 31 518 21 578 … … … 94 6302002 17 002 18 179 … … 33 611 18 855 … … … 87 6472003 16 511 18 625 … … 28 545 20 275 … … … 83 9572004 11 995 17 564 2 156 2 243 … 15 300 12 388 23 867 179 85 6922005 13 194 17 208 1 426 1 871 … 12 494 11 676 22 474 248 80 5932006 14 504 18 551 1 104 1 933 … 14 818 11 268 21 133 411 83 7222007 12 865 19 370 889 2 322 … 16 211 12 103 18 717 443 82 9222008 13 201 16 582 845 2 248 … 16 928 7 756 17 167 450 75 1792009 11 087 13 376 752 … … 14 735 7 077 10 384 … 59 6662010 10 599 11 833 909 … … 11 687 5 900 7 170 … 50 115
Source: Office for National Statistics.
Wales production of crushed rock by end-use 1998–2009Thousand tonnes
Year Roadstone Total
Surface Railway Fill and Concrete Other Other con- Armour-Coated Uncoated dressing ballast ballast aggregate screened structional stone &
chippings & graded uses Gabion
1998 3 318 4 222 … … 8 445 3 919 … … … 19 9031999 3 342 4 868 … … 8 268 3 951 … … … 20 4292000 2 748 3 269 … … 9 532 3 495 … … … 19 0442001 3 269 2 436 … … 7 212 4 848 … … … 17 7652002 3 340 1 938 … … 6 508 4 937 … … … 16 7242003 3 039 2 514 … … 5 640 5 644 … … … 16 8372004 2 856 1 871 … … … 3 733 2 469 4 351 … 16 5282005 3 737 2 007 … … … 2 117 2 927 4 478 83 16 5352006 3 853 1 972 … … … 2 514 2 954 5 813 85 18 4292007 3 351 2 121 … … … 3 335 2 678 5 662 74 18 4872008 … 1 757 250 … … 3 087 1 642 5 057 45 15 6852009 3 267 1 830 192 … … 2 317 773 2 044 … 10 542
2010 3 224 1 695 218 … … 2 112 1 198 2 446 … 11 001
Source: Office for National Statistics.
Scotland production of crushed rock by end-use 1998–2010Thousand tonnes
Year Roadstone Total
Surface Railway Fill and Concrete Other Other con- Armour-Coated Uncoated dressing ballast ballast aggregate screened structional stone &
chippings & graded uses Gabion
1998 3 738 7 077 … … 10 098 2 224 … … … 23 1381999 3 255 8 907 … … 9 122 2 247 … … … 23 5312000 3 420 9 672 … … 8 385 1 760 … … … 23 2362001 2 870 7 869 … … 8 495 2 130 … … … 21 3642002 2 939 7 206 … … 9 503 2 550 … … … 22 1982003 3 589 7 812 … … 8 023 2 669 … … … 22 0922004 3 910 5 825 … … … 2 198 6 159 5 274 … 25 4942005 3 204 6 687 … … … 2 266 6 346 4 408 208 24 7322006 3 008 6 711 … … … 2 531 6 918 3 776 200 24 7442007 4 286 6 492 … … … 5 111 4 586 5 865 264 28 1682008 … 7 310 109 … … 2 981 5 639 4 331 218 24 2152009 2 355 6 516 308 … … 2 541 4 506 3 805 … 20 8952010 3 282 7 146 217 … … 3 239 3 959 2 704 … 21 193
Source: Office for National Statistics.
41
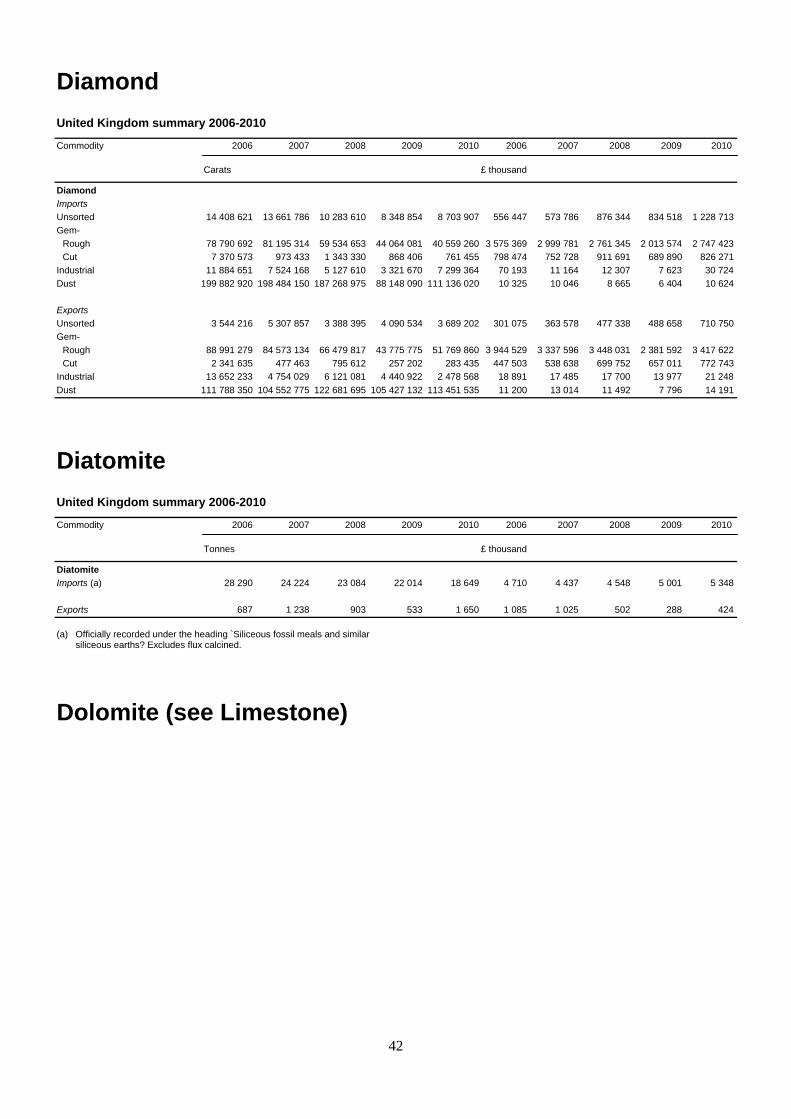
42
Diamond
United Kingdom summary 2006-2010
Commodity 2006 2007 2008 2009 2010 2006 2007 2008 2009 2010 Carats £ thousand
Diamond
Imports
Unsorted 14 408 621 13 661 786 10 283 610 8 348 854 8 703 907 556 447 573 786 876 344 834 518 1 228 713
Gem-
Rough 78 790 692 81 195 314 59 534 653 44 064 081 40 559 260 3 575 369 2 999 781 2 761 345 2 013 574 2 747 423
Cut 7 370 573 973 433 1 343 330 868 406 761 455 798 474 752 728 911 691 689 890 826 271
Industrial 11 884 651 7 524 168 5 127 610 3 321 670 7 299 364 70 193 11 164 12 307 7 623 30 724
Dust 199 882 920 198 484 150 187 268 975 88 148 090 111 136 020 10 325 10 046 8 665 6 404 10 624
Exports
Unsorted 3 544 216 5 307 857 3 388 395 4 090 534 3 689 202 301 075 363 578 477 338 488 658 710 750
Gem-
Rough 88 991 279 84 573 134 66 479 817 43 775 775 51 769 860 3 944 529 3 337 596 3 448 031 2 381 592 3 417 622
Cut 2 341 635 477 463 795 612 257 202 283 435 447 503 538 638 699 752 657 011 772 743
Industrial 13 652 233 4 754 029 6 121 081 4 440 922 2 478 568 18 891 17 485 17 700 13 977 21 248
Dust 111 788 350 104 552 775 122 681 695 105 427 132 113 451 535 11 200 13 014 11 492 7 796 14 191
Diatomite
United Kingdom summary 2006-2010
Commodity 2006 2007 2008 2009 2010 2006 2007 2008 2009 2010 Tonnes £ thousand
Diatomite
Imports (a) 28 290 24 224 23 084 22 014 18 649 4 710 4 437 4 548 5 001 5 348
Exports 687 1 238 903 533 1 650 1 085 1 025 502 288 424
(a) Officially recorded under the heading `Siliceous fossil meals and similar siliceous earths? Excludes flux calcined.
Dolomite (see Limestone)

43
Feldspar
United Kingdom summary 2006-2010
Commodity 2006 2007 2008 2009 2010 2006 2007 2008 2009 2010 Tonnes £ thousand
Feldspar
Production
China stone (a) 1 441 1 112 430 — —
Imports
Feldspar 17 098 26 751 18 899 9 299 17 584 1 096 1 687 1 406 661 1 813
Nepheline-syenite 81 960 40 484 44 275 32 462 39 092 4 201 3 617 4 355 3 516 4 038
Exports
Feldspar 38 40 82 369 38 121 20 28 30 20
Nepheline-syenite 557 2 430 902 204 291 271 635 520 62 83
(a) Including weathered granite feldspar.
Fireclay
United Kingdom summary 2006-2010
Commodity 2006 2007 2008 2009 2010 2006 2007 2008 2009 2010 Tonnes £ thousand
Fireclay
Production (a) 228 000 338 000 180 000 129 000 110 000
Imports
Fireclay 1 279 1 467 2 556 2 273 2 644 377 244 402 514 661
Fireclay bricks etc 7 651 8 166 7 070 3 229 2 103 2 800 3 478 4 960 1 509 1 552
Refractory hollow-ware 1 969 1 357 2 272 2 090 1 622 2 688 2 670 3 557 4 306 3 614
Exports
Fireclay 179 94 54 92 9 117 79 33 62 24
Fireclay bricks etc 2 676 3 283 4 347 3 455 2 587 4 800 3 957 5 319 4 441 3 093
Refractory hollow-ware 2 989 2 386 1 274 1 297 890 15 361 16 218 17 071 14 687 13 212
(a) Great Britain only. There is a small, undisclosed production in Northern Ireland.
Fluorspar
United Kingdom summary 2006-2010
Commodity 2006 2007 2008 2009 2010 2006 2007 2008 2009 2010 Tonnes £ thousand
Fluorspar
Production 49 676 44 936 36 801 18 536 26 420
Imports 6 620 3 875 8 429 6 436 1 294 976 1 040 2 389 2 574 599
Exports 3 016 589 187 303 412 476 304 156 184 1 345
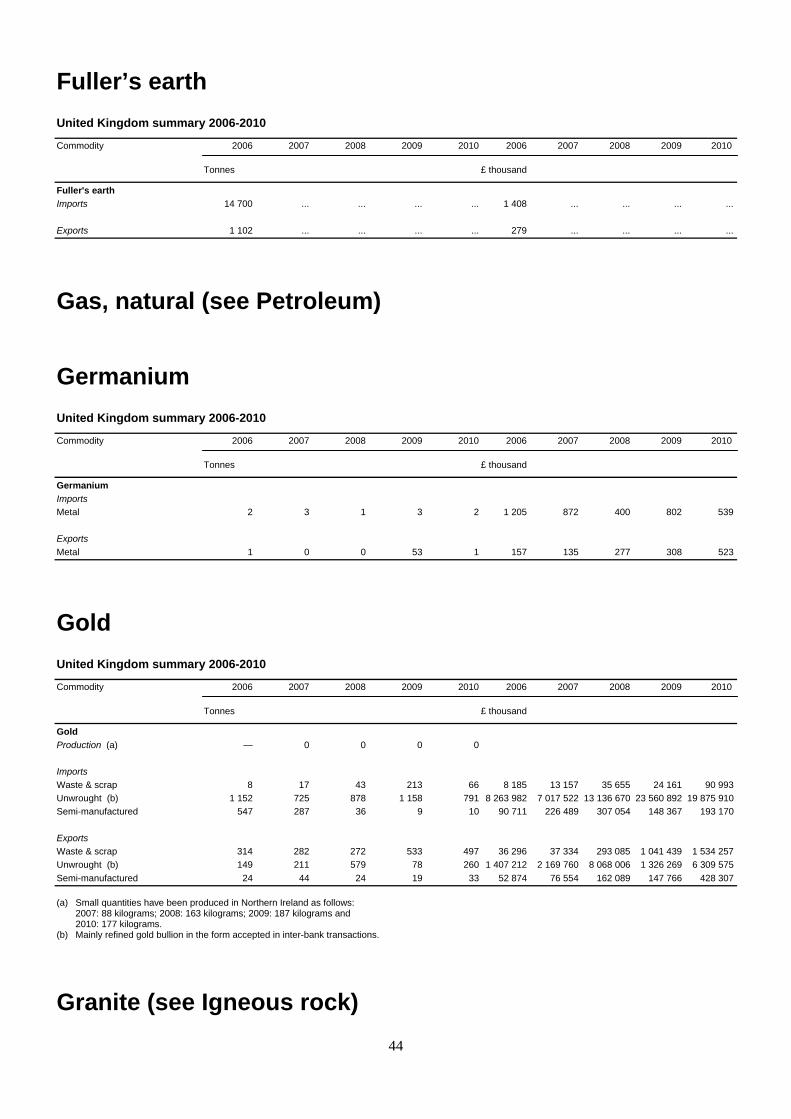
44
Fuller’s earth
United Kingdom summary 2006-2010
Commodity 2006 2007 2008 2009 2010 2006 2007 2008 2009 2010 Tonnes £ thousand
Fuller's earth
Imports 14 700 ... ... ... ... 1 408 ... ... ... ...
Exports 1 102 ... ... ... ... 279 ... ... ... ...
Gas, natural (see Petroleum)
Germanium
United Kingdom summary 2006-2010
Commodity 2006 2007 2008 2009 2010 2006 2007 2008 2009 2010 Tonnes £ thousand
Germanium
Imports
Metal 2 3 1 3 2 1 205 872 400 802 539
Exports
Metal 1 0 0 53 1 157 135 277 308 523
Gold
United Kingdom summary 2006-2010
Commodity 2006 2007 2008 2009 2010 2006 2007 2008 2009 2010 Tonnes £ thousand
Gold
Production (a) — 0 0 0 0
Imports
Waste & scrap 8 17 43 213 66 8 185 13 157 35 655 24 161 90 993
Unwrought (b) 1 152 725 878 1 158 791 8 263 982 7 017 522 13 136 670 23 560 892 19 875 910
Semi-manufactured 547 287 36 9 10 90 711 226 489 307 054 148 367 193 170
Exports
Waste & scrap 314 282 272 533 497 36 296 37 334 293 085 1 041 439 1 534 257
Unwrought (b) 149 211 579 78 260 1 407 212 2 169 760 8 068 006 1 326 269 6 309 575
Semi-manufactured 24 44 24 19 33 52 874 76 554 162 089 147 766 428 307
(a) Small quantities have been produced in Northern Ireland as follows: 2007: 88 kilograms; 2008: 163 kilograms; 2009: 187 kilograms and 2010: 177 kilograms. (b) Mainly refined gold bullion in the form accepted in inter-bank transactions.
Granite (see Igneous rock)

45
Graphite
United Kingdom summary 2006-2010
Commodity 2006 2007 2008 2009 2010 2006 2007 2008 2009 2010 Tonnes £ thousand
Graphite
Imports
Natural graphite 16 978 17 225 14 309 7 850 6 989 9 243 8 642 7 766 5 516 5 468
Artificial graphite 15 334 16 112 20 728 10 813 16 290 15 435 15 136 21 815 18 104 21 622
Graphite crucibles etc 1 100 1 333 991 788 782 3 506 3 531 3 401 2 880 2 878
Exports
Natural graphite 2 979 3 065 3 156 2 271 2 981 3 183 3 760 3 906 3 015 3 032
Artificial graphite 9 300 8 765 6 792 5 450 6 894 10 537 11 275 17 974 13 008 14 909
Graphite crucibles etc 11 699 10 900 11 342 6 412 6 548 21 255 22 612 25 447 17 751 17 750
Gypsum
United Kingdom summary 2006-2010
Commodity 2006 2007 2008 2009 2010 2006 2007 2008 2009 2010 Tonnes £ thousand
Gypsum
Production
Gypsum, natural (a) 1 700 000 1 700 000 1 700 000 1 700 000 1 700 000
Imports
Gypsum-
Gypsum 369 714 196 613 140 783 396 138 216 605 8 415 8 511 8 522 8 104 6 957
Calcined gypsum (plasters) 92 069 52 678 88 766 60 337 54 209 10 976 10 674 12 433 13 540 12 728
Exports
Gypsum-
Gypsum 2 679 1 248 1 493 1 978 3 330 559 584 955 777 1 128
Calcined gypsum (plasters) 63 533 57 988 48 340 32 551 24 552 13 680 13 668 13 647 12 067 7 953
(a) BGS Estimates.
UK production of desulphogypsum 2001-2011 Thousand tonnes
2001 2002 2003 2004 2005 2006 2007 2008 2009 2010 2011
Drax 506 485 699 653 565 610 645 744 … … …
Ratcliffe-on-Soar 291 358 384 350 235 204 254 338 263 266 248
West Burton — — — 274 335 289 255 217 164 144 164
Eggborough — — — — 31 46 36 66 … 40 44
Cottam — — — — 19 196 257 225 164 210 208
Total 797 843 1 083 1 228 1 185 1 303 1 447 1 590 … … …
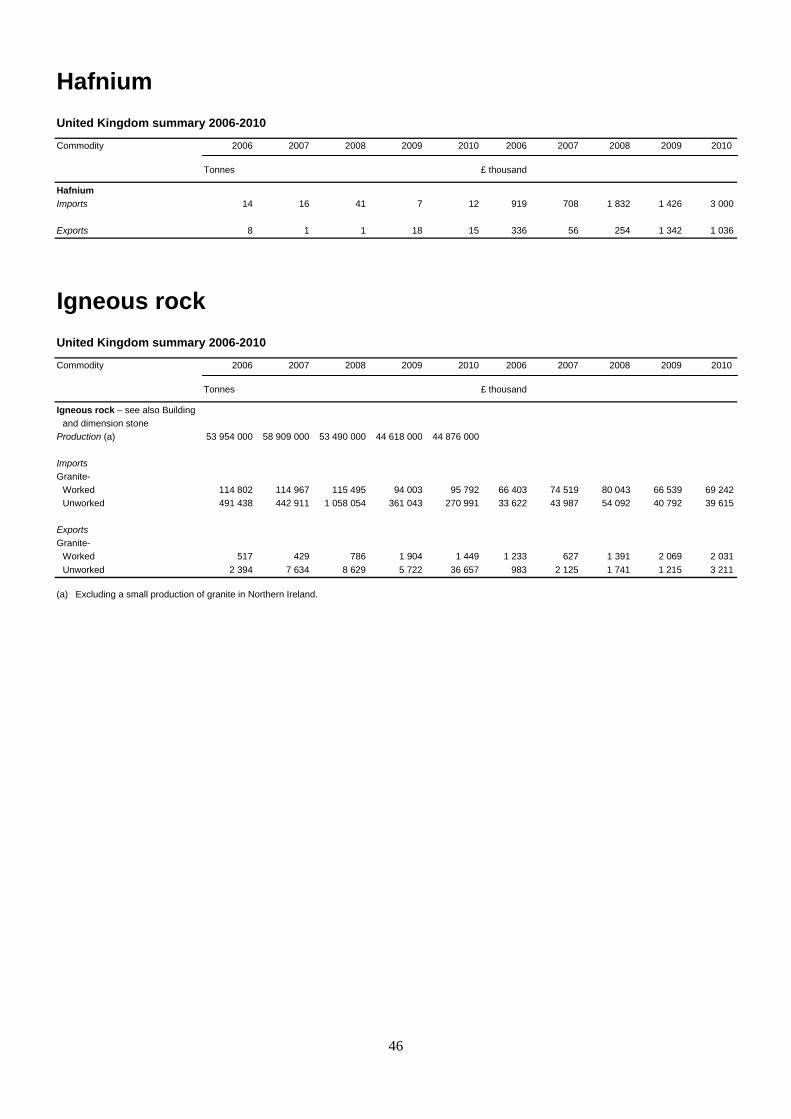
46
Hafnium
United Kingdom summary 2006-2010
Commodity 2006 2007 2008 2009 2010 2006 2007 2008 2009 2010 Tonnes £ thousand
Hafnium
Imports 14 16 41 7 12 919 708 1 832 1 426 3 000
Exports 8 1 1 18 15 336 56 254 1 342 1 036
Igneous rock
United Kingdom summary 2006-2010
Commodity 2006 2007 2008 2009 2010 2006 2007 2008 2009 2010 Tonnes £ thousand
Igneous rock – see also Building
and dimension stone
Production (a) 53 954 000 58 909 000 53 490 000 44 618 000 44 876 000
Imports
Granite-
Worked 114 802 114 967 115 495 94 003 95 792 66 403 74 519 80 043 66 539 69 242
Unworked 491 438 442 911 1 058 054 361 043 270 991 33 622 43 987 54 092 40 792 39 615
Exports
Granite-
Worked 517 429 786 1 904 1 449 1 233 627 1 391 2 069 2 031
Unworked 2 394 7 634 8 629 5 722 36 657 983 2 125 1 741 1 215 3 211
(a) Excluding a small production of granite in Northern Ireland.
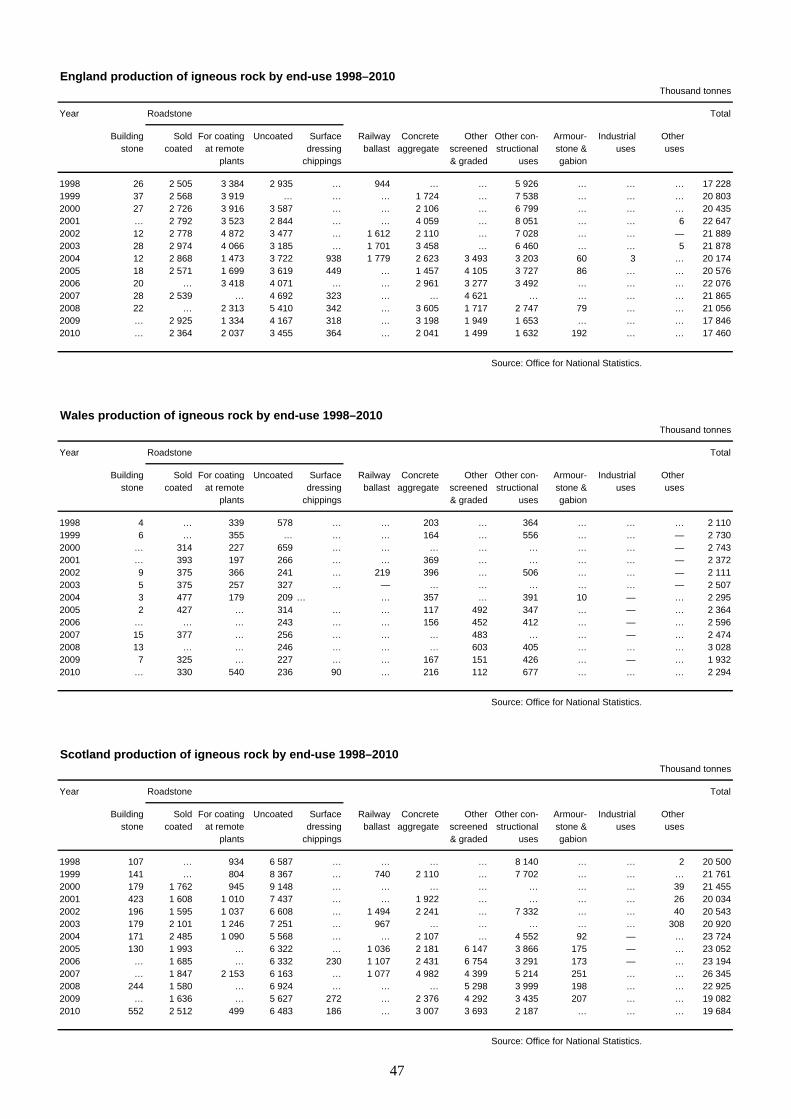
England production of igneous rock by end-use 1998–2010Thousand tonnes
Year Roadstone Total
Building Sold For coating Uncoated Surface Railway Concrete Other Other con- Armour- Industrial Otherstone coated at remote dressing ballast aggregate screened structional stone & uses uses
plants chippings & graded uses gabion
1998 26 2 505 3 384 2 935 … 944 … … 5 926 … … … 17 2281999 37 2 568 3 919 … … … 1 724 … 7 538 … … … 20 8032000 27 2 726 3 916 3 587 … … 2 106 … 6 799 … … … 20 4352001 … 2 792 3 523 2 844 … … 4 059 … 8 051 … … 6 22 6472002 12 2 778 4 872 3 477 … 1 612 2 110 … 7 028 … … — 21 8892003 28 2 974 4 066 3 185 … 1 701 3 458 … 6 460 … … 5 21 8782004 12 2 868 1 473 3 722 938 1 779 2 623 3 493 3 203 60 3 … 20 1742005 18 2 571 1 699 3 619 449 … 1 457 4 105 3 727 86 … … 20 5762006 20 … 3 418 4 071 … … 2 961 3 277 3 492 … … … 22 0762007 28 2 539 … 4 692 323 … … 4 621 … … … … 21 8652008 22 … 2 313 5 410 342 … 3 605 1 717 2 747 79 … … 21 0562009 … 2 925 1 334 4 167 318 … 3 198 1 949 1 653 … … … 17 8462010 … 2 364 2 037 3 455 364 … 2 041 1 499 1 632 192 … … 17 460
Source: Office for National Statistics.
Wales production of igneous rock by end-use 1998–2010Thousand tonnes
Year Roadstone Total
Building Sold For coating Uncoated Surface Railway Concrete Other Other con- Armour- Industrial Otherstone coated at remote dressing ballast aggregate screened structional stone & uses uses
plants chippings & graded uses gabion
1998 4 … 339 578 … … 203 … 364 … … … 2 1101999 6 … 355 … … … 164 … 556 … … — 2 7302000 … 314 227 659 … … … … … … … — 2 7432001 … 393 197 266 … … 369 … … … … — 2 3722002 9 375 366 241 … 219 396 … 506 … … — 2 1112003 5 375 257 327 … — … … … … … — 2 5072004 3 477 179 209 … … 357 … 391 10 — … 2 2952005 2 427 … 314 … … 117 492 347 … — … 2 3642006 … … … 243 … … 156 452 412 … — … 2 5962007 15 377 … 256 … … … 483 … … — … 2 4742008 13 … … 246 … … … 603 405 … … … 3 0282009 7 325 … 227 … … 167 151 426 … — … 1 9322010 … 330 540 236 90 … 216 112 677 … … … 2 294
Source: Office for National Statistics.
Scotland production of igneous rock by end-use 1998–2010Thousand tonnes
Year Roadstone Total
Building Sold For coating Uncoated Surface Railway Concrete Other Other con- Armour- Industrial Otherstone coated at remote dressing ballast aggregate screened structional stone & uses uses
plants chippings & graded uses gabion
1998 107 … 934 6 587 … … … … 8 140 … … 2 20 5001999 141 … 804 8 367 … 740 2 110 … 7 702 … … … 21 7612000 179 1 762 945 9 148 … … … … … … … 39 21 4552001 423 1 608 1 010 7 437 … … 1 922 … … … … 26 20 0342002 196 1 595 1 037 6 608 … 1 494 2 241 … 7 332 … … 40 20 5432003 179 2 101 1 246 7 251 … 967 … … … … … 308 20 9202004 171 2 485 1 090 5 568 … … 2 107 … 4 552 92 — … 23 7242005 130 1 993 … 6 322 … 1 036 2 181 6 147 3 866 175 — … 23 0522006 … 1 685 … 6 332 230 1 107 2 431 6 754 3 291 173 — … 23 1942007 … 1 847 2 153 6 163 … 1 077 4 982 4 399 5 214 251 … … 26 3452008 244 1 580 … 6 924 … … … 5 298 3 999 198 … … 22 9252009 … 1 636 … 5 627 272 … 2 376 4 292 3 435 207 … … 19 0822010 552 2 512 499 6 483 186 … 3 007 3 693 2 187 … … … 19 684
Source: Office for National Statistics.
47

48
Insulating materials
United Kingdom summary 2006-2010
Commodity 2006 2007 2008 2009 2010 2006 2007 2008 2009 2010 Tonnes £ thousand
Insulating materials
Imports
Mineral wools (a) 44 986 36 100 24 135 25 128 24 427 34 486 34 748 32 142 34 156 33 505
Expanded minerals (b) 98 909 170 284 111 091 30 732 47 121 9 123 9 663 8 663 5 523 7 137
Other (c) 42 734 45 972 43 244 32 068 37 361 40 520 38 309 38 139 32 841 40 172
Exports
Mineral wools (a) 29 911 33 825 24 700 29 984 35 500 51 274 58 525 39 471 35 600 52 257
Expanded minerals (b) 18 844 20 009 19 581 10 973 14 174 17 693 18 668 22 236 14 126 17 959
Other (c) 65 952 57 570 58 762 42 351 56 989 66 845 61 163 70 153 57 472 74 706
(a) Slag wool, rock wool and similar mineral wools. (b) Exfoliated vermiculite, expanded clays, foaming slag and similar expanded mineral materials. (c) Mixtures and articles of heat-insulating, sound-insulating or sound-absorbing mineral materials.
Iodine
United Kingdom summary 2006-2010
Commodity 2006 2007 2008 2009 2010 2006 2007 2008 2009 2010 Tonnes £ thousand
Iodine
Imports 1 020 1 225 1 107 1 075 1 254 10 728 11 828 10 923 13 753 16 854
Exports 315 369 175 121 393 3 891 4 557 1 826 2 153 2 922
Iron compounds and earth colours
United Kingdom summary 2006-2010
Commodity 2006 2007 2008 2009 2010 2006 2007 2008 2009 2010 Tonnes £ thousand
Iron compounds and earth colours
Imports
Earth colours containing 70%
or more ferric oxide 122 136 74 213 210 34 48 25 217 147
Other iron compounds-
Oxides and hydroxides 37 755 37 993 36 145 21 412 21 516 23 389 22 333 25 271 18 624 21 396
Exports
Earth colours containing 70%
or more ferric oxide 20 79 450 543 68 34 150 646 598 100
Other iron compounds-
Oxides and hydroxides 7 894 7 265 7 784 4 313 5 070 9 193 8 593 11 318 7 723 7 582

49
Iron ore
United Kingdom summary 2006-2010
Commodity 2006 2007 2008 2009 2010 2006 2007 2008 2009 2010 Tonnes £ thousand
Iron ore
Production
Iron ore (a) 341 (b) 300 145 — —
Fe content (b) 190 170 80 — —
Consumption
Home-produced (b) 340 300 140 — —
Imported 16 538 800 16 607 000 15 338 400 11 171 300 10 572 200
Imports
Iron ore 16 370 705 17 435 472 15 282 786 9 185 919 10 597 085 539 498 644 177 938 415 468 519 912 896
Fe content (b) 9 000 000 10 600 000 9 300 000 5 600 000 6 400 000
Exports
Iron ore 5 229 5 396 7 731 32 579 5 228 1 256 1 734 953 3 014 634
(a) The Florence mine near Egremont, Cumbria closed in 2008. The mine produced high-grade hematite for foundry uses, mineral specimens and jewellery. The mine was also a tourist attraction. (b) BGS estimates.
Iron and steel
United Kingdom summary 2006-2010
Commodity 2006 2007 2008 2009 2010 2006 2007 2008 2009 2010 Tonnes £ thousand
Iron and steel
Production
Pig iron 10 695 700 10 959 800 10 136 800 7 671 100 7 233 000
Crude steel-
Alloy qualities 760 000 778 600 824 900 393 500 506 600
Other 13 828 600 13 613 700 12 695 600 9 681 000 9 201 400
Total 13 904 600 14 392 300 13 520 500 10 074 500 9 708 000
Consumption
Pig iron (a) 10 444 000 10 729 000 9 931 000 7 540 000 7 088 000
Finished steel (b) 12 813 000 12 832 000 11 808 000 7 030 000 8 830 000
Scrap 4 811 000 5 144 000 4 888 000 3 459 400 3 713 100
Imports
Pig iron 81 689 89 863 61 657 19 703 41 959 15 201 17 957 21 724 5 758 13 167
Shot, powder, sponge etc 34 768 25 772 27 003 17 483 97 745 28 676 27 009 26 470 15 722 31 682
Ferro-alloys 288 116 298 803 314 921 160 285 208 817 194 384 271 513 430 007 154 472 246 459
Iron and steel-
Ingots and other primary
forms 1 053 176 849 803 679 019 212 829 714 541 362 218 352 643 409 887 176 318 393 571
Scrap 154 967 204 100 228 294 213 818 270 986 84 007 159 432 133 546 80 685 160 388
Exports
Pig iron 5 407 15 892 2 523 27 765 4 339 1 114 4 353 2 308 5 254 3 351
Shot, powder, sponge etc 44 736 45 051 43 775 37 314 41 899 38 375 39 693 43 529 31 752 43 965
Ferro-alloys 41 879 41 841 40 986 28 899 45 314 389 373 361 635 365 568 125 266 240 287
Iron and steel-
Ingots and other primary
forms 2 692 654 3 514 850 3 348 794 2 118 701 1 137 160 1 012 574 1 450 504 1 619 056 936 583 818 397
Scrap 7 407 174 6 013 907 6 616 708 6 007 656 7 507 853 1 191 273 1 335 853 1 868 340 1 184 693 1 944 946
(a) Consumption in steel making only. (b) Net home disposals.

Consumption in the United Kingdom iron and steel industry 2001–2010Thousand tonnes
2001 2002 2003 2004 2005 2006 2007 2008 2009 2010
Iron ore – Home produced (a) 1 0 1 1 0 0 0 0 0 0 Imported (b) 15 108 13 181 15 766 16 011 15 990 16 539 16 607 15 338 11 171 10 572
Manganese ore 4 4 0 6 3 6 3 4 21 0g
Iron and steel scrap (f) 4 864 4 138 4 390 5 123 4 531 4 811 5 144 4 888 3 459 3 713
Pig iron (f) 9 713 8 312 9 955 10 010 9 983 10 444 10 729 9 931 7 540 7 088
Alloy metals (c) – Nickel 14 15 16 17 14 13 12 12 8 10 Molybdenum 2 2 2 2 2 2 2 3 1 1 Tungsten 0 0 0 0 0 0 0 0 0 0
Vanadium 1 1 0 0 0 0 0 0 0 0 Vanadium 1 1 0 0 0 0 0 0 0 0 Cobalt 0 0 0 0 0 0 0 0 0 0 Chromium 47 46 53 54 52 55 61 69 24 34 Niobium 0 0 0 0 0 0 0 1 0 0
Ferro-alloys – Ferro-manganese 91 77 94 95 92 97 100 94 70 67 Ferro-silico- manganese 24 21 23 23 22 24 24 23 17 16 Ferro-aluminium 3 3 3 3 3 3 3 3 2 2
Ferro chromium (d) (d) (d) (d) (d) (d) (d) (d) (d) (d) Ferro-chromium (d) (d) (d) (d) (d) (d) (d) (d) (d) (d) Ferro-silico- chromium (d) (d) (d) (d) (d) (d) (d) (d) (d) (d) Ferro-silicon 36 35 37 37 36 38 39 37 27 26 Ferro-silico- zirconium 0 0 0 0 0 0 0 0 0 0 Calcium silicide 0 0 0 0 0 0 0 0 0 0 Ferro-phosphorus 1 1 1 1 1 1 1 1 1 1 Ferro-niobium (d) (d) (d) (d) (d) (d) (d) (d) (d) (d) Ferro-titanium 1 1 1 1 1 1 1 1 1 1
Dolomite (raw and burnt) (e) 261 223 254 262 243 445 474 420 369 399Limestone (e) 1 889 1 684 2 019 2 068 1 951 2 028 1 822 1 664 1 095 948Lime (e) 561 501 530 584 593 631 585 496 378 371
Zinc for galvanising 64 66 62 53 57 60 58 52 41 49Tin for tinplating 3 3 2 3 3 2 3 3 2 3
Average Fe content: (a) 55% (b) 62% (e) Restricted to consumption in blast furnaces sinter plants and steelAverage Fe content: (a) 55%, (b) 62%. (e) Restricted to consumption in blast furnaces, sinter plants and steel(c) Metal content. furnaces.(d) Included under alloying metals. (f) Consumption in steel making only.
Source: Iron and Steel Statistics Bureau.
50

51
Lead
United Kingdom summary 2006-2010
Commodity 2006 2007 2008 2009 2010 2006 2007 2008 2009 2010 Tonnes £ thousand
Lead Production
Concentrate-
Pb content (a) (b) 400 (b) 300 (b) 300 243 251
Unwrought-
Bullion 36 000 36 000 36 000 36 000 36 000
Refined
Primary (c) 174 703 119 000 139 000 157 865 153 453
Secondary 144 000 144 000 144 000 144 000 144 000
Consumption
Refined 300 000 244 800 222 123 188 726 207 618
Imports
Ores & concentrates 78 72 116 24 23 94 91 169 30 42
Ash and residues 447 443 423 133 186 148 670 200 90 153
Scrap 5 914 17 685 4 621 4 962 8 858 4 098 15 842 5 287 4 695 9 957
Unwrought
Unrefined-
Base bullion (d) 120 871 119 726 194 113 130 312 151 653 130 338 191 196 252 593 194 998 297 843
Other 2 745 3 160 1 190 1 300 0 2 224 3 446 1 698 1 180 41
Refined 50 504 28 020 18 379 14 179 14 359 32 754 33 596 22 523 14 569 18 682
Alloys 644 7 19 924 1 798 787 517 35 24 743 2 741 1 681
Exports
Ores & concentrates 202 19 177 67 11 147 91 277 98 37
Ash and residues 484 704 535 515 982 113 300 536 327 560
Scrap 1 859 31 942 47 660 56 055 69 404 1 364 31 087 44 505 48 579 74 457
Unwrought
Unrefined
Base bullion 73 ... ... 0 21 72 ... ... 3 40
Other 3 074 1 257 1 725 45 1 226 596 825 1 854 38 1 635
Refined 86 124 66 895 77 795 126 697 103 988 66 656 92 463 96 383 144 935 152 672
Alloys 48 589 39 246 57 466 54 505 62 406 37 477 56 008 79 823 70 000 97 889
(a) By-product of Pennine fluorspar operations and of gold mining in Northern Ireland. (b) BGS estimate. (c) Refined from imported bullion including lead content of alloys. (d) Containing substantial quantities of silver.

52
Limestone, dolomite and chalk
United Kingdom summary 2006-2010
Commodity 2006 2007 2008 2009 2010 2006 2007 2008 2009 2010 Tonnes £ thousand
Limestone
Production
Limestone 80 228 000 83 491 000 74 145 000 60 111 000 56 985 000
Dolomite 12 101 000 7 622 000 5 509 000 3 164 000 4 540 000
Imports
Limestone flux (a) 22 067 32 446 38 404 24 368 14 954 1 615 1 679 1 699 1 764 1 758
Lime 20 681 23 946 11 452 9 091 9 883 2 388 2 747 1 887 1 235 1 627
Dolomite 111 177 146 587 146 620 149 802 149 695 3 135 3 721 4 954 4 612 4 961
Exports
Limestone flux (a) 307 136 348 347 261 462 226 165 225 551 5 744 4 894 3 168 2 763 3 161
Lime 101 138 103 928 115 728 95 357 106 075 11 740 12 831 13 946 13 382 13 442
Dolomite (b) 47 360 4 642 4 786 3 438 2 675 2 230 252 249 245 227
Chalk
Production (c) 7 376 000 7 566 000 5 874 000 4 047 000 3 626 000
Imports 4 249 5 689 5 447 3 878 9 341 315 450 716 627 1 074
Exports 36 918 34 594 126 594 30 890 22 504 1 670 2 082 4 510 1 870 1 542
(a) Including calcareous stone commonly used for the manufacture of lime or cement. (b) Crude. (c) Great Britain only. There is a small, undisclosed production in Northern Ireland.
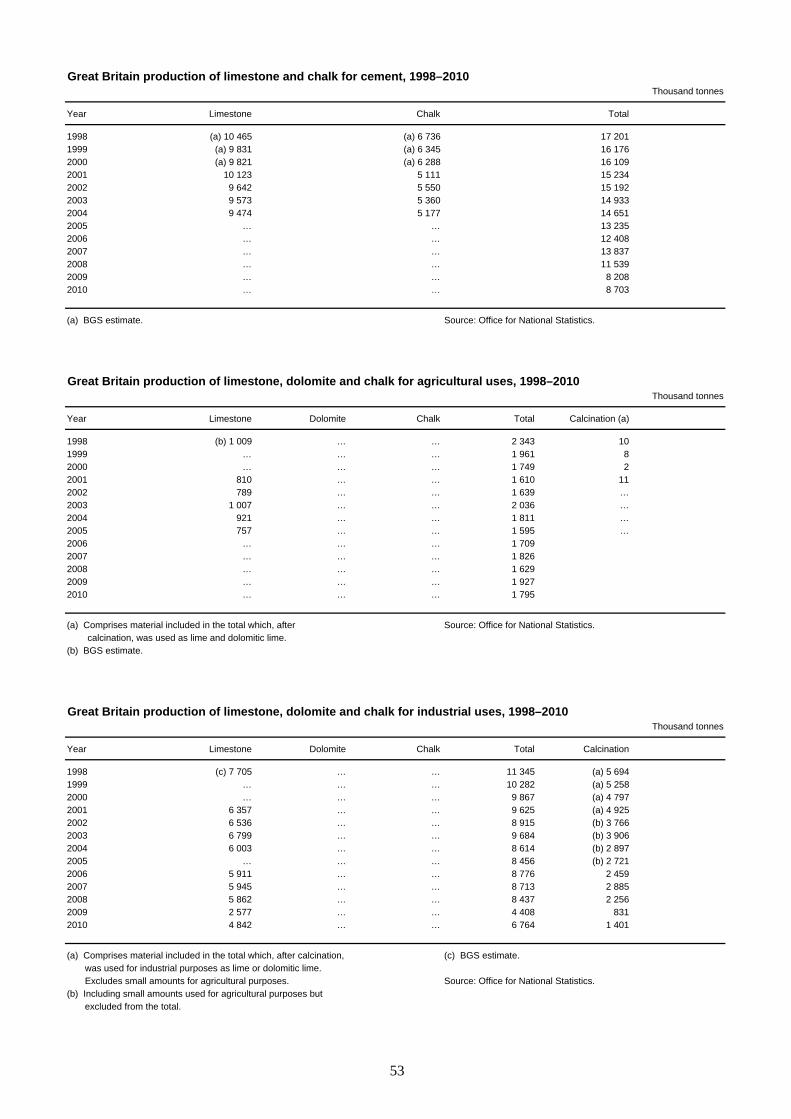
Great Britain production of limestone and chalk for cement, 1998–2010Thousand tonnes
Year Limestone Chalk Total
1998 (a) 10 465 (a) 6 736 17 2011999 (a) 9 831 (a) 6 345 16 1762000 (a) 9 821 (a) 6 288 16 1092001 10 123 5 111 15 2342002 9 642 5 550 15 1922003 9 573 5 360 14 9332004 9 474 5 177 14 6512005 … … 13 2352006 … … 12 4082007 … … 13 8372008 … … 11 5392009 … … 8 2082010 … … 8 703
(a) BGS estimate. Source: Office for National Statistics.
Great Britain production of limestone, dolomite and chalk for agricultural uses, 1998–2010Thousand tonnes
Year Limestone Dolomite Chalk Total Calcination (a)
1998 (b) 1 009 … … 2 343 101999 … … … 1 961 82000 … … … 1 749 22001 810 … … 1 610 112002 789 … … 1 639 …2003 1 007 … … 2 036 …2004 921 … … 1 811 …2005 757 … … 1 595 …2006 … … … 1 7092007 … … … 1 8262008 … … … 1 6292009 … … … 1 9272010 … … … 1 795
(a) Comprises material included in the total which, after Source: Office for National Statistics. calcination, was used as lime and dolomitic lime.(b) BGS estimate.
Great Britain production of limestone, dolomite and chalk for industrial uses, 1998–2010Thousand tonnes
Year Limestone Dolomite Chalk Total Calcination
1998 (c) 7 705 … … 11 345 (a) 5 6941999 … … … 10 282 (a) 5 2582000 … … … 9 867 (a) 4 7972001 6 357 … … 9 625 (a) 4 9252002 6 536 … … 8 915 (b) 3 7662003 6 799 … … 9 684 (b) 3 9062004 6 003 … … 8 614 (b) 2 8972005 … … … 8 456 (b) 2 7212006 5 911 … … 8 776 2 4592007 5 945 … … 8 713 2 8852008 5 862 … … 8 437 2 2562009 2 577 … … 4 408 8312010 4 842 … … 6 764 1 401
(a) Comprises material included in the total which, after calcination, (c) BGS estimate. was used for industrial purposes as lime or dolomitic lime. Excludes small amounts for agricultural purposes. Source: Office for National Statistics.(b) Including small amounts used for agricultural purposes but excluded from the total.
53

Great Britain production of limestone, dolomite and chalk for industrial uses by end-use, 1998–2010Thousand tonnes
Year Iron and steel Chemicals (a) Glass making Special fillers Asphalt fillers Building Water and effluent Total (a)making (a) materials treatment and
pollution control (a)
1998 … 2 047 375 … … 459 … 11 3451999 … 1 689 203 … … 460 … 10 2822000 … 1 864 … … 192 474 1 144 9 8672001 … 2 630 278 … 211 957 1 384 9 6252002 … … 233 1 759 164 … 1 154 8 9152003 … … … … 325 … … 9 6862004 … … … … 149 … … 8 6152005 … … … 1 131 126 577 … 8 4572006 4 390 … 280 983 … 624 … 8 7762007 4 319 … … 991 116 698 … 8 7142008 4 089 … … 928 105 529 1 362 8 4392009 2 822 102 200 834 95 122 233 4 4082010 3 035 … … 912 85 332 … 6 766
(a) Including material for calcination. Source: Office for National Statistics.
Great Britain production of limestone, dolomite and chalk for calcination by end-use, 1998–2010Thousand tonnes
Year Agriculture Iron and Steel Chemicals Building Others Totalmaterials
1998 10 3 035 2 047 459 153 5 7041999 8 2 970 1 689 460 139 5 2662000 2 2 301 1 864 474 158 4 7992001 11 1 248 2 630 957 90 4 9362002 … 1 228 1 922 537 … 3 7662003 … 1 353 1 858 … … 3 9062004 … 1 463 … … … 2 8972005 … 1 460 … … … 2 7212006 … 1 230 … … … 2 4592007 … 1 220 … … … 2 8852008 … 1 113 … … … 2 2562009 … … … … … 8312010 … … … … … 1 401
Source: Office for National Statistics.
Great Britain production of limestone, dolomite and chalk for iron and steel making, 1998–2010Thousand tonnes
Year Limestone Dolomite and Total Calcination (a)chalk
1998 3 346 … … 3 0351999 3 239 … … 2 9702000 2 500 … … 2 3012001 1 844 … … 1 2482002 1 866 … … 1 2282003 1 948 … … 1 3532004 1 592 … … 1 4632005 1 745 … … 1 4602006 … … 4 390 1 2302007 … … 4 319 1 2202008 … … 4 089 1 1132009 … … 2 822 …2010 … … 3 035 …
(a) Comprises material included in the total which, after Source: Office for National Statistics. calcination, was used as lime or dolomitic lime.
54
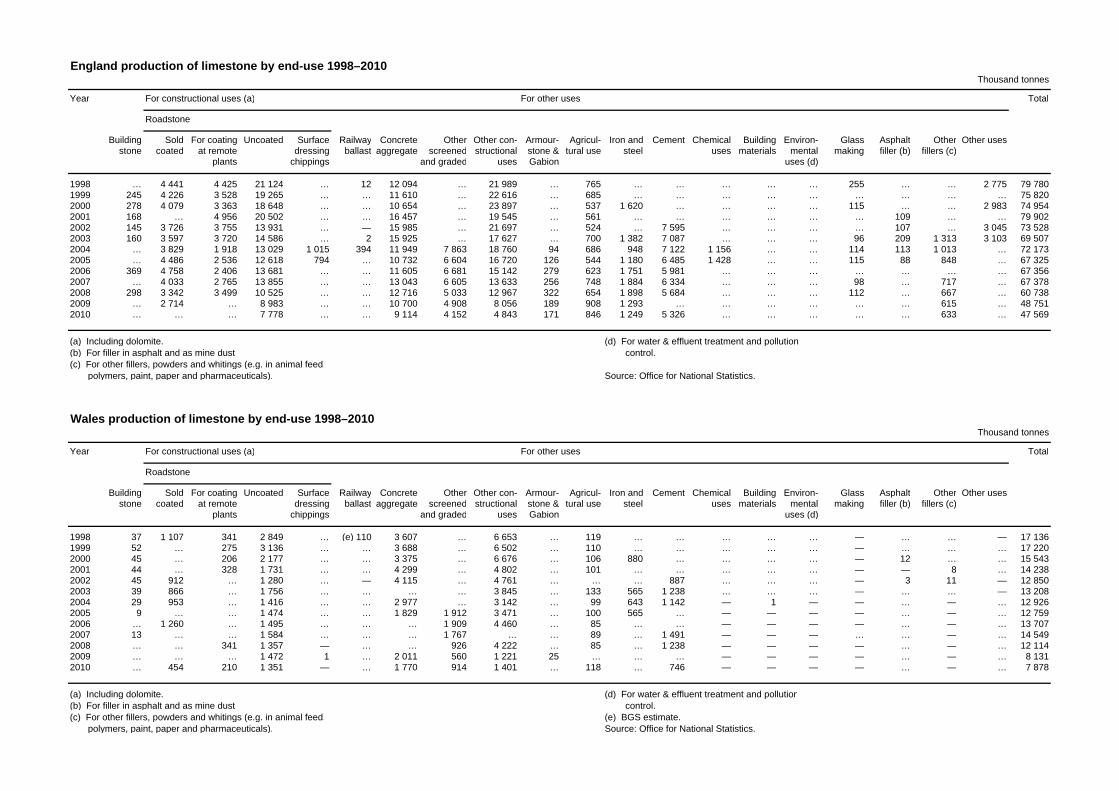
England production of limestone by end-use 1998–2010Thousand tonnes
Year For constructional uses (a) For other uses Total
Roadstone
Building Sold For coating Uncoated Surface Railway Concrete Other Other con- Armour- Agricul- Iron and Cement Chemical Building Environ- Glass Asphalt Other Other usesstone coated at remote dressing ballast aggregate screened structional stone & tural use steel uses materials mental making filler (b) fillers (c)
plants chippings and graded uses Gabion uses (d)
1998 … 4 441 4 425 21 124 … 12 12 094 … 21 989 … 765 … … … … … 255 … … 2 775 79 7801999 245 4 226 3 528 19 265 … … 11 610 … 22 616 … 685 … … … … … … … … … 75 8202000 278 4 079 3 363 18 648 … … 10 654 … 23 897 … 537 1 620 … … … … 115 … … 2 983 74 9542001 168 … 4 956 20 502 … … 16 457 … 19 545 … 561 … … … … … … 109 … … 79 9022002 145 3 726 3 755 13 931 … — 15 985 … 21 697 … 524 … 7 595 … … … … 107 … 3 045 73 5282003 160 3 597 3 720 14 586 … 2 15 925 … 17 627 … 700 1 382 7 087 … … … 96 209 1 313 3 103 69 5072004 … 3 829 1 918 13 029 1 015 394 11 949 7 863 18 760 94 686 948 7 122 1 156 … … 114 113 1 013 … 72 1732005 … 4 486 2 536 12 618 794 … 10 732 6 604 16 720 126 544 1 180 6 485 1 428 … … 115 88 848 … 67 3252006 369 4 758 2 406 13 681 … … 11 605 6 681 15 142 279 623 1 751 5 981 … … … … … … … 67 3562007 … 4 033 2 765 13 855 … … 13 043 6 605 13 633 256 748 1 884 6 334 … … … 98 … 717 … 67 3782008 298 3 342 3 499 10 525 … … 12 716 5 033 12 967 322 654 1 898 5 684 … … … 112 … 667 … 60 7382009 … 2 714 … 8 983 … … 10 700 4 908 8 056 189 908 1 293 … … … … … … 615 … 48 7512010 … … … 7 778 … … 9 114 4 152 4 843 171 846 1 249 5 326 … … … … … 633 … 47 569
(a) Including dolomite. (d) For water & effluent treatment and pollution (b) For filler in asphalt and as mine dust. control.(c) For other fillers, powders and whitings (e.g. in animal feed, polymers, paint, paper and pharmaceuticals). Source: Office for National Statistics.
Wales production of limestone by end-use 1998–2010Thousand tonnes
Year For constructional uses (a) For other uses Total
Roadstone
Building Sold For coating Uncoated Surface Railway Concrete Other Other con- Armour- Agricul- Iron and Cement Chemical Building Environ- Glass Asphalt Other Other usesstone coated at remote dressing ballast aggregate screened structional stone & tural use steel uses materials mental making filler (b) fillers (c)
plants chippings and graded uses Gabion uses (d)
1998 37 1 107 341 2 849 … (e) 110 3 607 … 6 653 … 119 … … … … … — … … — 17 1361999 52 … 275 3 136 … … 3 688 … 6 502 … 110 … … … … … — … … … 17 2202000 45 … 206 2 177 … … 3 375 … 6 676 … 106 880 … … … … — 12 … … 15 5432001 44 … 328 1 731 … … 4 299 … 4 802 … 101 … … … … … — — 8 … 14 2382002 45 912 … 1 280 … — 4 115 … 4 761 … … … 887 … … … — 3 11 — 12 8502003 39 866 … 1 756 … … … … 3 845 … 133 565 1 238 … … … — … … — 13 2082004 29 953 … 1 416 … … 2 977 … 3 142 … 99 643 1 142 — 1 — — … — … 12 9262005 9 … … 1 474 … … 1 829 1 912 3 471 … 100 565 … — — — — … — … 12 7592006 … 1 260 … 1 495 … … … 1 909 4 460 … 85 … … — — — — … — … 13 7072007 13 … … 1 584 … … … 1 767 … … 89 … 1 491 — — — … … — … 14 5492008 … … 341 1 357 — … … 926 4 222 … 85 … 1 238 — — — — … — … 12 1142009 … … … 1 472 1 … 2 011 560 1 221 25 … … … — — — — … — … 8 1312010 … 454 210 1 351 — … 1 770 914 1 401 … 118 … 746 — — — — … — … 7 878
(a) Including dolomite. (d) For water & effluent treatment and pollution(b) For filler in asphalt and as mine dust. control.(c) For other fillers, powders and whitings (e.g. in animal feed, (e) BGS estimate. polymers, paint, paper and pharmaceuticals). Source: Office for National Statistics.
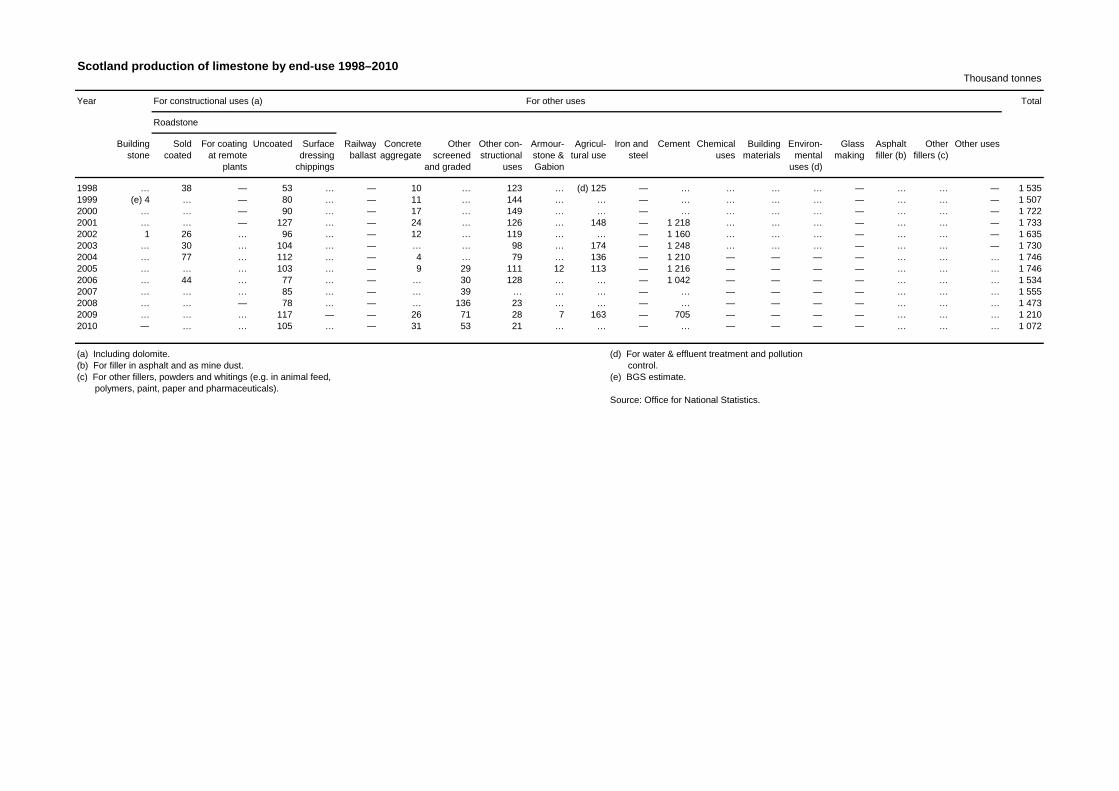
Scotland production of limestone by end-use 1998–2010Thousand tonnes
Year For constructional uses (a) For other uses Total
Roadstone
Building Sold For coating Uncoated Surface Railway Concrete Other Other con- Armour- Agricul- Iron and Cement Chemical Building Environ- Glass Asphalt Other Other usesstone coated at remote dressing ballast aggregate screened structional stone & tural use steel uses materials mental making filler (b) fillers (c)
plants chippings and graded uses Gabion uses (d)
1998 … 38 — 53 … — 10 … 123 … (d) 125 — … … … … — … … — 1 5351999 (e) 4 … — 80 … — 11 … 144 … … — … … … … — … … — 1 5072000 … … — 90 … — 17 … 149 … … — … … … … — … … — 1 7222001 … … — 127 … — 24 … 126 … 148 — 1 218 … … … — … … — 1 7332002 1 26 … 96 … — 12 … 119 … … — 1 160 … … … — … … — 1 6352003 … 30 … 104 … — … … 98 … 174 — 1 248 … … … — … … — 1 7302004 … 77 … 112 … — 4 … 79 … 136 — 1 210 — — — — … … … 1 7462005 … … … 103 … — 9 29 111 12 113 — 1 216 — — — — … … … 1 7462006 … 44 … 77 … — … 30 128 … … — 1 042 — — — — … … … 1 5342007 … … … 85 … — … 39 … … … — … — — — — … … … 1 5552008 … … — 78 … — … 136 23 … … — … — — — — … … … 1 4732009 … … … 117 — — 26 71 28 7 163 — 705 — — — — … … … 1 2102010 — … … 105 … — 31 53 21 … … — … — — — — … … … 1 072
(a) Including dolomite. (d) For water & effluent treatment and pollution(b) For filler in asphalt and as mine dust. control.(c) For other fillers, powders and whitings (e.g. in animal feed, (e) BGS estimate. polymers, paint, paper and pharmaceuticals).
Source: Office for National Statistics.
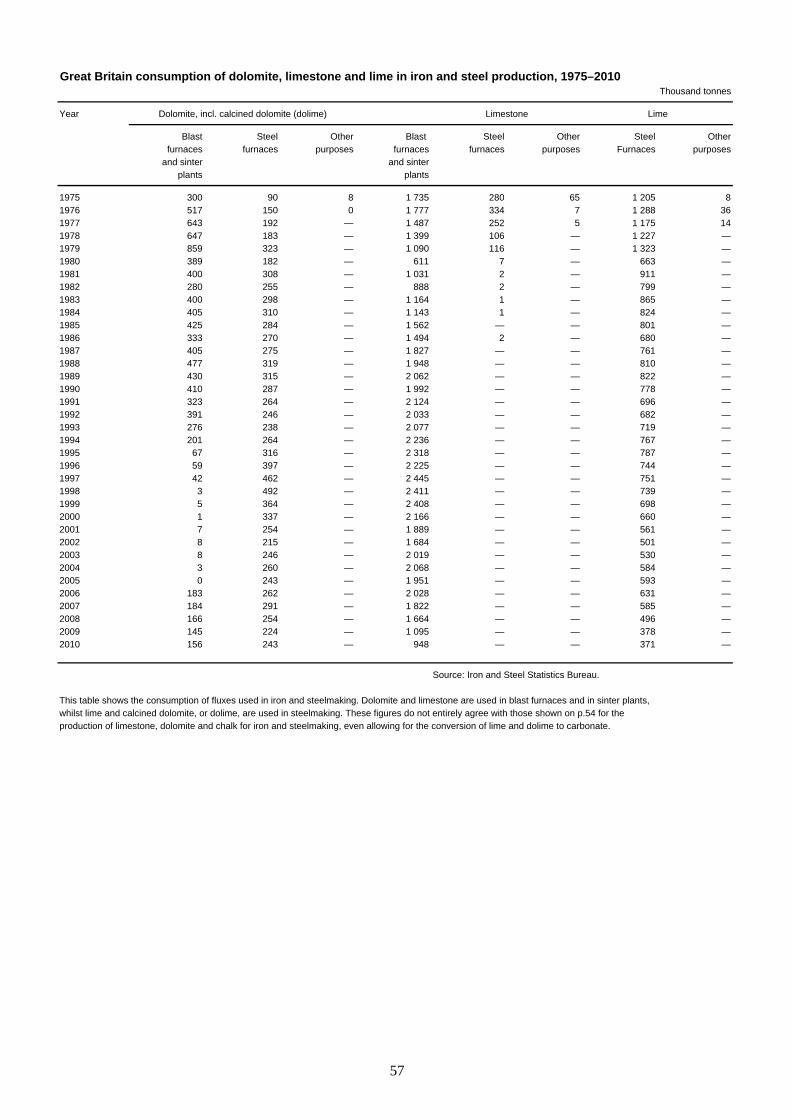
Great Britain consumption of dolomite, limestone and lime in iron and steel production, 1975–2010Thousand tonnes
Year
Blast Steel Other Blast Steel Other Steel Otherfurnaces furnaces purposes furnaces furnaces purposes Furnaces purposes
and sinter and sinterplants plants
1975 300 90 8 1 735 280 65 1 205 81976 517 150 0 1 777 334 7 1 288 361977 643 192 — 1 487 252 5 1 175 141978 647 183 — 1 399 106 — 1 227 —1979 859 323 — 1 090 116 — 1 323 —1980 389 182 — 611 7 — 663 —1981 400 308 — 1 031 2 — 911 —1982 280 255 — 888 2 — 799 —1983 400 298 — 1 164 1 — 865 —1984 405 310 — 1 143 1 — 824 —1985 425 284 — 1 562 — — 801 —1986 333 270 — 1 494 2 — 680 —1987 405 275 — 1 827 — — 761 —1988 477 319 — 1 948 — — 810 —1989 430 315 — 2 062 — — 822 —1990 410 287 — 1 992 — — 778 —1991 323 264 — 2 124 — — 696 —1992 391 246 — 2 033 — — 682 —1993 276 238 — 2 077 — — 719 —1994 201 264 — 2 236 — — 767 —1995 67 316 — 2 318 — — 787 —1996 59 397 — 2 225 — — 744 —1997 42 462 — 2 445 — — 751 —1998 3 492 — 2 411 — — 739 —1999 5 364 — 2 408 — — 698 —2000 1 337 — 2 166 — — 660 —2001 7 254 — 1 889 — — 561 —2002 8 215 — 1 684 — — 501 —2003 8 246 — 2 019 — — 530 —2004 3 260 — 2 068 — — 584 —2005 0 243 — 1 951 — — 593 —2006 183 262 — 2 028 — — 631 —2007 184 291 — 1 822 — — 585 —2008 166 254 — 1 664 — — 496 —2009 145 224 — 1 095 — — 378 —2010 156 243 — 948 — — 371 —
Source: Iron and Steel Statistics Bureau.
This table shows the consumption of fluxes used in iron and steelmaking. Dolomite and limestone are used in blast furnaces and in sinter plants,whilst lime and calcined dolomite, or dolime, are used in steelmaking. These figures do not entirely agree with those shown on p.54 for theproduction of limestone, dolomite and chalk for iron and steelmaking, even allowing for the conversion of lime and dolime to carbonate.
Dolomite, incl. calcined dolomite (dolime) LimeLimestone
57

Great Britain production of dolomite by end-use 1998–2010Thousand tonnes
Year Building Constructional Agricultural Other Totalstone use (a) use (b) uses (b)
1998 10 13 070 … … 15 6321999 14 11 833 … … 13 6982000 15 11 409 … … 13 0692001 34 12 381 … … 14 3142002 9 11 839 … … 12 9462003 7 10 391 … … …2004 8 10 832 … … 12 2262005 … … … … 11 5142006 … 10 283 … … 12 1002007 … 5 898 … … 7 6222008 2 3 918 … … 5 5102009 … 1 954 … … 3 1642010 … 3 222 … … 4 540
(a) Data also included in table for ‘Limestone’. Source: Office for National Statistics.(b) Including material for calcination.
England (d) production of dolomite by end-use 1998–2010Thousand tonnes
Year Building Constructional Agricultural Other Totalstone use (a) use (b) uses (b)
1998 … 11 289 … … 13 7231999 … 9 681 … … 11 4852000 15 9 509 … … 11 1202001 … … 426 … …2002 9 … 543 … …2003 7 … 676 … 10 3272004 8 … … … …2005 … 8 177 568 … …2006 … 8 434 … … 10 2382007 … … 601 … …2008 2 … 539 … …2009 … … 408 … …2010 … … … … …
(a) Data also included in table for ‘Limestone’. (d) Small amounts of dolomite are also produced in(b) Including material for calcination. Wales and very minor amounts in Scotland.(c) BGS estimate.
Source: Office for National Statistics.
England production of chalk by end-use 1998–2010Thousand tonnes
Year Cement Construc- Agricultural Industrial Totaltional use use uses
1998 (a) 6 736 768 … 397 9 9341999 (a) 6 345 1 021 … … 9 6672000 (a) 6 288 683 … 352 9 2132001 5 111 925 … … 8 2052002 5 550 904 … … 8 5872003 5 360 561 … … 8 0662004 5 177 705 … … 7 9972005 … 795 … … 7 1052006 … 681 … … 7 3762007 … 698 … … 7 5652008 … 497 … … 5 8742009 … 530 … … 4 0472010 … 312 … … 3 626
(a) BGS estimate. Source: Office for National Statistics.
58
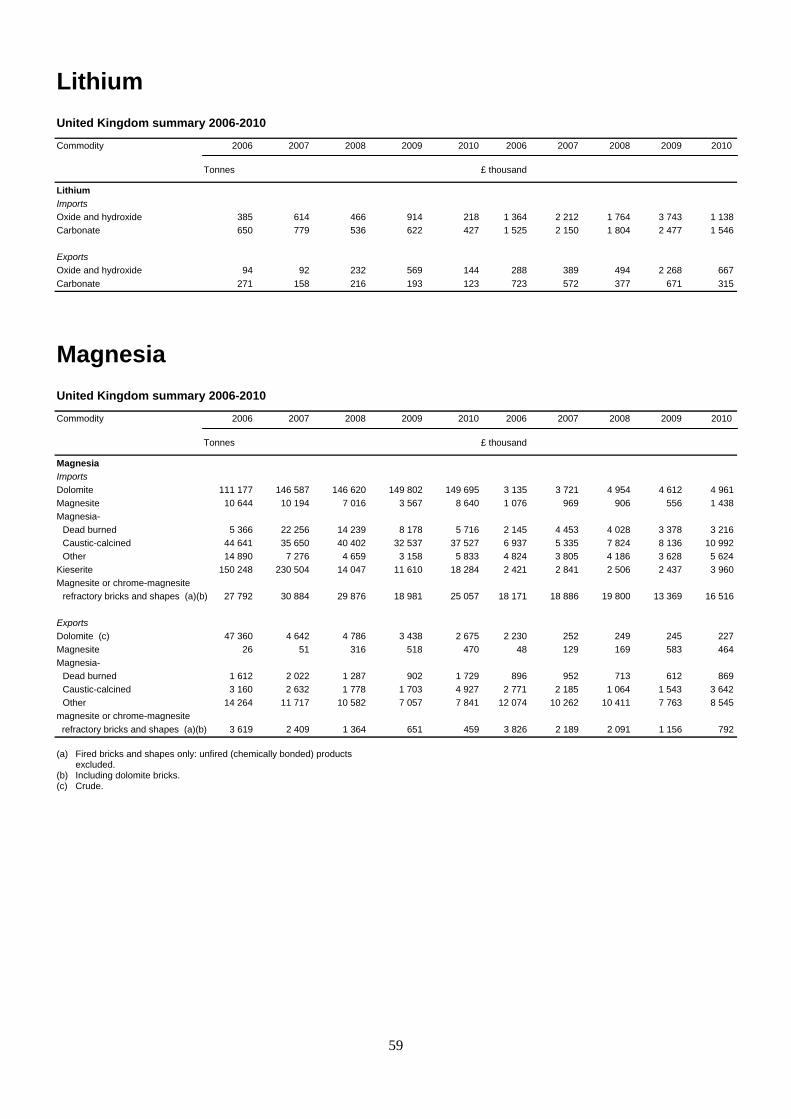
59
Lithium
United Kingdom summary 2006-2010
Commodity 2006 2007 2008 2009 2010 2006 2007 2008 2009 2010 Tonnes £ thousand
Lithium
Imports
Oxide and hydroxide 385 614 466 914 218 1 364 2 212 1 764 3 743 1 138
Carbonate 650 779 536 622 427 1 525 2 150 1 804 2 477 1 546
Exports
Oxide and hydroxide 94 92 232 569 144 288 389 494 2 268 667
Carbonate 271 158 216 193 123 723 572 377 671 315
Magnesia
United Kingdom summary 2006-2010
Commodity 2006 2007 2008 2009 2010 2006 2007 2008 2009 2010 Tonnes £ thousand
Magnesia
Imports
Dolomite 111 177 146 587 146 620 149 802 149 695 3 135 3 721 4 954 4 612 4 961
Magnesite 10 644 10 194 7 016 3 567 8 640 1 076 969 906 556 1 438
Magnesia-
Dead burned 5 366 22 256 14 239 8 178 5 716 2 145 4 453 4 028 3 378 3 216
Caustic-calcined 44 641 35 650 40 402 32 537 37 527 6 937 5 335 7 824 8 136 10 992
Other 14 890 7 276 4 659 3 158 5 833 4 824 3 805 4 186 3 628 5 624
Kieserite 150 248 230 504 14 047 11 610 18 284 2 421 2 841 2 506 2 437 3 960
Magnesite or chrome-magnesite
refractory bricks and shapes (a)(b) 27 792 30 884 29 876 18 981 25 057 18 171 18 886 19 800 13 369 16 516
Exports
Dolomite (c) 47 360 4 642 4 786 3 438 2 675 2 230 252 249 245 227
Magnesite 26 51 316 518 470 48 129 169 583 464
Magnesia-
Dead burned 1 612 2 022 1 287 902 1 729 896 952 713 612 869
Caustic-calcined 3 160 2 632 1 778 1 703 4 927 2 771 2 185 1 064 1 543 3 642
Other 14 264 11 717 10 582 7 057 7 841 12 074 10 262 10 411 7 763 8 545
magnesite or chrome-magnesite
refractory bricks and shapes (a)(b) 3 619 2 409 1 364 651 459 3 826 2 189 2 091 1 156 792
(a) Fired bricks and shapes only: unfired (chemically bonded) products excluded. (b) Including dolomite bricks. (c) Crude.

60
Magnesium
United Kingdom summary 2006-2010
Commodity 2006 2007 2008 2009 2010 2006 2007 2008 2009 2010 Tonnes £ thousand
Magnesium
Imports
Ferro-silico-magnesium 3 810 2 303 1 614 512 931 1 738 1 168 1 744 536 1 006
Scrap 1 982 2 721 1 685 748 875 780 789 816 380 819
Unwrought 6 408 5 201 3 813 1 763 3 171 6 325 6 229 8 700 3 740 6 231
Unwrought alloys 7 197 3 904 3 618 2 386 4 252 7 376 4 557 8 351 6 222 9 054
Wrought 3 077 3 602 4 750 3 576 6 631 7 600 8 208 16 710 13 762 22 348
Exports
Ferro-silico-magnesium 653 917 976 458 366 441 807 1 231 709 457
Scrap 1 772 2 398 2 222 1 937 3 143 1 413 2 938 4 439 3 665 6 179
Unwrought 209 8 38 13 209 275 82 220 242 564
Unwrought alloys 4 872 4 911 4 062 2 470 1 872 12 601 11 559 14 155 13 412 11 007
Wrought 605 1 533 1 333 674 626 3 084 5 448 5 856 5 109 4 301
Manganese
United Kingdom summary 2006-2010
Commodity 2006 2007 2008 2009 2010 2006 2007 2008 2009 2010 Tonnes £ thousand
Manganese
Consumption in Iron and Steel
Industry
Ore 6 000 3 300 4 100 20 500 —
Ferro-manganese 96 770 100 100 93 990 69 770 67 560
Ferro-silico-manganese 23 620 24 430 22 940 17 030 16 490
Apparent consumption (a) 116 000 125 000 120 000 68 000 72 000
Imports
Ores & Concentrates (b) 8 458 1 569 4 133 941 1 517 431 433 1 045 613 678
Ferro-manganese 86 598 100 694 96 461 49 700 46 985 37 430 57 728 130 012 45 265 47 612
Ferro-silico-manganese 59 985 56 036 52 966 37 114 49 280 23 440 29 887 59 497 24 468 42 091
Scrap 1 60 751 83 155 1 99 1 528 172 285
Unwrought 8 169 6 728 7 895 3 295 4 499 6 752 9 303 15 160 4 488 7 178
Wrought 394 232 126 746 1 965 542 599 535 1 380 3 664
Oxides 7 216 9 646 7 913 5 438 9 344 1 813 1 979 3 348 3 009 4 433
Exports
Ores & Concentrates 200 114 244 65 97 192 88 207 90 62
Ferro-manganese 946 1 136 1 210 963 8 361 949 1 359 1 293 933 8 522
Ferro-silico-manganese 60 7 49 65 52 90 11 27 59 55
Scrap 0 ... 314 126 23 1 ... 103 37 7
Oxides 6 284 3 785 4 571 1 768 4 173 1 529 1 026 1 597 1 289 1 714
Metal (c) 2 000 2 100 3 200 2 200 2 000 2 500 3 600 6 400 4 600 4 100
(a) BGS estimates; see explanatory notes. (b) Including manganiferous iron ore. (c) BGS estimates, based on known imports into certain countries.

61
Marble
United Kingdom summary 2006-2010
Commodity 2006 2007 2008 2009 2010 2006 2007 2008 2009 2010 Tonnes £ thousand
Marble
Imports
Dimension stone-
Unworked 32 609 37 404 37 444 26 787 21 339 17 463 20 144 21 150 16 466 15 556
Worked 100 555 111 039 114 870 100 648 92 078 65 977 63 620 74 273 70 696 59 417
Crushed and powdered 245 601 248 711 233 499 177 802 190 740 10 242 11 217 12 482 8 586 10 558
Exports
Dimension stone-
Unworked 1 549 2 227 1 019 728 822 184 553 264 493 1 221
Worked 4 068 4 740 2 934 1 603 1 332 6 441 7 319 5 292 3 294 3 310
Crushed and powdered 1 176 3 229 2 637 1 723 830 213 641 484 317 271
Mercury
United Kingdom summary 2006-2010
Commodity 2006 2007 2008 2009 2010 2006 2007 2008 2009 2010 Tonnes £ thousand
Mercury
Imports
Elemental 2 3 2 1 22 107 91 57 29 71
Oxide ... ... ... ... ... ... ... ... ... ...
Exports
Elemental 79 4 6 179 9 491 59 102 741 194
Oxide 1 ... ... ... ... 10 ... ... ... ...
Mica
United Kingdom summary 2006-2010
Commodity 2006 2007 2008 2009 2010 2006 2007 2008 2009 2010 Tonnes £ thousand
Mica
Imports
Crude (a) 251 289 377 328 43 108 92 129 139 20
Ground 5 856 6 705 7 061 6 396 7 341 1 824 1 831 2 308 1 862 2 225
Waste 3 474 3 433 2 030 49 902 404 476 336 4 245
Worked 726 919 1 310 604 654 4 861 4 277 5 357 5 023 4 317
Exports
Crude (a) 0 2 14 4 12 1 2 28 2 5
Ground 4 593 3 818 4 735 3 928 4 125 4 694 2 835 3 612 3 741 3 679
Waste ... 0 ... 12 ... ... 6 ... 11 ...
Worked 412 629 690 650 706 4 844 6 065 8 310 6 395 7 595
(a) Including sheets or splitting.
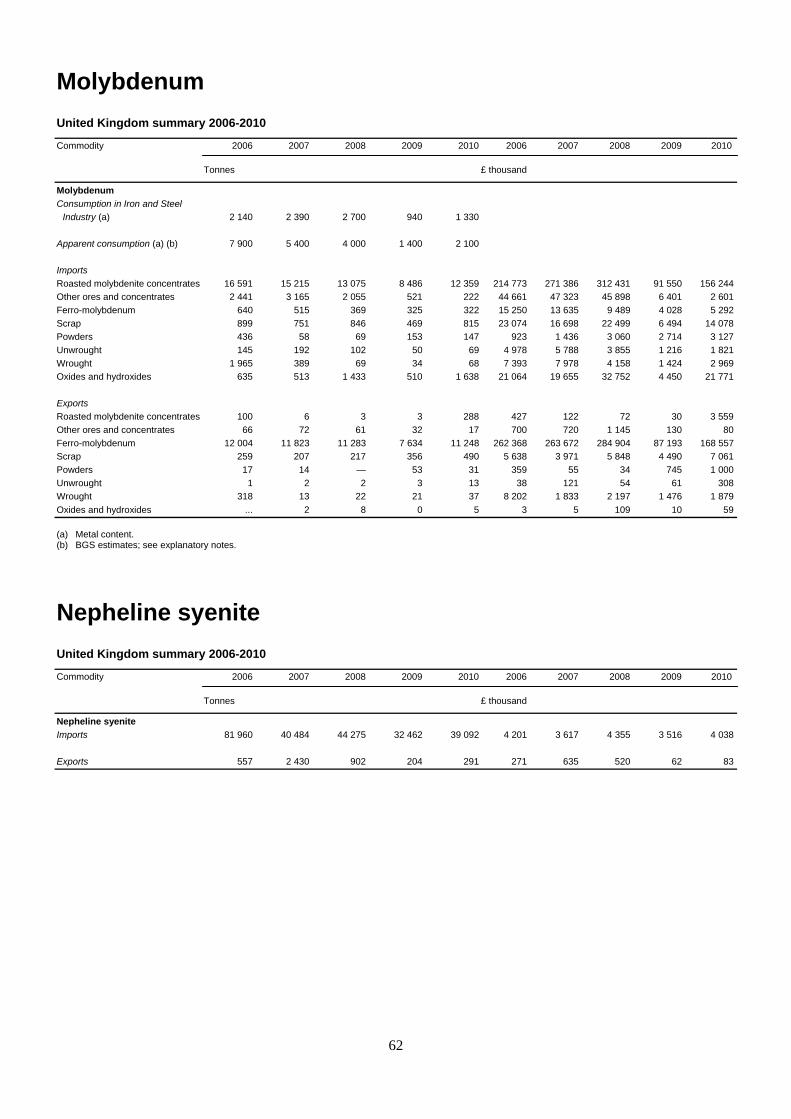
62
Molybdenum
United Kingdom summary 2006-2010
Commodity 2006 2007 2008 2009 2010 2006 2007 2008 2009 2010 Tonnes £ thousand
Molybdenum
Consumption in Iron and Steel
Industry (a) 2 140 2 390 2 700 940 1 330
Apparent consumption (a) (b) 7 900 5 400 4 000 1 400 2 100
Imports
Roasted molybdenite concentrates 16 591 15 215 13 075 8 486 12 359 214 773 271 386 312 431 91 550 156 244
Other ores and concentrates 2 441 3 165 2 055 521 222 44 661 47 323 45 898 6 401 2 601
Ferro-molybdenum 640 515 369 325 322 15 250 13 635 9 489 4 028 5 292
Scrap 899 751 846 469 815 23 074 16 698 22 499 6 494 14 078
Powders 436 58 69 153 147 923 1 436 3 060 2 714 3 127
Unwrought 145 192 102 50 69 4 978 5 788 3 855 1 216 1 821
Wrought 1 965 389 69 34 68 7 393 7 978 4 158 1 424 2 969
Oxides and hydroxides 635 513 1 433 510 1 638 21 064 19 655 32 752 4 450 21 771
Exports
Roasted molybdenite concentrates 100 6 3 3 288 427 122 72 30 3 559
Other ores and concentrates 66 72 61 32 17 700 720 1 145 130 80
Ferro-molybdenum 12 004 11 823 11 283 7 634 11 248 262 368 263 672 284 904 87 193 168 557
Scrap 259 207 217 356 490 5 638 3 971 5 848 4 490 7 061
Powders 17 14 — 53 31 359 55 34 745 1 000
Unwrought 1 2 2 3 13 38 121 54 61 308
Wrought 318 13 22 21 37 8 202 1 833 2 197 1 476 1 879
Oxides and hydroxides ... 2 8 0 5 3 5 109 10 59
(a) Metal content. (b) BGS estimates; see explanatory notes.
Nepheline syenite
United Kingdom summary 2006-2010
Commodity 2006 2007 2008 2009 2010 2006 2007 2008 2009 2010 Tonnes £ thousand
Nepheline syenite
Imports 81 960 40 484 44 275 32 462 39 092 4 201 3 617 4 355 3 516 4 038
Exports 557 2 430 902 204 291 271 635 520 62 83
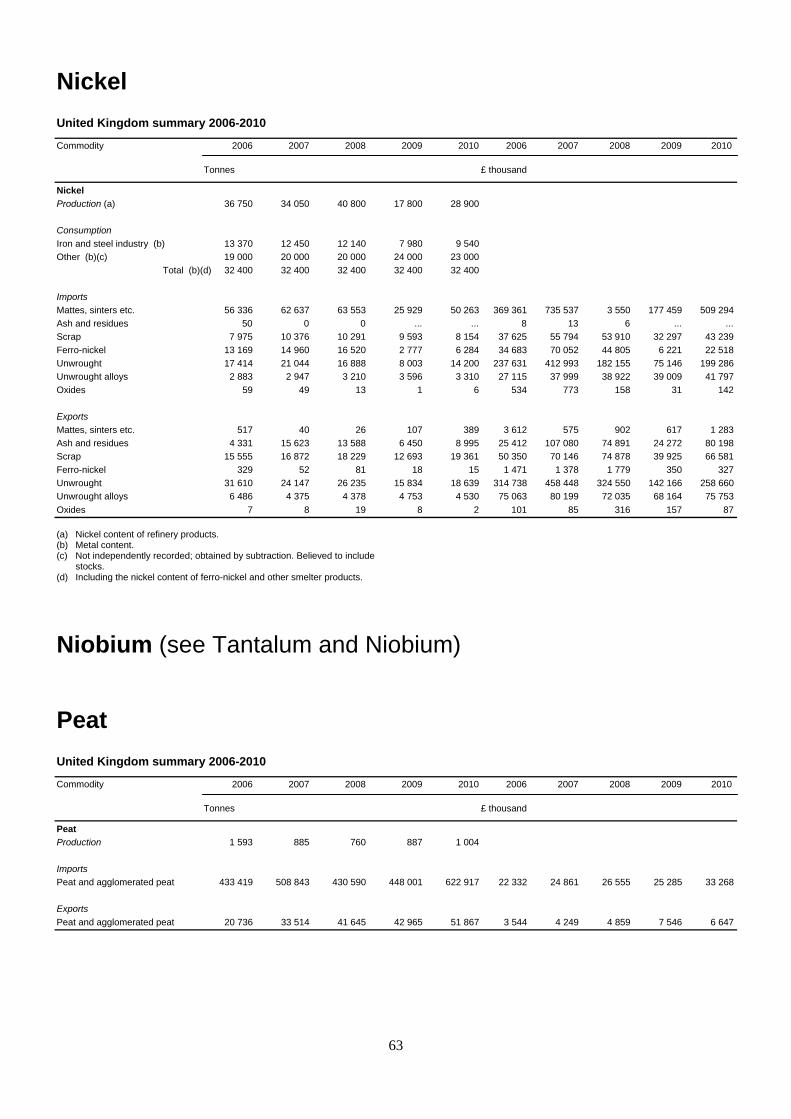
63
Nickel
United Kingdom summary 2006-2010
Commodity 2006 2007 2008 2009 2010 2006 2007 2008 2009 2010 Tonnes £ thousand
Nickel
Production (a) 36 750 34 050 40 800 17 800 28 900
Consumption
Iron and steel industry (b) 13 370 12 450 12 140 7 980 9 540
Other (b)(c) 19 000 20 000 20 000 24 000 23 000
Total (b)(d) 32 400 32 400 32 400 32 400 32 400
Imports
Mattes, sinters etc. 56 336 62 637 63 553 25 929 50 263 369 361 735 537 3 550 177 459 509 294
Ash and residues 50 0 0 ... ... 8 13 6 ... ...
Scrap 7 975 10 376 10 291 9 593 8 154 37 625 55 794 53 910 32 297 43 239
Ferro-nickel 13 169 14 960 16 520 2 777 6 284 34 683 70 052 44 805 6 221 22 518
Unwrought 17 414 21 044 16 888 8 003 14 200 237 631 412 993 182 155 75 146 199 286
Unwrought alloys 2 883 2 947 3 210 3 596 3 310 27 115 37 999 38 922 39 009 41 797
Oxides 59 49 13 1 6 534 773 158 31 142
Exports
Mattes, sinters etc. 517 40 26 107 389 3 612 575 902 617 1 283
Ash and residues 4 331 15 623 13 588 6 450 8 995 25 412 107 080 74 891 24 272 80 198
Scrap 15 555 16 872 18 229 12 693 19 361 50 350 70 146 74 878 39 925 66 581
Ferro-nickel 329 52 81 18 15 1 471 1 378 1 779 350 327
Unwrought 31 610 24 147 26 235 15 834 18 639 314 738 458 448 324 550 142 166 258 660
Unwrought alloys 6 486 4 375 4 378 4 753 4 530 75 063 80 199 72 035 68 164 75 753
Oxides 7 8 19 8 2 101 85 316 157 87
(a) Nickel content of refinery products. (b) Metal content. (c) Not independently recorded; obtained by subtraction. Believed to include stocks. (d) Including the nickel content of ferro-nickel and other smelter products.
Niobium (see Tantalum and Niobium)
Peat
United Kingdom summary 2006-2010
Commodity 2006 2007 2008 2009 2010 2006 2007 2008 2009 2010 Tonnes £ thousand
Peat
Production 1 593 885 760 887 1 004
Imports
Peat and agglomerated peat 433 419 508 843 430 590 448 001 622 917 22 332 24 861 26 555 25 285 33 268
Exports
Peat and agglomerated peat 20 736 33 514 41 645 42 965 51 867 3 544 4 249 4 859 7 546 6 647

64
Perlite
United Kingdom summary 2006-2010
Commodity 2006 2007 2008 2009 2010 2006 2007 2008 2009 2010 Tonnes £ thousand
Perlite
Imports 101 910 150 255 45 064 36 315 58 456 3 357 3 200 3 304 2 675 5 357
Exports 885 947 702 414 1 059 201 218 74 90 822
Petroleum (also see Primary fuels)
United Kingdom summary 2006-2010
Commodity 2006 2007 2008 2009 2010 2006 2007 2008 2009 2010 Tonnes £ thousand
Petroleum
Production
Crude petroleum 69 665 000 70 357 000 66 745 000 64 001 000 58 988 000
Condensates and other (a) 6 913 000 6 475 000 6 168 000 5 378 000 4 915 000
Refined petroleum products 82 839 000 81 278 000 81 278 000 74 893 000 72 871 000
Consumption (inland deliveries)
of refined products
Used as fuels-
Refineries 4 878 000 4 681 000 4 751 000 4 849 000 4 967 000
Power generation 1 527 000 1 390 000 1 982 000 1 783 000 1 343 000
Elsewhere 63 653 000 63 392 000 61 406 000 57 964 000 57 853 000
Not used as fuels 9 756 000 7 967 000 7 883 000 7 365 000 7 527 000
Total 79 812 000 77 428 000 76 119 000 71 962 000 71 691 000
Imports
Crude petroleum 55 735 570 44 129 689 52 103 843 50 656 965 50 447 008 14 579 475 11 671 463 20 537 880 14 519 898 19 489 775
Partly refined petroleum and
refined products 32 427 307 40 845 976 26 175 761 26 122 966 26 913 407 9 536 164 12 173 132 12 769 749 9 287 712 11 996 861
Exports
Crude petroleum 47 864 601 47 058 702 43 354 245 43 550 953 41 591 305 12 929 441 12 663 222 16 674 142 12 536 388 15 840 899
Partly refined petroleum and
refined products 31 621 552 29 396 482 31 936 044 32 271 444 31 346 754 8 801 422 8 515 217 13 373 616 10 482 121 13 746 412
(a) Including ethane, propane and butane, in addition to condensates.
Oil and gas field tables
United Kingdom production of onshore and offshore crude petroleum and natural gas by fields are produced by the Department of Energy and Climate Change. To avoid duplication, these tables will no longer be reproduced in this publication. To view this data please visit https://www.og.decc.gov.uk/information/statistics.htm

65
Natural gas
United Kingdom summary 2006-2010
Commodity 2006 2007 2008 2009 2010 2006 2007 2008 2009 2010 Tonnes £ thousand
Natural gas
Production
Methane
Colliery (a) 65 000 62 000 63 000 67 000 65 000
Offshore and onshore (a) 79 947 000 72 063 000 69 617 000 59 670 000 57 121 000
Consumption (b) 89 375 000 90 169 000 93 037 000 85 995 000 93 208 000
Imports
Liquefied natural gas (c) 3 230 972 1 281 434 766 298 9 508 135 17 522 810
Natural gas in gaseous state (c) 16 911 100 26 555 263 33 229 849 29 055 363 32 458 908
Total (c) 20 142 072 27 836 698 33 996 147 38 563 499 49 981 718 2 510 000 2 885 000 6 425 000 4 775 000 6 650 000
Other natural gas (d) 3 262 978 1 198 737 1 046 202 533 498 568 388 810 593 379 858 465 986 164 980 255 576
Exports
Liquefied natural gas and
natural gas in gaseous state (c) 9 528 256 9 361 445 9 543 217 11 160 939 14 461 473 1 315 000 995 000 1 945 000 1 420 000 1 990 000
Other natural gas (d) 2 508 137 2 402 752 3 295 288 2 798 642 2 584 168 751 469 758 232 1 318 884 865 965 1 181 234
(a) Oil equivalent: converted from original data at 397 therms = 1 tonne. (b) Tonnes oil equivalent: excluding minor consumption for non-energy use. (c) Tonnes of oil equivalent, converted from GWh using 85.985 tonnes of oil equivalent to 1 GWh. Source: Department of Energy and Climate Change. (d) Includes propane, liquefied propane, butane, liquefied butane, ethylene, gaseous hydrocarbons.

66
Phosphorus
United Kingdom summary 2006-2010
Commodity 2006 2007 2008 2009 2010 2006 2007 2008 2009 2010 Tonnes £ thousand
Phosphorus
Consumption in Iron and Steel
Industry
Ferro-phosphorus 1 200 1 240 1 160 860 840
Imports
Phosphate rock 7 803 23 052 28 971 5 600 9 873 766 1 486 3 604 865 1 020
Amonium phosphates 129 771 208 736 105 024 102 567 109 084 19 703 42 766 48 306 27 488 36 326
Superphosphates 141 417 172 560 126 083 126 402 219 783 15 974 31 497 53 975 21 044 51 763
Basic slag 6 289 ... ... ... ... 262 ... ... ... ...
Other phosphatic fertilisers 9 409 26 718 24 870 4 986 11 266 1 172 2 746 5 319 443 1 395
Elemental phosphorus — ... 0 108 152 — ... 36 734 324
Phosphoric acids 170 353 149 686 110 067 77 210 90 655 41 196 38 229 64 480 51 989 45 147
Calcium phosphates 120 402 113 632 79 069 81 205 68 902 22 607 22 397 32 904 26 146 22 009
Sodium phosphates and
orthophosphates 52 735 74 532 16 482 14 249 11 258 24 188 24 585 17 662 14 639 10 362
Polyphosphates including ammonium
and sodium 25 236 51 155 29 107 27 030 28 450 11 337 13 348 25 957 21 591 21 318
Exports
Phosphate rock 335 504 759 514 615 254 313 622 353 634
Amonium phosphates 269 276 31 217 179 170 349 263 20 978 392 363
Superphosphates 1 470 12 ... 236 235 301 21 23 104 68
Basic slag 0 ... ... ... ... 1 ... ... ... ...
Other phosphatic fertilisers 476 44 ... 17 42 103 41 ... 27 40
Elemental phosphorus 24 2 100 0 16 21 25 132 12 55
Phosphoric acids 10 760 7 124 4 020 3 554 3 251 5 629 4 653 4 991 3 851 2 605
Calcium phosphates 23 267 23 698 5 704 3 506 2 459 13 226 14 980 4 466 3 017 1 981
Sodium phosphates and
orthophosphates 4 724 3 382 2 443 1 326 1 389 2 775 2 420 2 950 2 021 2 147
Polyphosphates including ammonium
and sodium 23 587 21 691 15 790 11 765 8 666 15 049 13 463 18 665 15 541 9 716
Platinum group metals
United Kingdom summary 2006-2010
Commodity 2006 2007 2008 2009 2010 2006 2007 2008 2009 2010 Tonnes £ thousand
Platinum group metals
Imports
Unwrought or partly worked-
Platinum 23 26 30 30 59 332 670 389 203 432 806 568 901 1 866 543
Palladium 37 42 33 37 73 178 290 199 298 135 692 214 272 728 069
Other platinum metals 9 7 5 7 9 204 830 303 995 252 822 114 883 219 027
Waste & scrap 1 149 1 456 1 417 1 100 820 224 707 261 626 696 282 435 759 475 114
Exports
Unwrought or partly worked-
Platinum 43 53 41 43 24 734 052 895 179 1 069 051 954 655 787 176
Palladium 49 57 47 53 43 261 717 329 468 329 534 284 178 455 590
Other platinum metals 23 24 23 20 23 486 989 805 069 1 047 491 271 233 416 542
Waste & scrap 3 507 3 794 4 279 4 273 528 53 027 60 527 84 625 50 605 62 151

67
Potassium compounds
United Kingdom summary 2006-2010
Commodity 2006 2007 2008 2009 2010 2006 2007 2008 2009 2010 Tonnes £ thousand
Potassium compounds
Indigenous production
KCl product 716 000 712 000 673 000 (a) 700 000 (a) 700 000
Apparent consumption
Potassic fertilisers
(K2O content) (b) 301 300 (b) 338 600 (b) 254 700 ... ...
Imports
Crude natural salts 10 696 ... ... ... ... 573 ... ... ... ...
Sulphate 14 274 16 166 15 157 15 766 15 766 2 583 3 457 4 423 6 380 4 068
Chloride 170 942 202 623 165 331 80 842 270 096 19 835 25 097 ... 33 207 71 094
Other potassic fertilisers 1 310 10 813 11 919 10 422 10 565 519 1 216 2 364 1 450 1 471
Exports
Sulphate 39 163 93 443 71 16 20 42 311 75
Chloride (c) 497 700 220 600 244 300 205 600 339 000 91 000 36 891 204 382 80 287 102 142
Other potassic fertilisers 612 399 562 228 420 412 379 487 261 513
(a) BGS estimates. (b) Home deliveries plus imports. (c) BGS estimates, based on known imports into certain countries.
Precious and semi-precious stones
United Kingdom summary 2006-2010
Commodity 2006 2007 2008 2009 2010 2006 2007 2008 2009 2010 Tonnes £ thousand
Precious and semi-precious stones
(excluding diamond) (a)
Imports
Natural stones 326 235 97 124 416 73 492 110 025 105 565 94 979 126 780
Synthetic stones 18 48 69 66 84 5 686 5 103 5 184 4 048 4 638
Dust and powder 3 1 2 1 4 935 704 686 352 382
Exports
Natural stones 2 31 3 5 11 61 510 71 100 384 80 485 106 276
Synthetic stones 1 5 5 1 24 844 1 403 3 381 10 250 6 182
Dust and powder 0 4 9 6 8 87 296 560 519 701
(a) Unworked, cut or otherwise worked, but not mounted, set or strung.

Primary fuelsUnited Kingdom production of primary fuels 1985–2010 (energy supplied basis)
Million tonnes of oil equivalent (a)
Year Coal Petroleum Natural Nuclear Hydro- Total (d)gas (b) electricity electricity (c)
1985 57 139 40 17 0 2531986 66 139 42 15 0 2621987 63 135 44 14 0 2571988 63 126 42 17 0 2491989 61 100 41 18 0 2211990 56 100 46 16 0 2191991 58 100 51 17 0 2271992 52 104 52 19 1 2271993 42 110 61 22 1 2351994 30 139 65 21 0 2571995 33 143 71 21 1 2701996 31 142 84 22 0 2821997 30 140 86 23 0 2821998 26 145 90 23 1 2871999 23 150 99 22 1 2982000 20 138 108 20 1 2892001 20 128 106 21 0 2772002 19 127 104 20 1 2732003 18 116 103 20 0 2602004 16 105 96 18 1 2382005 13 93 88 18 1 2172006 11 84 80 17 1 1972007 11 84 72 14 1 1862008 11 79 70 12 1 1772009 11 75 60 15 1 1672010 11 69 57 14 1 158
(a) Based on a standard ‘tonne of oil equivalent’ equal to 397 therms. (d) Including, from 1988, small amounts of primary heat sources(b) Including colliery methane. (solar, geothermal, etc.), solid renewable sources (wood, waste, etc.)(c) Including, from 1988, other renewable primary electricity sources and gaseous renewable sources (landfill gas, sewage gas, etc.).
( i d t ) (wind, etc.).Source: Department of Energy and Climate Change.
68
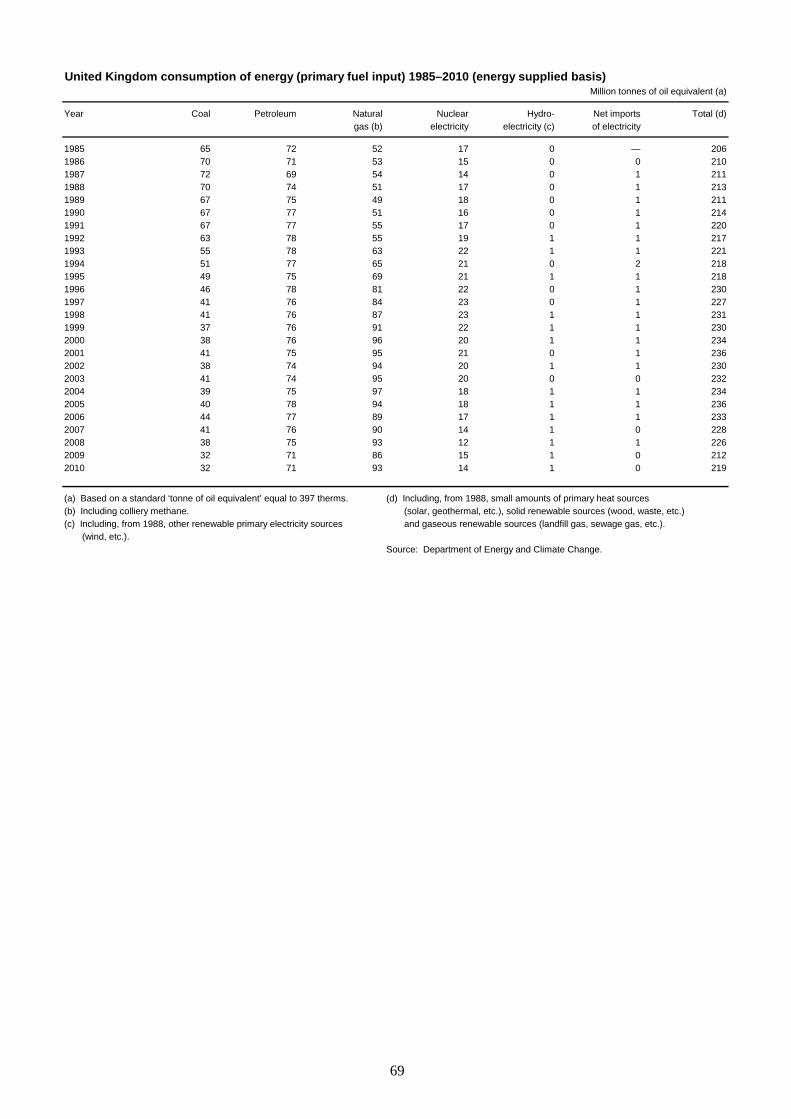
United Kingdom consumption of energy (primary fuel input) 1985–2010 (energy supplied basis)Million tonnes of oil equivalent (a)
Year Coal Petroleum Natural Nuclear Hydro- Net imports Total (d)gas (b) electricity electricity (c) of electricity
1985 65 72 52 17 0 — 2061986 70 71 53 15 0 0 2101987 72 69 54 14 0 1 2111988 70 74 51 17 0 1 2131989 67 75 49 18 0 1 2111990 67 77 51 16 0 1 2141991 67 77 55 17 0 1 2201992 63 78 55 19 1 1 2171993 55 78 63 22 1 1 2211994 51 77 65 21 0 2 2181995 49 75 69 21 1 1 2181996 46 78 81 22 0 1 2301997 41 76 84 23 0 1 2271998 41 76 87 23 1 1 2311999 37 76 91 22 1 1 2302000 38 76 96 20 1 1 2342001 41 75 95 21 0 1 2362002 38 74 94 20 1 1 2302003 41 74 95 20 0 0 2322004 39 75 97 18 1 1 2342005 40 78 94 18 1 1 2362006 44 77 89 17 1 1 2332007 41 76 90 14 1 0 2282008 38 75 93 12 1 1 2262009 32 71 86 15 1 0 2122010 32 71 93 14 1 0 219
(a) Based on a standard ‘tonne of oil equivalent’ equal to 397 therms. (d) Including, from 1988, small amounts of primary heat sources(b) Including colliery methane. (solar, geothermal, etc.), solid renewable sources (wood, waste, etc.)(c) Including, from 1988, other renewable primary electricity sources and gaseous renewable sources (landfill gas, sewage gas, etc.). (wind, etc.).
Source: Department of Energy and Climate Change.
69

70
Pumice
United Kingdom summary 2006-2010
Commodity 2006 2007 2008 2009 2010 2006 2007 2008 2009 2010 Tonnes £ thousand
Pumice
Imports 97 832 206 353 2 259 1 668 2 062 1 659 2 546 2 013 1 130 1 183
Exports 70 40 76 307 704 227 93 293 534 997
Pyrite
United Kingdom summary 2006-2010
Commodity 2006 2007 2008 2009 2010 2006 2007 2008 2009 2010 Tonnes £ thousand
Pyrite
Imports
Iron pyrites (incl.cupreous)-
Unroasted 19 105 704 104 2 581 7 24 153 38 1 333
Roasted 1 282 131 230 693 232 — 171 5 649 98 67 —
Exports
Iron pyrites (incl.cupreous)-
Unroasted 2 122 161 21 2 7 20 5 62 5
Roasted 6 95 90 0 28 5 43 15 10 15
Quartz and quartzite
United Kingdom summary 2006-2010
Commodity 2006 2007 2008 2009 2010 2006 2007 2008 2009 2010 Tonnes £ thousand
Quartz and quartzite
Imports
Quartzite 306 2 512 353 318 92 512 377 324 213 137
Quartz 5 235 7 143 4 036 1 989 4 015 1 078 1 659 3 140 2 372 4 013
Exports
Quartzite 170 45 99 25 34 296 225 102 14 20
Quartz 1 367 541 657 832 1 045 291 310 344 1 115 771

71
Radioactive and associated materials
United Kingdom summary 2006-2010
Commodity 2006 2007 2008 2009 2010 2006 2007 2008 2009 2010 Tonnes £ thousand
Radioactive and associated materials
Imports
Natural and enriched uranium,
plutonium, artificial radioactive
isotopes, and their compounds ... ... ... ... ... 1 176 048 1 708 433 1 130 734 1 330 313 1 258 131
Exports
Natural and enriched uranium,
plutonium, artificial radioactive
isotopes, and their compounds ... ... ... ... ... 709 205 1 708 528 1 626 085 1 808 150 2 113 690
Rare earths
United Kingdom summary 2006-2010
Commodity 2006 2007 2008 2009 2010 2006 2007 2008 2009 2010 Tonnes £ thousand
Rare earths
Imports
Rare earth metas (a) 88 88 133 99 119 486 865 1 297 907 2 231
Cerium compounds 1 615 2 167 2 067 612 1 119 3 253 4 768 5 802 1 932 4 694
Other rare earth compounds (b) 600 664 251 103 322 2 768 4 152 3 461 3 648 3 999
Ferro-cerium & other
pyrophoric alloys 60 77 57 148 150 4 012 81 109 210 173
Exports
Rare earth metals (a) 29 143 237 54 46 453 610 798 503 1 158
Cerium compounds 111 37 73 105 182 1 596 545 1 257 1 692 2 349
Other rare earth compounds (b) 954 1 089 622 459 614 5 669 4 634 2 673 2 606 5 033
Ferro-cerium & other
pyrophoric alloys 76 80 7 6 37 125 160 86 113 439
(a) Including yttrium and scandium. (b) Including yttrium and scandium compounds.
Salt
United Kingdom summary 2006-2010
Commodity 2006 2007 2008 2009 2010 2006 2007 2008 2009 2010 Tonnes £ thousand
Salt
Production 5 499 000 5 600 000 5 565 000 6 166 000 6 666 000
Imports 246 879 237 772 237 288 410 434 1 288 253 17 673 18 097 21 973 30 365 64 295
Exports 557 311 514 868 873 708 449 303 450 246 29 091 28 112 33 995 31 509 35 354

72
Sand and gravel (see also Aggregates)
United Kingdom summary 2006-2010
Commodity 2006 2007 2008 2009 2010 2006 2007 2008 2009 2010 Tonnes £ thousand
Sand and gravel
Production
Sand & gravel (a) 92 107 000 93 236 000 85 473 000 66 226 000 61 700 000
Consumption
Building sand (b) 12 105 000 12 207 000 10 595 000 7 941 000 7 710 000
Concreting sand (b) 29 815 000 30 202 000 26 885 000 21 570 000 20 947 000
Gravel and hoggin (b) 38 321 000 36 092 000 34 648 000 26 199 000 19 052 000
Total (b) 80 242 000 78 501 000 72 127 000 55 709 000 54 330 000
Imports 634 844 896 715 647 603 444 725 343 749 17 583 18 260 16 043 12 212 10 874
Exports (c) 9 308 961 8 089 175 7 747 635 6 236 662 6 081 730 45 498 46 624 50 027 48 688 44 819
(a) Including production from marine dredging. (b) Great Britain: production for the home market including landings of marine dredged materials at British ports. (c) Principally marine dredged sand and gravel. Source: HM Revenue and Customs. However, the Crown Estate Commissioners give the following figures for marine dredged sand and gravel landed at foreign ports (tonnes): 2006: 6 714 659; 2007: 6 649 041; 2008: 6 211 703; 2009: 5 660 522; 2010: 5 192 348.
Building sand for asphalt
Building sand for mortar
Concreting sand
Gravel, coated
Gravel for concrete
aggregate
Gravel for other uses
Sand, gravel and hoggin for fill
Great Britain production of sand and gravel by end-use 2010 (total production 54.3 million tonnes)
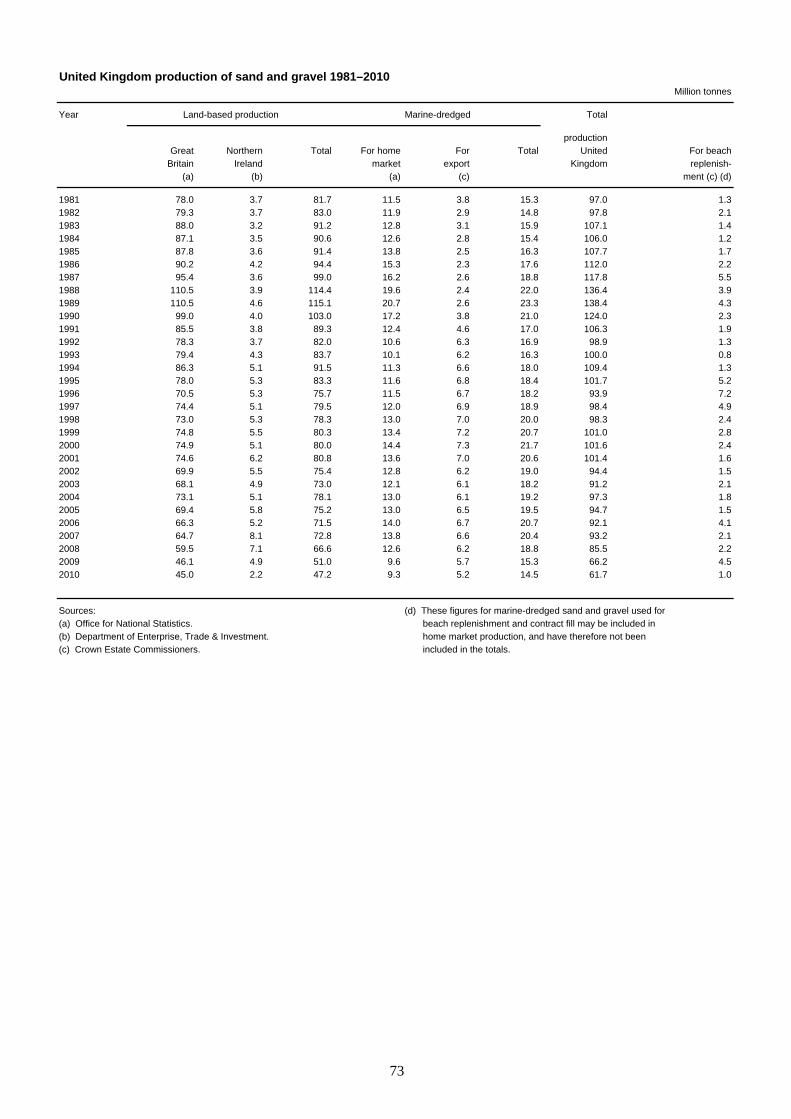
United Kingdom production of sand and gravel 1981–2010Million tonnes
Year Total
productionGreat Northern Total For home For Total United For beach
Britain Ireland market export Kingdom replenish-(a) (b) (a) (c) ment (c) (d)
1981 78.0 3.7 81.7 11.5 3.8 15.3 97.0 1.31982 79.3 3.7 83.0 11.9 2.9 14.8 97.8 2.11983 88.0 3.2 91.2 12.8 3.1 15.9 107.1 1.41984 87.1 3.5 90.6 12.6 2.8 15.4 106.0 1.21985 87.8 3.6 91.4 13.8 2.5 16.3 107.7 1.71986 90.2 4.2 94.4 15.3 2.3 17.6 112.0 2.21987 95.4 3.6 99.0 16.2 2.6 18.8 117.8 5.51988 110.5 3.9 114.4 19.6 2.4 22.0 136.4 3.91989 110.5 4.6 115.1 20.7 2.6 23.3 138.4 4.31990 99.0 4.0 103.0 17.2 3.8 21.0 124.0 2.31991 85.5 3.8 89.3 12.4 4.6 17.0 106.3 1.91992 78.3 3.7 82.0 10.6 6.3 16.9 98.9 1.31993 79.4 4.3 83.7 10.1 6.2 16.3 100.0 0.81994 86.3 5.1 91.5 11.3 6.6 18.0 109.4 1.31995 78.0 5.3 83.3 11.6 6.8 18.4 101.7 5.21996 70.5 5.3 75.7 11.5 6.7 18.2 93.9 7.21997 74.4 5.1 79.5 12.0 6.9 18.9 98.4 4.91998 73.0 5.3 78.3 13.0 7.0 20.0 98.3 2.41999 74.8 5.5 80.3 13.4 7.2 20.7 101.0 2.82000 74.9 5.1 80.0 14.4 7.3 21.7 101.6 2.42001 74.6 6.2 80.8 13.6 7.0 20.6 101.4 1.62002 69.9 5.5 75.4 12.8 6.2 19.0 94.4 1.52003 68.1 4.9 73.0 12.1 6.1 18.2 91.2 2.12004 73.1 5.1 78.1 13.0 6.1 19.2 97.3 1.82005 69.4 5.8 75.2 13.0 6.5 19.5 94.7 1.52006 66.3 5.2 71.5 14.0 6.7 20.7 92.1 4.12007 64.7 8.1 72.8 13.8 6.6 20.4 93.2 2.12008 59.5 7.1 66.6 12.6 6.2 18.8 85.5 2.22009 46.1 4.9 51.0 9.6 5.7 15.3 66.2 4.52010 45.0 2.2 47.2 9.3 5.2 14.5 61.7 1.0
Sources: (d) These figures for marine-dredged sand and gravel used for(a) Office for National Statistics. beach replenishment and contract fill may be included in(b) Department of Enterprise, Trade & Investment. home market production, and have therefore not been(c) Crown Estate Commissioners. included in the totals.
Land-based production Marine-dredged
73

Great Britain production of sand and gravel by end-use and area of origin 2010Thousand tonnes
Area of origin Sand Gravel Total
Building sand Concreting Coated Concrete Other Sand,sand with a aggregate screened gravel and
For For use in bituminous & graded hoggin forasphalt mortar binder gravels (c) fill
North East … 187 (a) 665 — (a) … 44 (a) … (a) 1 150Yorkshire and the Humber … 533 1 239 … (a) 772 366 … (a) 3 195East Midlands … 503 2 511 … 1 335 597 325 5 503East of England … (a) 1 021 (a) 3 717 … (a) 2 565 (a) 786 (a) 1 229 (a) 9 711South East (a) … (a) 1 179 (a) 4 435 … (a) 4 923 (a) 682 (a) 1 749 (a) 13 145South West 181 (a) 356 (a) 1 930 … (a) 762 … (a) 1 237 (a) 4 714West Midlands … 665 2 234 … 1 620 721 622 6 074North West 111 (a) 486 (a) 1026 — … … 125 (a) 1841
England Land-won … … … … … … … 36 723 Marine (b) … … … … … … … 8 609 Total (a) … (a) 4 929 (a) 17 758 … (a) 12 169 (a) 3 439 (a) 5 558 (a) 45 332
Wales Land-won … … … — … … … 901 Marine (b) … … … — … … … 732 Total (a) … (a) 505 (a) 658 — (a) 244 (a) 128 (a) … (a) 1 633
Scotland Total 533 675 2 531 … 1 081 1 479 … 7 365
Great Britain Land-won … 5 575 16 647 512 9 629 … 6 234 44 989 Marine (b) … 535 4 300 — 3 865 … 387 9 341 Total (a) 1 600 (a) 6 110 (a) 20 947 512 (a) 13 494 (a) 5 046 (a) 6 621 (a) 54 330
(a) Including marine-dredged material. (c) This heading is now believed to include material previously classified(b) Excluding marine-dredged landings at foreign ports (exports). as construction fill.
Source: Office for National Statistics.
74

Great Britain production of sand and gravel (a) by region 1981–2010Thousand tonnes
Year North North Yorks. & West East East of South South England Wales Scotland Great East (b) West (c) the Humber Midlands Midlands England (d) East (e) West Britain
1981 2 798 3 043 4 668 8 109 9 217 6 532 35 864 5 843 76 074 3 492 9 886 89 4531982 2 685 3 410 4 397 9 892 9 100 7 026 35 374 6 017 77 901 3 444 9 861 91 2061983 3 087 3 730 4 690 9 847 10 470 7 581 39 035 8 017 86 457 4 033 10 309 100 7991984 3 062 4 080 4 680 10 827 10 604 6 934 38 862 7 010 86 060 3 437 10 178 99 6751985 2 717 3 823 4 537 10 728 10 609 7 540 39 930 6 981 86 865 3 420 11 320 101 6051986 2 863 4 036 4 686 10 486 11 743 7 547 42 192 7 152 90 706 4 083 10 710 105 4981987 2 932 4 006 4 780 11 095 13 348 8 306 43 563 8 495 96 525 4 793 10 311 111 6291988 3 291 4 156 5 306 14 138 15 603 11 361 50 970 9 843 114 667 4 734 10 753 130 1541989 3 802 4 709 5 722 14 020 15 892 10 145 51 208 9 142 114 640 4 588 12 004 131 2321990 3 951 4 641 5 485 12 581 14 051 8 762 42 516 7 559 99 547 3 990 12 634 116 1721991 3 017 4 243 4 960 10 698 12 683 7 288 33 318 6 045 82 253 3 439 12 226 97 9181992 2 732 3 894 4 028 9 976 12 072 6 456 28 590 6 171 73 290 3 205 11 774 88 8981993 2 856 4 028 4 539 10 345 12 364 5 962 28 600 6 138 74 833 3 278 11 359 89 4701994 3 268 4 843 4 907 12 207 12 860 6 947 31 140 6 765 82 937 3 312 11 423 97 6721995 3 086 4 529 4 333 10 722 11 556 6 550 28 046 6 684 75 506 3 260 10 889 89 6561996 2 909 3 792 3 923 9 633 10 827 5 623 26 485 5 790 68 983 3 111 9 904 81 9971997 3 109 4 294 4 041 9 966 10 899 5 899 29 154 6 054 73 416 3 050 9 900 86 3661998 3 056 3 579 4 381 9 721 10 416 5 979 29 637 6 166 72 935 2 959 10 074 85 9681999 3 117 3 801 4 872 9 901 10 216 6 395 30 821 6 016 75 139 3 039 10 031 88 2092000 2 003 4 003 4 559 9 879 10 253 15 637 22 553 7 385 76 272 2 939 10 022 89 2342001 1 566 3 402 5 171 9 894 9 716 15 694 22 004 7 126 74 572 2 886 10 753 88 2102002 1 344 3 890 4 999 9 159 9 608 15 317 19 872 7 131 71 320 2 758 8 643 82 7212003 1 254 5 220 4 770 9 590 9 842 14 381 17 915 6 413 69 385 2 733 8 103 80 2212004 1 576 3 992 5 197 9 401 10 906 15 461 19 885 8 065 74 482 3 120 8 455 86 0572005 1 575 3 674 5 248 9 250 9 235 15 561 19 362 6 934 70 838 2 746 8 808 82 3922006 1 471 3 599 5 016 9 396 8 979 13 588 20 194 6 793 69 035 2 615 8 592 80 2422007 1 411 3 592 5 098 10 025 8 485 13 283 18 442 6 801 67 137 2 339 9 025 78 5012008 1 288 2 813 5 014 10 476 7 477 12 060 16 582 5 960 61 669 2 361 8 097 72 1272009 1 110 2 121 3 235 6 397 5 798 9 980 13 211 4 677 46 529 1 668 7 512 55 7092010 1 150 1 841 3 195 6 074 5 503 9 711 13 145 4 714 45 332 1 633 7 365 54 330
(a) Including marine-dredged material. (e) From 2000, excludes Essex, Hertfordshire and Bedfordshire. (b) From 2000, excludes Cumbria. (c) From 2000, includes Cumbria.(d) From 2000, includes Essex, Hertfordshire and Bedfordshire. Source: Office for National Statistics.
75
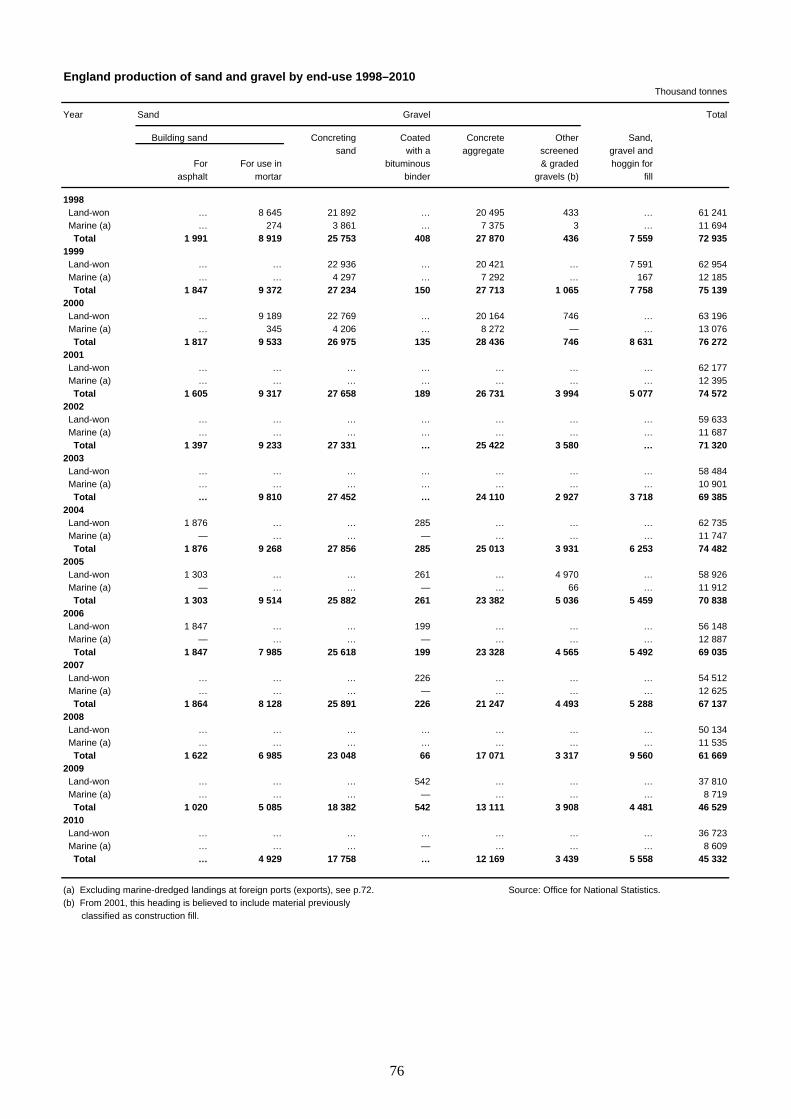
England production of sand and gravel by end-use 1998–2010Thousand tonnes
Year Sand Gravel Total
Building sand Concreting Coated Concrete Other Sand,sand with a aggregate screened gravel and
For For use in bituminous & graded hoggin forasphalt mortar binder gravels (b) fill
1998 Land-won … 8 645 21 892 … 20 495 433 … 61 241 Marine (a) … 274 3 861 … 7 375 3 … 11 694 Total 1 991 8 919 25 753 408 27 870 436 7 559 72 9351999 Land-won … … 22 936 … 20 421 … 7 591 62 954 Marine (a) … … 4 297 … 7 292 … 167 12 185 Total 1 847 9 372 27 234 150 27 713 1 065 7 758 75 1392000 Land-won … 9 189 22 769 … 20 164 746 … 63 196 Marine (a) … 345 4 206 … 8 272 — … 13 076 Total 1 817 9 533 26 975 135 28 436 746 8 631 76 2722001 Land-won … … … … … … … 62 177 Marine (a) … … … … … … … 12 395 Total 1 605 9 317 27 658 189 26 731 3 994 5 077 74 5722002 Land-won … … … … … … … 59 633 Marine (a) … … … … … … … 11 687 Total 1 397 9 233 27 331 … 25 422 3 580 … 71 3202003 Land-won … … … … … … … 58 484 Marine (a) … … … … … … … 10 901 Total … 9 810 27 452 … 24 110 2 927 3 718 69 3852004 Land-won 1 876 … … 285 … … … 62 735 Marine (a) — … … — … … … 11 747 Total 1 876 9 268 27 856 285 25 013 3 931 6 253 74 4822005 Land-won 1 303 … … 261 … 4 970 … 58 926 Marine (a) — … … — … 66 … 11 912 Total 1 303 9 514 25 882 261 23 382 5 036 5 459 70 8382006 Land-won 1 847 … … 199 … … … 56 148 Marine (a) — … … — … … … 12 887 Total 1 847 7 985 25 618 199 23 328 4 565 5 492 69 0352007 Land-won … … … 226 … … … 54 512 Marine (a) … … … — … … … 12 625 Total 1 864 8 128 25 891 226 21 247 4 493 5 288 67 1372008 Land-won … … … … … … … 50 134 Marine (a) … … … … … … … 11 535 Total 1 622 6 985 23 048 66 17 071 3 317 9 560 61 6692009 Land-won … … … 542 … … … 37 810 Marine (a) … … … — … … … 8 719 Total 1 020 5 085 18 382 542 13 111 3 908 4 481 46 5292010 Land-won … … … … … … … 36 723 Marine (a) … … … — … … … 8 609 Total … 4 929 17 758 … 12 169 3 439 5 558 45 332
(a) Excluding marine-dredged landings at foreign ports (exports), see p.72. Source: Office for National Statistics.(b) From 2001, this heading is believed to include material previously classified as construction fill.
76

Wales production of sand and gravel by end-use 1998–2010Thousand tonnes
Year Sand Gravel Total
Building sand Concreting Coated Concrete Other Sand,sand with a aggregate screened gravel and
For For use in bituminous & graded hoggin forasphalt mortar binder gravels (b) fill
1998 Land-won … 270 712 — 370 — … 1 701 Marine (a) … 497 570 — 162 — … 1 258 Total 45 768 1 282 — 532 — 333 2 9591999 Land-won … … 683 — 453 2 354 1 800 Marine (a) … … 543 — 175 — 3 1 240 Total 37 789 1 226 — 628 2 357 3 0392000 Land-won … 331 502 — 404 … 386 1 658 Marine (a) 4 620 489 — 164 — 3 1 280 Total … 951 991 — 568 … 389 2 9392001 Land-won … … … — … 116 … 1 670 Marine (a) … … … — … — … 1 216 Total 16 1 120 923 — 524 116 187 2 8862002 Land-won … … … — … … … 1 613 Marine (a) … … … — … — … 1 145 Total … 862 1 140 — 487 134 … 2 7582003 Land-won … … … — … … … 1 503 Marine (a) … … … — … — … 1 230 Total … 987 1 073 — 430 … 107 2 7332004 Land-won … … … — … 142 … 1 871 Marine (a) … … … — … — … 1 249 Total 16 688 1 364 — 526 142 384 3 1202005 Land-won … … … … … 262 … 1 634 Marine (a) … … … … … — … 1 112 Total … 974 824 … 450 262 206 2 7462006 Land-won … … … … … 206 … 1 528 Marine (a) — … … … … — … 1 087 Total … 954 978 … 280 206 179 2 6152007 Land-won … … … — … 178 … 1 187 Marine (a) — … … — … — … 1 152 Total … 749 902 — 443 178 … 2 3392008 Land-won … … … — … … … 1 275 Marine (a) … … … — … … … 1 086 Total 49 660 1 032 — 382 95 143 2 3612009 Land-won … … … — … … … 795 Marine (a) … … … — … … … 873 Total 148 458 657 — 238 94 74 1 6682010 Land-won … … … — … … … 901 Marine (a) … … … — … … … 732 Total … 505 658 — 244 128 … 1 633
(a) Excluding marine-dredged landings at foreign ports (exports), see p.72. Source: Office for National Statistics.(b) From 2001, this heading is believed to include material previously classified as construction fill.
77

Scotland (land-won) production of sand and gravel by end-use 1998–2010Thousand tonnes
Year Sand Gravel Total
Building sand Concreting Coated Concrete Other Sand,sand with a aggregate screened gravel and
For For use in bituminous & graded hoggin forasphalt mortar binder gravels (a) fill
1997 547 1 268 3 199 48 2 142 64 2 632 9 9001998 447 1 153 3 210 79 1 968 198 3 020 10 0741999 455 1 195 3 270 95 2 008 198 2 809 10 0312000 … 1 274 3 202 67 1 749 … 3 031 10 0222001 374 1 079 3 075 72 2 715 1 056 2 382 10 7532002 … 1 096 2 753 … 1 790 1 021 1 581 8 6432003 359 1 053 2 886 … 1 724 … 1 132 8 1032004 181 732 3 309 79 1 994 740 1 421 8 4552005 … 1 070 3 142 … 2 182 851 986 8 8082006 … 968 3 219 … 1 745 877 1 197 8 5922007 … 1 000 3 409 80 1 931 1 058 … 9 0252008 397 882 2 805 88 1 334 1 189 1 403 8 0972009 477 753 2 530 84 1 103 1 099 1 466 7 5122010 533 675 2 531 … 1 081 1 479 … 7 365
(a) From 2001, this heading is believed to include material previously Source: Office for National Statistics. classified as construction fill.
SandstoneUnited Kingdom summary 2006-2010
Commodity 2006 2007 2008 2009 2010Tonnes
Sandstone – see Building and dimension stoneProduction 18 038 000 16 806 000 12 255 000 12 335 000 11 556 000
78
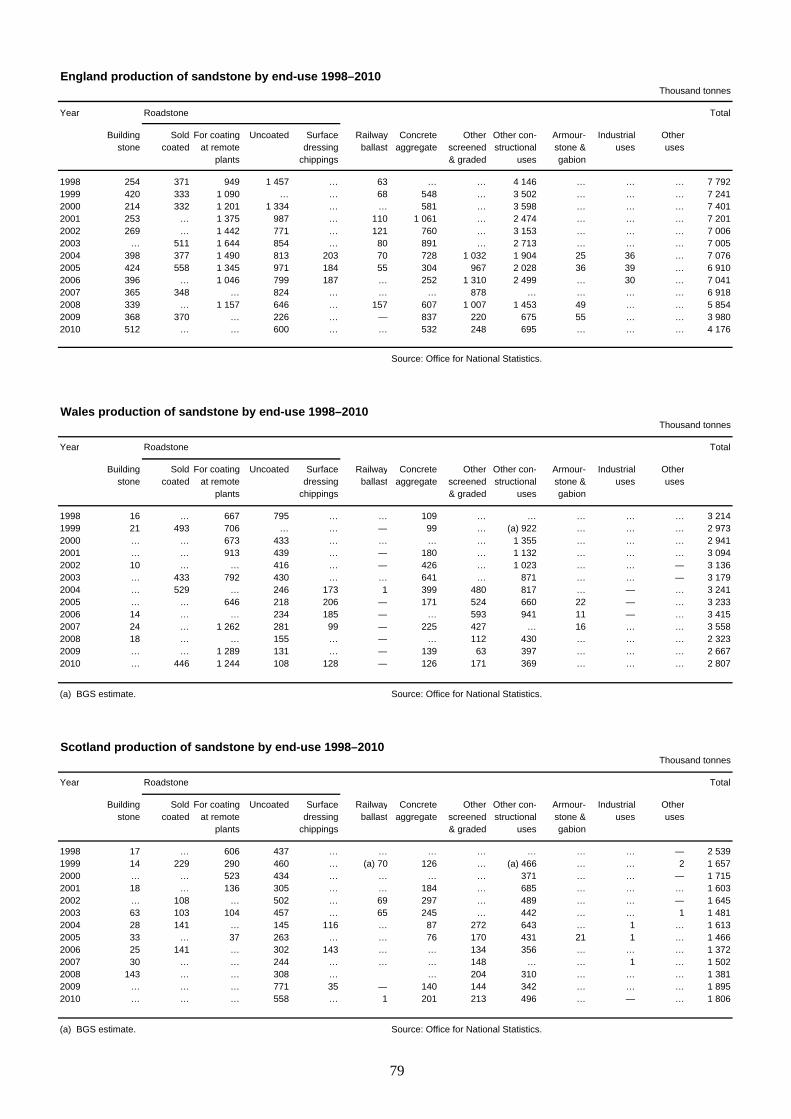
England production of sandstone by end-use 1998–2010Thousand tonnes
Year Roadstone Total
Building Sold For coating Uncoated Surface Railway Concrete Other Other con- Armour- Industrial Otherstone coated at remote dressing ballast aggregate screened structional stone & uses uses
plants chippings & graded uses gabion
1998 254 371 949 1 457 … 63 … … 4 146 … … … 7 7921999 420 333 1 090 … … 68 548 … 3 502 … … … 7 2412000 214 332 1 201 1 334 … … 581 … 3 598 … … … 7 4012001 253 … 1 375 987 … 110 1 061 … 2 474 … … … 7 2012002 269 … 1 442 771 … 121 760 … 3 153 … … … 7 0062003 … 511 1 644 854 … 80 891 … 2 713 … … … 7 0052004 398 377 1 490 813 203 70 728 1 032 1 904 25 36 … 7 0762005 424 558 1 345 971 184 55 304 967 2 028 36 39 … 6 9102006 396 … 1 046 799 187 … 252 1 310 2 499 … 30 … 7 0412007 365 348 … 824 … … … 878 … … … … 6 9182008 339 … 1 157 646 … 157 607 1 007 1 453 49 … … 5 8542009 368 370 … 226 … — 837 220 675 55 … … 3 9802010 512 … … 600 … … 532 248 695 … … … 4 176
Source: Office for National Statistics.
Wales production of sandstone by end-use 1998–2010Thousand tonnes
Year Roadstone Total
Building Sold For coating Uncoated Surface Railway Concrete Other Other con- Armour- Industrial Otherstone coated at remote dressing ballast aggregate screened structional stone & uses uses
plants chippings & graded uses gabion
1998 16 … 667 795 … … 109 … … … … … 3 2141999 21 493 706 … … — 99 … (a) 922 … … … 2 9732000 … … 673 433 … … … … 1 355 … … … 2 9412001 … … 913 439 … — 180 … 1 132 … … … 3 0942002 10 … … 416 … — 426 … 1 023 … … — 3 1362003 … 433 792 430 … … 641 … 871 … … — 3 1792004 … 529 … 246 173 1 399 480 817 … — … 3 2412005 … … 646 218 206 — 171 524 660 22 — … 3 2332006 14 … … 234 185 — … 593 941 11 — … 3 4152007 24 … 1 262 281 99 — 225 427 … 16 … … 3 5582008 18 … … 155 … — … 112 430 … … … 2 3232009 … … 1 289 131 … — 139 63 397 … … … 2 6672010 … 446 1 244 108 128 — 126 171 369 … … … 2 807
(a) BGS estimate. Source: Office for National Statistics.
Scotland production of sandstone by end-use 1998–2010Thousand tonnes
Year Roadstone Total
Building Sold For coating Uncoated Surface Railway Concrete Other Other con- Armour- Industrial Otherstone coated at remote dressing ballast aggregate screened structional stone & uses uses
plants chippings & graded uses gabion
1998 17 … 606 437 … … … … … … … — 2 5391999 14 229 290 460 … (a) 70 126 … (a) 466 … … 2 1 6572000 … … 523 434 … … … … 371 … … — 1 7152001 18 … 136 305 … … 184 … 685 … … … 1 6032002 … 108 … 502 … 69 297 … 489 … … — 1 6452003 63 103 104 457 … 65 245 … 442 … … 1 1 4812004 28 141 … 145 116 … 87 272 643 … 1 … 1 6132005 33 … 37 263 … … 76 170 431 21 1 … 1 4662006 25 141 … 302 143 … … 134 356 … … … 1 3722007 30 … … 244 … … … 148 … … 1 … 1 5022008 143 … … 308 … … 204 310 … … … 1 3812009 … … … 771 35 — 140 144 342 … … … 1 8952010 … … … 558 … 1 201 213 496 … — … 1 806
(a) BGS estimate. Source: Office for National Statistics.
79
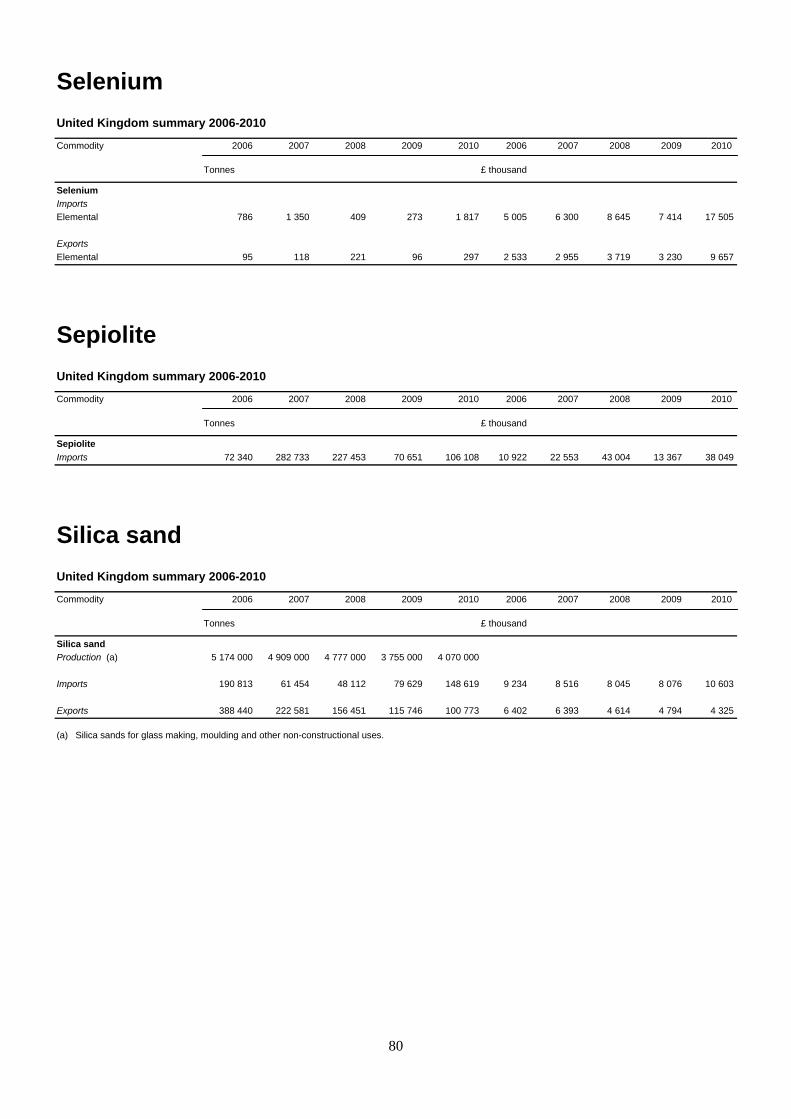
80
Selenium
United Kingdom summary 2006-2010
Commodity 2006 2007 2008 2009 2010 2006 2007 2008 2009 2010 Tonnes £ thousand
Selenium
Imports
Elemental 786 1 350 409 273 1 817 5 005 6 300 8 645 7 414 17 505
Exports
Elemental 95 118 221 96 297 2 533 2 955 3 719 3 230 9 657
Sepiolite
United Kingdom summary 2006-2010
Commodity 2006 2007 2008 2009 2010 2006 2007 2008 2009 2010 Tonnes £ thousand
Sepiolite
Imports 72 340 282 733 227 453 70 651 106 108 10 922 22 553 43 004 13 367 38 049
Silica sand
United Kingdom summary 2006-2010
Commodity 2006 2007 2008 2009 2010 2006 2007 2008 2009 2010 Tonnes £ thousand
Silica sand
Production (a) 5 174 000 4 909 000 4 777 000 3 755 000 4 070 000
Imports 190 813 61 454 48 112 79 629 148 619 9 234 8 516 8 045 8 076 10 603
Exports 388 440 222 581 156 451 115 746 100 773 6 402 6 393 4 614 4 794 4 325
(a) Silica sands for glass making, moulding and other non-constructional uses.
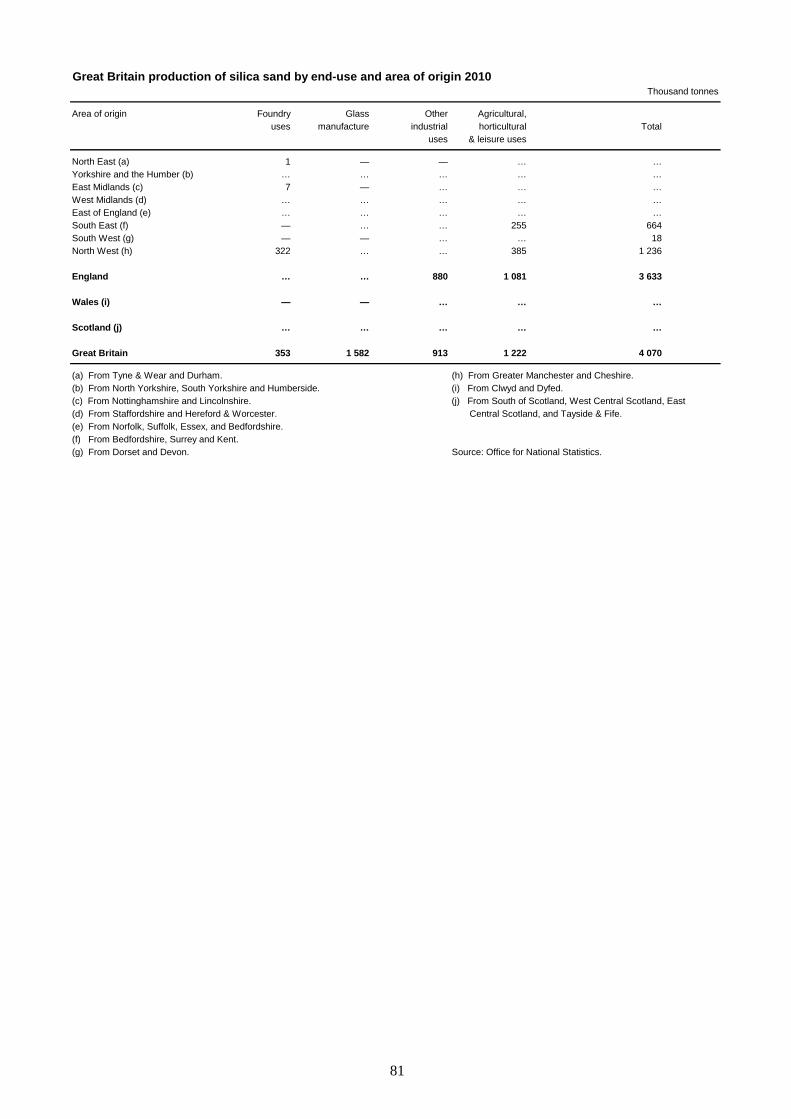
Great Britain production of silica sand by end-use and area of origin 2010Thousand tonnes
Area of origin Foundry Glass Other Agricultural,uses manufacture industrial horticultural Total
uses & leisure uses
North East (a) 1 — — … …Yorkshire and the Humber (b) … … … … …East Midlands (c) 7 — … … …West Midlands (d) … … … … …East of England (e) … … … … …South East (f) — … … 255 664South West (g) — — … … 18North West (h) 322 … … 385 1 236
England … … 880 1 081 3 633
Wales (i) — — … … …
Scotland (j) … … … … …
Great Britain 353 1 582 913 1 222 4 070
(a) From Tyne & Wear and Durham. (h) From Greater Manchester and Cheshire.(b) From North Yorkshire, South Yorkshire and Humberside. (i) From Clwyd and Dyfed.(c) From Nottinghamshire and Lincolnshire. (j) From South of Scotland, West Central Scotland, East (d) From Staffordshire and Hereford & Worcester. Central Scotland, and Tayside & Fife.(e) From Norfolk, Suffolk, Essex, and Bedfordshire.(f) From Bedfordshire, Surrey and Kent.(g) From Dorset and Devon. Source: Office for National Statistics.
81
82
Silicon
United Kingdom summary 2006-2010
Commodity 2006 2007 2008 2009 2010 2006 2007 2008 2009 2010 Tonnes £ thousand
Silicon
Consumption in Iron and Steel
Industry
Ferro-silicon 37 610 38 900 36 520 27 110 26 250
Calcium silicide 90 90 80 60 60
Ferro-silico-zirconium 60 70 70 50 50
Ferro-silico-manganese 23 620 24 430 22 940 17 030 16 490
Imports
Elemental silicon-
Containing not less than
99.99% silicon 2 203 1 504 2 788 2 673 3 299 46 953 49 825 88 581 105 259 102 641
Other 27 309 24 284 54 019 65 436 96 352 25 192 25 025 83 887 98 160 156 601
Doped silicon 399 467 378 296 434 30 409 35 333 35 288 31 544 49 386
Ferro-silicon 64 610 66 838 59 438 31 091 43 703 28 782 33 311 42 239 26 667 41 390
Ferro-silico-chrome 350 1 242 128 26 9 128 635 136 59 10
Ferro-silico-magnesium 3 810 2 303 1 614 512 931 1 738 1 168 1 744 536 1 006
Ferro-silico-manganese 59 985 56 036 52 966 37 114 49 280 23 440 29 887 59 497 24 468 42 091
Exports
Elemental silicon-
Containing not less than
99.99% silicon 788 571 645 739 1 135 19 922 23 458 38 735 52 704 56 225
Other 6 175 10 754 14 488 7 014 1 767 6 420 11 815 24 901 13 343 4 585
Doped silicon 545 957 622 331 675 80 048 85 190 78 997 57 775 71 505
Ferro-silicon 2 733 2 314 3 250 3 338 2 958 3 331 3 096 4 728 4 154 5 530
Ferro-silico-chrome 8 35 9 50 22 12 80 24 244 43
Ferro-silico-magnesium 653 917 976 458 366 441 807 1 231 709 457
Ferro-silico-manganese 60 7 49 65 52 90 11 27 59 55
Sillimanite
United Kingdom summary 2006-2010
Commodity 2006 2007 2008 2009 2010 2006 2007 2008 2009 2010 Tonnes £ thousand
Sillimanite
Imports
Sillimanite minerals (a) 10 268 10 239 11 920 7 763 7 419 1 898 1 774 2 515 2 064 2 076
Chamotte earth (b) 19 120 29 416 22 243 28 501 52 384 2 351 3 393 3 635 5 231 10 670
Mullite 7 468 12 036 6 488 5 255 8 276 3 288 3 963 3 588 2 770 3 538
Exports
Sillimanite minerals (a) 41 75 16 157 274 17 43 8 49 77
Chamotte earth (b) 112 235 162 572 1 146 78 132 110 168 273
Mullite 1 884 2 355 2 060 1 257 1 104 1 457 1 811 1 825 1 567 1 280
(a) Andalusite, kyanite and sillimanite. (b) Calcined refractory clay including flint clay.

83
Silver
United Kingdom summary 2006-2010
Commodity 2006 2007 2008 2009 2010 2006 2007 2008 2009 2010 Tonnes £ thousand
Silver
Production (a) — 0 0 1 1
Imports
Ores & concentrates 0 8 8 1 10 326 4 215 9 011 299 687
Waste & scrap 2 742 3 049 4 223 3 311 4 137 311 032 590 691 636 999 301 611 611 252
Unwrought 6 898 3 500 3 328 6 374 2 977 1 036 089 642 960 874 396 1 931 139 1 254 899
Partly worked 419 2 018 616 276 301 53 981 57 981 73 951 55 069 89 044
Silver in unrefined lead bullion (b) 240 240 390 260 300
Exports
Ores & concentrates 26 2 0 1 2 644 12 2 25 22
Waste & scrap (c) 3 785 5 051 5 447 8 412 5 160 37 217 38 340 57 315 56 820 132 182
Unwrought 762 1 806 5 909 905 2 467 164 306 408 430 1 307 184 266 091 995 488
Partly worked 307 214 162 39 113 26 417 27 564 19 567 13 865 41 897
(a) Small quanitities have been produced in Northern Ireland as follows: 2007: 212; 2008: 398; 2009: 514; 2010: 506. (b) BGS estimates of silver content of unrefined lead bullion imported. (c) Including scrap of platinum group metals.
Slate
United Kingdom summary 2006-2010
Commodity 2006 2007 2008 2009 2010 2006 2007 2008 2009 2010 Tonnes £ thousand
Slate
Production
Architectural and cladding uses,
roofing & damp proofing courses ... ... ... 42 000 ...
Powder and granules ... ... ... 14 000 ...
Crude blocks 76 000 41 000 37 000 29 000 35 000
Fill and other uses 714 000 1 332 000 967 000 597 000 615 000
Total 865 000 1 428 000 1 058 000 683 000 695 000
Imports
Unworked (a) 52 135 45 556 32 258 21 718 25 080 11 029 11 709 9 059 6 879 6 604
Roofing and wall tiles 156 784 174 574 179 150 140 691 163 494 51 255 59 391 66 118 57 688 63 112
Other worked slate (b) 55 401 41 222 30 012 30 015 29 668 10 778 9 217 8 448 8 074 8 466
Exports
Unworked (a) 450 255 297 56 907 225 232 46 745 332 1 846 803 1 837 920
Roofing and wall tiles 9 348 13 230 8 459 13 010 10 319 5 410 7 275 5 940 8 201 6 349
Other worked slate (b) 4 266 7 133 6 014 11 165 11 511 2 932 2 280 1 588 1 122 1 734
(a) Including roughly split or squared. (b) Including articles of slate or agglomerated slate.
84
Strontium
United Kingdom summary 2006-2010
Commodity 2006 2007 2008 2009 2010 2006 2007 2008 2009 2010 Tonnes £ thousand
Strontium
Imports
Carbonate 1 3 212 7 70 7 13 25 13 45
Exports
Carbonate 425 513 2 2 5 300 71 17 95 66
Sulphur
United Kingdom summary 2006-2010
Commodity 2006 2007 2008 2009 2010 2006 2007 2008 2009 2010 Tonnes £ thousand
Sulphur
Supply
Produced (a) 115 000 130 000 135 000 145 000 160 000
Imported (b) 18 942 13 679 9 638 6 285 10 475
Sulphur, zinc concentrates 175 60 107 25 28
(imported) (c)
Imports
Sulphur-
Crude 11 608 5 101 64 74 274 663 266 45 60 435
Refined 7 334 8 577 9 574 6 211 10 201 1 017 2 931 4 278 2 900 4 942
Sublimed, colloidal etc 1 297 1 073 1 186 473 767 1 001 832 1 268 805 946
Exports
Sulphur-
Crude 113 8 207 13 182 2 545 41 491 228 262 1 699 201 2 299
Refined 643 15 268 27 872 38 723 1 198 991 1 525 10 764 3 101 2 007
Sublimed, colloidal etc 1 312 624 1 144 1 902 1 349 392 265 744 976 1 096
(a) Produced from oil refineries. (b) Including waste and residues. (c) Sulphur content calculated at 29%.
Talc
United Kingdom summary 2006-2010
Commodity 2006 2007 2008 2009 2010 2006 2007 2008 2009 2010 Tonnes £ thousand
Talc
Production 4 325 2 850 2 410 2 861 2 633
Imports 55 200 54 812 53 864 39 520 50 309 10 815 11 176 12 468 12 640 15 312
Exports 4 626 2 389 3 129 2 402 3 074 1 501 878 1 140 1 058 1 497

85
Tantalum and Niobium
United Kingdom summary 2006-2010
Commodity 2006 2007 2008 2009 2010 2006 2007 2008 2009 2010 Tonnes £ thousand
Tantalum and Niobium
Consumption in Iron and Steel
Industry
Niobium (a) 430 480 540 190 270
Imports
Ores & concentrates 13 0 6 5 97 287 222 17 264 148 36 306
Ferro-niobium 1 098 1 490 1 189 686 859 7 427 12 836 13 659 9 955 13 712
Tantalum 119 96 161 145 284 9 501 6 572 8 443 11 647 10 642
Niobium (b) 143 140 154 98 104 7 953 2 972 6 975 9 342 9 331
Exports
Ferro-niobium 74 49 58 52 224 513 944 1 148 935 4 284
Tantalum 83 77 55 72 191 11 569 4 706 2 255 3 144 8 657
Niobium (b) 9 124 148 23 45 315 2 012 3 021 947 3 971
(a) Metal content. (b) Including rhenium.
Tellurium
United Kingdom summary 2006-2010
Commodity 2006 2007 2008 2009 2010 2006 2007 2008 2009 2010 Tonnes £ thousand
Tellurium
Imports 38 38 151 53 98 806 1 070 11 650 5 366 14 999
Exports 53 40 3 112 92 1 753 1 781 338 9 453 9 004
Tin
United Kingdom summary 2006-2010
Commodity 2006 2007 2008 2009 2010 2006 2007 2008 2009 2010 Tonnes £ thousand
Tin
Consumption
Refined 4 080 4 080 3 000 3 000 3 000
Imports
Concentrates 0 0 0 6 0 43 39 25 122 45
Unwrought 3 558 13 630 7 181 4 522 4 327 17 917 32 618 55 479 39 257 58 068
Unwrought alloys 891 525 400 370 365 5 029 5 535 6 533 5 648 6 829
Scrap 1 728 452 448 121 196 510 317 334 251 384
Exports
Concentrates 4 373 254 61 163 21 2 012 1 158 448 954
Ash and residues 165 124 ... ... ... 474 199 ... ... ...
Unwrought 8 395 4 085 1 264 928 1 856 43 259 29 224 11 781 8 500 24 891
Unwrought alloys 698 696 532 537 389 4 107 5 332 5 671 3 296 4 037
Scrap 35 252 27 329 19 110 22 597 13 115 31 425 43 699 24 197 29 286 12 682

86
Titanium
United Kingdom summary 2006-2010
Commodity 2006 2007 2008 2009 2010 2006 2007 2008 2009 2010 Tonnes £ thousand
Titanium
Production
Titanium dioxide pigment (a) 275 000 268 000 255 000 230 000 (b) 200 000
Apparent consumption (b) 78 800 68 200 63 900 24 100 43 400
Consumption in Iron and Steel
Industry
Ferro-titanium 1 020 1 050 990 730 710
Imports
Ores & concentrates
Ilmenite 175 882 181 794 194 719 112 068 90 622 25 815 27 878 38 401 33 818 31 752
Other (rutile) 48 147 42 37 23 ... 12 111 36 34 80 ...
Scrap 14 375 12 585 12 367 8 972 8 388 88 437 45 141 32 945 11 106 24 707
Unwrought 10 736 11 966 13 868 9 989 7 994 75 833 70 708 78 778 52 522 52 867
Wrought 5 156 6 354 6 071 4 218 4 299 141 150 176 721 186 129 160 102 153 972
Ferro-titanium (c) 1 087 1 677 1 290 396 274 6 434 6 732 3 612 399 813
Oxides 10 769 6 981 6 925 4 933 6 503 11 521 8 884 10 053 9 101 11 106
Pigments based on titanium dioxide 60 759 67 727 51 822 48 931 52 957 82 835 113 787 71 395 72 302 86 182
Titanium slag 91 603 151 494 158 195 127 224 ... 27 968 33 379 38 966 36 298 ...
Exports
Ores & concentrates
Ilmenite 58 26 21 19 20 199 100 165 56 35
Other (rutile) 99 ... 0 22 ... 780 ... 29 94 ...
Scrap 4 280 4 476 3 973 3 269 4 180 28 935 20 964 12 714 5 096 15 804
Unwrought 2 952 3 263 2 754 2 823 3 683 31 888 17 402 13 252 8 265 25 579
Wrought 6 795 5 196 4 428 3 464 4 197 169 621 178 876 198 153 156 703 155 259
Ferro-titanium (c) 17 645 19 515 18 557 13 098 15 197 108 240 79 176 59 013 23 486 43 348
Oxides 1 224 1 130 1 104 845 867 3 792 2 392 3 536 3 693 2 464
Pigments based on titanium dioxide 181 023 210 938 221 399 203 028 207 651 220 091 247 463 276 503 298 629 322 674
(a) Articol estimates. (b) BGS estimates; see explanatory notes. (c) Including ferro-silico-titanium.

87
Tungsten
United Kingdom summary 2006-2010
Commodity 2006 2007 2008 2009 2010 2006 2007 2008 2009 2010 Tonnes £ thousand
Tungsten
Consumption in Iron and Steel
Industry (a) 40 40 50 20 20
Imports
Ores & concentrates 34 2 11 35 2 229 27 25 44 40
W content 177 ... 6 ... ...
Scrap 1 841 1 823 1 291 1 157 1 278 16 240 18 787 15 129 11 134 15 973
Unwrought 2 766 389 430 283 353 22 773 5 953 6 903 5 456 5 470
Wrought 111 713 144 38 45 5 015 6 828 4 257 2 995 4 384
Ferro-tungsten (b) 134 33 27 26 48 948 397 487 348 763
Carbide 913 1 409 1 023 614 1 111 18 831 25 842 19 982 11 808 27 735
Tungstates 39 51 31 6 4 379 590 348 144 116
Oxides and hydroxides 707 746 96 36 24 9 535 8 566 1 171 154 117
Exports
Ores & concentrates 1 36 21 3 29 44 589 136 93 327
W content 0 ... 11 ... ...
Scrap 1 161 1 991 1 399 1 429 1 451 8 062 17 528 14 390 11 089 15 563
Unwrought 845 373 182 65 162 6 659 4 232 2 979 1 681 2 502
Wrought 93 80 44 47 36 2 532 3 091 3 976 1 975 2 645
Ferro-tungsten (b) 17 8 31 1 4 246 112 256 25 112
Carbide 251 303 51 80 41 3 937 7 874 1 704 211 983
Tungstates 12 11 5 8 6 181 182 85 650 117
Oxides and hydroxides 4 0 402 55 6 143 4 4 782 367 68
(a) Metal content. (b) Including ferro-silico-tungsten.
Vanadium
United Kingdom summary 2006-2010
Commodity 2006 2007 2008 2009 2010 2006 2007 2008 2009 2010 Tonnes £ thousand
Vanadium
Consumption in Iron and Steel
Industry (a) 80 90 100 40 50
Imports
Unwrought (b) 174 (b) 583 314 112 197 (b) 3 133 (b) 5 232 6 277 3 218 4 670
Wrought 233 ... ... ... ... 4 944 ... ... ... ...
Oxides 472 425 344 84 5 4 063 3 053 4 813 699 74
Ferro-vanadium 1 623 755 543 209 340 10 669 11 036 12 812 2 394 4 413
Exports
Unwrought 0 2 182 2 18 23 47 902 43 395 682
Wrought 69 ... ... ... ... 127 ... ... ... ...
Oxides 23 697 589 487 694 80 10 420 8 870 4 992 7 806
Ferro-vanadium 151 96 79 64 24 2 728 1 400 922 958 328
(a) Vanadium content of ferro-vanadium. (b) Including scrap.

88
Vermiculite
United Kingdom summary 2006-2010
Commodity 2006 2007 2008 2009 2010 2006 2007 2008 2009 2010 Tonnes £ thousand
Vermiculite
Imports 34 772 34 072 29 200 24 515 58 456 4 484 4 182 4 319 4 115 5 357
Exports 101 5 24 188 1 059 69 52 109 934 822
Zinc
United Kingdom summary 2006-2010
Commodity 2006 2007 2008 2009 2010 2006 2007 2008 2009 2010 Tonnes £ thousand
Zinc
Consumption
Slab 161 676 172 000 151 500 99 000 99 000
Imports
Ores & concentrates (a) 603 164 257 119 574 881 418 424 341 970
Ash and residues 5 632 4 918 4 632 3 160 2 898 3 863 3 553 2 122 11 203 1 243
Unwrought 119 676 122 458 119 911 84 594 97 066 215 030 222 907 134 468 96 839 144 172
Unwrought alloys 15 666 13 201 8 524 1 869 2 973 29 565 28 338 9 611 2 407 4 156
Scrap 334 30 103 344 447 243 41 54 258 409
Exports
Ores & concentrates 468 82 246 11 418 8 405 1 237 301 209 1 691 2 992
Ash and residues 7 009 7 068 13 786 9 585 9 139 5 807 6 677 8 597 6 268 8 422
Unwrought 5 325 5 932 3 883 3 600 3 580 8 776 10 236 4 639 4 560 4 937
Unwrought alloys 37 120 33 799 28 408 13 578 14 561 61 587 63 495 38 083 15 562 21 409
Scrap 4 571 7 543 5 699 6 030 14 903 4 948 9 610 4 973 5 144 18 207
(a) Zinc and mixed zinc-lead concentrates.

89
Zirconium
United Kingdom summary 2006-2010
Commodity 2006 2007 2008 2009 2010 2006 2007 2008 2009 2010 Tonnes £ thousand
Zirconium
Apparent consumption (a) 8 000 7 000 7 000 3 000 4 000
Consumption in Iron and Steel
Industry
Ferro-silico-zirconium 60 70 70 50 50
Imports
Ores and Concentrates (b) 13 729 11 007 13 092 6 386 8 450 8 769 7 296 8 145 5 910 7 204
Scrap 114 62 65 49 139 465 278 263 311 885
Unwrought 175 150 403 82 190 2 346 1 071 4 490 1 830 3 088
Wrought 178 235 53 72 82 4 131 3 411 1 745 852 1 219
Exports
Ores and concentrates 902 1 096 716 742 1 405 847 1 022 746 966 1 728
Scrap 25 41 2 11 76 111 104 33 42 338
Unwrought 5 0 54 0 0 22 6 72 53 6
Wrought 60 13 5 7 15 1 934 779 715 1 362 336
(a) BGS estimates; see explanatory notes. (b) Mainly zircon.