milestone 3.14 maximising circuit transfer...
TRANSCRIPT
Page 1 of 29
Milestone 3.14 Maximising Circuit Transfer Capacity

Milestone 3.14: Maximising Circuit Transfer Capacity
UK Power Networks (Operations) Limited. Registered in England and Wales. Registered No. 3870728. Registered Office: Newington House, 237 Southwark Bridge Road, London,
SE1 6NP Page 2 of 29
Contents
1. Introduction ..................................................................................................... 3 2. Dynamic Rating Principles ............................................................................. 4
Background .................................................................................................... 4 Literature Review and Academic Input .......................................................... 5
3. Lab tests ......................................................................................................... 8 Overview ......................................................................................................... 8 Test arrangements ......................................................................................... 8 Initial results .................................................................................................. 11
4. Data and Analysis ........................................................................................ 12 Cyclic load test ............................................................................................. 12 Heating and cooling profiles ......................................................................... 12 Derivation of Cable Model ............................................................................ 13 Applications .................................................................................................. 15
5. Demonstration Plan and Sites ...................................................................... 18 Site selection ................................................................................................ 18 Recommended Demonstration sites ............................................................ 20
6. Summary and conclusions ........................................................................... 22 Appendix A: Small Section Cables ....................................................................... 23 Appendix B: Examples of FUN-LV Load Transfer Profiles and Asset Guarding .. 25
Transfer Profiles ........................................................................................... 25 SOP Asset Guarding .................................................................................... 26
Appendix C: Field Measurement System .............................................................. 27 Appendix D: Milestone 3.14 Scope ....................................................................... 28 References ............................................................................................................ 29
This report has been prepared by the Energy Practice of Ricardo Energy and Environment.
Milestone 3.14: Maximising Circuit Transfer Capacity
UK Power Networks (Operations) Limited. Registered in England and Wales. Registered No. 3870728. Registered Office: Newington House, 237 Southwark Bridge Road, London,
SE1 6NP Page 3 of 29
1. Introduction This document details the evidence for the Ricardo-AEA milestone, on Maximising Circuit Transfer
Capacity, for Work Stream 3.14 of FUN-LV. The key deliverable is:
Documentation of the development of dynamic rating algorithms for determining the real-time
rating of transformers and cable circuits with tabulated and charted evidence of their
performance and benefits.
It should be noted that the work on deriving load profiles for transformers based on temperature sensor data
has been documented as part of SDRC9.1 (FUNLV_SP_WS1_042_Selection Criteria and
Approach_v1.00_FINAL). Revision to the coverage of this activity is summarised in Appendix D. Therefore,
this report focuses on the dynamic ratings of cable circuits.
The following sections detail work carried out in this activity:
Subsequent discussions with Peter Lang, the principles of dynamic rating are explained in
Section 2, which covers a literature review and discussions with Professor. Paul Lewin and Dr
Pilgrim from the University of Southampton;
In Section 3 the laboratory set up is described;
Section 4 presents the data analysis, including the development of a model, and comparison
between modelled and measured data;
A discussion on potential demonstrations and recommended sites is covered in Section 5; and
Finally, a summary and conclusions are given in Section 6.
Appendices provide additional information on:
Small Section Cables;
Transfer load profiles; and
Asset Guarding and Field Monitoring Systems.

Milestone 3.14: Maximising Circuit Transfer Capacity
UK Power Networks (Operations) Limited. Registered in England and Wales. Registered No. 3870728. Registered Office: Newington House, 237 Southwark Bridge Road, London,
SE1 6NP Page 4 of 29
2. Dynamic Rating Principles
Background
The key functionality of the FUN-LV Power Electronics (PE) Soft Open Points (SOP) solution is the
ability to finely control power flow, to:
• provide capacity equalisation between distribution substations, irrespective of their network
impedances or sources of supply, and
• release LV circuit capacity by the control of circuit loading and unbalance to dynamic limits.
To be able to transfer power between substations it is necessary to make the maximum use of both
transformers and existing cables, without unduly compromising their integrity or asset life. The lifetime
of equipment insulation is determined by the Arrhenius theory of electrolytic dissociation:
𝐼𝑛𝑠𝑢𝑙𝑎𝑡𝑖𝑜𝑛 𝐿𝑖𝑓𝑒𝑡𝑖𝑚𝑒 ∝ 10
1
(𝐿𝑜𝑎𝑑𝑖𝑛𝑔𝑅𝑎𝑡𝑖𝑛𝑔
)⁄
Hence using equipment at even a small amount over their design rating will result in a dramatic
reduction in insulation lifetime.
The essential difference between the “Release of Transfer Capacity” (also known as “Loading to
Dynamic Limits”) and “Dynamic Rating systems” is the control over the circuit load that is provided by
Power Electronics, preventing dynamic ratings being exceeded. This means that the thermal capacity
conventionally reserved to allow for normally uncontrollable fluctuations in load currents could be
released for use.
The loading profiles of equalisation circuits (or “transfer profiles”) will normally be determined by a
combination of the difference between the connected substation utilisations and the load on the circuit
itself. Transfer profiles may therefore be quite different in nature to that of distribution circuits: potentially
having higher peak loads but for shorter periods than conventionally loaded circuits and often from a
lower base load condition.
Controlled loading to dynamic limits by Power Electronics should also enable increases in the maximum
sustainable short transfers able to be provided at LV to provide network support on interconnected
networks under HV fault conditions. This will reduce the risk of LV cascade tripping, whilst also not
increasing short circuit levels.
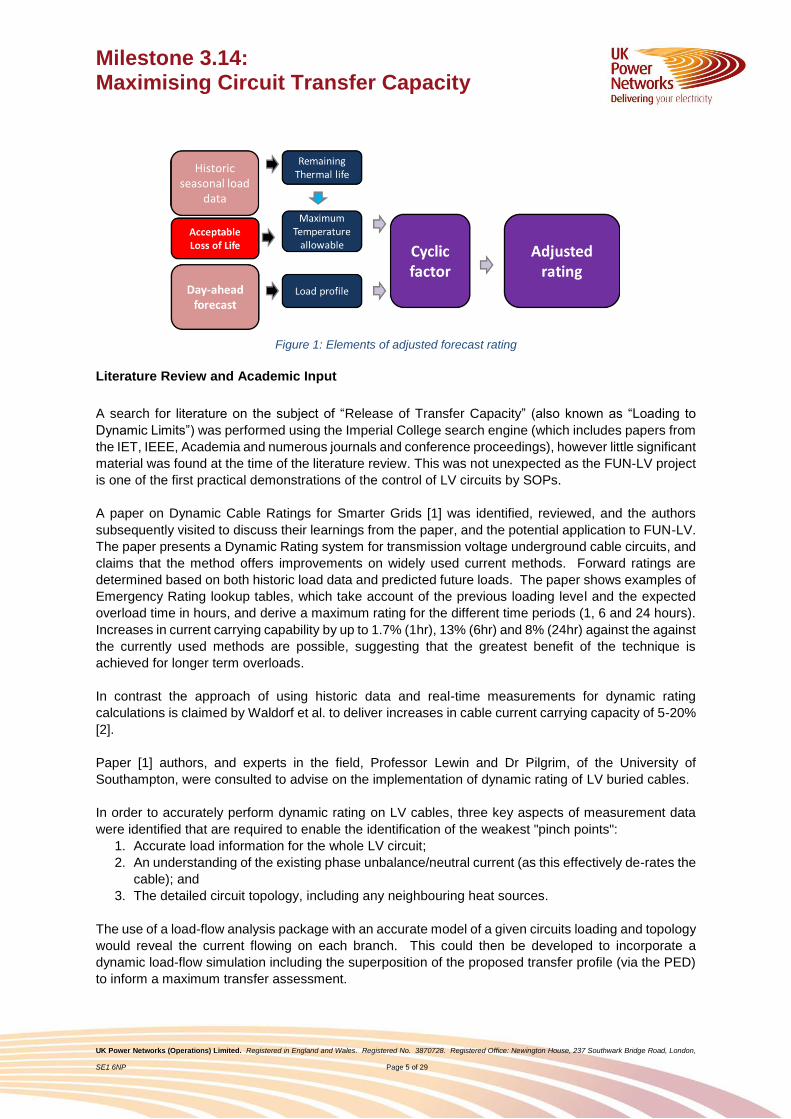
According to the FUN-LV Asset Guarding strategy, the information being collected by the SOP and the
monitoring at remote ends of circuits should also allow the conductor temperature for the next 24 hours
to be calculated based on the historic and predicted load. The forecast emergency rating can therefore
be obtained for any time within the next 24 hours (see figure 1) and recalculated in real time from the
measured data.
Milestone 3.14: Maximising Circuit Transfer Capacity
UK Power Networks (Operations) Limited. Registered in England and Wales. Registered No. 3870728. Registered Office: Newington House, 237 Southwark Bridge Road, London,
SE1 6NP Page 5 of 29
Figure 1: Elements of adjusted forecast rating
Literature Review and Academic Input
A search for literature on the subject of “Release of Transfer Capacity” (also known as “Loading to
Dynamic Limits”) was performed using the Imperial College search engine (which includes papers from
the IET, IEEE, Academia and numerous journals and conference proceedings), however little significant
material was found at the time of the literature review. This was not unexpected as the FUN-LV project
is one of the first practical demonstrations of the control of LV circuits by SOPs.
A paper on Dynamic Cable Ratings for Smarter Grids [1] was identified, reviewed, and the authors
subsequently visited to discuss their learnings from the paper, and the potential application to FUN-LV.
The paper presents a Dynamic Rating system for transmission voltage underground cable circuits, and
claims that the method offers improvements on widely used current methods. Forward ratings are
determined based on both historic load data and predicted future loads. The paper shows examples of
Emergency Rating lookup tables, which take account of the previous loading level and the expected
overload time in hours, and derive a maximum rating for the different time periods (1, 6 and 24 hours).
Increases in current carrying capability by up to 1.7% (1hr), 13% (6hr) and 8% (24hr) against the against
the currently used methods are possible, suggesting that the greatest benefit of the technique is
achieved for longer term overloads.
In contrast the approach of using historic data and real-time measurements for dynamic rating
calculations is claimed by Waldorf et al. to deliver increases in cable current carrying capacity of 5-20%
[2].
Paper [1] authors, and experts in the field, Professor Lewin and Dr Pilgrim, of the University of
Southampton, were consulted to advise on the implementation of dynamic rating of LV buried cables.
In order to accurately perform dynamic rating on LV cables, three key aspects of measurement data
were identified that are required to enable the identification of the weakest "pinch points":
1. Accurate load information for the whole LV circuit;
2. An understanding of the existing phase unbalance/neutral current (as this effectively de-rates the
cable); and
3. The detailed circuit topology, including any neighbouring heat sources.
The use of a load-flow analysis package with an accurate model of a given circuits loading and topology
would reveal the current flowing on each branch. This could then be developed to incorporate a
dynamic load-flow simulation including the superposition of the proposed transfer profile (via the PED)
to inform a maximum transfer assessment.
Milestone 3.14: Maximising Circuit Transfer Capacity
UK Power Networks (Operations) Limited. Registered in England and Wales. Registered No. 3870728. Registered Office: Newington House, 237 Southwark Bridge Road, London,
SE1 6NP Page 6 of 29
Accurate assessment of the dynamic rating capability of LV circuits would require detailed modelling of
each cables’ intrinsic electrical and thermal characteristics, the external environment (soil thermal
resistivity, adjacent heat sources etc.), and the detailed circuit loading.
Items 1 and 2 from the above list should be possible in due course through the development and
validation of advanced LV modelling capability of DPlan. However, the level of investigation and
monitoring required to accurately model a cables topology and external environment would make this
conventional approach impractical to achieve within the scope and timescales of the FUN-LV project
and its field trials.
Other non-invasive approaches to remotely establishing the temperature of buried cables at specific
points have been identified and have been the subject of separate preliminary and independently
funded research studies at Imperial College. However, the use of these studies are outside the current
scope of FUN-LV.
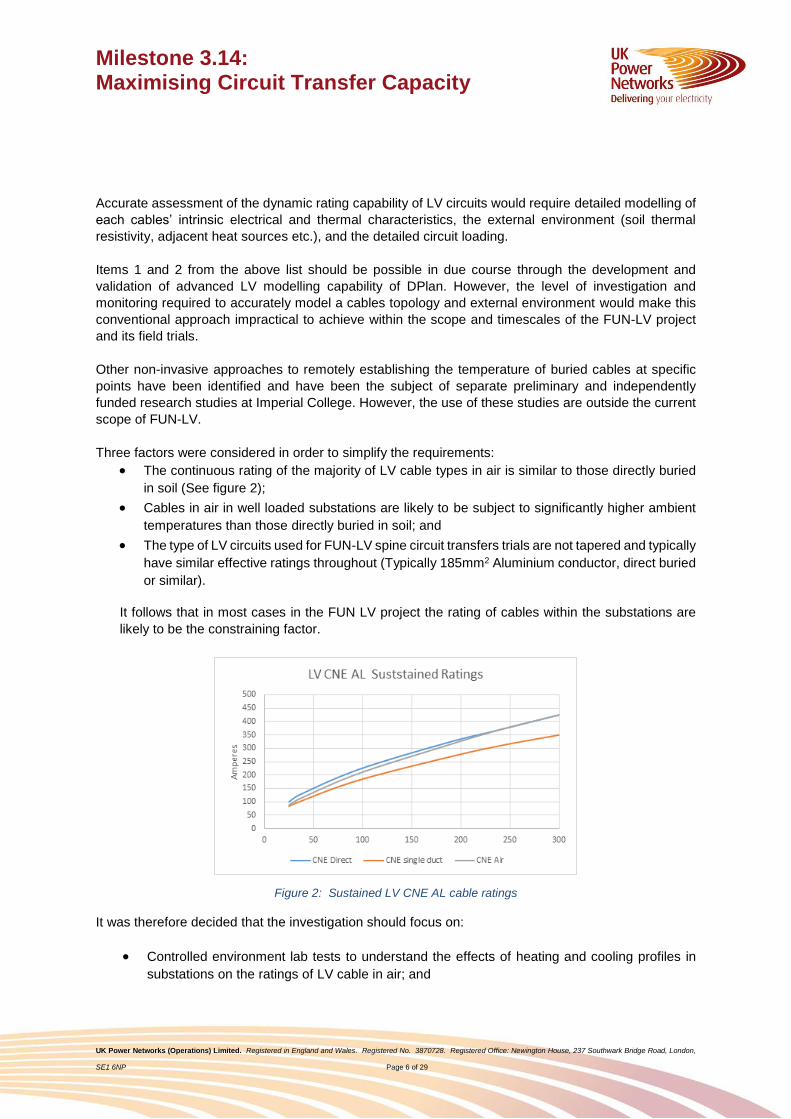
Three factors were considered in order to simplify the requirements:
The continuous rating of the majority of LV cable types in air is similar to those directly buried
in soil (See figure 2);
Cables in air in well loaded substations are likely to be subject to significantly higher ambient
temperatures than those directly buried in soil; and
The type of LV circuits used for FUN-LV spine circuit transfers trials are not tapered and typically
have similar effective ratings throughout (Typically 185mm2 Aluminium conductor, direct buried
or similar).
It follows that in most cases in the FUN LV project the rating of cables within the substations are
likely to be the constraining factor.
Figure 2: Sustained LV CNE AL cable ratings
It was therefore decided that the investigation should focus on:
Controlled environment lab tests to understand the effects of heating and cooling profiles in
substations on the ratings of LV cable in air; and
Milestone 3.14: Maximising Circuit Transfer Capacity
UK Power Networks (Operations) Limited. Registered in England and Wales. Registered No. 3870728. Registered Office: Newington House, 237 Southwark Bridge Road, London,
SE1 6NP Page 7 of 29
A subsequent potential demonstration of the SOPs to exercise control over the cable loading
to maximise the transfer capacity without unduly compromising cable life or integrity.
The principle being that exactly the same SOP control methods can be used for the underground
sections of circuits once non-invasive approaches to remotely establishing the temperature of buried
cables along their lengths are available.
Milestone 3.14: Maximising Circuit Transfer Capacity
UK Power Networks (Operations) Limited. Registered in England and Wales. Registered No. 3870728. Registered Office: Newington House, 237 Southwark Bridge Road, London,
SE1 6NP Page 8 of 29
3. Lab tests
Overview
This study aims to conduct a series of laboratory tests to provide insight into circuit short-term maximum
transfer capability, without exceeding thermal safety limits. By examining the dynamic temperature
response of LV cables subjected to large step-changes in load (replicating the transfer profiles
envisaged through the use of controllable Power Electronics) this study will generate learning in
assessing the maximum possible circuit transfers. This modelling requires knowledge of near real-time
power flows at different points on the LV network under consideration.
A test environment was built to enable development of an understanding of cable temperature response
to load changes in ambient air and single way ducts. This will be of particular use in providing insight
into the impact of the indicative transfer profiles envisaged using the Power Electronic Device (PED) for
FUN-LV Method 2 and 3 sites (2-terminal and 3-terminal SOPs respectively).
Test arrangements
A series of tests have been conducted on 185mm2 HV Cu Paper Insulated Lead Covered Steel Wire
Armoured sheath (PILCSWAS) and 185mm2 LV AL Paper Insulated Lead Covered Single Tape
Armoured Sheath (PILCSTAS) cable samples to examine the thermal response due to conventional
load profiles and indicative PED “transfer profiles” with short periods of higher load.
The trials have focussed on PILC type cable as these have a lower thermal capacity (60-65oC) than
XLPE types (up to 90oC), meaning they should represent the worst case.
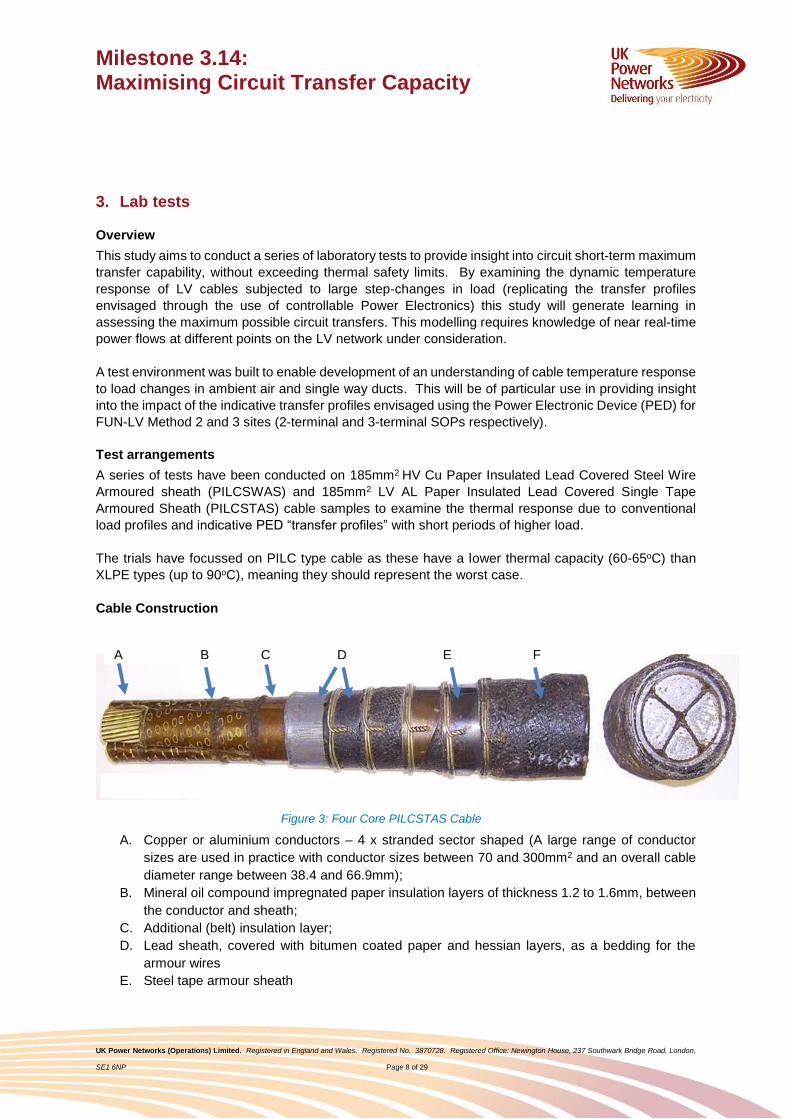
Cable Construction
A. Copper or aluminium conductors – 4 x stranded sector shaped (A large range of conductor
sizes are used in practice with conductor sizes between 70 and 300mm2 and an overall cable
diameter range between 38.4 and 66.9mm);
B. Mineral oil compound impregnated paper insulation layers of thickness 1.2 to 1.6mm, between
the conductor and sheath;
C. Additional (belt) insulation layer;
D. Lead sheath, covered with bitumen coated paper and hessian layers, as a bedding for the
armour wires
E. Steel tape armour sheath
A B C D E F
Figure 3: Four Core PILCSTAS Cable

Milestone 3.14: Maximising Circuit Transfer Capacity
UK Power Networks (Operations) Limited. Registered in England and Wales. Registered No. 3870728. Registered Office: Newington House, 237 Southwark Bridge Road, London,
SE1 6NP Page 9 of 29
F. Bitumen coated hessian tape serving or oversheath (This may be chalked as was the sample
supplied for test).
Note that the steel tape example shown in figure 3 has a reduced cross section neutral. The test sample has a full section neutral. LPN typically used steel wire rather than steel tape armours
Figure 4. The four core PILCSTAS cable (with full section neutral) used in the lab tests.
A test rig was developed to enable a current injection in steps of approximately 250A, 450A and 700A
per phase. These allow representation of the following conditions:
o off,
o normal (250A);
o emergency (450A);
o ultimate emergency current rating levels (700A); and
o the rapid transitions of Transfer Profiles (i.e. step changes in current as may be caused
by the use of power electronics, as opposed to the more gradual changes associated
with demand fluctuations).
As 700A per phase represents a significant overcurrent it was only applied for a maximum of 20 minutes. The following tests have been conducted:
Six permutations of heating profiles, with applied step currents of
1. 0 - 250A;
2. 0 - 450A;
3. 0 - 700A;
4. 250 - 450A;
5. 250 - 700A; and
6. 450-700A.
Six permutations of cooling profiles (the inverse of the above),
Investigation into the effects of varying the cable starting temperature, and
Determination of the resting temperature at different loading currents in a defined environment
and from a measured start.
Further trials with other sizes and types using the same approach are possible but are outside the scope
of this initial investigation.
Milestone 3.14: Maximising Circuit Transfer Capacity
UK Power Networks (Operations) Limited. Registered in England and Wales. Registered No. 3870728. Registered Office: Newington House, 237 Southwark Bridge Road, London,
SE1 6NP Page 10 of 29
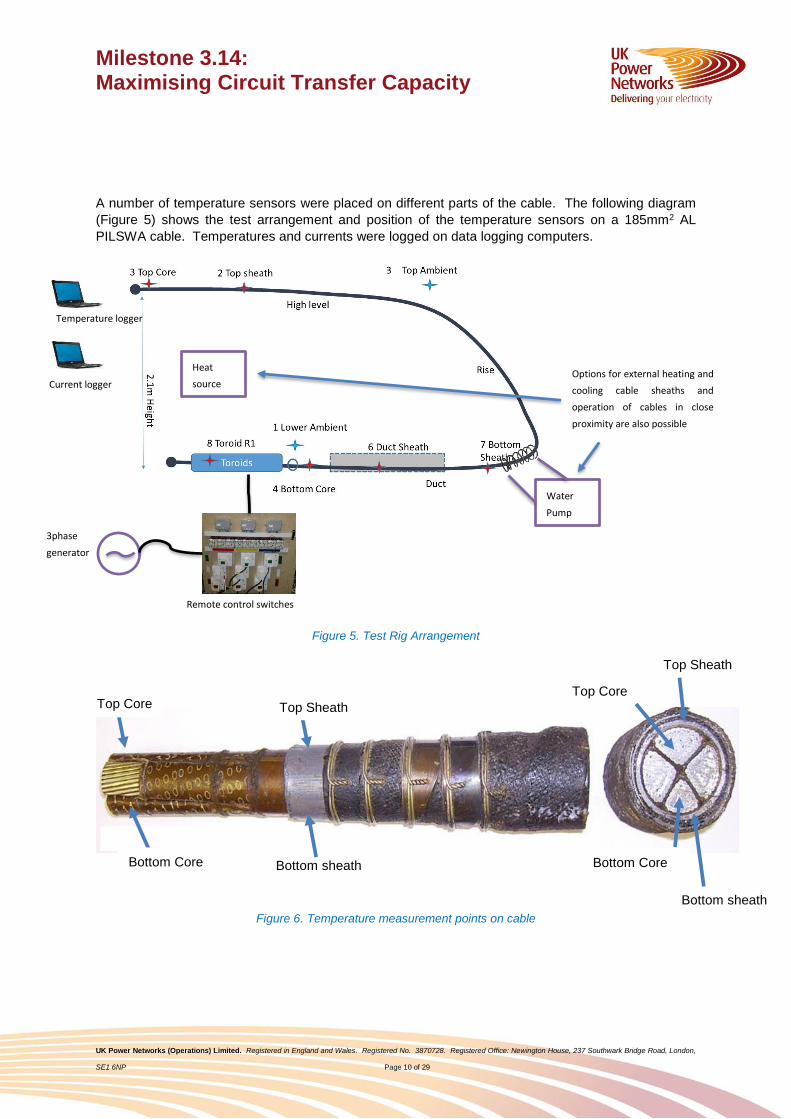
A number of temperature sensors were placed on different parts of the cable. The following diagram
(Figure 5) shows the test arrangement and position of the temperature sensors on a 185mm2 AL
PILSWA cable. Temperatures and currents were logged on data logging computers.
Figure 5. Test Rig Arrangement
Figure 6. Temperature measurement points on cable
Top Core
Bottom Core Bottom sheath
Top Sheath
Top Core
Bottom Core
Bottom sheath
Top Sheath
3phase
generator
Remote control switches
Temperature logger
Current logger Options for external heating and
cooling cable sheaths and
operation of cables in close
proximity are also possible
Water
Pump
Heat
source
Milestone 3.14: Maximising Circuit Transfer Capacity
UK Power Networks (Operations) Limited. Registered in England and Wales. Registered No. 3870728. Registered Office: Newington House, 237 Southwark Bridge Road, London,
SE1 6NP Page 11 of 29
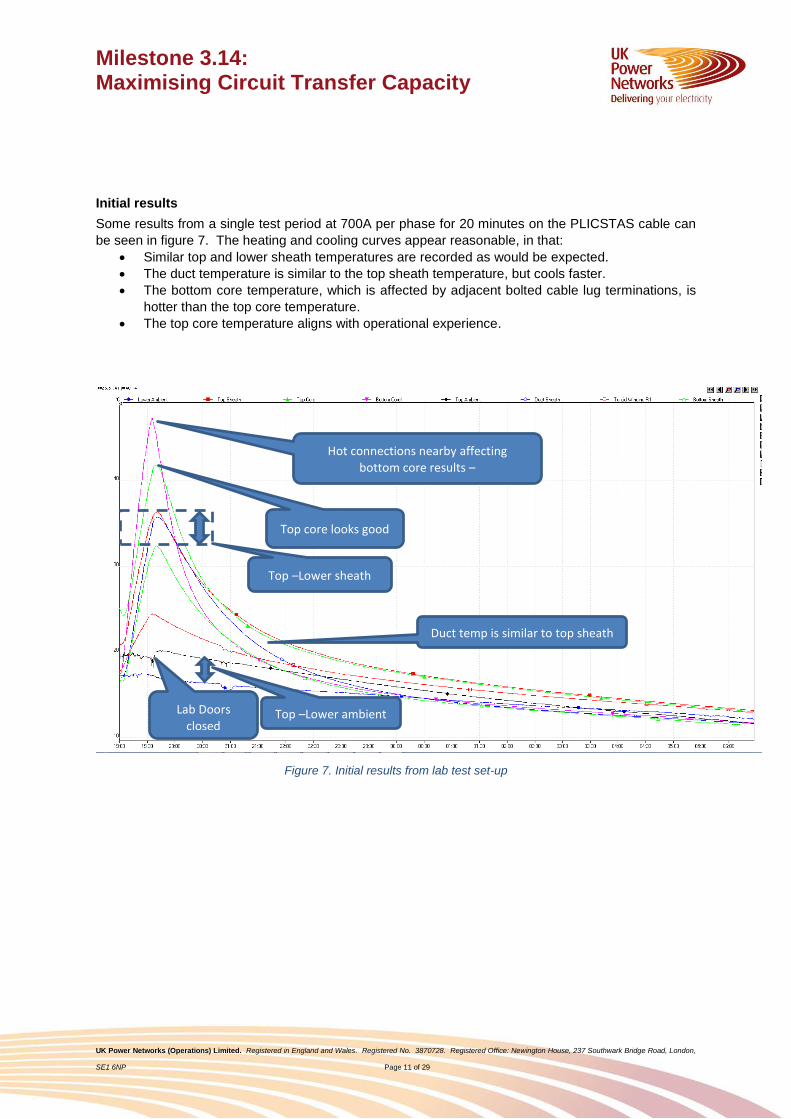
Initial results
Some results from a single test period at 700A per phase for 20 minutes on the PLICSTAS cable can
be seen in figure 7. The heating and cooling curves appear reasonable, in that:
Similar top and lower sheath temperatures are recorded as would be expected.
The duct temperature is similar to the top sheath temperature, but cools faster.
The bottom core temperature, which is affected by adjacent bolted cable lug terminations, is
hotter than the top core temperature.
The top core temperature aligns with operational experience.
Figure 7. Initial results from lab test set-up
Lab Doors
closed
Hot connections nearby affecting
bottom core results –
needs attention
Top –Lower ambient
Top –Lower sheath
Duct temp is similar to top sheath
but cools faster
Top core looks good
Milestone 3.14: Maximising Circuit Transfer Capacity
UK Power Networks (Operations) Limited. Registered in England and Wales. Registered No. 3870728. Registered Office: Newington House, 237 Southwark Bridge Road, London,
SE1 6NP Page 12 of 29
4. Data and Analysis
Cyclic load test
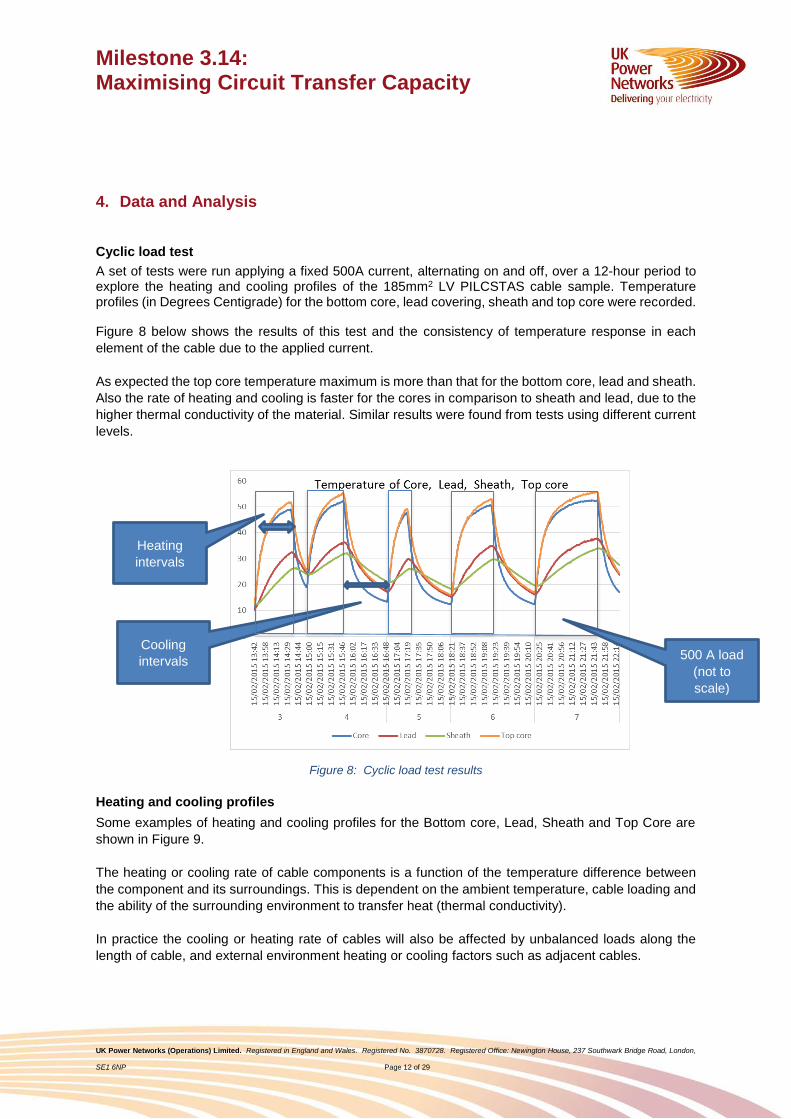
A set of tests were run applying a fixed 500A current, alternating on and off, over a 12-hour period to explore the heating and cooling profiles of the 185mm2 LV PILCSTAS cable sample. Temperature profiles (in Degrees Centigrade) for the bottom core, lead covering, sheath and top core were recorded.
Figure 8 below shows the results of this test and the consistency of temperature response in each
element of the cable due to the applied current.
As expected the top core temperature maximum is more than that for the bottom core, lead and sheath.
Also the rate of heating and cooling is faster for the cores in comparison to sheath and lead, due to the
higher thermal conductivity of the material. Similar results were found from tests using different current
levels.
Figure 8: Cyclic load test results
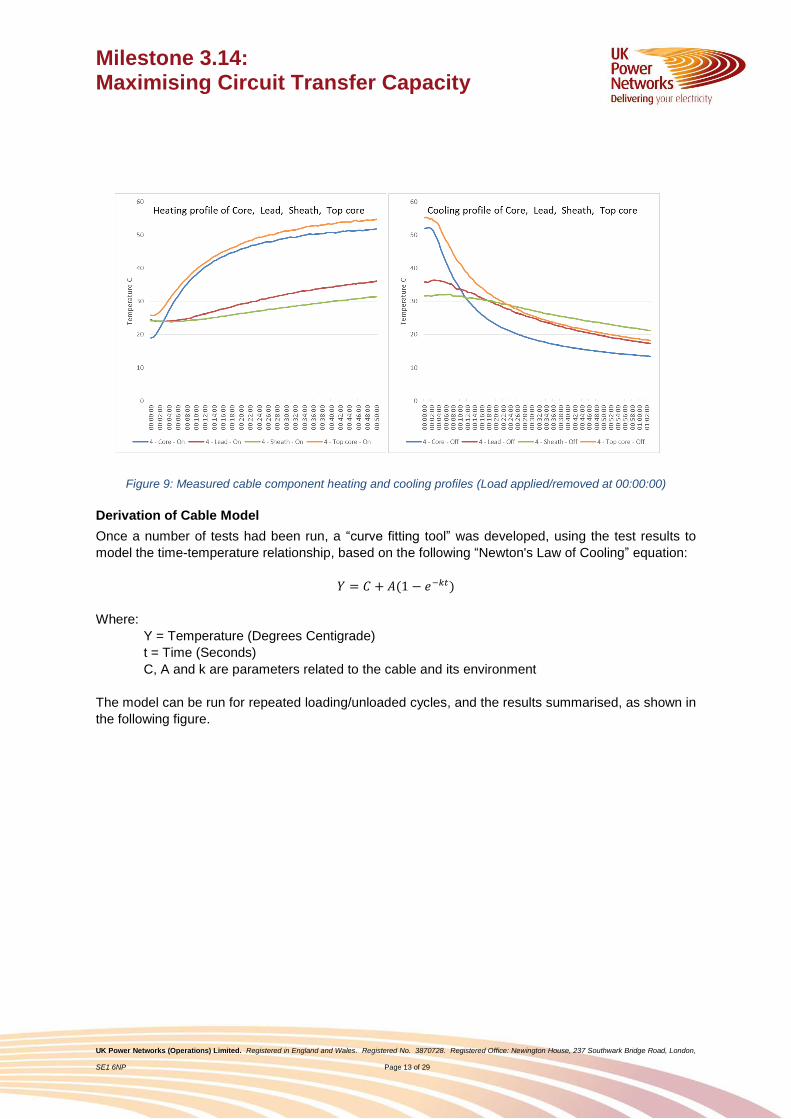
Heating and cooling profiles
Some examples of heating and cooling profiles for the Bottom core, Lead, Sheath and Top Core are
shown in Figure 9.
The heating or cooling rate of cable components is a function of the temperature difference between
the component and its surroundings. This is dependent on the ambient temperature, cable loading and
the ability of the surrounding environment to transfer heat (thermal conductivity).
In practice the cooling or heating rate of cables will also be affected by unbalanced loads along the
length of cable, and external environment heating or cooling factors such as adjacent cables.
Heating
intervals
Cooling
intervals 500 A load
(not to
scale)
Milestone 3.14: Maximising Circuit Transfer Capacity
UK Power Networks (Operations) Limited. Registered in England and Wales. Registered No. 3870728. Registered Office: Newington House, 237 Southwark Bridge Road, London,
SE1 6NP Page 13 of 29
Figure 9: Measured cable component heating and cooling profiles (Load applied/removed at 00:00:00)
Derivation of Cable Model
Once a number of tests had been run, a “curve fitting tool” was developed, using the test results to
model the time-temperature relationship, based on the following “Newton's Law of Cooling” equation:
𝑌 = 𝐶 + 𝐴(1 − 𝑒−𝑘𝑡)
Where:
Y = Temperature (Degrees Centigrade)
t = Time (Seconds)
C, A and k are parameters related to the cable and its environment
The model can be run for repeated loading/unloaded cycles, and the results summarised, as shown in
the following figure.

Milestone 3.14: Maximising Circuit Transfer Capacity
UK Power Networks (Operations) Limited. Registered in England and Wales. Registered No. 3870728. Registered Office: Newington House, 237 Southwark Bridge Road, London,
SE1 6NP Page 14 of 29
Figure 10: Cable temperature curve fitting tool
In order to demonstrate the difference between the modelled and measured temperature profiles, the heating and cooling profiles were both analysed using the curve fitting tool. The detailed output of the model is presented in Figure 11.
Rat
e o
f T
chan
ge (
TºC
/30
s)
Data A k C x^2
Top core On (2) 57.53 100.645353349 -4.639 28.63402497
T-Tamb
43 Top core Y=C+A(l-exp(-kt))
Row Labels Seconds 2 2pred Error^2
00:00:00 0 -0.73 -4.6
00:00:30 30 -0.62 -2.7
00:01:00 60 -0.03 -0.8
00:01:30 90 1.01 1.1
00:02:00 120 2.4 2.9
00:02:30 150 3.92 4.6
00:03:00 180 5.51 6.2 Only use data after N seconds
00:03:30 210 7.13 7.8 0.5 200
00:04:00 240 8.53 9.4 0.7
00:04:30 270 10.25 10.9 0.4
00:05:00 300 11.87 12.3 0.2
00:05:30 330 13.14 13.7 0.3
00:06:00 360 14.71 15.1 0.1
00:06:30 390 16.07 16.4 0.1
00:07:00 420 17.42 17.6 0.0
00:07:30 450 18.8 18.8 0.0
00:08:00 480 20.06 20.0 0.0
-10
0
10
20
30
40
50
60
0 1000 2000 3000 4000 5000 6000
Ra
te o
f T
cha
nge
(Tº
C/3
0s)
Top core
Print coefficients to "Equations" sheet
Data A k C Ʃ squares
Core On (3) 38.17 0.00149 0.818 14.038
Core On (4) 33.34 0.00151 7.789 13.423
Core On (5) 38.16 0.00162 1.450 9.799
Core On (6) 38.46 0.00152 1.057 15.233
Core On (7) 38.62 0.00146 1.796 20.485
Lead On (3) 33.20 0.00036 0.644 15.545
Lead On (4) 33.11 0.00016 13.081 16.906
Lead On (5) 50.68 0.00017 5.958 10.083
Lead On (6) 32.63 0.00031 4.014 14.682
Lead On (7) 29.77 0.00033 5.388 18.052
Sheath On (3) 80.61 0.00006 2.498 10.140
Sheath On (4) 41.84 0.00007 13.262 11.917
The constants C, A and
k are automatically
calculated based on
measured results
Milestone 3.14: Maximising Circuit Transfer Capacity
UK Power Networks (Operations) Limited. Registered in England and Wales. Registered No. 3870728. Registered Office: Newington House, 237 Southwark Bridge Road, London,
SE1 6NP Page 15 of 29
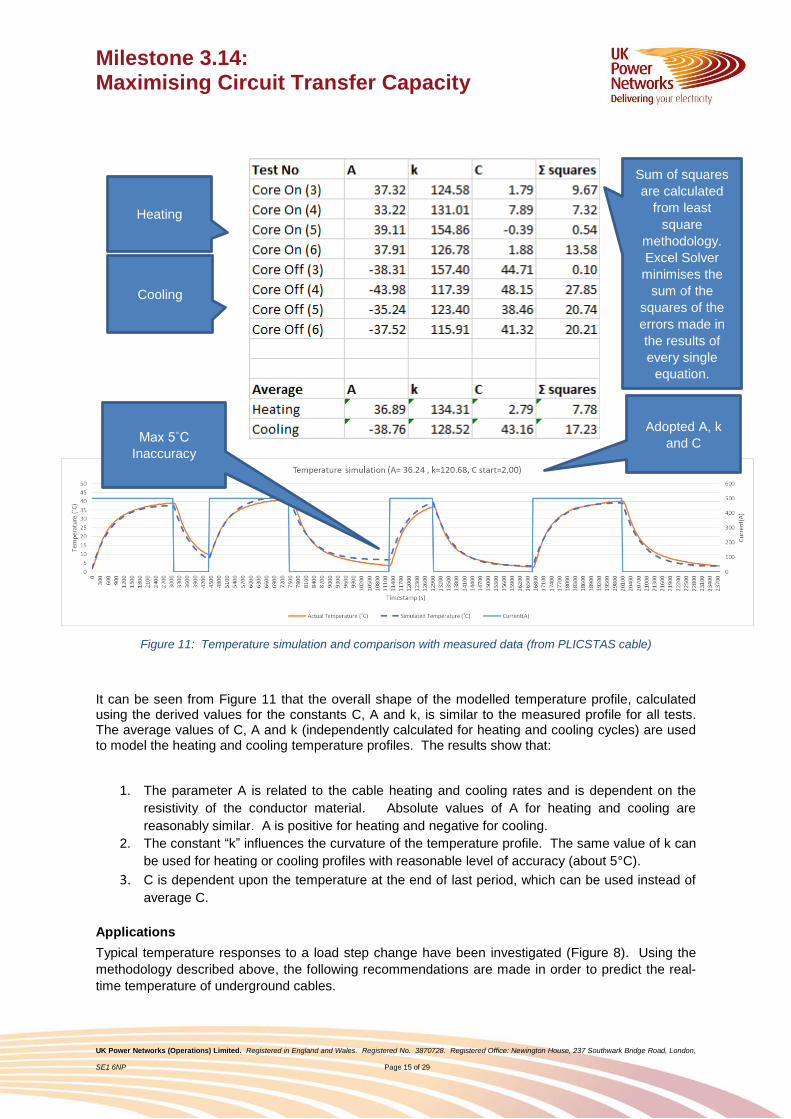
Figure 11: Temperature simulation and comparison with measured data (from PLICSTAS cable)
It can be seen from Figure 11 that the overall shape of the modelled temperature profile, calculated using the derived values for the constants C, A and k, is similar to the measured profile for all tests. The average values of C, A and k (independently calculated for heating and cooling cycles) are used to model the heating and cooling temperature profiles. The results show that:
1. The parameter A is related to the cable heating and cooling rates and is dependent on the
resistivity of the conductor material. Absolute values of A for heating and cooling are
reasonably similar. A is positive for heating and negative for cooling.
2. The constant “k” influences the curvature of the temperature profile. The same value of k can
be used for heating or cooling profiles with reasonable level of accuracy (about 5°C).
3. C is dependent upon the temperature at the end of last period, which can be used instead of
average C.
Applications
Typical temperature responses to a load step change have been investigated (Figure 8). Using the
methodology described above, the following recommendations are made in order to predict the real-
time temperature of underground cables.
Heating
Cooling
Adopted A, k
and C Max 5˚C
Inaccuracy
Sum of squares
are calculated
from least
square
methodology.
Excel Solver
minimises the
sum of the
squares of the
errors made in
the results of
every single
equation.
Milestone 3.14: Maximising Circuit Transfer Capacity
UK Power Networks (Operations) Limited. Registered in England and Wales. Registered No. 3870728. Registered Office: Newington House, 237 Southwark Bridge Road, London,
SE1 6NP Page 16 of 29
1. Carry out studies to obtain A and k values for a variety of cable types, in various heights
and layouts, using different heating and cooling sources, and ground type;
2. Derive the loading along LV circuits from CGI network analysis tool; and
3. Use the results to create algorithms that can be incorporated in the SOP control
algorithm based upon:
a. Real-time (as opposed to historic) Load conditions;
b. The cables characteristics
c. The cables position and elevation
d. The cable surrounding environment
e. Recent weather conditions
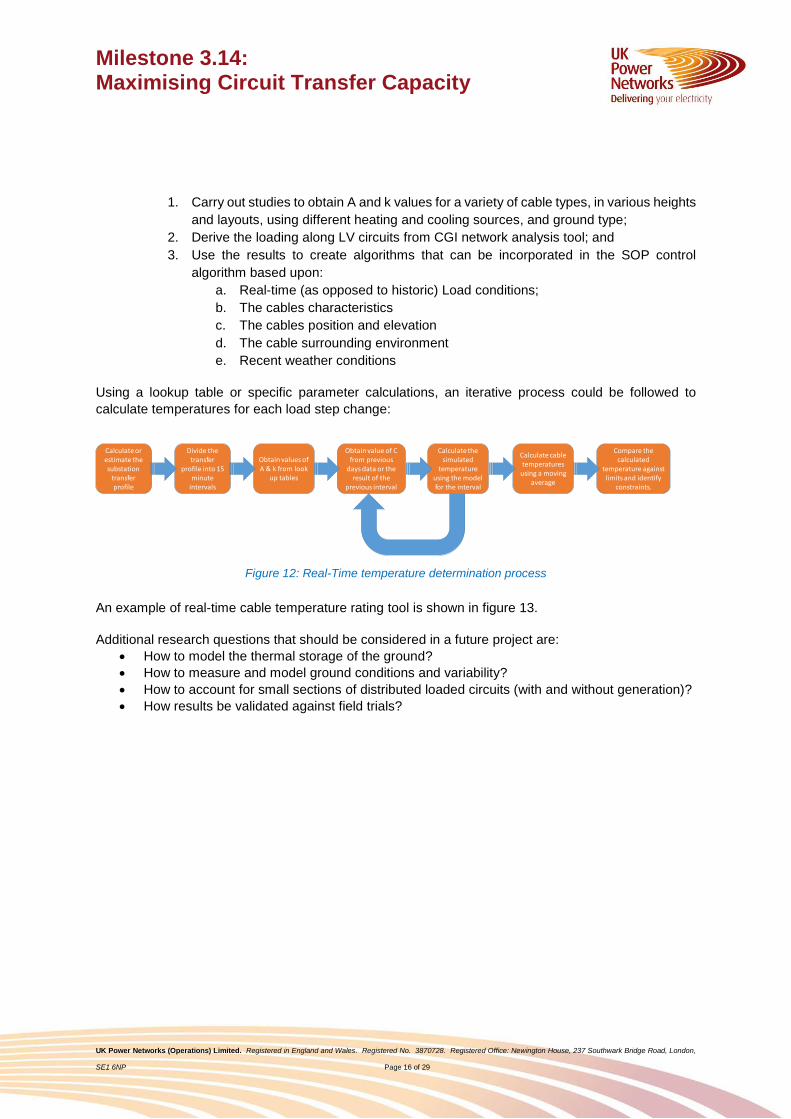
Using a lookup table or specific parameter calculations, an iterative process could be followed to
calculate temperatures for each load step change:
Figure 12: Real-Time temperature determination process
An example of real-time cable temperature rating tool is shown in figure 13.
Additional research questions that should be considered in a future project are:
How to model the thermal storage of the ground?
How to measure and model ground conditions and variability?
How to account for small sections of distributed loaded circuits (with and without generation)?
How results be validated against field trials?
Calculate or estimate the substation
transfer profile
Obtain value of C from previous
days data or the result of the
previous interval
Divide the transfer
profile into 15 minute
intervals
Obtain values of A & k from look
up tables
Calculate the simulated
temperature using the model for the interval
Calculate cable temperatures
using a moving average
Compare the calculated
temperature against limits and identify
constraints.

Page 17 of 29
Figure 13: Real-Time temperature demonstration tool
Milestone 3.14: Maximising Circuit Transfer Capacity
UK Power Networks (Operations) Limited. Registered in England and Wales. Registered No. 3870728. Registered Office: Newington House, 237 Southwark Bridge Road, London,
SE1 6NP
Page 18 of 29
5. Demonstration Plan and Sites
An activity to demonstrate the real-time application of the Maximising Circuit Transfer Capacity process
in real LPN &/or SPN networks could be implemented as part of a future study.
The trial design would demonstrate the ability of the SOP to calculate the temperature of the connected
LV cables. The calculated temperatures would then be validated against the measured temperatures,
and then used in the SOP control system to determine the maximum circuit currents permissible in
order to maximise the network support available without exceeding the cables’ defined thermal limits or
acceptable “Use of Life” rate. Suitable systems for measuring electrical power and asset temperatures
have been developed during 2016 as part of the Electricity North West Celsius NIC project are
described in Appendix c: Field Measurement Systems.
The essential process steps that should be demonstrated are:
1. The calculation of transfer profile currents of cables in real time. This will require significant
further work, outside of the scope of the FUN-LV project, to achieve, as:
The real time application of dynamic power flow systems (e.g. DPlan) are not within
the current FUN-LV scope.
Transfer profiles calculated using customer metered data and standard load profiles
has not been considered to be sufficiently accurate for use. Hence real-time measured
load data would need to be used instead of calculated data, which in practice will only
be available at circuit ends and SOP terminals.
2. Simple algorithms based on measured data, suitable for deployment in the SOP but not
requiring regular downloading of tabular files, but requiring additional memory in the SOP
controller from a system upgrade.
Site selection
The demonstration activity should focus on the following key thermal constraint pinch points:
• Ducted cables;
• Multiple cables in clusters;
• Vertical cables; and
• Cables in an environment with a high ambient temperature;
Thermal constraints caused by small section underground cables are important, but are not expected to be major issues within the selected FUN-LV trial sites. Their issues are therefore not prioritised for demonstration, but are discussed in Appendix A.
The 2-Port SOP has a lower rating than the 3-port Sops, 240kW as oppose to 400kW. It is therefore
less likely than the 3-Port SOP to encounter thermal transfer constraints. In addition, as the 2-Port
SOPs are installed as street furniture, they are not well positioned for the installation of thermal logging
equipment when it is likely that key thermal constraints are most likely to occur inside or in the immediate
vicinity of substations. 3-Port SOPs, which are installed within substations, are therefore considered to
offer a greater opportunity to investigate this subject.
To explore the full range of key thermal constraints it is recommended to select 3-Port sites that have
cables in one or more of the following conditions:
in air;
in close proximity to each other;
in higher ambient temperature conditions;
Milestone 3.14: Maximising Circuit Transfer Capacity
UK Power Networks (Operations) Limited. Registered in England and Wales. Registered No. 3870728. Registered Office: Newington House, 237 Southwark Bridge Road, London,
SE1 6NP Page 19 of 29
in vertical orientation;
with access to externally ducted cables.
This narrows the selection of target sites to those with:
well loaded existing transformers,
vertical and ceiling mounted cables, and
ducted incoming cables.
These criteria exclude LV only substations (with no transformer), those housed in separate GRP
enclosures and those without high level cable runs.
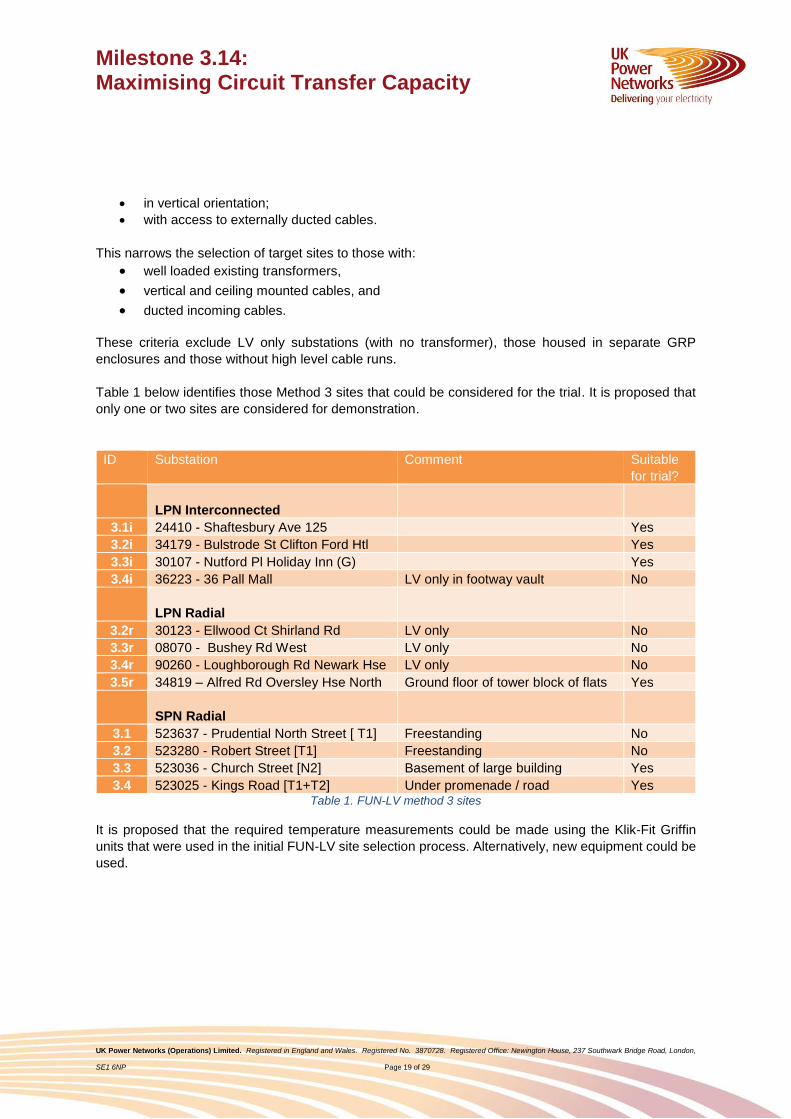
Table 1 below identifies those Method 3 sites that could be considered for the trial. It is proposed that
only one or two sites are considered for demonstration.
ID Substation Comment Suitable
for trial?
LPN Interconnected
3.1i 24410 - Shaftesbury Ave 125 Yes
3.2i 34179 - Bulstrode St Clifton Ford Htl Yes
3.3i 30107 - Nutford Pl Holiday Inn (G) Yes
3.4i 36223 - 36 Pall Mall LV only in footway vault No
LPN Radial
3.2r 30123 - Ellwood Ct Shirland Rd LV only No
3.3r 08070 - Bushey Rd West LV only No
3.4r 90260 - Loughborough Rd Newark Hse LV only No
3.5r 34819 – Alfred Rd Oversley Hse North Ground floor of tower block of flats Yes
SPN Radial
3.1 523637 - Prudential North Street [ T1] Freestanding No
3.2 523280 - Robert Street [T1] Freestanding No
3.3 523036 - Church Street [N2] Basement of large building Yes
3.4 523025 - Kings Road [T1+T2] Under promenade / road Yes Table 1. FUN-LV method 3 sites
It is proposed that the required temperature measurements could be made using the Klik-Fit Griffin
units that were used in the initial FUN-LV site selection process. Alternatively, new equipment could be
used.
Milestone 3.14: Maximising Circuit Transfer Capacity
UK Power Networks (Operations) Limited. Registered in England and Wales. Registered No. 3870728. Registered Office: Newington House, 237 Southwark Bridge Road, London,
SE1 6NP Page 20 of 29
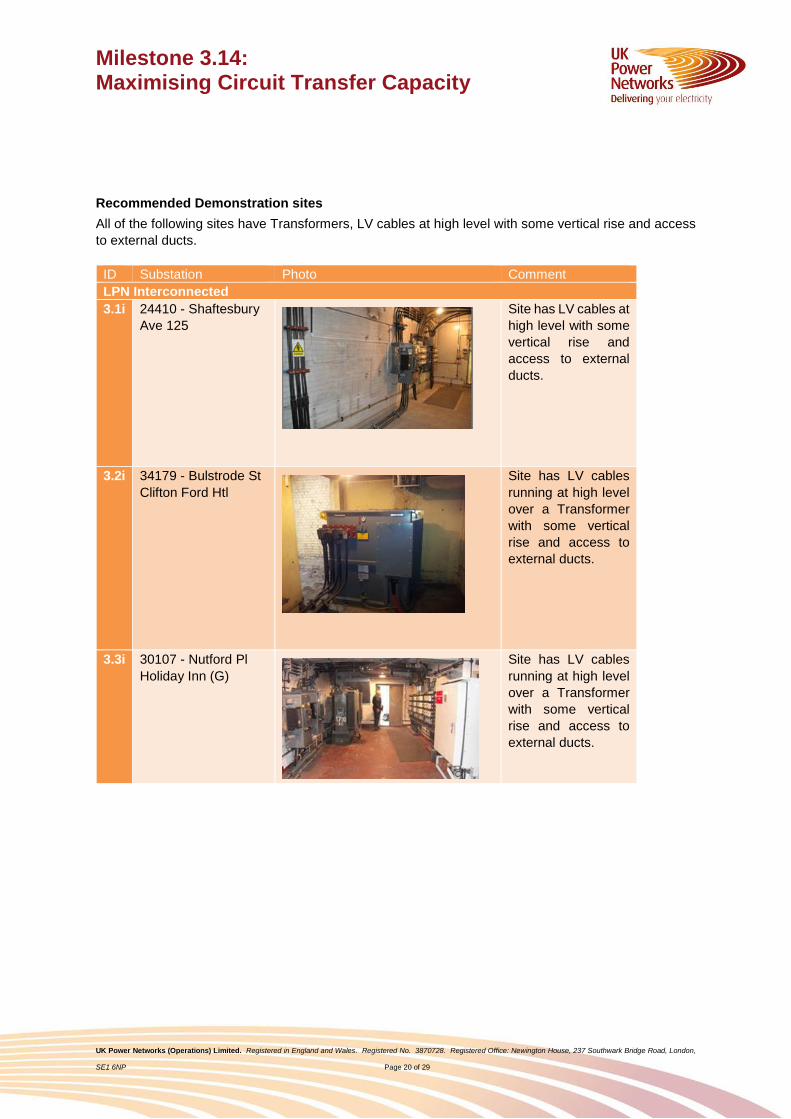
Recommended Demonstration sites
All of the following sites have Transformers, LV cables at high level with some vertical rise and access
to external ducts.
ID Substation Photo Comment
LPN Interconnected
3.1i 24410 - Shaftesbury
Ave 125
Site has LV cables at
high level with some
vertical rise and
access to external
ducts.
3.2i 34179 - Bulstrode St
Clifton Ford Htl
Site has LV cables
running at high level
over a Transformer
with some vertical
rise and access to
external ducts.
3.3i 30107 - Nutford Pl
Holiday Inn (G)
Site has LV cables
running at high level
over a Transformer
with some vertical
rise and access to
external ducts.
Milestone 3.14: Maximising Circuit Transfer Capacity
UK Power Networks (Operations) Limited. Registered in England and Wales. Registered No. 3870728. Registered Office: Newington House, 237 Southwark Bridge Road, London,
SE1 6NP Page 21 of 29
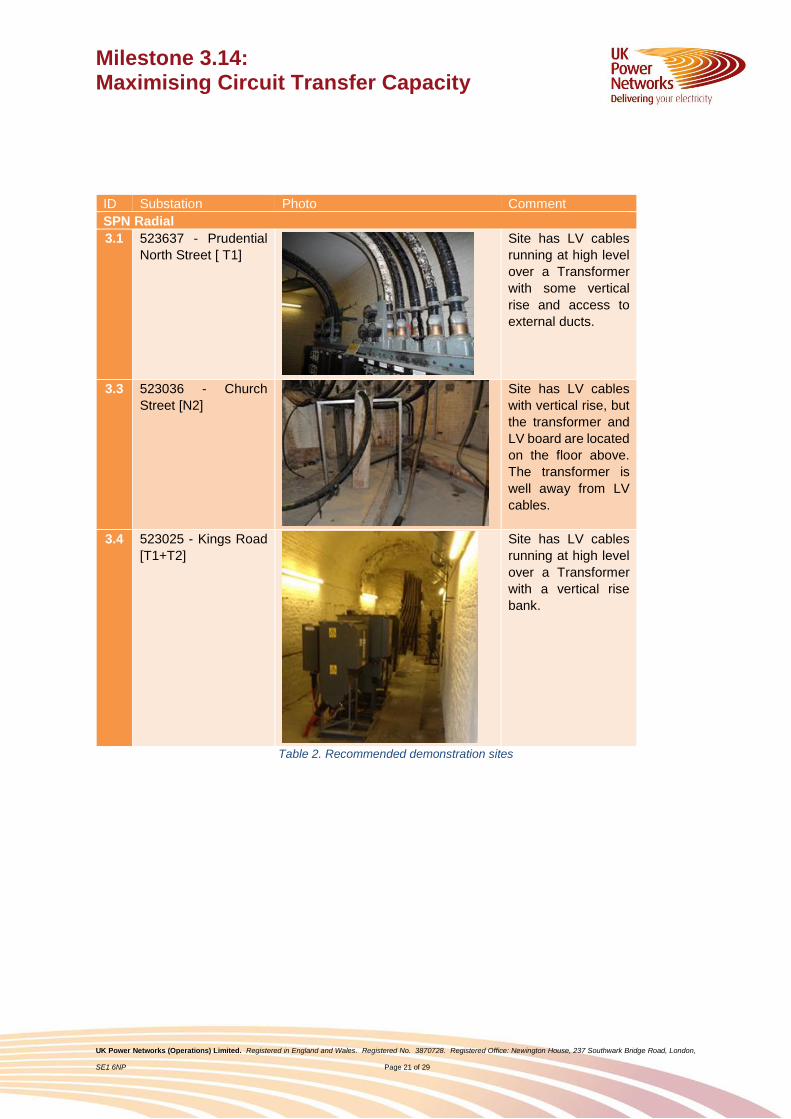
ID Substation Photo Comment
SPN Radial
3.1 523637 - Prudential
North Street [ T1]
Site has LV cables
running at high level
over a Transformer
with some vertical
rise and access to
external ducts.
3.3 523036 - Church
Street [N2]
Site has LV cables
with vertical rise, but
the transformer and
LV board are located
on the floor above.
The transformer is
well away from LV
cables.
3.4 523025 - Kings Road
[T1+T2]
Site has LV cables
running at high level
over a Transformer
with a vertical rise
bank.
Table 2. Recommended demonstration sites
Milestone 3.14: Maximising Circuit Transfer Capacity
UK Power Networks (Operations) Limited. Registered in England and Wales. Registered No. 3870728. Registered Office: Newington House, 237 Southwark Bridge Road, London,
SE1 6NP Page 22 of 29
6. Summary and conclusions
Background research indicates that dynamic ratings have potential to deliver increases of between 5
and 20% in cable current carrying capacity using historic and real-time data [2]. The key inputs in
determining dynamic ratings are day-ahead load and temperature prediction, and factors associated
with the cables and surrounding environment. Lookup tables have been developed and used by the
University of Southampton based on laboratory tests [1]. However, this approach is not well suited to
Maximising Circuit Transfer Capacity and the scale of work required to develop a similar approach for
FUN-LV is both outside of the project scope and would require large scale monitoring / validation of
distributed buried cable temperatures.
In order to demonstrate the concept of real-time temperature prediction and dynamic rating a test rig
has been built to enable a current injection in steps of approximately 250A, 450A and 700A per phase.
The results indicated that the concept of real-time temperature prediction and dynamic rating can be
demonstrated using a time-temperature relationship; which was validated by comparing experimental
results against a model. An example tool has been developed and the steps required to validate the
tool have been detailed. The key parameters in the real-time temperature equation used in the model,
A, C and k, can be determined from trials.
A site selection activity was carried out in order to identify candidate FUN-LV sites for a potential future
dynamic rating demonstration. The recommended sites are:
LPN
24410 - Shaftesbury Ave 125
34179 - Bulstrode St Clifton Ford Htl
30107 - Nutford Pl Holiday Inn (G)
SPN
523637 - Prudential North Street [ T1 ]
523036 - Church Street [ N2 ]
523025 - Kings Road [T1+T2]
Whilst all the sites are suitable those in bold are prioritised as the most appropriate for initial trials.
These sites have the highest potential for demonstrating the impact of heat on high level LV cables and
consequentially the greatest potential for using the SOP to maximise the capacity of these LV circuits
to within thermal limits.

Milestone 3.14: Maximising Circuit Transfer Capacity
UK Power Networks (Operations) Limited. Registered in England and Wales. Registered No. 3870728. Registered Office: Newington House, 237 Southwark Bridge Road, London,
SE1 6NP Page 23 of 29
Appendix A: Small Section Cables
Although not identified in the FUN-LV demonstration circuits, there are credible small section circuit
constraint scenarios, both with and without generation connected. In the following examples the arrows
represent units of loading and the thickness of the lines represent the rating of circuits. Small section
constraints are ringed in red.
Figure 14. Examples of small section circuit constraints
For the FUN-LV demonstration networks no significant small section constraints were identified, as the
Spine circuits in these networks are of uniform equivalent section, and the generation connected to the
distribution cables is at present too small to have a significant impact on ratings. Larger generation is
generally being connected direct to the LV board via dedicated separate cables.
Milestone 3.14: Maximising Circuit Transfer Capacity
UK Power Networks (Operations) Limited. Registered in England and Wales. Registered No. 3870728. Registered Office: Newington House, 237 Southwark Bridge Road, London,
SE1 6NP Page 24 of 29
The rating of a cable section could be artificially constrained, to simulate a small section for
demonstration purposes. However:
The temperature of buried cable sections in the field trials cannot be easily measured to validate
the results; and
The measurement would be of the actual installed cable, and not of the small section simulation,
so validation would not be possible.

Milestone 3.14: Maximising Circuit Transfer Capacity
UK Power Networks (Operations) Limited. Registered in England and Wales. Registered No. 3870728. Registered Office: Newington House, 237 Southwark Bridge Road, London,
SE1 6NP Page 25 of 29
Appendix B: Examples of FUN-LV Load Transfer Profiles and Asset Guarding
Transfer Profiles
The transfer profile created by SOPs is a function of the difference between the transformer load profiles
and utilisations, the spine circuit loading and length and any utilisation bandwidth threshold or asset
guarding settings on the SOP.
In practice the transfers vary widely including:
Those that comprise occasional short bursts, equalising demand peaks;
Those that vary over the course of a day in a similar manner to a conventional load profile; and
Those that operate almost continuously.
The transfer profiles are dynamic and can change rapidly in response to changes in loading conditions,
as well as during network support following an HV or LV circuit fault.
Figure 15. Examples of SOP Transfer profiles
There is therefore no simple rule that can be generically applied to estabish what would be reasonable loading limits for transfer profiles in the way that has been historically applied to conventional load profiles. It is also notable that the transfers demonstrated in the field trials were limited so as to not have a detrimental effect on any asset life.
Milestone 3.14: Maximising Circuit Transfer Capacity
UK Power Networks (Operations) Limited. Registered in England and Wales. Registered No. 3870728. Registered Office: Newington House, 237 Southwark Bridge Road, London,
SE1 6NP Page 26 of 29
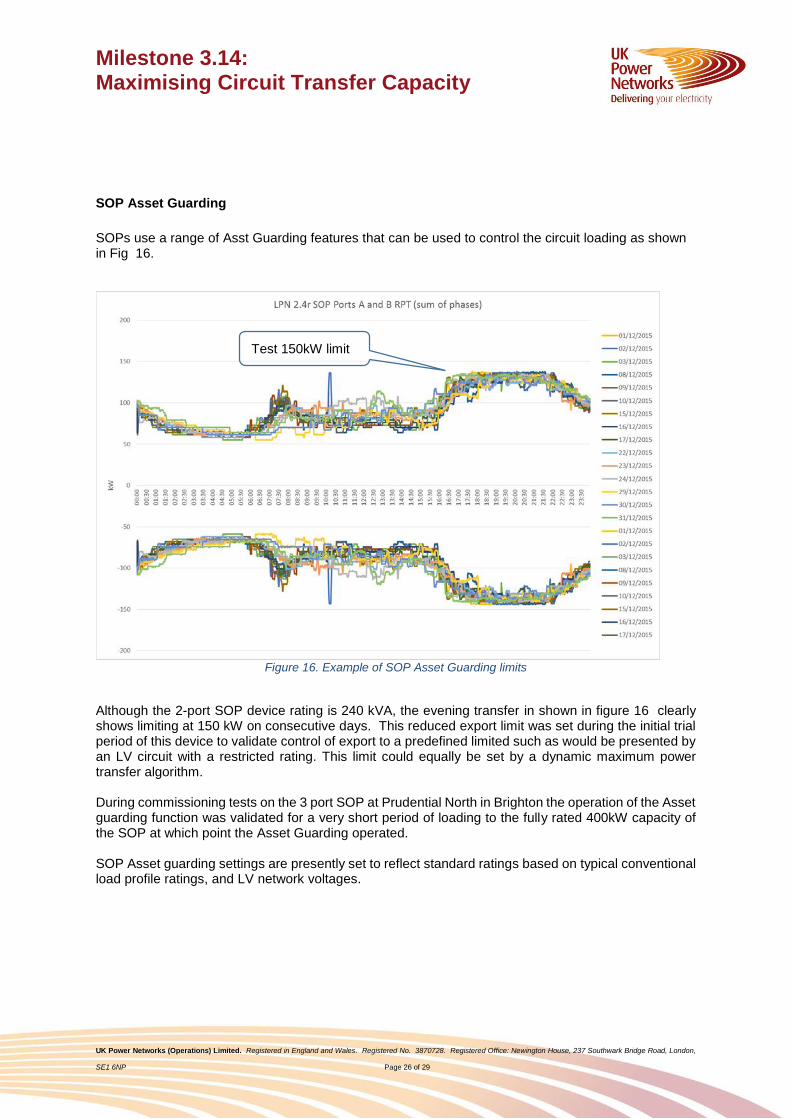
SOP Asset Guarding
SOPs use a range of Asst Guarding features that can be used to control the circuit loading as shown in Fig 16.
Figure 16. Example of SOP Asset Guarding limits
Although the 2-port SOP device rating is 240 kVA, the evening transfer in shown in figure 16 clearly shows limiting at 150 kW on consecutive days. This reduced export limit was set during the initial trial period of this device to validate control of export to a predefined limited such as would be presented by an LV circuit with a restricted rating. This limit could equally be set by a dynamic maximum power transfer algorithm. During commissioning tests on the 3 port SOP at Prudential North in Brighton the operation of the Asset guarding function was validated for a very short period of loading to the fully rated 400kW capacity of the SOP at which point the Asset Guarding operated. SOP Asset guarding settings are presently set to reflect standard ratings based on typical conventional load profile ratings, and LV network voltages.
Test 150kW limit
Milestone 3.14: Maximising Circuit Transfer Capacity
UK Power Networks (Operations) Limited. Registered in England and Wales. Registered No. 3870728. Registered Office: Newington House, 237 Southwark Bridge Road, London,
SE1 6NP Page 27 of 29
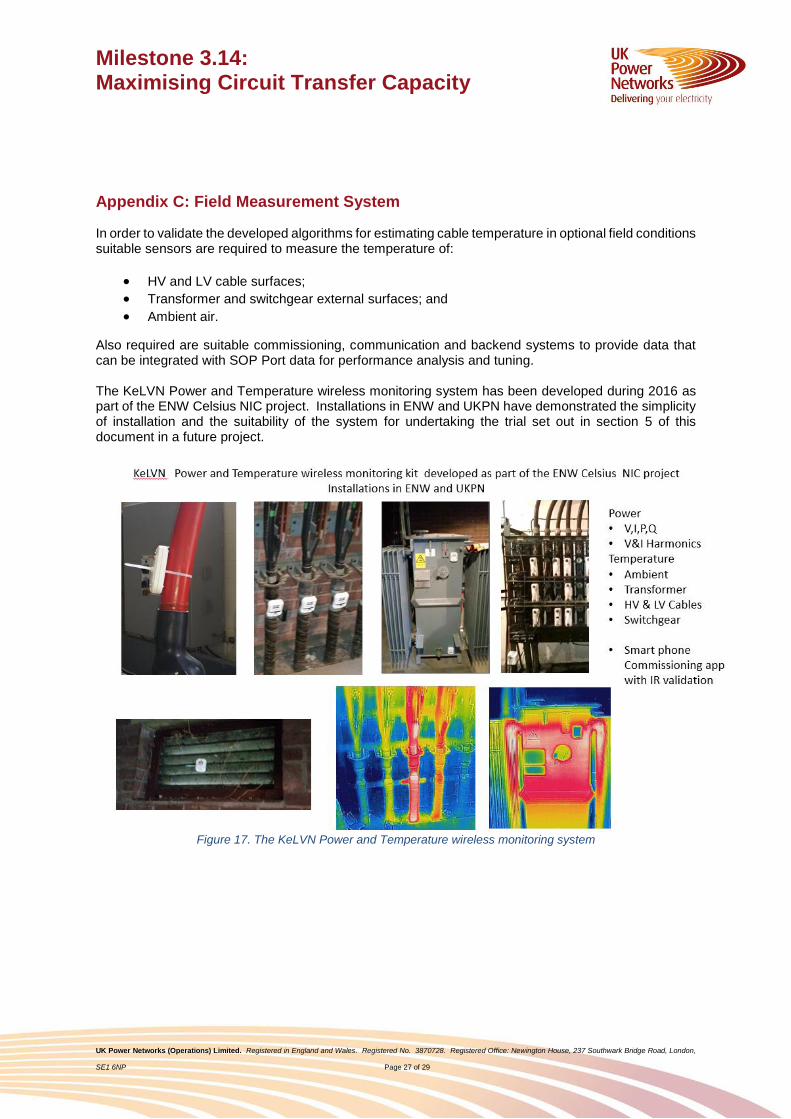
Appendix C: Field Measurement System In order to validate the developed algorithms for estimating cable temperature in optional field conditions suitable sensors are required to measure the temperature of:
HV and LV cable surfaces; Transformer and switchgear external surfaces; and Ambient air.
Also required are suitable commissioning, communication and backend systems to provide data that can be integrated with SOP Port data for performance analysis and tuning. The KeLVN Power and Temperature wireless monitoring system has been developed during 2016 as part of the ENW Celsius NIC project. Installations in ENW and UKPN have demonstrated the simplicity of installation and the suitability of the system for undertaking the trial set out in section 5 of this document in a future project.
Figure 17. The KeLVN Power and Temperature wireless monitoring system
Milestone 3.14: Maximising Circuit Transfer Capacity
UK Power Networks (Operations) Limited. Registered in England and Wales. Registered No. 3870728. Registered Office: Newington House, 237 Southwark Bridge Road, London,
SE1 6NP Page 28 of 29
Appendix D: Milestone 3.14 Scope
A meeting was held between Ricardo Energy & Environment and the FUN-LV Technical Lead on 20th
April 2014 to discuss the scope of the Maximising Circuit Transfer Capacity activity.
The scope of the activity has changed since the inception of the milestone descriptions for a number of
reasons. These include:
• The original aim of the activity was to predict and use real-time transfer profiles. However, neither
GE nor CGI have resources or scope to incorporate this functionality. Further the FUN-LV
demonstrations indicate that the thermal constraints appear to be at circuit ends in substations.
• While there is potential to incorporate the outcomes into the SOP control algorithm using real-time
data, there are potential constraints around the amount of working memory available in the devices.
This could be alleviated to some extent by upgrading the Programmable Logic Controller. However,
this would not be possible within the project timescales.
• Setting up and running the lab tests to obtain data for an algorithmic approach was more complex
than anticipated, and the project budget and timescales precluded further expenditure.
It was therefore agreed that the revised aim of the activity would be to complete the laboratory tests in
order to provide insight into short-term maximum transfers. It was proposed that the scope for this
activity would be restricted to:
• Completion of the final lab tests
• Finalise the algorithms that model thermal heating and cooling paths against circuit loading
• Document the concepts for tracking and predicting circuit temperatures from real time loading
measurements
• Document the milestone activity and results so far, including learning points from the field trials such
as the impact of transfer profiles on assets and the effect of asset guarding limits.
• Make recommendations for the next steps required for development of the concept and a limited
field demonstration trial on one or two 3-port sites once they are fully operational
Milestone 3.14: Maximising Circuit Transfer Capacity
UK Power Networks (Operations) Limited. Registered in England and Wales. Registered No. 3870728. Registered Office: Newington House, 237 Southwark Bridge Road, London,
SE1 6NP Page 29 of 29
References
[1] Dynamic Cable Ratings for Smarter Grids; R. Huang, J. A. Pilgrim and P. L. Lewin; 2013 4th IEEE
PES Innovative Smart Grid Technologies Europe (ISGT Europe), October 6-9, Copenhagen
[2] The use of real-time monitoring and dynamic ratings for power delivery systems and the Implications
for dielectric materials; S. Walldorf, J. Englehardt and F. Hoppe; IEEE Electrical Insulation Magazine,
Volume 15, pp 28-33; 1999