mikko j. anttonen evaluation of means to increase the...
TRANSCRIPT

MIKKO J. ANTTONEN
Evaluation of Means to Increase theContent of Bioactive Phenolic
Compounds in Soft Fruits
JOKAKUOPIO 2007
KUOPION YLIOPISTON JULKAISUJA C. LUONNONTIETEET JA YMPÄRISTÖTIETEET 208KUOPIO UNIVERSITY PUBLICATIONS C. NATURAL AND ENVIRONMENTAL SCIENCES 208
Doctoral dissertation
To be presented by permission of the Faculty of Natural and Environmental Sciences
of the University of Kuopio for public examination in Auditorium,
Tietoteknia building, University of Kuopio,
on Friday 30th March 2007, at 1 p.m.
Department of Biosciences University of Kuopio

Distributor : Kuopio University Library P.O. Box 1627 FI-70211 KUOPIO FINLAND Tel. +358 17 163 430 Fax +358 17 163 410 http://www.uku.fi/kirjasto/julkaisutoiminta/julkmyyn.html
Series Editors: Professor Pertti Pasanen, Ph.D. Department of Environmental Sciences
Professor Jari Kaipio, Ph.D. Department of Physics
Author’s address: Department of Biosciences University of Kuopio P.O. Box 1627 FI-70211 KUOPIO FINLAND Tel. +358 17 163 198 Fax +358 17 163 148 E-mail : [email protected]
Supervisors: Reijo Karjalainen, Ph.D. Department of Biosciences University of Kuopio
Professor Sirpa Kärenlampi, Ph.D. Department of Biosciences University of Kuopio
Reviewers: Professor Riitta Julkunen-Tiitto, Ph.D. Department of Biology University of Joensuu
Professor Howard Davies, Ph.D. Scottish Crop Research Institute Dundee, Scotland, UK
Opponent: Professor Teemu Teeri, Ph.D. Department of Applied Biology University of Helsinki
ISBN 978-951-27-0686-0ISBN 978-951-27-0781-2 (PDF)ISSN 1235-0486
KopijyväKuopio 2007Finland

Anttonen, Mikko J. Evaluation of mean to increase the content of bioactive phenolic compounds in soft fruits. Kuopio University Publications C. Natural and Environmental Sciences 208. 2007. 93 p. ISBN 978-951-27-0686-0 ISBN 978-951-27-0781-2 (PDF) ISSN 1235-0486 ABSTRACT
Phenolic compounds form a large group of plant secondary metabolites with many
functions related to the acclimation and adaptation of plants to changing environment and to the interaction with other organisms. Interestingly, numerous studies have shown the positive influence of phenolic compounds on human health, and a higher intake can be considered beneficial.
In this study potential of different cultivation practices to enhance the content of phenolic compounds in red raspberry (Rubus idaeus L.), strawberry (Fragaria x ananassa Duch.), and black currant (Ribes nigrum L.) was evaluated.
Plant genotype is known to affect the phenolic content, which was shown also in this study with red raspberries and strawberries. However, the phenolic content was strongly affected by the environment. Thus the range of natural variation of the phenolic profile needs to be established for each genotype.
Fertilization influences plant metabolism, and higher fertilization levels were shown here to lower the phenolic content in strawberries. Mulch colour also affected the phenolic content in strawberries, the white mulch increasing the content of total phenolics compared to the brown one. This is apparently due to enhanced photosynthesis caused by the increase in light and temperature. Interestingly, white mulch also led to decreased fruit yield.
The fruit order had a significant effect on strawberry fruit phenolics. The phenolic content increased from primary to tertiary fruits. Furthermore, later planting date augmented the difference, which might be due to higher amount of light. The effect of fruit order on the contents of ascorbic acid and sugars in the fruits was opposite to that of phenolic compounds.
Organically produced food is generally considered by the consumers as being healthier than conventional food. In this study, the production system was not found to be the major factor in determining the content of measured phenolic compounds in strawberry or in black currant fruits.
Several possible ways exist to enhance the content of phenolic compounds in crop plants. However, as different methods have different shortcomings, they should be thoroughly evaluated before their application in practice. Interactions between different factors make it though difficult to apply techniques in the field conditions, whereas in the more controlled greenhouse conditions techniques could be more easily introduced. Universal Decimal Classification: 547.56, 547.972, 547.98, 634.723, 634.711, 634.75, 581.13, 581.19 CAB Thesaurus: secondary metabolites; phenolic compounds; small fruits; black currants; Ribes nigrum; raspberries; Rubus idaeus; strawberries; Fragaria ananassa; phenylpropanoids; anthocyanins; flavonoids; coumaric acids; tannins; ellagic acid; genotypes; cultivars; environment; cultural methods; organic farming; mulches; plant nutrition; fertilizers; nitrogen; light; temperature; forcing; earliness; HPLC; mass spectrometry; principal component analysis


D N'T P A N I C
Douglas Adams, The Hitchhiker's Guide to The Galaxy

ACKNOWLEDGEMENT
For the past two decades phenolic compounds have been under increasingly active study all over the world. Phenolic compounds possess numerous interesting properties of which those related to human health are probably most actively studied. At the University of Kuopio several studies have been done on phenolic compounds. Many of these studies have focused on berries and they also cover many different aspects on phenolic compounds in plants and in humans.
In studies presented in this thesis the aim was to find some easily applicable means to increase the content of phenolic compounds in soft fruits including red raspberries, strawberries and black currants. These studies were done during 2001-2006 in the former Institute of Applied Biotechnology, which from the beginning of 2007 became a part of the Department of Biosciences. However, during the first studies a lot of the work was also done in the Department of Ecology and Environmental Science.
I wish to express my sincere thanks and gratitude to my supervisors Reijo Karjalainen and Sirpa Kärenlampi for their guidance, support and confidence. I also want to thank Riitta Törrönen for her contribution to the guidance of my work. I'm especially grateful of the open and creative working environment which best suits for me.
I am deeply grateful to my collaborators Kalle Hoppula, Rolf Nestby and Michel Verheul. I also thank the farmers who kindly provided me the fruit samples for analyses.
I wish to thank all the people who have kindly helped me in various ways during these years: Kaija Ahonen, Seppo Auriola, Petra Gynther, Anne Hukkanen, Sinikka Karjalainen, Harri Kokko, Anu Korhonen, Mirja Korhonen, Hobo Kukkonen, Helena Könönen, Satu Lehesranta, Timo Oksanen, Marjatta Puurunen, Satu Pölönen, Jaana Rissanen, Leena Tilus and Leena Virtanen.
Special thanks to Riitta Julkunen-Tiitto and Howard Davies for doing the pre-examination of this thesis and for their valuable comments.
I owe my thanks to many foundations that have financially supported me during this work: Finnish Cultural Foundation, Kuopio University Foundation, Kemira Oyj Foundation and Tiura Foundation.
Finally, I want to express my warmest gratitude to my family in which I can trust in everything. Kuopio, February 2007 Mikko Anttonen

ABBREVIATIONS
ANOVA, analysis of variance
APCI, atmospheric pressure chemical ionization
API, atmospheric pressure ionization
CHS, chalcone synthase
CID, collisionally induced dissociation
CoA, coenzyme A
CONV, conventional cultivation
cv., cultivar
CVD, cardiovascular diseases
DPPH, α,α-diphenyl-β-picrylhydrazyl
DW, dry weight
ESI, electrospray ionzation
ET, electron transfer
FW, fresh weight
GC, gas chromatography
HAT, hydrogen atom transfer
HPLC, high-performance liquid chromatography
MS, mass spectrometry
MSn, tandem mass spectrometry
NMR, nuclear magnetic resonance spectroscopy
ORG, organic cultivation
PAD, photodiode array detector
PAL, phenylalanine ammonia-lyase
PC, principal component
PCA, principal component analysis
RSD, relative standard deviation
RP, reverse phase
UV, ultraviolet
Vis, visible
WHO, World Health Organisation

LIST OF ORIGINAL PUBLICATIONS This thesis is based on the following original publications referred to in the text by their Roman numerals: I Anttonen, M.J. & R.O. Karjalainen. (2005). Environmental and genetic
variation of phenolic compounds in red raspberry. Journal of Food Composition and Analysis 18, 759-769.
II Anttonen, M.J., K.I. Hoppula, R. Nestby, M.J. Verheul & R.O. Karjalainen.
(2006) Influence of fertilization, mulch color, early forcing, fruit order, planting date, shading, growing environment, and genotype on the contents of selected phenolics in strawberry (Fragaria × ananassa Duch.) fruits. Journal of Agricultural and Food Chemistry 54, 2614-2620.
III Nestby, R., M.J. Anttonen, M. Verheul & R. Karjalainen. Effect of fruit
order, polyethylene mulch colour and early forcing on the fruit quality of tunnel-grown strawberry cv. ’Korona’. European Journal of Horticultural Science. In press.
IV Anttonen, M.J. & R.O. Karjalainen. (2006) High-performance liquid
chromatography analysis of black currant (Ribes nigrum L.) fruit phenolic compounds grown either conventionally or organically. Journal of Agricultural and Food Chemistry 54, 7530-7538.
These studies were done in the former Institute of Applied Biotechnology of the University of Kuopio, which from the beginning of 2007 became a part of the Department of Biosciences.

CONTENTS 1 INTRODUCTION...............................................................................15 2 PHENOLIC COMPOUNDS IN PLANTS ...........................................................17
2.1 Qualitative and quantitative variation ..............................17 2.2 Biosynthesis of phenolic compounds.................................19 2.3 Function of phenolic compounds in plants..........................22
2.3.1 Adaptation and acclimation..........................22 2.3.2 Phenolic compounds in the interaction of plants with other organisms......................23
3 PHENOLIC COMPOUNDS AND HUMAN HEALTH.................................................25 3.1 Phenolic compounds as antioxidants ................................25 3.2 Other modes of action of phenolic compounds ....................26 3.3 Metabolism and bioavailability of phenolic compounds ..........28 3.4 Possible negative effects of phenolic compounds on human health............................................................29
4 ANALYSIS OF FRUIT PHENOLIC COMPOUNDS ..................................................31 4.1 Collection and storage of plant material ...........................31 4.2 Sample treatment.......................................................32 4.3 Chromatographic separation of phenolic compounds .............33 4.4 Qualitative analysis.....................................................34 4.5 Quantitative chromatography.........................................35 4.6 Simple quantitative methods for phenolic compounds ...........35 4.7 Antioxidant capacity assays ...........................................36 4.8 Reporting quantitative data...........................................37
5 PHENOLIC COMPOUNDS AS A PART OF FOOD QUALITY ........................................38 5.1 Health awareness .......................................................38 5.2 Methods for enrichment of phenolic compounds ..................39
5.2.1 Genetic modification..................................39 5.2.2 Plant breeding .........................................41 5.2.3 Exploitation of the phenotypic plasticity ..........41
6 AIMS OF THE STUDY..........................................................................42 7 MATERIALS AND METHODS ...................................................................43
7.1 Plant material and experimental design ............................43 7.1.1 Genotype and environment ..........................43 7.1.2 Agricultural regimes...................................44 7.1.3 Conventional versus organic production system.....................................45
7.2 Sample treatments .....................................................46 7.3 Quantitative analysis ...................................................47
7.3.1 Total phenolics.........................................47 7.3.2 Total anthocyanins ....................................47 7.3.3 DPPH radical scavenging capacity ..................47 7.3.4 Total soluble solids ....................................48
7.3.5 Titratable acidity ......................................48 7.3.6 L-Ascorbic acid.........................................48 7.3.7 High-performance liquid chromatographic (HPLC) methods ........................................48
7.4 Identification of phenolic compounds ...............................50 7.5 Statistical analyses .....................................................50
8 RESULTS AND DISCUSSION....................................................................52 8.1 Validity of the analyses of phenolic compounds ...................52
8.1.1 Flavonol analysis.......................................52 8.1.2 Ellagic acid analysis ...................................52 8.1.3 Acetone extraction, total phenolics, total anthocyanins, and antioxidant capacity ....53 8.1.4 Analysis of black currant fruit phenolic compounds ..................................53
8.2 Effect of genotype and environment on fruit phenolic content........................................................54
8.2.1 Genotype................................................54 8.2.2 Environment ............................................57 8.2.3 Genotype x environment .............................60
8.3 Effect of agricultural regimes on strawberry fruit phenolics...........................................................61
8.3.1 Fertilization ............................................61 8.3.2 Fruit order, shading, and planting date............62 8.3.3 Mulch colour and early forcing ......................65
8.4 Identification of black currant fruit phenolic compounds ...................................................67 8.5 The effect of organic versus conventional production system on black currant fruit phenolics ..............71
9 CONCLUSIONS................................................................................76 10 LITERATURE CITED .........................................................................79 APPENDIX: ORIGINAL PUBLICATIONS
Introduction
1 INTRODUCTION
High consumption of fruits and vegetables has been associated with reduced risk of many major diseases including cardiovascular diseases, cancer, and degenerative diseases (Arts & Hollman 2005, Dauchet et al. 2006, Ness & Powles 1997). Oxidative damage is considered as one of the main mechanisms in the pathology of these diseases (Ames et al. 1993, Youdim et al. 2002a). Thus it has been suggested that various antioxidant phytochemicals in fruits and vegetables, such as vitamins, carotenoids, and phenolic compounds contribute to the protective effect. Phenolic compounds have been extensively studied during the past decade. Even though the data on the health effects of phenolic compounds cannot be considered comprehensive (Scalbert et al. 2005), it strongly suggests that phenolic compounds have a link to our health, although the mechanisms are not yet fully understood.
Knowledge of the importance of food and food constituents on our health increases constantly. Consumers also show interest in putting this new knowledge into practice (European Opinion Research Group EEIG 2003). Thus the health-related properties of foods are becoming increasingly important quality criteria. Consequently, research has focused on finding means to improve the health-related properties of crop plants. Several different strategies can be used to modify the biosynthesis of phenolic compounds (Parr & Bolwell 2000). These strategies include genetic modification (Schijlen et al. 2004) and breeding (Scalzo et al. 2005a). In addition, the phenotypic plasticity of plant metabolism might be exploited to increase the phenolic content of crop plants.
Phenolic compounds serve many functions in plants (Parr & Bollwell 2000). Lignin provides mechanical support to the plant, while some compounds serve as signal molecules. Most identified functions relate to adaptation and acclimation of plants to changing environmental conditions and to their interaction with other organisms. Phenolic compounds can be considered as health compounds also to the plant due to their protective functions during biotic and abiotic stress (Dixon & Paiva 1995). By optimizing the growing conditions of the plant, the production of phenolic compounds and thus their health-related value for humans could be increased.
Kuopio Univ. Publ. C. Nat. and Environ. Sci. 208: 1-93 (2007) 15
Mikko J. Anttonen: Evaluation of means to increase the content of bioactive phenolic compounds in soft fruits
The present study focuses on the evaluation of different techniques that could be used to increase the phenolic content in soft fruits. Techniques that might be easily applied in normal cultivation practices were studied. Strawberry, black currant and red raspberry were chosen because they represent the most highly consumed and cultivated berries in Finland and they are also important crop plants worldwide. In addition, their phenolic content is already high to start with, which makes them good sources of phenolic compounds.
Kuopio Univ. Publ. C. Nat. and Environ. Sci. 208: 1-93 (2007) 16

Phenolic compounds in plants
2 PHENOLIC COMPOUNDS IN PLANTS 2.1 Qualitative and quantitative variation
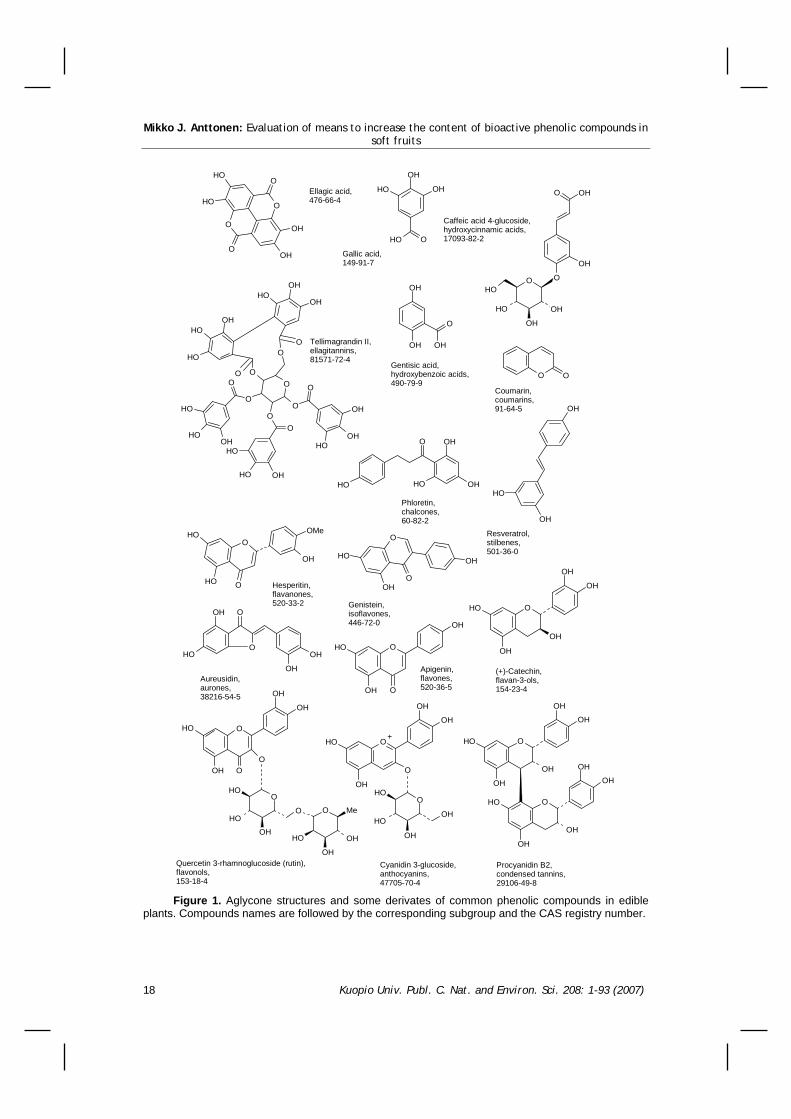
Plants produce a vast array of compounds referred to as secondary metabolites or natural compounds, which can be divided into three major classes, i.e. terpenoids, alkaloids, and phenylpropanoids. Phenylpropanoids are often called phenolic compounds since they all contain at least one phenyl ring with one or more acidic hydroxyl groups attached (Figure 1). Phenolic compounds can be divided into several subgroups based on the aglycone structure. Aglycones are usually further modified by conjugation with sugars and carboxylic acids. Thus the total number of possible structures is huge and no single plant species expresses the whole metabolite array. The main phenolic compounds in fruits can be classified as phenolic acids (hydroxycinnamic and hydroxybenzoic acids), coumarins, flavonoids, and tannins (hydrolysable and condensed) (Macheix et al. 1990).
Phenolic compounds are ubiquitous in all higher plants, alhough there are large qualitative and quantitative differences between species (Kähkönen et al. 1999, Macheix et al. 1990). Kähkönen et al. (1999) analysed the total phenolic content of 92 plant species. Berries were found to contain particularly high amounts of phenolic compounds, whereas the contents were low in cereals and vegetables. The highest content of phenolic compounds was found in spruce needles, being over 750 times that in wheat grains (the lowest measured content). Moreover, the quantitative variation can be significant even between closely related species (Määttä et al. 2003, Määttä-Riihinen et al. 2004a and 2004b) or even between different cultivars of the same species (Lata et al. 2005, Ehlenfeld & Prior 2001). Lata et al. (2005) evaluated the total phenolic content from 56 apple cultivars.The evaluation was done twice during two consecutive years and 2- to 5-fold differences were found depending on the growing season. In blueberries, 4.5- and 3-fold differences were detected between 87 cultivars in the contents of total phenolics and total anthocyanins, respectively (Ehlenfeld & Prior 2001). Qualitative differences between closely related species are not as evident, and phenolic compounds are thus considered good candidates for chemotaxonomic markers (Keinänen et al. 1999a, Okuda et al. 1992).
Kuopio Univ. Publ. C. Nat. and Environ. Sci. 208: 1-93 (2007) 17
Mikko J. Anttonen: Evaluation of means to increase the content of bioactive phenolic compounds in soft fruits
OH
OH OH
O
OH
OH
OH
OOH
O
OH
OHOO
O
O
OOH
OH
OH
OH
OH
OH OH
OH O
OH
O OH
OHOH
O
OH
OH
OH O
OOH
OH
O
OH
OOH
OHO
OMe
OH
OH
OH
OH
O
OH
OH
OH
O
O
O
OH
OH
OH
O
O
OH
Me
OH
OH
OH
O
OH
O
OH
OH
O
OH
OH
OH
OH
OH
OH
O
OH
OH
OH
OH
OH
O
OH
OH
OH
OH
OH
O
OH
OH
OH
OH
O
OH
OH
OOH
OH
O O
OH
OHOH
OH
OH
OH
O
OH
OH
OH
OO
OHOH
OHO
O
O
O
OHOH
O
O
OH
O
OGentisic acid,hydroxybenzoic acids,490-79-9
Caffeic acid 4-glucoside,hydroxycinnamic acids,17093-82-2
Ellagic acid,476-66-4
Gallic acid,149-91-7
Phloretin,chalcones,60-82-2
Apigenin,flavones,520-36-5
Genistein,isoflavones,446-72-0
Hesperitin,flavanones,520-33-2
Quercetin 3-rhamnoglucoside (rutin),flavonols,153-18-4
+
Cyanidin 3-glucoside,anthocyanins,47705-70-4
(+)-Catechin,flavan-3-ols,154-23-4
Procyanidin B2,condensed tannins,29106-49-8
Resveratrol,stilbenes,501-36-0
Aureusidin,aurones,38216-54-5
Coumarin,coumarins,91-64-5
Tellimagrandin II,ellagitannins,81571-72-4
Figure 1. Aglycone structures and some derivates of common phenolic compounds in edible
plants. Compounds names are followed by the corresponding subgroup and the CAS registry number.
Kuopio Univ. Publ. C. Nat. and Environ. Sci. 208: 1-93 (2007) 18

Phenolic compounds in plants
Phenolic compounds are not only affected by the genotype but variation also exists between plant organs, tissues, and developmental stages (Chinnici et al. 2004, Close et al. 2005, Halbwirth et al. 2006, Hirota et al. 1998, Tsao et al. 2006). In general, phenolic compounds concentrate on surface tissues (Hirota et al. 1998, Chinnici et al. 2004). The phenolic content can vary according to juvenility (Close et al. 2005, Mamati et al. 2006). Fruit maturation has a strong effect on phenolic profiles (Halbwirth et al. 2006), the most obvious change being the accumulation of coloured anthocyanins at the later stages of fruit development. 2.2 Biosynthesis of phenolic compounds
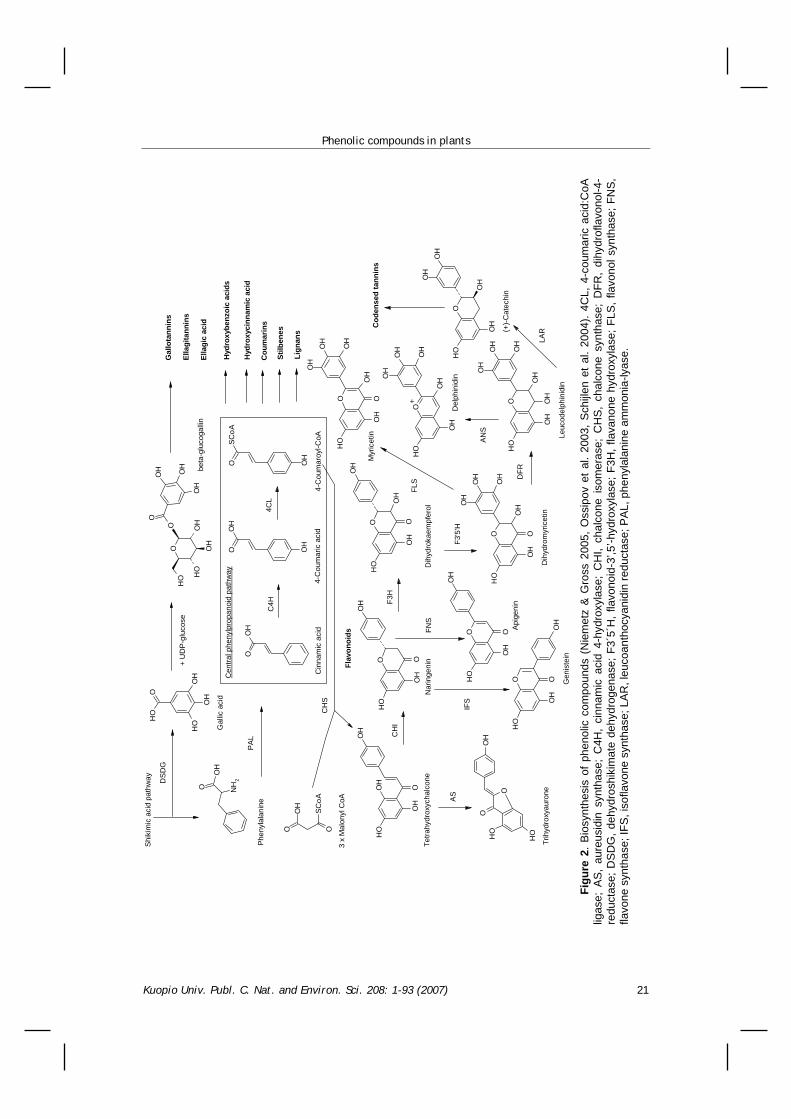
The shikimic acid pathway, which begins with the condensation of phosphoenolpyruvate from glycolysis and erythrose 4-phosphate from the pentosephosphate pathway leads to the formation of the aromatic amino acids phenylalanine and tyrosine. Phenylalanine is the substrate for phenylalanine ammonia-lyase (PAL), which catalyses the first reaction of the phenylpropanoid pathway leading to the formation of most phenolic compounds, i.e. phenylpropanoids. The synthesis of other compounds such as gallic acid, galloylglucoses, gallotannins, and ellagitannins, may start already from the 3-dehydroshikimate, which is an intermediate of the shikimic acid pathway (Ossipov et al. 2003, Niemetz & Gross 2005). An overview of the biosynthesis of the main classes of phenolic compounds is shown in Figure 2.
The diversity of phenylpropanoids is produced from different branches of the pathway starting from the central phenylpropanoid metabolism (Hahlbrock and Scheel 1989). The central metabolism starts with the deamination of phenylalanine by PAL to cinnamic acid, which is then hydroxylated to 4-coumaric acid by cinnamic acid 4-hydroxylase (C4H). The final reaction is the esterification of 4-coumaric acid with coenzyme A (CoA) by 4-coumaric acid:CoA ligase (4CL).
Flavonoids are the most common group of phenolic compounds found in plants, comprising over 6000 known structures (Schijlen et al. 2004). The flavonoid branch of the phenylpropanoid pathway starts with a reaction catalysed by chalcone synthase (CHS). CHS uses 4-coumaroyl-CoA and malonyl-CoA (derived from the primary metabolism) as substrates to yield 4,2',4',6'-tetrahydroxychalcone. The anthocyanin subgroup can be considered as the final product of the flavonoid branch, and other flavonoid subgroups originate from the intermediates of anthocyanin biosynthesis.
The diversity of phenolic structures arises from different modifications of the basic structures (Markham 1982). These modifications include, for example,
Kuopio Univ. Publ. C. Nat. and Environ. Sci. 208: 1-93 (2007) 19
Mikko J. Anttonen: Evaluation of means to increase the content of bioactive phenolic compounds in soft fruits
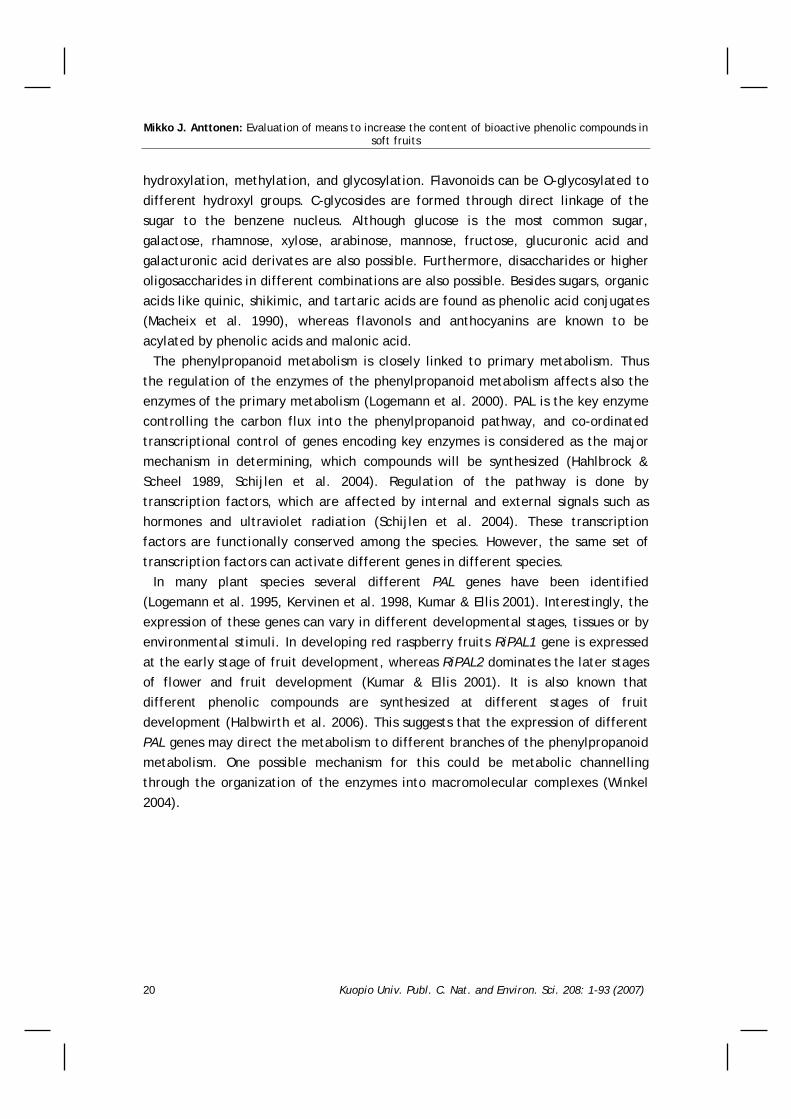
hydroxylation, methylation, and glycosylation. Flavonoids can be O-glycosylated to different hydroxyl groups. C-glycosides are formed through direct linkage of the sugar to the benzene nucleus. Although glucose is the most common sugar, galactose, rhamnose, xylose, arabinose, mannose, fructose, glucuronic acid and galacturonic acid derivates are also possible. Furthermore, disaccharides or higher oligosaccharides in different combinations are also possible. Besides sugars, organic acids like quinic, shikimic, and tartaric acids are found as phenolic acid conjugates (Macheix et al. 1990), whereas flavonols and anthocyanins are known to be acylated by phenolic acids and malonic acid.
The phenylpropanoid metabolism is closely linked to primary metabolism. Thus the regulation of the enzymes of the phenylpropanoid metabolism affects also the enzymes of the primary metabolism (Logemann et al. 2000). PAL is the key enzyme controlling the carbon flux into the phenylpropanoid pathway, and co-ordinated transcriptional control of genes encoding key enzymes is considered as the major mechanism in determining, which compounds will be synthesized (Hahlbrock & Scheel 1989, Schijlen et al. 2004). Regulation of the pathway is done by transcription factors, which are affected by internal and external signals such as hormones and ultraviolet radiation (Schijlen et al. 2004). These transcription factors are functionally conserved among the species. However, the same set of transcription factors can activate different genes in different species.
In many plant species several different PAL genes have been identified (Logemann et al. 1995, Kervinen et al. 1998, Kumar & Ellis 2001). Interestingly, the expression of these genes can vary in different developmental stages, tissues or by environmental stimuli. In developing red raspberry fruits RiPAL1 gene is expressed at the early stage of fruit development, whereas RiPAL2 dominates the later stages of flower and fruit development (Kumar & Ellis 2001). It is also known that different phenolic compounds are synthesized at different stages of fruit development (Halbwirth et al. 2006). This suggests that the expression of different PAL genes may direct the metabolism to different branches of the phenylpropanoid metabolism. One possible mechanism for this could be metabolic channelling through the organization of the enzymes into macromolecular complexes (Winkel 2004).
Kuopio Univ. Publ. C. Nat. and Environ. Sci. 208: 1-93 (2007) 20
Phenolic compounds in plants
Figu
re 2
. B
iosy
nthe
sis
of p
heno
lic c
ompo
unds
(N
iem
etz
& G
ross
200
5, O
ssip
ov e
t al
. 20
03,
Sch
ijlen
et
al.
2004
). 4C
L, 4
-cou
mar
ic a
cid:
CoA
lig
ase;
AS
, au
reus
idin
syn
thas
e; C
4H,
cinn
amic
aci
d 4-
hydr
oxyl
ase;
CH
I, ch
alco
ne i
som
eras
e; C
HS
, ch
alco
ne s
ynth
ase;
DFR
, di
hydr
ofla
vono
l-4-
redu
ctas
e; D
SD
G, d
ehyd
rosh
ikim
ate
dehy
drog
enas
e; F
3´5´
H, f
lavo
noid
-3’,5
’-hyd
roxy
lase
; F3H
, fla
vano
ne h
ydro
xyla
se; F
LS, f
lavo
nol s
ynth
ase;
FN
S,
flavo
ne s
ynth
ase;
IFS
, iso
flavo
ne s
ynth
ase;
LA
R, l
euco
anth
ocya
nidi
n re
duct
ase;
PA
L, p
heny
lala
nine
am
mon
ia-ly
ase.
OH
Kuopio Univ. Publ. C. Nat. and Environ. Sci. 208: 1-93 (2007) 21
OH
O
OH
O NH
2
OH
OH
OH
OO
H
O
OH
OH
OH
OH
O
OH
OH
OH
OO
H
OH
OH
OO
H
OSC
oA
OO
H
OH
O
OH
OH
OH
OH
OO
HO
OH
OH
OH
O
OH
OH
O
OH
SCoA
O
O
OH
OO
H OH
OO
H
OH
O
OH
O
OH
OH
OH
O
OO
H
OH
O
OH
OH
OH
OH
OH
OH
OO
H
OH
OH
O
OH
OH
OHO
HO
H
OH
Cod
ense
d ta
nnin
s
OH
OH
OH
OH
O
O
OH
OH
OH
O
OH
OH
OH
Cen
tral p
heny
lpro
pano
id p
athw
ay
Shi
Hyd
roxy
cinn
amic
aci
d
Hyd
roxy
benz
oic
acid
s
(+)-C
atec
hin
Gal
lota
nnin
s
Ella
gita
nnin
s
Ella
gic
acid
Cou
mar
ins
Stilb
enes
LAR
Lign
ans
Del
phin
idin
Leuc
odel
phin
idin
+
beta
-glu
coga
llin
AN
S
kim
ic a
cid
path
way
Phe
nyla
lani
ne
Gal
lic a
cid
PA
L
3 x
Mal
onyl
CoA
CH
S
AS
CH
IF3
H
FNS
Gen
iste
in
IFS
DS
DG
+ U
DP-
gluc
ose
Cin
nam
ic a
cid
C4H
4-C
oum
aric
aci
d4-
Cou
mar
oyl-C
oA
Myr
icet
in
DFR
FLS
4CL
Dih
ydro
kaem
pfer
ol
Dih
ydro
myr
icet
in
F3'5
'H
Api
geni
n
Flav
onoi
ds
Nar
inge
nin
Tetra
hydr
oxyc
halc
one
Trih
ydro
xyau
rone
Mikko J. Anttonen: Evaluation of means to increase the content of bioactive phenolic compounds in soft fruits
2.3 Function of phenolic compounds in plants
Phenolic compounds serve many functions in plants (Parr & Bolwell 2000). Some of them, such as lignin, provide mechanical support, whereas others serve as signal molecules. However, most of the identified functions relate to the phenotypic adaptation and acclimation of plants to changing environmental conditions or to the interaction of plants with other organisms. 2.3.1 Adaptation and acclimation
It has been proposed that the original function of phenolic compounds was to enable the adaptation of plants from aquatic to terrestrial environment (Parr & Bolwell 2000). Thus the primary function was to provide mechanical support, inhibit desiccation, and create structures for internal water transport. However, during the evolution of plants, the diversity of phenolic compounds has grown tremendously, which also reflects the functional diversity of these compounds.
Environmental factors affect the phenolic profiles of plants (Tomás-Barberán & Espín 2001). Although many changes have a functional purpose, others seem to be a result of the general rearrangement of plant metabolism. Many hypotheses have been made to try to explain these metabolic changes. For example, the carbon/nutrient balance hypothesis by Bryant et al. (1983) suggested that the metabolism is controlled by the available resources. According to the hypothesis, high nitrogen availability will increase the synthesis of nitrogen-based metabolites, whereas the synthesis of carbon-based compounds such as phenolic compounds is constrained. Indeed, many studies have shown that high nitrogen fertilization will lead to lower amount of phenolic compounds (Delgado et al. 2004, Norbaek et al. 2003). Moreover, in a recent study a direct link between nitrate availability and the activity of some early enzymes on the phenylpropanoid pathway was discovered (Fritz et al. 2006). However, the effect of nitrogen availability is also affected by other factors (Delgado et al. 2004, Witzell & Shevtsova 2004). Futhermore, in a study done on birch, fertilization significantly decreased the content of condensed tannins, whereas the effect on non-tannin phenolic compounds was non-significant (Keinänen et al. 1999b). In addition, the levels of some individual compounds were elevated, which was suggested to be due to internal metabolic trade-offs. The carbon/nutrient balance hypothesis can thus be considered narrow, since the control of the metabolic homeostasis is obviously more complicated.
Kuopio Univ. Publ. C. Nat. and Environ. Sci. 208: 1-93 (2007) 22
Phenolic compounds in plants
The phenolic profiles of plants have also been shown to change in numerous other situations. For example, water availability affects the phenolic content of plants (Bennett et al. 2004, Jeyaramraja et al. 2003, Koundouras et al. 2006, Moore et al. 2005). Bennett et al. (2004) demonstrated that irrigation increased the isoflavone content of soybean seeds compared to non-irrigated plants, and Jeyaramraja et al. (2003) showed a strong positive correlation between PAL activity and soil moisture. Interestingly, water deficit can also increase the phenolic content (Koundouras et al. 2006). During limited water availability phenolic compounds can protect the membranes against desiccation (Moore et al. 2005). In addition, as water deficit can lead to oxidative stress (Dat et al. 2000), accumulation of phenolic compounds could also suggest a role as antioxidants (Moore et al. 2005).
The effect of light on the phenolic content of plants is extensively studied. Not only the amount of light but also its quality affects the phenolic profiles (Tegelberg et al. 2004, Cortell & Kennedy 2006). High-light conditions lead to the accumulation many phenolic compounds in the surface tissues of plants (Tattini et al. 2004). Because of their strong ability to absorb ultraviolet light (Markham 1982), phenolic compounds protect plants against deleterious ultraviolet radiation (Li et al. 1993). Accumulation of phenolic compounds can also prevent photoinhibition, as they also decrease the amount of incoming visible light (Edreva et al. 2005). Furthermore, high-light conditions commonly lead to oxidative stress (Dat et al. 2000), and it has been suggested that phenolic compounds could also function as antioxidants in plants in these conditions (Edreva 2005).
Another major environmental factor that affects the phenolic profiles of plants is temperature. Both high and low temperature extremes have been shown to change the activity of PAL and the accumulation of phenolic compounds (Rivero et al. 2001). Moreover, the difference between day and night temperatures can have a significant effect on the phenolic profiles (Wang & Zheng 2001). However, different genotypes appear to be affected differently (Rivero et al. 2001, Wang & Zheng 2001). It is well known that temperature extremes cause oxidative stress (Dat et al. 2000), and the accumulation of phenolic compounds could again suggest a role as antioxidants. Another suggested function during cold stress is to filter out excess of solar radiation to prevent photoinhibition (Solecke et al. 1999). However, there is no clear evidence of the roles of phenolic compounds during temperature stress. 2.3.2 Phenolic compounds in the interaction of plants with other organisms
Phenolic compounds are important in the interaction between plants and other organism (Parr & Bolwell 2000, Harborne 1999). They attract pollinators and
Kuopio Univ. Publ. C. Nat. and Environ. Sci. 208: 1-93 (2007) 23
Mikko J. Anttonen: Evaluation of means to increase the content of bioactive phenolic compounds in soft fruits
beneficial soil micro-organisms but also pathogens and pests. Phenolic compounds play also an important role in the defence against herbivores, pathogens, pests, and competing plants.
Defence against pathogens consists of constitutive physical and biochemical mechanisms and of inducible mechanisms (Agrios 1997), and phenolic compounds are an important, albeit not the only part in the defence strategy (Agrios 1997, Maher el al. 1994). Following the identification of pathogen attack, activation of key enzymes on the phenylpropanoid pathway is often seen (Somssich & Hahlbrock 1998). Some phenolic compounds such as lignin can provide mechanical barriers that prevent the invasion of the pathogen (Nicholson & Hammerschmidt 1992), whereas others can be antimicrobial (Cowan 1999). The antimicrobial properties of phenolic compounds are based on their ability to disrupt membrane structure and to bind and inactivate proteins (Cowan 1999).
A clear link between the content and quality of plant secondary metabolites and feeding behaviour of animals has been established (e.g. Iason & Villalba 2006). A high content of selected phenolic compounds can protect plants against herbivore damages (Harborne 1999, Simmonds 2003, Tahvanainen et al. 1985). However, no single compound or group of compounds is effective against all herbivores, and different species exploit different compounds in their defence (Harborne 1999). Moreover, depending on its concentration, the same compound can be a feeding stimulant or deterrent or herbivores can even benefit from the intake the phenolic compounds (Harborne 1999, Simmonds 2003).
Kuopio Univ. Publ. C. Nat. and Environ. Sci. 208: 1-93 (2007) 24

Phenolic compounds and human health
3 PHENOLIC COMPOUNDS AND HUMAN HEALTH
Diets rich in fruits and vegetables can promote longevity (Rissanen et al. 2003). In epidemiological studies, a protective effect has been shown especially against cardiovascular diseases (CVD) (Dauchet et al. 2006, Ness & Powles 1997). Phenolic compounds in plants are suggested to be at least partly responsible for this protective effect. Some epidemiological studies have evaluated the human health effects of the consumption of phenolics. In a Finnish study, the relationship between flavonoid intake and risk of several chronic diseases was investigated (Knekt et al. 2002). Higher flavonoid intake was associated with lower total mortality and incidence of asthma, whereas individual flavonoid compounds were shown to reduce the risk of cancer, type 2 diabetes, and CVD-based mortality. In an Italian study, the consumption of flavones was shown to reduce the breast cancer risk (Bosetti et al. 2005). There are many other epidemiological studies (reviewed by Arts & Hollman 2005) evaluating the health effects of phenolic compounds and, in general, phenolic compounds seem to protect humans against many chronic diseases. 3.1 Phenolic compounds as antioxidants
Oxidative stress which damages cell components, lipids, proteins, and DNA is one of the main factors in the pathology of many major diseases including cardiovascular diseases, cancer, and degenerative diseases like neurodegenerative disorders (Ames et al. 1993, Youdim et al. 2002a). Oxidants are normal by-products of human metabolism, and many endogenous mechanisms exist to prevent their damage (Ames et al. 1993, Halliwell 1994, Nijveldt et al. 2001). In addition, dietary antioxidants play an important role in the prevention of oxidative damages. Phenolic compounds are known to be powerful antioxidants (Pietta 2000, Pulido et al. 2000, Rice-Evans et al. 1997) and, compared with ascorbic acid and Trolox (a synthetic vitamin E analogue) their antioxidant capacity seems to be higher. The total in vitro antioxidant capacity of plant extracts has been shown to correlate with the total phenolic content (Sun et al. 2002, Tsao et al. 2005), whereas the contribution of ascorbic acid seems to be low (Kalt et al. 1999).
In vitro data support the role of phenolic compounds as antioxidants. The protective activity of phenolic extract from strawberries was shown in a cell culture test with PC12 neuronal cells treated with H2O2 (Heo & Lee 2005). Similarly, phenolic compounds extracted from black currants were shown to protect SH-SY5Y neuroblastoma cells against H2O2-induced cytotoxity and oxidative
Kuopio Univ. Publ. C. Nat. and Environ. Sci. 208: 1-93 (2007) 25
Mikko J. Anttonen: Evaluation of means to increase the content of bioactive phenolic compounds in soft fruits
stress (Ghosh et al. 2006). Furthermore, black currant phenolics also protected the DNA of promyelocytic HL-60 cells after exposure to H2O2. Animal studies have also proven the antioxidant capacity of phenolics. Wine phenolics were found to decrease the basal oxidative damage of rat colon mucosal cell DNA (Giovannelli et al. 2000). In another study with rats, supplementation of the diet with quercetin 3-rhamnoglucoside (rutin) increased the antioxidant status of liver tissue but not that of serum or brain (Gao et al. 2003). The protective effect of cloudberry fruit phenolics against lipid peroxidation has also been show in a model system with fruit flies (Mylnikov et al. 2005). However, not all studies show positive effects after consumption of phenolics. When the diet was supplemented with cyanidin 3-glucoside, lipid peroxidation or DNA damage in rats were unaffected (Duthie et al. 2005).
Human studies also support antioxidative effects after consumption of fruits and vegetables. In a human intervention study, Marniemi et al. (2000) observed a slight increase in the plasma antioxidant status and slightly lowered LDL oxidation as a consequence of daily consumption of 100 g of soft fruits. Similarly, consumption of strawberries was found to increase the antioxidant capacity of plasma (Cao et al. 1998). It was also concluded that the increase was most likely due to phenolic compounds in strawberries. Boyle et al. (2000) found that ingestion of onion meal led to an increase in the plasma flavonoid content. Furthermore, the onion meal reduced oxidative damage of lymphocyte DNA and a decrease in the oxidative stress markers was also observed.
There are plenty of data suggesting that the antioxidant activity of phenolic compounds is an important property in the prevention of various diseases. However, in their recent review, Halliwell et al. (2005) argued that the data supporting in vivo antioxidant activity of phenolics is still inconclusive, as many studies have failed to show any effects of the consumption of phenolics on the biomarkers of DNA, lipid or protein oxidation. It can be thus concluded that the antioxidant activity of phenolic compounds is not their only mode of action (Scalbert et al. 2005). 3.2 Other modes of action of phenolic compounds
Besides antioxidant activity, many other modes of action have been identified for phenolic compounds (for reviews see Issa et al. 2006, Scalbert et al. 2005, Stoclet et al. 2004, Williams et al. 2004). Some of the recent findings include effects on energy metabolism (Lagouge et al. 2006). In mice, resveratrol enhanced the function of mitochondria and increased the aerobic capacity. These effects were
Kuopio Univ. Publ. C. Nat. and Environ. Sci. 208: 1-93 (2007) 26
Phenolic compounds and human health
associated with the increase of SIRT1 activity. Furthermore, resveratrol protected the mice against obesity and insulin resistance. Anthocyanins have also been linked to the prevention of diet-induced weight gain (Tsuda et al. 2003, Tsuda et al. 2004). Apparently this effect is mediated by up-regulation of specific genes in the adipocytes.
Inflammation plays an important role in the pathology of many diseases (Libby et al. 2002, Youdim et al. 2002a). Inflammation as a temporal condition is not a disease, but when it is prolonged it can have negative effects (Issa et al. 2006). In a cell culture assay phenolic compounds from blueberries and cranberries were shown to inhibit the formation of TNFα (tumor necrosis factor) induced inflammation mediators (Youdim et al. 2002b). Similarly, ellagitannins from red raspberries were found to inhibit proinflammatory mediators nitric oxide and prostaglandin E2 in activated macrophages (Vuorela et al. 2005). Finally, in a recent study with transgenic mice tomato flavonoids were shown to reduce the basal concentration of C-reactive protein, which is a marker of inflammation (Rein et al. 2006).
As in plants, phenolic compounds can act as antimicrobial agents in humans (Cowan 1999). In vitro studies have shown the antimicrobial activity of phenolic compounds and plant extracts containing phenolic compounds against pathogenic bacteria (Puupponen-Pimiä et al. 2001) or even against viruses (Knox et al. 2003). Thus the compounds have the potential to prevent chronic infections which lead to inflammation and oxidative stress (Ames et al. 1993).
Many identified functions of phenolic compounds are related to their ability to interact with proteins. Yeh and Yen (2003) demonstrated that some phenolic acids can increase the activity of phenolsulfotransferase (PST), which detoxifies xenobiotics and endogenous compounds. The metabolism of xenobiotics mainly takes place in the liver, and phytochemicals including phenolic compounds have been shown to inhibit or activate also other phase I and phase II enzymes of xenobiotic metabolism (Issa et al. 2006). Thus phenolic compounds can either enhance the deactivation or inhibit the activation of deleterious compounds.
Following ingestion, phenolic compounds accumulate first in the gastrointestinal tract, where they can interact with various digestive enzymes (McDougall & Stewart 2005). Intestinal α-glucosidase is one of the target enzymes. Phenolic compounds can decrease its activity and thus lower blood glucose levels after meal. Similarly, phenolic compounds can prevent lipid degradation by inhibiting lipase activity. Further, the compounds can restrict proteolytic activity through various mechanisms, including metal chelation and enzyme inhibition. The latter
Kuopio Univ. Publ. C. Nat. and Environ. Sci. 208: 1-93 (2007) 27

Mikko J. Anttonen: Evaluation of means to increase the content of bioactive phenolic compounds in soft fruits
two mechanisms can be beneficial for health in some cases, as they can limit excess energy intake.
As estrogen agonists or antagonists, some phenolic compounds can affect gene expression regulated by estrogen receptors (Cornwell et al. 2004, Papoutsi et al. 2005). Thus consumption of these phytoestrogens may be beneficial for the prevention of estrogen-related disorders like osteoporosis, CVD and cancer.
Many studies have shown the antiproliferative activity of phenolic extracts from soft fruits in cancer cell cultures (Liu et al. 2002, Meyers et al. 2003, Olsson et al. 2004a, Seeram et al. 2004). The antiproliferative effect seems to be independent of antioxidant activity. Interestingly, Olsson et al. (2004a) did not find a strong link between the phenolic content and antiproliferative activity of different fruit extracts. However, in a study done with cranberries (Seeram et al. 2004), the phenolic fractions were found mainly to be responsible for the antiproliferative effect against different oral, colon, and breast cancer cell lines. Studies with animals also support the role of phenolics in the inhibition of carcinogenesis (Yang et al. 2001), and the inhibition can take place at various stages of cancer development. Suppression of tumour growth includes modulation of oncogenes, tumour suppressor genes, and signal transduction pathways as well as apoptosis (Scalbert et al. 2005, Yang et al. 2001).
Most of the studies supporting the health-related properties of phenolic compounds have been done in vitro or in animal models. However, these data might give, for various reasons, a misleading image of the true impact of these compounds (Scalbert et al. 2005). First, the concentrations used might not correspond to those in vivo. Secondly, the bioavailability of different compounds can vary significantly. Finally, before reaching their possible targets in human metabolism, the phenolic profile measured in vitro might undergo several changes. In a recent review, results from 93 different human interventions were evaluated (Williamson & Manach 2005). These studies supported the role of phenolic compounds in humans. However, the data cannot be considered comprehensive and more research is still needed. 3.3 Metabolism and bioavailability of phenolic compounds
After ingestion, the phenolic compounds can undergo many changes before reaching their targets. During the gastrointestinal digestion major degradation of phenolic compounds may take place (Perez-Vicente et al. 2002). In addition, the colonic microflora can modify phenolic compounds in many ways (Aura et al. 2002). Phenolic glycosides can be hydrolysed to aglycones and further metabolised into
Kuopio Univ. Publ. C. Nat. and Environ. Sci. 208: 1-93 (2007) 28
Phenolic compounds and human health
various aromatic acids (Manach et al. 2004). In addition, after absorption, phenolic compounds can be further modified by many human enzymes. The three main conjugation types are methylation, sulfation, and glucuronidation.
The bioavailability of different phenolic compounds can vary greatly (Manach et al. 2005). Differences are observed in the absorption efficiencies and also in the absorption and elimination rates. For example, quercetin glucoside is more efficiently absorbed than are the corresponding aglycone or the rhamnoglucoside derivate rutin. In addition, the absorption rate of rutin is much slower. Compared with other phenolic compounds, anthocyanins are very poorly absorbed and also their absorption and elimination rates are fast. Interestingly, anthocyanins are a major phenolic group in soft fruits (Määttä-Riihinen et al. 2004a and b), and have been shown to possess high in vitro antioxidant capacity compared with other edible crops (Halvorsen et al. 2002). 3.4 Possible negative effects of phenolic compounds on human health
Although the human intervention data on the health effects of phenolic compounds are not comprehensive, none of the studies so far have reported negative effects. However, if consumed in high amounts, phenolic compounds have the potential of being detrimental to health, as the same mechanisms that are responsible for the positive effects, may also mediate the negative effects (Mennen et al. 2005). A practical example of the excess intake of phenolics comes from West Africa. Due to its high vitexin (C-glycosylflavone) content, millet consumption is thought to be one of the reasons for endemic goitre, as vitexin inhibits thyroid peroxidase and thus interferes with thyroid hormone biosynthesis.
In their reduced forms phenolic compounds act as antioxidants. However, in certain situations phenolics can be pro-oxidants (Galati & O'Brien 2004), although the pro-oxidant activity of phenolic compounds in vivo might also be beneficial due to anti-cancer or apoptosis-inducing properties.
As mentioned above, phenolics can inhibit and induce phase I and II enzymes (Issa et al. 2006) and, therefore, it is possible that phenolics accelerate the production of deleterious compounds as well as inhibit their deactivation. In addition, by affecting phase I and II enzymes phenolic compounds can also interfere with drug metabolism (Mennen et al. 2005).
Inhibition of the enzymes in the gastrointestinal tract can have a negative impact when the diet is limited, both qualitatively and quantitatively (McDougall & Stewart 2005). Similarly, the ability to chelate ferric ions can be undesirable when iron availability is limited (Scalbert et al. 2005).
Kuopio Univ. Publ. C. Nat. and Environ. Sci. 208: 1-93 (2007) 29
Mikko J. Anttonen: Evaluation of means to increase the content of bioactive phenolic compounds in soft fruits
Data on the negative effects of phenolic compounds is scarce, and it is mainly based on in vitro studies. Thus the negative effects should not be exaggerated, although it is an area that should be more thoroughly studied, and care should be taken especially when supplementing diets with nutraceuticals containing phenolic compounds way beyond the amounts that are normally consumed.
Kuopio Univ. Publ. C. Nat. and Environ. Sci. 208: 1-93 (2007) 30
Analysis of fruit phenolic compounds
4 ANALYSIS OF FRUIT PHENOLIC COMPOUNDS
The analysis of phenolic compounds has been regularly reviewed (Waterman & Mole 1994, Robards & Antolovich 1997, Antolovich et al. 2000, Merken & Beecher 2000, Stobiecki 2000, Mueller-Harvey 2001, Schofield et al. 2001, Tura & Robards 2002, Robbins 2003, Naczk & Shahidi 2004, Tsao & Deng 2004, Molnár-Perl & Füzfai 2005). In older reviews (Waterman & Mole 1994) much attention was paid on simple spectrophotometric methods and low capacity chromatographic methods such as paper chromatography. However, nowadays high-performance liquid chromatography (HPLC) in combination with ultraviolet and visible wavelength (UV-Vis) photodiode array detector (PAD) is the main method used for quantitative analysis of phenolic compounds. In addition, HPLC systems equipped with mass spectrometric (MS) detection are becoming more common in the quantitative analysis. HPLC-PAD systems can give some indication of the structure of unknown compounds; however, MS and nuclear magnetic resonance (NMR) based methods are more powerful in the elucidation of the structure. 4.1 Collection and storage of plant material
As discussed earlier (see 2.3), a variety of internal and external factors affect the content of fruit phenolic compounds, which should be considered during the experiment and when collecting samples (Siriwoharn et al. 2004). Important factors to be considered are light and temperature conditions (Cortell & Kennedy 2006, Wang & Zheng 2001), irrigation (Koundouras et al. 2006), biotic stress factors (Dixon & Paiva 1995), fertilization (Fritz et al. 2006), juvenility (Close et al. 2005), maturity (Halbwirth et al. 2006), fruit size (Moyer et al. 2002) and differential distribution of compounds between tissues (Tsao et al. 2006).
To get an authentic phenolic profile, the fruits should be analysed right after collection (Kalt et al. 1999, Mullen et al. 2002). However, this can be difficult to arrange and samples are commonly frozen or dried until analysed. Drying and freezing can minimize enzymatic degradation and oxidative damage, but they also cause changes in the phenolic profiles (Keinänen & Julkunen-Tiitto 1996, Mullen et al. 2002). Frozen storage can cause further changes (de Ancos 2000a and b), and storage time should thus be kept as short as possible.
Kuopio Univ. Publ. C. Nat. and Environ. Sci. 208: 1-93 (2007) 31

Mikko J. Anttonen: Evaluation of means to increase the content of bioactive phenolic compounds in soft fruits
4.2 Sample treatment
The goal of the sample treatment is to solubilise the analytes in sufficient concentrations for further analyses and to get rid of interfering substances. Given the wide variation in the content of different compounds and in their chemical properties there are no universal methods for all sample types and compounds (Kähkönen et al. 1999).
For frozen samples, thawing in a microwave oven has been found suitable (Häkkinen et al. 1999). Thorough grinding of the sample is essential for efficient extraction. Liquid extraction is commonly used for solid samples (Tura & Robards 2002, Tsao & Deng 2004). However, there are also other useful techniques including microwave-assisted extraction, supercritical fluid extraction and pressurized liquid extraction.
In the liquid extraction of solid samples, aqueous mixtures of ethanol, methanol, and acetone have been commonly used. The choice of organic solvent and its ratio to water differs according to the properties of the phenolic compounds to be extracted (Julkunen-Tiitto 1985, Kähkönen et al. 1999 and 2001). Aqueous acetone is good for extracting phenolic compounds from fruits (Kähkönen et al. 2001); however, modifications in the structure of anthocyanins may occur (Lu & Foo 2001).
The stability of phenolic compounds during the extraction process can be increased by adding small amounts of acids in the extraction solvent (Friedman & Jürgens 2000). Particularly in the extraction of anthocyanins, low pH is essential (Nielsen et al. 2003). Hydrochloric acid is often used for the acidification; however, it can be deleterious to the most sensitive acylated anthocyanins (Tura & Robards 2002). Weaker acids, such as formic and acetic acid are thus preferred.
Cell wall -bound phenolic compounds are not extracted by the above-mentioned methods (Péres-Jiménes & Saura-Calixto 2005). Alkaline or enzymatic hydrolysis can be used to release these compounds (Tura & Robards 2002).
In some cases simple solvent extraction is sufficient for the analyses. However, further concentration, purification and fractionation steps might be needed (Tura & Robards 2002). Selective solvents, such as ethyl acetate can be used to fractionate different phenolic compounds (Määttä et al. 2001, Kader et al. 1996). Solid phase extraction with C18 packing material can also be used to fractionate phenolic compounds according to their polarity, acidity (Chen et al. 2001) or solubility in different solvents (Skrede et al. 2000). However, recovery of different compounds in solid phase extraction can vary significantly (George et al. 2005).
Kuopio Univ. Publ. C. Nat. and Environ. Sci. 208: 1-93 (2007) 32
Analysis of fruit phenolic compounds
Numerous derivatives of phenolic aglycones can make their analysis challenging. Several hydrolytic methods have been developed to remove the sugar groups and thus reduce the number of compounds to be analysed (Mattila et al. 2000, Mattila & Kumpulainen 2002, Nyman & Kumpulainen 2001). Hydrolysis (acid, base, or enzymatic) offers numerous advantages (Tura & Robards 2002). By reducing the number of analytes, their chromatographic separation becomes easier. Moreover, more commercial standards are available for phenolic aglycones. By combining derivatives of the same aglycone structure, the precision of the methods can be increased. 4.3 Chromatographic separation of phenolic compounds
HPLC is probably the most widely used technique for the separation of phenolic compounds (Merken & Beecher 2000, Robbins 2003, Naczk & Shahidi 2004, Molnár-Perl & Füzfai 2005). Gas chromatography (GC) has also been used, but volatility of different phenolic compounds varies greatly, which limits the use of the technique. GC is used nowadays primarily for the analysis of phenolic acids (Robbins 2003, Zadernowski et al. 2005). Besides HPLC and GC, there are reports describing the use of capillary electrophoresis (CE) (Molnár-Perl & Füzfai 2005). Compared with HPLC, these techniques might in some cases be more useful, providing higher efficiency, selectivity, and speed.
In the HPLC analysis phenolic compounds are normally separated in reverse phase (RP) columns using gradient elution (Naczk & Shahidi 2004). However, the separation of large condensed tannin polymers is not possible with RP columns because of many isomers with similar polarity, and normal-phase columns are thus used instead (Schofield et al. 2001).
The binary elution system in the HPLC analysis is usually composed of organic solvent and aqueous acid. Commonly used organic solvents are acetonitrile and methanol (Molnár-Perl & Füzfai 2005). Keinänen & Julkunen-Tiitto (1998) reported that, compared with methanol, acetonitrile is a slightly better eluent for flavonoid glycosides, whereas methanol is better for non-flavonoid phenolic compounds. Addition of tetrahydrofuran can enhance the separation of flavonoid glycosides. Acids are used to minimize peak tailing (Keinänen & Julkunen-Tiitto 1998). Some commonly used acids are acetic acid, formic acid, phosphoric acid, and trifluoroacetic acid (Naczk & Shahidi 2004).
Kuopio Univ. Publ. C. Nat. and Environ. Sci. 208: 1-93 (2007) 33

Mikko J. Anttonen: Evaluation of means to increase the content of bioactive phenolic compounds in soft fruits
4.4 Qualitative analysis
On-line UV-Vis spectral analysis with PAD after HPLC separation can provide some information of the structure of compounds (Figure 3). However, more appropriate methods for the structure elucidation are MS and NMR spectroscopy.
Various MS methods have been applied for the analysis of phenolic compounds (Stobiecki 2000). Methods based on atmospheric pressure ionisation (API), including electrospray ionisation (ESI) and atmospheric pressure chemical ionisation (ACPI), are probably most widely used. These methods can be easily coupled with HPLC systems, and ionization conditions used are suitable for labile compounds. ESI is based on the formation of ions in a solution, whereas in ACPI molecules are first thermally transferred into gaseous phase, after which ionisation is induced by electric discharge. ACPI might thus be more useful for compounds that do not efficiently form ions in a solution. In addition, higher flow rates can be used with ACPI.
A B E
C D
F G
Figure 3. Ultraviolet-visible wavelength spectra of different phenolic compounds. A = Protocatechuic acid, hydroxybenzoic acids; B = Caffeic acid, hydroxycinnamic acids; C = 5-caffeoylquinic acid (chlorogenic acid), hydoxycinnamic acid derivate; D= quercetin 3-rhamnoglucoside (rutin), flavonolglycoside; E = quercetin, flavonols; F = cyanidin, anthocyanidin; G = (-)-catechin, flavan-3-ols.
Kuopio Univ. Publ. C. Nat. and Environ. Sci. 208: 1-93 (2007) 34

Analysis of fruit phenolic compounds
Both ESI and ACPI techniques can be used either in positive or in negative ion mode. This is useful since different compounds can form one type of ion more efficiently (Pèrez-Magariño et al. 1999, de Rijke et al. 2003).
Tandem mass spectrometers (MSn) are capable of selecting ions with chosen mass to charge ratio for collisionally induced dissociation (CID). CID-created fragment ions can then be detected and used for structural elucidation (Clifford et al 2003). Aglycone structures and molecular mass of conjugates can be easily determined (Häkkinen & Auriola 1998). However, MS techniques are not capable of providing complete structural identification (Stobiecki 2000). For example, it is not possible to distinguish between diastereomeric sugar units. 4.5 Quantitative chromatography
In the quantitative chromatography, the most common detection system combined with HPLC is UV-Vis PAD (Naczk & Shahidi 2004), which enables simultaneous detection with different wavelengths. Different phenolic classes can be analysed simultaneously using appropriate wavelengths, providing thus the highest sensitivity and selectivity (Figure 3). Moreover, PAD can be used for tentative structural identification as it enables on-line spectral analysis.
Besides UV-Vis detection, fluorescence detection is occasionally used (Naczk & Shahidi 2004). In some cases fluorescence detection can provide higher sensitivity and selectivity (Rodríques-Delgado et al. 2001). However, UV-Vis detection seems to be more applicable when several compounds are analysed simultaneously.
MS techniques are widely used for qualitative analysis of phenolic compounds (Molnár-Perl & Füzfai 2005) but these techniques are becoming more common also in the quantitative analysis. The obvious benefits from MS methods are their high selectivity and sensitivity. 4.6 Simple quantitative methods for phenolic compounds
Several simple spectrophotometric methods have been developed for the analysis of phenolic compounds (Table 1). Although these methods are not very specific, they can easily give an estimate of the content of phenolic compounds in a sample.
The Folin-Ciocalteu method for the analysis of total phenolics (Singleton & Rossi 1965) is probably one of the most widely used methods. The reaction is based on the reducing ability of phenolic compounds in alkaline solution. However, there are many interfering compounds, and non-phenolic compounds can also act as reducing agents (Prior et al. 2005). The result cannot thus be considered as an absolute
Kuopio Univ. Publ. C. Nat. and Environ. Sci. 208: 1-93 (2007) 35

Mikko J. Anttonen: Evaluation of means to increase the content of bioactive phenolic compounds in soft fruits
measure of total phenolics. Due to its reaction mechanism, the Folin-Ciocalteu method can also give an estimate of the antioxidant capacity of a sample (see 4.7).
The structure of anthocyanins in solution is affected by pH (Lapidot et al. 1999). Consequently, pH also alters the absorption properties of these compounds, which can be used in the quantification of anthocyanins. The red coloured flavylium cation is present at highly acidic pH, whereas at pH range from 4 to 5 the colourless pseudobase prevails. Thus by measuring the absorbance at 515 nm of a sample buffered to pH values 1.0 and 4.5 an estimation of the anthocyanin content can be obtained (Naczk & Shahidi 2004, Fuleki & Francis 1968).
Table 1. Simple methods for quantitative analysis of different phenolic groups
Phenolic group Method and mechanism Reference
Total phenolics Folin-Ciocalteu method; reducing property of phenolate anions in alkaline solution
Singleton & Rossi 1965
Hydrolysable tannins Potassium iodate assay; conversion of hydrolysable tannins to methyl gallate followed by oxidation with KIO3 to yield a chromophore
Hartzfeld et al. 2002
Flavonoids Total flavonoid assay; reaction of flavonoids with sodium nitrate followed by formation of flavonoid-aluminum complex
Zhishen et al. 1999
Anthocyanins pH differential method; absorption changes by pH
Fuleki & Francis 1968
Condensed tannins Acid-butanol assay; acid-catalysed oxidative depolymerisation of condensed tannins into anthocyanidins
Porter et al. 1986
4.7 Antioxidant capacity assays
There are several in vitro methods for the analysis of antioxidant capacity of a sample, which can be divided either to electron transfer (ET) or hydrogen atom transfer (HAT) -based assays (Prior et al. 2005). In general, HAT-based methods are regarded as biologically more relevant, and oxygen radical absorbance capacity (ORAC) assay has been proposed as the most useful method.
The Folin-Ciocalteu method (Singleton & Rossi 1965) measures the reducing capacity of phenolic compounds. The reaction is not very specific and thus it is suitable for measuring antioxidant capacity (Prior et al. 2005). Although the method is based on electron transfer, it is considered very useful as it is simple, sensitive and reproducible.
The DPPH (α,α-diphenyl-β-picrylhydrazyl) radical scavenging assay is also simple and widely used ET-based method. DPPH is a stable radical molecule that absorbs
Kuopio Univ. Publ. C. Nat. and Environ. Sci. 208: 1-93 (2007) 36

Analysis of fruit phenolic compounds
strongly at 517 nm (in ethanol) giving the solution a deep purple colour (Blois 1958). When the odd electron becomes paired, the absorption vanishes; the change is stoichiometric with respect to the number of electrons taken up. Thus the easiest assay is to mix sample and DPPH solution and follow the colour change until the reaction reaches the steady state (Brand-Williams et al. 1995). However, this kind of strategy does not take into account the speed of the reaction. Sánchez-Moreno et al. (1998) introduced a new parameter that also considers the time needed to reach the steady state. The new parameter made the analysis more discriminatory compared to the simpler one.
The biological significance of these assays has not been fully established (Huang et al. 2005). The problem with antioxidant capacity methods is their narrowness. Single type of reaction is measured either in hydrophilic or hydrophobic phases. However, in a biological system several types of oxidants with different modes of action are present. 4.8 Reporting quantitative data
The data on phenolic content can be reported either on dry weight (DW) or fresh weight (FW) basis. Expression based on FW is appropriate when reporting food composition data (Macheix et al. 1990).
In plant physiological studies other factors need to be considered when reporting the results (Macheix et al. 1990). Expression based on DW is used to eliminate variation caused by water. However, both phenolic compounds and most of the cellular water are stored in vacuoles. Thus FW-based expression gives a good estimation of the biologically significant concentration of phenolic compounds. Neither way considers dilution caused by increased biomass (Koricheva 1999). Reporting the amount of phenolics per fruit could be considered (Halbwirth et al. 2006). In some cases this type of expression can give more information of the biosynthesis, import, and export of phenolic compounds as it merely represents the content of phenolic compounds per cell (Macheix et al. 1990).
Kuopio Univ. Publ. C. Nat. and Environ. Sci. 208: 1-93 (2007) 37

Mikko J. Anttonen: Evaluation of means to increase the content of bioactive phenolic compounds in soft fruits
5 PHENOLIC COMPOUNDS AS PART OF FOOD QUALITY
Interest in healthier food can increase the value of plants and plant products with higher content of heath-related compounds. Thus the content of compounds such as phenolics should be equally considered, along with other quality factors, in plant production and when developing new cultivars. 5.1 Health awareness
Knowledge of the importance of food and food constituents in our health increases constantly. In addition, people seem to be interested in applying this new knowledge. In the Eurobarometer survey in 2003, one third of the Europeans reported that they had changed their eating habits into more healthier direction during the previous three years (European opinion research group EEIG 2003). Interestingly, one of the changes was to eat more fruits and vegetables. Another trend suggesting the interest in investing in health is the increased sales of nutraceuticals and functional foods. In the USA the value of functional food market in 2002 was estimated to be 20 billion USD and it was expected to reach 37 billion USD by 2007 (LePree 2003). Globally USA forms the main market area of functional foods. The value of European functional food market in 2003 was estimated to be only over 2 billion USD with an annual growth of 5% (Menrad 2003). Similarly, in 2003 the global market value of nutraceuticals was expected to grow at an annual rate of 9.9% from 46.7 to 74.7 billion USD by the year 2007 (McWilliams 2003). In Europe, increased production of organic foods (Rohner-Thielen 2005) further supports the trend towards healthier food choices, as the assumption that organically produced food is healthy is a major driving force when making the purchase decision (Shepherd et al. 2005).
Education can further strengthen the trend toward healthier food consumption habits. In Finland, education has for long been an important part of the healthcare system. An excellent example of the power of education is the Finnish North-Karelia project which started in 1972 (Puska et al. 1985). The project aimed at decreasing the major cardiovascular disease risk factors through community-based strategy. Education and training, integrated to the social organization and aimed to the whole community, were the main strategies of the project. During the ten years of intervention, a significant decrease was observed in the cardiovascular disease risk factors and also in the cardiovascular disease mortality. The importance of education has been acknowledged also at the global level. Healthy nutrition and sufficient physical exercise are considered as major approaches in the
Kuopio Univ. Publ. C. Nat. and Environ. Sci. 208: 1-93 (2007) 38
Phenolic compounds as part of food quality
prevention of dominant causes of death worldwide and, as one of the global strategies to improve wellbeing, WHO emphasizes the importance of education (WHO, resolution WHA55.23). 5.2 Methods for enrichment of phenolic compounds
The intake of phenolic compounds is directly related to the quality and quantity of fruits and vegetables that are consumed. Thus if we are to increase the intake of phenolic compounds we can either increase the consumption of fruits or choose species with high phenolic content. However, due to the quality, availability, and price of fruits and vegetables this approach has its limitations. There is also another potential way to increase the phenolic content, which includes different techniques that can be used to manipulate plant metabolism in a way that favours higher accumulation of phenolic compounds (Table 2). 5.2.1 Genetic modification
Several strategies exist to genetically modify the biosynthesis of phenolic compounds (Parr & Bolwell 2000, Schijlen et al. 2004). For example, by down-regulating one branch of the pathway, it might be possible to enhance the synthesis of the compounds in another branch. A more common approach is to up-regulate the genes, and there are several successful examples (Muir et al. 2001, Lukaszewicz et al. 2004, Niggeveg et al. 2004). Muir et al. (2001) achieved a 78-fold increase in the flavonol content of tomato peel by over-expressing chalcone isomerase. However, this kind of approach might not always be easy due to the presence of several control points that maintain the metabolic homeostasis (Parr & Bolwell 2000).
Besides increasing the content of endogenous metabolites, it is also possible to introduce new ones (Dixon 2005). There are several examples of the successful introduction of the gene encoding resveratrol-producing stilbene synthase (STS) in various crop plants (Liu et al. 2006, Rühmann et al. 2006). Following the transfer of STS in apples (Rühmann et al. 2006), the basal level of a new metabolite piceid (resveratrol glucoside) was quite low (< 10 µg/g dry weight), whereas quite high content (56 µg/g fresh weight) of resveratrol was detected in lettuce (Liu et al. 2006).
Kuopio Univ. Publ. C. Nat. and Environ. Sci. 208: 1-93 (2007) 39
Mikko J. Anttonen: Evaluation of means to increase the content of bioactive phenolic compounds in soft fruits
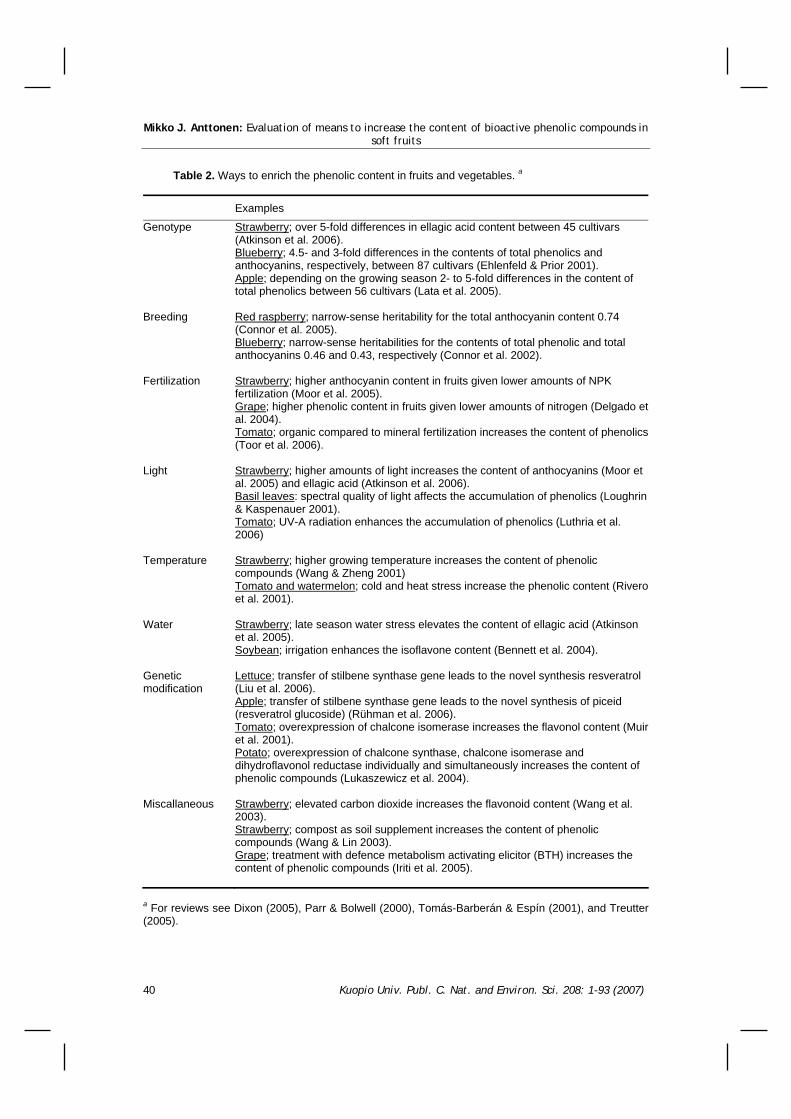
Table 2. Ways to enrich the phenolic content in fruits and vegetables. a
Examples
Genotype Strawberry; over 5-fold differences in ellagic acid content between 45 cultivars (Atkinson et al. 2006). Blueberry; 4.5- and 3-fold differences in the contents of total phenolics and anthocyanins, respectively, between 87 cultivars (Ehlenfeld & Prior 2001). Apple; depending on the growing season 2- to 5-fold differences in the content of total phenolics between 56 cultivars (Lata et al. 2005).
Breeding Red raspberry; narrow-sense heritability for the total anthocyanin content 0.74 (Connor et al. 2005). Blueberry; narrow-sense heritabilities for the contents of total phenolic and total anthocyanins 0.46 and 0.43, respectively (Connor et al. 2002).
Fertilization Strawberry; higher anthocyanin content in fruits given lower amounts of NPK fertilization (Moor et al. 2005). Grape; higher phenolic content in fruits given lower amounts of nitrogen (Delgado et al. 2004). Tomato; organic compared to mineral fertilization increases the content of phenolics (Toor et al. 2006).
Light Strawberry; higher amounts of light increases the content of anthocyanins (Moor et al. 2005) and ellagic acid (Atkinson et al. 2006). Basil leaves: spectral quality of light affects the accumulation of phenolics (Loughrin & Kaspenauer 2001). Tomato; UV-A radiation enhances the accumulation of phenolics (Luthria et al. 2006)
Temperature Strawberry; higher growing temperature increases the content of phenolic compounds (Wang & Zheng 2001) Tomato and watermelon; cold and heat stress increase the phenolic content (Rivero et al. 2001).
Water Strawberry; late season water stress elevates the content of ellagic acid (Atkinson et al. 2005). Soybean; irrigation enhances the isoflavone content (Bennett et al. 2004).
Genetic modification
Lettuce; transfer of stilbene synthase gene leads to the novel synthesis resveratrol (Liu et al. 2006). Apple; transfer of stilbene synthase gene leads to the novel synthesis of piceid (resveratrol glucoside) (Rühman et al. 2006). Tomato; overexpression of chalcone isomerase increases the flavonol content (Muir et al. 2001). Potato; overexpression of chalcone synthase, chalcone isomerase and dihydroflavonol reductase individually and simultaneously increases the content of phenolic compounds (Lukaszewicz et al. 2004).
Miscallaneous Strawberry; elevated carbon dioxide increases the flavonoid content (Wang et al. 2003). Strawberry; compost as soil supplement increases the content of phenolic compounds (Wang & Lin 2003). Grape; treatment with defence metabolism activating elicitor (BTH) increases the content of phenolic compounds (Iriti et al. 2005).
a For reviews see Dixon (2005), Parr & Bolwell (2000), Tomás-Barberán & Espín (2001), and Treutter (2005).
Kuopio Univ. Publ. C. Nat. and Environ. Sci. 208: 1-93 (2007) 40
Phenolic compounds as part of food quality
Genetic modification has thus the potential of producing plants with higher phenolic content. A major hurdle in this approach, especially in Europe, is the general opposition of this technology as indicated by the recent Eurobarometer survey (Gaskell et al. 2006). 5.2.2 Plant breeding
Because of the big genotypic differences in the phenolic content of plants (see 2.1), breeding could be a potential approach for enrichment of phenolic compounds (Scalzo et al. 2005a). Evaluation of the heritability of anthocyanins in red raspberries (Connor et al. 2005) and of antocyanins and total phenolic compounds in blueberries (Connor et al. 2002) shows that these traits can be improved through breeding. However, there are only a few published examples of the potency of this strategy. 5.2.3 Exploitation of the phenotypic plasticity
The phenotypic plasticity of plant metabolism (see 2.3) might also be exploited to increase the phenolic content of crop plants. Potential approaches have been presented in the reviews of Parr & Bolwell (2000) and Tomás-Barberán & Espín (2001) who suggested the exploitation of biotic and abiotic stress factors and optimization of growth conditions such as light and temperature. Furthermore, treatment of the plants with compounds affecting the metabolism of phenolic compounds could also be used (Iriti et al. 2005).
As a further point of consideration regarding the enrichment of fruits and
vegetables with phenolic compounds, the recent paper of Atkinson et al. (2005) raised an important question. Although it is possible to increase the content of these compounds by manipulating the physiology of plants using different agronomic treatments, it is equally important to consider their effects on other quality factors including yield and organoleptic properties such as colour, bitterness, and astringency. There are only a few studies considering these other quality factors. Atkinson et al. (2005) reported that drought stress increased the ellagic acid content of strawberry fruits, whereas the fruit size was simultaneously decreased. In another study with strawberries, Atkinson et al. (2006) found that highly reflective mulches increased both the content of ellagic acid in the fruits and also the fruit yield.
Kuopio Univ. Publ. C. Nat. and Environ. Sci. 208: 1-93 (2007) 41
Mikko J. Anttonen: Evaluation of means to increase the content of bioactive phenolic compounds in soft fruits
6 AIMS OF THE STUDY
Numerous studies support the health-promoting effects of phenolic compounds. Higher intake of these compounds can thus be considered beneficial for human health. Along with the increased scientific knowledge, consumers' awareness of the relationship of nutrition and health has also increased, and the health-related properties of food crops are becoming increasingly significant quality criteria. There are several approaches to increase the intake of phenolic compounds, of which the most obvious way is to choose foods with high content of these compounds. Optimisation of the cultivation practices can also lead to a higher content of phenolic compounds in plants and thus to higher intake of phenolics.
The aim of the present study was to evaluate the potential of different agricultural regimes and production systems for increasing the phenolic content in soft fruits. Techniques that could easily be applied in practice were chosen. Red raspberry, strawberry and black currant were chosen as they are the most consumed and cultivated soft fruits in Finland and important crop plants worldwide. Besides, the phenolic content is high in these fruits, which makes them good sources of phenolic compounds to start with. The specific aims were: A To evaluate the effect of genotype (I and II) and environment (I, II, and IV)
on fruit phenolic content. B To evaluate the effect of agricultural regimes (fertilization, mulch colour,
early forcing, planting date, amount of light) and fruit order on the biochemical quality of strawberry fruits (II and III).
C To compare fruit phenolic compounds of black currants in conventional and
organic production systems (IV).
Kuopio Univ. Publ. C. Nat. and Environ. Sci. 208: 1-93 (2007) 42
Materials and methods
7 MATERIALS AND METHODS 7.1 Plant material and experimental design
In all experiments, evenly ripened fruits according to their surface colour were harvested. Only fruits grown in similar light conditions were collected. The fruits were immediately frozen and stored at –20° C. In comparative studies the storage times were the same for all samples. 7.1.1 Genotype and environment
Red raspberries (I) (Rubus idaeus L.) were collected during summers 2001 and 2002 from a commercial farm in Kitee and from the Research Garden of the University of Kuopio, both located in Eastern Finland (distance 150 km). The cultivars (cv.) in Kitee were Balder, Heisa, Preussen, Ottawa, Haida, Muskoka, Algonquine, Ville, Gatineau, Nova, Orion, yellow cv. 1, yellow cv. 2, and Killarney. The cultivars in Kuopio were Balder, Heisa, Preussen, Ottawa, Muskoka, Ville, yellow cv. 3, and Maurin Makea. Wild red raspberries were collected close to the Research Garden of the University of Kuopio. A composite sample of evenly ripened fruits (300-500 g) was collected evenly from the central area of the farm from five randomly selected rows.
Strawberries (II) (Fragaria × ananassa Duch.) were grown in commercial farms in Southern Finland. The fruit samples of different strawberry cultivars (Honeoye, Jonsok, Polka, Bounty, Korona, and Dania) were collected during summer 2001 (third year from planting) at four farms in which either conventional or organic farming were practised. Silt clay was the dominant soil type in all farms. In conventional farms NPK fertilization was given at the time of establishment and in spring 2001, whereas the organic fields were fertilized only at the time of establishment with cow manure compost. Pesticides and fungicides were used in conventional farms whereas no plant protection was used in organic farms. A composite sample of fruits (500 g) was collected evenly from five randomly selected rows at the central area of the field.
Black currant (IV) (Ribes nigrum L.) samples were collected as described below (see 7.1.3).
Kuopio Univ. Publ. C. Nat. and Environ. Sci. 208: 1-93 (2007) 43
Mikko J. Anttonen: Evaluation of means to increase the content of bioactive phenolic compounds in soft fruits
7.1.2 Agricultural regimes
The fertilization experiment (II) was carried out on an open field in South-Western Finland. Peat beds (20 cm high and 80 cm wide), isolated from the soil by plastic foil were mulched with black plastic foil, and strawberry (Fragaria × ananassa Duch., cv. Bounty) plants were planted in double row with 33 cm space between the plants (40000 plants/ha). Fertilization treatments were applied in the following summer. The experimental design was a randomised block design with four replicates. Plants were fertigated with solutions of three different conductivities. By the collection date, at the fertilization level 0.6 mS/cm, the seedlings had received (per plant) 339 μg of N, 82 μg of P, 645 μg of K, 65 μg of Ca, 39 μg of Mg, 51 μg of S, 3.7 μg of Fe, 514 ng of B, 308 ng of Cu, 2057 ng of Mn, 41 ng of Mo, 20 ng of Co and 514 ng of Zn. The amounts of nutrients were calculated according to the manufacturer’s information. At the levels of 1.2 and 2.4 mS/cm the amounts were increase 2- and 4-fold, respectively. 500 g of fruits per replicate were collected at the end of the cropping season.
The effects of mulch colour, early forcing and fruit order (Figure 4) on strawberry (Fragaria × ananassa Duch., cv. Korona) fruit quality were evaluated in a field study in Stjørdal, middle Norway (II and III). Strawberry plants with initiated flower buds, were planted 2 July 2003 on 25 cm high beds in double row 20 cm apart with 25 cm space between the plants (5714 plants/1000 m2). During winter the field was covered with fleece for freezing protection. Throughout the experiment the field was drip fertigated. The photosynthetic active radiation (PAR; μmol/m2 s) was measured at the ground level inside and outside the tunnel in 2003 and 2004, and temperatures (ºC) were monitored 5 cm above the mulch in 2003 to 2005 within the plant canopy in both mulch types and under the fleece. Experiments were carried out in a tunnel (Haygrove Ltd., Herefordshire, UK) with two treatments in a split plot design of six replicates placed across the rows of the tunnel. Treatments were: 1) Early forcing on large plots (120 plants harvested) randomised within replication; a: from 2 July 2003 and from 20 April 2004, until 5% of the flowers were opened, b: no forcing, and 2) mulch on small plots (60 plants harvested) randomised within large plots; a: white polyethylene mulch, b: brown polyethylene mulch. Fruits (100 g) of different order (Figure 4) were harvested in 2003 as autumn crop and in 2004 and 2005 as midsummer crop. However, in summer 2005 a single sample consisted of fruits of different order collected evenly. Fruit yield (kg/1000 m2) and size (diameter, mm) as well as the the quality of fruits (shape and possible infections) were recorded.
Kuopio Univ. Publ. C. Nat. and Environ. Sci. 208: 1-93 (2007) 44
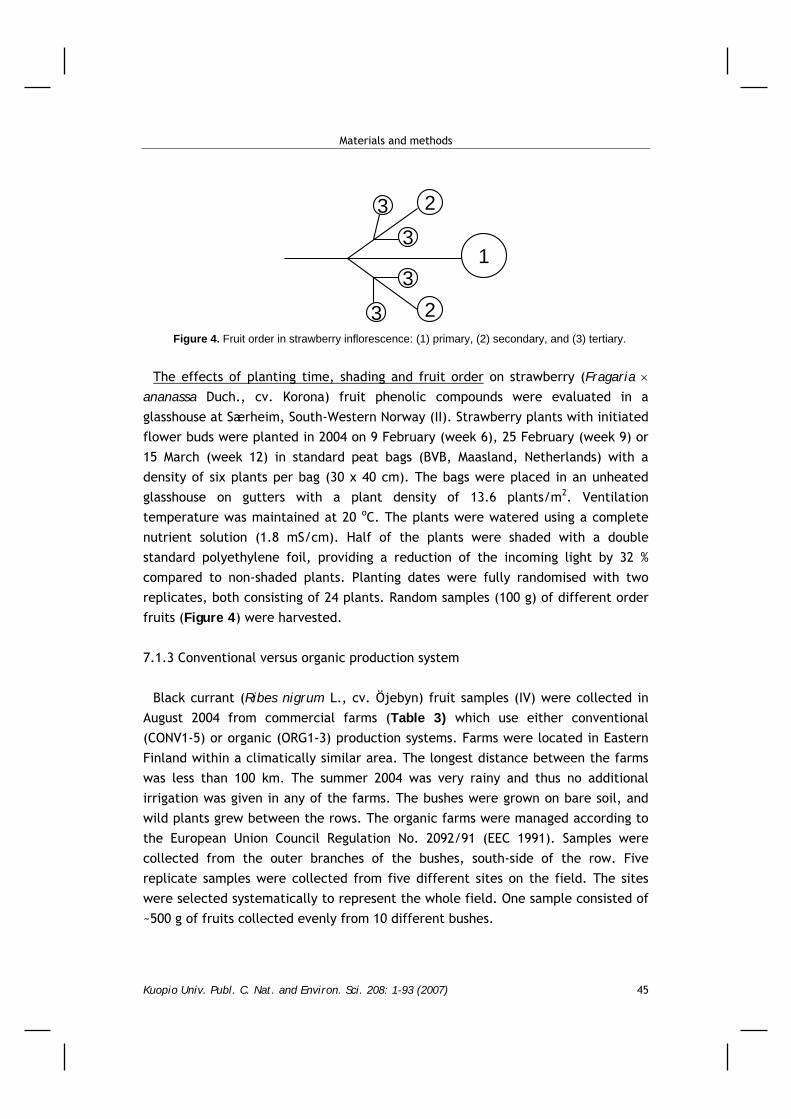
Materials and methods
1
2
2
33
3
3 Figure 4. Fruit order in strawberry inflorescence: (1) primary, (2) secondary, and (3) tertiary.
The effects of planting time, shading and fruit order on strawberry (Fragaria ×
ananassa Duch., cv. Korona) fruit phenolic compounds were evaluated in a glasshouse at Særheim, South-Western Norway (II). Strawberry plants with initiated flower buds were planted in 2004 on 9 February (week 6), 25 February (week 9) or 15 March (week 12) in standard peat bags (BVB, Maasland, Netherlands) with a density of six plants per bag (30 x 40 cm). The bags were placed in an unheated glasshouse on gutters with a plant density of 13.6 plants/m2. Ventilation temperature was maintained at 20 oC. The plants were watered using a complete nutrient solution (1.8 mS/cm). Half of the plants were shaded with a double standard polyethylene foil, providing a reduction of the incoming light by 32 % compared to non-shaded plants. Planting dates were fully randomised with two replicates, both consisting of 24 plants. Random samples (100 g) of different order fruits (Figure 4) were harvested. 7.1.3 Conventional versus organic production system
Black currant (Ribes nigrum L., cv. Öjebyn) fruit samples (IV) were collected in August 2004 from commercial farms (Table 3) which use either conventional (CONV1-5) or organic (ORG1-3) production systems. Farms were located in Eastern Finland within a climatically similar area. The longest distance between the farms was less than 100 km. The summer 2004 was very rainy and thus no additional irrigation was given in any of the farms. The bushes were grown on bare soil, and wild plants grew between the rows. The organic farms were managed according to the European Union Council Regulation No. 2092/91 (EEC 1991). Samples were collected from the outer branches of the bushes, south-side of the row. Five replicate samples were collected from five different sites on the field. The sites were selected systematically to represent the whole field. One sample consisted of ~500 g of fruits collected evenly from 10 different bushes.
Kuopio Univ. Publ. C. Nat. and Environ. Sci. 208: 1-93 (2007) 45

Mikko J. Anttonen: Evaluation of means to increase the content of bioactive phenolic compounds in soft fruits
Table 3. Black currant cv. Öjebyn fruit samples were collected from eight farms during august 2004 within a climatically similar area in Eastern Finland, which use either conventional (CONV) or organic (ORG) production systems.
Age Soil type Alignment of rows a Fertilisation b Plant
protection
CONV1 5 sand moraine SW-NE A2003, 235 kg/ha of PK S2004, 235 kg/ha of Y2 Karate c
CONV2 4 clay (rich organic) SW-NE S2004, row fertilization equaling 1200 kg/ha of Y2
Gusation d, Karate
CONV3 4 sand moraine (rich organic) E-W S2004, 130 kg/ha of Y2 Basta e
CONV4 5 silt clay SW-NE A2003, 300 kg/ha of PK S2004, 400 kg/ha of Y2
Karate, Dithane f
CONV5 5 sand moraine SE-NW S2004, 250 kg/ha of Y1 Roundup Gold g, Malasiini h
ORG1 5 sand moraine SW-NE 2003, green fertilization and ash none
ORG2 4 silt sand SW-NE Biotite at establishment none
ORG3 5 sand moraine SW-NE Cow manure sludge, green fertilization and micronutrients at establishment.
none
a SW = South-West, NE = North-East, E = East, W = West, SE = South-East, NW = North-West b A=autumn, S=spring, PK=0N:5P:20K, Y1=9N:6P:17K, Y2=6N:6Y:19K c insecticide (Syngenta CropProtection A/S, Basel, Switzerland) d insecticide (Makhteshim-Agan Industries Ltd., Tel-Aviv, Israel) e herbicide (Bayer CropScience, Monheim, Germany) f fungicide (Dow AgroScience LLC, Indianapolis, IN, USA) g herbicide (Monsanto Company, St. Louis, MO, USA) h insecticide (Kemira GrowHow Oyj, Helsinki, Finland)
7.2 Sample treatments
All analyses were made from freshly frozen fruits. The fruits were thawed in microwave oven (650 W) so that the temperature stayed close to 0 °C. Thawed samples were homogenised using a household food processor.
Ellagic acid and flavonols were extracted from red raspberries (I) and strawberries (II and III) with optimised hydrolytic methods (Häkkinen et al. 1999 and 2000, Mikkonen et al. 2001). The fruit homogenates were first extracted with 50% methanol containing tert-butylhydroquinone as antioxidant. For the flavonol analysis, morin was added as an internal standard. The extracted flavonol glycosides and ellagic acid conjugates were hydrolysed at +80 °C for 2 h and at +85 °C for 20 h, respectively, using hydrochloric acid.
The other phenolic compounds (I-IV) were extracted with 70% aqueous acetone acidified to pH 2 with hydrochloric acid. 5 g of strawberry and red raspberry homogenate (I-III) was extracted three times with 15 mL of the solvent for 5 min, whereas 3 g of black currant homogenate (IV), was extracted once with 20 mL of
Kuopio Univ. Publ. C. Nat. and Environ. Sci. 208: 1-93 (2007) 46
Materials and methods
the solvent for 20 min followed by two extractions with 15 mL of the solvent for 10 min. After extraction the volumes were adjusted to 50 mL.
Total soluble solids and titratable acids were analysed from the juice separated from the fruit homogenates (III and IV). The fruit homogenate was warmed up to room temperature to aid juice separation and the juice was separated by centrifugation at ambient temperature (2000 g, 30 min). 7.3 Quantitative analysis 7.3.1 Total phenolics
Total phenolic content (I-IV) was measured from the phenolic extracts using the Folin-Ciocalteu method (Singleton & Rossi 1965) with minor modifications. Volumes of the sample, Folin-Ciocalteu phenol reagent (Merck, Darmstadt, Germany) and sodium carbonate were reduced to 1:10 compared with the original method, in which the final volume was 20 mL. The modified method was found to give results comparable with the original method. Gallic acid (Sigma Chemical Co., St. Louis, MO, USA) was used as a standard for the quantification. Results are expressed as mg/100 g FW for red raspberries (I) and strawberries (II and III) and as g/kg FW for black currants (IV). 7.3.2 Total anthocyanins
Total anthocyanin content (I-III) was measured with the pH differential method described by Cheng and Breen (1991). Briefly, absorbance of the extract was measured at 510 and 700 nm in buffers at pH 1.0 and 4.5. Anthocyanin content was calculated using the absorbance of A = [(A510-A700)pH 1,0 – (A510 – A700)pH 4,5]. Molar absorptivities of 29 000 and 24 400 L/(mol cm) were used for red raspberries and strawberries, respectively. The results are expressed as mg/100 g FW as cyanidin 3-glucoside for red raspberries and as pelargonidin 3-glucoside for strawberries. 7.3.3 DPPH radical scavenging capacity
The antioxidant capacity of strawberry extracts (II) was assessed using stable free radical α,α-diphenyl-β-picrylhydrazyl (DPPH) purhased from Sigma Chemical Co. Samples were diluted in 0.4 M acetate buffer (pH 5.0). The assay was performed in a microplate. To a well, 50 μl of sample and 250 μl of DPPH solution (4.0 mg/100
Kuopio Univ. Publ. C. Nat. and Environ. Sci. 208: 1-93 (2007) 47
Mikko J. Anttonen: Evaluation of means to increase the content of bioactive phenolic compounds in soft fruits
ml of methanol) were added. Absorbance was recorded in a Victor 2 (Wallac/PerkinElmer, Wellesley, MA, USA) multilabel counter using a 530 nm filter after 40 minutes, which was found sufficient for the reaction to reach a steady state. Calibration curve was used to calculate the amount of scavenged radical. From each extract, three replicate measurements were done. Results are expressed as mg of consumed DPPH/g of fruit FW. 7.3.4 Total soluble solids
Soluble solids of the juice (III and IV) were measured with a PR-32 Digital Refractometer (Atago, Tokyo, Japan). Four replicate measurements were done for each juice sample and results are given as % of Brix. 7.3.5 Titratable acidity
Titratable acidity of the juice samples (III and IV) was measured according to AOAC official method 942.15 (AOAC 1998). Juice was diluted in 200 mL of deionized water and titrated to pH 8.1 with 0.1 M sodium hydroxide (purchased as 50% solution from Fluka, Buchs SG, Switzerland). Results are given as g/kg of juice as citric acid equivalents. 7.3.6 L-Ascorbic acid
L-ascorbic acid was measured (III) using a commercial colorimetric method (Boehringer Mannheim/R-Biopherm GmbH, Darmstadt, Germany). 5 g of the fruit homogenate was extracted with 50 mL of cold 1.5% (w/v) meta-phosphoric acid (pH 3.5) for 10 min. In the reaction, L-ascorbic acid and other reducing agents reduce tetrazolium salt MTT to formazan, which is measured photometrically. The contribution of L-ascorbic acid is defined with blank reaction, where L-ascorbic acid is oxidatively removed by ascorbate oxidase. Reduction of the tetrazolium salt MTT by L-ascorbic acid is equivalent to the quantity of L-ascorbic acid. Results are expressed as mg/kg FW. 7.3.7 High-performance liquid chromatographic (HPLC) methods
Studies I, II, and III. Flavonols (quercetin and kaempferol) and ellagic acid were separated on a LiChroCART Purospher RP-18e column with 125×3 mm i.d. and 5 μm particle size, protected by a respective guard column with 4×4 mm i.d. (Merck).
Kuopio Univ. Publ. C. Nat. and Environ. Sci. 208: 1-93 (2007) 48

Materials and methods
The HPLC apparatus consisted of a Hewlett-Packard (Agilent Technologies, Palo Alto, CA, USA) 1050 series quaternary pumps, a 1100 series autosampler, and a 1040M series II diode array detector, linked to a HP ChemStation revision A.05.02 controlling and data handling software. The gradient elution system with 1% v/v formic acid (A) and acetonitrile (B) was used. The gradient program for ellagic acid was as follows: 0-10 min, 10-13% B; 10-20 min, 13-41.5% B; 20-25 min, 41.5-100% B; 25-28 min, 100-10% B; 28-38 min, 10% B at a flow rate of 0.5 mL/min. For flavonols the gradient program was as follows: 0-20 min, 5-55% B; 20-25 min, 55-100% B; 25-30 min, 100-5% B; 30-40 min 5% of B at a flow rate of 0.6 mL/min. In both analyses the injection volume was 20 μL. Before the analysis, the samples were filtered through syringe filters with 0.45 µm pore size. Compounds were identified by comparing their retention times and UV-Vis spectra to those of standard compounds. Ellagic acid was detected at 260 nm and flavonols at 360 nm. The standards ellagic acid, kaempferol, morin and quercetin were purchased from Sigma Chemical Co. In study I, morin used for year 2001 samples was purchased from ICN Biomedicals (Auraro, OH, USA). Quantification was based on peak areas and new standards were prepared and analysed daily. Results are expressed as mg/100 g FW.
Study IV. Anthocyanins from black currant were separated on a Hypersil ODS column (Agilent Technologies) with 60×4.6 mm i.d. and 3 µm particle size using the HP 1090 series HPLC (Agilent Technologies) equipped with diode array detector and HP ChemStation revision A.10.02 controlling and data evaluation software. The gradient elution system with 5% v/v formic acid (A) and acetonitrile (B) was as follows: 0-8 min, 5-14% B; 8-13-min, 14-95% B; 13-14 min, 95% B and 14-19 min, 95-5%; 19-24 min, 5% B at flow rate of 1.0 mL/min. The column temperature was set to 40 ºC. Before the analysis, samples were put through syringe filter with 0.45 µm pore size. Injection volume was 15 μL and the compounds were detected at 520 nm. Quantification was based on peak areas, and cyanidin (Fluka) was used as a standard. New standards were prepared and analysed daily. Results are expressed as mg/kg FW.
In the analysis of other phenolic compounds from black currant, the same HPLC apparatus as in the anthocyanin analysis was used. The compounds were separated on a 250×4.6 mm i.d., 5 µm particle size, Vydac 218TP54 RP-18 column (Separations Group, Hesperia, CA, USA) using gradient elution with 1% v/v formic acid (A) and 10% v/v acetonitrile in methanol (B) as follows: 0-5 min, 2% B; 5-35 min, 2-15% B; 35-48 min, 15-26% B; 48-55 min, 26-30% B; 55-70 min, 30-50% B; 70-73 min, 50-100% B; 73-75 min, 100% B; 75-80 min, 100-2% B and 10 min, 2% B. The column temperature was set to 40 ºC. Flow rate was 0.9 mL/min. Injection volume
Kuopio Univ. Publ. C. Nat. and Environ. Sci. 208: 1-93 (2007) 49

Mikko J. Anttonen: Evaluation of means to increase the content of bioactive phenolic compounds in soft fruits
was 25 μL. Phenolic acids were detected at 320 nm, whereas 360 nm was used for other compounds. Standards were used as follows (numbering according to Tables 8 and 9): caffeic acid (Sigma Chemical Co.) for compounds 1, 3, 9, 10, and 11; p-coumaric acid (Sigma Chemical Co.) for compounds 2, 4, 5, and 6; ferulic acid (Sigma Chemical Co.) for compounds 7 and 8; myricetin (Fluka) for compounds 12, 13, and 14; quercetin (Sigma Chemical Co.) for compounds 15, 16, 17, 18, and 21; kaempferol (Fluka) for compounds 19 and 20. Quantification was based on peak areas and new standards were prepared and analyzed daily. Results are expressed as mg/kg FW. 7.4 Identification of phenolic compounds
In all HPLC analyses, diode array detector was used to record the UV-Vis spectra of eluting compounds. In study IV electrospray ionization tandem mass spectrometric (ESI-MSn) detection was used for further structural elucidation of non-anthocyanin phenolics. The HPLC ESI-MSn system consisted of a Finnigan Surveyor HPLC and Finnigan LTQ linear ion trap mass spectrometer (Thermo Electron Corporation, Waltham, MA, USA). Simultaneous UV detection at 320 nm was done by splitting the solvent flow after the column. Otherwise HPLC conditions were as described above.
The ionization and collision parameters in the positive and negative mode were optimised according to the signal intensity using standard compounds. In the MS analysis ions in the range of m/z 280 and 700 were measured. In MS/MS analysis the most intense molecular ion in the MS spectrum was chosen for collisionally induced dissociation (CID). Following MS/MS analysis the most intense ion in the MS/MS spectrum was chosen for CID to produce MS3 spectrum, after which the sequence was repeated for the second most intense peak in MS spectrum. The specific fragmentation of the compounds was used for identification. The identity of the aglycones was confirmed by comparing the fragmentation pattern to that of standard compounds when available. 7.5 Statistical analyses
Statistical analyses in studies I, II, and IV were performed using the SPSS for Windows version 11.5.1 (SPSS Inc., Chicago, IL, USA). In study III SAS statistical analysis software release 8.2 was used (SAS Institute Inc., Cary, NC, USA). In all analyses differences at P < 0.05 were considered to be significant.
Kuopio Univ. Publ. C. Nat. and Environ. Sci. 208: 1-93 (2007) 50

Materials and methods
The effect of cultivar on phenolic content in red raspberries (I) and the effects of cultivar, growth location, and fertilization on strawberries (II) were evaluated using one-way analysis of variance (ANOVA). After ANOVA, multiple-comparisons were made using either Tukey’s HSD or Dunnett’s T3 test. T-test was used to compare the effect of growth season on flavonol content in red raspberries (I).
In studies II and III the GLM (general linear model) procedure was used to evaluate the effects of the main factors and their interactions on strawberry phenolic compounds (mulch colour × early forcing × fruit order and planting date × shading × fruit order).
In study IV, differences between farms in the contents of measured compounds were evaluated using one-way ANOVA. After ANOVA, multiple-comparisons were made using either Tukey’s HSD or Dunnett’s T3 test. In addition, the phenolic content data were analysed using factor analysis with principal component extraction (principal component analysis, PCA) and varimax rotation. Regression method was used to calculate factor scores. Factor scores were used to test the clustering of farms by one-way ANOVA in combination with either Tukey’s HSD or Dunnett’s T3 test.
Kuopio Univ. Publ. C. Nat. and Environ. Sci. 208: 1-93 (2007) 51
Mikko J. Anttonen: Evaluation of means to increase the content of bioactive phenolic compounds in soft fruits
8 RESULTS AND DISCUSSION 8.1 Validity of the analyses of phenolic compounds 8.1.1 Flavonol analysis
The hydrolytic extraction procedures in the flavonol analysis (I and II) were based on the work of Hertog et al. (1992), in which the reaction conditions were optimised for the analysis of flavonol glycosides. These conditions were adopted by Häkkinen & Auriola (1998) and further developed especially for berries by Häkkinen et al. (1999) and Mikkonen et al. (2001). The repeatability (relative standard deviation, RSD) of the method reported by Hertog et al. (1992) was 4.3% for myricetin, 2.5-3.1% for quercetin, and 4.6-5.6% for kaempferol. Recoveries for pure standard compounds spiked in the extract ranged from 71 to 101%. Similar values were reported for the method described by Mikkonen et al. (2001). In study I values for repeatability (RSD) and recovery for quercetin were 4 and 97%, respectively, whereas in study II repeatability (RSD) for quercetin was 3% and for kaempferol 5% and recoveries ranged from 88 to 111%. The conditions optimised by Hertog et al. (1992) were found suitable also in another study (Mattila et al. 2000), in which similar repeatability and recovery values were reported. Thus the method can be considered suitable for the evaluation of flavonol content in fruits. 8.1.2 Ellagic acid analysis
The ellagic acid analysis (I-III) was based on the method optimised by Häkkinen et al. (2000). In this method, ellagitannins and ellagic acid glycosides are extracted in 50% methanol and hydrolysed to ellagic acid. The reported repeatability (RSD) of the method was 5.3% for strawberries and 6.0% for red raspberries and the recovery for ellagic acid standard was 80% for strawberries. Mattila & Kumpulainen (2002) confirmed that the method was suitable for strawberries and red raspberries. In the method used in studies I-III the extraction and hydrolysis steps were separated, whereas in the original method by Häkkinen et al. (2000) these were done simultaneously. In the present study the extraction was done at lower temperature for 2 hours, which might have led to lower yields of ellagic acid. However, similar level of ellagic acid was quantified in strawberries and in red raspberries as in the studies of Häkkinen et al. (2000) and Mattila & Kumpulainen (2002). In addition, the repeatability, tested with strawberries was found good (8% RSD).
Kuopio Univ. Publ. C. Nat. and Environ. Sci. 208: 1-93 (2007) 52

Results and discussion
8.1.3 Acetone extraction, total phenolics, total anthocyanins, and antioxidant capacity
Total phenolics, total anthocyanins, and antioxidant capacity in studies I-III were analysed from the acetone extract. The acetone extract was also used in all analyses of phenolic compounds from black currant fruits (IV). The development of the extraction procedure was based on the yield of total phenolics measured using the Folin-Ciocalteu method. For all berries 50, 70 and 100% acetone were tested. In addition, for black currants 50 and 70% methanol were tested. In all analyses 70% acetone was found to give the highest yield of phenolic compounds. The repeatability (RSD) of the extraction procedure was < 1% for red raspberries and strawberries, and 1.5% for black currants. In addition, the within-laboratory reproducibility (RSD) tested with black currants was 1.1%.
The pH differential method was found suitable for the total anthocyanin analysis. The repeatability (RSD) of the method was 1.9% for strawberries and 1.2% for black currants.
The system suitability (repetability of the equipment) for the DPPH radical scavenging assay was 1.5% (RSD) and the detector response was found linear in the range used (R2 > 0.999). 8.1.4 Analysis of black currant fruit phenolic compounds
Anthocyanins in study IV were analysed from the acetone extract of black currant fruits using the HPLC method. Specifity of the method can be considered very good based on the unique absorption properties of anthocyanins at higher wavelengths compared with other phenolic compounds. The system suitability was 0.6-0.7% RSD and the repeatability 1.7-2.6% RSD. The detector response was linear within the range tested (R2 > 0.999). Repeatabilities reported by Nyman & Kumpulainen (2001) and by Nielsen et al. (2003) were 1.41 and 0.044% RSD respectively. In the former methods anthocyanins were analysed after hydrolysis and in the latter they were analysed from black currant juices.
Other black currant phenolic compounds in study IV were also analysed using a HPLC-based method. Specificity of the method was confirmed by comparing the spectra of the compounds at three different points of the peak (up-slope, apex and down-slope). The system suitability was 0.2-3.3% RSD and the repeatability 0.7-5.7% RSD. The detector response was linear within all ranges tested (R2 > 0.999). Previously, the repeatability of a hydrolytic method followed by HPLC analysis was 4.0-14.1% for phenolic acids (Mattila & Kumpulainen 2002) and 2.9-10.4% for
Kuopio Univ. Publ. C. Nat. and Environ. Sci. 208: 1-93 (2007) 53
Mikko J. Anttonen: Evaluation of means to increase the content of bioactive phenolic compounds in soft fruits
flavonoids (Mattila et al. 2000). Ehala et al. (2005) showed that capillary electrophoresis (CE) method can also be suitable for the analysis of phenolic compounds from fruits. Repeatability of the CE method for various phenolic compounds was 1.23-3.68% RSD. 8.2 Effect of genotype and environment on fruit phenolic content 8.2.1 Genotype
The effect of genotype on selected phenolic compounds in red raspberries and strawberries was evaluated in studies I and II. In both studies, wide and statistically significant differences were found between the cultivars.
In red raspberries (Figure 5), the content of the total phenolic compounds ranged from 192 mg/100 g FW in Gatineau to 359 mg/100 g FW in Ville. Gatineau and Nova contained the lowest levels of ellagic acid and Ville the highest, 38 and 118 mg/100 g FW, respectively. Interestingly, a high correlation (Pearson's r = 0.98, P < 0.001) between the ellagic acid and total phenolic content was found. The total anthocyanin content ranged from 19 mg/100 g FW in Preussen to 51 mg/100 g FW in Gatineau. The low levels of anthocyanins in the cultivars with yellow fruits could not be detected by the method used. The amounts of quercetin were also low in the yellow fruits. However, correlation was found between the anthocyanin and quercetin contents. The yellow cv. 2 had the lowest quercetin content and Ottawa the highest, 0.62 and 1.75 mg/100 g, respectively. Although no anthocyanins were detected in yellow fruits, there were no obvious changes in the contents of other phenolic compounds.
In study II, different strawberry cultivars (Honeoye, Jonsok, Polka, Bounty, Korona, and Dania) were collected from four different locations. Flavonols quercetin and kaempferol were detected in all samples. The highest kaempferol content was detected in Honeoye and Jonsok and the highest quercetin content in Honeoye. The ranking of other cultivars varied according to the location. Within a single location, the highest differences were over 4-fold for the kaempferol and over 2-fold for the quercetin.
Kuopio Univ. Publ. C. Nat. and Environ. Sci. 208: 1-93 (2007) 54

Results and discussion
Tot a l phe nol i c s
0 50 100 150 200 250 300 350 400
Ville
Algonquine
Ot t awa
Heisa
Preussen
Yellow cv. 1
Haida
Muskoka
Yellow cv. 2
Orion
Balder
Killarney
Nova
Gat ineau
El l a gi c a c i d
0 20 40 60 80 100 120 140
Ville
Algonquine
Ot t awa
Heisa
Preussen
Yellow cv. 1
Haida
Muskoka
Yellow cv. 2
Orion
Balder
Killarney
Nova
Gat ineau
na
na
na
na
A nt hoc y a ni ns
0 10 20 30 40 50 60
Ville
Algonquine
Ot t awa
Heisa
Preussen
Yellow cv. 1
Haida
Muskoka
Yellow cv. 2
Orion
Balder
Killarney
Nova
Gat ineau
nd
nd
Que r c e t i n
0 0,5 1 1,5
Ville
Algonquine
Ot t awa
Heisa
Preussen
Yellow cv. 1
Haida
Muskoka
Yellow cv. 2
Orion
Balder
Killarney
Nova
Gat ineau
2
Figure 5. Variation of the phenolic content between red raspberry cultivars collected in Kitee
2002. Results are expressed as mg/100 g FW with standard deviation. na = not analysed. nd = not detected.
Results from both strawberries and red raspberries indicate that genotype significantly affects the phenolic content. In addition, in the case of flavonol contents, this variation was proven in different growing locations and seasons. Interestingly, with red raspberries it was noted that different compound groups did not follow the same pattern. The ellagic acid content correlated well with the total phenolic content, whereas the anthocyanin content did not. This could be explained by the fact that ellagitannins are clearly the major group of phenolics in red raspberries (Kähkönen et al. 2001, Määttä-Riihinen et al. 2004a). Furthermore, anthocyanins and ellagitannins are synthesised in very distinct parts of the metabolism of phenolic compounds (Figure 2). It is possible that, for the same reason, the yellow fruit mutation did not appear to be linked with changes in other compounds. In contrast, Liu et al. (2002) observed that of the four cultivars tested, the yellow fruit cultivar Anne contained least phenolics and the dark fruit Heritage the most. In the present study, the contents of phenolic acids, flavan-3-ols, and
Kuopio Univ. Publ. C. Nat. and Environ. Sci. 208: 1-93 (2007) 55
Mikko J. Anttonen: Evaluation of means to increase the content of bioactive phenolic compounds in soft fruits
condensed tannins were not analysed; however, these comprise only small part of the total amount of phenolic compounds in red raspberries (Gu et al. 2004, Määttä-Riihinen et al. 2004a).
Flavonols comprise only a minor part of the phenolic compounds in strawberries (Määttä-Riihinen et al. 2004a, Seeram et al. 2006), and it is important to note that even though 2- to 4-fold differences in the contents of flavonols were found it only means few milligrams per 100 g of fruits. Hence, the practical significance of the variation in a minor component can be quite low unless the consumption is very high. Furthermore, the ranking of cultivars according to flavonol is not necessarily similar to that of other phenolic compounds in strawberries, as seen with red raspberries.
Numerous other studies have shown the variation between cultivars (Beekwilder et al. 2005, Ehlenfeld & Prior 2001, Lata et al. 2005, Olsson et al. 2004b). Results of the present study further support these studies, and especially the study on red raspberries provides quite extensive information due to the large number of cultivars analysed. In many studies variation in total phenolics or total anthocyanins between cultivars of different species has been measured. In red raspberries, ~1.5-fold differences were observed in the contents of total phenolics and flavonoids between four cultivars, whereas the difference in the anthocyanin content was over 20-fold (Liu et al. 2002). Similarly, in another study with red raspberries the relative difference between five cultivars was significantly higher in total anthocyanin content than in the content of total phenolics (Wang & Lin 2000). Scalzo et al. (2005b) detected almost 2-fold differences in total phenolic content between six strawberry cultivars. Interestingly, Moyer et al. (2002) not only detected over 2-fold differences in the contents of total phenolics and anthocyanins between 32 black currant genotypes, but also a positive correlation between fruit size and anthocyanin content. It was suggested that breeding during hundreds of years had combined these two important quality factors (fruit colour and size). When more detailed analysis of the different phenolic compounds has been done, differential variation has been observed in the contents of individual compounds (Howard et al. 2002, Beekwilder et al. 2005). More detailed information is thus needed about the variation of individual compounds, as their health related properties can vary greatly (see Chapter 3).
On the health-related point of view, the information about the phenolic content is valuable. First, more detailed information about the content of different compounds in our diet helps to evaluate better the relationship between the diet and health in epidemiological studies. Secondly, the intake of phenolics can be increased by selecting cultivars with high phenolic content. Thirdly, the presence
Kuopio Univ. Publ. C. Nat. and Environ. Sci. 208: 1-93 (2007) 56

Results and discussion
of genetic component in the determination of the phenolic content makes it possible to further enhance this trait by breeding.
Breeding has been suggested to be a potential strategy to increase the phenolic content in plants. Besides providing better health-related value, higher phenolic content might also provide other benefits, as phenolics are an important part of the organoleptic quality (for example colour) of food crops. Furthermore, as defence compounds (Dixon & Paiva 1995) phenolics could also enhance disease resistance. However, there are only a few published examples of the usefulness of this strategy. Evaluation of the heritability of anthocyanins in red raspberry (Connor et al. 2005) and of antocyanins and total phenolic compounds in blueberries (Connor et al. 2002) showed that these traits can be improved through breeding. The narrow-sense heritability for individual anthocyanins in red raspberries ranged from 0.45 to 0.78, being 0.74 for total anthocyanin content. In blueberries the values were 0.43 and 0.46 for total anthocyanins and total phenolics, respectively. However, breeding can also be challenging. For example, Scalzo et al. (2005a) observed that correct parental combinations were important in the improvement of the nutritional quality of red raspberries and strawberries. Furthermore, it is yet to found if the higher phenolic content is connected with some negative traits in the plants. 8.2.2 Environment
The effect of environment (growth location or growing seasons) on different biochemical constituents in red raspberries, strawberries, and black currants was evaluated in studies I, II, and IV. The differences in quercetin content in red raspberry cultivars (I) were wide between the two growing locations (Table 4). The highest difference between the growing locations was 2.5-fold. However, the variation in quercetin content between the two growing seasons was less evident. The highest difference between growing seasons was found in the yellow cv. 2 (1.8-fold).
In strawberries (II), the effect of growing environment on flavonol content was also statistically significant. The highest variation in kaempferol content was found in cv. Bounty, whereas the highest variation in quercetin content was found in cv. Polka (1.5- and 2.0-fold differences between the highest and lowest contents, respectively).
Kuopio Univ. Publ. C. Nat. and Environ. Sci. 208: 1-93 (2007) 57
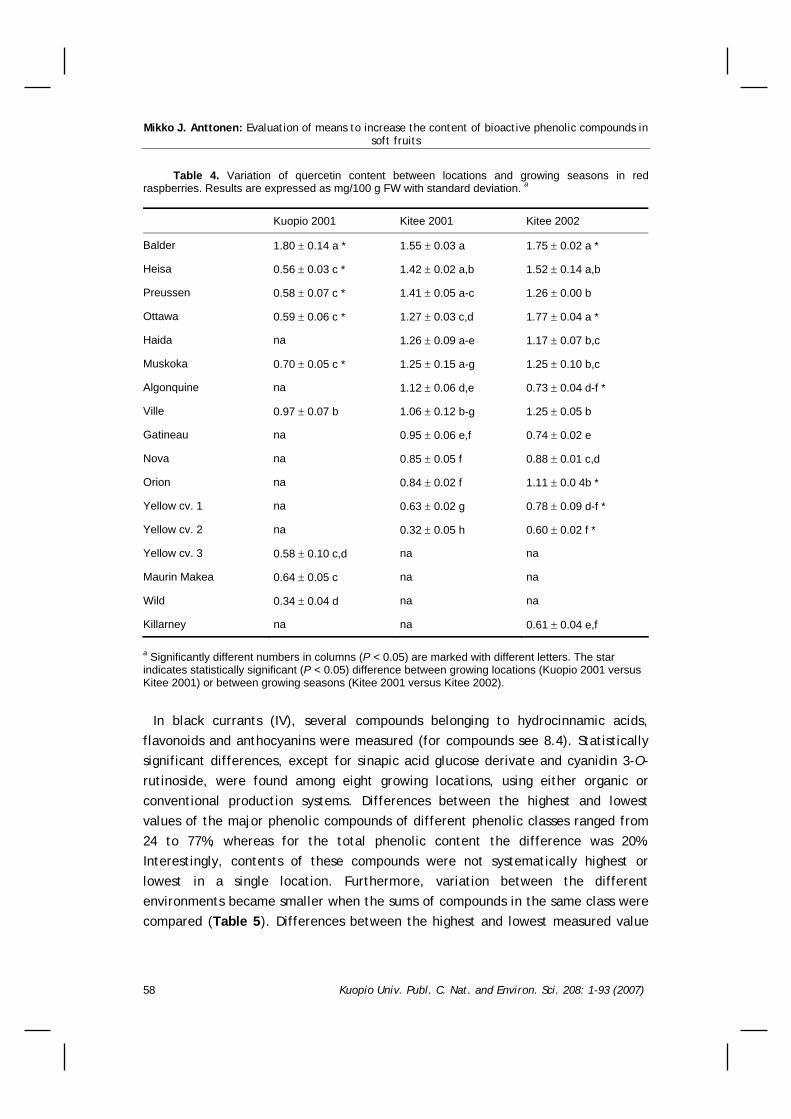
Mikko J. Anttonen: Evaluation of means to increase the content of bioactive phenolic compounds in soft fruits
Table 4. Variation of quercetin content between locations and growing seasons in red raspberries. Results are expressed as mg/100 g FW with standard deviation. a
Kuopio 2001 Kitee 2001 Kitee 2002
Balder 1.80 ± 0.14 a * 1.55 ± 0.03 a 1.75 ± 0.02 a *
Heisa 0.56 ± 0.03 c * 1.42 ± 0.02 a,b 1.52 ± 0.14 a,b
Preussen 0.58 ± 0.07 c * 1.41 ± 0.05 a-c 1.26 ± 0.00 b
Ottawa 0.59 ± 0.06 c * 1.27 ± 0.03 c,d 1.77 ± 0.04 a *
Haida na 1.26 ± 0.09 a-e 1.17 ± 0.07 b,c
Muskoka 0.70 ± 0.05 c * 1.25 ± 0.15 a-g 1.25 ± 0.10 b,c
Algonquine na 1.12 ± 0.06 d,e 0.73 ± 0.04 d-f *
Ville 0.97 ± 0.07 b 1.06 ± 0.12 b-g 1.25 ± 0.05 b
Gatineau na 0.95 ± 0.06 e,f 0.74 ± 0.02 e
Nova na 0.85 ± 0.05 f 0.88 ± 0.01 c,d
Orion na 0.84 ± 0.02 f 1.11 ± 0.0 4b *
Yellow cv. 1 na 0.63 ± 0.02 g 0.78 ± 0.09 d-f *
Yellow cv. 2 na 0.32 ± 0.05 h 0.60 ± 0.02 f *
Yellow cv. 3 0.58 ± 0.10 c,d na na
Maurin Makea 0.64 ± 0.05 c na na
Wild 0.34 ± 0.04 d na na
Killarney na na 0.61 ± 0.04 e,f
a Significantly different numbers in columns (P < 0.05) are marked with different letters. The star indicates statistically significant (P < 0.05) difference between growing locations (Kuopio 2001 versus Kitee 2001) or between growing seasons (Kitee 2001 versus Kitee 2002).
In black currants (IV), several compounds belonging to hydrocinnamic acids,
flavonoids and anthocyanins were measured (for compounds see 8.4). Statistically significant differences, except for sinapic acid glucose derivate and cyanidin 3-O-rutinoside, were found among eight growing locations, using either organic or conventional production systems. Differences between the highest and lowest values of the major phenolic compounds of different phenolic classes ranged from 24 to 77%, whereas for the total phenolic content the difference was 20%. Interestingly, contents of these compounds were not systematically highest or lowest in a single location. Furthermore, variation between the different environments became smaller when the sums of compounds in the same class were compared (Table 5). Differences between the highest and lowest measured value
Kuopio Univ. Publ. C. Nat. and Environ. Sci. 208: 1-93 (2007) 58

Results and discussion
of phenolic acids was 23%, whereas differences in the contents of flavonoids were non-significant. For anthocyanins the relative difference was also low (18%); however, it can be considered very important due to the high amount of anthocyanins. The highest difference in the total amount of anthocyanins between the farms was > 400 mg/kg.
Table 5. Environmental variation of black currant phenolics. Results are expresses as mg/kg FW (phenolic acids, flavonoids, and anthocyanins) or as g/kg FW (total phenolics).
Phenolic acids Flavonoids Anthocyanins Total phenolics
CONV1 a 106.90 b b 098.38 a 2552.58 ab 7.65 ab
CONV2 110.72 ab 098.07 a 2248.42 c 7.09 cd
CONV3 098.21 cd 094.77 a 2387.81 a-c 6.67 d
CONV4 105.65 bc 094.41 a 2643.81 a 7.91 a
CONV5 108.88 b 102.09 a 2345.60 bc 7.97 a
ORG1 118.73 a 096.85 a 2222.56 c 8.00 a
ORG2 096.70 d 099.04 a 2414.58 a-c 7.27 bc
ORG3 118.28 a 099.01 a 2421.65 a-c 7.91 a
P < 0.001 ns < 0.001 < 0.001
a CONV = conventional farm, ORG = organic farm b statistically different results (P < 0.05) in columns are marked with different letters, ns = non-significant
The data on the black currant phenolic content (IV) were analysed also with PCA to test the clustering of the farms. The farms were most efficiently separated by PC2 (Table 11 and Figure 8), which explained 24.0% of the total variation. The PC2 was most influenced (factor loading values > 0.7 or < -0.7) by delphinidin 3-O-rutinoside, cyanidin 3-O-glucoside, p-coumaric acid derivate, myricetin rutinoside, quercetin glucoside, and kaempferol glucoside (Table 10). During ripening of the black currant fruits, the content of flavonols and anthocyanins change significantly (Koeppen & Herrmann 1977, Starke & Herrmann 1976). Thus small differences in the maturity of the fruits might explain part of the variation between the farms. However, no differences were detected in the ratio of sugars and acids, which suggests an even ripeness. The phenolic content might also be affected by numerous environmental factors and different agricultural practices (Parr & Bolwell 2000, Tomás-Barberán & Espín 2001).
All the analyses demonstrated significant variation in the contents of phenolics between different environments. In addition, the study on red raspberry showed
Kuopio Univ. Publ. C. Nat. and Environ. Sci. 208: 1-93 (2007) 59
Mikko J. Anttonen: Evaluation of means to increase the content of bioactive phenolic compounds in soft fruits
that variation could be found also between the growing seasons. Probably the most significant observation was that the different compounds behaved differently. Many other studies have also demonstrated the environmental variation of phenolic compounds (Moore 2005, Mpofu et al. 2006), variation between the growing seasons (Howard et al. 2002, Howard et al. 2003, Lata et al. 2005), and in one study the ellagic acid content in strawberries was shown vary even between harvest dates not far apart from each other (Williner et al. 2003). 8.2.3 Genotype x environment
Results from other studies also show that the environment can have variable effects on different genotypes and on different compounds (Howard et al. 2002, Howard et al. 2003, Moore et al. 2006, Mpofu et al. 2006). In a study done with blueberries, Howard et al. (2003) not only showed that the phenolic content was affected by the genotype x growing season interaction, but also that the significance of the effect of environment varied according to different phenolic groups. Anthocyanins were most affected by the growing season (20% of the total variation), whereas in the case of hydroxycinnamic acids and flavonols the effect was smaller (9.1 and 2.9%, respectively). Similarly, Mpofu et al. (2006) demonstrated that phenolic acids in hard spring wheat where differently affected by the environment. For some compounds the effect of environment dominated over that of the genotype. However, the interaction between environment and genotype was small (< 4% of total variance). Interestingly, Moore et al. (2006) reported that the environment was far more important than genotype in determining the total phenolic content in hard winter wheat, as the environment was responsible for almost 80% of the total variation. With spinach it was observed that the variation between cultivars was more evident when harvested in spring, compared to those harvested in late fall (Howard et al. 2002). In addition, the ranking of cultivars was different in different harvests. In a large comparison of 56 different apple cultivars during two consecutive growing seasons, Lata et al. (2005) observed that the variation in the contents of total phenolics, flavonols and anthocyanins was different for different cultivars. Thus some cultivars might be more sensitive to the effect of environment. However, it might also be possible to find genotypes with a rather stable phenolic profile.
The variation in the phenolic content caused by the environment can be very distinctive. If the phenolic content of a cultivar is to be used as a quality factor, it is important to know the extent of variation of this property.
Kuopio Univ. Publ. C. Nat. and Environ. Sci. 208: 1-93 (2007) 60
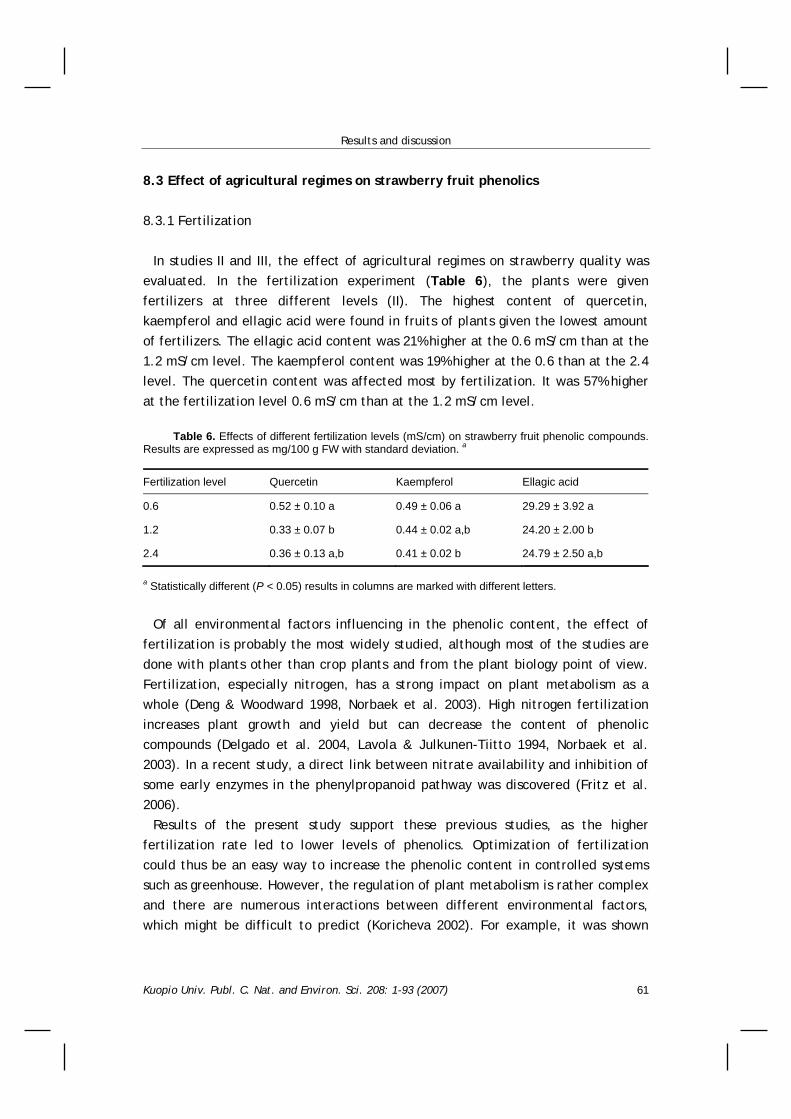
Results and discussion
8.3 Effect of agricultural regimes on strawberry fruit phenolics 8.3.1 Fertilization
In studies II and III, the effect of agricultural regimes on strawberry quality was evaluated. In the fertilization experiment (Table 6), the plants were given fertilizers at three different levels (II). The highest content of quercetin, kaempferol and ellagic acid were found in fruits of plants given the lowest amount of fertilizers. The ellagic acid content was 21% higher at the 0.6 mS/cm than at the 1.2 mS/cm level. The kaempferol content was 19% higher at the 0.6 than at the 2.4 level. The quercetin content was affected most by fertilization. It was 57% higher at the fertilization level 0.6 mS/cm than at the 1.2 mS/cm level.
Table 6. Effects of different fertilization levels (mS/cm) on strawberry fruit phenolic compounds. Results are expressed as mg/100 g FW with standard deviation. a
Fertilization level Quercetin Kaempferol Ellagic acid
0.6 0.52 ± 0.10 a 0.49 ± 0.06 a 29.29 ± 3.92 a
1.2 0.33 ± 0.07 b 0.44 ± 0.02 a,b 24.20 ± 2.00 b
2.4 0.36 ± 0.13 a,b 0.41 ± 0.02 b 24.79 ± 2.50 a,b
a Statistically different (P < 0.05) results in columns are marked with different letters.
Of all environmental factors influencing in the phenolic content, the effect of
fertilization is probably the most widely studied, although most of the studies are done with plants other than crop plants and from the plant biology point of view. Fertilization, especially nitrogen, has a strong impact on plant metabolism as a whole (Deng & Woodward 1998, Norbaek et al. 2003). High nitrogen fertilization increases plant growth and yield but can decrease the content of phenolic compounds (Delgado et al. 2004, Lavola & Julkunen-Tiitto 1994, Norbaek et al. 2003). In a recent study, a direct link between nitrate availability and inhibition of some early enzymes in the phenylpropanoid pathway was discovered (Fritz et al. 2006).
Results of the present study support these previous studies, as the higher fertilization rate led to lower levels of phenolics. Optimization of fertilization could thus be an easy way to increase the phenolic content in controlled systems such as greenhouse. However, the regulation of plant metabolism is rather complex and there are numerous interactions between different environmental factors, which might be difficult to predict (Koricheva 2002). For example, it was shown
Kuopio Univ. Publ. C. Nat. and Environ. Sci. 208: 1-93 (2007) 61

Mikko J. Anttonen: Evaluation of means to increase the content of bioactive phenolic compounds in soft fruits
recently that the decrease in the phenolic content of bilberry leaves induced by nitrogen fertilization was reversed by fungal infection (Witzell & Shevtsova 2004). In grapes high nitrogen fertilization decreased the phenolic content and this effect was attenuated by higher potassium fertilization (Delgado et al. 2004). Interestingly, individual phenolic compounds can behave differently, which suggests the presence of metabolic trade-offs (Keinänen et al. 1999b). The purpose of these trade-offs might be, for example, the maintenance of pathogen resistance, as Strissel et al. (2005) reported that the effect of high nitrogen input was not as strong on the apple scab resistant cultivar as on the susceptible cultivar. 8.3.2 Fruit order, shading and planting date
The effect of fruit order (Figure 4) on the phenolic content and antioxidant capacity of strawberry fruits was evaluted in two separate experiments. Results are reported in studies II and III. In the first experiment (A; experiment on the effects of planting time, shading and fruit order), the planting date and the fruit order had statistically significant effects (Figure 6). In addition, a statistically significant interaction between fruit order and planting date was found. In the second study (B; experiment on the effects of mulch colour, early forcing and fruit order), fruit order was also found to have a significant effect, whereas no interactions were detected.
In experiment A (Figure 6), the total phenolic content was similar in the primary fruits from all planting dates, whereas an increasing trend towards the later planting dates was observed for secondary and tertiary fruits. Similar trend was observed for ellagic acid content and antioxidant capacity. The latest secondary and tertiary fruits had 11 and 34% higher content of total these compounds compared with the earliest ones. Furthermore, the total phenolic and ellagic acid content and antioxidant capacity were found to increase from primary to tertiary fruits. This was observed for fruits from all planting dates; however, the trend was more evident in the later planting dates, and 1.5- to 2.0-fold differences were observed between the primary and tertiary fruits. Interestingly, anthocyanins behaved differently. The latest fruits had the lowest content of anthocyanins, whereas no constant trend was observed according to fruit order.
In experiment B (experiment on the effects of mulch colour, early forcing and fruit order), a statistically significant increasing trend from primary to tertiary fruits was also found for total phenolics, ellagic acid, and antioxidant capacity. Tertiary fruits had 10, 25 and 11% higher content of these compounds, respectively,
Kuopio Univ. Publ. C. Nat. and Environ. Sci. 208: 1-93 (2007) 62

Results and discussion
than did the primary fruits. The content of the total anthocyanin was lowest in the primary fruits and 22 and 17% higher in secondary and tertiary fruits, respectively.
Tot a l phe nol i c s
0
50
100
150
200
250
300
1 2 3 1 2 3 1 2 3
A B C
Ant hoc y a ni ns
0
5
10
15
20
25
30
35
40
45
1 2 3 1 2 3 1 2 3
A B C
El l a gi c a c i d
0
10
20
30
40
50
60
70
80
90
100
1 2 3 1 2 3 1 2 3
A B C
Ant i ox i da nt c a pa c i t y
0
2
4
6
8
10
12
14
16
18
1 2 3 1 2 3 1 2 3
A B C
Figure 6. Effects of planting date and fruit order on the content of strawberry fruit phenolic compounds. The phenolic contents are expressed as mg/100 g FW and antioxidant activity as scavenged DPPH mg/g FW with standard deviation. Fruit order: (1) primary, (2) secondary, and (3) tertiary. Planting dates: (A) week 6, (B) week 9, and (C) week 12.
In experiment A, an obvious difference between the planting dates was the
increased global radiation (Figure 7). According to the carbon/nutrient balance hypothesis (Bryant et al. 1983), higher light conditions could increase photosynthesis and the amount of carbon-based metabolites, including phenolic compounds. Higher amount of metabolites would lead to elevated concentrations particularly in the smaller fruits due to their lower biomass. However, increased light cannot be the only influencing factor, since the content of anthocyanins was decreased, although the effect of light on anthocyanins seems important, as shading was found to slightly decrease the content of anthocyanins (II). The effect was most evident on fruits from the first two planting dates, when the amount of light was lower (Figure 7), the anthocyanin content being 15 and 16% higher when
Kuopio Univ. Publ. C. Nat. and Environ. Sci. 208: 1-93 (2007) 63

Mikko J. Anttonen: Evaluation of means to increase the content of bioactive phenolic compounds in soft fruits
grown at the 100% light level. Cortell & Kennedy (2006) showed also with grapes that shading affects the phenolic content. They found that different phenolics reacted differently to shading. While the total amount of anthocyanins was unaffected, the relative amounts of individual anthocyanins changed significantly. The fruit size was also smaller when shading was used.
0
20
40
60
80
100
6 8 10 12 14 16 18 20 22 24 26
week
MJ m-2 per week
1 2 3
1 2 3
1 2 3A
B
C
Figure 7. Incoming global radiation (solid line) and harvest of strawberry fruits of different order
from different planting dates. Fruit order: (1) primary, (2) secondary, and (3) tertiary. Planting dates: (A) week 6, (B) week 9, and (C) week 12.
Atkinson et al. (2006) also observed differences in the ellagic acid content between fruit orders of two different strawberry cultivars. However, in their study the highest content of ellagic acid was found in the primary fruits. In addition, the two cultivars performed differently. The data of the present study are quite difficult to explain as anthocyanins, especially in experiment A, performed differently compared to the other factors. However, the ellagic acid content and total phenolics did not correlate with the anthocyanin content in red raspberries either (Figure 5). The primary fruits are often largest and the fruit size decreases with increasing fruit order. It is thus possible that the observed difference is due to higher input of resources on growth in primary fruits at the expense of phenolic compounds (Herms & Mattson 1992). Another explanation could be the dilution of the phenolic content due to the higher biomass in larger fruits (Koricheva 1999). The dilution hypothesis applies quite well to experiment B. However, in experiment A the statistically significant fruit order x planting date interaction complicates the interpretation.
In experiment B, the effect of fruit order on some other quality factors were analysed along with phenolic compounds. The titratable acidity of different order fruits was unaffected, whereas the content of total soluble solids, representing the sugar content of the fruits, was highest in primary fruits. The ascorbic acid content
Kuopio Univ. Publ. C. Nat. and Environ. Sci. 208: 1-93 (2007) 64

Results and discussion
of primary fruits was also higher than that of secondary and tertiary fruits. However, the high phenolic content does not seem to be always connected with lower levels of sugars and ascorbic acid, as seen in the mulch experiment below. 8.3.3 Mulch colour and early forcing
Mulch colour affected many quality factors in strawberries (II and III). In 2004, slightly higher amounts of total phenolics and ellagic acid (6 and 7%) were found in fruits grown on white rather than on brown mulch, whereas the total anthocyanin content was slightly higher (10%) in fruits grown on brown mulch, and the antioxidant capacity was unaffected (Table 7). In 2005 a similar, statistically significant result were observed for total phenolic compounds and ellagic acid, whereas the anthocyanin content was unaffected. During three consecutive years, slightly higher (11-7%) amounts of ascorbic acid were measured from fruits grown on white mulch. Titratable acidity was unaffected as were the soluble solids in 2003 and 2005. In 2004 the soluble solids were 6% higher in fruits grown on white mulch. Interestingly, the yields were significantly lower in 2004 and 2005, respectively, when white mulch was used (11 and 17%, respectively). However, when the saleable fruit yields were compared, they were only 6 and 13% lower in 2004 and 2005 when grown on white mulch. The use of fleece for early forcing also decreased the yield, while the phenolic compounds and antioxidant capacity were unaffected. Interestingly, the incidence of powdery mildew infection was slightly lower in fruits grown on white mulch and when fleece was used. However, the difference was not statistically significant. The higher canopy temperature on white mulch might explain this, as higher temperatures might lead to reduction of moisture on fruit surface, which is essential for the fungal growth.
Table 7. The effect of mulch colour on strawberry fruit phenolic compounds and antioxidant capacity. Results are expressed as mg/100 g FW and antioxidant activity as scavenged DPPH mg/g FW with standard deviation.
Total phenolics Anthocyanins Ellagic acid Antioxidant capacity
Brown mulch 253.6 ± 19.1 28.4 ± 4.4 35.1 ± 4.8 13.5 ± 1.4
White mulch 269.5 ± 19.6 25.8 ± 4.1 37.8 ± 4.5 14.1 ± 1.4 Level of significance a ** * ** ns
a ns = non-significant, * P < 0.05, ** P < 0.01
Kuopio Univ. Publ. C. Nat. and Environ. Sci. 208: 1-93 (2007) 65

Mikko J. Anttonen: Evaluation of means to increase the content of bioactive phenolic compounds in soft fruits
The use of a variety of different mulches in strawberry production provides many advantages. Mulching inhibits weed growth, keeps the fruits clean, and it can even limit spreading of diseases. Furthermore, when different mulch types and colours (non-mulched, paddy straw, white polyethylene, and black polyethylene) where compared in a sub-tropical climate, the best growth of strawberry plants was found on black mulch (Sharma & Sharma 2003). Mulching can also affect the biochemical quality of strawberries (Wang et al. 2002). When fruits from non-mulched matted-row system were compared to those grown on hill plasticulture (black polyethylene), higher contents of soluble solids, titratable acidity, ascorbic acid, and different phenolic compounds were found in fruits from hill plasticulture. However, within 14 different genotypes tested, there were also a few exceptions.
The effects of mulching are probably mediated through a more stable soil water status, higher soil and canopy temperatures, and changes in the light quality and quantity. When black and white mulches were compared, soil temperature was found to be higher under black mulch (Ruiz et al. 1999). Compared to black mulch, white mulch reflects the solar radiation better, which leads to lower soil temperature. Better reflection can, however, also lead to higher canopy temperatures, as observed in the present study (III) in summer 2004. Interestingly, Ruiz et al. (1999) also found that the temperature conditions in the soil, created by the white mulch, enhanced nitrogen metabolism seen as higher yields, whereas the temperature under black mulch was too high for optimal nitrogen metabolism. Mulch colour can also affect the quality of the reflected light (Loughrin & Kasperbauer 2001), and the relative reflection of different wavelengths. In addition, these differences were shown to affect the aroma and phenolic compounds in basil. The phenolic content was higher in plants grown on white rather than on black mulch, whereas the highest content was measured in plants grown on yellow and green mulch.
When brown and white mulch were compared in study III, the ascorbic acid content was systematically higher in fruits grown on white mulch in three consecutive years. Interestingly, higher amount of chlorophyll was also measured from the leaves of plants grown on white mulch. Reactive oxygen species are normal by-products of photosynthesis in chloroplasts, and ascorbic acid is essential in the prevention of damages they might cause (Davey et al. 2000). Thus enhanced photosynthesis might lead to higher demand of ascorbic acid.
Enhanced production of carbon-based metabolites could also explain the higher content of total phenolics and ellagic acid (Bryant et al. 1983). In addition, higher content of soluble solids was measured in fruits grown on white mulch in 2004. However, the anthocyanin content in 2004 was higher in fruits grown on brown
Kuopio Univ. Publ. C. Nat. and Environ. Sci. 208: 1-93 (2007) 66

Results and discussion
mulch and in 2005 no difference was observed. In another study where the effects of mulch type on strawberry metabolites was investigated, Atkinson et al. (2006) found higher content of ellagic acid in fruits grown on highly reflective mulches. In addition, in cv. Elsanta the ascorbic acid content performed similarly, whereas in cv. Flamenco the difference between reflective and non-reflective mulches was not as obvious.
The observed differences in the present study might also be explained by the enhanced nitrogen metabolism caused by the increase in soil temperature under brown mulch (Ruiz et al. 1999). The higher fruit yields on brown mulch compared to those grown on white mulch supports this. Consequently, enhanced protein synthesis for growth could make substrates for the synthesis of phenolic compounds less available (Herm & Mattson 1992).
Using a variety of mulches, plant metabolism can be modified in many ways. Our results show that mulch colour affects the phenolic content, which is also supported by other studies. Plant growth (Atkinson et al. 2003, Ruiz et al. 1999) or even flavour (Loughrin & Kasperbauer 2001 and 2002) could also be manipulated. However, different cultivars might be differently affected (Atkinson et al. 2003, Wang et al. 2002). Certain mulches can increase canopy temperature (Atkinson et al. 2006), which has also been shown to elevate the phenolic content (Wang & Zheng 2001); however, high temperatures may also reduce total soluble solids and fruit firmness (Hoppula & Karhu 2006). As mulch only mediates the effect of the environment, it might be challenging to find robust applications especially in field conditions. 8.4 Identification of black currant fruit phenolic compounds
Several phenolic compounds belonging to hydroxycinnamic acids, flavonoids, and anthocyanins were identified in black currants (Tables 8 and 9). The UV-Vis analysis allowed a rough identification of the main group of a compound, when the spectra were compared to those of standard compounds or to those found from the literature (Markham 1982). Four major anthocyanins (dephinidin 3-O-glucoside, delphinidin 3-O-rutinoside (rhamnoglucoside), cyanidin 3-O-glucoside, and 3-O-cyanidin rutinoside) were identified in this study according to their retention order, UV spectra, and relative abundances (Määttä et al. 2003, Slimestad & Solheim 2002).
Tandem mass spectrometric analysis was used for the identification of other compounds. For example, the MS/MS spectrum of compound 13 with [M+H]+ at m/z 627 consisted of two fragment ions at m/z 319 and 481. The first ion matched the
Kuopio Univ. Publ. C. Nat. and Environ. Sci. 208: 1-93 (2007) 67

Mikko J. Anttonen: Evaluation of means to increase the content of bioactive phenolic compounds in soft fruits
m/z values of flavonol aglycone myricetin, and the other indicated a loss of a 146 atomic mass units (amu) of the parent ion. The difference between the aglycones and the other ions was 162 amu. This fragmentation pattern is indicative of a rutinoside (rhamnoglucoside) conjugate. Moreover, the fragmentation of the ion at m/z 319 in the MS3 analysis matched with that of myricetin standard. Thus the compound was tentatively identified as myricetin rutinoside. The identification can be considered only tentative because the identity of conjugated sugars cannot be confirmed with this method. The other compounds were identified in a similar manner. In addition, for caffeoylquinic acids, the hierarchical scheme presented by Clifford et al. (2003) was found useful.
Interestingly, an isorhamnetin (compound 21) derivative was tentatively identified in the present study. Isorhamnetin has not been previously reported in black currant, although it has been found from gooseberry, which belongs to the same genus as black currants (Määttä-Riihinen et al. 2004b). Black currants also synthesise quercetin, the structure of which differs from that of isoramnetin only by one methyl group. The rest of the compounds found have also been identified in previous studies (Lu & Foo 2003, Määttä et al. 2003, Macheix et al. 1990). However, some groups were not detected in the present study. Zadernowski et al. (2005) identified several different hydroxybenzoic acids in black currants, and condensed tannins are also an important group of compounds in black currants (Gu et al. 2004).
In general, the MS method used was quite good for flavonoids, especially in the positive mode. Phenolic acids were detected only in the negative mode, alhough it was not very sensitive. The reason may be the low proportion of organic solvent in the eluent during the elution of phenolic acids, since high amounts (> 20%) of organic solvent is generally considered important for the optimal spray formation and thus for proper ionization. Narrow range in the detection of molecular ions was found important for the sensitivity of the method. Additional purification to reduce the amount of non-phenolic compounds could enhance the identification. In addition, fractionation of compounds with different polarities or ionization properties could enable better analysis conditions.
Kuopio Univ. Publ. C. Nat. and Environ. Sci. 208: 1-93 (2007) 68
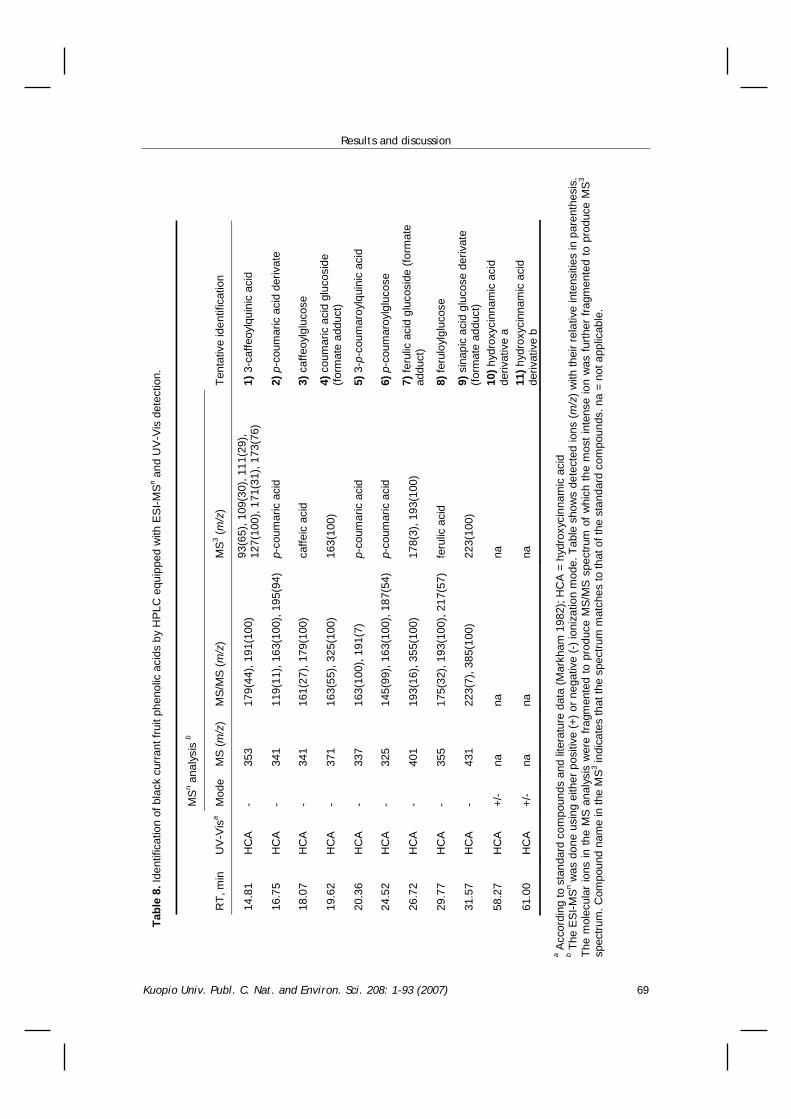
Results and discussion
Kuopio Univ. Publ. C. Nat. and Environ. Sci. 208: 1-93 (2007) 69
Tabl
e 8.
Iden
tific
atio
n of
bla
ck c
urra
nt fr
uit p
heno
lic a
cids
by
HPL
C e
quip
ped
with
ES
I-MS
n and
UV-
Vis
dete
ctio
n.
MS
n ana
lysi
s b
RT,
min
U
V-V
isa
Mod
e M
S (m
/z)
MS/
MS
(m/z
) M
S3 (m/z
) Te
ntat
ive
iden
tific
atio
n
14.8
1 H
CA
-
353
179(
44),
191(
100)
93
(65)
, 109
(30)
, 111
(29)
, 12
7(10
0), 1
71(3
1), 1
73(7
6)
1) 3
-caf
feoy
lqui
nic
acid
16.7
5 H
CA
-
341
119(
11),
163(
100)
, 195
(94)
p-
coum
aric
aci
d 2)
p-c
oum
aric
aci
d de
rivat
e
18.0
7 H
CA
-
341
161(
27),
179(
100)
ca
ffeic
aci
d 3)
caf
feoy
lglu
cose
19.6
2 H
CA
-
371
163(
55),
325(
100)
16
3(10
0)
4) c
oum
aric
aci
d gl
ucos
ide
(form
ate
addu
ct)
20.3
6 H
CA
-
337
163(
100)
, 191
(7)
p-co
umar
ic a
cid
5) 3
-p-c
oum
aroy
lqui
nic
acid
24.5
2 H
CA
-
325
145(
99),
163(
100)
, 187
(54)
p-
coum
aric
aci
d 6)
p-c
oum
aroy
lglu
cose
26.7
2 H
CA
-
401
193(
16),
355(
100)
17
8(3)
, 193
(100
) 7)
feru
lic a
cid
gluc
osid
e (fo
rmat
e ad
duct
)
29.7
7 H
CA
-
355
175(
32),
193(
100)
, 217
(57)
fe
rulic
aci
d 8)
feru
loyl
gluc
ose
31.5
7 H
CA
-
431
223(
7), 3
85(1
00)
223(
100)
9)
sin
apic
aci
d gl
ucos
e de
rivat
e (fo
rmat
e ad
duct
)
58.2
7 H
CA
+/
- na
na
na
10
) hyd
roxy
cinn
amic
aci
d de
rivat
ive
a
61.0
0 H
CA
+/
- na
na
na
11
) hyd
roxy
cinn
amic
aci
d de
rivat
ive
b a A
ccor
ding
to s
tand
ard
com
poun
ds a
nd li
tera
ture
dat
a (M
arkh
am 1
982)
; HC
A =
hyd
roxy
cinn
amic
aci
d b T
he E
SI-M
Sn w
as d
one
usin
g ei
ther
pos
itive
(+) o
r neg
ativ
e (-
) ion
izat
ion
mod
e. T
able
sho
ws
dete
cted
ions
(m/z
) with
thei
r rel
ativ
e in
tens
ities
in p
aren
thes
is.
The
mol
ecul
ar io
ns in
the
MS
anal
ysis
wer
e fra
gmen
ted
to p
rodu
ce M
S/M
S sp
ectru
m o
f whi
ch th
e m
ost i
nten
se io
n w
as fu
rther
frag
men
ted
to p
rodu
ce M
S3
spec
trum
. Com
poun
d na
me
in th
e M
S3 indi
cate
s th
at th
e sp
ectru
m m
atch
es to
that
of t
he s
tand
ard
com
poun
ds. n
a =
not a
pplic
able
.

Mikko J. Anttonen: Evaluation of means to increase the content of bioactive phenolic compounds in soft fruits
Tabl
e 9.
Iden
tific
atio
n of
bla
ck c
urra
nt fr
uit f
lavo
noid
s by
HPL
C e
quip
ped
with
ES
I-MS
n and
UV-
Vis
Det
ectio
n.
MS
n ana
lysi
s b
RT,
min
U
V-V
isa
Mod
e M
S (m
/z)
MS/
MS
(m/z
) M
S3 (m/z
) Te
ntat
ive
iden
tific
atio
n
47.6
5 FL
+
481
319(
100)
m
yric
etin
12
) myr
icet
in g
luco
side
48.5
8 FL
+
627
319(
100)
, 481
(51)
m
yric
etin
13
) myr
icet
in ru
tinos
ide
50.8
6 FL
+
567
319(
100)
m
yric
etin
14
) myr
icet
in m
alon
ylgl
ucos
ide
54.3
4 A
UR
+
449
287(
100)
14
9(14
), 15
3(10
0), 1
61(1
2),
213(
11),
231(
42),
241(
57),
259(
47),
269(
74)
15) a
ureu
sidi
n gl
ucos
ide
57.0
1 FL
+
465
303(
100)
qu
erce
tin
16) q
uerc
etin
glu
cosi
de
58.1
6 FL
+
611
303(
100)
, 465
(38)
qu
erce
tin
17) q
uerc
etin
rutin
osid
e
60.8
6 FL
+
551
303(
100)
qu
erce
tin
18) q
uerc
etin
mal
onyl
gluc
osid
e
62.7
3 FL
+
449
287(
100)
ka
empf
erol
19
) kae
mpf
erol
glu
cosi
de
63.1
4 FL
+
595
287(
100)
, 449
(20)
ka
empf
erol
20
) kae
mpf
erol
rutin
osid
e
64.0
6 FL
+
625
317(
100)
, 479
(36)
16
5(5)
, 243
(5),
271(
6), 2
74(6
), 28
5(35
), 29
9(4)
, 302
(100
) 21
) iso
rham
netin
rutin
osid
e
a acc
ordi
ng to
sta
ndar
d co
mpo
unds
and
lite
ratu
re d
ata
(Mar
kham
198
2); F
L =
flavo
nol,
AU
R=a
uron
e b T
he E
SI-M
Sn w
as d
one
usin
g ei
ther
pos
itive
(+) o
r neg
ativ
e (-
) ion
izat
ion
mod
e. T
able
sho
ws
dete
cted
ions
(m/z
) with
thei
r rel
ativ
e in
tens
ities
in p
aren
thes
is.
The
mol
ecul
ar io
ns in
the
MS
anal
ysis
wer
e fra
gmen
ted
to p
rodu
ce M
S/M
S sp
ectru
m o
f whi
ch th
e m
ost i
nten
se io
n w
as fu
rther
frag
men
ted
to p
rodu
ce M
S3
spec
trum
. Com
poun
d na
me
in th
e M
S3 in
dica
tes
that
the
spec
trum
mat
ches
to th
at o
f the
sta
ndar
d co
mpo
unds
. na
= no
t app
licab
le.
Kuopio Univ. Publ. C. Nat. and Environ. Sci. 208: 1-93 (2007) 70

Results and discussion
8.5 The effect of organic versus conventional production system on black currant fruit phenolics
Statistically significant differences were found between farms for almost all measured phenolic compounds in black currant fruits (see 8.2.2). However, ranking of the farms did not seem to depend on the production system. Similarity of the phenolic profiles in fruits from different growing locations was tested using PCA. Five PCs with eigenvalues > 1 were extracted, and they explained 86.3% of the total variation (Table 10). When the component scores of different PCs were plotted against each other (Figure 8), none of the PCs seemed to separate production systems in different clusters, which was also seen in the statistical analysis of component scores (Table 11). Interestingly, PC5 did not separate organic farms from each other, whereas they were separated to some extent from conventional farms which, on the other hand, were not clustered together. PC5 explained 9.7% of the total variation and was most influenced by caffeoylglucose and aureusidin glucoside (Table 10).
Organically produced foods are often considered healthier than the corresponding conventional foods (Shepherd et al. 2005). However, the scientific evidence supporting this assumption is limited and controversial. In a review of over 150 different studies comparing organic and conventional foods, no general trend could be found concerning the nutritional value (Woese et al. 1997). In a more recent review, Magkos et al. (2003) concluded that in organically produced vegetables there is a trend towards higher ascorbic acid content, although no generalisation could be made.
In the present study, it was found that production system was not the major factor in determining the phenolic contents of black currant fruits. This observation is also supported by other studies (Chassy et al. 2006, Dimberg et al. 2005, Hajslova et al. 2005). In a controlled cultivation test with oats (organic versus conventional), hydroxycinnamic acid content of grains was influenced by cultivar and growing season but not by production system (Dimberg et al. 20005). In a similar study with potatoes, it was concluded that the contents of quality factors including chlorogenic acid are equally or more affected by growing season, cultivar, and growing location than the production system (Hajslova et al. 2005). Finally, in a recent, highly controlled study with tomatoes and bell peppers, variable results were observed (Chassy et al. 2006). The results from the two tomato cultivars from three consecutive years showed that the effect of the cultivation practice on quercetin content and on total phenolics was different in different years, whereas bell peppers were not affected by the production system.
Kuopio Univ. Publ. C. Nat. and Environ. Sci. 208: 1-93 (2007) 71
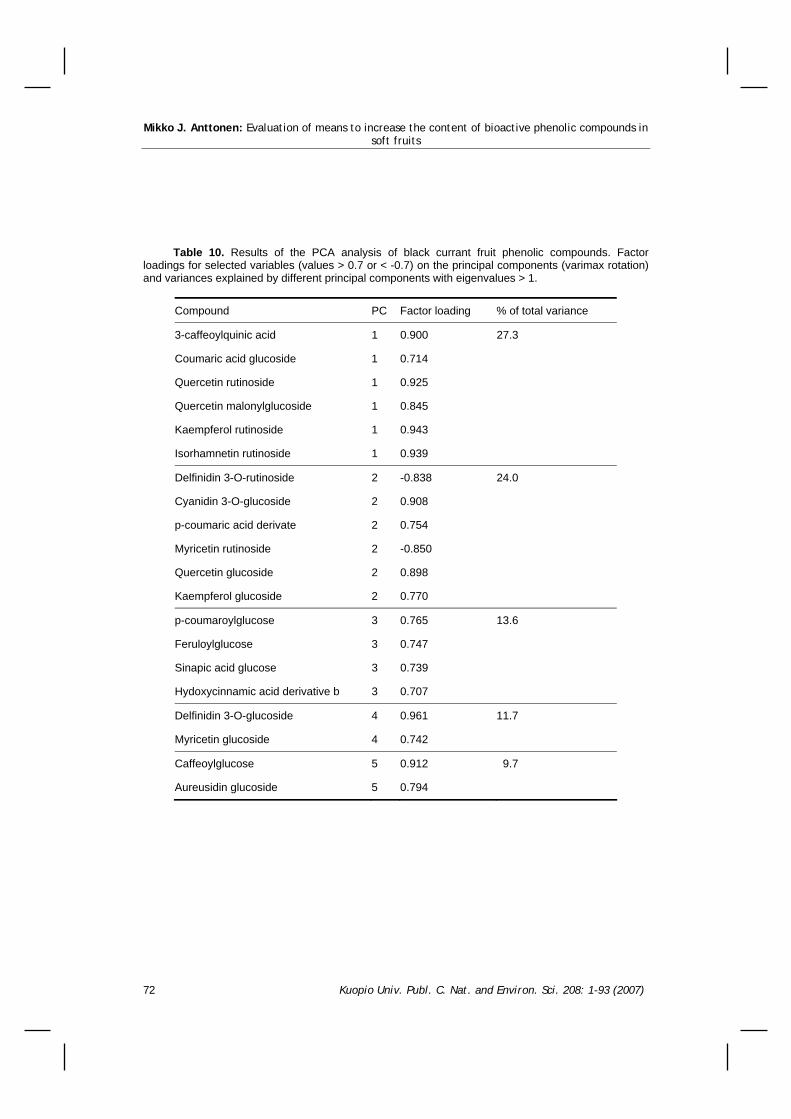
Mikko J. Anttonen: Evaluation of means to increase the content of bioactive phenolic compounds in soft fruits
Table 10. Results of the PCA analysis of black currant fruit phenolic compounds. Factor
loadings for selected variables (values > 0.7 or < -0.7) on the principal components (varimax rotation) and variances explained by different principal components with eigenvalues > 1.
Compound PC Factor loading % of total variance
3-caffeoylquinic acid 1 0.900 27.3
Coumaric acid glucoside 1 0.714
Quercetin rutinoside 1 0.925
Quercetin malonylglucoside 1 0.845
Kaempferol rutinoside 1 0.943
Isorhamnetin rutinoside 1 0.939
Delfinidin 3-O-rutinoside 2 -0.838 24.0
Cyanidin 3-O-glucoside 2 0.908
p-coumaric acid derivate 2 0.754
Myricetin rutinoside 2 -0.850
Quercetin glucoside 2 0.898
Kaempferol glucoside 2 0.770
p-coumaroylglucose 3 0.765 13.6
Feruloylglucose 3 0.747
Sinapic acid glucose 3 0.739
Hydoxycinnamic acid derivative b 3 0.707
Delfinidin 3-O-glucoside 4 0.961 11.7
Myricetin glucoside 4 0.742
Caffeoylglucose 5 0.912 09.7
Aureusidin glucoside 5 0.794
Kuopio Univ. Publ. C. Nat. and Environ. Sci. 208: 1-93 (2007) 72
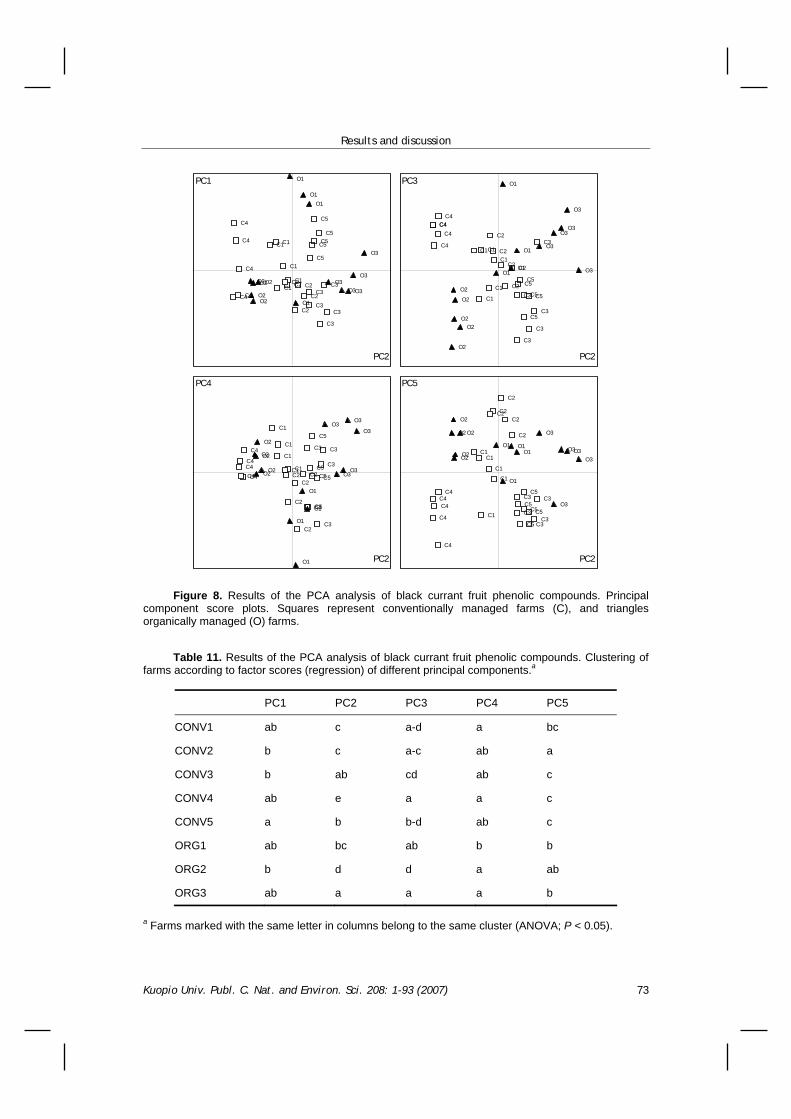
Results and discussion
C1
C1C1
C1
C1
C2C2
C2
C2
C3
C3
C3C3
C3O1
O1
O1O1
O2O2
O2O2O2
C4C4
C4
C4
C4
C5
C5C5C5
C5
O3
O3
O3
O3O3C2
PC2
PC1
C1C1
C1
C1
C1
C2
C2
C2C2
C3
C3
C3
C3
C3
O1
O1
O1
O1
O2
O2
O2O2
O2
C4C4
C4
C4C4
C5C5
C5C5
C5
O3
O3
O3
O3
O3
C2
PC2
PC3
C1
C1
C1
C1C1
C2
C2 C2C2
C3
C3C3
C3
C3
O1
O1
O1
O1
O2
O2
O2O2
O2
C4
C4C4
C4
C4
C5
C5C5C5
C5
O3
O3
O3
O3
O3
C2
PC2
PC4
C1
C1C1
C1
C1
C2C2
C2
C2
C3
C3C3
C3C3
O1
O1O1
O1O2
O2
O2
O2
O2
C4
C4
C4C4
C4
C5
C5
C5
C5C5O3
O3O3
O3
O3
C2
PC2
PC5
Figure 8. Results of the PCA analysis of black currant fruit phenolic compounds. Principal component score plots. Squares represent conventionally managed farms (C), and triangles organically managed (O) farms.
Table 11. Results of the PCA analysis of black currant fruit phenolic compounds. Clustering of farms according to factor scores (regression) of different principal components.a
PC1 PC2 PC3 PC4 PC5
CONV1 ab c a-d a bc
CONV2 b c a-c ab a
CONV3 b ab cd ab c
CONV4 ab e a a c
CONV5 a b b-d ab c
ORG1 ab bc ab b b
ORG2 b d d a ab
ORG3 ab a a a b
a Farms marked with the same letter in columns belong to the same cluster (ANOVA; P < 0.05).
Kuopio Univ. Publ. C. Nat. and Environ. Sci. 208: 1-93 (2007) 73

Mikko J. Anttonen: Evaluation of means to increase the content of bioactive phenolic compounds in soft fruits
One may argue that controlled cultivation tests are most reliable in testing the effect of production system (Magkos et al. 2003). However, even these studies have produced variable results. In yellow plums, higher total phenolic content was found in conventionally grown fruits than in the organically grown ones (Lombardi-Boccia et al. 2004). However, it was also found that individual phenolic acids and flavonols were not systematically higher in either type of fruits. In a similar study, organically grown peaches and pears had slightly higher total phenolic contents compared with the conventionally grown ones (Carbonaro et al. 2002). In vegetables, no differences were found in the contents of total phenolics, individual flavonoids or phenolic acids between organically and conventionally grown leaf lettuce (cultivars Kalura and Red Sails) or collards (Young et al. 2005). However, higher total phenolic content was measured in organically grown pac choi, which was associated with higher pest damages. Finally, Caris-Veyrat et al. (2004) found slightly higher amounts of phenolic compounds and antioxidants in organically grown fruits compared with conventionally grown ones. In addition, statistically significant interaction was found between production system and cultivar. Thus it seems that different species and individual compounds are differently affected by the production system.
Organic farming practises have the potential of producing higher levels of phenolic compounds in plants (Brand & Molgaard 2001). Increased disease pressure due to the lack of the use of pesticides is often suggested as a basis for higher polyphenol content in organically grown plants (Carbonaro et al. 2002, Young et al. 2005). The suggestion is based on the fact that phenylpropanoids act as defence compounds in plants (Maher et al. 1994). However, this is not applicable in all cases. First, the lack of use of pesticides does not directly mean higher disease pressure (Dimberg et al. 2005). Secondly, in some species phenolics are constitutively expressed in high amounts and no changes in the contents are observed during pathogen attack (Kortekamp 2006). However, it is possible that in some cases, due to pathogen pressure, the contents of defence compounds are higher in organically produced plants. The use of organic soil amendments in organic cultivation may enhance defence responses in plants (Vallad & Goodman 2004). It has been shown that compost as soil amendment can result in the activation of systemically acquired resistance (SAR) or induced systemic resistance (ISR). Systemic resistance primes plants to react more efficiently to stress and, due to this priming effect, phenolics can be produced more rapidly and in higher amounts (Conrath et al. 2002, Hoitink & Boehm 1999, Sarma et al. 2002,). This theory is further supported by a study done with strawberries, in which compost as
Kuopio Univ. Publ. C. Nat. and Environ. Sci. 208: 1-93 (2007) 74
Results and discussion
a soil supplement was found to increase the content of different phenolics (Wang & Lin 2003).
Fertilization is another factor that may explain the differences in the contents of phenolic compounds between organically and conventionally grown plants. In organic farming, nutrients are supplied through crop rotation, compost, manure, and plant-derived by-products. Organic nitrogen is transformed into inorganic form by soil microflora. Thus the nutrient availability to plants may be difficult to control and nitrogen can become a limiting nutrient. Consequently, as discussed above (see 8.3.1), lower nitrogen availability can lead to higher content of phenolic compounds (Norbaek et al. 2003).
Several approaches have been used to evaluate the effects of organic farming on crop quality factors (Magkos et al. 2003). One approach is a market study, in which samples are purchased from retail markets. However, in this strategy it is not possible to distinguish between the effects of production system and other factors. Controlled cultivation tests, on the other hand, can be considered as most reliable in the evaluation of the effects of production system, as the conditions other than those related to the production system can be kept similar. However, the major limitation of controlled cultivation tests is that the results can only be applied to certain environment, as the environment has a proven effect on the phenolic content. In farm studies, in which the samples are collected from separate farms, the environmental effect is included in the results and the results can be thus considered as having a better practical value. However, there is still one major problem concerning all approaches. Even though organic farming is defined by legislation, the definition is still quite arbitrary as is also the one for conventional farming. Both production systems have different elements such as soil type, farm topology, and climate which all can vary hugely and which also affect the phenolic content of plants. Thus evaluation of individual factors and interactions between them would lead to a better understanding of the effects of complex systems.
Kuopio Univ. Publ. C. Nat. and Environ. Sci. 208: 1-93 (2007) 75

Mikko J. Anttonen: Evaluation of means to increase the content of bioactive phenolic compounds in soft fruits
9 CONCLUSIONS
The phenolic content of fruits and vegetables can vary significantly due to various reasons. When the aim is to produce plants with a high content of phenolic compounds, the first step is to choose cultivars with a high content of these compounds. Furthermore, production conditions should be optimised for the high content of phenolic compounds. Finally, procedures after harvesting should aim at minimal degradation of phenolic compounds and at further enhancing the phenolic content. The purpose of the present study was to evaluate the potential of different cultivation practices to enhance the content of bioactive phenolic compounds in soft fruits (Table 12). Several factors were evaluated, including genotype (cultivar), environment, fertilization, mulch colour, early forcing, fruit order, planting date, shading, and production system (organic versus conventional).
Genotype is known to be a major factor affecting the phenolic content, which was also proven in the present study with red raspberries and strawberries. The presence of genetic component in determining the phenolic content makes it possible to further enhance this trait by breeding. However, the phenolic content is also strongly affected by the environment. Furthermore, other studies have shown that the effect of environment can even prevail over that of the genotype. Thus research is needed to find out how stable the phenolic profile of a certain genotype is in the changing environment.
Fertilization strongly influences plant metabolism, and it was found that higher fertilization led to a lower content of phenolics, as also supported by other studies. Mulch colour also affected the phenolic content. Compared with brown mulch, white mulch increased the content of total phenolics, which is probably connected with enhanced photosynthesis due to differences in the light and temperature conditions. Interestingly, it was also observed that white mulch decreased fruit yield, although the ascorbic acid and sugar contents were elevated.
The fruit order also had a significant effect on fruit phenolic content. As a general trend, the phenolic content increased from primary to tertiary fruits. Furthermore, later planting date augmented the difference, which might be due to higher amount of light. Possible explanations could be the metabolic priorities between the fruits or dilution effect due to increased biomass.
Organically produced food is often considered healthier than the corresponding conventional food. However, in the present study, it was shown that the production system is not the major determining factor of the phenolic contents of black currant fruits.
Kuopio Univ. Publ. C. Nat. and Environ. Sci. 208: 1-93 (2007) 76

Conclusions
Tabl
e 12
. Sum
mar
y of
the
vario
us m
eans
to in
crea
se th
e co
nten
t of b
ioac
tive
phen
olic
com
poun
ds in
sof
t fru
its.
Expe
rimen
tal v
aria
bles
and
frui
t spe
cies
An
alys
es
Mai
n re
sults
Gen
otyp
e R
aspb
erry
(I)
• 14
cul
tivar
s
Tota
l phe
nolic
s, e
llagi
c ac
id,
tota
l ant
hocy
anin
s an
d qu
erce
tin
S
traw
berr
y (II
) •
6 cu
ltiva
rs
Que
rcet
in a
nd k
aem
pfer
ol
Sig
nific
ant d
iffer
ence
s am
ong
culti
vars
in th
e co
nten
t of a
ll m
easu
red
com
poun
ds w
ere
obse
rved
.
Ras
pber
ry (I
) •
2 gr
owin
g se
ason
•
2 lo
catio
ns
Que
rcet
in
Stra
wbe
rry
(II)
• 4
loca
tions
Q
uerc
etin
and
kae
mpf
erol
Diff
eren
ces
in th
e co
nten
t of m
easu
red
com
poun
ds a
mon
g di
ffere
nt lo
catio
ns w
ere
obse
rved
. How
ever
, the
mag
nitu
de
of th
e di
ffere
nces
app
eare
d to
be
culti
var-
depe
nden
t.
Envi
ronm
ent
Blac
k cu
rran
t (IV
) •
8 lo
catio
ns
25 in
divi
dual
com
poun
ds
belo
ngin
g to
hyd
roxy
cinn
amic
ac
ids
and
flavo
noid
s
The
loca
tion
affe
cted
the
indi
vidu
al c
ompo
unds
diff
eren
tly.
Agric
ultu
ral
regi
mes
S
traw
berr
y (II
and
III)
• fe
rtiliz
atio
n •
plan
ting
date
•
shad
ing
• fru
it or
der
• ea
rly fo
rcin
g •
whi
te v
ersu
s br
own
mul
ch
Tota
l phe
nolic
s, q
uerc
etin
, ka
empf
erol
, ella
gic
acid
and
to
tal a
ntho
cyan
ins,
ant
ioxi
dant
ca
paci
ty, a
scor
bic
acid
, tot
al
solu
ble
solid
s, ti
trata
ble
acid
ity
and
fruit
yiel
ds
Hig
her f
ertil
izat
ion
decr
ease
d th
e co
nten
t of e
llagi
c ac
id,
quer
cetin
and
kea
mpf
erol
. To
tal p
heno
l and
ella
gic
acid
con
tent
s an
d an
tioxi
dant
ca
paci
ty in
crea
sed
from
prim
ary
to te
rtiar
y fru
its, a
nd la
ter
plan
ting
date
s au
gmen
ted
the
diffe
renc
e. S
olub
le s
olid
s an
d as
corb
ic a
cid
wer
e in
vers
ely
affe
cted
by
the
fruit
orde
r. Sl
ight
ly h
ighe
r tot
al p
heno
lic, e
llagi
c ac
id, a
scor
bic
acid
and
so
lubl
e so
lid c
onte
nt a
nd a
ntio
xida
nt c
apac
ity w
as o
bser
ved
in fr
uits
gro
wn
on w
hite
mul
ch, a
lthou
gh th
e fru
it yi
eld
was
sl
ight
ly lo
wer
. S
traw
berr
y (II
I) •
2 co
nven
tiona
l and
2
orga
nic
farm
s
Que
rcet
in a
nd k
aem
pfer
ol
Prod
uctio
n sy
stem
Blac
k cu
rran
t (IV
) •
5 co
nven
tiona
l and
3
orga
nic
farm
s
25 in
divi
dual
com
poun
ds
belo
ngin
g to
hyd
roxy
cinn
amic
ac
ids
and
flavo
noid
s
Prod
uctio
n sy
stem
was
not
the
maj
or fa
ctor
affe
ctin
g th
e ph
enol
ic c
onte
nt.
Kuopio Univ. Publ. C. Nat. and Environ. Sci. 208: 1-93 (2007) 77

Mikko J. Anttonen: Evaluation of means to increase the content of bioactive phenolic compounds in soft fruits
It can be concluded that there are several possible ways to enhance the content of phenolic compounds in crop plants. However, as different methods have different shortcomings, they should be thoroughly evaluated before their application in practice. Interactions between different factors make it though difficult to apply techniques in the field conditions, whereas in the more controlled greenhouse conditions techniques could be more easily introduced. It should also be emphasised that when inducing major changes to the metabolism of plants, the outcome should be carefully investigated, and risks related to these changes should be evaluated. Finally, results from different experiments demonstrated that individual phenolics can be differently affected by different factors. On the other hand, the synergistic effect of different phytochemicals on our health is presently not very well understood. When evaluating the effects of different factors on plants, analyses should thus cover individual compounds broadly. Obviously this kind of approach is laborious and requires sophisticated equipments. However, the results can be more useful when new information on the health effects emerges.
Kuopio Univ. Publ. C. Nat. and Environ. Sci. 208: 1-93 (2007) 78

Literature cited
10 LITERATURE CITED Agrios, G.N.A. (1997). Plant pathology, 4th edition, Academic Press: San Diego, CA, USA; 635 pp. Ames, B.N., M.K. Shigenaga & T.M. Hagen. (1993). Oxidants, antioxidants, and the degenerative
diseases of aging. Proceedings of the National Academy of Sciences of the United States of America 90, 7915-7922.
de Ancos, B., E.M. Gonzalez & M.P. Cano. (2000a). Ellagic acid, vitamin C, and total phenolic
contents and radical scavenging capacity affected by freezing and frozen storage in raspberry fruit. Journal of Agricultural and Food Chemistry 48, 4565-4570.
de Ancos, B., E. Ibanez, G. Reglero & M.P. Cano. (2000b). Frozen storage effects on anthocyanins
and volatile compounds of raspberry fruit. Journal of Agricultural and Food Chemistry 48, 873-879.
Antolovich, M., P. Prenzler, K. Robards & D. Ryan. (2000). Sample preparation in the determination
of phenolic compounds in fruits. Analyst 125, 989-1009. AOAC. (1998). Official methods of analysis of AOAC International, 16th ed., 4th revision; Cunniff, P.,
Ed.; AOAC international: Gaithersburg, MD, USA; Vol. 2. Arts, I.C.W. & P.C.H. Hollman. (2005). Polyphenols and disease risk in epidemiologic studies. The
American Journal of Clinical Nutrition 81, 317S-325S. Atkinson, C.J., R. Nestby, Y.Y. Ford & P.A.A. Dodds. (2005). Enhancing beneficial antioxidants in
fruits: a plant physiological perspective. BioFactors 23, 229-234. Atkinson, C.J., P.A.A. Dodds, Y.Y. Ford, J. Le Miere, J.M. Taylor, P.S. Blake & N. Paul (2006).
Effects of cultivar, fruit number and reflected photosynthetically active radiation on Fragaria x ananassa productivity and fruit ellagic acid and ascorbic acid concentrations. Annals of Botany 97, 429-441.
Aura, A.-M., K.A. O'Leary, G. Williamson, M. Ojala, M. Bailey, R. Puupponen-Pimiä, A.M. Nuutila, K.-
M. Oksman-Caldentey & K. Poutanen (2002). Quercetin derivatives are deconjugated and converted to hydroxyphenylacetic acids but not methylated by human fecal flora in vitro. Journal of Agricultural and Food Chemistry 50, 1725-1730.
Beekwilder, J., H. Jonker, P. Meesters, R.D. Hall, I.M. van der Meer & C.H.R. de Vos. (2005).
Antioxidants in raspberry: on-line analysis links antioxidant activity to a diversity of individual metabolites. Journal of Agricultural and Food Chemistry 53, 3313-3320.
Bennett, J.O., O. Yu, L.G. Heatherly & H.B. Krishnan. (2004). Accumulation of genistein and
daidzein, soybean isoflavones implicated in promoting human health, is significantly elevated by irrigation. Journal of Agricultural and Food Chemistry 52, 7574-7579.
Blois, M.S. (1958). Antioxidant determinations by the use of a stable free radical. Nature 181, 1199-
1200. Boyle, S.P., V.L. Dobson, S.J. Duthie, J.A.M. Kyle & A.R. Collins. (2000). Absorption and DNA
protective effects of flavonoid glycosides from onion meal. European Journal of Nutrition 39, 213-223.
Bosetti, C., L. Spertini, M. Parpinel, P. Gnagnarella, P. Lagiou, E. Negri, S. Franceschi, M. Montella,
J. Peterson, J. Dwyer, A. Giacosa & C. La Vecchia. (2005). Flavonoids and breast cancer risk in Italy. Cancer Epidemiology, Biomarkers & Prevention 14, 805-808.
Brandt, K. & J.P. Molgaard. (2001). Organic agriculture: does it enhance or reduce the nutritional
value of plant foods? Journal of the Science of Food and Agriculture 81, 924-931.
Kuopio Univ. Publ. C. Nat. and Environ. Sci. 208: 1-93 (2007) 79

Mikko J. Anttonen: Evaluation of means to increase the content of bioactive phenolic compounds in soft fruits
Brand-Williams, W., M.E. Cuvelier & C. Berset. (1995). Use of a free radical method to evaluate
antioxidant activity. European Food Research and Technology 28, 25-30. Bryant, J.P., S.C. Chapin III & D.R. Klein (1983). Carbon/nutrient balance of boreal plants in
relation to vertebrate herboviory. Oikos 40, 357-368. Cao, G., R.M. Russell, N. Lischner & R.L. Prior. (1998). Serum antioxidant capacity is increased by
consumption of strawberries, spinach, red wine, or vitamin C in elderly women. The Journal of Nutrition 128, 2383-2390.
Carbonaro, M., M. Mattera, S. Nicoli, P. Bergamo & M. Cappelloni. (2002). Modulation of antioxidant
compounds in organic vs conventional fruit (peach, Prunus persica L., and pear, Pyrus communis L.). Journal of Agricultural and Food Chemistry 50, 5458-5462.
Caris-Veyrat, C., M. Amiot, V. Tyssandier, D. Grasselly, M. Buret, M. Mikolajczak, J.-C. Guilland, C.
Bouteloup-Demange & P. Borel (2004). Influence of organic versus conventional agricultural practice on the antioxidant microconstituent content of tomatoes and derived purees; consequences on antioxidant plasma status in humans. Journal of Agricultural and Food Chemistry 52, 6503-6509.
Chassy, A.W., L. Bui, E.N. Renaud, M. Van Horn & A.E. Mitchell. (2006). Three-year comparison of
the content of antioxidant microconstituents and several quality characteristics in organic and conventionally managed tomatoes and bell peppers. Journal of Agricultural and Food Chemistry 54, 8244-8252.
Chen, H., Y. Zuo & Y. Deng. (2001). Separation and determination of flavonoids and other phenolic
compounds in cranberry juice by high-performance liquid chromatography. Journal of Chromatography A 913, 387-395.
Cheng, G.W. & P.J. Breen. (1991). Activity of phenylalanine ammonia-lyase (PAL) and
concentrations of anthocyanins and phenolics in developing strawberry fruit. The Journal of American Society for Horticultural Science 116, 865-869.
Chinnici, F., A. Gaiani, N. Natali, C. Riponi & S. Galassi. (2004). Improved HPLC determination of
phenolic compounds in cv. golden delicious apples using a monolithic column. Journal of Agricultural and Food Chemistry 52, 3-7.
Clifford, M.N., K.L. Johnston, S. Knight & N. Kuhnert. (2003). Hierarchical scheme for LC-MSn
identification of chlorogenic acids. Journal of Agricultural and Food Chemistry 51, 2900-2911. Close, D.C., C. McArthur, A.E. Hagerman & H. Fitzgerald. (2005). Differential distribution of leaf
chemistry in eucalypt seedlings due to variation in whole-plant nutrient availability. Phytochemistry 66, 215-221.
Connor, A.M., J.J. Luby & C.B.S. Tong. (2002). Variation and heritability estimates for antioxidant
activity, total phenolic content, and anthocyanin content in blueberry progenies. Journal of the American Society for Horticultural Science 127, 82-88.
Connor, A.M., T.K. McGhie, M.J. Stephens, H.K. Hall & P.A. Alspach. (2005). Variation and
heritability estimates of anthocyanins and their relationship to antioxidant activity in a red raspberry factorial mating design. Journal of the American Society for Horticultural Science 130, 534-542.
Conrath, U., C.M.J. Pieterse & B. Mauch-Mani. (2002). Priming in plant-pathogen interactions.
Trends in Plant Science 7, 210-216. Cornwell, T., W. Cohick & I. Raskin. (2004). Dietary phytoestrogens and health. Phytochemistry 65,
995-1016.
Kuopio Univ. Publ. C. Nat. and Environ. Sci. 208: 1-93 (2007) 80

Literature cited
Cortell, J.M. & J.A. Kennedy. (2006). Effect of shading on accumulation of flavonoid compounds in (Vitis vinifera L.) pinot noir fruit and extraction in a model system. Journal of Agricultural and Food Chemistry 54, 8510-8520.
Cowan, M.M. (1999). Plant products as antimicrobial agents. Clinical Microbiology Reviews 12, 564-
582. Dat, J., S. Vandenabeele, E. Vranova, M. Van Montagu, D. Inze & F. Van Breusegem. (2000). Dual
action of the active oxygen species during plant stress responses. Cellular and Molecular Life Sciences 57, 779-795.
Dauchet, L., P. Amouyel, S. Hercberg & J. Dallongeville. (2006). Fruits and vegetables consumption
and risk of coronary heart disease: A meta-analysis of cohort studies. The Journal of Nutrition 136, 2588-2593.
Davey, M.W., M. Van Montagu, D. Inze, M. Sanmartin, A. Kanellis, N. Smirnoff, I.J.J. Benzie, J.J.
Strain, D. Favell & J. Fletcher (2000). Plant L-ascorbic acid: Chemistry, function, metabolism, bioavailability and effects of processing. Journal of the Science of Food and Agriculture 80, 825-860.
Delgado, R., P. Martin, M. Del Alamo & M.R. Gonzalez. (2004). Changes in the phenolic composition
of grape berries during ripening in relation to vineyard nitrogen and potassium fertilisation rates. Journal of the Science of Food and Agriculture 84, 623-630.
Deng, X. & F.I. Woodward. (1998). The growth and yield responses of Fragaria ananassa to elevated
CO2 and N supply. Annals of Botany 81, 67-71. Dimberg, L.H., C. Gissen & J. Nilsson. (2005). Phenolic compounds in oat grains (Avena sativa L.)
grown in conventional and organic systems. Ambio 34, 331-337. Dixon, R.A. & N.L. Paiva. (1995). Stress-induced phenylpropanoid metabolism. Plant Cell 7, 1085-
1097. Dixon, R.A. (2005). Engineering of plant natural product pathways. Current Opinion in Plant Biology
8, 329-336. Duthie, S.J., P.T. Gardner, P.C. Morrice, S.G. Wood, L. Pirie, C.C. Bestwick, L. Milnie & G.G.
Duthie. (2005). DNA stability and lipid peroxidation in vitamin E-deficient rats in vivo and colon cells in vitro. European Journal of Nutrition 44, 195-203.
Edreva, A. (2005). The importance of non-photosynthetic pigments and cinnamic acid derivatives in
photoprotection. Agriculture, Ecosystems & Environment 106, 135-146. EEC. (1991). European Union Council Regulation No. 2092/91; http://europa.eu.int/eur-
lex/en/index.html Ehala, S., M. Vaher & M. Kaljurand. (2005). Characterization of phenolic profiles of Northern
European berries by capillary electrophoresis and determination of their antioxidant activity. Journal of Agricultural and Food Chemistry 53, 6484-6490.
Ehlenfeldt, M.K. & R.L. Prior. (2001). Oxygen radical absorbance capacity (ORAC) and phenolic and
anthocyanin concentrations in fruit and leaf tissues of highbush blueberry. Journal of Agricultural and Food Chemistry 49, 2222-2227.
European opinion reserch group EEIG. (2003). Health, food and alcohol and safety. Special
eurobarometer 186 / Wave 59.0. European Comission. Friedman, M. & H.S. Jürgens. (2000). Effect of pH on the stability of plant phenolic compounds.
Journal of Agricultural and Food Chemistry 48, 2101-2110.
Kuopio Univ. Publ. C. Nat. and Environ. Sci. 208: 1-93 (2007) 81

Mikko J. Anttonen: Evaluation of means to increase the content of bioactive phenolic compounds in soft fruits
Fritz, C., N. Palacios-Rojas, R. Feil & M. Stitt. (2006). Regulation of secondary metabolism by the carbon-nitrogen status in tobacco: Nitrate inhibits large sectors of phenylpropanoid metabolism. Plant Journal 46, 533-548.
Fuleki, T. & F.J. Francis. (1968). Quantitative methods for anthocyanins. 2. Determination of total
anthocyanin and degradation index for cranberry juice. Journal of Food Science 33, 78-83. Galati, G. & P.J. O'Brien. (2004). Potential toxicity of flavonoids and other dietary phenolics:
Significance for their chemopreventive and anticancer properties. Free Radical Biology and Medicine 37, 287-303.
Gao, Z., H. Xu, X. Chen & H. Chen. (2003). Antioxidant status and mineral contents in tissues of
rutin and baicalin fed rats. Life Sciences 73, 1599-1607. Gaskell, G., A. Allansdottir, N. Allum, C. Corchero, C. Fischler, J. Hampel, J. Jackson, N.
Kronberger, N. Mejlgaard, G. Revuelta, C. Schreiner, S. Stares, H. Torgersen & W. Wagner. (2006). Europeans and biotechnology in 2005: patterns and trends. Eurobarometer 64.3. European Comission.
George, S., P. Brat, P. Alter & M.J. Amiot. (2005). Rapid determination of polyphenols and vitamin
C in plant-derived products. Journal of Agricultural and Food Chemistry 53, 1370-1373. Giovannelli, L., G. Testa, C. De Filippo, V. Cheynier, M.N. Clifford & P. Dolora. (2000). Effect of
complex polyphenols and tannins from red wine on DNA oxidative damage of rat colon mucosa in vivo. European Journal of Nutrition 39, 207-212.
Ghosh, D., T.K. McGhie, J. Zhang, A. Adaim & M. Skinner. (2006). Effects of anthocyanins and other
phenolics of boysenberry and blackcurrant as inhibitors of oxidative stress and damage to cellular DNA in SH-SY5Y and HL-60 cells. Journal of The Science of Food and Agriculture 86, 678-686.
Gu, L., M.A. Kelm, J.F. Hammerstone, G. Beecher, J. Holden, D. Haytowitz, S. Gebhardt & R.L.
Prior. (2004). Concentrations of proanthocyanidins in common foods and estimations of normal consumption. The Journal of Nutrition 134, 613-617.
Hahlbrock, K. & D. Scheel. (1989). Physiology and molecular biology of phenylpropanoid
metabolism. Annual Review of Plant Physiology and Plant Molecular Biology, 347-369. Hajslová, J., V. Schulzová, P. Slanina, K. Janné, K.E. Hellenäs & C. Andersson. (2005). Quality of
organically and conventionally grown potatoes: Four-year study of micronutrients, metals, secondary metabolites, enzymic browning and organoleptic properties. Food Additives and Contaminants 22, 514-534.
Häkkinen, S. & S. Auriola. (1998). High-performance liquid chromatography with electrospray
ionization mass spectrometry and diode array ultraviolet detection in the identification of flavonol aglycones and glycosides in berries. Journal of Chromatography A 829, 91-100.
Häkkinen, S.H., S.O. Kärenlampi, I.M. Heinonen, H.M. Mykkänen & A.R. Törrönen. (1999). Content
of the flavonols quercetin, myricetin, and kaempferol in 25 edible berries. Journal of Agricultural and Food Chemistry 47, 2274-2279.
Häkkinen, S.H., S.O. Kärenlampi, H.M. Mykkänen, I.M. Heinonen & A.R. Törrönen. (2000). Ellagic
acid content in berries: Influence of domestic processing and storage. European Food Research and Technology 212, 75-80.
Halbwirth, H., I. Puhl, U. Haas, K. Jezik, D. Treutter & K. Stich. (2006). Two-phase flavonoid
formation in developing strawberry (Fragaria × ananassa) fruit. Journal of Agricultural and Food Chemistry 54, 1479-1485.
Kuopio Univ. Publ. C. Nat. and Environ. Sci. 208: 1-93 (2007) 82
Literature cited
Halliwell, B. (1994). Free radicals, antioxidants, and human disease: Curiosity, cause, or consequence? The Lancet 344, 721-724.
Halliwell, B., J. Rafter & A. Jenner. (2005) Health promotion by flavonoids, tocopherols,
tocotrienols, and other phenols: Direct or indirect effects? Antioxidant or not? The Americal Journal of Clinical Nutrition 81, 268S-276S.
Halvorsen, B.L., K. Holte, M.C.W. Myhrstad, I. Barikmo, E. Hvattum, S.F. Remberg, A.-B. Wold, K.
Haffner, H. Baugerød, L.F. Andersen, Ø. Moskaug, D.R. Jacobs Jr. & R. Blomhoff. (2002). A systematic screening of total antioxidants in dietary plants. The Journal of Nutrition 132, 461-471.
Harborne, J.B. (1999). Recent advances in chemical ecology. Natural Product Reports 16, 509-523. Hartzfeld, P.W., R. Forkner, M.D. Hunter & A.E. Hagerman. (2002). Determination of hydrolyzable
tannins (gallotannins and ellagitannins) after reaction with potassium iodate. Journal of Agricultural and Food Chemistry 50, 1785-1790.
Heo, H.J. & C.Y. Lee. (2005). Strawberry and its anthocyanins reduce oxidative stress-induced
apoptosis in PC12 cells. Journal of Agricultural and Food Chemistry 53, 1984-1989. Herms, D.A. & W.J. Mattson. (1992). The dilemma of plants: To grow or defend. Quarterly Review
of Biology 67, 283-335. Hertog, M.G.L., P.C.H. Hollman & D.P. Venema. (1992). Optimization of a quantitative HPLC
determination of potentially anticarcinogenic flavonoids in vegetables and fruits. Journal of Agricultural and Food Chemistry 40, 1591-1598.
Hirota, S., T. Shimoda & U. Takahama. (1998). Tissue and spatial distribution of flavonol and
peroxidase in onion bulbs and stability of flavonol glucosides during boiling of the scales. Journal of Agricultural and Food Chemistry 46, 3497-3502.
Hoitink, H.A.J. & M.J. Boehm. (1999). Biocontrol within the context of soil microbial communities:
A substrate-dependent phenomenon. Annual Review of Phytopathology 37, 427-446. Hoppula, K.B. & S.T. Karhu. (2006). Strawberry fruit quality responses to the production
environment. Journal of Food, Agriculture and Environment 4, 166-170. Howard, L.R., N. Pandjaitan, T. Morelock & M.I. Gil. (2002). Antioxidant capacity and phenolic
content of spinach as affected by genetics and growing season. Journal of Agricultural and Food Chemistry 50, 5891-5896.
Howard, L.R., J.R. Clark & C. Brownmiller. (2003). Antioxidant capacity and phenolic content in
blueberries as affected by genotype and growing season. Journal of the Science of Food and Agriculture 83, 1238-1247.
Huang, D., B. Ou & R.L. Prior. (2005). The chemistry behind antioxidant capacity assays. Journal of
Agricultural and Food Chemistry 53, 1841-1856. Iason, G.R. & J.J. Villalba. (2006). Behavioral strategies of mammal herbivores against plant
secondary metabolites: the avoidance-tolerance continuum. Journal of Chemical Ecology 32, 1115-1132.
Iriti, M., M. Rossoni, M. Borgo, L. Ferrara & F. Faoro. (2005). Induction of resistance to gray mold
with benzothiadiazole modifies amino acid profile and increases proanthocyanidins in grape: Primary versus secondary metabolism. Journal of Agricultural and Food Chemistry 53, 9133-9139.
Kuopio Univ. Publ. C. Nat. and Environ. Sci. 208: 1-93 (2007) 83

Mikko J. Anttonen: Evaluation of means to increase the content of bioactive phenolic compounds in soft fruits
Issa, A.Y., S.R. Volate & M.J. Wargovich. (2006). The role of phytochemicals in inhibition of cancer and inflammation: New directions and perspectives. Journal of Food Composition and Analysis 19, 405-419.
Jeyaramraja, P.R., P.K. Pius, R. Raj Kumar & D. Jayakumar. (2003). Soil moisture stress-induced
alterations in bioconstituents determining tea quality. Journal of the Science of Food and Agriculture 83, 1187-1191.
Julkunen-Tiitto, R. (1985). Phenolic constituents in the leaves of northern willows: Methods for the
analysis of certain phenolics. Journal of Agricultural and Food Chemistry 33, 213-217. Kader, F., B. Rovel, M. Girardin & M. Metche. (1996). Fractionation and identification of the
phenolic compounds of highbush blueberries (Vaccinium corymbosum, L.). Food Chemistry 55, 35-40.
Kähkönen, M.P., A.I. Hopia, H.J. Vuorela, J.P. Rauha, K. Pihlaja, T.S. Kujala & M. Heinonen. (1999).
Antioxidant activity of plant extracts containing phenolic compounds. Journal of Agricultural and Food Chemistry 47, 3954-3962.
Kähkönen, M.P., A.I. Hopia & M. Heinonen. (2001). Berry phenolics and their antioxidant activity.
Journal of Agricultural and Food Chemistry 49, 4076-4082. Kalt, W., C.F. Forney, A. Martin & R.L. Prior. (1999). Antioxidant capacity, vitamin C, phenolics,
and anthocyanins after fresh storage of small fruits. Journal of Agricultural and Food Chemistry 47, 4638-4644.
Keinänen, M. & R. Julkunen-Tiitto R. (1996). Effects of sample preparation method on birch (Betula
pendula Roth) leaf phenolics. Journal of Agricultural and Food Chemistry 44, 2724-2727. Keinänen, M. & R. Julkunen-Tiitto R. (1998). High-performance liquid chromatographic
determination of flavonoids in Betula pendula and Betula pubescens leaves. Journal of Chromatography A 793, 370-377.
Keinänen, M., R. Julkunen-Tiitto, M. Rousi & J. Tahvanainen. (1999a). Taxonomic implications of
phenolic variation in leaves of birch (Betula L.) species. Biochemical Systematics and Ecology 27, 243-254.
Keinänen, M., R. Julkunen-Tiitto, P. Mutikainen, M. Walls, J. Ovaska & E. Vapaavuori. (1999b).
Trade-offs in phenolic metabolism of silver birch: Effects of fertilization, defoliation, and genotype. Ecology 80, 1970-1986.
Kervinen, T., S. Peltonen, T.H. Teeri & R. Karjalainen. (1998). Differential expression of
phenylalanine ammonia-lyase genes in barley induced by fungal infection or elicitors. New Phytologist 139, 293-300.
Knekt, P., J. Kumpulainen, R. Järvinen, H. Rissanen, M. Heliövaara, A. Reunanen, T. Hakulinen & A.
Aromaa. (2002). Flavonoid intake and risk of chronic diseases. American Journal of Clinical Nutrition 76, 560-568.
Knox, Y.M., T. Suzutani, I. Yosida & M. Azuma. (2003). Anti-influenza virus activity of crude extract
of Ribes nigrum L. Phytotherapy Research 17, 120-122. Koeppen, B.H. & K. Herrmann. (1977). Flavonoid glycosides and hydroxycinnamic acid esters of
blackcurrants (Ribes nigrum). European Food Research and Technololy 164, 263-268. Koricheva, J. (1999). Interpreting phenotypic variation in plant allelochemistry: Problems with the
use of concentrations. Oecologia 119, 467-473. Koricheva, J. (2002). The carbon-nutrient balance hypothesis is dead; long live the carbon-nutrient
balance hypothesis? Oikos 98, 537-539.
Kuopio Univ. Publ. C. Nat. and Environ. Sci. 208: 1-93 (2007) 84
Literature cited
Kortekamp, A. (2006). Expression analysis of defence-related genes in grapevine leaves after
inoculation with a host and a non-host pathogen. Plant Physiology and Biochemistry 44, 58-67. Koundouras, S., V. Marinos, A. Gkoulioti, Y. Kotseridis & C. van Leeuwen. (2006). Influence of
vineyard location and vine water status on fruit maturation of nonirrigated cv. Agiorgitiko (Vitis vinifera L.). Effects on wine phenolic and aroma components. Journal of Agricultural and Food Chemistry 54, 5077-5086.
Kumar, A. & B.E. Ellis. (2001). The phenylalanine ammonia-lyase gene family in raspberry.
Structure, expression, and evolution. Plant Physiology 127, 230-239. Lagouge, M., C. Argmann, Z. Gerhart-Hines, H. Meziane, C. Lerin, F. Daussin, N. Messadeq, J.
Millne, P. Lambert, P. Elliott, B. Geny, M. Laakso, P. Puigserver & J. Auwerx. (2006). Resveratrol improves mitochondrial function and protects against metabolic disease by activating SIRT1 and PGC-1a. Cell 127, 1109-1122.
Lapidot, T., S. Harel, B. Akiri, R. Granit & J. Kanner. (1999). pH-dependent forms of red wine
anthocyanins as antioxidants. Journal of Agricultural and Food Chemistry 47, 67-70. Lata, B., M. Przeradzka & M. Binkowska. (2005). Great differences in antioxidant properties exist
between 56 apple cultivars and vegetation seasons. Journal of Agricultural and Food Chemistry 53, 8970-8978.
Lavola, A. & R. Julkunen-Tiitto. (1994). The effect of elevated carbon dioxide and fertilization on
primary and secondary metabolites in birch, Betula pendula (Roth). Oecologia 99, 315-321. LePree, J. (2003). FOD023B Functional foods and beverages. BCC Reserch. Li, J., T.M. Ou-Lee, R. Raba, R.G. Amundson & R.L. Last. (1993). Arabidopsis flavonoid mutants are
hypersensitive to UV-B irradiation. Plant Cell 5, 171-179. Libby, P., P.M. Ridker & A. Maseri. (2002). Inflammation and atherosclerosis. Circulation 105, 1135-
1143. Liu, M., X.Q. Li, C. Weber, C.Y. Lee, J. Brown & R.H. Liu. (2002). Antioxidant and antiproliferative
activities of raspberries. Journal of Agricultural and Food Chemistry 50, 2926-2930. Liu, S., Y. Hu, X. Wang, J. Zhong & Z. Lin. (2006). High content of resveratrol in lettuce
transformed with a stilbene synthase gene of Parthenocissus henryana. Journal of Agricultural and Food Chemistry 54, 8082-8085.
Logemann, E., M. Parniske & K. Hahlbrock. (1995). Modes of expression and common structural
features of the complete phenylalanine ammonia-lyase gene family in parsley. Proceedings of the National Academy of Sciences of the United States of America 92, 5905-5909.
Logemann, E., A. Tavernaro, W. Schulz, I.E. Somssich & K. Hahlbrock. (2000). UV light selectively
coinduces supply pathways from primary metabolism and flavonoid secondary product formation in parsley. Proceedings of the National Academy of Sciences of the United States of America 97, 1903-1907.
Lombardi-Boccia, G., M. Lucarini, S. Lanzi, A. Aguzzi & M. Cappelloni. (2004). Nutrients and
antioxidant molecules in yellow plums (Prunus domestica L.) from conventional and organic productions: A comparative study. Journal of Agricultural and Food Chemistry 52, 90-94.
Loughrin, J.H. & M.J. Kasperbauer. (2001). Light reflected from colored mulches affects aroma and
phenol content of sweet basil (Ocimum basilicum L.) leaves. Journal of Agricultural and Food Chemistry 49, 1331-1335.
Kuopio Univ. Publ. C. Nat. and Environ. Sci. 208: 1-93 (2007) 85
Mikko J. Anttonen: Evaluation of means to increase the content of bioactive phenolic compounds in soft fruits
Loughrin, J.H. & M.J. Kasperbauer. (2002). Aroma of fresh strawberries is enhanced by ripening over red versus black mulch. Journal of Agricultural and Food Chemistry 50, 161-165.
Lu, Y. & L.-Y. Foo. (2003). Polyphenolic constituents of blackcurrant seed residue. Food Chemistry
80, 71-76. Lukaszewicz, M., I. Matysiak-Kata, J. Skala, I. Fecka, W. Cisowski & J. Szopa. (2004). Antioxidant
capacity manipulation in transgenic potato tuber by changes in phenolic compounds content. Journal of Agricultural and Food Chemistry 52, 1526-1533.
Luthria, D.L., S. Mukhopadhyay & D.T. Krizek. (2006). Content of total phenolic acids in tomato
(Lycopersicon esculentum Mill.) fruits as influenced by cultivar and solar UV radiation. Journal of Food Composition and Analysis 19, 771-777.
Määttä, K., A. Kamal-Eldin & R. Törrönen. (2001). Phenolic compounds in berries of black, red,
green, and white currants (Ribes sp.). Antioxidants & Redox Signaling 3, 981-993. Määttä, K.R., A. Kamal-Eldin & A.R. Törrönen. (2003). High-performance liquid chromatography
(HPLC) analysis of phenolic compounds in berries with diode array and electrospray ionization mass spectrometric (MS) detection: Ribes species. Journal of Agricultural and Food Chemistry 51, 6736-6744.
Määttä-Riihinen, K.R., A. Kamal-Eldin & A.R. Törrönen. (2004a). Identification and quantification of
phenolic compounds in berries of Fragaria and Rubus species (family Rosaceae). Journal of Agricultural and Food Chemistry 52, 6178-6187.
Määttä-Riihinen, K.R., A. Kamal-Eldin, P.H. Mattila, A.M. González-Paramás & A.R. Törrönen.
(2004b). Distribution and contents of phenolic compounds in eighteen Scandinavian berry species. Journal of Agricultural and Food Chemistry 52, 4477-4486.
Macheix, J.-J., A. Fleuriet & J. Billot. (1990). Fruit phenolics, CRC Press: Boca Raton, FL, USA; 378
pp. Magkos, F., F. Arvaniti & A. Zampelas. (2003). Organic food: Nutritious food or food for thought? A
review of the evidence. International Journal of Food Sciences and Nutrition 54, 357-371. Maher, E.A., N.J. Bate, W. Ni, Y. Elkind, R.A. Dixon & C.J. Lamb. (1994). Increased disease
susceptibility of transgenic tobacco plants with suppressed levels of preformed phenylpropanoid products. Proceedings of the National Academy of Sciences of the United States of America 91, 7802-7806.
Mamati, G.E., Y. Liang & J. Lu. (2006). Expression of basic genes involved in tea polyphenol
synthesis in relation to accumulation of catechins and total tea polyphenols. Journal of the Science of Food and Agriculture 86, 459-464.
Manach, C., A. Scalbert, C. Morand, C. Rémésy & L. Jiménez. (2004). Polyphenols: Food sources and
bioavailability. The American Journal of Clinical Nutrition 79, 727-747. Manach, C., G. Williamson, C. Morand, A. Scalbert & C. Rémésy. (2005). Bioavailability and
bioefficacy of polyphenols in humans. I. Review of 97 bioavailability studies. The American Journal of Clinical Nutrition 81, 230S-242S.
Marniemi, J., P. Hakala, J. Mäki & M. Ahotupa. (2000). Partial resistance of low density lipoprotein
to oxidation in vivo after increased intake of berries. Nutrition, Metabolism and Cardiovascular Diseases 10, 331-337.
Mattila, P., J. Astola & J. Kumpulainen. (2000). Determination of flavonoids in plant material by
HPLC with diode-array and electro-array detections. Journal of Agricultural and Food Chemistry 48, 5834-5841.
Kuopio Univ. Publ. C. Nat. and Environ. Sci. 208: 1-93 (2007) 86

Literature cited
Mattila, P. & J. Kumpulainen. (2002). Determination of free and total phenolic acids in plant-derived foods by HPLC with diode-array detection. Journal of Agricultural and Food Chemistry 50, 3660-3667.
Markham, K.R. (1982). Techniques of flavonoid identification. Academic Press: London, England;
114 pp. McDougall, G.J. & D. Stewart. (2005). The inhibitory effects of berry polyphenols on digestive
enzymes. BioFactors 23, 189-195. McWilliams, A. (2003). FOD013B Evolving nutraceuticals. BCC Reserach. Mennen, L.I., R. Walker, C. Bennetau-Pelissero & A. Scalbert. (2005). Risks and safety of polyphenol
consumption. The American Journal of Clinical Nutrition 81, 326S-329S. Menrad, K. (2003). Market and marketing of functional food in Europe. Journal of Food Engineering
56, 181-188. Merken, H.M. & G.R. Beecher. (2000). Measurement of food flavonoids by high-performance liquid
chromatography: A review. Journal of Agricultural and Food Chemistry 48, 577-599. Meyers, K.J., C.B. Watkins, M.P. Pritts & R.H. Liu. (2003). Antioxidant and antiproliferative
activities of strawberries. Journal of Agricultural and Food Chemistry 51, 6887-6892. Mikkonen, T.P., K.R. Määttä, A.T. Hukkanen, H.I. Kokko, A.R. Törrönen, S.O. Kärenlampi & R.O.
Karjalainen (2001). Flavonol content varies among black currant cultivars. Journal of Agricultural and Food Chemistry 49, 3274-3277.
Molnár-Perl, I. & Z. Füzfai. (2005). Chromatographic, capillary electrophoretic and capillary
electrochromatographic techniques in the analysis of flavonoids. Journal of Chromatography A 1073, 201-227.
Moor, U., K. Karp, P. Põldma & A. Pae. (2005). Cultural systems affect content of anhocyanins and
vitamin C in strawberry fruits. European Journal of Horticultural Science 70, 195-201. Moore, J.P., K.L. Westall, N. Ravenscroft, J.M. Farrant, G.G. Lindsey & W.F. Brandt. (2005). The
predominant polyphenol in the leaves of the resurrection plant Myrothamnus flabellifolius, 3,4,5 tri-O-galloylquinic acid, protects membranes against desiccation and free radical-induced oxidation. Biochemical Journal 385, 301-308.
Moore, J., J. Liu, K. Zhou & L.L. Yu. (2006). Effects of genotype and environment on the antioxidant
properties of hard winter wheat bran. Journal of Agricultural and Food Chemistry 54, 5313-5322.
Moyer, R.A., K.E. Hummer, C.E. Finn, B. Frei & R.E. Wrolstad. (2002). Anthocyanins, phenolics, and
antioxidant capacity in diverse small fruits: Vaccinium, Rubus, and Ribes. Journal of Agricultural and Food Chemistry 50, 519-525.
Mpofu, A., H.D. Sapirstein & T. Beta. (2006). Genotype and environmental variation in phenolic
content, phenolic acid composition, and antioxidant activity of hard spring wheat. Journal of Agricultural and Food Chemistry 54, 1265-1270.
Mueller-Harvey, I. (2001). Analysis of hydrolysable tannins. Animal Feed Science and Technology 91,
3-20. Muir, S.R., G.J. Collins, S. Robinson, S. Hughes, A. Bovy, C.H.R. De Vos, A.J. van Tunen & M.E.
Verhoeyen. (2001). Overexpression of petunia chalcone isomerase in tomato results in fruit containing increased levels of flavonols. Nature Biotechnology 19, 470-474.
Kuopio Univ. Publ. C. Nat. and Environ. Sci. 208: 1-93 (2007) 87
Mikko J. Anttonen: Evaluation of means to increase the content of bioactive phenolic compounds in soft fruits
Mullen, W., A.J. Stewart, M.E.J. Lean, P. Gardner, G.G. Duthie & A. Crozier. (2002). Effect of freezing and storage on the phenolics, ellagitannins, flavonoids, and antioxidant capacity of red raspberries. Journal of Agricultural and Food Chemistry 50, 5197-5201.
Mylnikov, S.V., H.I. Kokko, S.O. Kärenlampi, T.I. Oparina, H.V. Davies & D. Stewart. (2005). Rubus
fruit juices affect lipid peroxidation in a Drosophila melanogaster model in vivo. Journal of Agricultural and Food Chemistry 53, 7728 - 7733.
Naczk, M. & F. Shahidi. (2004). Extraction and analysis of phenolics in food. Journal of
Chromatography A 1054, 95-111. Ness, A.R. & J.W. Powles. (1997). Fruit and vegetables, and cardiovascular disease: A review.
International Journal of Epidemiology 26, 1-13. Nicholson, R.L. & R. Hammerschmidt. (1992). Phenolic compounds and their role in disease
resistance. Annual Review of Phytopathology, 369-389. Nielsen, I.L.F., G.R. Haren, E.L. Magnussen, L.O. Dragsted & S.E. Rasmussen. (2003). Quantification
of anthocyanins in commercial black currant juices by simple high-performance liquid chromatography. Investigation of their pH stability and antioxidative potency. Journal of Agricultural and Food Chemistry 51, 5861-5866.
Niemetz, R. & G.G. Gross. (2005). Enzymology of gallotannin and ellagitannin biosynthesis.
Phytochemistry 66, 2001-2011. Niggeweg, R., A.J. Michael & C. Martin. (2004). Engineering plants with increased levels of the
antioxidant chlorogenic acid. Nature Biotechnology 22, 746-754. Nijveldt, R.J., E. van Nood, D.E.C van Hoorn, P.G. Boelens, K. van Norren & P.A.M. van Leeuwen.
(2001) Flavonoids: A review of probable mechanisms of action and potential applications. The Americal Journal of Clinical Nutrition 74, 418-425.
Norbaek, R., D.B. Aaboer, I.S. Bleeg, B.T. Christensen, T. Kondo & K. Brandt. (2003). Flavone C-
glycoside, phenolic acid, and nitrogen contents in leaves of barley subject to organic fertilization treatments. Journal of Agricultural and Food Chemistry 51, 809-813.
Nyman, N.A. & J.T. Kumpulainen. (2001). Determination of anthocyanidins in berries and red wine
by high-performance liquid chromatography. Journal of Agricultural and Food Chemistry 49, 4183-4187.
Okuda, T., T. Yoshida, T. Hatano, M. Iwasaki, M. Kubo, T. Orime, M. Yoshizaki & N. Naruhashi.
(1992). Hydrolysable tannins as chemotaxonomic markers in the Rosaceae. Phytochemistry 31, 3091-3096.
Olsson, M.E., K.-E. Gustavsson, S. Andersson, Å. Nilssom & R.-D. Duan. (2004a). Inhibition of cancer
cell proliferation in vitro by fruit and berry extracts and correlations with antioxidant levels. Journal of Agricultural and Food Chemistry 52, 7264-7271.
Olsson, M.E., J. Ekvall, K. Gustavsson, J. Nilsson, D. Pillai, I. Sjöholm, U. Svensson, B. Åkesson &
M.G.L. Nyman. (2004b). Antioxidants, low molecular weight carbohydrates, and total antioxidant capacity in strawberries (Fragaria x ananassa): Effects of cultivar, ripening, and storage. Journal of Agricultural and Food Chemistry 52, 2490-2498.
Ossipov, V., J.P. Salminen, S. Ossipova, E. Haukioja & K. Pihlaja. (2003). Gallic acid and
hydrolysable tannins are formed in birch leaves from an intermediate compound of the shikimate pathway. Biochemical Systematics and Ecology 31, 3-16.
Papoutsi, Z., E. Kassi, A. Tsiapara, N. Fokialakis, G.P. Chrousos & P. Moutsatsou. (2005). Evaluation
of estrogenic/antiestrogenic activity of ellagic acid via the estrogen receptor subtypes ERα and ERβ. Journal of Agricultural and Food Chemistry 53, 7715-7720.
Kuopio Univ. Publ. C. Nat. and Environ. Sci. 208: 1-93 (2007) 88

Literature cited
Parr, A.J. & G.P. Bolwell. (2000). Phenols in the plant and in man. The potential for possible
nutritional enhancement of the diet by modifying the phenols content or profile. Journal of the Science of Food and Agriculture 80, 985-1012.
Pérez-Jiménez, J. & F. Saura-Calixto. (2005). Literature data may underestimate the actual
antioxidant capacity of cereals. Journal of Agricultural and Food Chemistry 53, 5036-5040. Pèrez-Magariño, S., I. Revilla, M.L. Gonzalez-SanJose & S. Beltran. (1999). Various applications of
liquid chromatography-mass spectrometry to the analysis of phenolic compounds. Journal of Chromatography A 847, 75-81.
Perez-Vicente, A., A. Gil-Izquierdo & C. Garcia-Viguera. (2002). In vitro gastrointestinal digestion
study of pomegranate juice phenolic compounds, anthocyanins, and vitamin C. Journal of Agricultural and Food Chemistry 50, 2308-2312.
Pietta, P.-G. (2000). Flavonoids as antioxidants. Journal of Natural Products 63, 1035-1042. Porter, L.J., L.N. Hrstich & B.G. Chan. (1986). The conversion of procyanidins and prodelphinidins
to cyanidin and delphinidin. Phytochemistry 25, 223-230. Prior, R.L., X. Wu & K. Schaich. (2005). Standardized methods for the determination of antioxidant
capacity and phenolics in foods and dietary supplements. Journal of Agricultural and Food Chemistry 53, 4290-4302.
Pulido, R., L. Bravo & F. Saura-Calixto. (2000). Antioxidant activity of dietary polyphenols as
determined by a modified ferric reducing/antioxidant power assay. Journal of Agricultural and Food Chemistry 48, 3396-3402.
Puska, P., A. Nissinen, J. Tuomilehto, J.T. Salonen, K. Koskela, A. McAlister, T.E. Kottke, N.
Maccoby & J.W. Farquhar. (1985). The community-based strategy to prevent coronary heart disease: Conclusions from the ten years of the North Karelia project. Annual Review of Public Health 6, 147-193.
Puupponen-Pimiä, R., L. Nohynek, C. Meier, M. Kähkönen, M. Heinonen, A. Hopia & K.-M. Oksman-
Caldentey. (2001). Antimicrobial properties of phenolic compounds from berries. Journal of Applied Microbiology 90, 494-507.
Rein, D., Schijlen, E., T. Kooistra, K. Herbers, L. Verschuren, R. Hall, U. Sonnewald, A. Bovy & R.
Kleemann. (2006). Transgenic flavonoid tomato intake reduces C-reactive protein in human C-reactive protein transgenic mice more than wild-type tomato. The Journal of Nutrition 136, 2331-2337.
Rice-Evans, C.A., N.J. Miller & G. Paganga. (1997). Antioxidant properties of phenolic compounds.
Trends in Plant Science 2, 152-159. de Rijke, E., H. Zappey, F. Ariese, C. Gooijer & U.A.T. Brinkman. (2003). Liquid chromatography
with atmospheric pressure chemical ionization and electrospray ionization mass spectrometry of flavonoids with triple-quadrupole and ion-trap instruments. Journal of Chromatography A 984, 45-58.
Rissanen, T.H., S. Voutilainen, J.K. Virtanen, B. Venho, M. Vanharanta, J. Mursu & J.T. Salonen.
(2003). Low intake of fruits and vegetables is associated with excess mortality in men: The Kuopio Ischaemic heart disease risk factor (KIHD) study. The Journal of Nutrition 133, 199-204.
Rivero, R.M., J.M. Ruiz, P.C. Garcia, L.R. Lopez-Lefebre, E. Sanchez & L. Romero. (2001).
Resistance to cold and heat stress: Accumulation of phenolic compounds in tomato and watermelon plants. Plant Science 160, 315-321.
Kuopio Univ. Publ. C. Nat. and Environ. Sci. 208: 1-93 (2007) 89
Mikko J. Anttonen: Evaluation of means to increase the content of bioactive phenolic compounds in soft fruits
Robards, K. & M. Antolovich. (1997). Analytical chemistry of fruit bioflavonoids. A review. Analyst 122, 11R-34R.
Robbins, R.J. (2003). Phenolic acids in foods: an overview of analytical methodology. Journal of
Agricultural and Food Chemistry 51, 2866-2887. Rodríguez-Delgado, M.A., S. Malovaná, J.P. Pérez, T. Borges & F.J. García Montelongo. (2001).
Separation of phenolic compounds by high-performance liquid chromatography with absorbance and fluorimetric detection. Journal of Chromatography A 912, 249-257.
Rohner-Thielen, W. (2005). Organic farming in Europe. Statistics in focus 31. Eurostat. European
Comission. Rühmann, S., D. Treutter, S. Fritsche, K. Briviba & I. Szankowski. (2006). Piceid (resveratrol
glucoside) synthesis in stilbene synthase transgenic apple fruit. Journal of Agricultural and Food Chemistry 54, 4633-4640.
Ruiz, J.M., J. Hernandez, N. Castilla & L. Romero. (1999). Potato performance in response to
different mulches. 1. Nitrogen metabolism and yield. Journal of Agricultural and Food Chemistry 47, 2660-2665.
Sánchez-Moreno, C., J.A. Larrauri & F. Saura-Calixto. (1998). A procedure to measure the
antiradical efficiency of polyphenols. Journal of the Science of Food and Agriculture 76, 270-276.
Sarma, B.K., D.P. Singh, S. Mehta, H.B. Singh & U.P. Singh. (2002). Plant growth-promoting
rhizobacteria-elicited alterations in phenolic profile of chickpea (Cicer arietinum) infected by Sclerotium rolfsii. Journal of Phytopathology 150, 277-282.
Scalbert, A., C. Manach, C. Morand, C. Rémésy & L. Jiménez. (2005). Dietary polyphenols and the
prevention of diseases. Critical Reviews in Food Science and Nutrition 45, 287-306. Scalzo, J., M. Battino, E. Costantini & B. Mezzetti. (2005a). Breeding and biotechnology for
improving berry nutritional quality. BioFactors 23, 213-220. Scalzo, J., A. Politi, N. Pellegrini, B. Mezzetti & M. Battino. (2005b). Plant genotype affects total
antioxidant capacity and phenolic contents in fruit. Nutrition 21, 207-213. Schijlen, E.G.W.M., C.H.R. De Vos, A.J. Van Tunen & A.G. Bovy. (2004). Modification of flavonoid
biosynthesis in crop plants. Phytochemistry 65, 2631-2648. Schofield, P., D.M. Mbugua & A.N. Pell. (2001). Analysis of condensed tannins: A review. Animal
Feed Science and Technology 91, 21-40. Seeram, N.P., L.S. Adams, M.L. Hardy & D. Heber. (2004). Total cranberry extract versus its
phytochemical constituents: Antiproliferative and synergistic effects against human tumour cell lines. Journal of Agricultural and Food Chemistry 52, 2512-2517.
Seeram, N.P., R. Lee, H.S. Scheuller & D. Heber. (2006). Identification of phenolic compounds in
strawberries by liquid chromatography electrospray ionization mass spectroscopy. Food Chemistry 97, 1-11.
Sharma, S.S. & V.P. Sharma. (2003). Mulch type influences plant growth, albinism disorder and fruit
quality in strawberry (Fragaria x ananassa Dusch.). Fruits 58, 221-227. Shepherd, R., M. Magnusson & P. Sjödén. (2005). Determinants of consumer behavior related to
organic foods. Ambio 34, 352-359. Simmonds, M.S.J. (2003). Flavonoid-insect interactions: Recent advances in our knowledge.
Phytochemistry 64, 21-30.
Kuopio Univ. Publ. C. Nat. and Environ. Sci. 208: 1-93 (2007) 90

Literature cited
Singleton, V.L. & J.A. Rossi. (1965) Colorimetry of total phenolics with phosphomolybdic-
phosphotungstic acid reagent. American Journal of Enology and Viticulture 16, 144-158. Siriwoharn, T., R.E. Wrolstad, C.E. Finn & C.B. Pereira. (2004). Influence of cultivar, maturity, and
sampling on blackberry (Rubus L. Hybrids) anthocyanins, polyphenolics, and antioxidant properties. Journal of Agricultural and Food Chemistry 52, 8021-8030.
Skrede, G., R.E. Wrolstad & R.W. Durst. (2000). Changes in anthocyanins and polyphenolics during
juice processing of highbush blueberries (Vaccinium corymbosum L.). Journal of Food Science 65, 357-364.
Slimestad, R. & H. Solheim. (2002). Anthocyanins from black currants. Journal of Agricultural and
Food Chemistry 50, 3228-3231. Solecka, D., A.M. Boudet & A. Kacperska. (1999). Phenylpropanoid and anthocyanin changes in low-
temperature treated winter oilseed rape leaves. Plant Physiology and Biochemistry 37, 491-496.
Somssich, I.E. & K. Hahlbrock. (1998). Pathogen defence in plants - A paradigm of biological
complexity. Trends in Plant Science 3, 86-90. Starke, H. & K. Herrmann. (1976). The phenolics of fruits VIII. Changes in flavonol concentrations
during fruit development. European Food Research and Technology 161, 131-135. Stobiecki, M. (2000). Application of mass spectrometry for identification and structural studies of
flavonoid glycosides. Phytochemistry 54, 237-256. Stoclet, J.-C., T. Chataigneau, M. Ndiaye, M.-H. Oak, J. El Bedoui, M. Chataigneau & V.B. Schini-
Kerth. (2004). Vascular protection by dietary polyphenols. European Journal of Pharmacology 500, 299-313.
Strissel, T., H. Halbwirth, U. Hoyer, C. Zistler, K. Stich & D. Treutter. (2005). Growth-promoting
nitrogen nutrition affects flavonoid biosynthesis in young apple (Malus domestica Borkh.) leaves. Plant Biology 7, 677-685.
Sun, J., Y.F. Chu, X. Wu & R.H. Liu. (2002). Antioxidant and antiproliferative activities of common
fruits. Journal of Agricultural and Food Chemistry 50, 7449-7454. Tahvanainen, J., E. Helle, R. Julkunen-Tiitto & A. Lavola. (1985). Phenolic compounds of willow
bark as deterrents against feeding by mountain hare. Oecologia 65, 319-323. Tattini, M., C. Galardi, P. Pinelli, R. Massai, D. Remorini & G. Agati. (2004). Differential
accumulation of flavonoids and hydroxycinnamates in leaves of Ligustrum vulgare under excess light and drought stress. New Phytologist 163, 547-561.
Tegelberg R., R. Julkunen-Tiitto & P.J. Aphalo. (2004). Red : far-red light ratio and UV-B radiation:
Their effects on leaf phenolics and growth of silver birch seedlings. Plant, Cell and Environment 24, 1005-1013.
Tomás-Barberán, F.A. & J.C. Espín. (2001). Phenolic compounds and related enzymes as
determinants of quality in fruits and vegetables. Journal of the Science of Food and Agriculture 81, 853-876.
Toor, R.K., G.P. Savage & A. Heeb. (2006). Influence of different types of fertilisers on the major
antioxidant components of tomatoes. Journal of Food Composition and Analysis 19, 20-27. Treutter, D. (2005). Significance of flavonoids in plant resistance and enhancement their
biosynthesis. Plant Biology 7, 581-591.
Kuopio Univ. Publ. C. Nat. and Environ. Sci. 208: 1-93 (2007) 91

Mikko J. Anttonen: Evaluation of means to increase the content of bioactive phenolic compounds in soft fruits
Tsao, R. & Z. Deng. (2004). Separation procedures for naturally occurring antioxidant phytochemicals. Journal of Chromatography B 812, 85-99.
Tsao, R., R. Yang, S. Xie, E. Sockovie & S. Khanizadeh. (2005). Which polyphenolic compounds
contribute to the total antioxidant activities of apple? Journal of Agricultural and Food Chemistry 53, 4989-4995.
Tsao, R., Y. Papadopoulos, R. Yang, J.C. Young & K. McRae. (2006). Isoflavone profiles of red
clovers and their distribution in different parts harvested at different growing stages. Journal of Agricultural and Food Chemistry 54, 5797-5805.
Tsuda, T., F. Horio, K. Uchida, H. Aoki & T. Osawa. (2003). Dietary cyanidin-3-O-β-D-glucoside-rich
purple corn color prevents obesity and ameliorates hyperglycemia in mice. The Journal of Nutrition 133, 2125-2130.
Tsuda, T., Y. Ueno, H. Aoki, T. Koda, F. Horio, N. Takahashi, T. Kawada & T. Osawa. (2004).
Anthocyanin enhances adipocytokine secretion and adipocyte-specific gene expression in isolated rat adipocytes. Biochemical and Biophysical Research Communications 316, 149-157.
Tura, D. & K. Robards. (2002). Sample handling strategies for the determination of biophenols in
food and plants. Journal of Chromatography A 975, 71-93. Vallad, G.E. & R.M. Goodman. (2004). Systemic acquired resistance and induced systemic resistance
in conventional agriculture. Crop Science 44, 1920-1934. Wang, S.Y. & H.S. Lin. (2000). Antioxidant activity in fruits and leaves of blackberry, raspberry, and
strawberry varies with cultivar and developmental stage. Journal of Agricultural and Food Chemistry 48, 140-146.
Wang, S.Y. & W. Zheng. (2001). Effect of plant growth temperature on antioxidant capacity in
strawberry. Journal of Agricultural and Food Chemistry 49, 4977-4982. Wang, S.Y., W. Zheng & G.J. Galletta. (2002). Cultural system affects fruit quality and antioxidant
capacity in strawberries. Journal of Agricultural and Food Chemistry 50, 6534-6542. Wang, S.Y., J.A. Bunce & J.L. Maas. (2003). Elevated carbon dioxide increases contents of
antioxidant compounds in field-grown strawberries. Journal of Agricultural and Food Chemistry 51, 4315-4320.
Wang, S.Y. & H.S. Lin. (2003). Compost as a soil supplement increases the level of antioxidant
compounds and oxygen radical absorbance capacity in strawberries. Journal of Agricultural and Food Chemistry 51, 6844-6850.
Waterman, P.G. & S. Mole. (1994). Analysis of phenolic plant metabolites. Blackwell Scientific
Publications: Oxford, England; 237 pp. WHO. World Health Organization; http://www.who.int. Williams, R.J., J.P.E. Spencer & C. Rice-Evans. (2004). Flavonoids: Antioxidants or signalling
molecules? Free Radical Biology & Medicine 36, 838-849. Williamson, G. & C. Manach. (2005). Bioavailability and bioefficacy of polyphenols in humans. II.
Review of 93 intervention studies. The American Journal of Clinical Nutrition 81, 243S-255S. Williner, M.R., M.E. Pirovani & D.R. Guemes. (2003). Ellagic acid content in strawberries of
different cultivars and ripening stages. Journal of the Science of Food and Agriculture 83, 842-845.
Winkel, B.S.J. (2004). Metabolic channeling in plants. Annual Review of Plant Biology 55, 85-107.
Kuopio Univ. Publ. C. Nat. and Environ. Sci. 208: 1-93 (2007) 92
Literature cited
Witzell, J. & A. Shevtsova. (2004). Nitrogen-induced changes in phenolics of Vaccinium myrtillus - Implications for interaction with a parasitic fungus. Journal of Chemical Ecology 30, 1937-1956.
Woese, K., D. Lange, C. Boess & K.W. Bogl. (1997). A comparison of organically and conventionally
grown foods - Results of a review of the relevant literature. Journal of the Science of Food and Agriculture 74, 281-293.
Vuorela, S., K. Kreander,M. Karonen, R. Nieminen, M. Hämäläinen, A. Galkin, L. Laitinen, J.-P.
Salminen, E. Moilanen, K. Pihlaja, H. Vuorela, P. Vuorela & M. Heinonen. (2005). Preclinical evaluation of rapeseed, raspberry, and pine bark phenolics for health related effects. Journal of Agricultural and Food Chemistry 53, 5922-5931.
Yang, C.S., J.M. Landau, M.-T. Huang & H.L. Newmark. (2001). Inhibition of carsinogenesis by
dietary polyphenolic compounds. Annual Review of Nutrition 21, 381-406. Yeh, C. & G. Yen. (2003). Effects of phenolic acids on human phenolsulfotransferases in relation to
their antioxidant activity. Journal of Agricultural and Food Chemistry 51, 1474-1479. Youdim, K.A., J.P.E. Spencer, H. Schroeter & C. Rice-Evans. (2002a). Dietary flavonoids as potential
neuroprotectants. Biological Chemistry 383, 503-519. Youdim, K.A., J. McDonald, W. Kalt & J.A. Joseph. (2002b). Potential role of dietary flavonoids in
reducing microvascular endothelium vulnerability to oxidative and inflammatory insults. Journal of Nutritional Biochemistry 13, 282-288.
Young, J.E., X. Zhao, E.E. Carey, R. Welti, S. Yang & W. Wang. (2005). Phytochemical phenolics in
organically grown vegetables. Molecular Nutrition & Food Research 49, 1136-1142. Zadernowski, R., M. Naczk & J. Nesterowicz. (2005). Phenolic acid profiles in some small berries.
Journal of Agricultural and Food Chemistry 53, 2118-2124. Zhishen J., T. Mengcheng & W. Jianming. (1999). The determination of flavonoid contents in
mulbery and their scavenging effects on superoxide radicals. Food Chemistry 64, 555-559.
Kuopio Univ. Publ. C. Nat. and Environ. Sci. 208: 1-93 (2007) 93


APPENDIX:
ORIGINAL PUBLICATIONS

Kuopio University Publications C. Natural and Environmental Sciences C 192. Ålander, Timo. Carbon composition and volatility characteristics of the aerosol particles formed in internal combustion engines. 2006. 54 p. Acad. Diss. C 193. Molnar, Ferdinand. Structural analysis of the ligand-binding domains of human and mouse CAR, human VDR and human PPARs. 2006. 115 p. Acad. Diss. C 194. Kasurinen, Anne. Soil-related processes of young silver birch trees grown under elevated CO₂ and O₃ . 2006. 64 p. Acad. Diss. C 195. Metsärinne, Sirpa. Degradation of Novel and Conventional Complexing Agents. 2006. 138 p. Acad. Diss. C 196. Heijari, Juha. Seed origin, forest fertilization and chemical elicitor influencing wood characteristics and biotic resistance of Scots pine. 2006. 39 p. Acad. Diss. C 197. Hakulinen, Mikko. Prediction of density, structure and mechanical properties of trabecular bone using ultrasound and X-ray techniques. 2006. 84 p. Acad. Diss. C 198. Al Natsheh, Anas. Quantum Mechanics Study of Molecular Clusters Composed of Atmospheric Nucleation Precursors. 2006. 55 p. Acad. Diss. C 199. Tarvainen, Tanja. Computational Methods for Light Transport in Optical Tomography. 2006. 123 p. Acad. Diss. C 200. Heikkinen, Päivi. Studies on Cancer-related Effects of Radiofrequency Electromagnetic Fields. 2006. 165 p. Acad. Diss. C 201. Laatikainen, Tarja. Pesticide induced responses in ectomycorrhizal fungi and symbiont Scots pine seedlings. 2006. 180 p. Acad. Diss. C 202. Tiitta, Markku. Non-destructive methods for characterisation of wood material. 2006. 70 p. Acad. Diss. C 203. Lehesranta, Satu. Proteomics in the Detection of Unintended Effects in Genetically Modified Crop Plants. 2006. 71 p. Acad. Diss. C 204. Boman, Eeva. Radiotherapy forward and inverse problem applying Boltzmann transport equation. 2007. 138 p. Acad. Diss. C 205. Saarakkala, Simo. Pre-Clinical Ultrasound Diagnostics of Articular Cartilage and Subchondral Bone. 2007. 96 p. Acad. Diss. C 206. Korhonen, Samuli-Petrus. FLUFF-BALL, a Fuzzy Superposition and QSAR Technique - Towards an Automated Computational Detection of Biologically Active Compounds Using Multivariate Methods. 2007. 154 p. Acad. Diss.