middle school math march 12, 2007 transition … · middle school math march 12, 2007. transition...
TRANSCRIPT

1WWC Intervention Report Transition Mathematics March 12, 2007
WWC Intervention Report U.S. DEPARTMENT OF EDUCATION
What Works ClearinghouseMiddle School Math March 12, 2007
Transition MathematicsProgram description Transition Mathematics aims to increase 7th- through 12th-grade
students’ skills in applied arithmetic, pre-algebra, and pre-geom-
etry. This one-year curriculum also addresses general application
to different wordings of problems, types of numbers, and contexts
for problems and aims to promote mathematical reading skills.
The curriculum uses the University of Chicago School Mathemat-
ics Project (UCSMP) textbook. The sequence of the topics intends
to assist the transition from arithmetic to algebra and geometry.
Research One study of Transition Mathematics, first edition, comparing it
with Expert Mathematician, met the What Works Clearinghouse
(WWC) evidence standards. One study of the first edition and
one study of the second edition of the intervention, comparing
it with diverse curricula used in different schools, met WWC evi-
dence standards with reservations. The three studies included
more than 2,000 students in seventh, eighth, and ninth grades in
schools throughout the United States.1
Effectiveness Transition Mathematics was found to have mixed effects on mathematics achievement.
Math achievementRating of effectiveness Mixed effects
Improvement index2 Average: +0 percentile points
Range: –14 to +19 percentile points
1. The evidence presented in this report is based on available research. Findings and conclusions may change as new research becomes available.2. These numbers show the average and range of improvement indices for all findings across the studies.

2Transition Mathematics March 12, 2007WWC Intervention Report
Additional program information
Developer and contactDeveloped by the University of Chicago School Mathematics
Project (UCSMP). Address: 6030 S. Ellis Avenue, Chicago, IL
60637. Web: http://socialsciences.uchicago.edu/ucsmp/Sec-
ondary.html. Telephone: (773) 702-1130. The second edition
curriculum is distributed by Pearson, Prentice Hall. Email:
[email protected]. Web: http://www.phschool.
com/atschool/ucsmp/index.html. Telephone: (800) 848-9500.3
Scope of useTransition Mathematics, first edition was developed and tested
between 1983–86. Transition Mathematics, second edition was
developed and tested in 1992–94.4 The third edition has been
in development since 2004. According to the developers at
the University of Chicago, since 1983, 3.5–4 million students
in elementary, middle, and high schools have been using
UCSMP materials and curricula. Scope of use and demographic
characteristics of students using Transition Mathematics are not
available.
TeachingThe curriculum introduces algebra by examining different uses
of variables and variable representation on the number line and
coordinate plane. The course also introduces basic algebra skills
and connects geometry to arithmetic, measurement, and algebra.
Numbers are viewed as representative of real objects and events,
not abstraction. The use of numbers and operations in real-life
situations is emphasized. Among the chapters included in the
second edition textbook are decimal notation, large and small
numbers, measurement, uses of variables, problem-solving strate-
gies, real numbers, coordinate graphs, and equations. The use of
scientific calculators and computer exercises is integrated into the
curriculum. According to the publisher, this curriculum implements
the National Council of Teachers of Mathematics’ standards by
emphasizing applications, writing, problem solving, and technology.
CostA student textbook costs $55.47. A teacher resource book,
Implementing UCSMP: A User’s Handbook, costs $12.97. An
additional Study Skills Handbook costs $30.97.
Research Three studies reviewed by the WWC investigated the effects
of Transition Mathematics. One study (Baker, 1997) was a
randomized controlled trial that met WWC evidence standards
in the original review and met WWC evidence standards in this
updated review. Two studies (Hedges, Stodolsky, Mathison, &
Flores, 1986; Thompson, Senk, Witonsky, Usiskin, & Kaeley,
2005) used a quasi-experiment design that met WWC evidence
standards with reservations.
Met evidence standardsBaker (1997) included 90 eighth-grade students in four
classrooms who were randomly assigned to either a Transition
Mathematics (n = 45) or Expert Mathematician (n = 45) group.
Met evidence standards with reservationsHedges et al. (1986) included 40 matched pairs of pre-algebra
classrooms from urban, suburban, and rural schools located in
several states in the United States and represented a wide range
of socioeconomic groups. Students in the comparison classrooms
used mathematics curricula other than Transition Mathematics.
Thompson et al. (2005) included 91 students in four matched
pairs of classrooms in two inner-city schools and one rural school
in the West, upper Midwest, and Southeast. The sample was made
up of a diverse student population, including low socioeconomic
and minority populations. Students in the comparison group used
non-UCSMP materials—also referred to as “traditional mathemat-
ics materials”—which were used by the schools before the study.
3. According to the developer, the third edition will be available from the Wright Group/McGraw Hill.4. The second edition includes new features designed to broaden teacher assessment strategies of students’ math knowledge, understanding, and in-
depth exploration and to encourage and model students’ writing about mathematics.

3Transition Mathematics March 12, 2007WWC Intervention Report
Effectiveness FindingsThe WWC review of interventions for middle school math
addresses student outcomes in the mathematics achievement
domain.
Baker (1997) reported that Transition Mathematics students
scored lower than Expert Mathematician students on the Objec-
tives by Strand test, but that the difference was not statistically
significant.5 The WWC confirmed that the difference was not
statistically significant, but found that it was large enough to be
considered substantively important according to WWC criteria.
Hedges et al. (1986) reported Transition Mathematics class-
rooms scored statistically significantly higher than comparison
classrooms on three outcomes: the Orleans-Hanna Algebra
Prognosis test, the High School Subjects Test: General Math-
ematics, and the Geometry Readiness test. The WWC analysis
confirmed these results for the Geometry Readiness test, but
found no statistically significant differences for the Orleans-
Hanna Algebra Prognosis test and the General Mathematics
test.6
Thompson et al. (2005) examined student outcomes using
the High School Subjects Test: General Mathematics, Geometry
Readiness test, Algebra Readiness test, and Problem-Solving
and Understanding test. The study reported a statistically signifi-
cant difference favoring the Transition Mathematics group on the
Geometry Readiness test, but this difference was not statistically
significant according to WWC criteria. The study reported no
statistically significant differences on the other measures.7
The average effect size across all four student outcomes was
neither statistically significant nor large enough to be considered
substantively important (that is, at least 0.25).
In sum, of the three studies that examined the impact of the
first and second editions of Transition Mathematics, one study
showed a substantively important negative effect, one study
showed a statistically significant positive effect, and one study
showed an indeterminate effect.
Rating of effectivenessThe WWC rates the effects of an intervention in a given outcome
domain as positive, potentially positive, mixed, no discernible
effects, potentially negative, or negative. The rating of effective-
ness takes into account four factors: the quality of the research
design, the statistical significance of the findings,8 the size of the
difference between participants in the intervention and compari-
son conditions, and the consistency in findings across studies
(see the WWC Intervention Rating Scheme).
5. Baker (1997) also reported statistically significant improvement between pretest and posttest experienced by both Transitional Mathematics and Expert Mathematician students. Expert Mathematician was reviewed by the WWC, and the findings of this review are presented in the WWC Expert Mathemati-cian Intervention Report.
6. Hedges et al. (1986) also analyzed findings separately for students using calculators and students not using calculators. The WWC analysis confirmed a statistically significant positive effect for students using calculators.
7. This WWC review focuses on reported results from the study that use all items in the study measures. The study also examined performance on subsets of items of the General Mathematics test and the Algebra Readiness test that were aligned with the mathematics content that students had the opportunity to learn in class—those subsets of items are referred to in the study as “fair test” and “conservative test.” The study reported a statistically significant positive effect of the Transition Mathematics curriculum using both the fair and conservative versions of the Algebra Readiness test, but no statistically significant effects using the fair and conservative versions of the General Mathematics test.
8. The level of statistical significance was reported by the study authors or, where necessary, calculated by the WWC to correct for clustering within classrooms or schools and for multiple comparisons. For an explanation, see the WWC Tutorial on Mismatch. See Technical Details of WWC-Conducted Computations for the formulas the WWC used to calculate the statistical significance. In the case of Transition Mathematics, corrections for clustering and multiple comparisons were needed for part of the studies reviewed. See WWC Transition Mathematics Technical Appendices for further details.

4Transition Mathematics March 12, 2007WWC Intervention Report
The WWC found Transition Mathematics to have mixed
effects for mathematics achievement
Improvement indexThe WWC computes an improvement index for each individual
finding. In addition, within each outcome domain, the WWC
computes an average improvement index for each study and
an average improvement index across studies (see Technical
Details of WWC-Conducted Computations). The improvement
index represents the difference between the percentile rank
of the average student in the intervention condition versus
the percentile rank of the average student in the comparison
condition. Unlike the rating of effectiveness, the improvement
index is entirely based on the size of the effect, regardless of
the statistical significance of the effect, the study design, or the
analyses. The improvement index can take on values between
–50 and +50, with positive numbers denoting results favorable to
the intervention group.
The average improvement index for mathematics achievement
is +0 percentile points across the three studies, with a range of
–14 to +19 percentile points across findings.
SummaryThe WWC reviewed three studies on Transition Mathematics. Of
these, one study met WWC evidence standards and two studies
met WWC evidence standards with reservations. Based on the
results of the three studies, the WWC found mixed effects on
students’ mathematics achievement. The evidence presented in
this report is limited and may change as new research emerges.
References Met WWC evidence standardsBaker, J. J. (1997). Effects of a generative instructional design
strategy on learning mathematics and on attitudes towards
achievement. Dissertation Abstracts International, 58(7),
2573A. (UMI No. 9800955).
Met WWC evidence standards with reservationsHedges, L. V., Stodolsky, S. S., Mathison, S., & Flores, P. V.
(1986). Transition Mathematics Field Study. Chicago: Univer-
sity of Chicago.
Thompson, D. R., Senk, S. L., Witonsky, D., Usiskin, Z., & Kaeley,
G. (2005). An evaluation of the second edition of UCSMP
Transition Mathematics. Chicago: University of Chicago
School Mathematics Project.
For more information about specific studies and WWC calculations, please see the WWC Transition Mathematics Technical Appendices.
5WWC Intervention Report Transition Mathematics March 12, 2007
Appendix
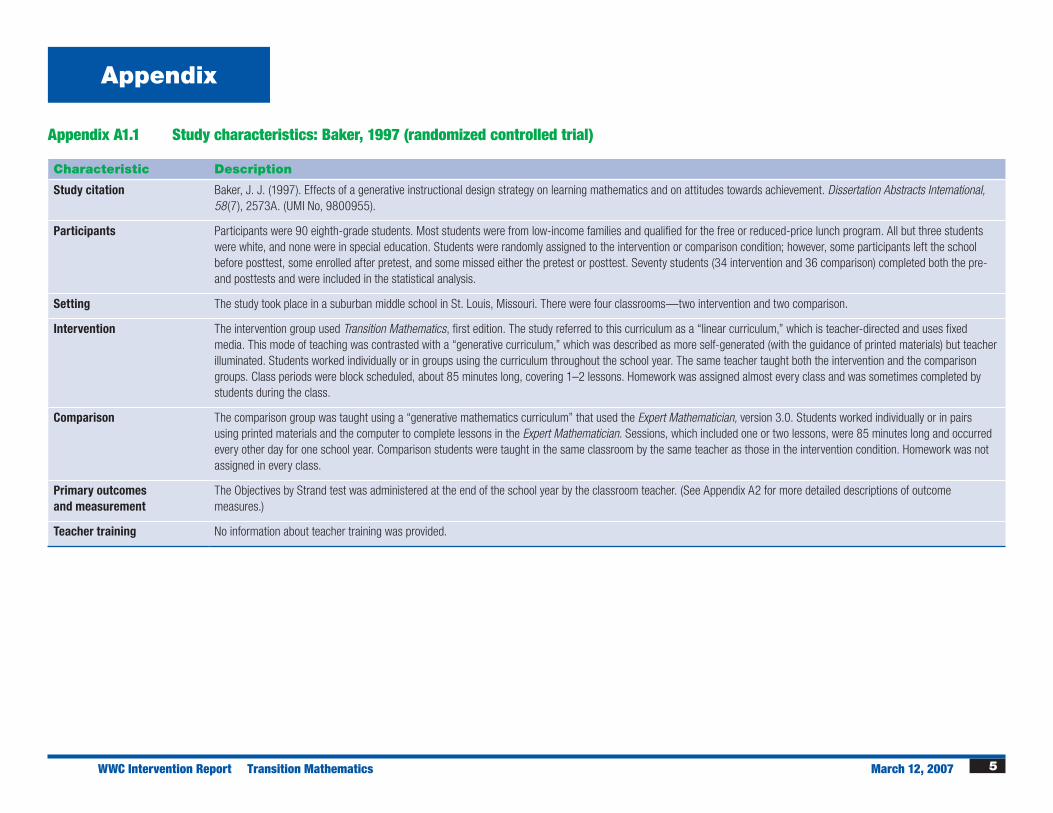
Appendix A1.1 Study characteristics: Baker, 1997 (randomized controlled trial)
Characteristic Description
Study citation Baker, J. J. (1997). Effects of a generative instructional design strategy on learning mathematics and on attitudes towards achievement. Dissertation Abstracts International, 58 (7), 2573A. (UMI No, 9800955).
Participants Participants were 90 eighth-grade students. Most students were from low-income families and qualified for the free or reduced-price lunch program. All but three students were white, and none were in special education. Students were randomly assigned to the intervention or comparison condition; however, some participants left the school before posttest, some enrolled after pretest, and some missed either the pretest or posttest. Seventy students (34 intervention and 36 comparison) completed both the pre- and posttests and were included in the statistical analysis.
Setting The study took place in a suburban middle school in St. Louis, Missouri. There were four classrooms—two intervention and two comparison.
Intervention The intervention group used Transition Mathematics, first edition. The study referred to this curriculum as a “linear curriculum,” which is teacher-directed and uses fixed media. This mode of teaching was contrasted with a “generative curriculum,” which was described as more self-generated (with the guidance of printed materials) but teacher illuminated. Students worked individually or in groups using the curriculum throughout the school year. The same teacher taught both the intervention and the comparison groups. Class periods were block scheduled, about 85 minutes long, covering 1–2 lessons. Homework was assigned almost every class and was sometimes completed by students during the class.
Comparison The comparison group was taught using a “generative mathematics curriculum” that used the Expert Mathematician, version 3.0. Students worked individually or in pairs using printed materials and the computer to complete lessons in the Expert Mathematician. Sessions, which included one or two lessons, were 85 minutes long and occurred every other day for one school year. Comparison students were taught in the same classroom by the same teacher as those in the intervention condition. Homework was not assigned in every class.
Primary outcomes and measurement
The Objectives by Strand test was administered at the end of the school year by the classroom teacher. (See Appendix A2 for more detailed descriptions of outcome measures.)
Teacher training No information about teacher training was provided.

6WWC Intervention Report Transition Mathematics March 12, 2007
Appendix A1.2 Study characteristics: Hedges, Stodolsky, Mathison, & Flores, 1986 (quasi-experimental design)
Characteristic Description
Study citation Hedges, L. V., Stodolsky, S. S., Mathison, S., & Flores, P. V. (1986). Transition Math Field Study. Chicago: University of Chicago.
Participants The study included seventh-grade students in the 50th-90th percentile of math ability, eighth-grade students in the 30th-70th percentile, and ninth-grade students in the 15th-50th percentile based on standardized test scores. The participants were enrolled in a pre-algebra class. The original sample (referred to in the study as “all pairs”) included 1,048 students in 41 intervention classrooms and 976 students in 38 comparison classrooms. Based on examination of the statistical significance of pretest differences and class size and composition, the study defined a subset of 20 well-matched pairs of classrooms (7 pairs of seventh grade, 10 pairs of eighth grade, and 3 pairs of ninth grade). This sample was referred to in the study as “the conservative sample.” The sample was diverse in terms of demographic characteristics—for example, socioeconomic status and ethnic minority.
Setting The “all pairs” sample was recruited from 35 schools in rural, suburban, and urban areas in 10 states: Colorado, Florida, Illinois (Chicago and Chicago suburbs), Maryland, Michigan, Mississippi, New Mexico, Ohio, Virginia, and Washington. No information was provided on the number of schools and geographical areas from which the conserva-tive sample was recruited.
Intervention This study used the first edition of the Transition Mathematics textbook, which addresses pre-algebra, pre-geometry, and applied arithmetic. Compared with traditional cur-ricula, Transition Mathematics emphasizes reading math and using calculators. Lessons ranged 40–60 minutes across grade levels. Teachers were expected to do a lesson a day, but the study reported variations in the number of lessons taught each week. The study reported that lower student math ability made it difficult to implement the intervention as intended.
Comparison The comparison group was taught using curricula that were not Transition Mathematics but provided similar opportunities to learn mathematics content.
Primary outcomes and measurement
Primary outcomes used in this study were the High School Subjects Test: General Mathematics, the Geometry Readiness test, and the Orleans-Hanna Algebra Prognosis test. An additional nonstandardized measure, the Alternative Test, was not reviewed because complete statistical information was not available, so effect sizes could not be computed for this measure. (See Appendix A2 for more detailed descriptions of outcome measures.)
Teacher training No information about teacher training was provided.
7WWC Intervention Report Transition Mathematics March 12, 2007
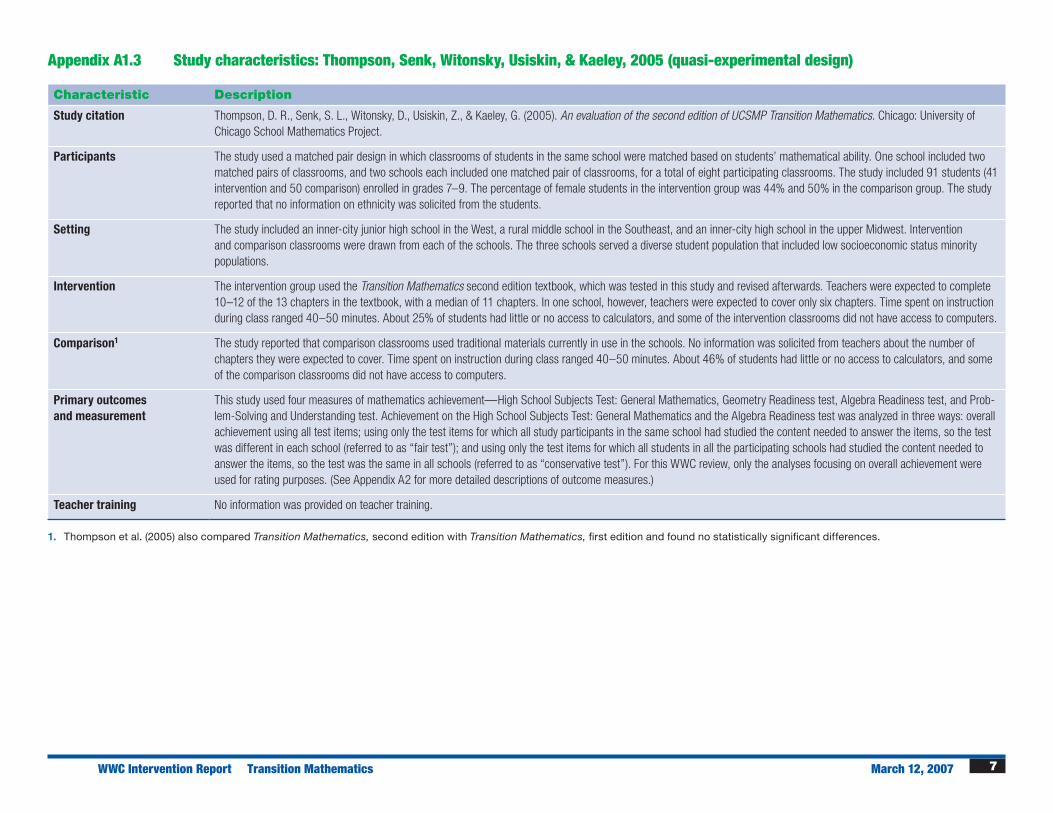
Appendix A1.3 Study characteristics: Thompson, Senk, Witonsky, Usiskin, & Kaeley, 2005 (quasi-experimental design)
Characteristic Description
Study citation Thompson, D. R., Senk, S. L., Witonsky, D., Usiskin, Z., & Kaeley, G. (2005). An evaluation of the second edition of UCSMP Transition Mathematics. Chicago: University of Chicago School Mathematics Project.
Participants The study used a matched pair design in which classrooms of students in the same school were matched based on students’ mathematical ability. One school included two matched pairs of classrooms, and two schools each included one matched pair of classrooms, for a total of eight participating classrooms. The study included 91 students (41 intervention and 50 comparison) enrolled in grades 7–9. The percentage of female students in the intervention group was 44% and 50% in the comparison group. The study reported that no information on ethnicity was solicited from the students.
Setting The study included an inner-city junior high school in the West, a rural middle school in the Southeast, and an inner-city high school in the upper Midwest. Intervention and comparison classrooms were drawn from each of the schools. The three schools served a diverse student population that included low socioeconomic status minority populations.
Intervention The intervention group used the Transition Mathematics second edition textbook, which was tested in this study and revised afterwards. Teachers were expected to complete 10–12 of the 13 chapters in the textbook, with a median of 11 chapters. In one school, however, teachers were expected to cover only six chapters. Time spent on instruction during class ranged 40–50 minutes. About 25% of students had little or no access to calculators, and some of the intervention classrooms did not have access to computers.
Comparison1 The study reported that comparison classrooms used traditional materials currently in use in the schools. No information was solicited from teachers about the number of chapters they were expected to cover. Time spent on instruction during class ranged 40–50 minutes. About 46% of students had little or no access to calculators, and some of the comparison classrooms did not have access to computers.
Primary outcomes and measurement
This study used four measures of mathematics achievement—High School Subjects Test: General Mathematics, Geometry Readiness test, Algebra Readiness test, and Prob-lem-Solving and Understanding test. Achievement on the High School Subjects Test: General Mathematics and the Algebra Readiness test was analyzed in three ways: overall achievement using all test items; using only the test items for which all study participants in the same school had studied the content needed to answer the items, so the test was different in each school (referred to as “fair test”); and using only the test items for which all students in all the participating schools had studied the content needed to answer the items, so the test was the same in all schools (referred to as “conservative test”). For this WWC review, only the analyses focusing on overall achievement were used for rating purposes. (See Appendix A2 for more detailed descriptions of outcome measures.)
Teacher training No information was provided on teacher training.
1. Thompson et al. (2005) also compared Transition Mathematics, second edition with Transition Mathematics, first edition and found no statistically significant differences.

8WWC Intervention Report Transition Mathematics March 12, 2007
Appendix A2 Outcome measures in the mathematics achievement domain
Outcome measure Description
Objectives by Strand A 78-item multiple-choice test of mathematical ability (as cited in Baker, 1997).
Orleans-Hanna Algebra Prognosis test
This nationally normed test consists of 60 multiple-choice items based on nine model lessons and five questionnaire items that require students to report their course grades and predict their final grade if they were to take algebra. In contrast to an achievement test, students are required to answer questions by following a procedure or set of operations using mathematical or verbal expressions parallel to but different from those contained in the model lessons. This test is often used to predict the ability to succeed in a first-year algebra course (as cited in Hedges et al., 1986).
High School Subjects Test: General Mathematics
This test consists of 40 items—20 arithmetic skills items and 20 arithmetic uses items. The test was developed by Scott, Foresman, and Company (as cited in Hedges et al., 1986; Thompson et al., 2005).
Geometry Readiness This 19-item test was constructed by UCSMP and adapted from a test developed in the early 1970s for the Cognitive Development and Achievement in the Secondary School Geometry Study (as cited in Hedges et al., 1986; Thompson et al., 2005). According to the study’s description of the test, it covers relevant topics in geometry, including properties of lines; perimeter, area, and volume; figures and their properties; angles and their measures; and circles. The test was accepted for review based on the descrip-tion of its content.
Algebra Readiness This test consists of 11 multiple-choice items and 10 short constructed-response items. The test was developed by UCSMP (as cited in Thompson et al., 2005). According to the study’s description of the test, it covers relevant topics in algebra, including translating words into symbols, properties of numbers, scientific notations, graphs of lines, equation solving, coordinates, estimation, and evaluating an expression. The test was accepted for review based on the description of its content.
Problem-Solving and Understanding
This open-ended problem-solving test was developed at the UCSMP (as cited in Thompson et al., 2005). This test was administered in two different forms—“even form” and “odd form.” Each form examines different mathematics skills and knowledge (for example, probability, mean and median, decimals and fractions, and area and perimeter). Half of the students in each class were randomly assigned to each form. The test was accepted for review based on the description of its content.

9WWC Intervention Report Transition Mathematics March 12, 2007
Appendix A3 Summary of study findings included in the rating for the mathematics achievement domain1
Author’s findings from the study
WWC calculationsMean outcome
(standard deviation2)
Outcome measureStudy
sample
Sample size (schools/ students)
Transition Mathematics
group3Comparison
group
Mean difference4
(Transition Mathematics – comparison) Effect size5
Statistical significance6
(at α = 0.05)Improvement
index7
Baker, 1997 (randomized controlled trial)8
Objectives by Strand Grade 8 1/70 40.8
(12.41)
45.1
(12.03)
–4.309 –0.35 ns –14
Average10 for mathematics achievement (Baker, 1997) –0.35 ns –14
Hedges et al., 1986 (quasi-experimental design)8
Orleans-Hanna Algebra Prognosis test
Grades 7–9 40/809 38.91 (13.22)
36.66 (13.67)
2.24 0.17 ns +7
Geometry Readiness Grades 7–9 40/587 9.87 (4.17)
8.67 (4.15)
1.20 0.29 Statistically significant
+11
High School Subjects Test: General Mathematics
Grades 7–9 40/806 26.17 (8.00)
25.12 (7.60)
1.05 0.13 ns +5
Average10 for mathematics achievement (Hedges et al., 1986) 0.20 ns +8
Thompson et al., 2005 (quasi-experimental design)8
High School Subjects Test: General Mathematics
Grades 7–9 8/91 52.70 (23.90)
58.5 (20.60)
–5.80 –0.26 ns –10
Algebra Readiness Grades 7–9 8/91 41.90 (25.10)
39.7 (22.30)
2.20 0.09 ns +4
Geometry Readiness Grades 7–9 8/91 49.20 (19.10)
39.5 (18.90)
9.70 0.51 ns +19
Problem-Solving and Understanding
Grades 7–9 8/93 4.02(2.99)11
2.96 (3.06)
1.06 0.35 ns +14
Average10 for mathematics achievement (Thompson et al., 2005) 0.17 ns +7
Domain average10 for mathematics achievement across all studies 0.02 na +0
ns = not statistically significantna = not applicable
(continued)

10WWC Intervention Report Transition Mathematics March 12, 2007
1. This appendix reports findings considered for the effectiveness rating and the average improvement indices. Subgroup findings are presented in appendix A4.1. Findings by form type (even form and odd form) of High School Subjects Test: General Mathematics in Thompson et al. (2005) are presented in Appendix A4.2.
2. The standard deviation across all students in each group shows how dispersed the participants’ outcomes are: a smaller standard deviation on a given measure would indicate that participants had more similar outcomes. Standard deviations and means for Hedges et al. (1986) were requested by the WWC and received from the first study author.
3. In Baker (1997), the intervention group is Expert Mathematician, but in this report the intervention group is Transition Mathematics.4. Positive differences and effect sizes favor the intervention group; negative differences and effect sizes favor the comparison group.5. For an explanation of the effect size calculation, see Technical Details of WWC-Conducted Computations.6. Statistical significance is the probability that the difference between groups is a result of chance rather than a real difference between the groups.7. The improvement index represents the difference between the percentile rank of the average student in the intervention condition and that of the average student in the comparison condition. The improvement index can take on values
between –50 and +50, with positive numbers denoting results favorable to the intervention group.8. The level of statistical significance was reported by the study authors or, where necessary, calculated by the WWC to correct for clustering within classrooms or schools and for multiple comparisons. For an explanation about the
clustering correction, see the WWC Tutorial on Mismatch. See Technical Details of WWC-Conducted Computations for the formulas the WWC used to calculate statistical significance. In the case of Baker (1997), no corrections for clustering or multiple comparisons were needed. In the case of Hedges et al. (1986), the study reported that the analyses were conducted on the classroom level, so corrections for clustering were not needed; however, corrections for multiple comparisons were needed. In the case of Thompson et al. (2005), corrections for clustering and multiple comparisons were needed.
9. In Baker (1997), the mean difference was calculated using the difference in difference approach, which takes into account baseline differences; in this table, the comparison group mean is the posttest intervention group mean plus the absolute value of the mean difference.
10. The WWC-computed average effect sizes for each study and for the domain across studies are simple averages rounded to two decimal places. The average improvement indices are calculated from the average effect size.11. Means and standard deviations for the Problem-Solving and Understanding test were calculated by the WWC based on the means and standard deviations presented for the even and odd forms of this test, taking into account the
number of students who completed each type of form (see Appendix A4.2).
Appendix A3 Summary of study findings included in the rating for the mathematics achievement domain

11WWC Intervention Report Transition Mathematics March 12, 2007
Appendix A4.1 Summary of subgroup findings for the mathematics achievement domain1
Author’s findings from the study
WWC calculationsMean outcome
(standard deviation2)
Outcome measureStudy
sample
Sample size (schools/ students)
Transition Mathematics
groupComparison
group
Mean difference3
(Transition Mathematics – comparison) Effect size4
Statistical significance5
(at α = 0.05)Improvement
index6
Hedges et al., 1986 (quasi-experimental design)7
High School Subjects Test: General Mathematics
Grades 7–9 (using calculators)
40/232 29.86 (6.55)
26.46 (7.20)
3.39 0.49 Statistically significant
+19
High School Subjects Test: General Mathematics
Grades 7–9 (without
calculators)8
40/574 24.59 (8.06)
24.61 (7.70)
–0.02 0.00 ns +0
ns = not statistically significant
1. This appendix presents subgroup findings for measures that fall in the mathematics achievement domain. Total scores for the entire sample were used for rating purposes and are presented in Appendix A3.2. The standard deviation across all students in each group shows how dispersed the participants’ outcomes are: a smaller standard deviation on a given measure would indicate that participants had more similar outcomes. For Hedges et
al. (1986), the WWC requested and received from the first study author posttest standard deviations.3. Positive differences and effect sizes favor the intervention group; negative differences and effect sizes favor the comparison group.4. For an explanation of the effect size calculation, see Technical Details of WWC-Conducted Computations.5. Statistical significance is the probability that the difference between groups is a result of chance rather than a real difference between the groups.6. The improvement index represents the difference between the percentile rank of the average student in the intervention condition and that of the average student in the comparison condition. The improvement index can take on values
between –50 and +50, with positive numbers denoting results favorable to the intervention group.7. The level of statistical significance was reported by the study authors or, where necessary, calculated by the WWC to correct for clustering within classrooms or schools (corrections for multiple comparisons were not done for findings
not included in the overall intervention rating). For an explanation about the clustering correction, see the WWC Tutorial on Mismatch. See Technical Details of WWC-Conducted Computations for the formulas the WWC used to calculate statistical significance. In the case of Hedges et al. (1986), no correction for clustering was needed.
8. Students without calculators did not have personal calculators and were not provided calculators by the school.

12WWC Intervention Report Transition Mathematics March 12, 2007
Appendix A4.2 Summary of additional findings for the mathematics achievement domain1
Author’s findings from the study
WWC calculationsMean outcome
(standard deviation2)
Outcome measureStudy
sample
Sample size (schools/ students)
Transition Mathematics
groupComparison
group
Mean difference3
(Transition Mathematics – comparison) Effect size4
Statistical significance5
(at α = 0.05)Improvement
index6
Thompson et al., 2005 (quasi-experimental design)7
Problem-Solving and Understanding test: odd form
Grades 7–9 4/47 3.95 (2.48)
3.72 (3.34)
0.23 0.08 ns +3
Problem-Solving and Understanding test: even form
Grades 7–9 4/46 4.10 (3.50)
2.20 (2.60)
1.90 0.61 ns +23
ns = not statistically significant
1. This appendix presents findings for the even form and odd form versions of the Problem-Solving and Understanding test reported in Thompson et al. (2005). Aggregated scores across forms were used for rating purposes and are pre-sented in Appendix A3.
2. The standard deviation across all students in each group shows how dispersed the participants’ outcomes are: a smaller standard deviation on a given measure would indicate that participants had more similar outcomes.3. Positive differences and effect sizes favor the intervention group; negative differences and effect sizes favor the comparison group.4. For an explanation of the effect size calculation, see Technical Details of WWC-Conducted Computations.5. Statistical significance is the probability that the difference between groups is a result of chance rather than a real difference between the groups.6. The improvement index represents the difference between the percentile rank of the average student in the intervention condition and that of the average student in the comparison condition. The improvement index can take on values
between –50 and +50, with positive numbers denoting results favorable to the intervention group.7. The level of statistical significance was reported by the study authors or, where necessary, calculated by the WWC to correct for clustering within classrooms or schools (corrections for multiple comparisons were not done for findings
not included in the overall intervention rating). For an explanation about the clustering correction, see the WWC Tutorial on Mismatch. See Technical Details of WWC-Conducted Computations for the formulas the WWC used to calculate statistical significance. In the case of Thompson et al. (2005), correction for clustering was needed.

13WWC Intervention Report Transition Mathematics March 12, 2007
Appendix A5 Transition Mathematics rating for the mathematics achievement domain
The WWC rates an intervention’s effects in a given outcome domain as positive, potentially positive, mixed, no discernible effects, potentially negative, or negative.1
For the outcome domain of mathematics achievement, the WWC rated Transition Mathematics as having mixed effects. It did not meet the criteria for positive or
potentially positive effects because one study showed a substantively important negative effect. Further, it did not meet the criteria for negative or potentially negative
effects because one study showed a statistically significant positive effect. The remaining rating (no discernible effects) was not considered because Transition Math-
ematics was assigned the highest applicable rating.
(continued)
Rating received
Mixed effects: Evidence of inconsistent effects as demonstrated through either of the following criteria.
• Criterion 1: At least one study showing a statistically significant or substantively important positive effect, and at least one study showing a statistically significant
or substantively important negative effect, but no more such studies than the number showing a statistically significant or substantively important positive effect.
Met. One study showed a substantively important negative effect, and one study showed a statistically significant positive effect. One study
showed indeterminate effects.
• Criterion 2: At least one study showing a statistically significant or substantively important effect, and more studies showing an indeterminate effect than showing
a statistically significant or substantively important effect.
Not met. One study showed a substantively important negative effect, and one study showed a statistically significant positive effect. Only one
study showed indeterminate effects.
Other ratings considered
Positive effects: Strong evidence of a positive effect with no overriding contrary evidence.
• Criterion 1: Two or more studies showing statistically significant positive effects, at least one of which met WWC evidence standards for a strong design.
Not met. The one study that showed a statistically significant positive effect did not use a strong design.
• Criterion 2: No studies showing statistically significant or substantively important negative effects.
Not met. One study showed a substantively important negative effect.
Potentially positive effects: Evidence of a positive effect with no overriding contrary evidence.
• Criterion 1: At least one study showing a statistically significant or substantively important positive effect.
Met. One study that met WWC standards with reservations showed a statistically significant positive effect.
• Criterion 2: No studies showing a statistically significant or substantively important negative effect and fewer or the same number of studies showing indeterminate
effects than showing statistically significant or substantively important positive effects.
Not met. One study showed a substantively important negative effect.

14WWC Intervention Report Transition Mathematics March 12, 2007
Appendix A5 Transition Mathematics rating for the mathematics achievement domain (continued)
Potentially negative effects: Evidence of a negative effect with no overriding contrary evidence
• Criterion 1: At least one study showing a statistically significant or substantively important negative effect.
Met. One study showed a substantively important negative effect.
• Criterion 2: No studies showing a statistically significant or substantively important positive effect, or more studies showing statistically significant or substantively
important negative effects than showing statistically significant or substantively important positive effects.
Not met. One study showed a statistically significant positive effect.
Negative effects: Strong evidence of a negative effect with no overriding contrary evidence.
• Criterion 1: Two or more studies showing statistically significant negative effects, at least one of which met WWC evidence standards for a strong design.
Not met. No studies showed a statistically significant negative effect, and no studies met WWC evidence standards for a strong design.
• Criterion 2: No studies showing statistically significant or substantively important positive effects.
Not met. One study showed a statistically significant positive effect.
1. For rating purposes, the WWC considers the statistical significance of individual outcomes and the domain level effect. The WWC also considers the size of the domain level effect for ratings of potentially positive or potentially negative effects. See the WWC Intervention Rating Scheme for a complete description.