microwave frequency measurement based on an optically
TRANSCRIPT
IEEE PHOTONICS TECHNOLOGY LETTERS, VOL. 32, NO. 23, DECEMBER 1, 2020 1485
Microwave Frequency Measurement Based on anOptically Injected Semiconductor Laser
Bowen Zhang , Dan Zhu , Member, IEEE, Hao Chen, Yuewen Zhou, and Shilong Pan , Senior Member, IEEE
Abstract— A microwave frequency measurement system utiliz-ing the optical injection technology in a semiconductor laser isproposed. A single-wavelength optical carrier is generated anddivided into two parts. One part is intensity-modulated by acontrol signal with a triangular shape and then injected intoa semiconductor laser to generate a frequency scanning opticalsideband. The other part is modulated by the microwave signalunder test, which is then coupled with the frequency scanningoptical sideband and detected by a photodetector (PD). Theoutput of the PD is filtered by an electrical passband filterand detected by an envelope detector. Electrical pulses will beobtained with the time interval proportional to the microwavefrequency. Thus the microwave frequency can be retrieved fromthe time interval of the generated pulses. A proof of conceptexperiment is taken. The microwave frequency measurementfrom 3 to 40 GHz is achieved, and the frequency measurementerrors are within ±30 MHz.
Index Terms— Microwave frequency measurement, opticalinjection, semiconductor laser.
I. INTRODUCTION
M ICROWAVE frequency measurement plays an impor-tant role in many applications, e.g., electronic warfare,
radar, wireless communication systems [1]–[3]. Convention-ally, microwave frequency can be identified by electricalmethods [4], but the measurement speed and bandwidth areusually limited. To solve these problems, photonic approachesmapping the microwave frequency into time domain have beenproposed for the microwave frequency measurement [5]–[15].One typical method is based on the time-division multiplex-ing (TDM) technique, which is usually performed using afrequency-shifted loop [5]–[7]. After electro-optical modula-tion and several rounds in the loop, the optical carrier and thefrequency-shifted sideband are combined and photodetected,generating a down-converted microwave signal. Utilizing thetemporal position of the generated signal, the microwavefrequency can be obtained. However, the operation time willincrease with the measured bandwidth.
To realize a fast frequency measurement, real-time Fouriertransformation (RTFT) is proposed [8]–[11], which can beimplemented using a dispersion element assisted with a time
Manuscript received September 10, 2020; revised October 17, 2020;accepted October 26, 2020. Date of publication November 3, 2020; date ofcurrent version November 17, 2020. This work was supported in part by theNational Natural Science Foundation of China under Grant 61971222 andin part by the Fundamental Research Funds for Central Universities underGrant NE2017002 and Grant NC2018005. (Corresponding authors: Dan Zhu;Shilong Pan.)
The authors are with the College of Electronic and Information Engineering,Nanjing University of Aeronautics and Astronautics, Nanjing 210016, China(e-mail: [email protected]; [email protected]).
Color versions of one or more figures in this article are available athttps://doi.org/10.1109/LPT.2020.3035694.
Digital Object Identifier 10.1109/LPT.2020.3035694
lens [9], [10]. However, the frequency resolution is usuallylimited by the dispersion value. Although an improved res-olution can be realized using a frequency-shifted feedbacklaser [11], it is hard to simultaneously achieve a large instan-taneous bandwidth and a high frequency resolution.
Another typical method is the photonics-based frequencyscanning measurement [12]–[15]. A narrow-band filter,of which the passband position is varying with time, is utilizedto filter the optical-carried microwave signal. A temporallyvarying optical power after the filter is generated, which isthe mapping of the microwave spectrum. The narrow-bandfilter can be implemented using a microwave photonic filterassisted by a linear frequency modulated signal (LFM) genera-tor [14], [15]. A high-speed digital-analog converter is requiredin [14] and the continuous measurement of the microwavefrequency is hard to realize in [15].
In this letter, utilizing the optical injection technology ina semiconductor laser, a microwave frequency measurementscheme is proposed. A single-wavelength optical carrier emit-ted from a master laser (ML) is divided into two parts.One part is intensity-modulated by a control signal with atriangular shape. By injecting the intensity-modulated opticalcarrier into a semiconductor slave laser (SL) working at theperiod-one state, a frequency scanning optical sideband isgenerated. The other part of the optical carrier is modulatedby the microwave signal under test, generating the opticalsignal sideband. The optical signal sideband and the frequencyscanning optical sideband are coupled together and detected bya PD. Then the electrical passband filtering and the envelopedetection are carried out, generating the electrical pulses. Thefrequency of the signal under test will be retrieved from thetime interval of the generated pulses. As compared with [14],only a digital-analog converter with a sampling rate as lowas 2 GSa/s is required. In the experimental demonstration,a frequency measurement region of 3-40 GHz and frequencyerrors of ±30 MHz are realized. The frequency resolution aslow as 11 MHz can be realized with the help of a 20-MSa/soscilloscope.
II. PRINCIPLE AND EXPERIMENTAL RESULTS
Fig. 1 shows the scheme of our proposed system. An opticalcarrier with a frequency of f0 is emitted from the MLand divided into two parts. Via a Mach-Zehnder modulator(MZM1), the microwave signal under test, of which thefrequency is assumed to be fm , modulates one part of theoptical carrier. The first-order sideband is selected by anoptical bandpass filter (OBPF1), which performs the opticalsignal sideband and can be mathematically expressed as
Eup (t) = E1 exp [ j2π ( f0 + fm) t] (1)
where E1 represents the optical signal amplitude after OBPF1.The direct digital synthesizer (DDS) generates a control signal
1041-1135 © 2020 IEEE. Personal use is permitted, but republication/redistribution requires IEEE permission.See https://www.ieee.org/publications/rights/index.html for more information.
Authorized licensed use limited to: NANJING UNIVERSITY OF AERONAUTICS AND ASTRONAUTICS. Downloaded on December 04,2020 at 06:31:44 UTC from IEEE Xplore. Restrictions apply.
1486 IEEE PHOTONICS TECHNOLOGY LETTERS, VOL. 32, NO. 23, DECEMBER 1, 2020
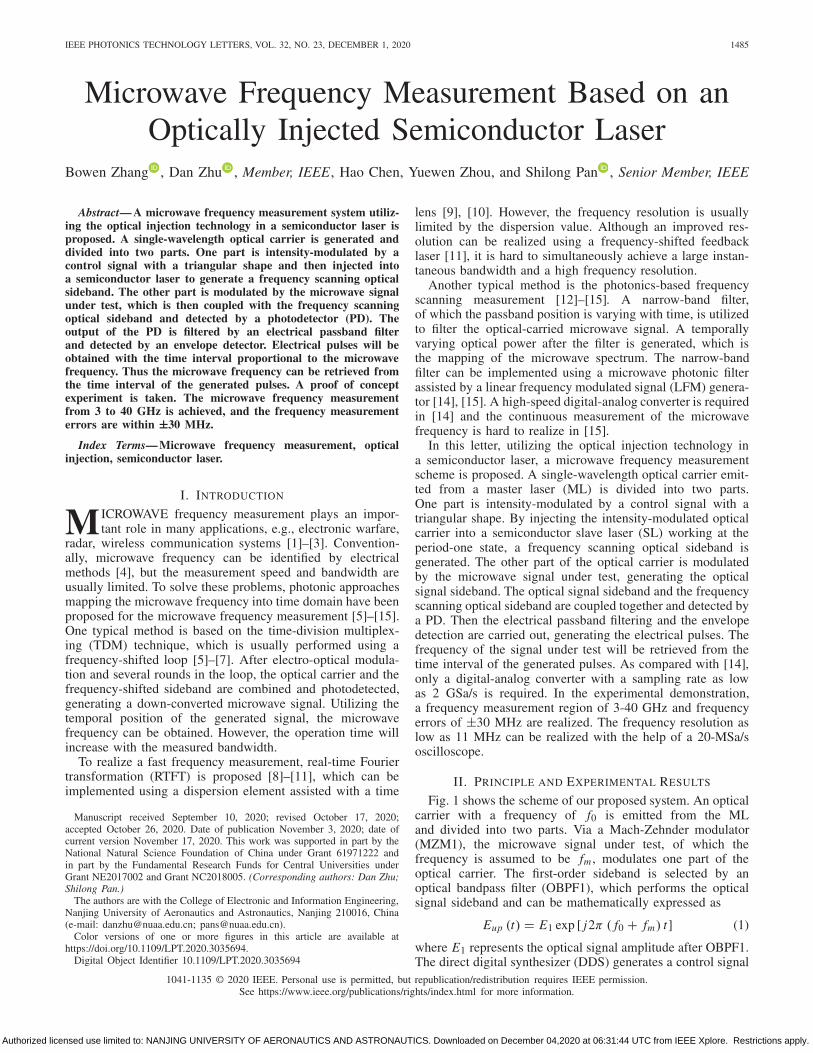
Fig. 1. Schematic configuration of the proposed system. ML, masterlaser; MZM, Mach–Zehnder modulator; OBPF, optical bandpass filter; PC,polarization controller; CIR, circulator; DDS, direct digital synthesizer; SL,slave laser; PD, photodetector; EBPF, electrical bandpass filter; ED, envelopedetector; RTOSC, real-time oscilloscope.
with a triangular shape, which is used to intensity-modulatethe other part of the optical carrier via MZM2. A polarizationcontroller (PC) is used to realize an optimal injection efficiencyof the SL, which works at the period-one state. The output ofthe SL is filtered by OBPF2 to remove the optical carrier. Thefrequency scanning optical sideband will be generated, whichcan be mathematically expressed as
Edown (t)
=
⟨E2 exp
{j2π
[(f0 + fc + 1
2fBW
)t + fBW
Ttrit2
]}
when − Ttri
2≤ t ≤ 0
E2 exp
{j2π
[(f0 + fc + 1
2fBW
)t − fBW
Ttrit2
]}
when 0 ≤ t ≤ + Ttri
2
(2)
where E2 is the amplitude of the optical signal, f0 + fc, fBW,
and Ttri are the central frequency, spectrum width, and periodof the frequency scanning optical sideband, respectively. It isworthy to note that f0 + fc, fBW, and Ttri are related tothe power of the injected optical signals, the half-wave volt-age (Vπ) of MZM2, and the waveform of the applied controlsignal [16].
The output of the two branches are combined and injectedinto a PD, with the electrical output as (3), shown at the bottomof the page.
As can be seen, a triangular LFM signal with the instanta-neous frequency of fc+0.5 fBW- fm+2 fBWt/Ttri during -Ttri ≤t ≤0 and fc+0.5 fBW- fm -2 fBWt/Ttri during 0 ≤ t ≤ Ttri isgenerated. After passing through an electrical bandpass filter(EBPF, center frequency fIF, bandwidth δ fIF) and an envelope
detector, the output signal can be expressed as
Eout (t) = δ
[t − fm + f I F − ( fc + 0.5 fBW)
2 fBWTtri
]
+ δ
[t + fm + f I F − ( fc + 0.5 fBW)
2 fBWTtri
](4)
where δ(t) represents the temporal envelope of the generatedpulse and is related to the frequency response of EBPF.The two pulses have a microwave frequency-dependent timeinterval, which can be expressed as
�τ = ( fc + 0.5 fBW) − ( fm + f I F )
fBWTtri (5)
Thus the microwave frequency under test is mapped intotime domain with a mapping factor of Ttri/ fBW. By analyzingthe temporal output signal, the microwave frequency can beestimated.
III. EXPERIMENTAL RESULTS AND DISCUSSION
Based on the analysis above, an experiment is conducted.A tunable laser diode (Agilent N7714A) is used as the ML.MZM1 (Fujitsu FTM7938EZ, 40-GHz bandwidth, 4-V Vπ)is driven by the signal under test from a microwave signalgenerator (Agilent E8267D, 250 kHz-67 GHz) and MZM2(Lucent 2623NA, 10-GHz bandwidth, 3.5-V Vπ) is driven bya control signal with a triangular shape from a 2-GSa/s DDS(Agilent 81150A). A distributed feedback semiconductor laser(Actech LD15DM) is used as the SL. The bandwidth of thePD is 30 GHz. The central frequency and the bandwidth ofthe EBPF are 10 GHz and 11 MHz, respectively. Two OBPFs(Yenista XTM-50, out-of-band suppression ratio larger than40 dB) are used to remove the optical carriers in the upper andlower branches. The envelope detector (ED, Agilent 8474C)has a working frequency range of 10 MHz-33 GHz. The real-time oscilloscope (RTOSC, Keysight DSO-X 92504A) has atunable sampling rate up to 80 GSa/s.
Firstly, an optical carrier with a wavelength of 1543.839 nmand a power of 16 dBm is emitted from the ML. After passingthrough MZM2, the PC and the circulator, the optical powerinjected into the SL is about 6 dBm. The wavelength of thefree-running SL is 1543.932 nm, thus the frequency detuningis 0.093 nm. When MZM2 is not driven by any signal,the spectrum of the signal after the PC is measured by an opti-cal spectrum analyzer (APEX AP2040D, resolution 0.04 pm)and plotted in Fig. 2(a). Meanwhile, the optical spectra of theSL without and with injection are also plotted in Fig. 2(a).The frequency spacing of the longitudinal modes shown asthe blue curve in Fig. 2(a) is about 0.18 nm (corresponding tothe period-one frequency). When MZM2 is driven by a control
E P D (t) = ηP D∣∣Eup (t) + Edown (t)
∣∣2
=
⟨ηP D
(E2
1 + E22 + 2E1 E2 cos 2π
[(fc + 1
2fBW − fm
)t + fBW
Ttrit2
])
when − Ttri
2≤ t ≤ 0
ηP D
(E2
1 + E22 + 2E1 E2 cos 2π
[(fc + 1
2fBW − fm
)t − fBW
Ttrit2
])
when 0 ≤ t ≤ + Ttri
2
(3)
Authorized licensed use limited to: NANJING UNIVERSITY OF AERONAUTICS AND ASTRONAUTICS. Downloaded on December 04,2020 at 06:31:44 UTC from IEEE Xplore. Restrictions apply.
ZHANG et al.: MICROWAVE FREQUENCY MEASUREMENT BASED ON AN OPTICALLY INJECTED SEMICONDUCTOR LASER 1487
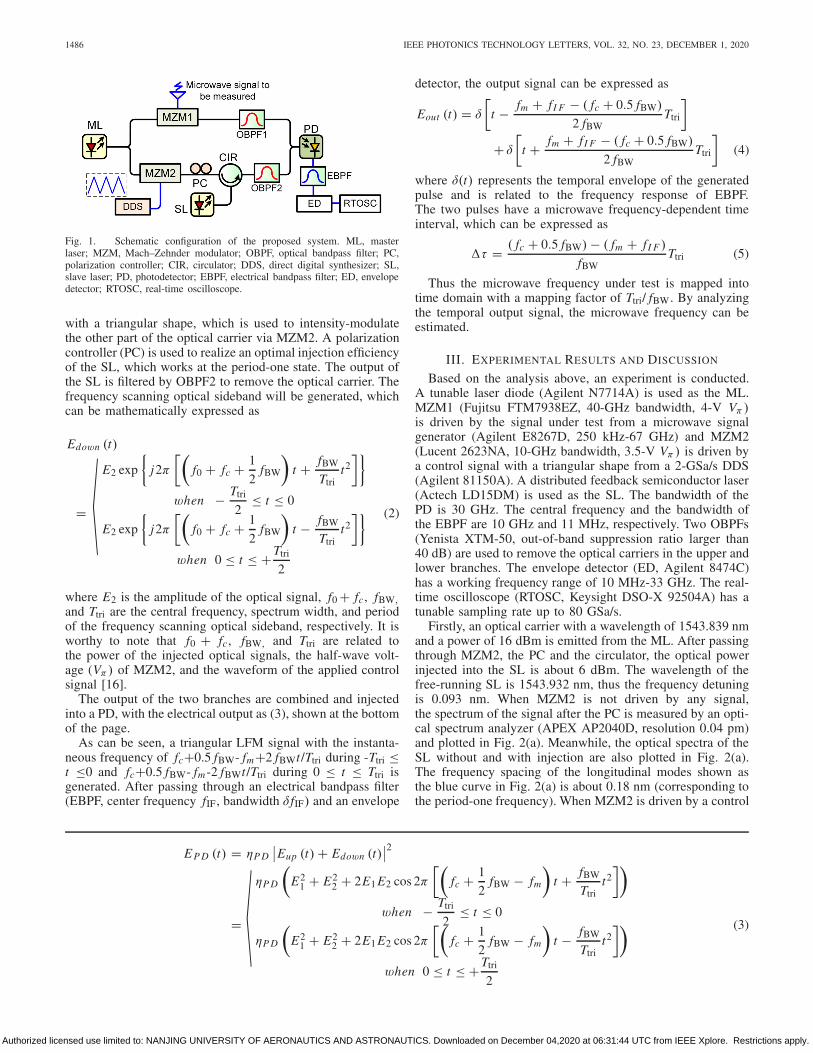
Fig. 2. (a) Optical spectra of the injecting light (black dashed curve), the SLwithout injection (red curve), and the SL with injection (blue curve). (b) Theoptical spectrum of the SL with injection when a control signal is applied,and (c) the waveform, (d) time-frequency diagram of the correspondinglygenerated electrical signal.
Fig. 3. (a) The experimental measurement result of a 10-GHz signal.(b) The measured time interval value of the two generated pulses versus themicrowave frequency value tuning from 3 to 13 GHz.
signal with a triangular shape, of which the voltage varies from-1.8 V to 0.7 V and the period is 10 μs, the optical spectrumof the SL with injection is shown in Fig. 2(b). To observethe frequency scanning optical sideband, the optical signalbefore the OBPF2 is sent to the PD. The generated signal iscaptured by the RTOSC and plotted in Fig. 2(c). The processof time-frequency analysis for the generated signal is carriedout to obtain the instantaneous frequency, which is shownin Fig. 2(d). A frequency scanning optical sideband with aspectrum width of 11 GHz (12.1-23.1 GHz) and a periodof 10 μs is generated.
Then a 10-GHz signal with a 10-dBm power is used todrive MZM1. By setting the sampling rate of the RTOSC tobe 100 MSa/s, the output waveform of the system is recordedand plotted in Fig. 3(a). A 2.81-μs time interval of the twogenerated pulses is observed, which is consistent with (5).The measurement region of the microwave frequency is fromfc-0.5 fBW + fIF to fc+0.5 fBW + fIF, which is 2.1-13.1 GHzin this experiment. By adjusting the microwave frequency from3 to 13 GHz with a spacing of 1 GHz, different time intervalvalues of the two pulses are measured and shown in Fig. 3(b).
It is worthy to note that (4) is obtained on the condi-tion that fc+0.5 fBW- fm±2 fBWt/Ttri = fIF. In fact, dueto the square-law detection of the PD, when fc+0.5 fBW-fm±2 fBWt /Ttri = − fIF, two pulses can also be observed in
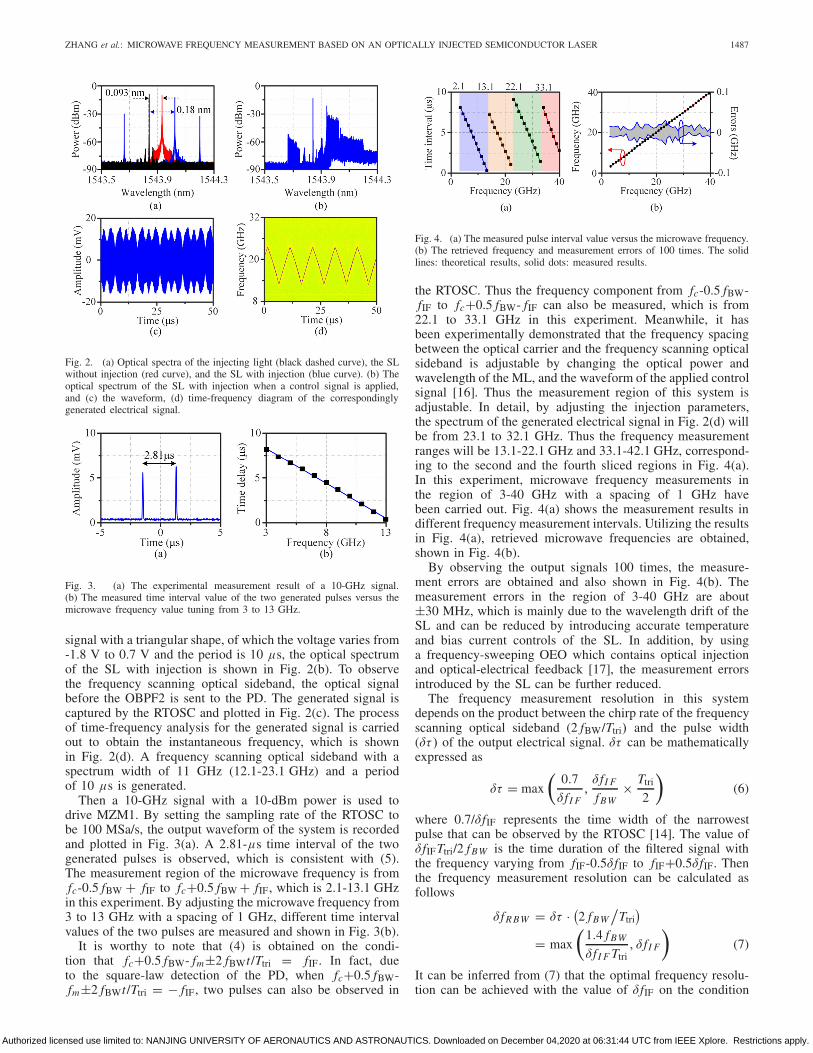
Fig. 4. (a) The measured pulse interval value versus the microwave frequency.(b) The retrieved frequency and measurement errors of 100 times. The solidlines: theoretical results, solid dots: measured results.
the RTOSC. Thus the frequency component from fc-0.5 fBW-fIF to fc+0.5 fBW- fIF can also be measured, which is from22.1 to 33.1 GHz in this experiment. Meanwhile, it hasbeen experimentally demonstrated that the frequency spacingbetween the optical carrier and the frequency scanning opticalsideband is adjustable by changing the optical power andwavelength of the ML, and the waveform of the applied controlsignal [16]. Thus the measurement region of this system isadjustable. In detail, by adjusting the injection parameters,the spectrum of the generated electrical signal in Fig. 2(d) willbe from 23.1 to 32.1 GHz. Thus the frequency measurementranges will be 13.1-22.1 GHz and 33.1-42.1 GHz, correspond-ing to the second and the fourth sliced regions in Fig. 4(a).In this experiment, microwave frequency measurements inthe region of 3-40 GHz with a spacing of 1 GHz havebeen carried out. Fig. 4(a) shows the measurement results indifferent frequency measurement intervals. Utilizing the resultsin Fig. 4(a), retrieved microwave frequencies are obtained,shown in Fig. 4(b).
By observing the output signals 100 times, the measure-ment errors are obtained and also shown in Fig. 4(b). Themeasurement errors in the region of 3-40 GHz are about±30 MHz, which is mainly due to the wavelength drift of theSL and can be reduced by introducing accurate temperatureand bias current controls of the SL. In addition, by usinga frequency-sweeping OEO which contains optical injectionand optical-electrical feedback [17], the measurement errorsintroduced by the SL can be further reduced.
The frequency measurement resolution in this systemdepends on the product between the chirp rate of the frequencyscanning optical sideband (2 fBW/Ttri) and the pulse width(δτ ) of the output electrical signal. δτ can be mathematicallyexpressed as
δτ = max
(0.7
δ f I F,δ fI F
fBW× Ttri
2
)(6)
where 0.7/δ fIF represents the time width of the narrowestpulse that can be observed by the RTOSC [14]. The value ofδ fIFTtri/2 fBW is the time duration of the filtered signal withthe frequency varying from fIF-0.5δ fIF to fIF+0.5δ fIF. Thenthe frequency measurement resolution can be calculated asfollows
δ fR BW = δτ · (2 fBW/
Ttri)
= max
(1.4 fBW
δ f I F Ttri, δ fI F
)(7)
It can be inferred from (7) that the optimal frequency resolu-tion can be achieved with the value of δ fIF on the condition
Authorized licensed use limited to: NANJING UNIVERSITY OF AERONAUTICS AND ASTRONAUTICS. Downloaded on December 04,2020 at 06:31:44 UTC from IEEE Xplore. Restrictions apply.

1488 IEEE PHOTONICS TECHNOLOGY LETTERS, VOL. 32, NO. 23, DECEMBER 1, 2020
Fig. 5. (a) Pulse width (δτ ) of the output electrical signal and (b) thetheoretical frequency resolution versus the time duration Ttri of the controlsignal. Solid dots: experimental results, blue curve: simulated theoreticalresults.
Fig. 6. System outputs of a two-tone signal with a frequency differenceof 11 MHz (10 and 10.011 GHz). (a) Sampling rate 100 MSa/s. (b) Samplingrate 20 MSa/s.
that Ttri >1.4 fBW /δ f 2IF. To demonstrate this, in the experiment,
fBW and δ fIF are set to be 11 GHz and 11 MHz, respectively.Fig. 5(a) shows the experimentally obtained pulse width values(δτ ) of the output electrical signals by tuning Ttri of the appliedcontrol signal, as shown in solid dots. The corresponding fre-quency resolution values are also calculated according to (7),as shown in solid dots in Fig. 5(b). Meanwhile, the theoreticalresults are also calculated according to (6) and (7), as shownin Fig. 5(a) and Fig. 5(b) in blue curves. As can be seen, theexperimental results agree well with the theoretical analyses.In addition, from Fig. 5 (b), it can be seen that with theincreasing of the Ttri value, the system resolution is limitedto about 11 MHz (the bandwidth δ fIF of the EBPF), whichalso agrees well with the theoretical analyses.
To further verify this, an experiment is carried out withTtri being set as 200 μs. A two-tone signal with a frequencydifference of 11 MHz (10 and 10.011 GHz) is used to driveMZM1. Fig. 6 (a) shows the system output. It can be seenthat the mapping results from this two-tone signals can beidentified, approving the frequency resolution of no more than11 MHz. The frequency resolution of this system can befurther improved utilizing an EBPF with a smaller bandwidth,simultaneously along with a larger period of the control signal.Besides, to observe the system output, the maximum samplinginterval must be less than 0.5δτ , which is 50 ns in thisexperiment. Therefore, the sampling rate of the RTOSC can beas low as 20 MSa/s. On this condition, when the same two-tonemicrowave signal is applied, the system output is recorded andplotted in Fig. 6 (b), which shows a great consistence with
Fig. 6 (a). This required sampling rate of the RTOSC canbe reduced using an electrical triangular control signal with alarger time duration.
IV. CONCLUSION
In this letter, we propose and experimentally demonstrate amicrowave frequency measurement scheme utilizing the opti-cal injection technology in a semiconductor laser. Microwavefrequency measurement form 3 to 40 GHz is realized. Mea-surement errors are within ±30 MHz. A frequency resolutionno larger than 11 MHz has been realized using an RTOSC witha sampling rate as low as 20 MSa/s. This scheme provides apossible solution to modern spectrum measurement system.
REFERENCES
[1] C.-H. Cheng, D. M. Lin, L. L. Liou, and J. B. Tsui, “Electronic warfarereceiver with multiple FFT frame sizes,” IEEE Trans. Aerosp. Electron.Syst., vol. 48, no. 4, pp. 3318–3330, Oct. 2012.
[2] D. Zhu and S. Pan, “Broadband cognitive radio enabled by photonics,”J. Lightw. Technol., vol. 38, no. 12, pp. 3076–3088, Jun. 15, 2020.
[3] M. Agiwal, A. Roy, and N. Saxena, “Next generation 5G wirelessnetworks: A comprehensive survey,” IEEE Commun. Surveys Tuts.,vol. 18, no. 3, pp. 1617–1655, 3rd Quart., 2016.
[4] A. O. Benz et al., “A broadband FFT spectrometer for radio andmillimeter astronomy,” Astron. Astrophys., vol. 442, no. 2, pp. 767–773,Nov. 2005.
[5] T. A. Nguyen, E. H. W. Chan, and R. A. Minasian, “Photonic radiofrequency memory using frequency shifting recirculating delay linestructure,” J. Lightw. Technol., vol. 32, no. 1, pp. 99–106, Jan. 1, 2014.
[6] T. A. Nguyen, E. H. W. Chan, and R. A. Minasian, “Photonic multiplefrequency measurement using a frequency shifting recirculating delayline structure,” J. Lightw. Technol., vol. 32, no. 20, pp. 3831–3838,Oct. 15, 2014.
[7] H. Chen et al., “Photonics-assisted serial channelized radio-frequencymeasurement system with Nyquist-bandwidth detection,” IEEE Photon.J., vol. 6, no. 6, pp. 1–7, Dec. 2014.
[8] B. Zhang et al., “Impact of dispersion effects on temporal-convolution-based real-time Fourier transformation systems,” J. Lightw.Technol., vol. 38, no. 17, pp. 4664–4676, Sep. 1, 2020.
[9] R. Salem, M. A. Foster, and A. L. Gaeta, “Application of space-timeduality to ultrahigh-speed optical signal processing,” Adv. Opt. Photon.,vol. 5, pp. 274–317, Aug. 2013.
[10] C. Wang, “Dispersive Fourier transformation for versatile microwavephotonics applications,” Photonics, vol. 1, no. 4, pp. 586–612,Dec. 2014.
[11] H. G. de Chatellus, L. R. Ortés, and J. Azaña, “Optical real-time Fouriertransformation with kilohertz resolutions,” Optica, vol. 3, no. 1, pp. 1–8,2016.
[12] P. Ghelfi, F. Scotti, D. Onori, and A. Bogoni, “Photonics for ultraw-ideband RF spectral analysis in electronic warfare applications,” IEEEJ. Sel. Topics Quantum Electron., vol. 25, no. 4, pp. 1–9, Jul. 2019.
[13] S. Song et al., “Photonic-assisted scanning receivers for microwavefrequency measurement,” Appl. Sci., vol. 9, no. 2, p. 328, Jan. 2019.
[14] J. Shi, F. Zhang, D. Ben, and S. Pan, “Simultaneous radar detection andfrequency measurement by broadband microwave photonic processing,”J. Lightw. Technol., vol. 38, no. 8, pp. 2171–2179, Apr. 15, 2020.
[15] T. F. Hao, J. Tang, N. N. Shi, W. Li, N. H. Zhu, and M.Li, “Multiple-frequency measurement based on a Fourier domainmode-locked optoelectronic oscillator operating around oscillationthreshold,” Opt. Lett., vol. 44, no. 12, pp. 3062–3065, Jun. 2019.
[16] B. W. Zhang, D. Zhu, P. Zhou, C. X. Xie, and S. L. Pan, “Tunabletriangular frequency modulated microwave waveform generation withimproved linearity using an optically injected semiconductor laser,”Appl. Opt., vol. 58, no. 20, pp. 5479–5485, Jul. 2019.
[17] P. Zhou, F. Zhang, and S. Pan, “Generation of linearfrequency-modulated waveforms by a frequency-sweepingoptoelectronic oscillator,” J. Lightw. Technol., vol. 36, no. 18,pp. 3927–3934, Sep. 15, 2018.
Authorized licensed use limited to: NANJING UNIVERSITY OF AERONAUTICS AND ASTRONAUTICS. Downloaded on December 04,2020 at 06:31:44 UTC from IEEE Xplore. Restrictions apply.