microbial activity in granular activated carbon filters in
TRANSCRIPT

Microbial Activity in Granular Activated Carbon Filters in
Drinking Water Treatment
Aleksandra Knezev

Thesis commiTTee
Promotors Prof. Dr H. Smidt Personal chair, Laboratory of Microbiology Wageningen University
Prof. Dr D. van der Kooij Emeritus professor of Environmental MicrobiologyWageningen University
Other members Prof. Dr H.H.M. Rijnaarts, Wageningen UniversityProf. Dr H.J. Albrechtsen, Technical University of Denmark, DenmarkProf. Dr L.C. Rietveld, Delft University of Technology, NetherlandsProf. Dr W. Uhl, TU, Dresden, Germany
This research was conducted under the auspices of the Graduate School ‘SENSE’: Research School for Socio-Economic and Natural Sciences of the Environment

Aleksandra Knezev
Thesis
submitted in fulfilment of the requirements for the degree of doctorat Wageningen University
by the authority of the Rector MagnificusProf. Dr M.J. Kropff,
in the presence of theThesis Committee appointed by the Academic Board
to be defended in publicon Friday 27 February 2015
at 1.30 p.m. in the Aula.
Microbial Activity in Granular Activated Carbon Filters in
Drinking Water Treatment

Aleksandra KnezevMicrobial Activity in Granular Activated Carbon Filters in Drinking Water Treatment 160 pages. PhD thesis, Wageningen University, Wageningen, NL (2015) With references, with summaries in Dutch and English ISBN 978-94-6257-244-7

CHAPTER 1General introduction 7
CHAPTER 2oPtiMiSation and SiGniFicance oF atP analYSiS For MeaSurinG actiVe BioMaSS in
Granular actiVated carBon FilterS uSed in Water treatMent 31
CHAPTER 3Polaromonas and HydrogenoPHaga SPecieS are the PredoMinant Bacteria
cultured FroM Granular actiVated carBon FilterS in Water treatMent 47
CHAPTER 4identitY oF Bacteria PredoMinatinG in Granular actiVated carBon FilterS For
drinKinG Water treatMent 63
CHAPTER 5nutritional VerSatilitY oF tWo Polaromonas StrainS iSolated FroM Granular
actiVated carBon FilterS 91
CHAPTER 6Polaromonas aS Model For analYzinG the MicroBial utilization oF natural
orGanic Matter in Granular actiVated carBon FilterS in Water treatMent 103
CHAPTER 7General diScuSSion 129
SUPPLEMENTSSuMMarY SaMenVattinG acKnoWledGeMentS aBout the author PuBlication liSt diPloMa For SPecialiSed Phd traininG
CONTENTS


1General introduction
CHAPTER

8 Microbial activity in GAC filters in drinking water treatment
1.1 Background
Water treatment is needed to produce drinking water from sources contaminated with patho-genic micro-organisms, anthropogenic chemicals and/or containing an elevated concentra-tion of natural organic matter (NOM) and/or inorganic compounds impacting drinking water quality, both from a public health point of view and/or its aesthetic appreciation, e.g. colour, taste, odour and turbidity. In the Netherlands, water treatment aiming at the removal of such constituents includes multiple barriers, e.g. coagulation/sedimentation, filtration, oxida-tion and disinfection. Granular activated carbon (GAC) filtration has become a main barrier in surface-water treatment for the removal of organic contaminants, but also removes NOM, including humic and fulvic acids and biodegradable compounds. This thesis describes inves-tigations on microbiological processes in these GAC filters (GACFs). The general introduction provides information about (i) the application of GAC filtration in water treatment, (ii), GAC characteristics, (iii) bacterial attachment and growth, (iv) microbial activity in GACFs, and (v) the objectives and aims of the studies described in this thesis.
1.2 Biological filTraTion in waTer TreaTmenT
1.2.1 Function and operational conditionsIn the Netherlands, two thirds of drinking water is produced from groundwater and one third from surface water (rivers and lakes). Biological filtration processes, including soil passage (e.g. river-bank filtration, dune infiltration), rapid sand filtration (RSF), dual-media filtration (DMF), slow sand filtration (SSF) and GAC filtration, are applied in water treatment for the removal of biodegradable compounds. One or more of these processes are applied at different stages in the water treatment train, depending on the origin and composition of the source wa-ter and national regulations and traditions related to water treatment and water quality. Bio-logical filtration processes differ in the operational conditions (empty bed contact time, flow rate, frequency of backwashing, and frequency of regeneration in the case of GACFs). All these conditions and the nature of the filter material have an impact on the intensity and effects of the microbiological activity in the filter bed.
RSFs are usually positioned at the beginning of the treatment train. In groundwater treatment RSFs are positioned after the aeration where they serve the removal of iron and manganese oxides, suspended solids and ammonia (nitrification). In surface-water treatment RSF or DMF are applied after flocculation or coagulation and sedimentation for the removal of suspended solids and are also often operated as biological filters for the removal of ammonium and bio-degradable organic matter, including precursors for disinfection by-products (LeChevallier et al. 1992; Carlson and Amy 1998; Huck et al. 1994). Frequent backwashing (within several days) is necessary to remove particulate material and biomass that is accumulated in the filter bed, causing pressure drop.
SSFs are usually positioned at the end of treatment as a polishing step for the removal of tur-bidity and pathogenic microorganisms and biodegradable compounds. SSFs operate at much lower hydraulic and organic loading rates, and instead of backwashing the surface layer of

9Chapter 1 General introduction
a SSF, also known as ‘Schmutzdecke’, is removed at a certain pressure drop or a certain time interval that is usually very long (months or years).
1.2.2 Biological stability of drinking waterBiological filtration processes can serve as a barrier against faecal contamination, in particular during soil passage, but play a major role in the removal of biodegradable organic compounds. These compounds are present in the raw water, but are also produced by oxidation processes applied in water treatment for the removal of anthropogenic organic compounds, e.g. ozona-tion (Servais et al. 2005). Removal from water is needed to prevent microbial growth in the distribution system (regrowth). Distribution of biologically instable water can cause various problems, such as noncompliance to water quality regulations (heterotrophic plate counts, coliforms), growth of opportunistic pathogenic microorganisms (Legionella pneumophila, Pseu-domonas aeruginosa or certain nontuberculous mycobacteria), growth of free-living protozoa, fungi, invertebrates, discoloration and taste and odour problems (van der Kooij and van der Wielen 2014). In the Netherlands, drinking water is distributed without a disinfectant residu-al, and therefore the water supply companies aim at achieving treated water with a high level of biological stability.
Biological stability is related to the concentration of compounds that can support bacterial growth in drinking water, i.e. the microbial growth potential (van der Kooij 1992; van der Kooij and Veenendaal 2014; LeChevallier et al. 1991, LeChevallier 2014; Servais et al. 1991; Laurent et a. 2005). Such compounds are present in water leaving the treatment plants, either as dissolved or particulate organic carbon and biomass, but may also originate from the accu-mulated sediments or from the pipe materials (Schoenen 1986; Colbourne 1985; van der Kooij and Veenendaal 2001). A variety of methods are available for measurement of the microbial growth potential of water. The assimilable organic carbon (AOC) test measures the concentra-tion of compounds promoting the growth of two bacterial cultures in samples of pasteurized water. The AOC concentration is calculated from the maximum colony counts of these bacteria and expressed as acetate-carbon equivalents L-1, based on the yield factor of the test organisms for acetate (van der Kooij et al. 1982; van der Kooij 1992). Large databases of the AOC concen-tration in treated water in the Netherlands and in the USA are available (van der Kooij 1992; van der Kooij and Veenendaal 2014; Lechevallier et al. 1992). The concentration of biodegrad-able organic carbon (BDOC) can be measured as the difference between the initial and final DOC concentration after incubation with a mixed population in a static or dynamic test (Joret and Levi 1985; Servais et al. 1987; Kaplan et al. 1996).
Threshold levels for the concentration of AOC and BDOC in treated water have been proposed to define the treatment goals aiming at limiting regrowth in the distribution system. Van der Kooij (1992) showed that drinking water complied with the standard for the heterotrophic plate count (HPC) at an AOC concentration < 10 µg acetate-C eq L-1. Below this concentra-tion, no decrease of the AOC concentration was observed in the distribution system. However, growth of Legionella was observed in biofilms in an installation that was fed with drinking water containing c. 5 µg acetate-C eq L-1 (van der Kooij et al. 2005). LeChevallier et al. (1991) proposed AOC levels below 50 µg acetate C eq L-1 for controlling coliform regrowth. For the BDOC fraction a threshold for biological stability was set at 0.15-0.30 mg L-1 (Servais et al.
10 Microbial activity in GAC filters in drinking water treatment
1991; Joret et al. 1994). The extend of microbial growth in distribution systems is also affected by e.g. water temperature, residence time, pipe materials and sediment formation.
1.3 granular acTivaTed carBon filTraTion in waTer TreaTmenT
1.3.1 Position and role of GACFUntil 1960 mainly powdered activated carbon (PAC) was used in drinking water treatment for the removal of taste, colour and odour. Industrial and technological developments resulted in the large-scale production of a large variety of synthetic organic compounds that entered the aquatic environment and contaminated drinking water sources. Confronted with the pres-ence of toxic substances in source waters, the water supply companies installed new technolo-gies enabling the removal of these compounds. This development was also stimulated by the discovery of undesirable disinfection by-products (DBPs), such as trihalomethanes and other organohalogen compounds (Rook 1974). The application of GAC filtration was shown to be more effective in removing organic contaminants and precursors for DBP formation than PAC (Suffet 1980; Cairo et al. 1979; Anonymous 1980; Schalekamp 1979; Sontheimer et al. 1988; Snoeyink and Summers 1999). To date GAC is applied worldwide in drinking water treat-ment.
From studies conducted between 1960 and 1980 guidelines for the use of GAC filtration in drinking water treatment were set. It was shown that GAC filtration is most efficient when applied at the end of the treatment train to avoid frequent backwashing of the filter bed for the removal of accumulated particles. Consequently, conventional pre-treatment with coagu-lation, sedimentation and RSF or DMF before GACF was recommended (Sontheimer et al. 1988). The GACFs in the Netherlands are operated at empty bed contact times between 10 - 40 minutes at hydraulic loading rates between 2 – 30 m3m-2h-1 and organic loading rates in the range of 5 – 55 g C m-2h-1 (Vries et al. 2012). GACFs are usually operated in a down-flow mode to minimize damage of filter material and release of particulate matter, and in a single or dou-ble series, or as pseudo-moving bed reactors. Backwashing is carried out either at fixed time intervals, or at the occurrence of a certain pressure drop. Regeneration of GAC to restore its adsorptive capacity can be carried out after a fixed period of operation or after a breakthrough of a target contaminant (Sontheimer et al. 1988).
In the Netherlands about 1200 x 106 m3 of drinking water is produced annually. A total of 37.5% of this volume originates from fresh surface water and 62.5% comes from groundwater (Geudens 2012). Almost half (46 %) of this water is treated with GAC filtration, i.e. about 96% of the drinking water produced from surface water (430 x 106 m3) and approximately one fifth of the groundwater (132 x 106 m3), mainly at locations treating riverbank filtrate (25 locations, Vries et al. 2012).
GACFs are used for the removal of NOM, for colour and taste reduction, removal of micro-pollutants, often in combination with advanced oxidation, for the removal of oxidation by-products, for the removal of precursors for disinfection by- products in systems that apply chlo-

11Chapter 1 General introduction
rination and for the improvement of the biological stability of treated water (Sontheimer et al. 1988; Billen et al. 1992; Huck et al. 1994; Orlandini 1999; Snoeyink and Summers 1999). The release of particulate matter (Camper et al. 1985) and invertebrates from GACFs (Schreiber et al. 1997) may cause problems in distribution systems. In the Netherlands, slow sand filtration (SSF), microsieves, or UV is sometimes applied after GAC filtration to control HPC levels.
Removal of organic compounds by GAC filtration is primarily determined by the adsorption ca-pacity of GAC that depends on the nature of the raw material and the production process. The removal efficiency of GACFs depends also on the influent water quality, flow rate and contact time. These parameters are designed to achieve an optimal use of the adsorption capacity and attain long operational periods between the regenerations. Biological processes contribute to the overall removal of organic compounds in GACFs and are therefore considered as ben-eficial. The regeneration frequency of GAC usually depends on the threshold levels, usual for organic contaminants such as pesticides and pharmaceuticals, to maintain the desired effluent quality. When the removal of colour, taste, disinfection precursors, oxidation by-products or biological stability is the main focus, the concentration of NOM (DOC, TOC and UVA) is used to define the threshold levels (Graveland et al. 1994).
1.3.2 Characteristics of activated carbon The ability of activated carbon to remove organic compounds from water is based on the prop-erties of this material. These properties include: (i) a high specific surface area and (ii) specific chemical surface characteristics including hydrophobicity and presence of functional groups. The specific surface area varies between 400 and 1500 m2 g-1 and is a result of the high poros-ity of GAC. The shape, size, volume and surface area of the pores and their spatial distribution within the carbon particle characterize the porosity of GAC. These characteristics depend on the material from which the carbon is produced (bituminous coal, peat, lignite, petrol coke, wood and coconut shells). The diameter of the GAC particles applied in drinking water treat-ment generally ranges between 0.4 and 2.5 mm.
The internal structure of GAC is defined by crystallites similar to graphite (Fig. 1.1, left). The voids between the crystallites shape the micropores (<2 nm), which represent >99% of the internal surface area. The porous structure (Fig. 1.1, right) also comprises mesopores (2-50 nm) and macropores (>50 nm), representing a much smaller proportion of the internal surface. The surface of the micro- and mesopores and the volume distribution is determined from the amount of nitrogen required to form a complete monolayer on the carbon surface (Brunauer-Emmett-Teller (BET), Snoeyink and Summers 1999). Generally the BET surface is approximately 500 – 1000 m2 g-1 (Sontheimer et al. 1988; Bjelopavlic et al. 1999). The volume and surface distribution of the macropores and the mesopores is determined with mercury po-rosimetry. Typical curves of the cumulative pore volume show that mesopores occupy a small proportion of the internal particle surface c. 9% (81 m2 g-1 GAC), and that macropores occupy only c. 0.2 % (1.7 m2 g-1 GAC). The surface available for attachment of bacteria includes pores with radii > 500 nm, and occupies 0.008 % (0.070 m2 g-1 GAC) of the total adsorptive surface.

12 Microbial activity in GAC filters in drinking water treatment
The surface area within the pores determines the adsorption capacity. The adsorption capacity for low molecular weight compounds (< 1000 g mol-1) corresponds with the specific surface and volume of the micropores. The surface and volume of the mesopores and macropores determine the adsorption capacity for molecules ranging from 1000 to 70 000 g mol-1 (Kilduff et al. 1996; Newcombe et al. 1997; Thurman et al. 1982). Although the specific surface area of the macropores is small and contributes very little to the adsorption, the volume of mac-ropores is important for the diffusion process (Sontheimer et al. 1988). Furthermore, macro-pores with a radius larger than 500 nm (> 0.5 µm) are available for bacterial adhesion.
The adsorption properties of activated carbon are also determined by the chemical character-istics of the GAC surface, which is hydrophobic by its nature. Sorption of dissolved oxygen on GAC leads to the formation of acidic surface oxides, thus increasing the polarity of the carbon surface and the adsorption capacity for carboxylic acid groups (Prober et al., 1975; Sontheimer et al., 1988; Snoeyink and Summers 1999). Generally 5 to 20 % of the activated carbon weight consists of other elements than carbon, from which metals and surface-bond oxygen are most important (Snoeyink and Weber 1967; Sontheimer et al., 1988). Oxygen-containing functional groups on GAC include carboxylic and anhydrides of carboxylic acids, phenolic, pyrone and quinon type of carbonyl, lactone, benzopyrylium derivatives etc. (Sontheimer et al., 1988). Re-sults of some investigations indicate that the surface chemistry can be more important for the adsorption of NOM than the pore structure (Yapsakly et al. 2008). The occurrence of positive or negative charges on the surface of GAC is characterized by the point of zero charge (PZC) pH, which is the pH value at which the densities of positive and negative ions at the surface are equal. At a pH below PZC the surface is positively charged (acidophilic), and above PZC the surface is negatively charged (basophilic), the latter being the case for most GAC applications in water treatment. Furthermore, pH and ionic strength of the solution also affect the interac-tions between absorbate and the GAC surface (Bjelopavlic et al. 1999).
figure 1.1 a schematic representation of the crystal structure of graphite (left, adapted from amelinckx et al.
1965); B, a SeM image of the Gac surface (norit Gac 830) provided by cabot (2013).
Rhombohedral Stacking
A
A
C
B
1.0062mm

13Chapter 1 General introduction
1.3.3 Adsorption Adsorption is a process in which a molecule (adsorbate) from the liquid or gas phase is bound to the surface of a solid phase (adsorber) that is in contact with the liquid or gas. In case of physical adsorption van der Waal’s and electrostatic interactions are responsible for the partitioning of the adsorbate between two phases. Non-polar compounds or hydrophobic parts of complex mol-ecules are attracted to the lipophilic surface of GAC and regions of molecules with electrostatic charge are attracted to surface oxides with the opposite charge. Although physical adsorption is generally considered a reversible process (Moore 1972), desorption of complex molecules is unlikely to occur due to the multiple binding by different mechanisms (Bos et al. 1999). The ad-sorption may furthermore be a result of covalent interactions between adsorbate and adsorber. Chemisorpion is attributed to the presence of functional groups on activated carbon surface and is considered irreversible (Moore 1972). The desorption of adsorbed compounds requires an energy input equivalent to the energy of the bonds between adsorbate and surface. This energy input is achieved at high temperatures that are applied during thermal regeneration of GAC.
The adsorption process is described by the adsorption isotherm, the constant-temperature equilibrium relationship between the quantity of adsorbate per unit of adsorbent (qe) and its equilibrium solution concentration (Ce). Several equations or models are available that de-scribe this function, but the Freundlich and the Langmuir equations, are most frequently ap-plied. The Freundlich equation (1) is an empirical equation, and the theory of adsorption that leads to the Freundlich equation was developed by Halsey and Taylor (1947).
qe = KCe1/n (1)
The parameters qe and Ce are the equilibrium concentrations of a compound on surface and in solution, respectively. The parameter K is related to the capacity of the adsorbent for the ad-sorbate, and 1/n is a function of the strength of adsorption.
In the Langmuir equation (2),
qe = (2)
the constant qmax corresponds to the surface concentration at a monolayer coverage and rep-resents the maximum value of qe that can be achieved as Ce is increased (Langmuir 1918). The constant b is related to the strength of the adsorption bond.
During GAC filtration of water containing a mixture of compounds with different values of the adsorption parameters, the equilibrium concentration of a compound is affected by competi-tion. Sontheimet et al. (1985) developed a method for the analysis of the adsorption equilibria of multicomponent mixtures in GACFs. The large number of organic components are grouped into several pseudocomponents and adsorption competition within the mixture is assumed to obey the IAS-theory (Radke and Prausnitz 1972) or the SCA-model (Baldauf et al. 1977). Peel and Benedek (1980, 1983) developed a dual-rate kinetic model for the fixed-bed adsorber that explained two distinct stages during the approach to equilibrium in a GAC system by including the intraparticle kinetics to describe the behaviour of compounds in GACFs. In the first, fast
qmaxb1+bce

14 Microbial activity in GAC filters in drinking water treatment
adsorption stage, the external film diffusion and transfer of the adsorbate to the solid-phase are the main driving forces. However, at an increasing solid phase concentration the specific rate of adsorption decreases as a consequence of diffusion along the walls of the macropores (surface diffusion), and diffusion from macropores into the micropores. As a result, break-through of different components present in the influent occurs at varying degrees, depending on contact time and operational period.
1.4 naTural organic maTTer in waTer
The concentration of NOM in water used for the production of drinking water generally ranges from 0.5 to 5 mg L-1. NOM includes a large diversity of substances with different biodegradation kinetics (Billen 1992; Amon and Benner 1996; Frimmel 1998). Generally two groups of com-pounds are recognized: a low molecular weight fraction (< 1 kDa) and a fraction comprised of large complex biopolymers (> 1 kDa) such as proteins, polysaccharides and humic substances (HS). HS in surface and groundwater comprise the majority (60-80%) of NOM (Thurman et al. 1982; Newcombe et al. 1997; Aiken and Costaris 1995; Kilduf et al. 1996). The apparent molecu-lar weight of HS varies between a few hundred and several million Daltons (Choudhry 1984) containing c. 50% of carbon, 36-40% of oxygen, 3 – 4 % of hydrogen and 0.5-3 % of nitrogen (w/w) (Frimmel 1998). HS contains aromatic structures such as phenol or quinone bridged by ether (-O-), alkane (-CH2-), amine (-NH-), imine (-N=) or other groups (Camper 2004). For a long period it was generally accepted that HS are built from covalently-bound repeating units. In the period 1986-1999 the theory was challenged by the micelle concept (Wershaw 1986; 1999; von Wandruska 1988) followed by the supramolecular concept (Piccolo 2001; 2002; Sutton and Sposito 2005). According to the supramolecular concept the low-molecular-weight components (building blocks) are held together by non-covalent van der Waals forces and hydrogen bonds. Hence, reassembling of the supramolecular aggregates to reach the most stable thermodynamic conformation will occur with changing conditions. The building blocks of HS in freshwaters include a diversity of low-molecular-weight molecules (500 Da), from which a portion is repre-sented with biomolecules derived from lipids, lignin, nonlignin aromatic species, carbohydrates and proteins (Hoque et al. 2003; Reemtsma and Thesee 2003; Cooper et al., 2005; Hatcher et al. 2007; Seitzinger et al. 2005; Sutton and Sposito 2005).
The general perception is that low-molecular-weight organic compounds are degraded quickly while degradation of high-molecular-weight molecules requires more time (Saunders 1976; Hozalski and Bouwer 2001; Billen et al. 1992). Humic substances have long been considered as recalcitrant due to their ability to form complexes with extracellular enzymes that inhibit their activity (Wetzel, 1992). However, several studies have shown that bacteria in aquatic biofilms are capable of using humic substances (Amon and Benner 1996; Volk et al. 1997). More recently, it was demonstrated for drinking water that biofilms attached to corroding iron surfaces can utilize HS for bacterial growth (Camper 2004). Hence, under certain conditions, HS can serve as a carbon and energy source for growth of microorganisms.
Pre-treatment processes affect the concentration and nature of NOM in the influent of GACFs. Oxidative pre-treatment increases charge, polarity and the hydrophilic nature of NOM, while

15Chapter 1 General introduction
the biodegradation decreases the charge of NOM indicating that biodegradable NOM fraction has a more negative charge (Ypsalsky et al. 2009). Beside the humic compounds, NOM also contains low molecular weight (<500 Da) compounds including carboxylic acids, aldehydes, ketones and monomeric or oligomeric units of various biopolymers, such as amino acids, peptides or saccharides (Koudjonou et al. 2005). Most of the easily degradable low molecu-lar weight compounds are utilised in biological filtration in the conventional pre-treatment, but some is also present in the GAC influent. However, oxidative pre-treatment increases the concentration of easily assimilable organic carbon (van der Kooij et al. 1989; Carlson and Amy 1997). Various anthropogenic micropollutants (pesticides, pharmaceuticals, additives etc.) and their metabolites can also be present in water as individual compounds or in association with HS (Houtman 2010). The hydrophilic low-molecular-weight components generally are more susceptible to the microbial degradation than the hydrophobic fraction that in turn ad-sorbs better on the GAC surface. However, many anthropogenic hydrophilic, low molecular weight molecules are recalcitrant and are not removed in GACFs (Schoonenberg et al. 2010).
1.5 microBiological acTiviTy in gac filTer Beds
1.5.1 Attachment of bacteria to surfacesIn nature and in engineered systems such as water treatment processes and distribution systems, most microorganisms are present attached to water-exposed surfaces. The initial attachment of bacteria is a result of the physicochemical interactions controlled by van der Waals and electrostatic forces and is generally explained by the Derjaguin, Landau Verwey and Overbeek (DVLO) theory of colloidal stability (van Loosdrecht et al. 1990; Bos et al. 1999). The initially-reversible attachment is followed by the formation of extracellular polymers that irreversibly anchor the organism to the surface. This process is associated with the uptake of compounds from the water phase. The extracellular polymeric substances (EPS) are character-ized by hydrophobic, and charged hydrophilic moieties, ensuring binding to surfaces differing in hydrophobicity and charge. The irreversible nature of the attachment is due to the irrevers-ible nature of the adsorption of EPS. The extent of attachment is affected by both the nature of the organism and the nature of the surface. Thermodynamically, adsorption onto a hydro-phobic surface is most favourable, because of the reduction of the surface-free energies of both the microorganism and the involved surface.
Bacteria and other microorganisms also interact actively or passively with the surface of GAC in contact with water. These interactions lead to attachment, retention, and consequently to growth and maintenance of bacteria in GACFs. The extent of growth and maintenance de-pends on the availability of compounds serving as a source of energy and/or carbon. Only the surfaces of the pores on the outer part of a GAC particle with a radius greater than 500 nm are potentially available for bacterial attachment. The fraction of the GAC surface comprised by these pores represents only a small faction (0.008%)of the total GAC surface, but due to the roughness and porosity of GAC this surface is much larger when compared with other materi-als of the same particle diameter used in drinking water treatment, such as sand or anthracite. The specific surface area of sand (diameter 1 to 2 mm), with a filter bed porosity of 39% is approximately 35 -70 cm2 cm-3, respectively. The surface of GAC that includes pores with radii

16 Microbial activity in GAC filters in drinking water treatment
> 500 nm that are available for bacterial attachment, calculated from mercury intrusion, is approximately 350 cm2 cm-3. Hence, GAC provides a larger surface area available for bacterial attachment than sand. Furthermore, the hydrophobic nature and the presence of functional groups additionally strengthen the attachment of bacteria to GAC surface.
1.5.2 Microbial substrate utilization and growth Microbial utilization of biodegradable compounds is characterized by the rate of uptake and the formation of biomass. The relationship between the rate of growth and the concentration of the growth-limiting compound (energy source) is given by the Monod equation, i.e.
µ = µmax × S/(Ks+S) (1)
where: µ (h-1) is the specific growth rate of the microorganisms, i.e. the increase of microbial biomass (M) per unit of biomass (M) and time [(dM/(M×dt)]; µmax (h-1) is the maximum spe-cific growth rate of the microorganisms; S is the concentration of the limiting substrate for growth; Ks is the “saturation constant” or the value of S at µ / µmax = 0.5 µmax and Ks are em-pirical coefficients and are determined by the ability of a species to utilize a specific substrate. The rate of growth corresponds with the rate of uptake of the involved substrate. The relation-ship between substrate uptake and growth is defined by the yield coefficient (Y) with:
Y = dS/dM (2)
Y depends on the nature of the substrate and the nature of the microorganism. For easily bio-degradable organic compounds, Y is about 0.5 mg biomass C mg-1 substrate C (Heijnen and van Dijken 1992).
The efficiency of a species to utilize a specific substrate is related to the composition of the substrate and the kinetics of the critical enzymatic reaction involved in the transformation of the involved substrate. Passive non-specific transport through the bacterial cell wall and the porins in the outer membrane into the periplasmic space is restricted to compounds with a molecular weight < 700 Da (Decad and Nikaido 1976; Nikaido 2003). Specific porins may transport specific compounds. The transportation from the periplasmic space to the cyto-plasm via the cytoplasmic membrane is carrier mediated and highly specific, requiring mem-brane transport proteins. This energy requiring transportation results in high concentrations of the transported molecule in the cytoplasm. Easily biodegradable low molecular weight compounds such as monosaccharides, amino acids and (hydroxy)carboxylic acids, are rapidly transported through the porins into the periplasmic space and their transport is most likely diffusion limited.
Large complex molecules including biopolymers must first be transformed by exo-enzymatic hydrolysis before they can be transported into the cell and utilized. The utilization rate of large molecules will therefore be affected by the rate and efficiency of binding to the cell and the subsequent effect of the exo-enzymatic reactions (Hoppe 1991). Extracellular enzymes can be classified as ectoenzymes and truly extracellular enzymes. Ectoenzymes are associated either with the cytoplasmic membrane or the cell wall of viable cells. Strict-sense extracellular

17Chapter 1 General introduction
enzymes occur in free form and catalyse reactions detached from their producers. Bacterial extracellular enzymes may be actively secreted by intact viable cells, released into the environ-ment by viral lysis or predation (Wetzel 1991). Overall, the utilization of compounds that can-not pass through the porins (in gram-negative bacteria) requires adsorption to specific binding proteins, followed by hydrolysis. In contrast to the low-molecular-weight compounds, utiliza-tion of the high-molecular-weight compounds may be limited by the kinetics of adsorption and hydrolysis. Sack et al. (2014) demonstrated that polysaccharides at concentrations of 10 µ g L-1 can cause biofilm formation on a glass surface. The substrate concentration (S) at the surface (in the biofilm) depends on the transportation from the bulk water to the microorganisms and the utilization by the micro-organisms. Transportation from the bulk water to the attached microorganisms is the result of convection and diffusion. In granular media filters (GACF and RSF), the flow pattern is turbulent, resulting in an effective transportation of the substrate to the laminar layer at the solid phase. Diffusion subsequently determines the transportation of the substrate to the microorganisms. Studies of biofiltration in drinking water indicate that diffusion and external mass-transport resistance in the biofilm have a negligible effect on the performance of a biofilter (Wang and Summers 1995; Gagnon and Huck 2001; Urfer 1998; Uhl 2000; Huck et al. 1991; Zhang and Huck 1996).
1.5.3 Microorganisms in GACFsMicrobiological activity in GACFs was recognized already in early studies on GAC filtration as elevated colony counts in the effluent, oxygen consumption by the filterbeds and release of GAC fines with attached bacteria in the filtered water (Melbourne and Miller 1974; Weber et al. 1978; Cairo et al. 1979; van der Kooij 1983; Bancroft et al. 1983; Chudyk and Snoeyink 1984). Initially, the presence of bacteria raised doubts about health risks associated with the introduction of GAC filtration in water treatment. Elevated heterotrophic plate counts (HPC) in effluents of GACFs were repeatedly reported by operators and researchers, especially dur-ing the startup period. In the process of filter maturation, HPCs in the effluent decrease and stabilize usually at levels one order of magnitude lower than in the startup period (Klotz et al. 1975; van der Kooij 1975; Werner et al. 1978; Cairo et al. 1979; den Blanken 1982; Wilcox et al. 1983; Chudyk and Snoeyink 1984; McElhaney and McKeon 1985; Servais et al. 1991). HPCs in the GAC filtrate can be controlled by treatment with chlorine, chlorine dioxide, UV light, or slow sand filtration (Camper et al. 1986; Graveland et al. 1994; IJpelaar et al. 2007). Multiplication of pathogenic bacteria of faecal origin or faecal indicator bacteria does not oc-cur in GACFs under the usual operating conditions (Camper et al. 1986; Stewart et al. 1990). Furthermore, GACFs with a long running time are able to remove these microorganisms from the influent (van der Kooij 1983; Hijnen et al. 2010). Nevertheless, certain undesired bacteria, e.g. coliforms may survive in GAC filterbeds and enter a distribution system when attached on fines for which disinfection is not efficient (Camper et al. 1985; Camper et al. 1986; Stewart et al. 1990).
Bacteria have been isolated from GACFs by using classical culture techniques with plate count agar or R2A agar (Reasoner and Geldreich 1985). Subsequently, these organisms were identi-fied by determining a number of metabolic characteristics for classification. The isolated bacte-ria have been identified as members of Achromobacter, Arthrobacter, Alcaligenes, Acinetobacter, Aeromonas, Bacillus, Caulobacter, Chromobacterium, Corynebacterium, Flavobacterium, Morax-

18 Microbial activity in GAC filters in drinking water treatment
ella, Micrococcus, Microcyclus, Nitrosomonas, Nitrobacter, Paracoccus, Pseudomonas, and actino-mycetes (van der Kooij 1975; Werner et al. 1978; Cairo et al. 1979; Parsons 1980; den Blanken 1982; 1983; Wilcox et al. 1983; McElhaney and McKeon 1985; Camper et al. 1986; Burlingame et al. 1986; Rollinger and Dott 1987). None of the isolates was identified as an organism as-sociated with a potential health risk. However, many isolates remained unidentified due to the low discriminatory capacity of the classical identification methods. By using fatty acid analysis for bacterial identification, Norton and LeChevallier (2000) found that the largest proportion of isolates from GAC belonged to the genera Acidovorax, Hydrogenophaga, Pseudomonas, Xan-thomonas, and Sphingomonas. Also rotifers, nematodes, copepods, oligochaeta and tardigrada were detected in high numbers in GACFs and could not easily be removed or controlled by back-washing (van der Kooij 1983; Schreiber et al. 1997; Scholz and Martin 1997; Wang et al. 2014).
1.5.4 Biological activity and biodegradation in GACFs Much research has been conducted to evaluate the contribution of microbial activity to the removal of organic contaminants and NOM from the influent. Investigations showed that oxidative pre-treatment with ozone extends the running time between regenerations and im-proved the removal of toxic substances and dissolved organic carbon (Sontheimer et al. 1978). It became evident that beside adsorption, biodegradation also plays a role in the removal of organic compounds in GACFs, and that optimal utilization of GAC filtration in water treatment also requires knowledge about biological processes and biodegradation in GACFs. A variety of techniques has been used to assess the activity or the concentrations of bacteria in GACFs (Table 1.1).
Table 1.1 Methods for the assessment of the quantity and microbial activity in biological filters.
reference Parameter
Klotz et al. 1975; van der Kooij 1983; urfer and huck 2000 oxygen consumption
Weber 1978; cairo et al. 1979 Scanning electron microscopy
Werner et al. 1979; camper et al. 1985 heterotrophic plate counts
diGiano et al. 1992 total cell counts
Wang et al. 1995; carlson et al. 1996 Phospholipids
White et al. 1977; Servais et al. 1994 uptake of labelled substrates
Fonseca et al. 2001 reduction of int*
Velten et al. 2007 atP
* 2-(p-iodo-phenyl)-3(p-nitrophenyl)-3 phenyl tetrazolium chloride
These methods have been applied to study the development of biomass and to relate biomass activity with the removal of organic carbon from the influent. In order to distinguish between

19Chapter 1 General introduction
adsorption and biodegradation, methods for characterization and biodegradability of the nat-ural organic matter have also been developed (van der Kooij et al. 1982; 1992; Vartiainen et al. 1987; Servais et al. 1989; Peuravuori and Pihlaja 1997). Measurement of the concentration of microorganisms or microbial activity repeatedly revealed initial growth of bacteria in GACFs up to a certain level, which then remained stable (Bancroft et al. 1983; Billen et al. 1992; Wang et al. 1995; Carlson and Amy 1998; Velten et al. 2007). The distribution of biomass through the filterbed was reported to include a maximum biomass at the top and a decreasing concentration or activity with the filter depth. Filters that received pre-ozonated water devel-oped more biomass than filters that received non-ozonated water (Billen et al. 1992; Wang et al. 1995; Carlson and Amy 1998; Urfer and Huck 2000; Huck et al. 2000; Fonseca et al. 2001; Velten et al. 2007). This stimulation of microbial growth was attributed to the formation of easily biodegradable compounds from humic and fulvic acids by partial oxidation (van der Kooij et al. 1982; 1989; Gagnon et al. 1997; Carlson and Amy 1997).
The number of bacteria present on the GAC particles is 2-3 orders of magnitude higher than those in the filtrates. Hence, the biological processes in GACFs proceed almost entirely on the GAC surface (van der Kooij 1983; Servais et al. 1994). The elevated specific rate of removal of natural organic matter in mature GACFs as compared to SSF and the higher oxygen consump-tion in GACFs than in filters with sand, anthracite or non-activated granular carbon (NAGC) was observed in different investigations (van der Kooij 1983; Nijishima et al. 1992; Wang et al. 1995; Carlson and Amy 1998). These findings suggested that GAC enhances microbial activity when compared to the inert filter materials.
In many studies that compared GACF to filters with inert media, an elevated specific rate of NOM removal and higher microbial activity was repeatedly reported (Table 1.2).
Table 1.2 enhancement of the removal of noM in GacF relative to the removal in filters with inert media.
filter material removal enhancement by gac (%)
reference
Gac/Sand 50 Sontheimer and hubele 1986
Gac/anthracite/Sand/Gravel 50-62 lechevallier et al. 1992
Gac/Sand 60-75 Servais et al. 1994
Gac/anthracite/Sand 23-26 Wang et al. 1995
Gac/Pumice/Glass/Sand 52-82 uhl 2000
Gac/Sand n.o. huck and Sozansky 2008
Gac/anthracite <5 chowdhurry et al. 2013
n.o. not observed
The enhanced removal was often attributed to enhanced microbial activity (Shimp and Pfaender 1982; Chudyk and Snoeyink 1984; Goeddertz et al. 1988; Nishijima et al. 1992; Servais et al. 1994; Wang et al. 1995), and microbial utilization of compounds adsorbed onto GAC (Eberhardt 1975; Sontheimer et al. 1978; Weber et al. 1978; Chudyk and Snoeyink 1984;

20 Microbial activity in GAC filters in drinking water treatment
Kim et al. 1997; Summers et al. 2010). However, utilisation of adsorbed compounds has been denied by other investigators (Peel and Benedek 1983; van der Kooij 1983; Sontheimer and Hubele 1986). To date, the mechanisms of the enhanced biological activity in GAC filterbeds remain unresolved.
A number of authors have suggested that the enhancement of microbial activity is related to the accumulation of organic matter on the GAC surface by adsorption (Eberhardt 1975; Son-theimer et al. 1978). Another explanation is related to the nature and size of the specific sur-face area of GAC that is available for bacterial attachment (van der Kooij, 1983; Carlson and Amy, 1998; Wang et al. 1995). The enhancement of microbial activity by the adsorption pro-cess was questioned when GAC types with considerably different adsorptive properties showed similar biological activity (Jekel 1979; Wang et al. 1995). Furthermore, in batch experiments with river water and preloaded GAC or NAGC, bacteria died equally soon indicating that adsorbed compounds are not available for growth (van der Kooij 1983). However, enhanced microbial activity and increase of the adsorption capacity of GAC observed as the extension of filter life time and postponed breakthrough of NOM and/or organic micropollutants are com-monly related phenomena (Peel and Benedek 1983; Chudyk and Snoeyink 1984; Goeddertz et al. 1988; Speitel et al. 1989; Hutchinson and Robinson 1990; Nishijima et al. 1992; Servais et al. 1994; Wang et al. 1995; Kim et al. 1997; Jones et al. 1998; Nagayev and Sirotkin 1998; Orlandini 1999; Klimenko et al. 2004; Aktas and Cecen 2007).
The improved performance of GACFs has also been explained by the biodegradation of as-similable organic compounds from the water phase. Compounds that would normally adsorb onto GAC are biodegraded, and saturation of GAC adsorption capacity is postponed. Improved performance of GACFs receiving water pre-treated with ozone demonstrates that increase in biodegradability of NOM in the influent is leading to better removal of organic micropol-lutants and NOM when compared to filters receiving water without oxidative pre-treatment (Sontheimer et al. 1978; Orlandini 1999; van der Aa et al. 2012).
Peel and Benedek (1980) gave another explanation for the continuing removal of organic compounds in GAC filters and demonstrated that kinetic limitation of the diffusion in the micropores can result in a continuing adsorption long after apparent breakthrough has been achieved. This is attributed to very slow adsorption and described by a dual-rate kinetic model that produce breakthrough curves very similar to adsorption curves observed in practice. This second slow removal phase is usually seen as biodegradation, but the authors anticipated that some of the removal that was attributed to biodegradation might be purely adsorptive (Peel and Benedek 1980; 1983).
The improvement of GAC performance due to enhanced microbial activity is often explained by bioregeneration, the idea based on the disproportion between oxygen consumption and the removal of organic compounds (Sontheimer 1979; Jekel 1979). However, van der Kooij (1983) suggested that an elevated exceeding oxygen consumption is due to biomass accumulation. The research on bioregeneration focused mainly on restoration of adsorption capacity for a single solute as phenol, naphthalene (Chudyk and Snoeyink 1984; Goeddertz et al. 1988; Spei-tel et al. 1989; Hutchinson and Robinson 1990) or atrazine (Jones et al. 1998). Restoration

21Chapter 1 General introduction
of 50-100% of adsorptive capacity for single solutes (phenol, naphthalene, dichloromethane, 3-chlorobenzoic acid etc.), and 20-40 % for humic substances has been reported for different systems of continuous or offline bioregeneration (Nagayev and Syrotkin 1998).
Two mechanisms are usually proposed to explain bioregeneration: exoenzymatic activity (Pierrotti and Rodman 1974) and reverse-concentration gradient (Andrews and Chi Tien 1981), the latter being more widely accepted and supported by experimental observations (Chudyk and Snoeyink 1984; Goeddertz et al. 1988; Speitel et al. 1989; Hutchinson and Rob-inson 1990). In both proposed mechanisms bioregeneration involves desorption of sorbed molecules, either following the action of exoenzymes or by the effect of microbial activity in the biofilm on the concentration and diffusion of a biodegradable solute on the surface and inside the GAC particle.
Beside the removal of organic contaminants, GAC filtration also affects the biological stability of water (van der Kooij 1984, 1987; Zang and Huck 1996; Servais et al. 1991; LeChevallier et al. 1992). For this purpose, GACFs are often operated long after the saturation of adsorption capacity as biological filters and the effect of biomass on the removal was addressed in differ-ent investigations (Huck et al. 1994; Wang et al. 1995; Carlson and Amy 1998; Laurent et al. 1999). Empirical and conceptual models have been developed to explain and predict the re-moval of biodegradable organic matter (as BDOC, AOC) in GACFs that were operating as bio-logical filters (Billen et al. 1992; Huck et al. 1994; Hozalsky et al. 1995; Wang and Summers 1995; Huck et al. 2000). In empirical models, a linear relationship that was found between the influent quality (BDOC, AOC) and the removal rate was used to predict the removal at differ-ent operating conditions (van der Kooij 1987; Huck et al. 1994; Hozalsky et al. 1995; Wang and Summers 1995; Huck et al. 2000). Wang et al. (1995) and Carlson and Amy (1998) ob-served that the removal is controlled by the biomass concentration only up to a certain level, as markedly different biomass concentration in different filters was able to remove equivalent BDOC quantity.
Based on studies on GACFs in Parisian suburbs, a deterministic model for prediction of BDOC removal in biological filters, the Chabrol model, was developed (Billen et al. 1992). The model predicted the performance of a biological filter in the steady state mode and involves a total of three groups of parameters that characterize: (i) the interactions with solid support ii) the physiology of the microorganisms and iii) the bacterial mortality. Parameters describing the solid support are determined experimentally, but most of the parameters describing physiol-ogy, including non-grazing mortality, were adopted from the literature with the assumption that these are constant characteristics of naturally occurring bacteria in aquatic environments.
1.6 sTudy oBjecTives
GAC filtration is applied in water treatment in the Netherlands for the removal of organic mi-cropollutants and for the reduction of colour, and in combination with advanced oxidation for the improvement of the biological stability of finished water. The efficiency of GAC filtration is limited, and GAC regeneration is needed when breakthrough of a target compound is reached

22 Microbial activity in GAC filters in drinking water treatment
(Wiesner et al. 1973; Suffet 1980; Kruithof and van der Leer 1983; Sontheimer and Hubele 1987). Thermal regeneration of GAC is expensive, and the costs of the annual regeneration of GAC at location Weesperkarspel of Amsterdam Water Supply comprise 46% of the total opera-tional costs for GAC filtration, and 15% of the drinking water production costs (Barrios et al. 2008).
After several decades of research, the relationship between microbial activity in GACFs and the surface characteristics of GAC is still not elucidated. Optimisation of the biological activity in GAC filtration may lead to further optimization of this treatment process. Such optimisation requires a fundamental understanding of the biological processes, the adsorption processes and their interactions, which may be influenced by water composition (raw water, pre-treat-ment), temperature (seasonal effects) and process conditions, respectively.
A research project was defined aiming at collecting such knowledge in a series of investiga-tions including observations in full-scale treatment plants, laboratory experiments, and pilot plant studies. For this purpose, both adsorption processes (R. van der Aa, TU Delft) and micro-biological processes were studied. The investigations described in this thesis aim at analysing the microbiological processes occurring in GACFs used in water treatment. In particular the contribution of bacteria to the removal of organic compounds is studied. To elucidate the con-tribution of the bacterial activity to the effects of GAC filtration on the removal of NOM from the water the study focused on the quantification and the characterisation of the bacterial community in GACFs.
The following goals of this investigation have been defined:
1. Development and evaluation of a method for measuring the concentration of active micro-organisms in GAC filter beds;
2. Characterisation of the bacterial activity in GACFs, which includes: a. Isolation and identification of predominating bacterial species; b. Elucidation of physiological properties of the predominant species 3. Analysis of the interactions between process conditions and the microbiological processes
during GAC filtration.
To this end, Chapter 2 describes a method for measuring the concentration of active bacte-rial biomass in GACFs, focusing on the removal of the attached bacteria with high-energy sonication and their subsequent quantification of adenosine triphosphate (ATP) and total cell counts. Furthermore, the application of this method in full scale and pilot plant GACFs , RSFs and SSFs is described to obtain quantitative information about the level of microbial activity in GACFs as compared to RSFs and SSFs in relation to biofilms in drinking water treatment.
In Chapter 3, the use of genomic fingerprinting and 16S rRNA gene sequence analysis is de-scribed to identify the predominant cultivable bacteria from full-scale GACFs in water treat-ment plants in the Netherlands. Chapter 4 continues with the cultivation-independent assess-ment of bacteria in full-scale GACFs based on the sequence analysis and t-RFLP fingerprinting of PCR-amplified bacterial 16S rRNA genes aiming to identify the predominant types.

23Chapter 1 General introduction
The nutritional versatility and growth kinetics of two Polaromonas strains, representing the predominating bacteria in the studied GACFs, were analyzed in batch culture growth experi-ments with mixed and individual substrates at concentrations typical for drinking water (Chapter 5). The information about the nature of favourite substrates and kinetic parameters of growth for these two strains, together with the information about the concentration of bio-mass in a GAC filter is then applied in Chapter 6 to improve our understanding of the removal of organic matter by the biodegradation processes in a GAC filter.
Obtained results and insights are integrated with available relevant data from the literature in a final synthesis in Chapter 7 with focus on the effect of the GAC surface characteristics on the microbial activity and biodegradation in GACFs, the mechanisms behind the enhanced per-formance of GACFs and the significance of insights obtained in this study for drinking water treatment practice.
Several organisations have contributed to this joint research project, including Amsterdam Water Supply (Waternet), Water Supply Midden Nederland (Vitens), Norit (Cabot), KWR Watercycle Research Institute (previously Kiwa Water Research), Delft University (TUD) and Wageningen University (WU). This study on the microbiological processes in GAC filters was financially supported by the Ministry of Economic Affairs, Project number BTS99160.
1.7 references
Aiken G.R. and Costaris E. (1995). Soil and hydrol-
ogy their effect on NOM. J. AWWA. 87, p. 6-45.
Aktas O., Cecen F. (2007). Bioregeneration of acti-
vated carbon, A review. International Biodeterioration &
Biodegradation, 59, 257–272.
Amelinckx S., Delavignette, P., Heerschap, M.
(1965). In Chemistry and Physics of Carbon; Walker P.L.,
Jr., Ed.; Marcel Dekker: New York.
Amon R.M.W., and Benner R. (1996). Bacterial
utilization of different size classes of dissolved organic
matter. Limnol.Oceanogr., 41(1), 41-51.
Andrews G.F. and Chi T. (1981). Bacterial film
growth on adsorbent surfaces. AlChE. Journal 27,396-
405.
Anonymous (1980). National Research Council
Safe Drinking Water Committee. Drinking water and
health, vol. 2. National Academy Press, Washington,
D.C.;
Bancroft K., Maloney S. W., McElhaney J., Suffet
I. H., and Pipes W. O. (1983). Assessment of bacterial
growth and total organic carbon removal on granular
activated carbon contactors. Appl. Environ. Microbiol.
46, 683-688.
Baldauf G., Frick B., and Sontheimer H. (1977).
Berechung des Sorptionsverhaltens von Gemischen.
Vom. eg Wasser., 49, 315-330.
Barrios R., Siebel M. van der Helm A., Bosklopper
K., Gijzen H. (2008). Environmental and financial life
cycle impact assessment of drinkingwater production at
Waternet. J. Cleaner Production, 16 (4), 471–476.
Billen G. (1991). Protein degradation in aquatic
environment. In, Chrost R.J. eds. Microbial enzymes
in aquatic environments New York, Berlin, Heidelberg,
Paris, Tokyo, Hong Kong, Barcelona, Springer Verlag;
Billen G., Servais P., Bouillot P., and Ventresque C.
(1992). Functioning of biological filters used in drink-
ing water treatment – the CHABROL model. J. Water
SRT-Aqua 41, 231-241.
Bjelopavlic M., Newcombe G., Hayes R. (1999).
Adsorption of NOM onto activated carbon, effect of
surface charge, ionic strength, and pore volume distri-
bution. J. Colloid and Interface Sci. 210, 271-280.
Blanken J.G. den. (1982). Microbial activity in
activated carbon filters. J. Env.Eng. Div., 108, 405-425.

24 Microbial activity in GAC filters in drinking water treatment
Bos R., van der Mei H.C., Busscher H.J. (1999).
Physico-chemistry of initial microbial adhesive interac-
tions – its mechanisms and methods for study. FEMS
Microbiol. Reviews, 23, 179-230.
Burlingame G. A., Suffet I. H., Pipes W. O. (1986).
Predominant bacterial genera in granular activated
carbon treatment systems. Canadian Journal of Microbi-
ology., 32, 226-230.
Cairo P.R., McElhaney J. and Suffet I.H. (1979).
Pilot plant testing of activated carbon adsorption sys-
tems, J. AWWA 71, 660-673.
Camper A. K., LeChevallier M. W., Broadaway S.
C., and McFeters G. A. (1985). Growth and persistence
of pathogens on granular activated carbon filters. Appl.
Environ. Microbiol., 50, 1378-1382.
Camper A. K., LeChevallier M. W., Broadaway S.
C., and McFeters G. A. (1986). Bacteria associated with
granular activated carbon particles in drinking water.
Appl. Environ. Microbiol., 52(3), 434-438.
Camper A.K., (2004). Involvement of humic
substances in regrowth. International Journal of Food
Microbiology, 92, 355– 364.
Carlson K.H., Garside G. L. A. H. and Blais G.
(1996). Ozone-induced biodegradation and removal of
NOM and ozonation byproducts in biological filters pp.
61-71. In Advances in Slow Sand and Alternative Biologi-
cal Filtration, Eds. Graham N. and Collins, R., John
Wiley &Sons, Chichester, England.
Carlson K.H. and Amy G.L. (1997). The formation
of filter removable biodegradable organic matter dur-
ing ozonation. Ozone Sci. Eng. 19, 179-199.
Carlson K.H. and Amy G.L. (1998). BOM removal
during biofiltration J. AWWA 90(12), 42-52.
Choudhry G.G. (1984). Humic substances. struc-
tural, photophysical, photochemical, and free radical
aspects and interactions with environmental chemicals.
Gordon & Breach, New York,NY
Chowdhury Z. K. Summers, S. R. Westerhoff G.P.,
Leto B. J., Nowack K. O., Corwin C. J. (2013). Activated
carbon solutions for improving water quality. AWWA,
Denver Co, USA.
Chudyk W. and Snoeyink V.L. (1984). Bioregen-
eration of activated carbon saturated with phenol.
Environ.Sci.Technol., 18(1), 1-5.
Colbourne J.S. (1985). Materials usage and their
effect on microbiological water quality of water sup-
plies. J. Appl. Bacteriology. Symp. Suppl., 71, 47S-59S.
Cooper W.T., Stenson A., Milligan L., Chanton J.,
Dittmar T., Filley T. (2004). Ultrahigh resolution mass
spectrometry of aquatic humic substances, recurring
molecular themes and polymeric character. p.257-260,
In Humic substances and soil and water environment.
Editors Martin-Neto L., Milori D.M.B.P., da Silva W.T.L.,
Embrapa. Brasil.
Cotner J.B. (2000). Intense winter heterotrophic
production stimulated by benthic resuspension Limnol.
Oceanogr., 45 (7), 1672–1676.
Decad G.M., Nikaido H. (1976). Outer membrane
of gram-negative bacteria. XII. Molecular-sieving func-
tion of cell wall. Journal Of Bacteriology, 128, 325-336
DiGiano A.F., Mallon K., Stringfellow W., Cobb N.,
Moore J. and Thompson J.C. (1992). Microbial activ-
ity on filter-adsorbers. AWWA Research Foundation,
Denver, USA C.Thompson Camp Dresser & McKee Inc.
Maitland, Florida.
Eberhardt M., Madsen S. and Sontheimer H.
(1975). Untersuchungen zur Verwendung biologisch
arbeitender Aktivkholefilter bei der Trinkwasseraufbe-
reitung, gwf-Wasser/Abwasser 116(6), 245-247.
Fonseca A.C., Summers R. S. and Hernandez
M.T. (2001). Comparative measurements of microbial
activity in drinking water biofilters. Wat. Res. 35(16),
3817-3824.
Frimmel F.H. (1998). Characterisation of natural
organic matter as major constituents in aquatic sys-
tems. J. Contam. Hydrol., 35,201-216.
Gagnon G. A., Booth S.D.J. Peldszus S., Mutti D.,
Smith F., Huck P.M. (1997). Carboxylic acids, forma-
tion and removal in full scale plants J. AWWA; 89(8),
88-97.
Gagnon G,A. and Huck P. (2001). Removal of
easily biodegradable organic compounds by drinking
water biofilms, analysis of kinetics and mass transfer.
Wat. Res., 35(10), 2554–2564.
Geudens P.J.J.G. (2012). Drinkwaterstatistieken.
Vewin nr, 2012/110/6259 Vewin, Rijswijk, Netherlands
Goeddertz J.G., Matsumoto M.R. and Weber S.
(1988). Ofline bioregeneration of granular activated
carbon. J. Environ. Eng., 114(5), 1063-1075.
Graveland A. (1994). Application of biological

25Chapter 1 General introduction
activated carbon filtration at Amsterdam Water Supply,
Water Supply, 14, 233-241.
Halsey G. and Taylor H.S. (1947). The adsorption
of hydrogen on tungsten powders. J. Chem. Phys., 15,
624- 630.
Hatcher P. G., Mopper K., Stubbins A., Ritchie J.
D., and Bialk H. M. (2007). Advanced instrumental
approaches for characterization of marine dissolved
organic matter, Extraction techniques, mass spectrom-
etry, and nuclear magnetic resonance spectroscopy.
In, Chemical Oceanography. Chemical Reviews, 107,
419-442.
Hijnen W.A., Suylen G.M., Bahlman J.A., Brouwer-
Hanzens A., Medema G.J. (2010). GAC adsorption fil-
ters as barriers for viruses, bacteria and protozoan (oo)
cysts in water treatment. Wat. Res., 44(4),1224-1234.
Hoppe H.G. (1991). Microbial extracellular en-
zyme activity, a new key parameter in aquatic ecology,
and Meyer-Reil LA. Ecological aspects of enzymatic
activity in marine sediments, In, Chrost R.J. eds.
Microbial enzymes in aquatic environments New York,
Springer Verlag;
Hoque E, Wolf M, Teichmann G., Peller E., Schim-
mack W, Buckau G. (2003). Influence of ionic strength
and organic modifier concentrations on characteriza-
tion of aquatic fulvic and humic acids by high-perfor-
mance size-exclusion chromatography. J Chromatogr.
A., 1017,97-105.
Houtman C.J. (2010). Emerging contaminants in
surface waters and their relevance for the production
of drinking water in Europe. J. Int. Environ. Sci., 7(4),
271 – 295.
Hozalski R.M., and Bouwer E.J. (2001). Non-
steady state simulation of BOM removal in drinking
water biofilters, model development. Wat. Res., 35(1),
198-2010.
Huck P. M., Zhang S. and Price M.L. (1994). BOM
removal during biological treatment, a first-order
model. J. AWWA, 86(6), 61-71.
Huck P. M., Fedorak P. M. & Anderson W. B.
(1991). Formation and removal of assimilable organic
carbon during biological treatment. J. AWWA, 83(12),
69–80.
Huck P. M. and Sozanski M. M. (2008). Biologi-
cal filtration for membrane pre-treatment and other
applications, towards the development of a practically-
oriented performance parameter. Journal of Water
Supply, Research and Technology—AQUA, 57, 4.
Huck P.M., B. M. Coffey A. Amirtharajah E. J. Bou-
wer. (2000). Optimizing filtration in biological filters,
Eds. P.M Huck. AWWA Research foundation.
Hutchinson D.W. and Robinson C.W. (1990). A
microbial regeneration process for Granular Activated
Carbon –II. Regeneration Studies. Wat.Res., 24(10),
1217-1223
IJpelaar G. F., Harmsen D.J.H., Heringa M.
(2007). UV disinfection and UV/H2O2 oxidation, by-
product formation and control. Techneau, D2.4.1.1.
KIWA WR, Nieuwegein, Netherlands
Jekel M. (1979). Experience with biological acti-
vated carbon filters pp, 727. In, Proc. Conference, Oxi-
dation Techniques in Drinking water treatment, p,727.,
Karlsruhe.
Jones L.R., Oven S.A., Horrell P., and Burns R.G.
(1998). Bacterial inocultation of granular activated
carbon filters for the removal of atrazine from surface
water. Wat. Res., 32(8), 2542-2549.
Joret J.C., Volk C., Randon G., Cote P. (1994). Con-
trol of biodegradable organic matter during drinking
water treatment. Proc. International Seminar on Biode-
gradable Organic Matter. Montreal, Quebec, pp. 23–24.
Kilduff J.E., Karanfil T., Chin Y.P. and Weber W.J.
(1996). Adsorption of natural organic polyelectrolytes
by activated carbon, a size exclusion chromatography
study. Environ. Sci. Technol., 30, 1336-1343.
Kim D., Miyahara T., Noike T. (1997). Effect of
C/N ration on the bioregeneration of biological acti-
vated carbon. Wat. Sci. Technol., 36, 239-249.
Klimenko N., Smolin S., Rgechanyk S., Kofanov
V., Nevynna L., Samoylenko L. (2004). Bioregenera-
tion of activated carbons by bacterial degraders after
adsorption of surfactants from aqueous sollutions.
Colloids and surfaces A, Physicochem. Eng. Aspects.,
230, 141-158.
Klotz M. (1979). Mikrobiologische Untersuchungen
zur Trinkwasseraufbereitung mit Aktivkohle. Thesis,
Universitat des Saarlandes, Saarbrücken.
Koudjonou B., Prévost, M., Merlet, N. (2005).
Characterisation of orhanic matter in water resources
and supplies pp, 1-36. In Biodegrdable organic matter in

26 Microbial activity in GAC filters in drinking water treatment
drinking water treatment and distribution, Eds. Prévost,
M., Laurent, P., Servais, P., and Joret J.C. AWWA, Den-
ver CO, USA.
Kruithof J.C. and van der Leer R. (1983). Design,
construction and operation of carbon filters; in Acti-
vated carbon in drinking water technology, Cooperative
Research Report KIWA The Netherlands and AWWA
Research Foundation, U.S.A.
Langmuir I. (1918). The adsorption of gases on
plane surfaces of glass, mica and platinum. J. Am.
Chem. Soc.,40,1361-1403.
Laurent P.M., Prevost M., Cigana J., Niquette P.,
and Servais P. (1999). Biodegradable organic matter
removal in biological filters, evaluation of the Chabrol
model. Wat. Res., 33(6), 1387-1398.
Laurent P. M. Servais P., Gauthier V., Prévost M.,
Joret J.C., and Block J.C. (2005). Biodegradable organ-
ic matter and bacteria in drinking water distribution
systems. In Biodegradable organic matter in drinking
water treatment and distribution. Chapter 4., Pp,147-
190. Eds. M. Prévost, P. Laurent, P. Servais, J.C. Joret.
AWWA, USA
LeChevallier M.W., Schulz W., and Lee R.G.
(1991). Bacterial nutrients in drinking water. Appl.
Environ. Microbiol. 57,857– 862.
Lechevallier M.W., Becker W.C., Schorr P., and Lee
R.G. (1992). Evaluationg the performace of biologically
active rapid filters. J AWWA 84(4),136-146.
LeChevallier M.W., Welch N.J., and Smith D.B.
(1996). Full-scale studies of factors related to coliform
regrowth in drinking water. Appl. Environ. Microbiol.,
62, 2201– 2211.
LeChevallier M.W. (2014). Measurement of bio-
stabillity and impacts on water treatment in the US.
In Microbial growth in drinking water supplies, van der
Kooij D. and van der Wielen P.W.J.J. (eds). Chapter 2,
pp. 33-52. IWA Publishing, London UK.
McElhaney J., and McKeon W. R. (1978). Enu-
meration and identification of bacteria in granular
activated carbon columns, p. 1-22. In Proceedings of
the Water Quality Technology Conference, Houston,
Texas, 8 to 11 December, 1985. American Water Works
Association, Denver
Moore W.J. (1972). Fhysical chemistry, Prentice-
Hall, Engelwood Cliffs, New Jersey
Nagayev V.V. and Sirotkin A.S. (1998). Biological
methods of water treatment, biological regeneration of
activated carbon. J. WC&T., 20(9), 44-51.
Newcombe G., Drikas M., Assemi S. and Beckett
R. (1997). Influence of characterizes natural organic
material on activated carbon adsorption, I. Charac-
terisation of concentrated reservoir water. Wat.Res.,
31,965-972.
Nijishima W., Tojo M., Okada M., and A. Mu-
rakami. (1992). Biodegradation of organic substances
by biological activated carbon – simulation of bacterial
activity on granular activated carbon. Wat. Sci. Tech-
nol., 26(9-11), 2031-2034.
Nikaido H. (2003). Molecular Basis of Bacterial
Outer Membrane Permeability Revisited. Mol.Biol. Rev.,
67, 593-656.
Norton C. D., and LeChevallier M. W. (2000). A
pilot study of bacteriological population changes through
potable water treatment and distribution. Appl. Environ.
Microbiol. 66, 268–276.
Orlandini E. (1999). Pesticide removal by combined
ozonation and granular activated carbon filtration.
Thesis Wageningen University and International Insti-
tute for Infrastructural. Hydraulic and Environmental
Engineering Delft. A.A. Balkema. Rotterdam
Parsons F., Wood P.R., and DeMarco J. (1980).
Bacteria associated with granular activated carbon
columns. In Proceedings of the 6th Annual AWWA Water
Quality Technology Conference. pp. 63–68. Denver,
American Water Works Association.
Peel R.G., and Benedek A. (1980). Dual rate ki-
netic model for fixed bed adsorber. A.I.Ch.E.J. 27(1).
Peel R.G. and Benedek A. (1983). Biodegradation
and adsorption within activated carbon adsorbers. J
WPCF 55(9), 1168-1173.
Peuravuori J., and Pihlaja K. (1997). Molecular
size distribution and spectroscopic properties of aquat-
ic humic substances. Anal.Chim. Acta., 337, 133-49.
Piccolo A. (2001). The supramolecular structures
of humic substances. Soil Sci., 166(11), 810-832.
Piccolo A. (2002). The supramolecular structures
of humic substances, A novel understanding of humus
chemistry and implications in soil science. Adv. Agron.,
75, 457-478
Prober R., Pyeha J.J., and Kidon W.E. (1975).

27Chapter 1 General introduction
Interaction of activated carbon with oxygen. Al. Che.
Journal., 21(6), 1200-1204.
Radke C.J., and Prausnitz J.M. (1972). Thermo-
dinamics of multi-solute adsorption from dilute liquid
solutions. Amer. Inst. Chem. Eng. J. 18, 761-768.
Reasoner D.J. and Geldreich E.E. (1985). A new
medium for the enumeration and subculture of bacte-
ria from potable water. Appl Environ Microbiol. 49, 1–7.
Reemtsma T, and These A. (2003). On-line cou-
pling of size exclusion chromatography with electro-
spray ionization-tandem mass spectrometry for the
analysis of aquatic fulvic and humic acids. Anal Chem.,
75,1500-1507.
Rollinger Y., and Dott W. (1987). Survival of se-
lected bacterial species in sterilized activated carbon
filters and biological activated carbon filters. Appl.
Environ. Microbiol., 53, 777–781.
Rook J., (1974). The formation of haloforms dur-
ing chlorination of natural waters. Water Treat. Exam.,
23, 234-243.
Sack E. L. W., van der Wielen P. W. J. J., and van
der Kooij D. (2014). Polysaccharides and proteins
added to flowing drinking water at microgram-per-liter
levels promote the formation of biofilms predominated
by Bacteroidetes and Proteobacteria. Appl. Environ.
Microbiol. 80, 2360-2371.
Saunders G. (1976). Decomposition in fresh water.
In The role of terrestrial and aquatic organisms in decom-
position processes; Eds J.Anderson and A.Macfadyen,
Balckwell, Oxford, UK.
Schalekamp M. (1979). The use of GAC filtra-
tion to ensure quality in drinking water from surface
sources. J. AWWA, 71, 638-647.
Schoenen D. (1986). Microbial growth due to
materials used in drinking water systems pp. 628-647.
In Biotechnology, H.J. Rehm and G. Reed (eds), Vol. 8.
Weinheim, Germany, VCh Verlagsgesellschaft.
Scholz M., and Martin R. J. (1997). Ecological
Equilibrium on biological activated carbon. Wat.Res.,
31(12), 2959-2968.
Schoonenberg F. Kegel, B. M. Rietman and A. R. D.
(2010). Reverse osmosis followed by activated carbon
filtration for efficient removal of organic micropollut-
ants from river bank filtrateVerliefde Water Science &
Technology, 61(10), 2603–2610.
Schreiber H., Schoenen D. and Traunspurger W.
(1997). Invertebrate colonization of granular activated
carbon filters. Wat. res., 31(4), 743-748.
Seitzinger S.P., Hartnett H., Lauck R., Mazurek
M., Minegishi T., and Spyres G. (2005). Molecular-
level chemical characterization and bioavailability
of dissolved organic matter in stream water using
electrospray-ionization mass spectrometry. Limnol.
Oceanogr., 50, 1-12.
Servais P., Billen G., and Hascoet M.C. (1987).
Determination of biodegradable fraction of dissolved
organic matter in waters. Wat. Res., 21(4),445-450.
Servais P., Anzil A. and Vantresque C. (1989).
Simple method for determination of biodegradable
dissolved organic carbon in water. Appl. Env. Microb.,
55, 2732-2734,
Servais P., Billen G., Ventresque C., and Bablon
G.P. (1991). Microbiological activity in GAC filters at
the Choisy-le-Roi treatment plant. J. AWWA, 83 (2),
62-68.
Servais P., Cauchi B. and Billen G. (1994). Experi-
mental study and modeling bacterial activity in biologi-
cal activated carbon filters. Water Supply, 14, 223-231.
Servais P., Prevost M., Laurent P., Joret J.C., Sum-
mers S., Hamsch B., Ventresque C. (2005). Biodegrad-
able organic matter in drinking water treatment Pp,
61-130. In Biodegradable organic matter in drinking
water treatment and distribution. Eds. M. Prevost, P.
Laurent, P. Servais, J.C. Joret. AWWA, USA.
Snoeyink V. L., and Weber, W. J., Jr. (1967). The
Surface chemistry of active carbon, Environ. Sci. Tech-
nol., l(3), 228-234.
Snoeyink V.L., and Summers R.S. (1999). In Water
Quality and Treatment; (Chapter 13). (5th ed) Mcgraw-
Hill, New York, NY
Sontheimer H., Heilker E., Jekel M.R., Nolte H.
and Vollmer F.H. (1978). The Mülheim process. J.
AWWA, 70(7), 393.
Sontheimer H., Frick B.R., Fettig J., Hörner G.,
Hubele C., and Zimmer G. (1985). Adsorptionsver-
fahren zur Wasserreinigung. DVGW-Forschungsstelle
am Engler-Bunte-Institut der Universitat Karslruhe.
Sontheimer H., and Hubele C. (1987) The use of
ozone and granulated activated carbon in drinking
water treatment. In Treatment of Drinking Water for

28 Microbial activity in GAC filters in drinking water treatment
Organic Contaminants; P.M. Huck and P.Toft, eds.,
Pergamon Press, Oxford.
Sontheimer H., Crittenden J.C., and Summers
R.S. (1988). Activated carbon for water treatment.
AWWA-DVGW Forschungstelle Engler Bunte Instituut,
Karlsruhe.
Sozansky M.M. and Huck P.M. (2006). Biological
filtration for membrane pre-treatment and other appli-
cations, towards the development of a practically-ori-
ented performance parameter Journal of Water Supply,
Research and Technology-AQUA,57.4
Speitel G.E., Turakhia M. H. and Lu C. (1989).
Initiation of micropollutant biodegradation in virgin
GAC columns. J. AWWA, 81 (4), 168-176.
Stewart M.H., Wolf R L., and Means E. G. (1990).
Assessment of the Bacteriological Activity Associated
with Granular Activated Carbon Treatment of Drinking
Water. Appl.Environ. Microbiol., 56(12), 3822-3829.
Suffet I.H. (1980). An evaluation of activated car-
bon for drinking water treatment. A National Academy
of Scence report, J. AWWA, 72, 41-50;
Summers R.S, Knappe R.U.D., and Snoeyink V.
(2010). Adsorption of organic compounds by activated
carbon. Chapter 14 (14.1-14.91) In Water quality and
water treatment; a handbook on drinking water, ed J.K
Edzwald), 6 th Edition, American Waterworks Associa-
tion, McGraw Hill, USA.
Sutton R., and Sposito G. (2005). Molecular struc-
ture in soil humic substances, The new view. Environ.
Sci. Technol., 39, 9009-9015.
Thurman E.M., Wershaw R.L., Malcolm R.L., and
Pinckney D.J. (1982). Molecular size of aquatic humic
substances. GOrg. Geochem., 4, 27-35.
Uhl W. (2000). Biofiltration processes for organic
matter removal. In, Rehm H.J., Reed G. (eds), Biotech-
nology, 2nd completely revised ed. Vol. 11c, Environ-
mental Processes III (Vol.eds Klein, J.;Winter J.) Wiley-
VCH, Weinheim, New York, USA.
Urfer D. and Huck P.M. (2000). Measurement of
biomass activity in drinking water biofilters using a
respirometric method. Water Res., 35(6), 1469-1477.
Urfer-Frund, D. (1998). Effects of oxidants on
drinking water biofilters. PhD Thesis, Department of
ivil Engineering, University of Waterloo, Waterloo,
Ontario, Canada.
Van der Aa L.T.J., Kolpa R.J., Rietveld L.C. and Van
Dijk J.C. (2012). Improved removal of pesticides in bio-
logical granular activated carbon filters by pre-oxida-
tion of natural organic matter. Journal of Water Supply,
Research and Technology – AQUA 61(3), 153-163.
Van der Kooij D. (1975). Enkele aspecten van de
behandeling van oppervlaktewater door middle van
aktieve koolfiltratie. Report SW-141,KIWA, Rijswijk.
Van der Kooij D., Visser A., and Hijnen W.A.M.
(1982). Determining the concentartion of easily as-
similable organic carbon in drinking water. J. AWWA,
76(10), 540-545.
Van der Kooij D. (1983). Biological processes in
carbon filters. In Activated carbon in drinking water
technology. Cooperative report KIWA-AWWA research
foundation. Nieuwegein, Netherlands.
Van der Kooij D., and Hijnen W.A.M. (1984).
Subtraat utilisation by an oxalate-consuming Spiril-
lum species in relation to its growth in ozonated water.
Appl.Environ.Microbiol., 47,551-559.
Van der Kooij, D. (1987). The effect of treatment
on assimilable organic carbon in drinking water’ pp.
317-328 In Treatment of drinking water for organic con-
taminants, eds. PM Huck and P Toft. Pergamon Press,
New York, USA.
Van der Kooij D., Hijnen W.A.M., Kruithof J.C.,
(1989). The effects of ozonation, biological filtration,
and distribution on the concentration of easily assimi-
lable organic carbon in drinking water. Ozone, Sci. Eng.,
11, 297–303.
Van der Kooij D. (1992). Assimilable organic car-
bon as an indicator of bacterial regrowth J. AWWA, 84,
57–65.
Van der Kooij D., and Veenendaal H.R. (2001).
Biomass production potential of materials in contact
with drinking water; method and practical importance.
Wat. Sci. Technol. Wat. Supply, 1(3), 39-45.
Van der Kooij D., Veenendaal H.R., Scheffer W.J.
(2005). Biofilm formation and multiplication of Le-
gionella in model warm water system with pipes from
copper, stainless steel and cross-linked polyethylene
Wat. Res., 39, 2789-2798.
Van der Kooij D., and Wielen P.W.J.J. (2014).
General introduction, pp. 1-20, Chapter 1 in Microbial
growth in drinking water supplies, van der Kooij D. and

29Chapter 1 General introduction
van der Wielen P.W.J.J. (eds). Chapter 1, 1-20. IWA
Publishing, London UK.
Van der Kooij D., and Veenendaal H.R. (2014).
Regrowth problems and biological stabiltiy assesment
in the Netherlands. In Microbial growth in drinking-
water supplies. van der Kooij, D. and van der Wielen,
P.W.J. J. (eds.), Chapter 11, 291-338. IWA Publishing,
London, UK.
Van Loosdrecht M., Nyklema J., Norde W., and
Zehnder A.B. (1990). Influence of interfaceson micro-
bial activity 1990. Microbiol. Reviews., 54(1), 75-87.
Vartiainen T., Liimatainen A., and Kauranen P.
(1987). The use of TSK size exclusion columns in deter-
mination of quality and quantity of humus in raw wa-
ters and drinking waters. Sci Total Environ., 62, 75-84.
Velten S., Hammes F., Boller M., and Egli T.
(2007). Rapid and direct estimation of active biomass
on granular activated carbon trough adenosine tree-
phosphate (ATP) determination. Wat. Res., 41(9),
1973-1983.
Volk C.A., Volk C.B., Kaplan L.A. (1997). Chemical
composition of biodegradable dissolved organic matter
in streamwater. Limnol. Oceanogr., 42, 39– 44.
Von Wandruska, R. (1998). The micellar model of
humic acid, Evidence from pyrene fluorescence mea-
surements. Soil Sci., 163(12), 921-930.
Vries D., van Leerdam R., Post J.W. (2012), Stu-
urparameters Actieve Kool, Deelrapport 1, Overzicht
bedrijfsvoering actief-koolinstallaties bij Nederlandse en
Vlaamse drinkwaterbedrijven BTO 2012.215(s), KWR
Watercycle Research Institute, Nieuwegein, Nether-
lands.
Wang J.Z., Summers R.S. and Miltner R. J. (1995)
Biofiltration performance, part 1, relationship to bio-
mass. Filtration. J. AWWA, 87, 55-63.
Wang Q., You W., Li X., Yang Y., and Liu L. (2014).
Seasonal changes in the invertebrate community of
granular activated carbon filters and control technolo-
gies. Wat. Res., 51, 2016-227.
Weber W.J., Pirbazari M. and Melson G.L. (1978).
Biological growth on activated carbon, an investigation
by scanning electron microscopy. Environ. Sci. Technol.,
12(7), 817-819.
Werner P., M. Klotz and R. Schweisfurt. (1978).
Microbiologische Untersuchungen zur aktivkohlefiltra-
tion. In, Conf.Oxidation Techniques in Drinking water
treatment, Karlsruhe, Germany.
Wesrhaw R. L. (1986). A new model for humic ma-
terials and their interactions with hydrophobic organic
chemicals in soil-water or sediment-water systems. J.
Contaminant Hydrology, 1, 29-45.
Wershaw R. L. (1999). Molecular aggregation of
humic substances. Soil Sci., 164(11), 803-813.
Wetzel R.G. (1991). Extracellular enzymatic
interactions, storage, redistribution, and interspecific
communication; in Chrost RJ eds. Microbial enzymes
in aquatic environments New York, Berlin, Heidelberg,
Paris, Tokyo, Hong Kong, Barcelona, Springer Verlag;
Wetzel R.G., (1992). Gradient-dominated ecosys-
tems, sources and regulatory functions of dissolved
organic matter in freshwater ecosystems. Hydrobiolo-
gia, 229, 181– 198.
White D.C., Bobbie R.J., Morrison S.J., Oosterhof
D.K., Taylor C.V. and Meeter D.A. (1977). Determina-
tion of microbial activity of estuarine detritus by rela-
tive rates of lipid biosynthesis. Limnol Oceanogr., 22,
1089.
Wiesner M. R., Rook J. J., and Fiessinger F. (1987).
Optimizing the Placement of GAC Filtration Units. J.
AWWA, 79(12), 39-49.
Knoppert P.L. and Rook J.J. (1973). Treatment of
river Rhine water with activated carbon. In Activated
carbon in water treatment; proceedings of the Water
research association conference 3-5 April 1973, Univer-
sity of Reading, UK.
Wilcox D.P., Chang E.,. Dickson K.L, and Johans-
son K.R. (1983). Microbial growth associated with
granular activated carbon in a pilot water treatment
facility. Appl. Environ. Microb., 46(2),406-416.
Ypsalsky K., Cecen F., Aktas O.and Can Z.S.
(2008). Impact of surface properties of granular ac-
tivated carbon and preozonation on adsorption and
desorption of natural organic matter. Environ. Eng. Sci.,
26(3), 489-500.
Zhang S. and Huck P. M. (1996). Removal of
AOC in biological water treatment processes, a kinetic
model. Wat. Res., 30(5), 1195–1207.


2oPtiMiSation and SiGniFicance oF atP analYSiS For
MeaSurinG actiVe BioMaSS in Granular actiVated
carBon FilterS uSed in Water treatMent
CHAPTER
This chapter is based on publication:
Magic-Knezev A. and Van der Kooij D. (2004) Optimisation and significance of ATP analysis for measuring active biomass in granular activated carbon filters used in water treatment. Water Research, 38, 3971–3979.

ABSTRACTA method for determining the concentration of active microbial biomass in granu-lar activated carbon (GAC) fi lters used in water treatment was developed to fa-cilitate studies on the interactions between adsorption processes and biological activity in such fi lters. High-energy sonication at a power input of 40 W was applied to GAC samples for the detachment of biomass which was measured as adenosine triphosphate (ATP). Modelling of biomass removal indicated that a series of six to eight sonication treatments of two minutes each yielded more than 90% of the at-tached active biomass. The ATP concentrations in 30 different GAC fi lters at nine treatment plants in The Netherlands ranged from 25 to 5000 ng ATP cm-3 GAC, with the highest concentrations at long fi lter run times and pretreatment with ozone. A similar concentration range was observed in nine rapid sand (RS) fi lters. ATP con-centrations correlated signifi cantly (p<0.05) with total direct bacterial cell counts in each of these fi lter types, but the median value of the ATP content per cell in GAC fi lters (2.1x10⁻⁸ ng ATP/cell) was much lower than in the RS fi lters (3.6x10⁻⁷ ng ATP/cell). Average biofi lm concentrations ranging from 500 to 105 pg ATP cm-2 were calculated assuming spherical shapes for the GAC particles but values were about 20 times lower when the surface of pores > 1 µm diameter is included in these cal-culations. The quantitative biomass analysis with ATP enables direct comparisons with biofi lm concentrations reported for spiral wound membranes used in water treatment, for distribution system pipes and in other aquatic environments.
Key words – granular activated carbon, adenosine triphosphate, biological fi ltration, biofi lms, ultrasound.
NomenclatureATP = adenosine triphosphateCFU = colony-forming units DOC = dissolved organic carbonGAC = Granular Activated CarbonHES = high-energy sonicationHPC = heterotrophic plate countLES = low-energy sonicationNOM = natural dissolved organic matterNOX = Spirillum sp. strain NOXP17 = Pseudomonas fl uorescens strain P17TDC = total direct cell countUST = ultrasonic treatment

33Chapter 2 Optimisation and significance of ATP analysis
2.1 inTroducTion
Granular activated carbon (GAC) filtration is used in water treatment for the removal of or-ganic compounds that cause undesirable colour, odour or taste, and for the removal of pesti-cides and other xenobiotics, respectively. Adsorption and biodegradation occur simultaneously during GAC filtration.
A significant part of the costs of GAC filtration in water treatment is caused by the required thermal regeneration. Ozonation increases the biodegradability and reduces the adsorbability of natural organic matter (NOM) dissolved in water (Sontheimer et al. 1978; Van Leeuwen et al. 1985; Carlson et al. 1996). Consequently, preozonation enhances the microbial activity in GAC filters and delays the occupation of adsorption sites by NOM, resulting in postponed regeneration of GAC for the removal of persistent xenobiotics (Orlandini 1999). More detailed knowledge about the interactions between treatment conditions and biodegradation in GAC filters may lead to a more efficient use of GAC filters in water treatment. A method for deter-mining the concentration of active biomass on the surface of GAC was developed as a first step toward elucidation of these interactions.
A variety of techniques has been used to assess the activity or the concentrations of bacteria present in GAC filters, e.g. oxygen consumption (Klotz et al. 1975; Van der Kooij 1983; Urfer and Huck 2000), heterotrophic plate counts (Klotz 1979; Camper 1985), total direct cell counts (DiGiano et al. 1992), scanning electron microscopy (Weber 1978; Cairo et al. 1979), phospholipids (Wang et al. 1995 and Carlson et al. 1996), uptake of labelled substrates (White et al. 1977; Servais et al. 1994) and reduction of 2-(p-iodo-phenyl)-3(p-nitrophenyl)-3 phenyl tetrazolium chloride (INT) (Fonseca et al. 2001), respectively. Factors hampering the general application of one of these methods include the laborious nature of the analytical procedure and difficulties with the interpretation of the data: e.g. oxygen uptake by activated carbon itself, the large percentage of viable but uncultivable microorganisms and no differentia-tion between viable and non active bacteria, respectively. This paper describes an ATP-based method for determining the concentration of the active biomass in GAC filters. ATP was se-lected because of the speed and accuracy of the analysis and its general use in aquatic micro-biology (Karl 1980; Webster et al. 1985; Van der Kooij et al. 1995). The micro-organisms were removed from GAC surface with ultrasound, a technique that is often used for the detachment of particle-associated microorganisms and biofilms (Mathieu at al. 1993; Van der Kooij et al. 1995). However, sonication can inactivate microorganisms (Hua and Thompson 2000) and therefore the effects of ultrasonic treatment on the ATP concentration and cultivability of pure cultures and detached biofilm bacteria were investigated in this study. The main objectives of this investigation were:
1. To optimise ultrasonic treatment for the removal of bacteria from GAC in combination with the use of ATP analysis for biomass quantification;
2. To determine the relationship between ATP concentrations and selected biomass parameters (HPC, TDC) in GAC filter beds and obtain information about effects of process conditions on the biomass concentration in these filters. For this purpose a limited survey on biomass con-

34 Microbial activity in GAC filters in drinking water treatment
centrations in GAC filters, rapid sand (RS) filters and slow sand (SS) filters as applied in water treatment was conducted.
2.2 maTerials and meThods
2.2.1 Method developmentMethod development was conducted in four phases: (i), determination of the effects of ultra-sound on the ATP concentration and cultivability with selected pure cultures of aquatic bacteria (Spirillum sp., strain NOX and Pseudomonas fluorescens, strain P17) and suspensions of mixed bacterial communities detached from GAC samples. The suspensions were treated (10 times) with ultrasound and after each treatment ATP and cultivability were determined. Untreated suspensions served as a control; (ii), determination of the effect of the adsorptive properties of GAC and the release of fines on the concentration of free ATP. Free ATP was added to a suspen-sion of virgin GAC or GAC with developed biomass and incubated for two hours. A solution of free ATP in autoclaved tap water was used as control;. (iii), testing of the efficiency of the soni-cation treatment to remove attached bacteria with bacterial biofilms on plasticized polyvinyl-chloride (PVCp), GAC and sand. The materials were subsequently treated up to 20 times with ul-trasound at different power inputs and after each treatment biomass removal was measured as the ATP concentration. The ATP yield was plotted against the number of treatments; (iv), from the results of these experiments an optimal method for the removal and measurement of active biomass was defined and applied to a series of samples from different filter beds.
2.2.2 Samples from filter bedsSamples of GAC, sand and anthracite were obtained from nine water treatment plants in The Netherlands. Filter material (10-100 g) was collected from below the filter bed surface (2-10 cm) with a properly cleaned multisampler (Eijkelkamp) and stored in 100 cm3 screw-capped borosilicate flasks in the filtrate of the sampled unit at 4°C for a maximum period of 36 hours before the analysis. The specific density of the filter material was calculated from the weight of 50 cm3 of GAC, sand or anthracite that had been dried for four hours at 105° C. The volume is determined with a measuring cylinder (100 cm3). Prior to its use in experiments, virgin carbon (Norit 0.8 ROW Supra) was kept in demineralised water for 48 hours to allow saturation with oxygen. Subsequently, acid (1M HCl) was added to obtain pH 8.
2.2.3 Calculation of external surface of GACData for the external surface of the GAC particles assuming spherical shapes were derived from the literature (Sontheimer et al. 1985). The estimation of the surface of the pores with a diameter > 1 µm is based on data provided by the manufacturer about GAC porosity as based on penetration of butan at increasing pressure (Wheeler et al. 1983) and the assumption that pores had a cylindrical shape.
2.2.4 Test strains, mixed GAC community and stationary biofilm Spirillum sp. strain NOX and Pseudomonas fluorescens strain P17 were obtained from the sta-tionary growth phase of AOC tests in treated water as described earlier (Van der Kooij 1992). A mixed microbial community as present on GAC was obtained with a two minutes low energy

35Chapter 2 Optimisation and significance of ATP analysis
sonication (LES) treatment of a GAC sample (2 g wet weight) in 50 cm3 autoclaved tap water. Subsequently, the suspended bacteria were separated from the GAC particles and kept in auto-claved tap water for 4 hours at 20°C to allow adaptation to the new environment. A biofilm was grown on pieces (20 cm2) of plasticized PVC (PVC-P) incubated for 10 days at 15 °C in 600 cm3 of tap water inoculated with 1 cm3 of filtered river water (1.2 µm membrane filter) and enriched with nitrogen and phosphorus to prevent growth limitation (Van der Kooij and Veenendaal 2001).
2.2.5 Ultrasonic treatment A total of two to five gram of wet filter material was added to 50 cm3 of autoclaved tap water (pH 8.4±0.2) in a 100 cm3 screw-capped borosilicate flask. Sonication was applied for two minutes. A volume of five cm3 of the obtained suspension was collected and kept on ice for examination. The surplus liquid was decanted, 50 cm3 autoclaved tap water was added and sonication was repeated. This procedure was repeated several times depending on the objec-tive of the experiment. Low-energy sonication (LES) was applied with a Branson sonication unit 5050 at a constant frequency of 43 kHz and 180 W power output. Samples contained in 50 cm3 of autoclaved tap water were placed in the sonication chamber with 10 L of demine-ralised water. High-energy sonication (HES) was applied with a Sonifier II W-250 at a constant frequency of 20 kHz and an adjustable power output. Ultrasound was applied to the sample via a titanium microtip (D = 5 mm), with power inputs ranging from 10 to 40 W.
2.2.6 ATP measurementThe measurement of ATP is based on the production of light in the luciferine-luciferase assay. ATP was released from suspended cells with nucleotide-releasing buffer (NRB, Celsis). The intensity of the emitted light was measured in a luminometer (Celsis AdvanceTM) calibrated with solutions of free ATP (Celsis) in autoclaved tap water following the procedure as given by the manufacturer. The detection limit was 1 ng ATP L-1 of sample. Standard additions of free ATP dissolved in autoclaved tap water were used for recovery experiments.
The influence of the adsorptive properties of GAC on the ATP measurement was tested by ad-dition of free ATP to suspensions of virgin and preloaded GAC in autoclaved tap water (0.04 - 0.1 g GAC cm-3, dry weight). The concentrations of added ATP were of 2, 100, 600 and 3000 ng L-1 respectively. Autoclaved tap water with similar concentrations of free ATP was used as control. Recovery of added ATP was calculated from the measured ATP concentrations in the controls and in samples, which were corrected for the concentration of autochthonous ATP. The influence of carbon fines on the efficiency of light measurement was determined with GAC sampled from a filter bed and suspended in autoclaved tap water at concentrations of 0.01 to 0.3 g GAC cm-3 (dry weight) and subsequently sonicated. The liquid phase with GAC fines was separated from the GAC particles by decantation. After the measurement of auto- chthonous ATP, free ATP was added and the recovery was calculated from the measured val-ues in the samples and the control solutions, respectively.
2.2.7 Total direct cell count (TDC)A defined volume of the microbial suspension as obtained by sonication of GAC samples was filtered through a 0.22 µm polycarbonate filter, stained with acridine orange as described by

36 Microbial activity in GAC filters in drinking water treatment
Hobbie et al. (1977) and observed with epifluorescence microscopy (1000 x, Leica DM RXA). A total of ten random fields, each containing 20 to 200 cells, were analysed.
2.2.8 Heterotrophic plate counts (HPC) Volumes of 0.05 cm3 of appropriate decimal dilutions of microbial suspensions obtained by sonication of GAC, sand or anthracite in autoclaved tap water were spread in triplicate over the surface of R2A agar (Oxoid Ltd.) plates, which were incubated during 10 days at 25° C.
2.2.9 Statistic analysisThe statistical significance of the effects of ultrasonic treatment on microbial ATP and culti-vability was determined by a t-test after correction of the data for the values measured in the controls.
2.3 resulTs
2.3.1 Effects of sonication on microbial ATP and cultivabilityThe concentration of ATP in a suspension of NOX and P17 grown in treated water and in sus-pensions of the microbial community obtained from GAC samples (n=3) remained unaffected (102±2%) after ten LES treatments of two minutes each. This treatment also had no effect on the HPC values in these samples (105±15%). Ten HES treatments of two minutes each at power inputs of 20 W and 40 W also did not significantly affect the ATP concentration in microbial suspensions of NOX and P17 and mixed microbial communities obtained from GAC (recovery > 90%; n=4). HPC values increased after the first few treatments at both power inputs but further sonication obviously damaged the bacteria. This damage occurred after four to six treatments in the samples treated with 20 W and after two to four treatments in the samples that were treated with 40 W. Typical examples of this effect are shown in Figure 2.1. The de-crease of the HPC values following HES treatment fitted to an exponential function:
BT= B0.e -k.t (1)
where B0 is the HPC value in the untreated sample, and k (min-1) is the coefficient of exponen-tial decrease. Values of k for strain NOX, strain P17 and a mixed microbial community obtained from a GAC filter were calculated from the effects of ten subsequent HES treatments at power inputs of 20 and 40 W (Table 2.1). From these values it can be derived that the HPC values of strain NOX and the mixed microbial community decreased with 1 to 6 % for each minute of HES treatment in most cases but with strain P17 also decreases of 15 to 20% were observed (Fig. 2.1b). HES treatment affected strain P17 significantly (p < 0.05) more than strain NOX and the mixed microbial community from GAC. Furthermore, treatment at 40 W gave signifi-cantly larger k values than treatment at 20 W (p < 0.05).

37Chapter 2 Optimisation and significance of ATP analysis
figure. 2.1 effect of heS treatment on the hPc values of strain noX and strain P17 grown in tap water and a
mixed microbial community obtained from a Gac filter. abbreviations: n0, concentration at start (time zero, un-
treated sample); nt, concentration at time t. Symbols: , 20 W; , 40 W.
A125
100
75
50
25
00 2 4 6 8 10
Number of UST
strain NOX
NT /N
0 x 1
00%
B125
100
75
50
25
00 2 4 6 8 10
Number of UST
strain P17
125
100
75
50
25
00 2 4 6 8 10
Number of UST
Bacteria from GAC
C
organism high energy sonication (hes)
20 w 40 w
spirillum sp.
strain noX
0.018 ± 0.006 (r2= 0.59)
0.029 ± 0.002 (r2= 0.96)
0.041 ± 0.01 ( r2 = 0,82)
0.064 ± 0.006 (r2= 0.95)
0.041 ±0.004 (r2= 0.94)
0.078 ± 0.01 (r2 = 0.93)
Pseudomonas fluorescens
strain P17
0.040 ± 0.007 (r2= 0.82)
0.163 ± 0.006 (r2 = 0.99)
0.122 ± 0.01 (r2 = 0.97)
0.071 ± 0.012 (r2= 0.85)
0.226 ± 0.03 (r2 = 0.94)
0.147 ± 0.02 (r2 = 0.95)
Mixed Gac community 0.007 ± 0.004 (r2= 0.59)
0.054 ±0.01 (r2 = 0.94)
0.035 ± 0.002 (r 2= 0.99)
0.101 ± 0.02 (r2 = 0.82)
.2.3.2 Stability of ATP in the presence of GAC The effect of the adsorptive properties of GAC on the concentration of free ATP was tested with the internal standard addition method. The average recovery of free ATP was 104±7% (n=8) five minutes after the addition to tap water suspensions of virgin GAC and GAC from a filter bed. Two hours after the addition, the recovery of free ATP was 74±13% (n=4) for virgin
Table 2.1 coefficients of exponential decrease (k, min-1) of the cultivability of strain noX, strain P17 and a
mixed microbial community obtained from a Gac filter, after ten subsequent heS treatments at two power inputs.

38 Microbial activity in GAC filters in drinking water treatment
GAC and 91±12% (n=4) for GAC from a filter bed. The average recovery of ATP observed af-ter standard addition (97 ±3%; n=48) further demonstrated that carbon fines produced dur-ing sonication of GAC had no significant effect on the ATP measurement.
2.3.3 Removal of microorganisms from GAC Three samples from GAC filters and two sand samples from RSF filters were added to auto-claved tap water (0.1-0.3 g filter material cm–3) and subjected to LES or HES at 40 W for two minutes in a series of 6 to 20 treatments of two minutes each. The cumulative ATP yield of the biomass obtained with LES was 50±8 % (n = 5) of the biomass obtained with HES. GAC samples from two different filter beds and samples of PVC-P with attached microorganisms were treated with HES at power inputs of 10 to 40 W. Maximum removals were achieved at power inputs above 20 W (Fig. 2.2a). Subsequently, the effects of sequential HES treatments at 40 W on biomass removal was determined for GAC sampled from seven different filter beds. Four samples had ATP yields below 1000 ng ATP cm-3 of GAC and in 3 samples the ATP yield varied between 1000 and 3200 ng ATP cm-3 GAC. Typical examples of cumulative ATP yields are shown in Figure 2.2b. The data fitted well with the saturation kinetics as described by the Michaelis-Menten equation (0.91≤ r2 ≤ 0.99; n=7). In 5 of 7 samples the cumulative ATP yield as measured after six treatments was 90±3% of the maximum values calculated with this equation. GAC particles that had been sonicated ten times at 40 W cm-3 were stained with acridine orange and observed using fluorescence microscopy. The untreated particles emitted a high level of fluorescence but no fluorescent objects were observed on the treated particles (data not shown). Obviously, ten treatments had removed almost all attached biomass.
Power (W cm-3)
100
75
50
25
00 0.2 0.4 0.6 0.8 1.0
A
Rel
ativ
e AT
P yi
eld
(%)
, GAC#1, GAC#2
, PVCp
HES treatments
3500
3000
2500
2000
1500
1000
500
00 5 10 15 20
B
Cum
ulat
ive
yiel
d (n
g AT
P/ c
m2 )
figure 2.2 a. removal of attached bacteria from Gac and plasticized (PVc) PVcp at different power inputs of
heS; B, cumulative atP-yield as a function of the number of sonications in seven different Gac samples. the
relative atP yield (a) is Maximum observed value at applied power range.

39Chapter 2 Optimisation and significance of ATP analysis
1011
1010
109
108
107
101 102 103 104
ATP (ng/cm3)
TDC
(n/c
m3 )
A
, GAC, RSF
, SSF
101 102 103 104
ATP (ng/cm3)H
PC (C
FU/c
m3 )
B
, GAC, RSF
, SSF
109
1018
107
106
105
figure. 2.3 relationships between the atP concentrations and tdc values (a) and hPc values (B), respec-
tively in samples of filter material. Gac, granular activated carbon; rFS, rapid sand filters; SSF, slow sand filters.
Broken lines represent calculated relationships; dotted lines represent proportional relationships based on the
median values of the atP content per cell (a).
2.3.4 Active biomass in GAC filters, rapid sand filters and slow sand filters From a total of nine water treatment plants in The Netherlands samples were collected from 30 different GAC filters, nine rapid sand filters (RSF) and three slow sand filters (SSF) and anal-ysed for ATP, HPC and TDC, respectively. These samples were selected to include different con-ditions of filtration, viz. raw water source, DOC concentration, pretreatment, filter run time, filtration rate and carbon type (Table 2.2). Measurements on GAC samples were all conducted in duplicate. The median value of the variation coefficient for the ATP analysis (6%) was slightly lower than the variation coefficients for TDC (14%) and HPC (15%), respectively. Sig-nificant correlations were observed between values of ATP and TDC (p <0.05) in GAC filters and in RS filters (p < 0.05), respectively, but not between values of ATP and HPC (Fig. 2.3). The ATP concentrations in the GAC samples ranged from 25 to 5000 ng cm-3, thus covering more than two orders of magnitude. The ATP concentrations of the RSF samples also covered a wide range but values were below 100 ng ATP cm-3 in the SSF samples (Fig. 2.4). ATP concen-trations below 100 ng cm-3 were observed in GAC filters that had been in operation for a few weeks (samples 3 and 4). After 330 days the ATP concentration in these filters had increased tenfold (samples 21 and 22). The ATP concentration in GAC filters supplied with ozonated water (samples 15 and 40) was about 2 to 3 times higher than in filters operating under simi-lar conditions but supplied with non-ozonated water (samples 7 and 32). At two of the nine investigated locations, two-stage GAC filtration was applied. The ATP concentration in the first stage filters at both locations (samples 20 and 37) was higher than in the second stage filters (samples 19 and 18).

40 Microbial activity in GAC filters in drinking water treatment
2.4 discussion
2.4.1 Method developmentRemoval of attached biomass from the GAC surface and its subsequent quantification by ATP are essential steps in the determination of the concentration of active biomass on GAC with the method developed in this study. LES treatment did not affect the ATP concentration and cultivability of the sonicated bacteria but was clearly less effective in biomass detachment than HES treatment. The first HES treatment incidentally caused some increase of the ATP concen-
Table 2.2 operational parameters of filtration units and ranges of biomass concentrations on filter material.
ct contact time, V filtration rate.
filter type
(n.samples)
run time
(days)
cT
(min)
v
(m h-1)
doc
(mg l-1)
aTP
(ng cm –3)
hPc
(cfu cm –3)
Tdc
(cells cm –3)
SSF
(n=3)
675-2000 30-240 0.25-0.5 1.4-3.2 18-93 4 105- 5 105 3 107 – 2 108
rSF
(n=9)
820-7300 5-20 3-11 2.0-3.2 16-2592 4 105 - 1 108 3 107 – 2 1010
Gac
(n=30)*
7-1580 10-45 3-10 1.8-5.4 24-5067 1 107 - 1 109 1 109 – 4 1010
*number of samples tested for atP concentration
Sample number
1004
1003
1002
10
1 5 10 15 20 25 30 35 40
Activ
e bi
omas
s (n
g AT
P/cm
3 )
GAC RSF SSF
figure. 2.4 active-biomass concentrations in Gac, rSF and SSF samples from 9 water treatment plants in the
netherlands.

41Chapter 2 Optimisation and significance of ATP analysis
tration but subsequent sonications slightly decreased the ATP concentration, with the total de-crease remaining less than 10% after ten HES treatments. The slight initial increase of the ATP concentration and the HPC values after HES treatment may be attributed to a disintegration of clusters of bacteria during sonication and a subsequent better performance of nucleotide releasing reagent on individual bacteria. However, further HES treatment clearly damaged bac-teria, as is demonstrated by the decreasing HPC values with increasing number of sonications (Fig. 2.1). The effect depends on the nature of the bacteria and the intensity of sonication, with HES treatments at 40 W damaging significantly more bacteria than treatment at 20 W (Table 2.1). The observed inactivation of strain NOX and the mixed microbial community of 3 to 9 % for each minute of HES treatment at 40 W agrees well with the inactivation (7 to 10%) report-ed for Escherichia coli for each minute of HES treatment (Hua and Thompson 2000).
Both virgin and colonised GAC did not effect the concentration of added ATP when the mea-surement was performed five minutes after addition. This observation demonstrates that free ATP (i) is relatively stable in the presence of GAC, (ii) does not adsorb rapidly onto GAC and (ii) is not rapidly utilised by the attached microorganisms. Also carbon fines eroding from GAC during sonication did not have a significant effect on the light yield at the applied sample vol-umes. The removal of attached bacteria depends on the power input of ultrasound. Maximum removal of attached bacteria from GAC is obtained with HES treatment at power inputs above 20 W (Fig. 2.2a). Six to eight HES treatments removed about 90% of the maximum biomass yield as calculated with the Michelis-Menten equation (Fig 2.2b), but these treatments may significantly affect the cultivability of the bacteria (Fig. 2.1). Based on these observations the following procedure for removal of bacteria from GAC was established. A total of 2 to 5 gram of wet filter material is added to 50 cm3 of autoclaved tap water and treated with a series of six HES treatments at 40 W of two minutes each. After each HES treatment, the detached bacteria are separated from the material to avoid the damaging effect of subsequent treatments and stored on ice (< 30 min) prior to biomass analysis (ATP, HPC).
2.4.2 Biomass concentration in GAC filtersThe significant correlation with TDC values and the low value of the variation coefficient of the ATP measurement confirmed that ATP is a suited parameter for the quantification of active biomass in GAC filters. Attractive properties of the ATP analysis include the short time re-quired for analysis, the low detection level and the knowledge about the ecological and physi-ological significance of ATP Limitations of the parameter are the variations of the ATP content of cells depending on the growth phase and temperature and the sensitivity of the enzymatic reaction for certain inorganic compounds, e.g. copper and calcium (Karl 1980). Hence, the analytical procedures must be conducted under strictly defined conditions.
The concentrations of ATP in most GAC samples in this study were clearly higher than the val-ues (60-200 ng ATP cm-3 GAC) reported by Van Leeuwen et al. (1985). The ATP concentration of 80 ng ATP g-1 dry weight sand as reported for an SSF sample (Seger and Rothman 1996) was similar to the values found in this study. The low biomass concentrations in SSF can be attrib-uted to the low load with biodegradable compounds, viz. a low filtration rate (0.25 to 0.5 m h-1) in combination with a low concentration of biodegradable compounds in the influents of these filters which are at the end of the treatment chain. The similarities between concentra-

42 Microbial activity in GAC filters in drinking water treatment
tions of active biomass in GAC and RS filters may be explained by similarities in operational process parameters viz. filtration rate (3 - 10 m h-1) and water quality. This study showed that GAC filters supplied with ozonated water contained about 2 to 3 times more active biomass than filters fed with non-ozonated water operating under the same hydraulic conditions. This observation is consistent with the observation that biomass levels as determined with INT in biofilter systems operated with ozonated water were about 50% higher than in identical sys-tems operating with non-ozonated water. (Fonseca et al. 2001). Furthermore, a 50% reduction of biomass (measured as phospholipids) on GAC was observed after switching from ozonated to non-ozonated the influent water (Wang et al. 1995). Hence, preoxidation, running time and also the position of the filter beds in water treatment are dominant parameters affecting the biomass concentration in GAC filters. Quantification of these effects, and also the impact of carbon type, requires further investigation
The surface area, which is important for the transport of substrate from the water phase to the GAC surface, can be estimated at approximately 50 to 100 cm2 g–1 when spherical shapes are assumed for the GAC particles (Sontheimer 1985). The observed values of 25 to 5000 ng ATP cm-3 of GAC, with an average dry weight of about 0.5 g cm-3, thus correspond with 500 to 2x10⁵ (median: 104) pg ATP cm-2 of this surface. These values are in the same range as biomass concentrations in fouling spiral wound membranes used in water treatment and on plastic ma-terials in contact with biologically stable water but much higher than most biofilm concentra-tions observed in distribution systems in the Netherlands (van der Kooij 1999; Vrouwenvelder et al. 1998). The concentrations of biomass carbon on GAC, as calculated with the conversion factor C = 250 x ATP (Karl 1980), ranged from 6.3 to 1250 (median: 80) µg C cm-3 of GAC. These values clearly exceed the biomass concentrations previously reported for GAC (< 10 µg C cm-3) used in water treatment (Servais et al. 1991) and are also higher than the value for the maximum capacity of GAC for bacterial fixation (20 µg C cm-3) and the maximum adsorption capacity for bacteria (40 µg C cm-3) as defined in the Chabrol model (Billen et al. 1992). Most biomass carbon concentrations estimated for the surface of spherical GAC particles (0.13 to 50 µg C cm-2) are also higher than those (0.1 to 1.2 µg C cm -2) reported for drinking water dis-tribution systems (Niquette et al. 2000). The surface of GAC potentially available to microbial attachment, which includes the surfaces of all pores larger than 1 µm, is about 20 times larger than the surface of the spheres (Wheeler et al. 1983). The average biomass concentrations calculated for this surface (25 – 10,000 pg ATP cm-2; 0.01 – 2.5 µg C cm-2) are similar to con-centrations observed on surfaces exposed to treated water.
2.4.3 Relationships between HPC, TDC and ATP analysis The HPC values in GAC samples measured in this study correspond well with values reported earlier (Klotz 1975; Van der Kooij 1983; Cairo et al. 1979) and also with the numbers of active bacteria calculated from the respiration of radiolabeled substrate (Servais et al. 1994). Only small fractions of all bacteria (0.02 to 9%) produced colonies on R2A medium. The impact of sonication on cultivability is limited in comparison to these low percentages. The observed TDC values (up to 4 1010 cells cm-3 GAC) are clearly higher than the values obtained with scan-ning electron microscopy (108 cells g-1 wet GAC; Klotz 1979) and fluorescence microscopy (109 cells gram-1 wet GAC; DiGiano et al. 1992). The relatively high TDC values may be explained by the release of microbial cells from the pore surfaces, which are not visible with microscopy.

43Chapter 2 Optimisation and significance of ATP analysis
From the TDC values it can be derived that the present cells do not form a real biofilm on the GAC surface. The average coverage of the total accessible surface (up to 4000 cm2 cm-3 GAC) is less than 5 % at TDC values below 1010 cells cm-3. This low percentage indicates that the growth of bacteria on the GAC surface of the pores larger than 1 µm is limited by the availabil-ity of biodegradable compounds.
The average ATP content per cell, which is a measure for metabolic activity, ranged from 7 10-9
to 2 10-7 ng ATP cell–1 for the filter bed materials (Table 2.2). The median ATP content of cells on GAC (2.1 10-8 ng ATP cell-1) is at the low range of the ATP content reported for groundwater bacteria (2 10–8 to 4 10–7 ng ATP cell-1; Jensen 1989, Metge et al. 1993) and bacteria on mem-branes used in water treatment (2 10-8 to 7 10-7 ng cell-1; Vrouwenvelder et al. 1998). This me-dian value is also lower than 10-7 ng ATP cell-1 reported for starving cells (Webster et al. 1985), indicating rather low metabolic activities of the cells on GAC. The median value of the ATP content of the cells in RS filters (3.6 10-7 ng/cell) was about 10 times higher than the value obtained for the GAC filters. These observations indicate that (i), the cells in GAC filters were smaller and/or less active than those in RS filters and (ii), TDC values are not suited for quan-titative assessment of the biomass concentration but give valuable information when used in combination with measurements of ATP or cell size. The high ATP content of the cells in RS filters suggests a relatively high growth rate, which may be explained by the frequent and in-tensive backwashing of these filters. The effects of the difference in cell activities (and growth rates) between GAC and RS filters on biodegradation processes are not yet clear. The biomass activity in GAC filters will be further investigated by determining the identity and physiologi-cal properties of the predominating bacteria.
conclusions
1. HES treatment is more effective than LES treatment for the removal of biomass from GAC; it does not affect the concentration of free ATP, but reduces cultivability. Modeling indicates that more than 90% removal of attached biomass (ATP) is achieved with a series of six to eight HES treatments at 40 W power input.
2. The uptake of free ATP by cells or GAC is negligible in the applied procedure when the analy-sis is conducted five minutes after sonication and ATP analysis is not affected by carbon fines released during sonication. ATP concentrations in GAC filters and in RS filters correlate sig-nificantly with the TDC values in each of these filter types, but the median value of the ATP content of the cells in GAC filters is about 10 times lower than in RS filters;
3. ATP concentrations in GAC filters in water treatment cover a wide range of concentrations. Biomass concentration on GAC was affected by running time and pretreatment with ozone. The concentrations of active biomass on GAC calculated for the total accessible surface are at the same range as concentrations of biofilms in distribution systems, indicating a limited avail-ability of growth substrates.

44 Microbial activity in GAC filters in drinking water treatment
2.6 references
Billen G., Servais P., Bouillot P. and Ventresque C.
(1992). Functioning of biological filters used in drink-
ing water treatment – the CHABROL model. J. Water
SRT-Aqua 41, 231-241.
Cairo P.R., McElhaney J. and Suffet I.H. (1979).
Pilot plant testing of activated carbon adsorption sys-
tems. J. Am.Wat. Wks. Assoc. 71, 660-673.
Camper A.K., LeChevallier M. W., Broadaway S.
C. and McFeters G.A. (1985) Evaluation of procedures
to desorb bacteria from granular activated carbon. J.
Microbiol. Methods. 3,187- 198.
Carlson K.H., Garside G. L. A. H. and Blais G.
(1996) Ozone-induced biodegradation and removal
of NOM and ozonation byproducts in biological filters.
Advances in Slow Sand and Alternative Biological Filtra-
tion, Eds. Graham N. and Collins, R., pp. 61-71. John
Wiley &Sons, Chichester, England.
DiGiano A.F., Mallon K., Stringfellow W., Cobb N.,
Moore J. and Thompson J.C. (1992). Microbial activ-
ity on filter-adsorbers. AWWA Research Foundation,
Denver, USA C.Thompson Camp Dresser & McKee Inc.
Maitland, Florida.
Fonseca A.C., Summers R. S. and Hernandez
M.T. (2001). Comparative measurements of microbial
activity in drinking water biofilters. Wat. Res., 35(16),
3817-3824.
Hobbie J.E., Daley R.J.and Jasper S. (1977). Use
of nucleopore filters for counting bacteria by fluores-
cence microscopy. Appl. Environ. Microbiol., 33 (5),
1225-1228.
Hua I. J. and Thompson E. (2000). Inactivation
of Escherichia coli by sonication at discrete ultrasonic
frequencies. Wat. Res., 34 (15), 3888-3893.
Jensen, B. K. (1989). ATP-realted specific het-
erotrophic activity in petroleum contaminated and
uncontaminated groundwaters. Can. J. Microbiol., 35,
814-818.
Karl D. M. (1980). Cellular nucleotide measure-
ments and implications in microbial ecology. Microbiol.
Rev., 44, 739-796.
Klotz M., Werner P., und Schweisfurt R. (1975).
Untersuchungen zur Microbiologie der Aktivekohlefilter.
Veröffentlichungen der Bereichs des Lehrstuhls für
Wasserchemie. Heft 9. Pp, 270-282. Engler-Bunte-
Institut der Universität Karlsruhe.
Klotz M. (1979). Mikrobiologische Untersuchungen
zur Trinkwasseraufbereitung mit Aktivkohle. Thesis,
Universitat des Saarlandes, Saarbrücken.
Mathieu L., Block J.C., Dutean M., Maillard J. and
Reasoner D. (1993). Control of biofilm accumulation
in drinking water distribution systems. Water Supply,
11(3/4), 365-376.
Metge D.W., Brooks M.H., Smith R.L. and Harvey
R.W. (1993). Effect of treated-sewage contamination
upon bacterial energy-charge, adenine nucleotides
and DNA content in a sandy aquifer on Cape Cod. Appl.
Environ. Microbiol., 59(7), 2304-2310.
Niquette P., Serviais P. and Savoir R. (2000). Im-
pacts of pipe materials on densities of fixed bacterial
biomass in a drinking water distribution system. Wat.
Res., 34(6), 1952-1956.
Orlandini E. (1999). Pesticide removal by combined
ozonation and granular activated carbon filtration The-
sis Wageningen University and International Institute
for Infrastructural, Hydraulic and Environmental Engi-
neering Delft, A.A. Balkema, Rotterdam.
Seger A. and Rothman M. (1996). Slow sand filtra-
tion with and without ozonation in Nordic climate In
Graham and Collins (ed.), Advances in Slow Sand and
Alternative Biological Filtration. Eds. Graham N. and
Collins R., pp. 119-129. John Wiley &Sons, Chichester,
England.
Servais P., Billen G., Ventresque C. and Bablon
G.P. (1991). Microbiological activity in GAC filters at
the Choisy-le-Roi treatment plant. J. Am. Water Works
Assoc., 83 (2), 62-68.
Servais P., Cauchi B. and Billen G. (1994). Experi-
mental study and modelling bacterial activity in biolog-
ical activated carbon filters. Water Supply, 14, 223-231.
Sontheimer H., Heilker E., Jekel M.R., Nolte H.
and Vollmer F.H. (1978). The Mulheim Process.Journal
AWWA, 70, 393-396.
Sontheimer H., Frick B.R., Fettig J., Horner G.,
Hubele C., and Zimmer G. (1985). Adsorptionsver-

45Chapter 2 Optimisation and significance of ATP analysis
fahren zur Wasserreinigung DVGW-Forschungsstelle
am Engler-Bunte-Institut der Universität Karslruhe.
Braun GmbH Karsruhe.
Urfer D. and Huck P.M. (2000). Measurement of
biomass activity in drinking water biofilters using a
respirometric method. Water Res., 35(6), 1469-1477.
Van der Kooij D. (1983). Biological processes in
Carbon filters. In Activated carbon in drinking water
technology, pp. 119-153. Am. Water Works Assoc,
Denver.
Van der Kooij D. (1992). Assimilable organic car-
bon as an indicator of bacterial regrowth. J. Am. Water
Works Assoc., 84(2),57-65.
Van der Kooij D., Veenendaal H.R., Baars-Lorist
C., van der Klift D.W., and Drost Y.C. (1995). Biofilm
formation on surfaces of glass and teflon exposed to
treated water. Wat. Res., 29(7),1655-1662.
Van der Kooij D., van Lieverloo J.H.M., Schellart J.
and Hiemstra P. (1999). Maintaining quality without a
disinfectant residual. J. Am. Water Works Assoc., 91(1),
55- 64.
Van der Kooij D. and Veenendaal H. R. (2001).
Biomass production potential of materials in contact
with drinking water, method and practical importance.
Water Sci. Technol. Water Supply, 1(3), 39-45.
Van Leeuwen J., Nupen E.M. and Carstens P.A. Du
T. (1985). The influence of ozone, oxygen and chlorine
on biological activity of biological activated carbon.
Ozone Sci. Eng., 7 (4), 287-297.
Vrouwenvelder J.S., Van Paassen J.A.M., Folmer
H.C., Hoffman J.A.M.H., Nederlof M.M. and Van der
Kooij D. (1998). Biofouling of membranes for drinking
water production. Desalination, 118, 157-166.
Wang J.Z., Summers R.S. and Miltner R. J. (1995).
Biofiltration performance, part 1, relationship to bio-
mass. Filtration, J. Am. Water Works Assoc., 87, 55-63.
Weber W.J., Pirbazari M. and Melson G.L. (1978).
Biological Growth on Activated carbon, An investiga-
tion by Scanning Electron Microscopy. Environ. Sci.
Technol., 12(7), 817-819.
Webster Jr. J.W., Hampton G.J., Wilson J.T.,
Ghiorse W.C. and Leach F.R. (1985). Determination of
microbial cell numbers in subsurface samples. Ground
Water, 23 (1), 17-25.
Wheeler, Shull, Barrett-Joyner-Halenda, Cranston-
Inklet, Dollimore-Heal. (1983). Corrections on pore
size calculation with the Kelvin equation. In Activated
carbon, a fascinating material. Eds. A. Capelle and F.
de Vooys, pp, 13-39. Norit N.V. Amersfoort, The Neth-
erlands.
White D.C., Bobbie R.J., Morrison S.J., Oosterhof
D.K., Taylor C.V. and D.A. Meeter (1977). Determina-
tion of microbial activity of estuarine detritus by rela-
tive rates of lipid biosynthesis. Limnol Oceanogr., 22,
1089.


3Polaromonas and HydrogenoPHaga SPecieS are
the PredoMinant Bacteria cultured FroM
Granular actiVated carBon FilterS in Water
treatMent
CHAPTER
This chapter is based on publication:
Magic-Knezev A, Wullings B., Van der Kooij D. 2009. Polaromonas and Hydrogenophaga species are the predominant bacteria cultured from granular activated carbon filters in water treatment. Journal of Applied Microbiology 107(5), 1457-1467

ABSTRACT Aim: Identifi cation of the predominating cultivable bacteria in granular activated carbon (GAC) fi lters used in a variety of water treatment plants for selecting re-presentative strains to study the role of bacteria in the removal of dissolved organic matter. Methods and Results: Bacterial isolates were collected from 21 GAC fi lters in nine water treatment plants treating either ground water or surface water with or without oxidative pretreatment. Enrichment of samples in dilute liquid medium improved culturability of the bacteria by approximately log unit, to 9% up to 70% of the total cell counts. Genomic fi ngerprinting and 16S rRNA sequence analysis revealed that most (68%) of the isolates belonged to the Betaproteobacteria and 25% were identifi ed as Alphaproteobacteria. The number of different genera within the Betaproteobacteria was higher in the GAC fi lters treating ozonated water than in the fi lters treating nonozonated water. Polaromona was observed in nearly all of the GAC fi lters (86%), and the genera Hydrogenophaga, Sphingomonas and Afi pia were observed in 43%, 33% and 29% of the fi lter beds, respectively. AFLP analysis revealed that the predominating genus Polaromonas included a total of 23 different genotypes. Conclusions: This study is the fi rst to demonstrate that Polaromonas, which has mainly been observed in ultraoligotrophic freshwater environments, is a common component of the microbial community in GAC fi lters used in water treatment. Signifi cance and Impact of the Study: The predominance of ultraoligotrophic bac-teria in the GAC fi lters indicates that very low concentrations of substrates are available for microbial growth. Polaromonas species are suited for further studies on the nutritional versatility and growth kinetics enabling the modelling of biodeg-radation processes in GAC fi lters.

49Chapter 3 Polaromonas and Hydrogenophaga cultured from GAC filters
3.1 inTroducTion
Granular activated carbon (GAC) filters are used in water treatment for the removal of natural organic matter (NOM) and organic micropollutants. The main removal mechanism is adsorp-tion, but part of the dissolved organic compounds is also removed by biological activity in these filters. Biodegradation processes improve the biological stability of the water by remov-ing biodegradable nonadsorbable organic compounds that may cause bacterial regrowth and biofilm formation in drinking water distribution systems (LeChevallier et al. 1987; van der Kooij et al. 1989; Servais et al. 2004). Furthermore, biodegradation of adsorbable organic compounds delays the saturation of adsorption sites, thereby increasing the quantity of organ-ic matter that can be removed by a GAC filter in a certain period of time (Wilcox et al. 1983). The concentration of micropollutants in filtered water most often determines the operational period of a GAC filter and postponed breakthrough of these compounds therefore reduces the costs of water treatment (Orlandini et al. 1997).
The efficiency of the biodegradation processes depends on the concentration and activity of the microbial biomass and the nutritional properties of the microbial community. The proper-ties of the microbial community are in turn determined by the composition and concentration of NOM and by the operational parameters (filtration rate, contact time and GAC properties) and temperature. Several methods are available for determining the concentration (or activ-ity) of biomass in GAC filters, e.g. oxygen consumption, tetrazolium reduction, phospholipids and adenosine triphosphate (ATP) (Camper et al. 1985; Urfer and Huck 2000; Fonseca et al. 2001; Magic-Knezev and van der Kooij 2004; Velten et al. 2007). Based on the data about ATP concentrations observed in the GAC filters, it can be estimated that at least 6–125 kg of dry weight of microbial biomass carbon is present in a filter bed containing 100 m3 of GAC (Magic-Knezev and van der Kooij 2004).
Information about the nutritional properties of the predominating bacteria is needed to eluci-date the biodegradation capacity of GAC filters. Bacteria isolated from GAC filters have been identified in most cases as members of the genera Pseudomonas, Acinetobacter, Caulobacter, Alcaligens, Flavobacterium and Bacillus (McElhaney and McKeon 1978; Wilcox et al. 1983; Stewart et al. 1990). However, these bacteria may not represent the microbial community be-cause substrate-rich solid media was used with an incubation time of a few days, yielding only small fractions of the bacteria present in oligotrophic environments (Reasoner and Geldreich 1985). Furthermore, many aquatic isolates remained unidentified because of restricted reac-tions with substrates used at high concentrations in the classic tests for the identification of bacteria. To date, molecular analytical methods enable effective identification of isolated bac-teria. Furthermore, culture- independent techniques revealed the existence of many unknown and uncultured bacteria and stimulated researchers to adapt the cultivation techniques for bacteria from environmental samples (Button et al. 1993; Bussmann and Schink 2001; Page et al. 2004). An advantage of using cultivation methods is that organisms are obtained for fur-ther studies.
The objectives of our study were: (i) identification of cultivable bacteria predominating in GAC filters used in water treatment and (ii) selection of representatives of these bacteria for

50 Microbial activity in GAC filters in drinking water treatment
further study. In this study, the number of cultivable bacteria was determined in GAC filters at a variety of full-scale water treatment plants in relation to the total microscopic count us-ing enrichment media with low nutrient concentration to favour growth of aquatic bacteria. Subsequently, isolates were collected and identified based on 16S rRNA sequences, and finger-printing techniques were applied to determine the diversity of pre- dominant isolates.
3.2 maTerials and meThods
3.2.1 Isolation of predominant bacteria Bacteria were isolated from 21 different GAC filters, the sand of six dual media (anthracite ⁄ sand) filters and one slow sand filter (SSF), respectively, at nine full-scale water treatment plants in The Netherlands. The GAC filters were operated at different conditions. The empty-bed contact time varied between 10 and 45 min and the filtration rate was in the range of 3–10 m h-1. The concentration of dissolved organic carbon varied between 1.5 and 5.5 mg L-1 and the water temperature ranged from 5 to 21°C. Filter material was collected, stored and treated with ultrasound to obtain suspended biomass as described previously (Magic-Knezev and van der Kooij 2004). The bacteria in the obtained suspensions were cultivated on solid medium. Appropriate decimal dilutions of the obtained bacterial suspensions were spread in triplicate over the surface of R2A agar (Oxoid) plates and incubated during 10 days at 25°C (Reasoner and Geldreich 1985). The colonies were counted and from these counts, the number of colony- forming units (CFU) cm-3 was calculated. From each sample, three colonies of the three most abundant colony types and colonies with a distinctive morphological feature were collected for further analysis.
The most probable number (MPN) method was used for enumeration of the concentration of the bacteria in samples of nine GAC filters. The liquid medium used for this purpose was prepared from the autoclaved influent of the GAC filter enriched with 5 mg L-1 of yeast extract (YE). The obtained biomass suspensions were decimally diluted in autoclaved tap water and inoculated in fivefold in 9-ml volume of the YE medium. Growth was monitored with ATP analysis during 14 days of incubation at 22°C. Subsequently, the concentration of bacteria was determined according to MPN method (Clesceri et al. 1996). Volumes of 0.1 ml from the highest dilution with growth were plated on R2A medium to obtain pure cultures. A total of 186 isolates were collected from the R2A plates and 25 isolates were collected from the liquid medium.
3.2.2 Identification of isolated bacteria Collected isolates were screened with the repetitive extragenic palindrome rep-PCR to iden-tify colonies with similar appearance and select the representatives for the sequencing of 16S rRNA. Full sequences were used to determine the phylogenetic position of an isolate and partial sequences were used to confirm the identity of isolates with rep-PCR pattern similarity >90%. AFLP fingerprints were used to evaluate the diversity within predominant genus.

51Chapter 3 Polaromonas and Hydrogenophaga cultured from GAC filters
3.2.3 Rep-PCR analysis Freshly grown colonies on R2A medium were suspended in 500µl of DNA-free water and DNA was extracted using the Bio-Rad DNA Extraction Kit, following the procedure prescribed by the manufacturer. Subsequently, a genomic fingerprint was generated using specific primers for the REP regions of DNA as described previously (Versalovic et al. 1991). The PCR products were separated using agarose gel electrophoresis (2.5% fine NuSieve 3:1; BMA, Rockland, ME, USA) at 60 V for 16 h. Gels were stained for 30 min with Cyber gold and digitized with Bio-Rad Gel Documentation System (Bio-Rad). REP- patterns were compared by the bionumerics software ver. 3.2 (Applied Maths NV) after the normalization to the 100-bp standard reference lanes (Invitrogen 100-bp DNA ladder, Cat no. 15628019), applying the unweighed pair group method. Rep-PCR fingerprints were generated from DNA of Aeromonas hydrophila (strain M800), Ps. fluorescens (strain P17) and Spirillum sp. (strain NOX) in six to nine series to deter-mine the variability of the procedure. These strains were grown and maintained on Lab-Lemco Agar (Oxoid).
3.2.4 AFLP analysis The AFLP technique for DNA fingerprinting adapted for analysis of Campylobacter strains was used (Duim et al. 1999). The final products were diluted 1 : 1 together with an internal lane standard (PE Applied Biosystems) and analysed on a short capillary ⁄ POP four polymer by using a model ABI 310 automated DNA sequencer. The obtained chromatograms were normal-ized with internal lane stan- dard and compared using bionumerics software ver. 3.2.
3.2.5 Sequencing and phylogenetic analysis The 16S rRNA was amplified after DNA isolation with PCR using Taq DNA polymerase with primers for conserved domains (Devereux and Willis 1995). Full 16S rDNA sequences were analysed using two internal primers (530R16 and 907F16) and two terminal primers (8R16 and 1510R16) and partial 16S rRNA sequences were analysed using one internal primer (907F16). The 16S rRNA sequences were assembled with the Croma Tool and the dnastar soft-ware package (DNAStar Inc., WI). Automatically aligned and subsequently manually corrected sequences were added to the ARB SSU rDNA database tree (Technische Universität München, Freising, Germany) using the quick parsimony tool without filters. The identity of isolates on the genus level was derived from their position in the ARB SSU rDNA database tree (Ludwig et al. 2004). Sequences were also compared with the sequences from the GenBank data-base using the Blast tool (http://www.ncbi.nlm.nih.gov/ blast) to identify the closest relatives.
3.2.6 Statistical analysis The differences between the proportions of different bacterial species or groups originating from the filters treating different water types were tested using the Z-test (http://onlinestat-book.com/rvls/) on difference between proportions at a confidence level of 95%.
3.2.7 Nucleotide sequence accession numbers All partial or full-length sequences from 16S rRNA gene sequences determined in this study have been deposited in the GenBank database under accession numbers EU130949–EU131006 and EU180508–EU180567.

52 Microbial activity in GAC filters in drinking water treatment
3.3 resulTs
3.3.1 Isolation of predominant cultivable bacteria The colony counts of bacteria on R2A medium ranged from 1 · 107 to 5 · 109 CFU cm-3 and rep-resented 0.2– 9% of the total direct cell count (TDC) values that ranged from 1 · 109 to 4 · 1010
cell per cm3 GAC (Magic- Knezev and van der Kooij 2004). The predominating col- ony types represented 20–50% of the colony counts and the second and third most abundant colony types represented 10–20% of these counts. A total of 186 isolates originating from different filter materials were collected from R2A plates. The number of isolates obtained from the GAC filters treating surface water (SW) exceeded the number of isolates from the GAC filters treating ground water (GW) as a result of the larger variety of colony types on R2A plates in-oculated with biomass obtained from filters treating SW. The first, second and third dominant colony types yielded a total of 86, 50 and 33 isolates, respectively. The remaining 17 isolates represented less abundant colony types with a distinctive morphologic feature, not found in other isolates, e.g. colour, shape or roughness of the colony.
The concentration of cultivable bacteria, estimated as MPN in liquid medium, ranged from 1.1 · 108 to 4.3 · 1010 cells per cm3 GAC. These concentrations were 0.4–2.2 log units (median 0 · 98) higher than the corresponding HPC values (Table 1). A total of 25 isolates were obtained as pure culture from the highest dilution with growth in liquid medium.
3.3.2 Selection and identification of cultured bacteria The pattern similarity of the rep-PCR genomic fingerprint determined for three control strains in multiple experiments varied between 84% and 98% for Aer. hydrophila strain M800 (n = 6) and Ps. fluorescens strain P17 (n = 8) and from 89% to 99% for Spirillum sp. strain NOX (n = 9). The rep-patterns within a species show more variation than between strains and a rep-PCR pattern similarity >90% was used for clustering of the isolates. Rep-PCR fingerprints were generated for all isolates collected from the solid medium. A total of 130 (70%) of the isolates were divided into 39 clusters, each with 2–12 isolates, with >90% similarity. Furthermore, 56 isolates (30%) occurred individually in the rep-PCR dendrogram. For representatives of each cluster and all individually occurring isolates, the sequence of 16S rDNA gene was determined. Full sequences were used to determine the phylogenetic position of an isolate and partial sequences were used to confirm the identity of isolates with rep-PCR pattern similarity >90%. Isolates within clusters with rep-PCR pattern similarity >90% showed >97% 16S rDNA sequence similarity confirm-ing the validity of the applied selection criterion for rep-PCR pattern similarity (>90%). A total of 112 selected isolates obtained from R2A plates and 25 isolates grown in the MPN tests were identified based on the complete or partial 16S rDNA sequence.
The phylum of the Proteobacteria represented about 94% of all isolates (Table 2). The propor-tions of Alpha- and Betaproteobacteria differed for the two culturing methods. Alphaproteobac-teria represented 22% of the isolates obtained from the solid medium and 44% of the isolates obtained from the liquid medium.
A total of 25% of the identified isolates were assigned to the class Alphaproteobacteria of which Sphingomonas (7.1%) and Afipia (4.3%) were most frequently represented. The iso-

53Chapter 3 Polaromonas and Hydrogenophaga cultured from GAC filters
lates identified as members of the genus Sphingomonas were found in 33% of the filter beds (7 ⁄ 21) and had >97% sequence similarities with five different Sphingomonas sp. strains (AB033945, AF395031, AF428806, AY038702 and AY509378). The isolates identified as members of the genus Afipia, which were found in 29% of the filter beds (6 ⁄ 21), had >97% sequence similarity with Afipia genosp. 11 (AGU87782 and AGU87779) or Afipia massiliensis (AY568510).
Table 3.1 concentration of bacteria from 9 Gac samples cultivated on solid (hPc) and in liquid medium (MPn).
sample hPc
cfu/ml (stdev)
mPn
n/ml (lower – upper*)
log
(mPn/hPc)
a 1.2 107(1.3 106) 1.2 108 (3.7 107 – 4.2 108) 1.0
B 4.0 107 (5.4 106) 1.1 108 (3.6 107 – 3.8 108) 0.4
c 5.9 107 1.4 108 (3.6 107 – 4.2 108) 0.4
d 1.9 108(1.3 107) 9.3 108 (1.8 108 – 4.2 108) 0.7
e 2.0 108 (2.3 107) 1.1 109 (4.0 108– 2.9 109) 0.7
F 2.4 108 (6.1 107) 2.3 109 (4.6 108 – 9.4 109) 1.0
G 3.6 108 (6.9 107) 4.3 1010 (9.0 109 – 1.8 1010) 2.1
e 4.9 108 (8.5 107) 2.0 1010 (4.5 109 – 4.2 1010) 1.6
h 7.1 108 (1.8 108) 7.5 109 (1.7 109 – 2.0 109) 1.0
*) 95% confidence limits.
The Betaproteobacteria represented 68% (143⁄211) of all isolates, of which the Comamonada-ceae represented 76% (108 ⁄ 143) and included 51% (108 ⁄ 211) of all collected isolates. The most frequently represented genus of this group was Polaromonas (26.5%), which represented 50% of the predominating colony types and 43% of the second predominating colony types. Polaromonas-related bacteria were isolated from 86% (18 ⁄ 21) of the filter beds (Table 2). Their concentration estimated from the colony counts ranged from 5 · 106 to 3 · 109 CFU cm-3
GAC and represented 1–8% of the TDC values. The concen- tration of Polaromonas-related bacteria in GAC filters estimated from the MPN values ranged from 5 · 107 to 3 · 1010 cells per cm3 GAC, i.e. 5–75% of the TDC values.
The genus Hydrogenophaga comprised 13.7% of all isolates and 20% of the Betaproteobacte-ria. Hydrogenophaga-related bacteria were isolated from 43% (9 ⁄ 21) of the filter beds inves-tigated (Table 2) and were dominant in two filter beds. These bacteria had >97% sequence similarity with five sequences in the NCBI database and represented mainly Hydrogenophaga palleronii (AF445679, AF523030, AF523047 and AF523069) or Hydrogenophaga taenospiralis (AF078768). Isolates identified as Hydrogenophaga were 21% of the second predominant col-ony types and 26% of the third predominant colony types. The concentration of Hydrogenoph-aga in GAC filters was estimated at 2 · 106–1 · 109 CFU cm3 GAC, i.e. 0.2–3% of the TDC values. The concentration of Hydrogenophaga- related bacteria in GAC filters obtained from the MPN

54 Microbial activity in GAC filters in drinking water treatment
Table 3.2 identity and number (proportion) of bacteria, number (proportion) of filter beds in which a certain
group is detected and number of filter beds in which this group was predominant.
identity number of isolates (%) Present
in filter beds (%)
Predominant
in filterbeds (%)
Betaproteobacteria
Polaromonas 56 (26.5) 18 (86) 11 (52)
Hydrogenophaga 29 (13.7) 9 (43) 2 (10)
methylibium 13 (6.2) 4 (19) 3 (14)
Ultramicrobacterium 9 (4.3) 2 (10) 1 (5)
aquaspirillum 8 (3.8) 4 (19) 0
Ideonella 6 (2.8) 2 (10) 0
acidovorax 4 (1.9) 1 (5) 0
Comamonadaceae. unclassified 3 (1.4) 1 (5) 0
Variovorax 3 (1.4) 1 (5) 0
alcaligenes 2 (0.90 1 (5) 0
Burkholderia 2 (0.9) 1 (5) 0
Pseudomonas 2 (0.9) 1 (5) 0
rubrivivax 2 (0.9) 1 (5) 0
Xylophilus 2 (0.9) 1 (5) 0
aquamonas 1 (0.5) 1 (5) 0
unclassified 1 (0.5) 1 (5) 0
alphaproteobacteria
sphingomonas 15 (7.1) 7 (33) 2 (10)
afipia 9 (4.3) 6 (29) 1 (5)
unclassified 6 (2.8) 4 (19) 1 (5)
Bradyrhizobium 5 (2.4) 2 (10) 0
Brevundimonas 4 (1.9) 2 (10) 0
rhodobacter 4 (1.9) 2 (10) 0
methylomonas 3 (1.4) 1 (5) 0
roseomonas 2 (0.9) 1 (5) 0
acetobacter 1 (0.5) 1 (5) 0
Caulobacter 1 (0.5) 1 (5) 0
deviosa 1 (0.5) 1 (5) 0
rhizobium 1 (0.5) 1 (5) 0
actinobacteria 9 (4.3) 3 (14) 0
Bacteriodetes 4 (1.9) 3 (14) 0
gammaproteobacteria 1 (0.5) 1 (5) 0
Firmicutes 2 (0.90) 2 (10) 0

55Chapter 3 Polaromonas and Hydrogenophaga cultured from GAC filters
tests was estimated at 2 · 107– 1 · 1010 cells per cm3 GAC, i.e. 2–25% of the TDC values. A total of 7.6% of all isolates were related to a methyl tert-butyl ether (MTBE), degrading bacterium (AF176594) of the unclassified Burkholderiales. These isolates had >97% sequence similarity with four sequences (AY622242, AY662010, AY212718 and AF176594). Cultivation in the liquid medium did not yield different genera when compared with the iso-lates from the solid medium.
3.3.3 Diversity of Polaromonas Most (66%) of the Polaromonas isolates had 99% similarity with an uncultured bacterium clone C-15 (AF523046) of the Comamonadaceae, obtained from bottled mineral water (Loy et al. 2005). The remaining isolates of the Polaromonas group had >97% sequence similarity with five other sequences (AY250094, AY752100, AF523013, AF407400 and AF523046). The complete or partial 16S rDNA sequences of these isolates showed >97% similarity with the sequences of Polaromonas vacuolata (Irgens et al. 1996), Polaromonas naphthalenivorans (Jeon et al. 2004) and Polaromonas aquatica (Kampfer et al. 2006; Fig. 1). AFLP analysis revealed that the isolates could be divided into 23 genotypes with >90% internal similarity (Fig. 2)
Uncultered Comamonadaceae I
Uncultered Comamonadaceae II
Uncultered Comamonadaceae (AF523013)Polaromonas vacuolata (U14585)
Polaromonas sp. (EF423340)Polaromonas sp. (EF423333)
Polaromonas sp. (EF423325)Polaromonas sp. (EF423330)
Polaromonas sp. (EF423322)
Polaromonas sp. (CP000316)Variovorax paradoxus (AF250030)
Polaromonas sp. (AM492164)Polaromonas aquatica (AM039830)
Polaromonas ginsengisoli (Ab245355)Polaromonas rhizosphaerae (Ef127651)
P. naphthalenivorans (CP000529)P. hydrogenivorans (DQ094183)
BAC309 (EU130977)BAC64 (EU130982)BAC70 (EU130985)
BAC315 (EU130980)BAC303 (EU130978)
BAC300 (EU130976)
BAC262 (EU130995)BAC41 (EU130997)
BAC305 (EU130979)BAC68 (EU130984)
BAC17 (EU130975)BAC25 (EU130990)
BAC163 (EU130998)BAC243 (EU130983)
BAC137 (EU130994)BAC23 (EU130991)
BAC104 (EU130986)BAC39 (EU130992)
BAC74 (EU130993)BAC311 (EU130981)
Glacier bacterium (AY315178)
Uncultered bacterium (AF407400)
68
6870
70
7178
92
52
9975
68
9960
9290
5357
8458
79
88 88
9169
0.01
7958
64
figure 3.1 Phylogenetic tree showing the diversity and the relatedness of isolates from Gac filters classi-
fied as members of genus Polaromonas. the tree is constructed from full-length 16S rrna sequences using the
neighbour-joining method with Felstenstein correction and termini filter using 1000 bootstrap replicates. Boot-
straps values above 50% are shown. the scale bar represents 1% evolutionary distance. Variovorax paradoxus is
used as the out-group.

56 Microbial activity in GAC filters in drinking water treatment
20 40 60 80 100
BAC300 (EU130976)BAC315 (EU130980)BAC303 (EU130978)BAC11 (EU130981)
BAC64 (EU130982)BAC70 (EU130985)BAC309 (EU130977)BAC25 (EU130990)
BAC74 (EU130993)BAC39 (EU130992)BAC41 (EU130997)
BAC68 (EU130984)BAC23 (EU130991)BAC262 (EU130995)
BAC163 (EU130998)BAC305 (EU130979)
BAC243 (EU130983)BAC104 (EU130986)
BAC17 (EU130986)
BAC137 (EU130986)
figure 3.2 Pearson correlation dendogram from aFlP patterns of Polaromonas-related isolates from Gac fil-
ters. the accession numbers were shown only for the isolates that were used to build the phylogenetic tree based
on 16S rrna sequences in Fig. 1.
3.3.4 Identity of the predominating cultured bacteria in relation to water origin and pretreatment
The GAC filters studied were supplied with different water types. The GAC filters treating either GW or SW showed similar relative abundances of the Betaproteo- bacteria (data not shown). The genus Polaromonas represented a significantly (P < 0.01) larger proportion (33%) of the isolates cultured from GAC filters supplied with ozonated water (OW) than from filters without oxidative pre-treatment (16%). Isolates of the genus Variovorax were only observed in filters treating nonoxidized groundwater. The genus Sphingomonas represented the predominating Alphaproteobacteria in GAC filters treating SW and the genus Afipia repre-sented the predominant

57Chapter 3 Polaromonas and Hydrogenophaga cultured from GAC filters
Alphaproteobacteria in the filters treating GW. The genera Caulobacter, Devosia, Methylobac-terium and Rhodobacter were only obtained from filters treating nonoxidized ground water, whereas members of the family Acetobacteraceae and the genera Brevundimonas, Rhizobium and Roseomonas were obtained only from filters treating OW. The latter genera and Rhodo-bacter were specific for filters treating SW and members of the genera Caulobacter, Devosia and Methylobacterium were specific for filters treating GW. The isolates collected from sand and anthracite layers of the rapid sand filtration (RSF) or slow sand filtration (SSF) were identified as members of the same genera that were observed in GAC filters. Also in these filters, members of the Comamonadaceae family were predomi-nant (53%).
3.4 discussion
3.4.1 Abundance and diversity The range of HPC values in GAC samples observed in this investigation correspond well with values reported earlier for GAC filters in water treatment (Camper et al. 1985; Stewart et al. 1990). These values represent a minor proportion (0.2–9%) of the TDC values and similar frac- tions of cultivable bacteria have been reported for oligotrophic aquatic environments and soil (Reasoner and Geldreich 1985; Bruns et al. 2001; Page et al. 2004; Janssen 2006). Adjustment of the culturing technique improved the cultivability of bacteria from GAC filters by approximately 1 log unit (median value; Table 2). This observation is consistent with re-sults of other studies, viz. an increase of the average cultivability of lake bacteria with 1.25 log units when the substrate and oxygen concentration were adjusted and for marine bacteria, a cultivability of 2–60% was reported with the dilution-culture technique (Button et al. 1993; Bussmann and Schink 2001). However, we did not observe differences in the identity of iso-lates harvested with the two culturing techniques. Hence, the dilution-culture technique yields isolates representing a significant proportion of the total bacterial community, which therefore can be used for further studies.
In previous studies, a limited number of rapidly growing bacteria, which were able to metabo-lize substances at high concentrations, and bacteria with specific features, e.g. formation of spores, were isolated from GAC filters, viz. members of the genera Pseudomonas, Alcaligenes, Acinetobacter, Flavobacterium, Caulobacter and Bacillus (Parsons et al. 1980; Stewart et al. 1990; White et al. 1996). The identity of the isolates collected in this study differed clearly from the identity of bacteria isolated in earlier studies on GAC filters. The differences may be attributed to: (i) optimized removal of bacteria from GAC surface, (ii) adjustment of culturing techniques and (iii) use of molecular methods for identification of isolated bacteria. Further-more, the nomenclature of many previously isolated bacteria has been adapted since the in-troduction of phylogenetic analysis based on 16S rDNA sequences. The species Alcaligenes, Ps. acidovorans and Ps. testosteroni have been reclassified to the Comamonadaceae as Variovorax paradoxus, Comamonas acidovorans and Comamonas testosteroni, respectively (Willems et al. 1991). Bacteria previously identified as Pseudomonas are presently classified as Sphingomonas (White et al. 1996). In this study, Polaromonas was identified as predominant genus in GAC filters and these bacteria represent a high proportion of the TDC values (up to 70%). To our

58 Microbial activity in GAC filters in drinking water treatment
knowledge, representatives of the genus Polaromonas have not been reported in earlier studies on GAC. Only a few species of this genus have yet been described (Irgens et al. 1996; Jeon et al. 2004; Kampfer et al. 2006). The genomic diversity of the isolates identified in this study as Polaromonas spp. (Figs 3.1 and 3.2) suggests that further classification into additional species may be expected in the future.
Comparison with the bacterial communities of freshwater habitats, including SW, treated water and bottled water and of soil, yield a number of similarities and differences, but this comparison is biased by the application of cultivation in this study. The predomination of the Betaproteobacteria (61–80%) in GAC filters in water treatment is consistent with the position of this bacterial class in communities of biofilms and planktonic bacteria in natural freshwater environments (Zwart et al. 2002; Brummer et al. 2003; Bruns et al. 2003; Eiler and Bertilsson 2004; Page et al. 2004; Gich et al. 2005) and in drinking water distribution systems (Kalm-bach et al. 1997). The smaller proportion of Alphaproteobacteria is consistent with studies on natural fresh water, but these bacteria represented more than 90% of isolates from a distribu-tion system simulator with a monochloramine residual and from a chlorinated drinking water distribution system (Williams et al. 2003). Alphaproteobacteria also are major constituents of the microbial communities in soil (Bodour et al. 2003; Janssen 2006), and in particle- as-sociated and free-living bacterial communities in water treatment systems and river water (Crump et al. 1999; Macdonald and Brozel 1999). The small fractions of representatives of the Gammaproteobacteria (<1%), the Actinobacteria (4Æ3%) and the Firmicutes (<1%) are consistent with studies on natural freshwater communities, bottled natural mineral water and soil (Eiler and Bertilsson 2004; Loy et al. 2005). However, the Bacteriodetes (1.9%) were a significant fraction (>25%) of the bacterioplankton community in Swedish lakes (Eiler et al. 2004) and the Actinobacteria equalled the presence of the Alpha- and Betaproteobacteria in a number of lakes and rivers (Zwart et al. 2002). These variations may be due to both differ-ences in water composition and comparing clones with isolates. The relatively high propor-tion of Alphaproteobacteria among isolates cultivated in liquid medium (44%) suggests that the abundance of Alphaproteobacteria in GAC filters may be underestimated by cultivation on R2A medium.
3.4.2 Relationship between identity of predominating bacteria and environmental conditions in GAC filters
The presence of bacteria in GAC filters depends on the interactions between environmental conditions and their physiological properties. The significant contribution of a few bacterial types found in the GAC filters treating different water types indicates that these bacteria are typical constituents of the bacterial community in GAC filters used in water treatment (Table 2). On the contrary, bacterial types represented by only a single isolate (singletons) also constituted a relatively large proportion (30%) of the isolated bacteria. The bacteria isolated from the GAC filters may have different origins, viz. (i) the feed water, (ii) the biomass accu-mulating between the GAC particles and (iii) the bacteria attached to GAC surface. Previous observations showed that the main proportion of bacteria in GAC filters is present on the sur-face of GAC particles (Magic-Knezev and van der Kooij 2004). Therefore, the predominating bacterial types represent mainly attached bacteria and ⁄ or bacteria present as accumulated biomass. The predominating types of bacteria cultured from the GAC filters belonged to a few

59Chapter 3 Polaromonas and Hydrogenophaga cultured from GAC filters
genera, of which Polaromonas was most frequently observed. Some genera were only inciden-tally observed but such observations could not be attributed to differences in environmental conditions.
The concentration of biodegradable compounds in the feed water of the GAC filters usually is relatively low. Oxidative pretreatment of the water increases the concentra- tion and diversity of biodegradable compounds leading to the increased bacterial abundance in these filters (Gagnon et al. 1997). Concentrations of easily assimilable organic carbon (AOC), mainly in-cluding carboxylic acids and aldehydes, may attain a level of 40–150 µg of C ⁄ l after ozonation. Without such oxidation, the AOC concentration remains <10 µg CL-1 in GW and <35 µg CL-1
in SW (van der Kooij et al. 1989; van der Kooij 1992). Descriptions of the nutritional versatil-ity of the predominating genera confirm that Polaromonas, Hydrogenophaga and Afipia prefer carboxylic acids and ⁄ or amino acids as growth substrates but are limited in the utilization of carbohydrates and generally do not hydrolyse proteins, carbohydrates or fats, (Garrity et al. 2005; Magic-Knezev and van der Kooij 2006). Polaromonas spp. generally are not observed in natural freshwater environments (Zwart et al. 2002; Eiler and Bertilsson 2004), but the or-ganism predominated in an ultraoligotrophic Crater lake, in contaminated GW and in bottled natural mineral water (Jeon et al. 2004; Page et al. 2004; Loy et al. 2005). Representatives of the genera Pseudomonas, Aeromonas, Aquaspirillum and Flavobacterium can multiply at concentrations of a few µg L-1 of low molecular weight compounds (van der Kooij et al. 1982; van der Kooij and Hijnen 1984, 1985), but were not detected in GAC filters or are present at a very low concentration. Obviously, Polaromonas spp. multiply even more efficiently at low concentrations of biodegradable compounds and ⁄ or attach more efficiently onto the GAC surface than these organisms. Indeed, the batch tests with Polaromonas isolates collected from the GAC filters revealed that these bacteria are able to multiply at very low concentrations of carboxylic acids and aromatic acids (Magic-Knezev and van der Kooij 2006). Elucidation of the predominant position of Polaromonas requires further investigations, e.g. survival at a low flux of nutrients, attachment properties and utilization of NOM present in SW and GW. Further-more, the contribution of these bacteria to the microbial community in GAC filters should be determined with culture-independent methods
3.4.3 Microbiological contaminant removal Adsorption processes play a major role in the removal of organic contaminants with GAC filtra-tion in water treatment (Orlandini 1999). Hydrogenophaga spp. can degrade MTBE (Hatzing-er et al. 2001; Kane et al. 2007). Polaromonas-related bacteria can utilize cis-dichloroethane or naphthalene as sole carbon source at a concentration of a few mg L-1 (Coleman et al. 2002; Jeon et al. 2004). Furthermore, Sphingomonas spp. are capable degrading a wide variety of xenobiotic compounds, including pesticides (White et al. 1996). The concentrations of MTBE and pesticides in SW used for water treatment usually is low (<1 µg L-1; Achten et al. 2002) and it is uncertain if biodegradation of these compounds occurs in GAC filter beds in the pres-ence of clearly higher concentrations of biodegradable NOM. In addition, a contribution of these bacteria to the removal of xenobiotic organic compounds at suddenly elevated concen-trations is uncertain, because adaptation seems to be slow (Coleman et al. 2002).
60 Microbial activity in GAC filters in drinking water treatment
3.5 acknowledgemenTs
This study was carried out within the framework of the Joint Research Program of the Water Supply Companies in the Netherlands, with financial support of Senter- Novem. The authors are grateful to Leo Heijnen en Stefan Voost (KWR Watercycle Research Institute) for their con-tribution in the AFLP analysis and to Paul Baggelaar for the statistical analysis.
3.6 references
Achten C., Kolb A. and Puttmann W. (2002) Meth-
yl tert- butyl ether (MTBE) in river and wastewater in
Germany. Environ. Sci. Technol., 36, 3652–3661.
Bodour A.A., Wang J.M., Brusseau M.L. and Maier
R.M. (2003) Temporal change in culturable phenan-
threne degrad- ers in response to long-term exposure to
phenanthrene in a soil column system. Environ. Micro-
biol., 5, 888–895.
Brummer I.H.M., Felske A., and Wagner-Dobler I.
(2003) Diversity and seasonal variability of a-proteo-
bacteria in biofilms of polluted rivers, analysis by tem-
perature gradient gel electrophoresis and cloning. Appl.
Environ. Microbiol., 69, 4463–4473.
Bruns M.A., Hanson J.R., Mefford J. and Scow
K.M. (2001) Isolate PM1 populations are dominant
and novel methyl tert-butyl ether-degrading bacterial
in compost biofilter enrichments. Environ. Microbiol.,
3, 220–225.
Bruns A., Nubel U., Cypionka H. and Overmann
J. (2003) Effect of signal compounds and incubation
conditions on the culturability of freshwater bacterio-
plankton. Appl. Environ. Microbiol., 69, 1980–1989.
Bussmann I.B.P. and Schink B. (2001) Factors
influencing the cultivability of lake water bacteria. J
Microbiol Methods, 47, 41–50.
Button D.K., Schut F., Quang P., Martin R. and
Robertson B.R. (1993) Viability and isolation of marine
bacteria by dilution culture, theory, procedures, and
initial results. Appl. Environ. Microbiol., 9, 881–891.
Camper A.K., LeChevallier M.W., Broadaway S.C.
and McFeters G.A. (1985) Evaluation of procedures to
desorb bacteria from granular activated carbon. J Mi-
crobiol. Methods., 3, 187–198.
Clesceri L.S., Greenberg A.E. and Eaton,A.D. (ed)
(1996) Standard Methods for the Examination of Water
and Waste- water, 19th edn. Washington, American
Public Health Association.
Coleman N.V., Mattes T.E., Gossett J.M. and Spain
J.C. (2002) Biodegradation of cis-dichloroethene as
the sole carbon source by Betaproteobacterium. Appl.
Environ. Microbiol., 68, 2726–2730.
Crump B.C., Armbrust E.V. and Baross J.A. (1999)
Phylo- genetic analysis of particle-attached and free-
living bacterial communities in the Columbia river, its
estuary, and the adja- cent coastal ocean. Appl. Environ.
Microbiol., 65, 3192–3204.
Devereux R. and Willis S.G. (1995) Amplification
of ribo- somal RNA sequences. In Molecular Microbiol-
ogy Manual 3.3.1, ed. Akkermans, A.D.L., van Elsas,
J.D. and de Bruijn, F.J. pp. 1–11. Dordrecht, Kluwer
Academic Publishers.
Duim B., Wassenaar T.M., Rigter A. and Wagenaar
J. (1999) High-resolution genotyping of Campylobacter
strains iso- lated from poultry and humans with ampli-
fied fragment length polymorphism fingerprinting.
Appl. Environ. Microbiol., 65, 2369–2375.
Eiler A. and Bertilsson S. (2004) Composition
of freshwater bacterial communities associated with
cyanobacterial blooms in four Swedish lakes. Environ.
Microbiol., 6, 1228– 1243.
Fonseca A.C., Summers R.S. and Hernandez
M.T. (2001) Comparative measurements of microbial
activity in drink- ing water biofilters. Wat. Res., 35,
3817–3824.
Gagnon G.A., Booth S.D.J., Peldszus S., Smith D.
and Huck P.M. (1997) Carboxylic acids, formation and
removal in full scale plants. J Am. Water Works Assoc.,
89, 88–97.
Garrity G.M., Brenner D.J., Krieg N.R. and Staley
J.T. (2005) Bergey’s Manual of Systematic Bacteriol-

61Chapter 3 Polaromonas and Hydrogenophaga cultured from GAC filters
ogy, 2nd edn, Vol. 2. New York, Springer.
Gich F., Schubert K., Bruns A., Hoffelner H. and
Overmann J. (2005) Specific detection, isolation and
characterization of selected, previously uncultured
members of the fresh- water bacterioplankton commu-
nity. Appl. Environ. Microbiol., 71, 5908–5919.
Hatzinger P.B., McClay K., Vainberg S., Tugusheva
M., Condee C.W., and Steffan R.J. (2001) Biodegrada-
tion of methyl tert-butyl ether by a pure bacterial cul-
ture. Appl. Environ. Microbiol., 67, 5601–5607.
Irgens R.L., Gosink J.J., and Staley J.T. (1996)
Polaromonas vacuolata gen. nov., sp. nov., a psychro-
philic, marine, gas vacuolate bacterium from Antarc-
tica. Int. J. Syst. Bacteriol., 46, 822–826.
Janssen P.H. (2006) Identifying the dominant soil
bacterial in libraries of 16S rRNA genes. Appl. Environ.
Microbiol., 72, 1719–1728.
Jeon C.O., Park W., Ghiorse W.C. and Madsen
E.L. (2004) Polaromonas naphthalenivorans sp. nov., a
naphthalene- degrading bacterium from naphthalene-
contaminated sedi- ment. Int. J. Syst. Evol. Microbiol.,
54, 93–97.
Kalmbach S., Manz W. and Szewzyk U. (1997)
Isolation of new bacterial species from drinking water
biofilms and proof of their in situ dominance with
highly specific 16S rRNA probes. Appl. Environ. Micro-
biol., 63, 4164–4170.
Kampfer P., Busse H.J., and Falsen E. (2006) Polar-
omonas aquatica sp. nov., isolated from tap water. Int.
J. Syst. Evol. Microbiol., 56, 605–608.
Kane S.R., Chakicherla A.Y., Chain P.S., Schmidt R.
Shin, M.W., Legler T.C., Scow K.M., Larimer F.W., et al.
(2007) Whole-genome analysis of the methyl-tert-bu-
tyl- ether-degrading Betaproteobacterium Methylibium
petrolei- philum PM1. J Bacteriol., 189, 1931–1945.
LeChevallier M.W., Babcock T.M. and Lee R.G.
(1987) Examination and characterization of distribu-
tion system biofilms. Appl. Environ. Microbiol., 53,
2714–2724.
Loy A., Beisker W. and Meier H. (2005) Diversity
of bacteria growing in natural mineral water after bot-
tling. Appl. Environ. Microbiol., 71, 3624–3632.
Ludwig W., Strunk O., Westram R., Richter L.,
Meier H., Yadhukumar Buchner A., Lai T. (2004) ARB,
a software environment for sequence data. Nucleic
Acids Res., 32, 1363–1371.
Macdonald R. and Brozel V.S. (1999) Community
analysis of bacterial biofilms in a simulated recirculat-
ing cooling- water system by fluorescent in situ hybridi-
sation with rRNA-targeted oligonucleotide probes. Wat.
Res., 34, 2439–2446.
Magic-Knezev A., and Van der Kooij D. (2004) Op-
timisation and significance of ATP analysis for measur-
ing active bio- mass in granular activated carbon filters
used in water treatment. Wat. Res., 38, 3971–3979.
Magic-Knezev A., and Van der Kooij D. (2006)
Nutritional versatility of two Polaromonas-related bac-
teria isolated from biological granular activated carbon
filters. In Recent Progress in Slow Sand and Alternative
Biofiltration Processes ed. Gimbel, R., Graham, N.J.G.
and Collins, M.R. pp. 303 311 London, IWA publishers.
McElhaney J.B., and McKeon W.R. (1978) Enu-
meration and identification of bacteria in granular acti-
vated carbon columns. In Proceedings of the 6th Water
Quality Technology Conference ed. Louisville, K.Y. pp.
63–68 Denver, American Water Works Association.
Orlandini E., Gebereselassie T.G., Kruithof J.C. and
Schippers J.C. (1997) Effect of ozonation on preload-
ing of background organic matter in granular activated
carbon filters. Water Sci. Technol., 35, 295–302.
Orlandini E. (1999) Pesticide Removal by Combined
Ozonation and Granular Activated Carbon Filtration.
PhD Thesis. IHE, Delft, Netherlands.
Page K.A., Connon S.A. and Giovannoni S.J.
(2004) Representative freshwater bacterioplankton
isolated from Crater lake, Oregon. Appl. Environ. Micro-
biol., 70, 6542–6550.
Parsons F., Wood P.R. and DeMarco J. (1980)
Bacteria associated with granular activated carbon col-
umns. In Proceedings of the 6th Annual AWWA Water
Quality Technology Conference. pp. 63–68. Denver,
American Water Works Association.
Reasoner D.J. and Geldreich E.E. (1985) A new
medium for the enumeration and subculture of bacteria
from potable water. Appl. Environ. Microbiol., 49, 1–7.
Servais P., Anzil D.G. and Cavard J. (2004) Biofilm
in the Parisian suburbs drinking water distribution
system. J Water SRT – Aqua 53, 313–324.
Stewart M.H., Wolf R.L. and Means E.G. (1990)
Assessment of bacteriological activity associated with

62 Microbial activity in GAC filters in drinking water treatment
granular activated carbon treatment of drinking water.
Appl. Environ. Microbiol., 56, 3822–3829.
Urfer D. and Huck P.M. (2000) Measurement of
biomass activity in drinking water biofilters using a
respirometric method. Wat. Res., 35, 1469–1477.
Van der Kooij D., Visser A. and Oranje J.P. (1982)
Multiplication of fluorescent pseudomonads at low
substrate concentrations in tap water. Antonie Van Leeu-
wenhoek, 48, 229–243.
Van der Kooij D. and Hijnen W.A.M. (1984) Sub-
strate utilisation by an oxalate-consuming Spirillum
species in relation to its growth in ozonated water.
Appl. Environ. Microbiol., 47, 551–559.
Van der Kooij D. and Hijnen W.A.M. (1985) Deter-
mination of the concentration of maltose – and starch-
like compounds in drinking water by growth measure-
ments with a well-defined strain of Flavobacterium
species. Appl. Environ. Microbiol., 49, 765–771.
Van der Kooij D., Hijnen W.A.M. and Kruithof J.C.
(1989) The effects of ozonation, biological filtration
and distribution on the concentration of the easily
assimilable organic carbon (AOC) in drinking water.
Ozone Sci. Eng., 11, 297– 311.
Van der Kooij D. (1992) Assimilable organic car-
bon as an indicator of bacterial regrowth. J. Am. Water
Works Assoc., 84, 57–65.
Velten S., Hammes F., Boller M. and Egli T. (2007)
Rapid and direct estimation of active biomass on gran-
ular activated carbon through adenosine tri-phosphate
(ATP) determination. Wat. Res., 41, 1973–1983.
Versalovic J., Koeuth T. and Lupski J.R. (1991)
Distribution of repetitive DNA sequences in eubacteria
and application to fingerprinting of bacterial genomes.
Nucleic Acids Res., 19, 6823–6831.
White D.C., Sutton S.D. and Ringelberg D.B.
(1996) The genus Sphingomonas, physiology and ecol-
ogy. Curr. Opin. Biotechnol., 7, 301–306.
Wilcox D.P., Chang E., Dickson K.L. and Johansson
K.R. (1983) Microbial growth associated with granular
activated carbon in a pilot water treatment facility.
Appl. Environ. Microbiol., 46, 406–416.
Willems A., De Ley J., Gillis M. and Kersters K.
(1991) Comamonadaceae, a new family encompassing
the Acidovorans rRNA complex, including Variovorax
paradoxus gen. nov., comb. nov., for Alcaligens paradox-
us (Davis 1969). Int. J. Syst. Bacteriol., 41, 445–450.
Williams M.M., Domingo J.W.S., Meckes M.C.,
Kelty C.A. and Rochon H.S. (2003) Phylogenetic diver-
sity of drink- ing water bacteria in a distribution system
simulator. J. Appl. Microbiol., 96, 954–964.
Zwart G., Crump B.C., Kamst Van Agterveld M.P.,
Hagen F. and Han S.K. (2002) Typical freshwater bac-
teria, an analysis of available 16S rNA gene sequences
from plankton of lakes and rivers. Aquat. Microbiol.
Ecol., 28, 141–155.

4identitY oF Bacteria PredoMinatinG in Granular
actiVated carBon FilterS For drinKinG Water
treatMent
CHAPTER
Knezev A., Wullings B., Smidt H. and van der Kooij D.
This chapter has been submitted for publication

AbstractThe sequence and T-RFLP fi ngerprint analysis of 16S rRNA genes of bacteria from full-scale and pilot-plant granular activated carbon fi lters (GACFs) operating under different conditions at fi ve drinking water treatment plants were studied. A total of 135 operational taxonomic units (OTUs), retrieved from a clone library comprising 288 partial or full 16S rRNA gene sequences, represented 76% of the average bac-terial richness in the fi lters as estimated by Chao1. The most abundant OTUs re-trieved from GACFs belonged to Betaproteobacteria (43% of all sequences), Alpha-proteobacteria (38%) or Acidobacteria (7%). Most of the Betaproteobacteria belonged to the TRA3-20 group of yet-uncultured Betaproteobacteria (34% of betaproteobac-terial sequences) and to the Comamonadaceae family (43% of betaproteobacterial sequences) with the genus Polaromonas being found in 80% of the examined GACFs and representing 25% of the Betaproteobacteria. The majority of Alphaproteobacte-ria belonged to the families Bradyrhizobiaceae (23%) and Hyphomicrobiaceae (17%) from the order Rhizobiales (55% of alphaproteobacterial sequences). Members from the order Rhodospirillales represented 19% of the Alphaproteobacteria. The T-RFLP analysis revealed a relatively high similarity (>60%) between the commu-nities from GACFs at different locations and a temporal and spatial stability over a one-year period. A high Shannon evenness index (0.82 ± 0.06) of T-RFLP profi les suggests an even distribution of predominant species. An increase in richness of bacterial OTUs in a pilot GACF during a one-year maturation period was accom-panied by an increase in relative abundance of predominant fragments. Oxidative pre-treatment appeared to affect the bacterial community composition. The meta-bolic properties of cultured relatives of the predominant bacteria from GACFs sug-gest that bacteria on GAC are chemo-organothrophic aerobes that can grow at low concentrations of carboxylic acids and aromatic compounds or chemolitotrophs that utilize ammonium or nitrite as source of energy. Representatives of Polaromo-nas, Bosea, Afpia, Sphingomonas, Variovorax and unclassifi ed Commamonadaceae were ususally isolated from the same GAC fi lters indicating their importance in the biodegradation processes in GACFs.

65Chapter 4 Identity of bacteria predominating in GAC filters for drinking water treatment
4.1 inTroducTion
Bacteria in aquatic environments attach to and grow on water-exposed solid surfaces and form biofilms. Biofilm formation is conditioned by the continuous supply of nutrients pro-vided by the water flow (Marshall 1997; Flemming et al. 2014). The removal of dissolved organic matter by biofilms is widely used in treatment of water and wastewater. A common-ly applied process for the removal of micro-pollutants and natural organic matter (NOM) in water treatment is granular activated carbon (GAC) filtration. The removal is primarily achieved through the adsorption of organic compounds on the GAC surface (Sontheimer et al. 1988). In addition bacteria attach to the GAC surface and utilize biodegradable organic compounds from the influent (LeChevallier et al. 1987; van der Kooij et al. 1989; Servais et al. 2004). By reducing the concentration of growth-promoting compounds the bacteria in GAC filters contribute to the control of biofilm formation, accumulation of sediments, mul-tiplication of pathogens and invertebrates and corrosion in distribution systems (LeCheval-lier et al. 1987; Sontheimer et al. 1988; Servais et al. 1994). Furthermore, biodegradation extends the lifetime of a GACF and decreases the frequency of GAC regeneration (Orlandini, 1999; van der Aa et al. 2011). In order to further improve the performance of GAC filters, additional understanding is needed for the optimal employment of biodegradation pro-cesses in these filters.
The quantitative aspects of microbial activity in GAC filters have been investigated in various studies (Urfer and Huck 2000; Fonseca et al. 2001; MagicKnezev and van der Kooij 2004; Velten et al. 2007). Characterisation of bacteria from GACFs by classical techniques yielded a broad range of genera including Achromobacter, Arthrobacter, Alcaligenes, Acinetobacter, Aeromonas, Bacillus, Caulobacter, Chromobacterium, Corynebacterium, Flavobacterium, Mo-raxella, Micrococcus, Microcyclus, Nitrosomonas, Nitrobacter, Paracoccus, Pseudomonas, and actinomycetes (van der Kooij McElhaney and McKeon 1985; Wilcox et al. 1983; Rollinger and Dott 1987; Parsons 1980; Camper et al. 1985). However, many isolates remained un-identified due to low discriminatory capacity of classical identification methods. Norton and LeChevallier (2000) used fatty acid composition to identify bacteria from GAC and species from genera Acidovorax, Hydrogenophaga, Pseudomonas, Xanthomonas, and Sphingomonas were detected as predominant. Recently, predominating cultivable bacteria from GAC filters were isolated using nutrient-poor media and identified with molecular tools as members of the genera Polaromonas and Hydrogenophaga within the Comamonadaceae family (Magic-Knezev et al. 2009; Niemi et al. 2009). The metabolic properties of two Polaromonas strains isolated from GAC filters indicated that these slowly growing bacteria are specialized in the utilization of carboxylic and aromatic acids at concentrations of <10 µg/l (Magic-Knezev and van der Kooij 2006).
Cultivation independent studies on bacteria in GAC filters have been conducted mainly in pilot plant filters, to study regeneration or focusing on a certain process, such as nitrification (Li et al. 2010; Liao et al. 2012, 2013). In this study molecular methods were applied to identify the predominant bacteria in full-scale GACFs and to assess the effects of operational conditions on the diversity of bacterial communities. For this purpose bacterial communities from full-scale and pilot-plant GACFs at drinking water treatment plants in the Netherlands were investigated

66 Microbial activity in GAC filters in drinking water treatment
by constructing clone libraries of PCR-amplified 16S ribosomal RNA genes and by using 16S rRNA gene targeted T-RFLP fingerprinting.
4.2 maTerials and meThods
4.2.1 GAC filters A total of 18 GACFs at five full-scale drinking water treatment plants and five filters at three pi-lot plants in the Netherlands were included in the study. A total of two rapid sand filters (RSF) from location A2 and A6, were also included in the study. Surface water from four different sources and one groundwater source was used (Table 4.1). After conventional pre-treatment and softening the water was treated with ozone at the locations A1, A6, A7 and by advanced oxidation (peroxide-UV) at location A4. At locations A2, A3 and A5 no oxidative process was applied before GAC filtration. The numbers of bacteria and the bacterial biomass concentra-tion in the examined GAC filters have been reported previously (Magic-Knezev and van der Kooij 2004).
The GAC samples for clone library construction and the T-RFLP analysis were collected once from full-scale filters of different operational periods in a cold and in a warm season. The GAC samples from the surface water pilot-plant (location A7PI) were collected monthly during a period of one year, and samples from the groundwater pilot-plant (location A1, A2) were co-llected once in two months during one year. The GAC samples from the pilot-plant filters treat-ing SW with peroxide and UV (location A4) were sampled only once in the warm period for the T-RFLP analysis. Methods used to collect GAC from the filter beds and harvesting of bacte-ria from GAC have been described previously (Magic-Knezev and van der Kooij 2004). Briefly,
Table 4.1 influent water quality of Gac filters at eight different locations.
location water* source oxidation doc**
(mg l-1)
uva#
(m-1)
aoc#
(µg l-1)
Temp.
(°c)
ph
a1 GW (PPa) o3/h2o2 1.5-1.8 2.6-2.8 10-50 12 8.3-8.5
a2 GW (PP) n.o.c 1.5-1.8 3.4-4.0 2-5 12 8.4-8.6
a3 SW (FSb) n.o. 1.2-2.6 6.2-6.9 170 2-25 7.9
a4 SW (FS) uV/h2o2 1.4-2.2 6.6 40-80 2-25 8.3-8.5
a5 SW (FS) n.o. 3.4 3.0-3.9 n.a. 2-25 7.9
a6 SW (FS) o3 2.1 3.0-3.9 n.a. 2-25 8.0
a7 SW(FS) o3 5.5-6.5 10-12 40-150 2-25 7.6-7.8
a7Pi SW(PP) o3 5.5-6.5 8-11 8-12 2-25 7.6-7.8
* GW – groundwater; SW – surface water;** doc dissolved organic carbon; #ultraviolet light absorbance (254
nm); ##aoc-assimilable organic carbon; aPP-pilot-plant; bFS-full-scale; cn.o-pre-oxidation not applied.

67Chapter 4 Identity of bacteria predominating in GAC filters for drinking water treatment
GAC samples (10 – 20 g) were collected aseptically from the filter beds and kept submerged in the effluent at 4°C. Bacteria attached to GAC were harvested within 24 hours by applying a series of six two-minute treatments of a GAC sample (2 – 5 g wet GAC) in 50 ml of autoclaved tap water with high-energy ultrasound of 20kHz via a titanium microtip (D = 5 mm), at a power input of 40 W.
4.2.2 DNA extraction. Bacterial suspensions obtained by sonication of GAC samples were concentrated using a polycarbonate filter (diameter 25 mm, 0.22 µm pore size, type GTTP; Millipore). Subse-quently, DNA from bacteria retained on the filter was extracted and purified by the FastDNA Kit for soil (BIO 101, Vista, CA, USA) as described by the producer. Extracted DNA was stored at -20°C.
4.2.3 T-RFLP analysis. T-RFLP analysis was done as previously described (Dunbar et al. 2001). Shortly, the 16S rRNA gene of bacteria harvested from GAC was amplified with Platinum Taq polymerase (Hot-Start Taq polymerase, Invitrogen, Life Technology Corporation, CA, USA) using 8F-FAM (5’-AGAGTTTGATC(A/C)TGGCTCAG-3’) and 1392R (5’-ACGGGCGGTGTGTACA-3’) primers and the iCycler IQ real-time detection system (Bio-Rad Laboratories B.V., Veenendaal, the Netherlands). The following thermal cycling was applied: 30 cycles 95°C for 45 s, 57°C for 60 s and 72°C for 2 min; and a final extension at 72°C for 7 minutes. PCR products were purified (DNA Clean & Concentrator-5 Kit van Zymo Research Corporation, Orange, CA, USA) and digested with restriction enzymes HhaI (Promega Corporation Madison, WI, USA) at 37°C for 4-6 hours. Digestion products were purified, and after addition of the internal standard (Genescan –500 ABI 401734, Life Technology Corporation, Carlsbad, CA, USA) and loading buffer (Hi-Di formamide) DNA was denatured during 3 min at 95°C and transferred directly to ice for a minimum of 13 min. Electrophoresis was performed in the short capillary/POP polymer in the Run module “GS STR pop 41 ml D 28 min” on an ABI 310 automated DNA Se-quencer (AME Bioscience A/S, Toroed, Norway) with extended running time of 35 minutes. T-RFLP data was generated for 70 samples (Supplemental Material Table 4.S1A).
The T-RFLP fingerprints were compared using Pearson correlation. Dendrograms were constructed by the unweighted pair-group method using arithmetic averages (Bionumerics software version 3.0, Applied Maths NV, Sint-Martens-Latem, Belgium). The peak height was used as an estimate of the relative abundance of an individual fragment as the ratio to the total peak height in a sample. The Shannon and Simson’s indices (and the reciprocals) were used to evaluate diversity (Simpson 1949; Shannon and Weaver 1963).
4.2.4 Cloning and sequencing of PCR products The 16S rRNA gene was amplified with Taq DNA polymerase (Hot-Start Taq polymerase, Invi-trogen, Life Technology Corporation, CA, USA) and primers targeting conserved domains (8F and 1392R). The PCR products were extracted and purified from the 1 % agarose gel (DNA Clean & Concentrator-5 Kit van Zymo Research Corporation, Orange, CA, USA) and cloned into pGEM-T Easy Vector System II (Promega, Leiden, The Netherlands). A total of 288 white colonies were obtained from 10 samples. The number of clones obtained per sample varied

68 Microbial activity in GAC filters in drinking water treatment
between nine and 47 (Table 4.1B, Supplemental Material). White colonies were screened by colony PCR using standard cloning primers sp6 and T7agarose gel electrophoresis for the cor-rect size of the insert. The DNA insert was sequenced either with one internal primer (F907) to obtain partial sequences of approximately 200-400 base pairs (bp) or by using primers T7 and SP6 and internal primers (F907, R530) to obtain full length sequences.
4.2.5 Nucleotide sequence data analysis. Sequences were assembled using the software package DNA Star Seqman II (Lasergene Inc., Madison, WIS., USA). ARB software was used to determine the phylogenetic position of se-quenced fragments (Ludwig et al. 2004). Sequences were aligned with the SINA online aligner service available within the ARB-Silva platform (Prüsse et al. 2007; Prüsse et al. 2012), and imported to the non-redundant SSURef_NR99_115_SILVA_20_07_13 database. A distance matrix of sequences was calculated without a filter and corrections. Aligned sequences were added to the main tree by the parsimony tool with local optimization. The phylogenetic iden-tity of the sequences at the genus, family or class level was determined using the classification tool of the SINA aligner, as well as based on their position in the main tree. The number of unique sequence types, operational taxonomical units (OTU’s) and richness (CHAO1 index, Chao 1984) were calculated from the distance matrix generated by ARB using DOTUR soft-ware (Schloss and Handelsman 2005).
Nucleotide sequence accession numbers. All partial and full length 16S rRNA gene sequences determined in this study have been deposited in GenBank under accession numbers KJ615071-KJ615358.
4.2.6 Enzymatic properties of Polaromonas strainsA total of eight strains of Polaromonas isolated from GAC filters (EU130976, EU130977, EU130978, EU130979, EU130980, EU130981, EU130988 and EU130989; Magic-Knezev and van der Kooij 2009) were tested for enzymatic activity with the apiZYM test (Biomerieux, Dur-ham, NC/USA) as described by the producer.
4.3 resulTs
4.3.1 Clone Library A library of 288 clones was generated from the bacterial communities associated with ten GAC filters (Table 4.S1B). A total of 68% of the sequences showed >97% similarity with any se-quence in the reference database used for the alignment. A total of 135 operational taxonomic units (OTUs, defined by a threshold of 97% sequence similarity), were detected, representing 76 % of the average species richness estimated with Chao1 (Table 4.2).

69Chapter 4 Identity of bacteria predominating in GAC filters for drinking water treatment
About half (52%) of the identified families were represented by ≤1% of the sequences (n=1-4); one third (27%) was represented by 1-5% of the sequences (n=4 -14) and one fifth (21%) was represented by 5 – 16 % of the sequences (n=14 – 47). The majority of the sequences and OTUs were classified as Betaproteobacteria (43% of sequences, 31% of OTUs), Alphaproteobac-teria (38%, 36%) or Acidobacteria (7%, 9%). A detailed overview of the classification of the retrieved sequences is provided in Tables 4.3, 4.4 and 4.5, respectively.
A total of 42 (37%), 17 (15%) and 17 (15 %) sequences from the Betaproteobacteria were iden-tified only to the class, order or family level, respectively. A total of 42 OTUs (124 sequences) from the Betaproteobacteria represented 7 families from 5 orders with the Burkholderiales being most abundant (43% of the sequences, 40% of the OTUs). The majority (91%) of the sequences from the Burkholderiales belong to the family Comamonadaceae, with genus Polar-omonas representing 65% of the sequences from this family. The Comamonadaceae were found in 8 of the 10 studied filters and the genus Polaromonas in 6 of the filters.
A total of 34% of the betaproteobacterial sequences, representing 19% of the OTUs could be classified to the candidate order “TRA3-20” using the SINA classifier, and all showing 90% or higher sequence similarity, with the majority of sequences comprising an approximate genus-level group at ≥ 95% sequence similarity. These sequences were most closely related to an un-cultured bacterium TRA3-20 (AF047644, Edwards et al. 1999) and an uncultured bacterium clone OC35 (AY491578, Phung et al. 2004). The order Nitrosomonadales represented 5 % of the betaproteobacterial sequences, and was detected in GACFs at 3 from 6 locations treating oxidized surface water (locations A4, A6 and A7).
The majority of sequences of the Alphaproteobacteria retrieved from GACFs grouped within the order of Rhizobiales (63%), representing the families Bradyrhizobiaceae (39%), Hyphomico-biaceae (28%) and Rhodobacteraceae (9%). The most frequently observed genera were Bosea, Afipia and Bradhyrizobium. The families Acetobacteraceae and Rhodospirillaceae of the order of Rhodospirillales, represented 17% of the sequences (18% of OTUs) of the Alphaproteobacteria and the order Sphingomonadales represented 11% of the sequences (6% of OTUs).
Table 4.2 number of sequences and otus, defined using a threshold of 97% 16S rrna gene sequence simi-
larity, and the total species richness estimation for the collective clone library derived from ten Gac filters and an
individual clone library (Gac- GW) from a Gac filter treating ozonated ground water. low and high represent 95%
confidence interval.
origin of samples number of sequences
number of oTus*
Total species richness (chao1 estimation)
avg. low high
Gac filters (n=10) 288 135 194 178 287
Gac-GW (n=1) 48 27 56 33 146
*sequence similarity > 97%

70 Microbial activity in GAC filters in drinking water treatment
Table 4.3 identity and abundance of 124 sequences and 42 otus from the Betaproteobacteria, retrieved from
10 Gac filters at different influent water quality
order family genus no. seq
(oTus)
no. fB
(locaties)
locations
tra3-20 n.i. n.i. 42 (8) 11 (7) a1, a2, a3, a4, a5, a6, a7
Burkholderiales Comamonadaceae Polaromonas 31 (7) 6 (5) a1, a2, a3, a5, a7
n.i. 7 (3) 5 (5) a1, a2, a5,a6,a7
acidovorax 5 (2) 3 (3) (a1, a6, a7)
Comamonas 3 (1) 1 (1) a6
Hydrogenophaga 2 (1) 2 (2) a5, a6
alcaligenaceae achromobacter 4 (2) 2 (2) a6, a3
n.i. n.i. 1 (1) 1 (1) a5
nitrosomonadales nitrosomonadaceae n.i. 5 (3) 3 (3) a4, a6,a7
oxalobacteraceae n.i. 1 (1) 1 (1) a7
methylophilales methylophilaceae massilia 3 (1) 1 (1) a5
n.i. 3 (2) 2 (2) a3, a4, a5
rhodocyclales rhodocyclaceae n.i. 6 (2) 4 (3) a4, a6, a7
n.i. n.i. n.i. 1 (1) 1 (1) a6
n.i. n.i. n.i. (Variovorax) 7 (5) 2 (2) a1, a2
n.i. n.i. n.i. 3 (2) 2 (2) a2, a4
n.i. not identified;
The remaining sequences (19%) were classified either as Gammaprotebacteria (3%) or Del-taproteobacteria (1%) or as other phyla, from which the Acidobacteria (7%) and Nitrospirae (2.4%) were most abundant (Table 4.5). Acidobacteria were detected in most of the filters (80%) treating surface water. The sequences of Acidobacteria were distributed among three phylogenetically distinct groups.

71Chapter 4 Identity of bacteria predominating in GAC filters for drinking water treatment
Table 4.4 identity and abundance of sequences and otus from alphaproteobacteria, retrieved form Gac filters
at different locations
n.i. not indentified;
order family genus no. seq. ( oTus)
no. fB (loc)
locations
rhizobiales Hyphomicrobiaceae n.i. 13 (8) 5 (3) a1, a3, a6,
Pedomicrobium 2 (1) 2 (2) a1, a3
sideroxydans 2 (1) 1 (1) a7
uncultured 2 (1) 1 (1) a7
Bradyrhizobiaceae Bosea 14 (5) 2 (2) a1, a2
afipia 7 (3) 2 (1) a1
Bradyrhizobium uncultured
6 (2) 4 (3) a1, a3, a4,
rhodobacteraceae n.i. 12 (4) 5 (5) a, a3, a4, a6, a7
rhizobiales methylobacteriaceae uncultured 5 (2) 3 (2) a3, a5
Xanthobacteraceae uncultured 3 (1) 3 (3) a3, a4, a7
MnG7 n.i. 1 (1) 1 (1) a7
uncultured n.i. 2 (1) 1 (1) a4
rhodospirillales acetobacteraceae n.i. 5 (3) 3 (3) a2, a6, a7
n.i. n.i. 5 (2) 2 (2) a3, a6
Incertae sedis reyranella 3 (1) 2 (1) a3
rhodospirillaceae uncultured 3 (1) 1 (1) a6
n.i. 1 (1) 1 (1) a3
n.i. n.i. 1 (1) 1 (1) a7
sphingomonadales sphingomonadaceae GoBB3-c201 7 (1) 1 (1) a5
novosphingobium 3 (1) 2 (1) a1, a2
uncultured (13) n.i. 2 (1) 1 (1) a6
rickettsiales Holosporaceae n.i. 1 (1) 1 (1) a7
SM2d12 n.i. 3 (2) 2 (2) a2, a6
Caulobacterales Hyphomonadaceae Woodsholea 3 (2) 2 (2) a6, a7
n.i. n.i. n.i. 1 (1) 1 (1) a5
n.i. n.i. tK34 2 (1) 1 (1) a6

72 Microbial activity in GAC filters in drinking water treatment
Table 4.5 identity and abundance of sequences and otus from proteobacterial classes other than alpha- and
Betaproteobacteria and from other phyla retrieved from Gac filters
Phylum
(class)
order family/genus no seq.
( oTus)
no. fB
(loc)
locations
acidobacteria
(Holophagae)
s.g.a) 4 7(5) 4 (3) a4, a6, a7
s.g. 6 4(4) 5 (4) a2, a4, a6, a7
f.i.s. Bryobacter/s.g. 3 2 (2) 4 (2) a3, a4
Holophagales f.i.s. Blastocatella/ s.g. 10 1 (1) 1 (1) a4
nitrospirae
(nitrospira)
nitrospirales nitrospiraceae/
leptospirillum
2 (2) 1 (1) a2
nitrospiraceae /n.i. 1 (1) 1 (1) a6
nitrospiraceae / n.i. 2 (1) 2 (2) a6, a7
Proteobacteria
(gammaproteobacteria)
(deltaproteobacteria)
legionellales Coxiellaceae/ aquicella 2 (2) 2 (2) a6
legionellales Coxiellaceae 2 (1) 1 (1) a6
n.i. n.i. 5 (4) 3 (3) a1, a6, a7 -
Chromatiales ectothiorhodospiraceae 1 (1) 1 (1) a7
Xanthomonadales Xanthomonadaceae 1 (1) 1 (1) a4
Bdellovibrionales Bdellovibrionaceae 1 (1) 1 (1) a6
myxococcales n.i. 1 (1) 1 (1) a3
n.i. n.i. 1 (1) 1 (1) a6
Bacteroidetes
(Cytophagia) (sphingobacteriia)
Cytophagales Cytophagaceae/
Flexibacter
1 (1) 1 (1) a7
sphingobacte-riales
Chitinophagaceae /n.i. 3 (3) 3 (3) a1, a7
saprospiraceae n.i. 1 (1) 1 (1) a7
actinobacteria Propionibacteri-neae
nocardioidaceae/
nocardioides
1 (1) 1 (1) a6
Chloroflexi
(Caldilineae)
Caldilineales Caldilineaceae 1 (1) 1 (1) a6
Cyanobacteria Chloroplast 1 (1) 1 (1) a6
Planctomycetes Planctomycetales n.i. 1 (1) 1 (1) a4
uncultured 1 (1) 1 a4
unclassified uncultured 1 (1) 1 a7
candidate div. tM7 1 (1) 1 a1
n.i. ta06 1 (1) 1 a7
n.i. not indentified; f.i.s. : Family incertae Sedis; s.g. subgroup; a) ,s.g. subgroep.

73Chapter 4 Identity of bacteria predominating in GAC filters for drinking water treatment
4.3.2 T-RFLP analysis T-RFLP patterns were obtained from a total of 48 samples collected from 21 GACFs. Six samples were analysed in duplicate to determine the variability of the T-RFLP method. The similarity between duplicate patterns from the same DNA extract ranged between 86% and 94%. The position of a T-RFLP fragment obtained from a single sequence varied with ± two apparent base pairs (Table 4.S3).
The T-RFLP patterns of 67 GAC-associated bacterial communities, with a pattern similarity for all samples > 60%, were arranged in three major groups. The first group (similarity > 68%) comprises patterns derived from filters treating oxidized surface water; the second group (similarity >73%) is from filters treating groundwater and the third group (similarity >63%) includes patterns from the filters treating non-oxidized surface water (Fig. 4.1). These three groups were further divided into subgroups according to oxidative pre-treatment (communi-ties from filters treating groundwater) and location. Grouping revealed that the patterns from different filters at the same location were highly similar; effect of filter age and season were not observed. The communities from the rapid sand filters (A2-SF and A6-SF) clustered sepa-rately from the GACF communities. The similarity with communities from GACFs was <65%. The bacterial diversity in the examined GACFs (n=67) was highly similar (Table 4.S5). The average value of the Shannon evenness index of 0.82±0.06 (0.66 – 0.88) indicated a relatively even distribution of the predominant species in GACFs. The number of T-RFLP fragments with a relative abundance above 0.5% was between 10 and 62 (37±12, P50=12), and the number of fragments with a relative abundance above 5% was between 3 and 8 per sample. The frag-ments with a relative abundance above 5% represented on average 48±19% of the total pat-tern (p75 < 62%) and were grouped around 5 positions (Table 4.S2) from which three posi-tions, representing 200, 340 and 360 bp apparent fragment size, were detected in the majority of studied GAC communities.
T-RFLP patterns of selected isolates and clones from GACFs were used to identify the dominant fragments in the community patterns (Table 4.S3). Members from the family Comamonada-ceae produced fragments of approximately 200 bp (196-204bp). The members of Alphaproteo-bacteria (genera Bradyrhizobium, Pedomicrobium, Hyphomicrobium) produced fragments of 340 bp, and clones (KJ615152, KJ615160, KJ615167) related with TRA3-20 produced a frag-ment of 360 bp.
The bacterial community from the pilot-plant GACFs treating ozonated surface water (location A8) was analysed monthly during one year (Fig. S1). The most abundant fragments were pres-ent already after two weeks of operation and remained predominant during the whole period (Chapter 6). The patterns from the communities obtained in the first 2 months of operation (short running times) were clustered separately from the patterns of the communities ob-tained in the period between 2 and 12 months. Similarity values <75 % were found for short running times (<60 days). The similarity of the communities obtained in de period between 2 and 12 months of operation was above 80%. The patterns showed minor differences in the beginning of spring and in the fall. Furthermore, the predominant fragments were at the same positions as those retrieved from full-scale filters (Fig. S1). No differences in composition of the community in the top and in the bottom part of the filter were observed.

74 Microbial activity in GAC filters in drinking water treatment
4.3.3 Comparison of clone library and T-RFLP fi ngerprints The communities from two GACFs at locations A1 and A6 were studied in more detail. T-RFLP patterns were generated for a number of abundant sequences and isolates from these GACFs (Table 4.S3). The predominant fragments in the T-RFLP patterns were identified based on similarity to the T-RFLP patterns of representative clones and isolates. The identity of the pre-dominant species derived from the T-RFLP pattern was compared with the identity derived from the sequence analysis of the clones (Table 4.S4). In the GAC pilot filter treating ozonated groundwater (location A1), both methods indicated the predominance of Polaromonas and Bradhyrizobium in the community. The sequences of Hyphomicrobium spp. and Methylobacteri-um spp. detected in the clone library could not be confirmed by T-RFLP because the position of fragments for these sequences was not determined experimentally. However, fragments of 340
A4-A1A4-A2A4-A3A4-BA4-CA4-DA8A8A8A8A8A8A8A8A8A3-AA3-PI-1A3-PI-2A7-AA7-BA7-CA7-DA6-AA6-BA6-CA6-DA6-EA1-AA1-BA1-CA1-DA1-E1A1-E2A2-AA2-BA2-CA2-DA2-EA2-SFA5-AA5-BA5-CA3-BA3-CA3-DA6-SF
SWOSWOSWOSWOSWOSWOSWO PISWO PISWO PISWO PISWO PISWO PISWO PISWO PISWO PISWSWAOSWAOSWOSWOSWOSWOSWOSWOSWOSWOSWOGWOGWOGWOGWOGWOGWOGWNOGWNOGWNOGWNOGWNOGWNOSWNOSWNOSWNOSWNOSWNOSWNOSWNO
AugustAugustFebruaryFebruaryAugustAugustJuneMayAprilMarchJulyAugustSeptemberOctoberNovemberAugustAugustAugustFebruaryFebruaryJulyJulyJulyJulyJulyFebruaryFebruaryDecemberOctoberMayOctoberDecemberMarchMayDecemberMarchOctoberOctoberOctoberFebruaryFebruaryAugustFebruaryAugustAugustOctober
I - Oxidized Surface Water
III - Not Oxidized Surface Water
II - Ground Water
60
65
70
75
80
85
90 95
figure 4.1 clustering of t-rFlP patterns of 48 bacterial communities obtained from 18 full-scale Gac fi lters
and 3 pilot-plant fi lters. the t-rFlP fi ngerprints were compared with the unweighted pair-group method using
arithmetic averages (Bionumeric software version 3.0. applied Maths nV., Sint-Martens-latem, Belgium). a2- SF
= rapid sand fi lter at location a2, a6-SF = rapid sand fi lter at location a6.
75Chapter 4 Identity of bacteria predominating in GAC filters for drinking water treatment
and 342 bp were assigned to Pedomicrobium sequences (Table 4.S3), which are closely related to Hyphomicrobium (Garrity et al. 2005). Furthermore, the in silico predicted fragment size for Hyphomicrobium spp. (AF279791) (339 bp) is very similar with fragments of Pedomicro-bium. In the full-scale GAC filter treating oxidized surface water (location A7) both analyses indicated the predominance of unidentified Betaproteobacteria related with clone TRA3-20 (AY491578), Bradhyrizobium, Polaromonas, Pedomicrobium and uncultured Commamonada-ceae (Table 4.S4).
4.3.4 Enzymatic activity of Polaromonas strains isolated from GAC filters Polaromonas was identified as dominant genus in a previous cultivation dependent study (Magic-Knezev at al. 2009) and therefore cultured representatives were available for physi-ological characterization (Magic-Knezev and van der Kooij 2006). Additional tests on the en-zymatic activity were conducted to analyse the role of these bacteria in GAC filters. All tested isolates exhibited activity of 4 out of 20 tested enzymes: esterase (C4), esterase-lipase (C8), leucine and naphthol-AS-BI-phosphohydrolase. Alkaline and acid phosphatase, lipase, valine- and cystein arylamidase, trypsin and alpha-chymotrypsin and enzymes for carbohydrate deg-radation were not active in tested strains.
4.4 discussion
4.4.1 Identity of bacteria predominating in GAC filters This study focused on the identification of the predominant species (>1 %), and therefore an approach was chosen comprising the analysis of a relatively limited number of clones from an individual GAC filter (Table 4.S1A-B) in combination with T-RFLP profiling, that has previous-ly been shown to be well suited for that purpose, in line with its inherent limitations in estima-tion of the true richness (Bent et al. 2007). From a total of 24 groups of the Betaproteobacteria detected in a previous culture-based study (Magic-Knezev and van der Kooij 2009) and this study, four groups were found in both studies, viz. Polaromonas, Hydrogenophaga, Variovorax and unclassified Comamonadaceae. From a total of 28 groups of Alphaproteobacteria detected in the culture-based and the culture-independent study, five were found in both studies (Sphingomonas, Bradyrhizobiaceae, Afipia, Bosea and unclassified Rhodobacteriaceae). Hence, the predominance of genera from the family Comamonadaceae, Hyphomicrobiaceae, Rhodo-bacteriaceae and Bradyrhizobiaceae reported here (Table 4.3, Table 4.4) is in concordance with the culture-based study of the communities from the same GACFs (Magic-Knezev et al. 2009). The culture-independent study additionally revealed the importance of microorganisms re-lated to the uncultured betaproteobacterium TRA3-20, Acidobacteria and Nitrosomonadaceae.
The number of OTUs in samples from GACFs estimated by methods applied in this research varied between 33 – 146 OTUs for the clone library (Table 4.5, GAC-GW) and 25 – 49 species for the T-RFLP (>0.5% relative abundance). The estimated richness found here was similar to some of the previously reported data for freshwater and drinking water systems (Table 4.4). Recent studies that used pyrosequencing of PCR-amplified 16S rRNA gene fragments revealed a higher richness in GAC filters (Lautenschlager et al. 2014; Liao et al. 2013), with an increasing richness being observed with increasing numbers of sequences analysed per sample (Table 4.6).

76 Microbial activity in GAC filters in drinking water treatment
The even distribution of the predominant species (EH=0.82±0.06; Table 4.S5) and the high number of single sequences is typical for oligotrophic aquatic environments, and indicates unfavourable conditions for predominance of a single species (Hughes et al. 2001). Several studies demonstrated that rare species (<1%) in biofilm communities represent the majority of richness in these communities (>75%, Kwon et al. 2011, >92% Lautenschlager et al. 2014). Also Liao et al. (2013) reported a relative abundance of less than 6% for all genera in the stud-ied GACFs.
However, the relatively high similarity between the communities from different filters ob-served in our study (>60%, Fig. 4.1) and temporal and spatial stability of the bacterial compo-sition (Figure 4.S1) suggest that the predominant species are similar for all investigated GAC filters.
Table 4.6 Species richness in different aquatic environments and different methods targeting the 16S rrna gene
a) Sanger sequencing, b) Pyrosequncing 2) dW = drinking water; 3) SW= surface water; 4) Serial analysis of ribosomal
sequences
environment method species rich-ness
sequence depth
(# sequences)
reference
Surface water (SW) S.S.a) 48 239 crump et al. 1999
SW, combined S.S. 34 689 zwart et al. 2002
SW 3) ; humic lake S.S. 62 179 Burkert et al. 2003
dental unit water sys. S.S. 40 170 Singh et al. 2003
chlorinated dW 2) S.S. 23-55 Williams et al. 2004
dW distribution S.S. 83 288 Martiny at al. 2003
dW distribution S.S. 24-55 216 eichler et al. 2006
dW SarSt4) 62-332 Poitelon et al. 2009
Groundwater t-rFlP 95 danovaro et al. 2006
dW Biofilm dGGe 11-21 emtiazi et al. 2004
SW – river dGGe 16 Winter et al. 2007
Gac filters S.S. 36-70 768 li et al. 2010
rSF S.S. 65 431 White et al. 2012
GacF S.S. 6-27 52-55 liao et al. 2012
GacF Pyroseq. b) 2441-4139 10890-13659 liao et al. 2013
GacF
GacF
Pyroseq. b)
dGGe
300
24
2140 lautenschlager et al. 2014

77Chapter 4 Identity of bacteria predominating in GAC filters for drinking water treatment
4.4.2 Comparison with bacterial communities in aquatic environments.
Most bacteria identified in the GACFs are common constituents of freshwater environments and biofilms (Zwart et al. 2002; Eichler at al. 2006; Williams et al. 2004; Newton at al. 2011; Zeng et al. 2013; Liao et al. 2013; Vaz-Moreira et al. 2013; Lautenschlager et al. 2014). The predomi-nance of the phylum Proteobacteria in drinking water systems has been previously reported (Lautenschlager et al. 2014; Zeng et al. 2013; Liao et al. 2013; Vaz-Moreira et al. 2013; Liao et al. 2012; Pinto et al. 2012). However, we found a higher proportion of proteobacteria in GACF’s than reported by Liao et al. (2013) (45-65%) and Lautenschlager et al. (2014) (38 – 74%). The proportion of classes within the Proteobacteria varies for different aquatic environments. For GACFs three independent, culture-based studies identified Betaproteobacteria and in particular the family Comamonadaceae, with the genera Polaromonas and Hydrogenophaga, as predomi-nant in GAC filters (Magic-Knezev and van der Kooij 2009; Niemi et al. 2009; Norton and LeCh-evallier 2000). Liao et al. (2013) observed a decrease in the abundance of Betaproteobacteria in GACFs amended with ammonium. Lautenschlager et al. (2014) found a total of three predomi-nant groups of sequences (15-20%) in filters from drinking water treatment (SSF, RSF, GACF), including Bradyrhizobium, unclassified Betaproteobacterium and unclassified Rhodocyclales, from which the unclassified Betaproteobacterium showed higher abundance in GACFs than in SSF and RSF. A high relative abundance of the Comamonadaceae has frequently been reported for aquatic environments (Emtiazi et al. 2004; Burkert et al. 2003; Crump et al. 1999; Niemi et al. 2009; Kampfer et al. 2006; Kalmbach et al. 1997; Poitelon et al. 2009). Remarkably, Liao et al. (2013) found only members of the genus Hydrogenophaga, although also in their study the class of Betaproteobacteria was abundant, especially in a filter with a low concentration of am-monia in the influent. The abundance of members from the alphaproteobacterial order Rhizo-biales in GAC filters has also been reported by Liao et al. (2013) and Lautenschlager et al. (2014) using pyrosequencing of PCR-amplified 16S rRNA gene fragments.
A total of 9 from the 22 genera frequently identified in the pyrosequencing study (Liao et al. 2013) were also found in our study (Bradyrhizobium, Hyphomicrobium, Pedomicrobium, Bryo-bacter, Flexibacter, Nitrospira, Novosphingobium and Rhodobacter), but authors reported a much lower abundance of these sequences (0.2 – 5.3%). Ammonia-oxidizing bacteria from the beta-proteobacterial order of Nitrosomonadales are common constituents of aquatic environments and soil (Eichler et al. 2006; Garity et al. 2005). In contrast, alphaproteobacterial nitrifiers predominate in drinking water with chlorine (Williams et al. 2004), and in some distribution systems Nitrospirae are more abundant than nitrifying Betaproteobacteria (Martiny at al. 2003).
Only a few sequences of the Gammaproteobacteria were retrieved from the investigated GACFs, although the members of this class (as Pseudomonas, Aeromonas, Legionella) are common con-stituents of aquatic environments and used as parameters for microbiological quality of drink-ing water (Danovaro et al. 2006; Williams et al. 2004; Zwart et al. 2002; Crump et al. 1999). However, these organisms are usually present in very low numbers (1 in 100 ml) and identifi-cation of many more clones from a single community (e.g. >107 at 105 bacteria ml-1) would be needed for detection of these organisms. In line with this notion, Liao et al. (2013) was able to reveal the presence of Gammaproteobacteria in the GAC filters at much higher sequencing effort (2441-4139 sequences per sample) especially in the filters with higher ammonium con-

78 Microbial activity in GAC filters in drinking water treatment
centration, but reported only sequences from genus Lysobacter as frequently observed (0,5%). Consequently, the use of qPCR methods is more efficient for detection of specific bacterial genera and species.
The presence of Acidobacteria in GACFs has also been reported in other studies at a similar fre-quency (Liao et al. 2014 (5,3 – 5,9%); Lautenschlager et al. 2014; Shiary et al. 2012).
Although similarities with communities from other aquatic and terrestrial environments are present, the specific predominance of Polaromonas in GAC filters (Magic-Knezev et al. 2009; Niemi et al. 2009; Jeon et al. 2004; Coleman et al. 2002) and the group TRA3-20 may indicate specific conditions in GAC filters that enhance growth of these bacteria. The findings further suggest that members form Rhisobiales (Hypomicrobiaceae, Bradyrhizobiaceae and Rhodobacte-raceae) also play important role in GACFs.
4.4.3 Metabolic properties of bacterial types predominating in GAC filtersCulture based and culture independent studies revealed the importance of several bacterial groups in GACFs, vz. TRA3-20, Polaromonas and members from the order Rhizobiales and the phylum Acidobacteria.
The candidate order TRA3-20 represents 15 % of the retrieved sequences, and to date has no cultured representatives. Hence, the functional role of this important group in GACFs cannot be revealed beyond mere speculation due to the absence of cultured relatives from this group.
Polaromonas spp. accounted for 11 % of the identified clones (Table 4.3) and 26.5% of the identified bacterial colonies (Magic-Knezev et al. 2009). Representatives of this genus have also been found in groundwater contaminated with cis-dichloroethene and GACFs from drink-ing water treatment (Jeon et al. 2004; Coleman et al. 2002), and in bottled water after storage (Loy et al. 2005), indicating their preference for ultra-oligotrophic environments. This prefer-ence is consistent with physiological characteristics of Polaromonas spp. strains previously isolated from GAC filters that were shown to grow at microgram-per-liter levels of carboxylic and aromatic compounds. These organisms also assimilate amino acids but do not utilize carbohydrates (Magic-Knezev and van der Kooij 2006). Furthermore, the genome analysis of a Polaromonas sp. strain isolated from a GACF indicated a potential for utilization of haloge-nated alkanes, cyclic alkanes and (poly)aromatic compounds (Mattes et al. 2008). The enzy-matic activity measurements of eight of the strains isolated from GACFs indicated the ability to hydrolyze N-terminal amino acids from peptides, amides or arylamides (arylamidase), water-soluble short acyl chain esters (esterase) and also less soluble long-chain fatty acids (esterase-lipase) (Chahinian and Sarda 2009). The Polaromonas sp. strains tested here also could utilize the hydrophobic amino acid leucine (leucine arylamidase) and phosphate (phosphohydro-lase). The absence of enzymes for the hydrolysis of proteins and carbohydrates is consistent with the isolation of Polaromonas spp. from oligotrophic aquatic environments where proteins and carbohydrates are not the main substrate.
The importance of Rhizobiales in biofilters has been reported previously (Shiray et al. 2012; White et al. 2012 and Liao et al. 2013). The high relative abundance of Rhizobiales (20% of the

79Chapter 4 Identity of bacteria predominating in GAC filters for drinking water treatment
clones) found in our study indicates some similarity in the conditions in soil and in GAC filters, that may be related to limited availability of nitrogen and carbon sources (Batjes 1996). The growth of Hyphomicrobium may be stimulated by soil extract, and these organisms can utilize one-carbon compounds such as methanol or methylamine (Garrity et al. 2005). This suggests that Hyphomicrobium can utilize low molecular weight compounds from humic origin that are also important substrates in GACFs. The presence of bacteria known to be involved in nitrogen cycling, such as Bradyrhizobium (nitrogen fixation), Nitrospirae (nitrite oxidation) and Nitroso-monadales (ammonium oxidation) indicate that in GACFs nitrification processes occur despite the low ammonium concentration in the influent (usually below 0.02 mg N L-1), as ammonium is removed in conventional treatment preceding the GAC filtration (van der Wielen et al. 2009). Presence of nitrogen metabolizing bacteria in GACFs can therefore indicate i) incom-plete removal of ammonia in the pretreatment or/and ii) secondary production of ammonia and amino acids by the protozoan activity in GAC filters (Sherr and Sherr 2002). Furthermore, presence of species able to fix nitrogen indicates that nitrogen fixation may also occur in GAC filters. As an energetically expensive process nitrogen fixation is more probable to occur when the fixed nitrogen is depleted and phosphorus and carbon are still available. Concentration of nitrogen and phosphorous in facilities treating surface water vary with season and nitrogen concentration in form ammonium may reach values of 0.2 mgL-1 but is occasionally also below the detection limit (0.001 mg L-1). However, nitrate is available in the influent (0.8-7 mg L-1) indicating that nitrogen fixation is less likely to occur in GAC filters.
Analysis of complete genomes of three strains from subdivisions 1 (Acidobacterium capsula-tum, strain Ellin345) and 3 (strain Ellin 6076) within the phylum Acidobacteria suggested that these organisms are heterotrophs that utilize simple or complex sugars and are capable of ni-trate and nitrite reduction (Ward et al. 2009). The examined Acidobacteria strains exhibit slow metabolic rates under low-nutrient conditions. It should be noted, however, that most of the sequences retrieved from GAC filters in this study were classified as members of subdivisions 3, 4 and 6, and hence possibilities for extrapolation with respect to the physiology of the cor-responding bacteria remain limited.
4.4.4 Factors affecting the composition of the bacterial community in GACFs The high similarity between the GAC communities from different locations and the low simi-larity to bacterial communities from the rapid filters (A2-SF, A6-SF, Fig. 4.1) indicate specific conditions in GACFs. Shirey et al. (2012) also observed a low temporal variability in GACFs after a period of maturation and difference in the communtiy structure between anthracite and GACFs.
The variation in the bacterial community structure of GACFs from different locations is mainly related to the water source and the (oxidative) pre-treatment, but the effect of the seasonal changes in water quality and the maturation of a filter is not very clear from the data (Fig. 4.1), possibly due to (i) the low sensitivity of applied methodology, i.e. the small number of clones, (ii) the low resolution of the T-RFLP analysis, or (iii) a limited effect of seasonal chan-ges in water quality on predominant bacteria in GACFs. Nevertheless, in all examined filters, predominant bacterial groups TRA3-20, Polaromonas and Rhizobiales represented the most abundant bacteria.

80 Microbial activity in GAC filters in drinking water treatment
This suggests that the nature of the GAC surface and the nature of substrates available for growth (natural organic matter NOM) play an important role in the selection of the dominant populations. Most of the investigated GACFs are positioned at the end of the treatment train where the concentration of organic matter is low (1-6 mg DOC L-1), and readily degradable car-bon and energy sources are already utilized in the previous steps (Table 4.1). Moreover, strong adsorptive properties of GAC furthermore reduce the concentration of available organic carbon in the water phase (Chapter 6). However, the species that are among the first to colonize GAC remain predominant (Fig. 4.S1) suggesting that these organisms are best adapted to the condi-tions specific for GACFs where they carry the main role in the biodegradation processes.
The most important factor that distinguishes GAC filters from the aquatic and soil environ-ments is the specific nature of the GAC surface (Sontheimer et al. 1988). The enhancement of bacterial growth when compared to filters with inert material is frequently reported for GAC (Nishijima et al. 1992; Servais et al. 1994; Wang et al. 1995). Factors affecting selection of bacteria in GAC may be related to: i) the effect of GAC surface properties on strength of bacte-rial attachment that was demonstrated by Magic-Knezev and van der Kooij (2004) and Billen et al. (1992) ii) the effect of GAC geometry on the protection of bacteria from share forces and predation iii) the effect of GAC on the availability of organic compounds for growth. Fur-thermore, low density of GAC hampers rigorous backwashing and provides conditions for the accumulation of particulate organic matter and protists between the GAC particles (Scheriber et al. 1997; Wang 2014) resulting in biomass turnover and production of ammonia (Sherr and Sherr 2002; Pernthaler et al. 2005) that may explain the relatively important fraction of Rhizobiales in GAC filters (Table 4.4). Such conditions in GACFs lead to preferential survival of small bacteria that are strongly attached and better protected inside the macropores on the GAC surface.
To be able to survive, attached bacteria must also be capable in utilization of organic carbon available in GACFs. The metabolic properties of cultured relatives of the predominant bacteria in GACFs suggest that low molecular weight compounds are the major source of carbon for growth and maintenance. The majority of organic carbon in GAC is comprised of high mo-lecular weight humic substances (HS), while the low molecular weight compounds represent a smaller fraction (Servais et al. 2005). Amon and Banner (1996) showed that HS support more growth than low molecular weight compounds, and Camper (2004) concluded that the adsorption of HS on the surface of corrosion products enhances bacterial growth, thus bio-availability of HS. This indicates that the adsorption of HS on GAC might also play a role in availability of substrates for growth.
These findings lead to the conclusion that the bacteral communities in GACFs are relatively stable and that the conditions common for all GACFs apparently have a stronger effect than the differences related to the source, pre-treatment and season. The conditions common for GACFs can be summarized as the low concentration of nutrients, large surface available for growth, good protection from predation and effect of adsorptive properties of GAC on avail-ability of natural organic matter. This leads to accumulation of species specialized in attached growth at ultra-oligotrophic conditions as confirmed by the physiological properties of the predominant bacteria in GAC filters.

81Chapter 4 Identity of bacteria predominating in GAC filters for drinking water treatment
Amon R.M.W., and Benner R. (1996). Bacterial
utilization of different size classes of dissolved organic
matter. Limnol.Oceanogr., 41(1), 41-51.
Batjes, N.H. (1996). Total carbon and nitrogen in
the soils of the world. European Journal of Soil Science,
(47), 151-163.
Bent J.S., Pierson J. D., and Forney L. J. (2007).
Measuring species richness based on microbial com-
munity fingerprints, the emperor has no clothes. Appl.
Environ. Microbiol., 73(7), 2339-2401.
Billen G., Servais P., Bouillot P. and Ventresque C.
(1992). Functioning of biological filters used in drink-
ing-water treatment, the CHABROL model. J. Water
SRT- Aqua 41, 231-241.
Burkert U., Warnecke F., Babenzien D., Zwirn-
mann E., Pernthaler J. (2003). Members of a readily
enriched beta-proteobacterial clade are common in
surface waters of a humic lake. Appl. Environ. Micro-
biol., 69(11), 6550-6559.
Camper A.K., LeChevallier M.W., Broadaway S.C.
and McFeters G.A. (1985). Evaluation of procedures
to desorb bacteria from granular activated carbon. J.
Microbiol.Methods., 3, 187–198.
Camper A. (2004). Involvement of humic sub-
stances in regrowth. Int. J. of Food Microbiol., 92,
355– 364.
Chahinian H., and Sarda L. (2009). Distinction
between esterases and lipases, comparative biochemi-
cal properties of sequence-related carboxylesterases.
Protein Pept Lett.,16(10)1149-1161.
Coleman N. V., T. E. Mattes J. M. Gossett and Spain
J. C. (2002) . Biodeg-radation of cis-dichloroethene
as the sole carbon source by a beta-proteobac-terium.
Appl. Environ. Microbiol., (68),2726–2730.
Crump B.C., Armbrust E.V. and Baross J.A. (1999)
Phylogenetic analysis of particle-attached and free-
living bacterial communities in the Columbia river, its
estuary, and the adjacent coastal ocean. Appl. Environ.
Microbiol., (65),3192-3204.
Danovaro R., Luna G.M., Dell’anno A., Pietrangeli
B. (2006). Comparison of two fingerprinting tech-
niques, terminal restriction fragment length polymor-
phism and automated ribosomal intergenic spacer
analysis, for determination of bacterial diversity in
aquatic environments. Appl. Environ. Microbiol., 2006
Sep;72(9),5982-5989.
Dunbar J., Ticknor L. O., Kuske C.R. (2001). Phylo-
genetic specificity and reproducibility and new method
for analysis of terminal restriction fragment profiles
of 16S rRNA genes from bacterial communities. Appl.
Environ. Microbiol., 67(1), 190–197.
Eichler S., Christen R., Höltje C., Westphal P., Bötel
J., Brettar I., Mehling A., Höfle M.G. (2006). Com-
position and dynamics of bacterial communities of a
drinking water supply system as assessed by RNA- and
DNA-based 16S rRNA gene fingerprinting. Appl Environ
Microbiol., 72(3),1858-72.
Emtiazi F, Schwartz T, Marten SM, Krolla-Siden-
stein P, Obst U. (2004). Investigation of natural bio-
films formed during the production of drinking water
from surface water embankment filtration. Wat. Res.,
38(5),1197-1206.
Flemming H.-C., Bendinger B., Exner M., Gebel J.,
Kistemann T., Schaule G., Szewzyk U., and Wingender
J. (2014). Pp, 207-232. In Microbial growth in drinking
water supplies. Van der Kooij D. and van der Wielen
P.W.J.J. (eds). IWA Publishing, London UK.
Fonseca A.C., Summers R.S. and Hernandez
M.T. (2001) Comparative measurements of microbial
activity in drinking water biofilters. Wat. Res., (35),
3817-3824.
Garrity G.M., Brenner D.J., Krieg N.R., and Staley
J.T. (2005) Bergey’s manual of Systematic Bacteriology.
2nd ed. Vol. 2. Springer, New York, NY.
Hughes J.B., Hellmann J.J., Ricketts T.H., Bohan-
nan B.J. (2001) Counting the uncountable, statistical
approaches to estimating microbial diversity. Appl.
Environ. Microbiol., 67(10), 4399-406.
Jeon C.O., Park W., Ghiorse W.C., and Madsen
E.L.. (2004). Polaromonas naphthalenivorans sp. nov. a
naphthalene-degrading bacterium from naphthalene-
contaminated sediment. Int. J. Syst. Evol. Microbiol.,
(54), 93-97.
Kalmbach S., Manz W. and Szewzyk U. (1997).
Isolation of new bacterial species from drinking water
biofilms and proof of their in situ dominance with
4.5 references

82 Microbial activity in GAC filters in drinking water treatment
highly specific 16S rRNA probes. Appl. Environ. Micro-
biol., 63, 4164-4170.
Kampfer P., Busse H.J. and Falsen E. (2006). Polar-
omonas aquatica sp. nov., isolated from tap water. Int.
J. Syst. Evol. Microbiol., (56), 605-608.
Kwon S., Moon E., Kim T.S., Hong S., Park H.D.,
(2011). Pyrosequencing demonstrated complex mi-
crobial communities in a membrane filtration system
for a drinking water treatment plant. Microbes Environ.
JSME, 26, 149-155.
Lautenschlager K., Hwang C., Ling F., Liu W., Boon
N., Köster O., Egli T., Hammes F. (2014). Abundance
and composition of indigenous bacterial communities
in a multi-step biofiltration-based drinking water treat-
ment plant. Wat. Res., (62), 40-52.
LeChevallier, M.W., Babcock, T.M. and Lee, R.G.
(1987). Examination and characterization of distribu-
tion system biofilms. Appl. Environ. Microbiol., (53),
2714-2724.
Li X., Upadhyaya G., Yuen W., Brown J., Morgen-
roth E., Raskin L. (2010). Changes in the structure and
function of microbial communities in drinking water
treatment bioreactors upon addition of phosphorus.
Appl. Environ. Microbiol., 76(22),7473–7481.
Liao X.B,. Chen C., Wang Z., Wan R., Chang C.H.,
Zhang X.J., Xie S.G. (2013). Changes of biomass and
bacterial communities in biological activated carbon
filters for drinking water treatment. Process Biochem.,
48(2),312–316
Liao X.B., Chen C., Chang C.H., Wang Z., Zhang
X.J., Xie S.G. (2012) Heterogeneity of microbial com-
munity structures inside the up- flow biological acti-
vated carbon (BAC) filters for the treatment of drinking
water. Biotechnol. Bioprocess. Eng., 17(4), 881–886.
Loy A., Beisker W., and Meier H. (2005). Diversity
of bacteria growing in natural mineral water after bot-
tling. Appl. Environ. Microbiol., (71), 3624-3632.
Ludwig W., Strunk O., Westram R., Richter L.,
Meier H., Yadhukumar A., Buchner T., Lai S., Steppi G.
Jobb, W. Forster, I. Brettske, S. Gerber, A. W. Ginhart,
O. Gross, S. Grumann, S. Hermann, Jost R., Konig
A., Liss T., Lussmann R., May M., Nonhoff B., Reichel
B., Strehlow R., Stamatakis A., Stuckmann N., Vilbig
A., Lenke M., Ludwig T., Bode A., and Schleifer K.H.
(2004). ARB, a software environment for sequence
data. Nucleic Acids Res., 32, 1363-1371.
Magic-Knezev A. and van der Kooij D. (2004). Op-
timisation and significance of ATP analysis for measur-
ing active biomass in granular activated carbon filters
used in water treatment. Wat. Res., 38, 3971-3979.
Magic-Knezev A. and van der Kooij D. (2006).
Nutritional versatility of two Polaromonas-related bac-
teria isolated from biological granular activated carbon
filters, pp. 303-311. In, Recent progress in slow sand and
alternative biofiltration processes. R. Gimbel, N.J.G.
Graham, M. R. Collins eds. IWA publishers, London.
Magic-Knezev A, Wullings B., van der Kooij D.
(2009). Polaromonas and Hydrogenophaga species
are the predominant bacteria cultured from granular
activated carbon filters in water treatment. Journal of
applied microbiol., 107(5), 1457-1467.
Marshall, K.C. (1997). Colonization, adhesion,
and biofilms. pp. 358-365. In Hurst J.C. (ed.) Manual
of Environmental Microbiology. ASM Press, Washington
DC.
Martiny A.C., Jørgensen T.M., Albrechtsen H.J.,
Arvin E., Molin S. (2003). Long-term succession of
structure and diversity of a biofilm formed in a model
drinking water distribution system. Appl. Environ.
Microbiol., Nov; 69(11), 6899-907.
McElhaney J.B. and McKeon W.R.(1985) Enu-
meration and identification of bacteria in granular
activated carbon columns, p. 63-68. In Proceedings of
the 6th Water Quality Technology Conference. Louisville,
KY, American Water Works Association, Denver, Co.
Newton R.J., Jones S.E., Eiler A., McMahon K.D.,
Bertilsson S. (2011). A guide to the natural history of
freshwater lake bacteria. Microbiol. Mol. Biol. Rev., 75,
14-49.
Niemi R. M., Heiskanen I., Heine R. and Rapala J..
(2009). Previously uncultured β-Proteobacteria domi-
nate in biologically active granular activated carbon
(BAC) filters . Wat. Res., 43(20), 5075-86.
Norton C.D., LeChevallier M.W. (2000). A pilot
study of bacteriological population changes
through potable water treatment and distribution.
Appl. Environ. Microbiol., 66(1), 268-276.
Orlandini E. (1999). Pesticide removal by combined
ozonation and granular activated carbon filtration. PhD.
Thesis IHE, Delft, The Netherlands.

83Chapter 4 Identity of bacteria predominating in GAC filters for drinking water treatment
Parsons F., Wood P.R., and DeMarco J. (1980).
Bacteria associated with granular activated carbon
columns. Pp. 63–68. In Proceedings of the 6th Annual
AWWA Water Quality Technology Conference Denver,
AWWA.
Pernthaler J. (2005). Predation on prokaryotes in
the water column and its ecological implications. Nat.
Rev. Microbiol., 3(7), 537-546.
Pinto A.J., C.Xi,
and L. Raskin. (2012). Bacterial
Community Structure in the Drinking Water Microbi-
ome Is Governed by Filtration Processes. Environ. Sci.
Technol., 46, 8851−8859.
Poitelon J.B., Joyeux M., Welté B., Duguet J.P.,
Prestel E., Lespinet O., DuBow M.S. (2009). Assess-
ment of phylogenetic diversity of bacterial microflora
in drinking water using serial analysis of ribosomal
sequence tags. Wat. Res., 43 (17), 4197-4206.
Prüsse E., Peplies J., and Glöckner F. O. (2012).
SINA, Accurate high-throughput multiple sequence
alignment of ribosomal RNA genes. Bioinformatics
28,1823-1829.
Prüsse, E., Quast C., Knittel K., Fuchs B. M., Lud-
wig W., Peplies J., and Glöckner F. O. (2007). SILVA, a
comprehensive online resource for quality checked and
aligned ribosomal RNA sequence data compatible with
ARB. Nucleic Acids Res., 35, 7188-7196.
Rollinger Y., and Dott W. (1987). Survival of se-
lected bacterial species in sterilized activated carbon
filters and biological activated carbon filters. Appl.
Environ. Microbiol., 53, 777–781.
Schloss P. D., and J. Handelsman. (2005). Intro-
ducing DOTUR, a Computer Program for Defining
Operational Taxonomic Units and Estimating Species
Richness. Appl. Environ. Microbiol. 71,1501-1506.
Schreiber H., Schoenen D., Traunspurger, W.
(1997). Invertebrate colonisation of granular actvated
carbon filters. Wat. Res., 31(4), 743-748.
Sherr, E.B. and B.F. Sherr. (2002). Significant of
predation by protists in aquatic microbial food webs.
Antonie Van Leewenhoek International J. of Gen.l and
Mol. Microbiol., 81, 293-308.
Servais P., Billen G., and Bouillot P. (1994). Bio-
logical colonization of granular activated carbon filters
in drinking-water treatment. Journal of Environmental
Engineering, 120(4), 888-899.
Servais, P., Anzil, D.G. and Cavard J. (2004). Bio-
film in the Parisian suburbs drinking water distribution
system. J Water SRT – Aqua, 53, 313-324.
Servais P., Prevost, M., Laurent P., Joret JC. Sum-
mers, S. Hambsch, B. Ventresque C. (2005). Biodegrad-
able organic matter in drinking water treatment. Pp.
61-130 In Biodegrdable organic matter in drinking water
treatment and distribution, Eds. Prevost, M., Laurent, P.,
Servais, P., and Joret JC. AWWA, Denver CO, USA.
Shannon C.E. and W. Weaver. (1963). The Mathe-
matical theory of communication. University of Illinois
Press, Urbana, Illinois
Simpson E.H. (1949). Measurment of diversity.
Nature, 163,688;
Singh R., Stine O.C., Smith D.L., Spitznagel J.K. Jr,
Labib M.E., Williams H.N. (2003) Microbial diversity
of biofilms in dental unit water systems. Appl. Environ.
Microbiol., 69(6), 3412-3420.
Sontheimer H., Crittenden J.C., and Summers
R.S., (1988), Activated Carbon for Water treatment.
AWWA-DVGW Forschungstelle Engler Bunte Instituut,
Karlsruhe.
Urfer D. and Huck P.M. (2000). Measurement of
biomass activity in drinking water biofilters using a
respirometric method. Wat. Res., 35(6), 1469-1477.
Van der Aa, L.T.J., Rietveld, L.C. and van Dijk, J.C.
(2011) Effects of ozonation and temperature on the
biodegradation of natural organic matter in biological
granular activated carbon filters. Drinking Water Engi-
neering and Science, 4(1), 25-35.
Van der Kooij D. (1983). Biological processes in
Carbon filters. In Activated carbon in drinking water
technology, pp. 119-153. Am. Water Works Assoc,
Denver.
Van der Kooij D. and Hijnen W.A.M. and Kruithof,
J.C. (1989) The effects of ozonation, biological filtra-
tion and distribution on the concentration of the easily
assimilable organic carbon (AOC) in drinking water.
Ozone Science & Engineering., 11, 297-311.
Van der Wielen P. W. J. J., S. Voost and D. van der
Kooij. (2009). Ammonia-Oxidizing Bacteria and Ar-
chaea in Groundwater Treatment and Drinking Water
Distribution Systems. Appl. Environ. Microbiol., 75 (14),
4687-4695.
Vaz-Moreira I., Egas C., Nunes O.C., Manaia C.M.

84 Microbial activity in GAC filters in drinking water treatment
(2013). Bacterial diversity from the source to the tap:
a comparative study based on 16S rRNA gene-DGGE
and culture-dependent methods. FEMS Microbiol. Ecol.
83, 361-374.
Velten S., Hammes F., Boller M. and Egli T. (2007).
Rapid and direct estimation of active biomass on gran-
ular activated carbon through adenosine tri-phosphate
(ATP) determination. Wat. Res., 41, 1973-1983.
Wang J.Z., Summers R.S., and Miltner R. J.
(1995). Biofiltration performance, part 1. relationship
to biomass. Filtration, Jour. Am. Water Works Assoc.
(87). 55-63.
White, C.P., DeBry, R.W., Lytle, D.A., 2012. Micro-
bial survey of a full-scale, biologically active filter for
treatment of drinking water. Appl. Environ. Microbiol.,
78, 6390-6394.
Wilcox D.P., Chang E., Dickson K.L. and Johansson
K.R. (1983). Microbial growth associated with granular
activated carbon in a pilot water treatment facility.
Appl. Environ. Microbiol., 46, 406-416.
Williams M.M., Domingo J.W.S , Meckes M.C.,
Kelty, C.A. and Rochon H.S. (2004). Phylogenetic
diversity of drinking water bacterie in a distribution
system simulator. J. Appl. Microbiol., 96, 954-964.
Winter C, Hein T, Kavka G, Mach RL, Farnleitner
AH. (2007). Longitudinal changes in the bacterial com-
munity composition of the Danube River, a whole-river
approach. Appl. Environ. Microbiol., 73(2),421-431.
Zeng D.N., Fan Z.Y., Chi L., Wang X., Qu W.D.,
Quan Z.X., (2013). Analysis of the bacterial communi-
ties associated with different drinking water treatment
processes. World J. Microbiol. Biotechnol., 29, 1573-
1584.
Zwart G., Crump B.C., Kamst-van Agterveld M.P.,
Hagen F. and Han S.K. (2002). Typical freshwater bac-
teria, an analysis of available 16S rNA gene sequences
from plankton of lakes and rivers. Aquat. Microbiol.
Ecol., 28, 141-155

85Chapter 4 Identity of bacteria predominating in GAC filters for drinking water treatment
suPPlemenTal maTerial chaPTer 4.
Table 4.s1a number of Gac filters sampled, number of Gac samples and number of t-rFlP patterns re-
trieved per location. a8-Pi is pilot-plant filter from location a7
location no. filterbeds
(no. of samples)
filter age
(days)
season
a1 1(8) 90-390 -
a2 1 (7) 90-390 -
a3 3 (3) 150-335 Winter/Summer
a4 4 (5) 760-910 Winter/Summer
a5 3 (3) 35-455 Winter/Summer
a6 3 (4) 45-450 Winter/Summer
a7 3 (3) 365 Winter/Summer
a8-Pi 1 (15) 1-365 Winter/Summer
Table 4.s1B number of Gac filters sampled, number of Gac samples and number of clones retrieved per loca-
tion. location no. filterbeds
(no. of samples)
no. clones
retrieved (n)
a1 1(3) 85
a2 1 (1) 12
a3 2 (3) 40
a4 2 (2) 51
a5 1 (2) 10
a6 2 (2) 26
a7 3 (3) 56
a8 1 (1) 13
Table 4.s2 Size and relative frequency of appearance of the predominant t-rFlP fragments in the bacterial
communities from Gac filters.
fragment size group (bp)
Base pare range relative frequency
of appearance (n=352*)
Present in filterbeds
(%)
FS200 196.9-203.7 24% 75
FS340 340.9-342.9 18% 63
FS360 358.8-361.5 9% 50
* a total number of fragments with the relative abundance of peak height >5% in all analyzed communities.

86 Microbial activity in GAC filters in drinking water treatment
Taxon acession nr. apparent fragment size (BP)
Hydrogenophaga (isolate) eu130958 142
methyloversatilis (isoalate) eu180528 198
Polaromonas (isolate) eu130979 199
Polaromonas (isolate) eu130980 200
Polaromonas (isolate) eu130970 200
Polaromonas (clone) KJ615102 200
Polaromonas (clone) KJ615087 200
acidobacteria subgroup9 (clone) KJ615162 203
Pedomicrobium (clone) KJ615172 341
Bradyrhizobium (clone) KJ615097 343
Bradyrhizobium (clone) KJ615096 343
Hyphomicrobium (clone) KJ615092 341
Woodsholea (clone) KJ615353 341
Bradyrhizobium (isolate) eu180519 343
unindentified betaproteobacterium (clone) KJ615152 361
tra3-20 (clone) KJ615160 361
unindentified betaproteobacterium (clone) KJ615167 361
acidobacteria subgroup6 (clone) KJ615162 372
Table 4.s3 empirical apparent t-rFlP fragment sizes of selected individual clones and isolates.

87Chapter 4 Identity of bacteria predominating in GAC filters for drinking water treatment
Table 4.s4 apparent fragment size and identity of t-rFlP fragments and identity and abundance of clones
from the clone libraries of two bacterial communities. GW-oX = community from the Gac filter treating pre-
oxidized groundwater; SW-oX = community from the Gac filter treating pre-oxidized surface water
sample closest relatives clone clone library
n (%)
T-rflP fragment size
BP (abundance %)
T-rflP fragment
identity
SW-oX Bosea
Hyphomicrobium Bradhyrizobium sphingomonadales rhodobacterales
14(33)
4(9)
2(5)
2(5)
2 (5)
341 (13)
342 (14)
Pedomicrobium
Bradhyrizobium
hyphomicrobium
Polaromonas
Unindetified Comamonadaceae gallionellaceae
9 (21)
3 (7)
1 (2)
198 (4)
200 (33)
202 (20)
Polaromonas
gamma proteobacteria 3(7) 337 (2)
Cyanobacteria 1(2) 180 (2)
Caulobacter 1(2) 99 (2)
SW-oX rhodospirilales Hyphomicrobiaceae
rhizobiales
Unindentified alphaproteo-bacterium
13(28)
5(11)
5(11)
2 (4)
343(5)
341(2)
Bradhyrizobium Pedomicrobium
tra3-20
Comamonadaceae nitrosomonadales
9(20)
4(9)
2(4)
361 (13)
199 (2)
201 (5)
unindentified betapro-teobacterium Polaromonas
acidobacteria 3(7) 371 (7)
204 (3)
acidobacteria subgroup 6 and 9
actinobacteria 1(2) 89 (7)
Xantomonadales 1(2) 57(5)
nitrospira 1(2) 58 (4)

88 Microbial activity in GAC filters in drinking water treatment
Table 4.s5 reciprocal Simpson’s index (1/d), Shannon evenness index (eh) and diversity (h) of t-rFlP pat-
terns from Gac filters from different locations. rSF – rapid sand filters.
n shannon
diversity index
(h)
shannon
evenness index
(eh)
a7Pi 27 3.26±0.65
(1.80-3.92)
0.80±0.05
(0.66-0.85)
a4,a6,a7 16 3.70±0.34
(2.76-4.01)
0.87±0.04
(0.79-0.93)
a3,a5 8 3.29±0.47
(2.34-3.75)
0.82±0.03
(0.77-0.86)
a1 7 2.82±0.57
(2.04-3.70)
0.75±0.03
(0.69-0.80)
a2 7 3.17±0.49
(2.25-3.51)
0.83±0.06
(0.77-0.96)
a2 1 3.63 0.88
a6 1 3.86 0.82
totaal 67 3.31±0.58
(1.80-4.01)
0.82±0.06
(0.66-0.96)

89Chapter 4 Identity of bacteria predominating in GAC filters for drinking water treatment
BV204472204472511511102210218122369198919811246102181124681758175255435775109255335775109255435771328413284143051430512262122622044
EBCT7232377232372377237232372323237777232372377237
Pearson correlation (Opt:0.50%) [41.2%-72.5%] [72.6%-90.9%]T.RFLP Hhal
40 45 50 55 60 65 70 75 80 85 90 95 100
figure 4.s1 dendrogram for the t-rFlP patterns of bacterial community in a pilot Gac filter in the period of
one year, at different bed volumes (BV) in the top (eBct 7) and middle layer (eBct 23) of the filter. the t-rFlP
fingerprints were compared with unweighted pair-group method using arithmetic averages (Bionumeric software
version 3.0. applied Maths nV. Sint-Martens-latem. Belgium). Bedvolumes represent also the runnung time of a
filter.


5nutritional VerSatilitY oF tWo Polaromonas
StrainS iSolated FroM Granular actiVated
carBon FilterS
CHAPTER
This chapter is based on publication:
Magic-Knezev A., and van der Kooij D. (2006). Nutritional versatility of two Polaromonas-re-lated bacteria isolated from biological granular activated carbon filters pp. 303-311. In: Recent progress in slow sand and alternative biofiltration processes. Eds. Gimbel R., Graham N.J.G., and Collins M. R. I WA Publishing, London, UK.
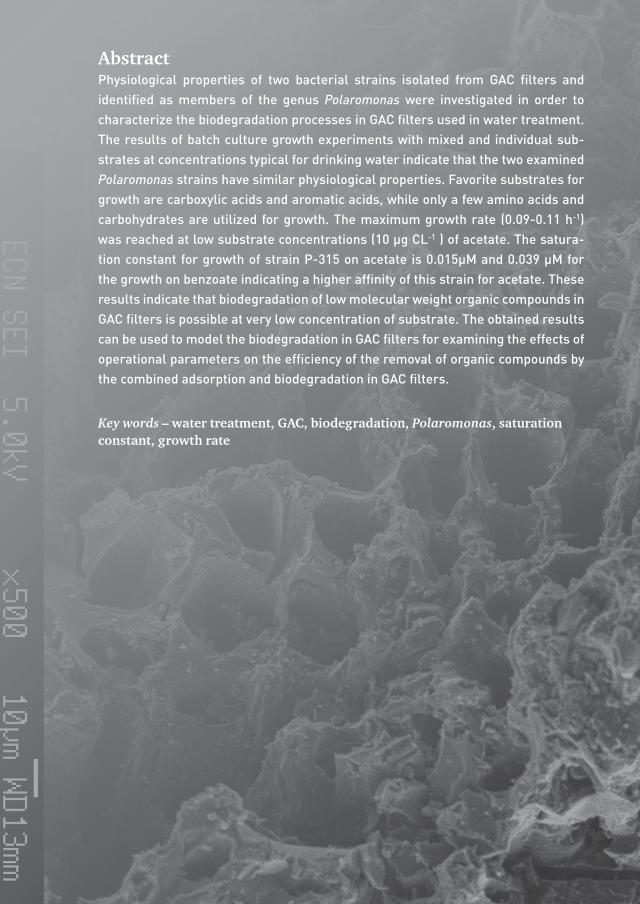
Abstract Physiological properties of two bacterial strains isolated from GAC fi lters and identifi ed as members of the genus Polaromonas were investigated in order to characterize the biodegradation processes in GAC fi lters used in water treatment. The results of batch culture growth experiments with mixed and individual sub-strates at concentrations typical for drinking water indicate that the two examined Polaromonas strains have similar physiological properties. Favorite substrates for growth are carboxylic acids and aromatic acids, while only a few amino acids and carbohydrates are utilized for growth. The maximum growth rate (0.09-0.11 h-1) was reached at low substrate concentrations (10 μg CL-1 ) of acetate. The satura-tion constant for growth of strain P-315 on acetate is 0.015μM and 0.039 μM for the growth on benzoate indicating a higher affi nity of this strain for acetate. These results indicate that biodegradation of low molecular weight organic compounds in GAC fi lters is possible at very low concentration of substrate. The obtained results can be used to model the biodegradation in GAC fi lters for examining the effects of operational parameters on the effi ciency of the removal of organic compounds by the combined adsorption and biodegradation in GAC fi lters.
Key words – water treatment, GAC, biodegradation, Polaromonas, saturation constant, growth rate

93Chapter 5 Nutritional versatility of two Polaromonas strains isolated from GACF
5.1 inTroducTion Biodegradation processes in granular activated carbon (GAC) filters are beneficial for the removal of organic compounds in the process of water treatment. The extent of biodegrada-tion in GAC filters is determined by the concentration of active biomass and by the metabolic properties of this biomass for available substrates. For the optimal exploitation of biodegra-dation in GAC filtration detailed information is needed about quantitative and qualitative properties of biomass in the GAC filters. Several methods are available for the assessment of the biomass concentration associated with GAC (Magic-Knezev and Van der Kooij 2004; Urf-er and Huck 2000; Wang et al. 1995), but information about metabolic properties of bacteria from GAC is scarce. According to the ATP-based method (Magic-Knezev and Van der Kooij 2004), 6 -125 kg of active biomass can be present in a filter bed of 100 m3 GAC. Further char-acterisation and optimisation of biodegradation in GAC filters requires information about the identity and physiological properties of predominant bacteria in GAC filters. In a study that was based on cultivation-dependant techniques, the dominant cultivable bacteria in GAC fil-ters used in drinking water treatment were identified as members of the genus Polaromonas of the Comamonadaceae family (Magic-Knezev et al. 2003). Very little information about the physiological properties of species belonging to this genus is available. Therefore, the aim of this research was to determine the growth characteristics of two strains belonging to the genus Polaromonas that were isolated from GAC filters. Experiments were designed to obtain information about:
1. the nature of favourite substrates at concentrations typical for water treatment and2. the kinetic parameters of growth on selected substrates at concentrations typical for water
treatment.
The information about the nature of favourite substrates and kinetic parameters of growth for these two strains, together with the information about the concentration of biomass in a GAC filter contributes to the understanding of the removal of organic matter by the biodegradation processes in a GAC filter.
5.2 meThods and maTerials
5.2.1 Bacterial strains Strain P-315 was isolated from a GAC filter treating surface water that was pre-treated by co-agulation and sedimentation followed by rapid sand filtration, softening and ozonation. Strain P-305 was isolated from a GAC filter treating ground water pre-treated with rapid sand filtra-tion and softening.According to the 16S rRNA sequence analysis both strains were identified as members of the genus Polaromonas. The closest cultured relative with both strains is Polaromonas vacuolata with a sequence similarity >97% (NCBI accession number UAU14585). Although a high level of similarity was observed for 16S rRNA sequence, analysis of genomic DNA with AFPLP fin-gerprinting (chapter 4) indicated that these two strains belonged to different genotypes. Inoculum cultures to be used in the growth experiments were prepared by inoculating a 100-ml infusion flask containing basal medium supplemented with 1 mg acetate-C L-1 with a

94 Microbial activity in GAC filters in drinking water treatment
suspension of a fresh culture grown on an R2A agar. Flasks were incubated at 15°C until the maximum colony counts were obtained (4-8 106 CFU ml-1). These cultures were kept at 4°C.
5.2.2 Growth on mixed substratesThe growth experiments were performed in 1-l glass-stoppered Erlenmeyer flask heated at 550°C for 4 hours to eliminate traces of organic carbon. The pipettes were cleaned with a 10% solution of K2Cr2O7 in concentrated H2SO4, followed by 4 hour rinsing with tap water and heating overnight at 250°C. A total of four different types or organic compounds were used as a substrate for growth: I, 20 amino acids; II, 11 aromatic compounds; III, 17 carboxylic acids and IV, 20 carbohydrates. Solutions were prepared in 600 ml of drinking water (AOC concen-tration < 5 µg acetate-C eq L-1), prepared from dune-infiltrated river water treated with pow-dered activated carbon, followed by softening, rapid and slow sand filtration. Indigenous bac-teria were eliminated by pasteurisation of water at 60°C for 30 minutes. Mixtures of substrates were prepared by adding individual substrates from stock solutions, which had been prepared as described previously (Van der Kooij and Hijnen 1985). The final concentration of each indi-vidual substrate in the mixture was 1 µg C L-1. Phosphorus (Na2HPO4) and nitrogen were add-ed (NH4Cl) to avoid growth limitation other than by the carbon source. Flasks were inoculated with the pre-cultured suspension of the strains to reach a start concentration of 100-500 CFU ml-1. The Erlenmeyer flasks were incubated without shaking in the dark at 15±1°C and growth was monitored by periodic determination of viable cells counts on R2A medium (Oxoid) in triplicate after incubation at 25°C during 5-7 days. Parallel to the determination of viable cell counts, concentrations of ATP were measured. Each mixture or concentrations was tested in duplicate flasks.
5.2.3 Growth on individual substratesFor the preparation of 1 mg C L-1 solutions autoclaved tap water was supplemented with ni-trogen, phosphorous and individual carbon source from the stock solution and inoculated with the 100-1000 CFU of the pre-cultured strain. Growth was carried out in 9-ml test tubes at 15±1°C. The growth was monitored by measurement of the ATP concentration on days 7 and 14 after inoculation. Solutions containing 10 µg CL-1 of individual substrates were prepared in the same way as described for the solutions of mixed substrate except only one substrate was added per Erlenmeyer flask. Flasks were inoculated with the pre-cultured suspension of strain to reach a start concentration of 100 to 500 CFU ml-1 and monitoring of growth was identi-cal as in the experiments with mixed substrates. For each substrate a duplicate test was per-formed. The experiments conducted to determine the kinetic parameters of growth (growth yield coefficient (Y), maximal growth rate (1/Gmin) and substrate saturation constant Ks) were carried out in drinking water prepared from aerobic groundwater containing a very low concentration of assimilable organic carbon. The test water was supplemented with nitrogen, phosphorous and the selected carbon source (acetate or benzoate) at concentrations ranging from 1 to 500 µg CL-1. The flasks were incubated at 15±1°C and growth was monitored by periodic determination of viable cell counts on R2A medium (Oxoid) in triplicate after incuba-tion at 25°C during 5-7 days. Parallel to the determination of the viable cell counts ATP con-centration was measured.
95Chapter 5 Nutritional versatility of two Polaromonas strains isolated from GACF
5.2.4 ATP analysisThe measurement of ATP is based on the production of light in the luciferine-luciferase assay. ATP was released from suspended cells with nucleotide-releasing buffer (NRB, Celsis). The intensity of the emitted light was measured in a luminometer (Celsis AdvanceTM) calibrated with solutions of free ATP (Celsis) in autoclaved tap water following the procedure as given by the manufacturer. The detection limit was 1 ng ATP L -1 of sample.
5.2.5 Growth kineticsThe growth yield Y was calculated from the maximum colony counts (Nmax, CFU/ml) obtained for the applied substrate concentration (dS). Y= dNmax/ dS (eq 1.)
The doubling time (G in hours) of the cultures was calculated with the equation:
G = log 2(t’-t)/(logNt’-log Nt) (eq 2.)
where t’- t is the incubation time in number of viable cells (N) increased from Nt to Nt’.
The saturation constant Ks and the minimum generation time Gmin were calculated with the Lineweaver-Burk equation:
G = Gmin+ Gmin·Ks/S (eq 3.)
Where S is the concentration of the added substrate (dS) and the natural substrate concentra-tion (Sn) which was derived from the Nmax values observed in water without substrate addition. (Van der Kooij and Hijnen 1985).
5.3 resulTs and discussion
5.3.1 Growth on mixed substratesThe growth on mixed substrate at the concentration of individual substrate of 1 µg C L-1 is per-formed for four major groups of organic compounds, viz. 20 amono acids (AA), 11 aromatic acids (AR); 17 carboxylic acids (CA) and 11 carbohydrates (CH). The growth response is com-pared to the growth in water without added substrate. The strains responded similarly to the substrate mixtures. Both strains showed significant growth in the mixtures of the AA, AR and CA compounds and a low response was observed with CH (Table 5.1). The best response was observed for the AR mixture indicating a high affinity of the strains for these (types of) organic compounds.

96 Microbial activity in GAC filters in drinking water treatment
5.3.2 Growth on individual substratesThe growth of strains on individual carbon sources was tested for two concentrations: 1 mg C L-1 and 10 µg C L-1. The results of the growth experiments on a wide range of individual com-pounds at a concentration of 1 mg C L-1 are presented in Table 5.2.
Table 5.1 Growth response of two Polaromonas strains as the maximum colony forming units (cFu l-1) and the
atP concentration (ng l-1) of the strains (cm) in the suspensions of mixed substrates and in blank water (cb). aa =
amino acids; ca = carboxylic acids; ar = aromatic compounds; ch = carbohydrates
aa ca ar ch
Strain P-315 cm (cFu) 1.9 106 1.8 106 7.2 105 8.2 105
cb (cFu) 2.8 105 2.8 105 5.2 104 3.5 105
cm (atP) 228 144 44 60
cb (atP) 25 25 6.4 30
Strain P-305 cm (cFu) 1.7 106 7.9 105 3.2 105 4.8 105
cb (cFu) 2.1 105 2.1 105 1.5 104 3.1 105
cm (atP) 105 67 24 41
cb (atP) 16 16 3.4 22
Table 5.2 utilisation of individual compounds in drinking water by two Polaromonas strains at a concentration
of 1 mg l-1.
substrate type number of com-pounds
number (%) of compounds utilized
Strain P-315 Strain P-305
amino acids (aa) 20 6 (30) 3 (15)
aromatic compounds (ar) 11 6 (55) 6 (55)
carboxylic acid (ca) 17 17 (100) 15 (88)
carbohydrates (ch) 21 3 (14) 5 (24)
The strains showed some differences in response to the substrates from four major groups but both strains grew well on the majority of tested carboxylic acids and aromatic compounds. The utilisation of amino acids and especially growth on carbohydrates was limited to a number of compounds from these two groups. However, strains grew better on the mixture of amino ac-ids, indicating that some amino acids serve as a source of energy while other serve as a carbon source. Strain P-305, isolated from the filter treating groundwater, had a slightly lower re-sponse in terms of growth with individual substrates than strain P-315 that was isolated from the filter treating surface water. Furthermore, strain P-305 grew slower in the water without substrates added.

97Chapter 5 Nutritional versatility of two Polaromonas strains isolated from GACF
A number of compounds was selected for further growth experiments at a concentration of 10 µg C L-1. The best response was observed for acetic acid, tartaric acid and benzoic acid (data not shown).
5.3.3 Growth kinetics of the Polaromonas strains for acetic and benzoic acid Acetic acid and benzoic acid were selected as substrates for the determination of the kinetic parameters of growth. Acetic acid is a by-product of ozonation and contributes to the AOC concentration in drinking water. Benzoic acid was selected to obtain information about the degradation of aromatic compounds which are present in drinking water as a part of natural organic matter (humic and fulvic acid), or as a xenobiotic compounds. Furthermore, kinetic parameters of growth on acetate for Spirillum sp. (strain NOX) and Pseudomonas fluorescens (strain P17) which are widely applied for the analysis of AOC concentration in treated water, were determined earlier (Van der Kooij 1990).
The kinetic parameters of growth were determined for the concentration range 1-500 µg C L-1. The growth curves observed in water supplied with substrates demonstrated that Nmax values and the growth rate depend on the substrate concentration. Both substrates promoted the growth rate and increased the colony counts at all concentrations tested (Fig. 5.1.).
1,0E+02
1,0E+03
1,0E+04
1,0E+05
1,0E+06
1,0E+07
0 100 200 300 400 500
CFU
/ml
B1-1 B1-2 B3-1 B3-2 B5-1 B5-2 B10-1 B10-2 B25-1 B25-2 B100-1 B100-2 B500-1 B500-2Blank-1Blank-2
B1-1B1-2B3-1B3-2B5-1B5-2B10-1B10-2B25-1B25-2B100-1B100-2B500-1B500-2Blank-1Blank-2
1,0E+07
1,0E+06
1,0E+05
1,0E+04
1,0E+03
1,0E+020 100 200 300 400 500
hours
CFU
/ml
figure 5.1 Growth of strain P-315 with different concentrations of benzoate at 15ºc.
The growth yield coefficients were calculated with the maximum values of the ATP concentra-tion and the plate count (CFU ml-1) for the applied substrate concentrations. These yield coef-ficient values differ slightly for the examined substrates and were used to calculate the natural indigenous substrate concentration (Sn) in the blank water (Table 5.3). The Sn concentration calculated from the yield coefficient derived from the ATP measurement were slightly higher than the concentrations calculated with the yield coefficient derived from the plate counts. The average value of the derived indigenous substrate concentration was used for the correc-tion of S (Sn+dS) in the calculation of Gmin and Ks with the Lineweaver-Burk equation (eq. 3). A plot of the generation time (G) of strain P-315 versus 1/S gave linear function for the growth on acetate and a non-linear function for the growth on benzoate (Fig. 5.2).

98 Microbial activity in GAC filters in drinking water treatment
The results reveal that Sn and added acetate were utilized simultaneously, while added benzo-ate is utilized after the depletion of Sn. Due to the preferential utilization of Sn in the solutions with added benzoate, kinetic parameters for growth on benzoate were determined for the concentrations above 10 µg C L-1. The minimum generation time of strain P-315 for both sub-strates was between 9 and 11 h (0.09-0.11 h-1), but the Ks value for acetate was lower than the Ks value for benzoate (Table 4) indicating a higher affinity of strain P-315 for acetate than for benzoate.
The observed Ks values are low and similar values have been reported for the growth of Aeromonas hydrophyla strain M800 on oleate (Van der Kooij and Hijnen 1988) and for the growth of Flavobacterium sp. strain S12 on oligosaccharides (Van der Kooij and Hijnen 1985). Furthermore, a similar saturation constant is reported for growth of a Mycobacterium sp. on
Table 5.3 Growth yield of two Polaromonas strains on acetate (Yac) and benzoate (Yar) acid and the concentra-
tion of indigenous substrate (Sn) derived from the growth yield and the maximum growth in the blank.
strain substrate ycfu
(cfu µg-1 c)
sn(cfu)
(µg c l-1 )
yaTP
(ng aTP µg-1 c)
sn(aTP)
(µg c l-1 )
P- 305 acetate 2.1 107±2.3 106 1.9±0.3 0.77±0.04 2.1±0.1
Benzoate 1.7 107±2.2 106 2.4±0.4 0.75±0.15 2.1±0.3
P- 315 acetate 1.4 107±6.8 105 1.7±0.5 0.76±0.01 2.4±0.6
Benzoate 1.4 107±1.8 106 1.7±0.4 0.93±0.11 1.9±0.5
5
7
9
11
13
15
17
0 0,1 0,2 0,3 0,4 0,5
1/S ((µg C/l)-1)
G (
h)
17
15
13
11
9
7
5
G (h
)
0 0,1 0,2 0,3 0,4 0,51/S [(µg C L-1)-1]
figure 5.2 lineweaver-Burk plot of strain P-315 for growth on acetate ( ) and benzoate (x).

99Chapter 5 Nutritional versatility of two Polaromonas strains isolated from GACF
phenanthrene (Table 6.4). Information about the physiological properties of bacteria belong-ing to the genus Polaromonas is scarce. There are only few species described in this genus and one of the species is isolated from a GAC filter treating polluted groundwater (Coleman et al. 2002). The results of our research indicate that Polaromonas strains isolated from GAC filters are able to grow at very low concentration of carboxylic acids, aromatic compounds, and ami-no acids when present in a mixture (1 µg C L-1). Carboxylic acids, which are the favourite substrates of Polaromonas strains, are formed by the oxidation of natural organic matter and are common constituents of organic matter at the end of the treatment train. Their presence in drinking water may contribute to the biofilm forma-tion in distribution systems. Due to their polar nature, carboxylic acids cannot be removed by adsorption on GAC, and their removal by biodegradation results in the improvement of bio-logical stability of drinking water.
Table 5.4 Saturation constants for growth of some aquatic bacteria on different substrates.
strain substrate ks
(µm)
gmin
(h)
reference
Polaromonas P-315 acetate 0.015 10.9 this research
Benzoate 0.039 9.4
Polaromonas cis-dichloroethene 1.6 coleman et al.(2002)
mycobacterium sp. Phenanthrene 0.026 Miyata et al.(2004)
aeromonas hydrophyla
Strain M800
oleate
acetate
0.01
0.46
4.3
6.7
Van der Kooij and hijnen (1988)
Flavobacterium sp. Maltotetraose
Maltopentaose
Maltohexaose
0.019
0.016
0.015
2.3
2.2
2.2
Van der Kooij and hijnen (1985)
spirillum sp. oxalate 0.14 4.1 Van der Kooij (1990)
Pseudomonas fluorescens acetate 0.17 5.5
Pseudomonas spp. gF1TP toluene 2.1 2.6 Massol-deya et al. (1997)
Pseudomonas spp. gF161 toluene 2.7 3.0
ralstonia taiwanensis Phenol 5.5 chen et al. (2004)

100 Microbial activity in GAC filters in drinking water treatment
The removal of organic compounds in GAC filters is a result of adsorption and biodegradation processes. The removal by the adsorption is determined by the adsorption capacity of GAC and the adsorption kinetics of organic compounds in the water, while the removal by the bio- degradation is determined by the concentration of biomass and its metabolic potential for the organic compounds that are available as a substrate. The adsorption capacity of GAC for organic compounds can differ significantly, but aromatic compounds are more adsorbable and will therefore occupy the adsorption sites on GAC. When these compounds are utilized by micro-organism the adsorption capacity of GAC will be used more optimally for the target compounds that are non-biodegradable and adsorbable resulting in an improved performance of the GAC filter and improved water quality. The information about the biodegradation kinet-ics for carboxylic acids by bacteria from GAC will be used for modeling the removal of these compounds in GAC filters, aiming at optimizing the use of this treatment process.
5.5 conclusions
Two strains of the genus Polaromonas, isolated as predominant cultivable bacteria from GAC filters used in water treatment, have a similar metabolic potential and the following physi-ological properties of these strains were observed:
1. Preferable substrates for growth are carboxylic acids and aromatic compounds while amino acids are utilized only when present in a mixture. Both strains grow only on a limited number of amino acids and carbohydrates;
2. Growth on benzoate and acetate occurs at very low concentration of these substrates (1 µg L-1) with a relatively low growth rate (0.09 h-1);
The Ks value for growth on benzoate (0.039 µM) and for acetate (0.015 µM) in combination with nearly similar Gmin values indicate that strain P-315 has a higher affinity for acetate (6) than for benzoate (0.23);
3. The ATP concentration is a suited parameter for the determination of bacterial growth yield and the natural substrate concentration and for determination of kinetic growth parameters at concentrations > 10 µg C L-1.
Hence, bacteria in GAC filters used in water treatment are able to utilise biodegradable low molecular weight compounds at very low concentrations, thus contributing to the production of biologically stable drinking water.

101Chapter 5 Nutritional versatility of two Polaromonas strains isolated from GACF
Chen W.M., Chang J.S., Wu C.H., Chang S.C.
(2004). Characterization of phenol and trichloroethene
degradation by the rhizobium Ralstonia taiwanensis.
Res. Microbiol., 155(8), 672-680.
Coleman N. V., T. E. Mattes J. M. Gossett and J. C.
Spain. (2002). Biodeg-radation of cis-dichloroethene
as the sole carbon source by a beta-proteobacterium.
Appl. Environ. Microbiol., 68(6), 2726–2730.
Magic-Knezev A., Wullings, B., van der Kooij, D.
(2003). Identification of cultivable bacteria from acti-
vated carbon filters used for water treatment. 1st FEMS
Congress of European Microbiologists, 2003 June 29
- July 3, Ljubljana, Slovenia.
Magic-Knezev A. and D. van der Kooij. (2004).
Optimisation and significance of ATP analysis for
measuring active biomass in granular activated carbon
filters used in water treatment. Wat.Res., 38 (18),
3971-3979.
Massol-Deya A., R. Weller, L.Rios-Hernandes, J.
Z. Zhou, R.F. Hickey, J.M. Tiedje. (1997). Succession
and Convergence of Biofilm Communities in Fixed-Film
Reactors Treating Aromatic Hydrocarbons in Ground-
water. Appl.Environ. Microbiol., 63(1), 270–276.
Miyata N., Iwahori K., Foght JM., Gray M.R.
(2004). Saturable, energy-dependent uptake of phen-
anthrene in aqueous phase by Mycobacterium sp. strain
RJGII-135. Appl Environ Microbiol., 70(1),363-369.
Urfer D. and Huck P.M. (2000). Measurement of
biomass activity in drinking water biofilters using a
respirometric method. Wat. Res., 35(6), 1469-1477.
Van der Kooij D. (1990). Assimilable organic car-
bon (AOC) in drinking water. In (G.A. McFeters eds)
Drinking water microbiology; progress and recent devel-
opments, pp 61-87. Springer-Verlag New York Berlin.
Van der Kooij D. and W.A.M. Hijnen (1985). Deter-
mination of the concentration of maltose- and starch-
like compounds in drinking water by growth measure-
ments with a well-defined strain of a Flavobacterium
species. Appl, Environ. Microbiol., 49(4),765-771.
Van der Kooij D. and W.A.M. Hijnen (1988). Nutri-
tional versatility and growth kinetics of an Aeromonas
hydrophyla strain isolated from drinking water Appl.
Environ. Microbiol., 54(11),2842-2851.
Wang J.Z., Summers R.S. and Miltner R. J. (1995).
Biofiltration performance, part 1, relationship to
biomass. Filtration, Jour. Am. Water Works Assoc., 87,
55-63.
5.6 references


6Polaromonas aS Model For analYzinG the
MicroBial utilization oF natural orGanic Matter
in Granular actiVated carBon FilterS in Water
treatMent
CHAPTER
Knezev A., van der Aa R. and van der Kooij D.
This chapter has been submitted for publication

Abstract Bacterial growth and the removal of natural organic matter (NOM) were analyzed in a pilot plant granular activated carbon (GAC) fi lter that was operated at the surface water treatment pilot plant of Weesperkarspel (Waternet, The Netherlands) during 602 days aiming to assess feasibility of Polaromonas as a model for the microbial utilization of NOM in GAC fi lters (GACFs). Removal of dissolved NOM in a GACF oc-curred at two rates. In phase I (<20,000 bed volumes BV), with adsorption as the main driving force, NOM is removed approximately three times faster than in phase II with slow adsorption and increased biological activity. The bacterial accumula-tion rate (BAR) on GAC was higher in the top of the fi lter (1.6 ng ATP g-1 GAC day-1) than in the middle part (1.1 to 1.6 ng ATP g-1 GAC day-1), and biomass concentration on GAC (BGAC) reached its maximal level of 315 – 530 ng ATP g-1 GAC after approxi-mately 250 days. The low specifi c growth rate of bacteria on GAC (<0.016 d-1) implies that substrate uptake for maintenance requirements is a signifi cant mechanism in the microbial removal of biodegradable compounds. At a temperature above 15°C bacterial ATP concentration decreased rapidly, but oxygen consumption increased, indicating activity of predating (micro) organisms in the fi lter. The quotient of oxy-gen consumption and dissolved organic carbon (DOC) removal exceeded the theo-retical value (2.8 mg O2 mg-1 C) for complete NOM oxidation at temperatures >10°C (3.9-11.2 mg O2 mg-1 C) suggesting the utilisation of accumulated living and dead biomass (particulate organic carbon, POC) by predating (micro)organisms. Biomass accumulation and oxygen consumption demonstrate that biodegradation plays a role in NOM removal in the GACF. However, oxygen consumption cannot be used as a quantitative measure for the biodegradation of dissolved NOM because of lack of information about POC removal and oxygen uptake by physicochemical processes on GAC surface. Values of the apparent specifi c NOM utilization rate (qA, 0.2 – 1.8 μg DOC ng-1 ATP day-1) observed in phase II approached the maintenance coeffi cient of Polaromonas for growth on acetate at lower temperatures and the maximal specifi c utilization rate at higher temperatures. A quantitative comparison of the apparent specifi c NOM utilization rate (qA) in the GAC fi lterbed, with the temperature-ad-justed maintenance coeffi cient and the specifi c maximal utilization rate of acetate by Polaromonas requires more accurate data on BGAC and the contribution of POC removal to microbial activity. The nature of the low molecular weight compounds that may be released by the disruption of humic substance micelles by the adsorp-tion is consistent with the preferred substrates of Polaromonas spp. predominating on GAC, but confi rmation of this hypothesis requires further research.
Keywords – water treatment, granular activated carbon, natural organic matter, adsorption, biodegradation, ATP, Polaromonas,

105Chapter 6 Polaromonas as model for analyzing the microbial utilization of NOM in GACF
6.1 inTroducTion
Granular activated carbon (GAC) filtration is used in water treatment for the removal of antropogenic contaminants and natural organic matter (NOM) that cause undesirable co-lour, odour or taste, serve as precursor for the formation of disinfection by products, or sup-port microbial growth in the distribution system. Bacterial activity in GAC filters (GACFs) has been studied with a variety of techniques, and all studies showed a substantial presence of bacteria in GACFs with most activity in the top section and an increasing activity with the age of the filterbed (Camper et al. 1985; Carlson et al. 1996; Servais et al. 1994a,b; Magic-Knezev and van der Kooij 2004; Velten et al. 2007). Changes in NOM composition due to ox-idative pretreatment of water enhances microbial activity and extends the operational time of a GACF for the removal of specific organic contaminants and dissolved NOM (Sontheimer et al. 1978; Carlson et al. 1996; Orlandini 1999; van der Aa et al. 2012). Various studies demonstrated enhanced biological activity in GACFs as compared to biofilters with sand, gravel, anthracite or other inert media (van der Kooij, 1983; Nijishima et al. 1992; Wang et al. 1995; Carlson and Amy 1998; LeChevallier et al. 1992; Uhl, 2000). The enhanced biolog-ical activity has been attributed to the physical and chemical properties of the GAC surface (Shimp and Pfaender 1982; Chudyk and Snoeyink 1984; Goeddertz et al. 1988; Nishijima et al. 1992; Servais et al. 1994b; Wang et al. 1995), and microbial utilisation of compounds adsorbed onto GAC (Eberhardt 1975; Sontheimer et al. 1978; Weber et al. 1978; Chudyk and Snoeyink 1984; Kim et al. 1997; Summers et al. 2010). However, utilisation of adsorbed compounds has been denied by other investigators (Peel and Benedek 1983; van der Kooij 1983; Sontheimer and Hubele 1986; Kim et al. 1997a; Ypsalski et al. 2008). To date, the mechanisms of the enhanced biological activity in GAC filterbeds remain unresolved.
Bacteria in GACFs utilize organic compounds for growth and maintenance. The extent of the removal due to bacterial utilization is determined by the quantity and metabolic properties of the bacteria in a filter, however, surprisingly little is known about these properties of bac-teria in GACFs. Earlier studies, based on cultivation techniques, identified the bacteria iso-lated from GACFs in water treatment as members of the genera Pseudomonas, Acinetobacter, Caulobacter, Alcaligenes, Flavobacterium and Bacillus (McElhaney et al. 1978; Wilcox et al. 1983; Stewart et al. 1990). In a more recent study Polaromonas spp. and Hydrogenophaga spp., both belonging to the Betaproteobacteria, were identified by molecular techniques, as the predominant bacteria cultivated from GACFs in water treatment (Magic-Knezev et al. 2009). Also Niemi et al. (2009) reported the predominance of Betaproteobacteria, e.g. representatives of the Burkholderiales, in GACFs. Polaromonas spp. are commonly found in ultra-oligotrophic aquatic environments (Jeon et al. 2004; Page et al. 2004; Loy et al. 2005), indicating that these bacteria are adapted to growth at microgram-per-liter levels. Indeed, the substrate saturation constant (Ks) of two Polaromonas strains, isolated from GACFs, is about 1 µg C L-1 for acetate and benzoate when growing in batch tests (Magic-Knezev and van der Kooij 2006).
The objective of this investigation was to assess the microbial utilization of NOM in a GACF. For this purpose NOM removal by GAC filtration in a surface water pilot plant was studied for about 1.5 years. Data about oxygen utilization, the concentration of adenosine 5’-triphosphate

106 Microbial activity in GAC filters in drinking water treatment
(ATP) associated with GAC and the metabolic properties of Polaromonas strains isolated from a GACF were used to analyze the microbial utilization of NOM.
6.2 meThods and maTerials
6.2.1 Pilot plant A GAC column was operated in a pilot plant at the water treatment plant Weesperkarspel of Waternet, the water cycle company of Amsterdam and surrounding areas. This column received pretreated water from the full-scale treatment plant using groundwater-derived seepage water as source. Pretreatment included coagulation and sedimentation in an open reservoir (lake) followed by rapid sand filtration, ozonation (net ozone dosage 2 mg L-1 at temperatures below 12 °C and 1.5 mg L-1 , at temperatures above 12 °C) and softening in pel-let reactors. This softened water was supplied to the GAC column of the pilot plant starting in July for an operational period of 602 days. The quality characteristics of the influent and the operational parameters of the GAC filterbed are shown in Table 6.1. Backwashing of the GAC filterbed, based on pressure drop, was applied weekly in summer and monthly in winter.
6.2.2 Analytical proceduresThe quality of the influent and water at empty bed contact times (EBCT) of 7 minutes (top section, 42 cm; 82 kg GAC), 23 minutes (middle section, 142 cm; 196 kg GAC) and 40 minutes (effluent) (242 cm; 474 kg GAC), was analyzed each 14 to 28 days. Oxygen, DOC, pH, phos-phate, nitrate, ammonium and UV absorbance at 254 nm (UVA, m-1) were measured according to standardized methods (Standard Methods 1998). The AOC concentration was determined by measuring the growth of the test strains Pseudomonas fluorescens P17 and Spirillum sp. strain NOX in pasteurized water samples of 600 ml (van der Kooij 1992). Periodically, ap-proximately 50 g of GAC was sampled from the filterbed with a thoroughly cleaned stainless steel pipe (D = 1.2 cm, L = 35 cm) via the sampling ports, at EBCT7 and EBCT23, respectively. High-energy ultrasonic treatment was used for the removal of bacteria from GAC (Magic-Knezev and van der Kooij 2004) The concentration of ATP in the obtained suspension and in water samples was measured as light emission in the luciferine-luciferase assay (Holm-Hansen and Booth 1966) with a luminometer (Advance, Celsis) using a reagent kit for bacterial ATP (Celsis; Brussels, Belgium). The ATP concentration was calculated from the relative light units (RLU) using the coefficient of the linear regression analysis of the calibration curve for free ATP (Celsis) in autoclaved tap water in the range of 1 – 250 ng L-1. From the linear relationship between the bacterial biomass concentration on GAC (BGAC, ng ATP g-1) and time in the growth phase, the biomass accumulation rate (BAR, ng ATP g-1 GAC d-1) was calculated.
Bacterial suspensions obtained by sonication of GAC samples (30 ml) were concentrated us-ing a polycarbonate filter (diameter 25 mm, 0.22 µm pore size, type GTTP; Millipore). Subse-quently, DNA from bacteria retained on the filter was extracted and purified by the FastDNA Kit for soil (BIO 101. Inc., 1070 Vista, CA, USA) as described by the producer. Extracted DNA was stored at -20°C and used for characterization of the bacterial community with TRFLP-analysis (see Supplemental Material).

107Chapter 6 Polaromonas as model for analyzing the microbial utilization of NOM in GACF
6.2.3 GAC characteristicsIn the GAC column (diameter 74.5 cm), Norit GAC 830P was used with an effective particle size of 0.1 cm (uniformity coefficient 1.7, an apparent density of 0.432 g cm-3 (backwashed and drained) and a filter bed porosity of 39%. The specific surface area of the diffusion layer surrounding the GAC particles (85 cm2 g-1 GAC) was calculated from the median particle size assuming a spherical shape with an average diameter of 0.1 cm, as described in Supplemental Material. The external surface of GAC available for bacterial attachment (700 cm2 g-1 GAC), including the surface of the pores with a diameter >1 µm, was calculated from mercury intru-sion analysis for GAC 830, provided by Cabot (Supplemental Material).
6.2.4 Removal of DOC, UVA and oxygen The removal of DOC, UVA and oxygen was calculated according to equation 1:
∆X = XI – XE (1)
where X is the concentration of DOC [mg C L-1], UVA [m-1] or O2 [mg O2 L-1], XI is the concen-tration in the influent and XE is the concentration in the effluent.
Parameter value*
column diameter [m] 0.745
Bed height [m] 2.415
carbon type [-] Gac 830P
total operational period [days] 602
Flow [m3h-1] 1.6
Surface load [m h-1] 3.7
empty bed contact time (eBct, min] 40
ozone dosage [g o3 m-3] 1.5
temp [°c] 3-24
ph [-] 7.6-7.9
doc [g c m-3] 4.6-6.0
ultraviolet light (254 nm) absorbance (uVa, m-1) 8-11
aoc [10-3 g acetate-c eq m-3] 47-88 (68)
nitrate [g m-3] <0.001- 0.20 (0.01)
Phosphate [g m-3] 0.01-0.09 (0.02)
atP (ng l-1) 5-72 (25)
Table 6.1 operational parameters of the Gac filtration and influent water quality characteristics.
* median value is given between brackets

108 Microbial activity in GAC filters in drinking water treatment
The specific removal rate of DOC, UVA and oxygen was calculated according to equation 2:
XSR = ∆X × Q × (mGAC)-1 (2)
Where Q is the flow (L d-1] , mGAC is the weight of GAC in the column at the defined EBCT [g GAC] and XSR is the specific removal rate of component X [mg C g-1 GAC d-1; m-1 g-1 GAC d-1; mg O2 g-1 GAC d-1].
Specific accumulation of component X (DOC, UVA and oxygen) was calculated according to equation 3:
XCS(t)= ∑ t=0 XSR,i,j (t) (3)
Where XSR is the specific removal rate of component X for a given running time (t) [d] and XCS is the specific accumulation of component X [mg C g-1 GAC; m-1 g-1 GAC; mg O2 g-1 GAC].
6.3 resulTs and discussion
6.3.1 NOM removal The DOC concentration in the influent of the GACF varied between 4.6-6 mg L-1. The concen-tration drop (c. 15 %) in summer (Fig. 6.1A,C) can be attributed to more effective biological processes in the pretreatment in this period. The DOC removal at EBCT 40 min (EBCT40) de-creased rapidly from more than 95% at the beginning to approximately 20±5 % after 200 days (7,200 BVs) and approached 10% at the end of the experiment (602 days, 22,000 BVs) (Fig. 6.1A, B). At EBCT7 the 10%-reduction level was reached after about 30,000 BVs (day 150) and approached 5% after about 100,000 BVs (day 500). At EBCT23 and EBCT40 the DOC removal increased after 350 (Fig. 1A) days when water temperature was > 20°C. The UVA reduction decreased from 98% at the beginning to approx. 26±6 % (at EBCT40) after about 200 days (7,200 BVs), increased to 35% at a water temperature > 20°C and subsequently decreased further to about 20% after 500 days (18,000 BVs) (Fig. 6.1D). At EBCT7, the UVA reduction was c. 10% after 100,000 BVs (500 days). The AOC concentration in the influent varied be-tween 47-88 µg C L-1 (median 68 µg C l-1) and between 9 - 40 µg C L-1 (median 29 µg C l-1) in the effluent (EBCT40). The removal dropped from more than 80% in the beginning to 40% at the end of the experiment (data not shown). A significant proportion of the AOC removal oc-curred at EBCT7 at an average rate of 11.4 ± 3.4 µg AOC g-1 GAC d-1. The average removal rate at EBCT40 was 3.3 ± 0. 9 µg AOC g-1 GAC d-1.
Two phases in NOM removal can be distinguished at EBCT7, less clearly in the EBCT7-23 section
and and not in the EBCT23-40 section (Fig. 6.2). Phase I ended after an operational period of 100 days (20,000 BVs) and a cumulative specific DOC removal (DOCCS) of approx. 122 mg g-1 GAC. The average specific DOC removal rate (DOCRS) in the top layer in phase II was 21% of DOCRS in phase I and remained fairly constant (RSE = 2%, Table 6.2). UVARS in phase II at EBCT7 was 30% of UVARS in phase I (RSE 1%). The decreased removal rates of DOC and UVA in phase II at EBCT7 (Fig. 6.2, Table 6.2) show that adsorption of NOM became much less efficient when

109Chapter 6 Polaromonas as model for analyzing the microbial utilization of NOM in GACF
a certain apparent solid phase concentration had been reached. The phase with reduced NOM removal has been defined as the (pseudo) steady-state phase based on two assumptions: (i) the adsorption capacity of GAC is exhausted and (ii) NOM is removed primarily by biodegradation (Sontheimer et al. 1978; Servais et al. 1991; Billen et al. 1992; Lechevallier et al. 1992; Carlson et al. 1996). However, Peel and Benedek (1980; 1983) developed a dual-rate adsorption kinetic model and concluded that slow diffusion into the micropores causes a continuing adsorptive removal of NOM. Summers and Roberts (1988) attributed the continuing NOM adsorption at extended running times by changes in the orientation of adsorbed NOM at high solid phase concentrations. We observed an increased NOM removal, most pronounced with UVA, after 350 days at an increasing temperature (Fig. 6.1B, D). Schreiber et al. (2005) also observed an increased adsorption of NOM at elevated water temperatures and attributed the effect of tem-perature to an entropic process controlled by hydrophobic interactions with the GAC surface, resulting in a modified orientation of adsorbed NOM. Nevertheless, an increasing number of bed volumes will result in a (slow) decrease of the adsorption capacity. The continuing decline of NOM removal after approximately 400 days (Fig. 6.1 B, D) indicates that high BV numbers are required to achieve a steady-state removal in which the contribution of adsorption has be-come negligible. A continuing decrease in the removal of NOM after more than 50,000 BV has also been observed in other studies (Bonné et al. 2002; Chowdhury et al. 2013). However, the effective removal of pesticides added to the influent after several years of operation demon-strated a significant residual adsorption capacity in GACFs (Bonné et al. 2002).
* corresponds with filterbed section
Table 6.2 the average specific removal of doc and uVa (docrS, uVarS) with standard error of the regression
coefficient during two phases in the top (0-7), middle (7-23) and bottom section (23-40) and the whole column
(0-40).
Phase eBcT (min)* docrs uvars ors
(mg g-1 gac d-1) (m-1 g-1 gac d-1) (mg g-1 gac d-1)
i 0-7 1.10 ± 0.06 1.77 ± 0.15 0.37 ± 0.02
7-23 0.29 ± 0.02 0.48 ± 0.02 0.30 ± 0.02
23-40 0.06 ± 0.01 0.11 ± 0.02 0.25 ± 0.01
0-40 0.34 ± 0.01 0.56 ± 0.02 0.29 ± 0.02
ii 0-7 0.23 ± 0.004 0.53 ± 0.006 0.67 ± 0.02
7-23 0.08 ± 0.005 0.15 ± 0.004 0.30 ± 0.02
23-40 0.07 ± 0.001 0.09 ± 0.002 0.33 ± 0.02
0-40 0.10 ± 0.002 0.19 ± 0.003 0.38 ± 0.02

110 Microbial activity in GAC filters in drinking water treatment
figure 6.1 concentration and the percentual removal of doc (a,B) and uVa (c, d) in relation to the operational
period and water temperature. eBct, empty bed contact time.
3530
25
2015
105
0
Tem
pera
ture
[0 C]
TemperatureA
Influent EBCT 7 min EBCT 23 min EBCT 40 min
Influent EBCT 7 min EBCT 23 min EBCT 40 min
765
4
32
1
0
DO
C [m
g C
L -1
]
0 100 200 300 400 500 600Run time [days]
25
20
15
10
5
0
Tem
pera
ture
[0 C]
25
20
15
10
5
0
Tem
pera
ture
[0 C]
B
100%
80%
60%
40%
20%
0%
(DO
C inf D
OC)
/DO
C inf [
%]
0
100%
80%
60%
40%
20%
0%
(UVA
inf -
UVA
eff)/
UVA
inf [
%]
0
100 200 300 400 500 600Run time [days]
EBCT 7 min EBCT 23 min EBCT 40 min Temperature
CTemperature
DTemperature
24
18
12
6
0
Tem
pera
ture
[0 C]
12
9
6
3
0
UVA
[m-1
]
0 100 200 300 400 500 600Run time [days]
0 100 200 300 400 500 600Run time [days]
EBCT 7 min EBCT 23 min EBCT 40 min

111Chapter 6 Polaromonas as model for analyzing the microbial utilization of NOM in GACF
figure 6.2 the cumulative specifi c doc removal (doccS) (a) and the cumulative specifi c uVa removal (uVacS)
(B) in the top (eBct 0-7 min), middle (eBct 7-23 min) and the bottom section (eBct 23-40 min) of the fi lterbed.
The NOM removal percentages reported for (pseudo) steady-state GACFs vary from 10 to 45% (Table 2, Supplemental Material). Relatively high values in some studies most likely are af-fected by the contribution of adsorption to the removal of NOM at a short running time and/or a relatively high percentage of biodegradable compounds in the influent. Investigations with filter beds of GAC operated in parallel with inert materials clearly demonstrated a higher level of biological activity (e.g. oxygen consumption, number of bacteria) and a better NOM removal in GACFs (van der Kooij 1983; Nijishima et al. 1992; Wang et al. 1995; Carlson and Amy 1998; LeChevallier et al. 1992; Uhl 2000). Obviously, certain GAC properties enhance microbial activity thus affecting NOM removal by biodegradation.
6.3.2 Biomass accumulation The concentration of bacterial biomass on GAC (BGAC) increased immediately after the start (Fig. 6.3). The ATP concentration in the influent ranged from 5-72 ng L-1 and was slightly lower in the effluent (2 – 56 ng L-1; Table 6.1). From these data an average rate of ATP reten-tion in the GACF of 0.0013 ± 0.0011 ng g-1 GAC d-1 was calculated. The bacterial biomass ac-
25
20
15
10
5
0
Tem
pera
ture
[0 C]
ATemperatureEBCT 0-7 min EBCT 7-23 min EBCT 23-40 min
250
200
150
100
50
0
DO
C cs [m
g C
g -1
GAC
]
0 100 200 300 400 500 600Run time [days]
EBCT 0-7 min EBCT 7-23 min EBCT 23-40 minB
Temperature
600
500
400
300
200
100UVA
cs [m
-1 C g
-1 G
AC]
0 100 200 300 400 500 600Run time [days]
25
20
15
10
5
0
Tem
pera
ture
[0 C]

112 Microbial activity in GAC filters in drinking water treatment
cumulation rate (BAR), calculated from the increase of BGAC was 1.6 ± 0.3 ng ATP g-1 GAC d-1 at EBCT7 and 1.1 ± 0.3 ng ATP g-1 GAC d-1 at EBCT23. After reaching a maximal value (530 ng ATP g-1 GAC at EBCT7 and 360 ng ATP g-1 GAC at EBCT23), BGAC started to decline at a water temperature of 15 °C. When temperature declined BGAC increased again, but at a lower rate than in the phase I (1.1 ng ATPg-1 GAC d-1 in the top section and 0.4 ng ATP g-1 GAC d-1 in the middle section) (Fig. 6.3). The BAR/BGAC ratio, which represents the net specific growth rate, declined from 0.016 d-1 (at 100 ng ATP g-1 GAC and BAR =1.6 ± 0.3 ng ATP g-1 GAC d-1) to 0.003 d-1 at the maximal BGAC concentration of 530 ng ATP g-1 GAC. Hence, the growth rate on GAC is very low.
The maximal BGAC concentration in the GACF is within the range of concentrations observed in full-scale GAC filterbeds in the Netherlands (Magic-Knezev and van der Kooij 2004) and is similar to values reported by Velten et al. (2007). Conversion of BGAC to biomass carbon (C = 250 x ATP; Karl 1980) yields concentrations of 11 µg C cm-3 GAC at 100 ng ATP g-1 GAC to 58 µg C cm-3 GAC, at 530 ng ATP g-1 GAC, respectively. The maximal values are similar to the maximal adsorption capacity of GAC for bacteria (40 µg C cm-3, Billen et al. 1992). The values in our study exceeded the biomass concentrations (< 10 µg C cm-3) reported by Servais et al. (1991) for GAC at a full-scale water treatment plant, which may be explained by an under-estimation of the biomass concentration on GAC by the 14CO2 production from radioactively labeled glucose caused by the poor glucose affinity of the bacteria predominating in GACFs (Magic-Knezev and van der Kooij 2006).
EBCT 7 min EBCT 23 min Temperature
30
25
20
15
10
5
0
Tem
pera
ture
[0 C]
0 100 200 300 400 500 600Run time [days]
600
500
400
300
200
100
0
BG
AC [n
g AT
P g
-1 G
AC]
figure 6.3 concentration of atP on Gac (BGac) in the top (eBct 7 min) and middle section (eBct 23 min).
The BAR values converted to the surface area of the diffusion layer surrounding the GAC parti-cles (13 – 19 pg ATP cm-2 d–1) are in the range of the biofilm formation rates (BFR) observed in drinking water in the Netherlands (1-100 pg ATP cm-2 d-1, median 7.4 pg ATP cm-2 d-1) (van der Kooij and Veenendaal 2014). Dosage of 10 µg of acetate-C L-1 to a biofilm monitor gave a BFR of 360 pg ATP cm-2 day-1 (van der Kooij et al. 1995). The low BAR values in the GAC column at influent AOC concentrations > 10 µg of acetate-C eq. L-1 (Table 6.1) therefore indicate that compounds contributing to the AOC in the influent are less readily available than acetate. Fur-thermore, from the average AOC removal rates (3.4 and 10.4 µg C g-1 GAC d-1) and the growth
113Chapter 6 Polaromonas as model for analyzing the microbial utilization of NOM in GACF
yield of Polaromonas on acetate (0.8 ng ATP µg-1 C; Magic-Knezev and van der Kooij 2006), it can be derived that biological AOC removal should result in BAR values on GAC exceeding 40 – 122 pg ATP cm-2 d-1. The lower BAR values observed on GAC (13 – 19 pg ATP cm-2 d–1) may be attributed to : (i) an adsorption-dominated AOC removal and/or (ii) a low yield of bacterial biomass formation due to substrate uptake for maintenance requirements at the low specific growth rate (< 0.016 d-1).
We observed a substantial decrease of the BGAC at temperatures above 15°C (Fig. 6.3), however, the oxygen utilization rate increased with increasing temperature (Fig. 6.4A). A season-related presence and activity of protozoa and invertebrates in biological filters, including GACFs, has been observed in many studies (Husmann 1982; van der Kooij 1983 ; Schreiber et al. 1997; Wang et al. 2014). The BGAC decrease in association with an increase of the oxygen utilization rate can therefore be explained by an increased consumption of bacterial biomass by protozoa and invertebrates at elevated temperatures. The increase of the endogenous decay rate with temperature (Tijhuis et al. 1993) may also lead to a BGAC decrease.
6.3.3 Oxygen uptakeBiological activity in GACFs is associated with oxygen uptake for the conversion of biode-gradable compounds into energy and biomass. After a high initial specific oxygen removal (ORS, Fig. 6.4) at a low BGAC concentration (Fig. 6.3), that may have been caused by adsorption or chemisorption of oxygen onto GAC (Probes et al. 1975; Philips et al. 1998), the ORS declined to < 0.2 mg O2 g-1 GAC. After approx. 100 days ORS started to increase, reached a maximal level of about 1.3 mg O2 g-1 GAC at EBCT7 at 15 °C and decreased after 400 days when temperature declined (Fig. 6.4). The ORS in the middle and bottom sections were similar and lower than in the top section. From the average NOM composition (60% C, 5% H and 32% O; Malcolm and MacCarthy 1986), it can be derived that 2.8 mg O2 mg-1 C is needed for oxidation to CO2 and H2O. The dO2/dDOC ratio at EBCT40 exceeded the level of 2.8 mg mg-1 after an operational period of 100 days and also at EBCT7 and EBCT23 at a water temperature > 10°C (Fig. 6.5A). A maximal level of 12 mg mg-1 coincided with the maximal water temperature (Fig. 6.5A). Both physicochemical and biological processes may have contributed to the excess level of oxygen utilization (dO2/dDOC > 2.8). The physicochemical processes include (i) adsorption and/or chemisorption of oxygen and (ii) oxygen utilization by polymerization of phenolic NOM components (Vidic and Suidan 1991), but quantitative data about oxygen uptake by these pro-cesses are not available. Biological processes leading to excess oxygen utilization are (i) the ac-tivity of predating organisms (protozoa, invertebrates) in the GACF resulting in the turnover of biomass and/or (ii) utilization of previously adsorbed NOM. Predating organisms consume living and dead biomass (detritus), which implies that also particulate organic carbon (POC) accumulating in the filter bed can affect oxygen consumption. Backwashing of GAC filterbeds is applied to limit the release of organisms into the treated water (Schreiber et al. 1997, Wang et al. 2014). The loss of bacterial biomass by backwashing, with a mild regime necessary to prevent GAC loss, most likely is limited because bacteria are strongly attached to the surface of GAC (Camper et al. 1985, Magic-Knezev and van der Kooij 2004). However, data about the total amount of predating organisms and the oxygen consumption by these organism are not available.

114 Microbial activity in GAC filters in drinking water treatment
BEBCT 0-7 min EBCT 7-23 min EBCT 23-40 min Temperature
24
20
16
12
8
4
0
Tem
pera
ture
[0 C]
0 100 200 300 400 500 600Run time [days]
6
5
4
3
2
1
0
dO2C
S /d
DO
C CS [m
g O
2 mg-1
DO
C]
TemperatureEBCT 23-40 minEBCT 7-23 minEBCT 0-7 min
0 100 200 300 400 500 600Run time [days]
25
20
15
10
5
0
Tem
pera
ture
[0 C]
1.4
1.1
0.8
0.5
0.2
-0.1
OR
S [m
g g
-1 G
AC d
-1]
figure 6.4 Specifi c oxygen consumption rate(orS) in the top section (eBct0-7 min), middle section (eBct7-23
min) and bottom section (eBct23-40 min) of the fi lter bed.
0 100 200 300 400 500 600Run time [days]
EBCT 0-7 min EBCT 7-23 min EBCT 23-40 min Temperature
A
15
12
9
6
3
0
dO2 /d
DO
C [m
g O
2 mg-1
DO
C]
25
20
15
10
5
0
Tem
pera
ture
[0 C]
figure 6.5 ratio of the oxygen consumption (do2) and doc removal (ddoc) (a) and the ratio of the cumulative
specifi c oxygen consumption (ocS) and the cumulative specifi c doc removal (doccS) (B) in the top (eBct0-7 min),
middle (eBct7-23 min) and bottom section (eBct23-40 min) of the fi lter bed.
24
20
16
12
8
4
0
Tem
pera
ture
[0 C]
0 100 200 300 400 500 600Run time [days]
66
55
44
33
22
11
00
dO2C
S /d
DO
C CS[m
g O
2 mg-1
DO
C]
figure 6.5figure 6.5 ratio of the oxygen consumption (do ) and doc removal (ddoc) (a) and the ratio of the cumulative ) and doc removal (ddoc) (a) and the ratio of the cumulative
BEBCT 0-7 min EBCT 7-23 min EBCT 23-40 min Temperature
24
20
16
12
8
4
0
Tem
pera
ture
[0 C]
0 100 200 300 400 500 600Run time [days]
6
5
4
3
2
1
0
dO2C
S /d
DO
C CS [m
g O
2 mg-1
DO
C]

115Chapter 6 Polaromonas as model for analyzing the microbial utilization of NOM in GACF
The POC concentration (difference between the concentration of TOC and DOC) in the GAC influent averaged about 0.2 mg L-1 (Supplemental material). After 250 days, a POC removal of 0.2 mg L-1 at EBCT7 would result in an accumulation of c. 9 mg C g-1 GAC at a cumulative DOC removal of c. 150 mg C g-1 GAC (Fig. 6.2A) and an ORS increasing to 1.3 mg O2 g-1 GAC d-1 (Fig. 6.4). The ORS is relatively low as compared to the amount of accumulated DOC (0.009 mg O2 mg-1 C d-1) and POC (0.14 mg O2 mg-1 C d-1). Accumulated POC may constitute a larger amount of biodegradable compounds available to (micro)organisms than the adsorbed DOC, thereby contributing signifinantly to the ORS increase at increasing temperature. Data indicate (Supple-mental material) that GACFs contain similar POC concentration in the effluent. However, the POC in the influent may be represented by adifferent type of carbon than the POC in the ef-fluent. It is wel known that GACFs release GAC fines (Camper et al. 1986). Hence, qualitative POC data for a mass balance calculation are not available.
The ratio of the cumulative specific removal of oxygen and DOC (OCS/DOCCS), in the top and middle section of the filter bed increased in time and reached maximal levels after about 400 days (Fig. 6.5B). The maximal ratio of c. 1.5 mg mg-1 at EBCT0-7 corresponds with c. 50 % oxi-dation of the removed DOC to CO2 and H2O and the level of 2.5 mg mg-1 at EBCT7-23 complete oxidation. These OCS/DOCCS ratios may have been affected by, the accumulation of POC, some variation in the oxidative state of NOM and/or O2 utilization by physicochemical processes, e.g. the oxidation of adsorbed phenolic NOM components (Vidic and Suidan 1991) and/or uptake of oxygen by GAC (Prober et al. 1975; Philips et al. 1998). The OCS/DOCCS ratio was highest in the bottom section of the filter bed and stabilized after the initial period to values between 4.1 and 5.4 mg O2 mg-1 DOC. However, the similarity of the ORS in the EBCT 7-23 and the EBCT23-40 sections (Fig. 6.4) indicate that the accumulated DOC and/or POC did not af-fect the oxygen comsumption in these sections. Therefore, the ORS ranging from approx. 0.2 to 0.5 mg O2 g
-1 CAC d-1 may have been due to physicochemical processes mentioned above. Overall, the OCS/DOCCS ratio cannot be used as a measure for the biodegradation of adsorbed compounds.
6.3.4 Polaromonas as model for bacterial activity in GACFsThe spatial and temporal stability of the bacterial community (Fig. 6. S1) is consistent with other studies showing that only a few bacterial species, mainly members of the Betaproteo-bacteria, e.g. Polaromonas, Hydrogenophaga spp., predominate in GACFs operating under different conditions, and that the presence of these bacteria is characteristic for GACFs in water treatment (Magic Knezev et al. 2009; Niemi et al. 2009; Chapter 4). Polaromonas spp. are specialized in the utilization of carboxylic and aromatic acids with a growth yield (YG) for acetate and benzoate of 0.8 and 1.0 ng ATP µg-1 C, respectively, and a maximal specific growth rate (µmax) at 15ºC of 1.52 d-1 for acetate and 1.78 d-1 for benzoate (Magic-Knezev and van der Kooij 2006). From these values, the maximal specific utilization rate (qmax = μmax/YG) of ac-etate and benzoate at 15ºC can be derived, viz. 1.9 µg C ng-1 ATP d-1 and 2.2 µg C ng-1 ATP d-1, respectively. The apparent growth yield of the bacteria in the GAC filterbed (BAR/DOCRS) of 0.7-34 ng ATP mg-1 C is only 0.1 - 4% of the yield of the Polaromonas strains on acetate (1 ng ATP μg-1 C) and benzoate (0.8 ng ATP μg-1 C) in batch experiments (Magic-Knezev and van der Kooij 2006). This low yield can be explained by (i) the adsorptive removal of most DOC, (ii) substrate utilization for maintenance requirements and/or (iii) protistan grazing. The low ATP

116 Microbial activity in GAC filters in drinking water treatment
concentration per cell in GACFs as compared to RSFs (Magic-Knezev and van der Kooij 2004) is consistent with the notion that maintenance is the activity mode of most bacteria in GACFs. At a low growth rate, the growth yield is reduced by the use of the energy source(s) for main-tenance of the produced biomass. According to Pirt (1982):
q = µ/YG + m (1)
where q is the specific utilization rate of the energy source per unit of biomass and time, YG
is the maximal growth yield, µ is specific growth rate (d- 1), and m is the maintenance energy coefficient, which can be derived from:
m = µE/YG (2)
where µE (d-1) is the endogenous decay rate. The maintenance energy coefficient of Polaro-monas for acetate can be obtained from equation 2 by using YG for growth on acetate and µE calculated from the minimal maintenance Gibbs energy requirement and the Gibbs energy dissipation associated with growth on a specific organic compound (Tijhuis et al. 1993). Fig. 6.6 depicts qmax and m of Polaromonas for acetate in relation to temperature, based on one doubling of µE at 8°C increase and reveals that m is about 30 times lower than qmax. The DOCRS/BGAC ratio, representing the apparent specific substrate utilization rate (qA), exceeds the qmax of Polaromonas for acetate in phase I, which is consistent with the adsorptive removal of NOM. Moreover, in the top section the qA values are lower than calculated because the average BGAC will be higher, e.g. 2 times, than measured at 42 cm (EBCT7). BGAC for the middle section is calculated from the average of at EBCT7 and EBCT23. On the other hand, POC utilization will increase the BGAC, leading to an underestimation of qA. In phase II, qA ranges between the val-
100.00
10.00
1.00
0.10
0.01
q(m
) [ug
C n
g AT
P d-1
]
24
18
12
6
0
Tem
pera
ture
[0 C]
Temperature
qGAC 0-7min
qGAC 7-23min
mP.
qmaxP.
0 100 200 300 400 500 600days
figure 6.6 the apparent specifi c utilization rate q (µg doc ng-1 atP d -1] in the top section (eBct7 min), and
the middle section (eBct 7-23 min/) of Gac and the temperature-adjusted maintenance coeffi cient of Polaromo-
nas for acetate (m P.) and the maximal specifi c utilisation rate of Polaromonas for acetate (qmaxp.) in the opertional
period.

117Chapter 6 Polaromonas as model for analyzing the microbial utilization of NOM in GACF
ues of m and qmax of Polaromonas for acetate. The increased qA at the low BGAC can be explained by an elevated growth rate of Polaromonas and other bacteria induced by protistan grazing at elevated temperatures (Pernthaler 2005). Overall, the Polaromonas model is qualitatively con-sistent with the impact of adsorption, maintenance and growth on DOC removal, but quantita-tive interpretation requires more detailed information about BGAC levels, and biomass turnover processes in the GACF.
6.3.5 Effect of adsorptive properties of GAC on attachment and microbial activity
Attachment of bacteria, as well as the adsorption of organic compounds, onto the charged and hydrophobic GAC (graphite) surface (Bjelopavlic et al. 1999) results in a decrease of the surface free energy by the hydrophobic interactions between GAC and bacteria and organic compounds, respectively. The hydrophobic interactions may select for the attachment of mi-croorganisms with hydrophobic properties. Consequently, it is much more difficult to remove bacteria from GAC than from sand (Magic-Knezev and van der Kooij 2004), making backwash-ing in GAC filterbeds less effective than in sand filters. The strong attachment (Camper et al.1985; Magic-Knezve and van der Kooij 2004; Bilen et al. 1992 ), the small cell size (Magic-Knezev and van der Kooij 2004) and lower accessibility of attached bacteria on the highly porous GAC surface (Wright et al. 1995) hampers protistan grazing of these bacteria. Still, the reduced BGAC concentration in combination with excess oxygen utilization at elevated tem-peratures (Fig. 6.5A) indicates the impact of grazing by protists and invertebrates in the GACF, and implies that a significant proportion of the microbial activity is associated with organic aggregates accumulating on and between the GAC particles. As mentioned above, these or-ganic aggregates can be the result of the accumulation of POC present in the influent, but are also generated in the filterbed by the utilization of biodegradable compounds. As the majority (>90%) of bacterial activity measured as ATP concentration in GACFs occurs on the surface of GAC particles (Magic-Knezev and van der Kooij 2004), the activity associated with organic aggregates accumulating between the GAC particles is probably related with the presence of protists and invertebrates in GACFs. The applied mild backwashing regime in GACFs may re-sult in more accumulation of organic aggregates than in filterbeds of sand or anthracite, thus enhancing biological activity in GACFs.
Humic substances (HS), the major component of NOM, generally are considered as recalci-trant, but Amon and Benner (1996) reported that HS supported more bacterial growth in water than low molecular weight compounds. The proportion of the biodegradable organic carbon (BDOC) to the DOC concentration in aquatic environments (Servais et al. 2005) also indicates that bacteria utilize HS compounds. Camper et al. (2004) concluded that HS utiliza-tion is responsible for the enhanced microbial growth on corroding iron surfaces. Microbial activity on the organic aggregates may contribute to biodegradation of HS, but the question remains whether or not adsorption-enhanced utilization of HS occurs in GACFs. First of all, more than 99.9 % of HS adsorption will occur in pores < 50 nm (Bjelopavlic et al. 1999), which are too small for bacteria. Degradation of HS has been attributed to the activity of ex-tracellular enzymes (Billen 1991, Billen et al. 1992), but enzymes excreted by bacteria prob-ably will be inactivated by adsorption on GAC before reaching the adsorbed compounds. The recently developed supramolecular concept of the HS structure may provide a hypothesis for

118 Microbial activity in GAC filters in drinking water treatment
an adsorption-enhanced utilization of NOM. This concept is based on observations that HS includes a large variety of relatively small molecular organic components (200 - 2500 Da) held together by weak chemical interactions such as hydrophobic associations, charge interac-tions, metal bridging and hydrogen bonds (Conte and Piccolo 1999; Sutton and Sposito 2005). Consequently, the micelle-like HS aggregates are more susceptible to structural changes than the previously assumed polymeric structure. The change in orientation of adsorbed HS as pro-posed by Summers and Robbert (1988) and Schreiber et al. (2005), controlled by hydrophobic interactions, may be associated with a release of low-molecular-weight biodegradable compo-nents from HS. This release depends on temperature and the concentration of adsorbed NOM. Aromatic ring structures with carboxylic and phenolic substituents appear to be major con-stituents of HS (Sonnenberg et al. 1988; Buuan et al. 2007). Certain aromatic compounds (e.g. benzoic, para-hydroxy benzoic, phthalic and vanillic acid) and (hydroxy) carboxylic acids are preferred substrates for Polaromonas spp. (Mattes et al. 2008), including strains isolated from GAC (Magic-Knezev and van der Kooij 2006). A strong attachment of Polaromonas to the GAC surface and the high substrate affinity may enable the utilization of released compounds at low concentrations (Magic-Knezev and van der Kooij 2006, Chapter 4). However, the hypoth-esis that adsorbed HS aggregates contribute to the enhanced biodegradation in GACFs implies that a decrease of the adsorptive DOC removal to a low percentage after passage of more than 20,000 bed volumes (Fig. 6.2; Bonne et al. 2002; Chowdhury et al. 2013) may be associated with a decrease in biodegradation.
6.4 conclusions
1. Removal of dissolved NOM in a GACF occurred at two rates. In phase I (<20,000 BV), with adsorption as the main driving force, NOM is removed approximately 3 to 5 times faster than in phase II with slow adsorption and increased biological activity.
2. Biomass accumulation and oxygen consumption demonstrate that biodegradation plays a role in NOM removal in the GACF. However, oxygen consumption cannot be used as a quantitative measure for the biodegradation of dissolved NOM because of lack of information about POC removal and oxygen uptake by physicochemical processes on GAC surface.
3. The low specific growth rate of bacteria on GAC implies that substrate uptake for maintenance requirements is a significant mechanism in the microbial removal of biodegradable com-pounds.
4. The elevated specific oxygen consumption rate (ORS) in the top section at water temperatures >15 °C can be attributed to the activity of predating (micro)organisms utilizing the accumu-lated living and dead (POC) biomass.
5. The similarity of the ORS values in the middle and bottom sections at a different cumulative specific DOC removal (DOCCS) indicates that oxygen consumption is not related to DOC accu-mulation.
6. A quantitative comparison of the apparent specific DOC utilization rate (qA, mg C ng-1 ATP d-1) in the GAC filterbed, with the temperature-adjusted maintenance coefficient and the specific maximal utilization rate of acetate by Polaromonas requires more accurate data on BGAC and the contribution of POC removal to microbial activity.
7. The nature of the low molecular weight compounds that may be released by the disruption of

119Chapter 6 Polaromonas as model for analyzing the microbial utilization of NOM in GACF
HS micelles is consistent with the preferred substrates of Polaromonas spp. predominating on GAC, but confirmation of the hypothesis requires further research.
6.5 acknowledgemenTs
This investigation was part of a joint research project conducted by Waternet, Vitens, the Tech-nical University Delft, Wageningen University and KWR Watercycle Research Institute, Nieu-wegein. The financial support of the Ministry of Economic Affairs (Senter) for the cooperative research project BAKF, number BST99160, is greatefully acknowledged.
6.6 references
Amon R.M.W., and Benner R. (1996). Bacterial
utilization of different size classes of dissolved organic
matter. Limnol.Oceanogr., 41(1),41-51;
Anonimous (1998). Standard Methods, Standard
Methods for the examination of water & wastewater. 20
Edn., American Public Health Association/ American
Water Works Association/Water Environment Federa-
tion. Washington DC. USA.
Billen G. (1991). Protein degradation in aquatic
environments. In Microbial Enzymes in Aquatic Environ-
ments, ed. R. Chrost, pp. 123-143. Springer-Verlag,
Berlin.
Billen G., Servais P., Bouillot P. and Ventresque C.
(1992). Functioning of biological filters used in drink-
ing-water treatment, the CHABROL model. J. Water
SRT- Aqua, 41, 231-241.
Bjelopavlic M., Newcombe G., Hayes R. (1999).
Adsorption of NOM onto activated carbon, Effect of
surface charge, ionic strength, and pore volume distri-
bution. J. Colloid Interface Sci., 210 (2), 271–280.
Bonné P.A.C., Hofman J.A.M.H., and van der Hoek
J.P. (2002). Long term capacity of biological activated
carbon filtration for organics removal. Wat. Sci. Tech-
nol., Water Supply, 2 (1), 139–146.
Buuan L., Baer A., Alaee M., Lefebvre B., Moser A.,
Williams A., Simpson. A. J. (2007). Major structural
components in freshwater dissolved organic matter.
Environ. Sci. Technol., 41(24),8240-8247.
Camper A.K. (2004). Involvement of humic
substances in regrowth. International Journal of Food
Microbiology, 92, 355– 364.
Camper A.K., LeChevallier M. W., Broadaway S. C.,
and McFeters, G.A. (1985). Evaluation of procedures
to desorb bacteria from granular activated carbon. J.
Microbiol. Methods., (3), 187- 198.
Carlson K.H., and Amy G.L. (1998). BOM removal
during biofiltration J. AWWA., 90(12), 42-52.
Carlson K.H., Garside G. L. A. H., and Blais G.
(1996). Ozone-induced biodegradation and removal of
NOM and ozonation byproducts in biological filters. In
Advances in Slow Sand and Alternative Biological Filtra-
tion. Eds. Graham N. and Collins. R. pp. 61-71. John
Wiley &Sons. Chichester. England.
Chowdhury Z. K., Summers S. R., Westerhoff G.P.,
Leto B. J., Nowack K. O., Corwin C. J. (2013). Activated
Carbon Solutions for Improving Water Quality. AWWA,
Denver Co, USA.
Chudyk W., and Snoeyink V.L. (1984). Bioregen-
eration of activated carbon saturated with phenol.
Environ.Sci.Technol., 18(1),1-5.
Conte P., and Piccolo A. (1999). Conformational
arrangement of dissolved humic substance. Influence
of sollution composition on association of humic mol-
ecules. Environ. Sci. Technol., 33(10),1682-1690.
Dunbar J., Ticknor L. O. Kuske C.R. (2001).
Phylogenetic Specificity and Reproducibility and New
Method for Analysis of Terminal Restriction Fragment
Profiles of 16S rRNA Genes from Bacterial Communi-
ties. Appl. Environ. Microbiol., 67(1), 190–197.
Eberhardt M., Madsen S., and Sontheimer H.
(1975). Untersuchungen zur Verwendung biologisch
arbeitender Aktivkholefilter bei der Trinkwasseraufbe-

120 Microbial activity in GAC filters in drinking water treatment
reitung, gwf-Wasser/Abwasser., 116(6),245-247
Fonseca, A.C., Summers R.S. and Hernandez
M.T. (2001). Comparative measurements of microbial
activity in drinking water biofilters. Wat. Res., 35,
3817–3824.
Goeddertz J.G., Matsumoto M.R. and Weber S.
(1988). Ofline bioregeneration of granular activated
carbon. J. Environ. Eng., 114(5),1063-1075.
Holm-Hansen O., and Booth C. R. (1966). The
measurement of adenosine triphosphate in the ocean
and its ecological significance. Limmology and Oceanog-
raphy., 11, 510-519.
Husmann S. (1982). Aktivkohlefilter als künnstli-
che Biotope stygophiler und stygobionter Grundwas-
sertiere. Archiv für Hydrobiologie, 95 (I/4), 135-155.
Jeon C.O., Park W., Ghiorse W.C., and Madsen
E.L. (2004). Polaromonas naphthalenivorans sp. nov., a
naphthalene-degrading bacterium from naphthalene-
contaminated sediment. Int. J. Syst. Evol. Microbiol.,
(54). 93-97.
Karl D. M. (1980). Cellular nucleotide measure-
ments and implications in microbial ecology. Microbiol.
Rev., (44). 739-796.
Kim D., Miyahara T. Noike, T. (1997). Effect of
C/N ration on the bioregeneration of biological acti-
vated carbon. Wat. Sci. Technol., 36, 239-249.
Kim W.H., Nishijima W., Shoto E., and Okada M.
(1997a). Competitive removal of biodegradable dis-
solved organic carbon in ozonation-biological activated
carbon. Water Sci. Technol., 35(7), 147-152.
Lechevallier M.W., Becker W.C., Schorr P., and Lee
R.G. (1992). Evaluationg the performace of biologically
active rapid filters. J AWWA, 84(4),136-146.
Loy A., Beisker W., and Meier H. (2005). Diversity
of bacteria growing in natural mineral water after bot-
tling. Appl. Environ. Microbiol., (71), 3624-3632.
Magic-Knezev A., and van der Kooij D. (2004). Op-
timisation and significance of ATP analysis for measur-
ing active biomass in granular activated carbon filters
used in water treatment. Wat. Res., (38), 3971-3979.
Magic-Knezev A., and van der Kooij D. (2006).
Nutritional versatility of two Polaromonas-related bac-
teria isolated from biological granular activated carbon
filters. pp. 303-311. In, Recent progress in slow sand and
alternative biofiltration processes. R. Gimbel. N.J.G. Gra-
ham. M. R. Collins eds. IWA Publishing. London.
Magic-Knezev A., Wullings B., and van der Kooij
D. (2009). Polaromonas and Hydrogenophaga species
are the predominant bacteria cultured from granular
activated carbon filters in water treatment. J. of Applied
Microbiology. 107(5), 1457–1467.
Malcolm R. L., MacCarthy P. (1986). Limitations
in the use of commercial humic acids in water and soil
research. Environ. Sci. Technol., 20 (9), 904–911.
Mattes T.E., Alexander A.K., Richardson P.M.,
Munk A.C., Han C.S., Stothard P., Coleman N.V.
(2008).The genome of Polaromonas sp. strain JS666,
insights into the evolution of a hydrocarbon- and xeno-
biotic-degrading bacterium, and features of relevance
to biotechnology. Appl. Environ. Microbiol., 74(20),
6405-6416.
McElhaney J.B. and McKeon W.R. (1978). Enu-
meration and identification of bacteria in granular
activated carbon columns. Pp. 63-68. In Proceedings of
the 6th Water Quality Technology Conference. Louisville.
KY. American Water Works Association. Denver. Co
Moll D. M., Summers R. S., and Breen A. (1998).
Microbial characterization of biological filters used for
drinking water treatment. Appl. Environ.Microbiol.,
(64), 2755–2759.
Niemi R.M., Heiskanen I., Heine R., Rapala J.
(2009). Previously uncultured Betaproteobacteria dom-
inate in biologically active granular activated carbon
(BAC) filters. Wat. Res., 43(20), 5075-5086.
Nijishima W., Tojo M., Okada M., and Murakami
A. (1992). Biodegradation of organic substances by
biological activated carbon – simulation of bacterial ac-
tivity on granular activated carbon. Wat. Sci. Technol.,
26(9-11), 2031-2034.
Orlandini E. (1999). Pesticide removal by combined
ozonation and granular activated carbon filtration The-
sis Wageningen University and International Institute
for Infrastructural. Hydraulic and Environmental Engi-
neering Delft. A.A. Balkema. Rotterdam
Page K.A., Connon S.A., and Giovannoni S.J.
(2004). Representative freshwater bacterioplankton
isolated from Crater lake. Oregon. Appl. Environ. Micro-
biol., (70), 6542-6550.
Peel R.G. and Benedek A. (1983). Biodegradation
and adsorption within activated carbon adsorbers. J

121Chapter 6 Polaromonas as model for analyzing the microbial utilization of NOM in GACF
WPCF, 55(9), 1168-1173.
Peel R.G., and Benedek A. (1980). Dual rate
kinetic model of fixed bed adsorber. Journal of Environ-
mental Engineering Division., 106(4), 797-813.
Pernthaler J. (2005). Predation on prokaryotes in
the water column and its ecological implications. Nat
Rev Microbiol., 3(7),537-546.
Philips J., B. Xia, J. A. Menendez. (1998). Calori-
metric study of oxygen adsorption on activated carbon.
Thermochimica Acta, 312, 87-93.
Pirt S. J. (1982). Maintenance energy, a general
model for energy-limited and energy-sufficient growth.
Arch. Microbiol., 133,300–302.
Prober R., J.J. Pyeha and Kidon W.E. (1975).
Interaction of activated carbon with dissolved oxygen.
Al.Che. Journal., 21(6), 1200-1204.
Schreiber B., Brinkmann T., Schmalz V. and
Worch, E. (2005). Adsorption of dissolved organic
carbon onto activated carbon–the influence of tem-
perature, absorption wavelength, and molecular size.
Wat. Res., 39, 3449-3456.
Schreiber H., Schoenen D., Traunspurger W.
(1997). Invertebrate colonisation of granular actvated
carbon filters. Wat. Res., 31(4),743-748.
Servais P., Billen G., Ventresque C., and Bablon
G.P. (1991). Microbiological activity in GAC filters at
the Choisy-le-Roi treatment plant. J. Am. Water Works
Assoc., 83(2), 62-68.
Servais P., Billen G., and Bouillot P. (1994). Bio-
logical colonization of granular activated carbon filters
in drinking-water treatment. Journal of Environmental
Engineering, 120(4), 888-899.
Servais P., Cauchi B. and Billen G., (1994a). Ex-
perimental study and modelling bacterial activity in
biological activated carbon filters. Water Supply, (14),
223-231.
Servais P., Prevost M., Laurent P., Joret J.C., Sum-
mers S., Hambsch B., Ventresque C. (2005). Biodegrad-
able organic matter in drinking water treatment. In
Biodegrdable organic matter in drinking water treatment
and distribution, Eds. Prevost, M., Laurent, P., Servais,
P., and Joret JC. AWWA, Denver CO, USA. Chapter 3;
p, 61-130.
Shimp R.J., and Pfaender F. (1982). Effects of
surface area and flow rate on marine bacterial growth
in activated carbon columns. Appl. Environ. Microbiol.,
44(2), 471-477.
Sonnenberg L.B., Johnson J.D., and Christman
R.F. (1988). Chemical Degradation of Humic Substanc-
es for Structural Characterization. In Aquatic Humic
Substances; Suffet, I., et al.; Advances in Chemistry;
American Chemical Society, Washington, DC,
Sontheimer H., Heilker E., Jekel M.R., Nolte H.,
and Vollmer F.H. (1978). The Mülheim process. J.
AWWA, 70(7), 393-395.
Sontheimer H., and Hubele C. (1986). The use of
ozone and granular activated carbon in drinking water
treatment. p. 45-66. In Treatment of drinking water for
organic contaminants. Eds. P.M. Huck and P. Toft, Pro-
ceedings of the second national conference of drinking
water, Edmonton Canada. Pergamon press.
Stewart M.H., Wolf R.L., and Means E.G. (1990).
Assesment of bacteriological activity associated with
granular activated carbon treatment of drinking water.
Appl. Environ. Microbiol., (56), 3822-3829.
Summers R.S., Roberts P.V. (1988). Activated
carbon adsorptionof humic substances, II. Size exclu-
sion and electrostaticinteractions. J. Colloid Interface
Sci., 122 (2), 382–397.
Summers R.S, Knappe R.U.D., Snoeyink V. (2010).
Adsorption of organic compounds by activated carbon.
Chapter 14 (14.1-14.91) In Water quality and water
treatment; a handbook on drinking water, ed J.K Edz-
wald, 6 th Edition, American Waterworks Association,
McGraw Hill.
Sutton R., Sposito G. (2005). Molecular structure
in soil humic substances, The new view. Environ. Sci.
Technol., 39, 9009-9015.
Tijhuis L., van Loosdrecht M. C. M., and Heijnen
J. J. (1993). A Thermodynamically Based Correlation
for Maintenance Gibbs Energy Requirements in Aerobic
and Anaerobic Chemotrophic Growth. Biotechnology
and Bioengineering, (42), 509-519.
Uhl W. (2000). Biofiltration processes for organic
matter removal. In, Rehm, H.-J.; Reed, G. (eds), Bio-
technology, Vol. 11c, Environmental Processes III (Vol.eds
Klein, J.;Winter J.) 2nd completely revised ed. Wiley-
VCH, Weinheim, New York.
Van der Aa L.T.J., Kolpa R.J., Rietveld L.C. and
Van Dijk J.C. (2012). Improved removal of pesticides

122 Microbial activity in GAC filters in drinking water treatment
in biological granular activated carbon filters by pre-
oxidation of natural organic matter. J. Water Supply,
Research and Technology – AQUA 61(3), 153-163.
Van der Kooij D. (1983). Biological processes in
Carbon filters. In Activated carbon in drinking water
technology. pp. 119-153. Am. Water Works Assoc.
Denver.
Van der Kooij D. (1992). Assimilable organic car-
bon as an indicator of bacterial regrowth. J. AWWA,
84, 57–65.
Van der Kooij D., Vrouwenvelder H. S., and
Veenendaal H. R. (1995). Kinetic aspects of biofilm
formation on surfaces exposed to drinking water. Wat.
Sci. Technol., (32), 61–65.
Van der Kooij D., and Veenendaal H.R. (2014).
Regrowth problems and biological stabiltiy assesment
in the Netherlands. Pp. 291-338 in Microbial growth in
drinking-water supplies. Van der Kooij, D. and Van der
Wielen, P.W.J. J. (eds.), IWA Publishing, London, UK.
Velten S., Hammes F., Boller M. and Egli T. (2007).
Rapid and direct estimation of active biomass on gran-
ular activated carbon through adenosine tri-phosphate
(ATP) determination. Wat. Res., 41, 1973–1983.
Vidic R. D., Suidan M.T. (1991). Role of dissolved
oxygen on the adsorptive capacity of activated carbon
for synthetic and natural organic matter. Environ. Sci.
Technol., 25 (9), 1612–1618.
Wang Q., You W., Li X., Yang Y., and Liu L. (2014).
Seasonal changes in the invertebrate community of
granular activated carbon filters and control technolo-
gies. Wat. Res., 51, 2016-227.
Wang J.Z., Summers R.S., and Miltner R. J.
(1995). Biofiltration performance, part 1. relationship
to biomass. Filtration, J. AWWA, (87), 55-63.
Weber W.J., Pirbazari M. and Melson G.L. (1978).
Biological Growth on Activated carbon, An investiga-
tion by Scanning Electron Microscopy. Environ. Sci.
Technol., 12(7), 817-819.
Wilcox D.P., Chang E., Dickson K.L., and Johans-
son K.R. (1983). Microbial growth associated with
granular activated carbon in a pilot water treatment
facility. Appl. Environ. Microbiol., (46), 406-416.
Wright D. A. Killham K., Glover L. A., and Prosser
J.I. (1995). Role of Pore Size Location in Determining
Bacterial Activity during Predation by Protozoa in Soil.
Appl. Environ. Microbiol., 61(10), 3537-3543.
Ypsalsky K., Cecen F., Aktas O.and Can Z.S.
(2008). Impact of surface properties of granular ac-
tivated carbon and preozonation on adsorption and
desorption of natural organic matter. Environ. Eng. Sci.,
26(3), 489-500.

123Chapter 6 Polaromonas as model for analyzing the microbial utilization of NOM in GACF
suPPlemenTal maTerial To chaPTer 6
1 Terminal restriction fragment polymorphism (T-RFLP) Method.T-RFLP was performed as described by Dunbar et al. (2001). In brief, the 16S rRNA gene of bacteria harvested from GAC was amplified with Platinum Taq polymerase (Hot-Start Taq polymerase, Invitrogen, Life Technology Corporation, California, USA) using 8F-FAM (5’-AGAGTTTGATC (A/C)TGGCTCAG-3’) and 1392R (5’-ACGGGCGGTGTGTACA-3’) primers by the iCycler IQ real-time detection system (Bio-Rad Laboratories B.V., Veenendaal, the Neth-erlands). The following thermal cycle was applied: 30 cycles 95°C for 45 s. 57° C for 60 s and 72 for 2 min; and a final extension at 72°C for 7 minutes. PCR products were purified (DNA Clean & Concentrator-5 Kit van Zymo Research Corporation, Orange, U.S.A) and digested with restriction enzymes HhaI (Promega Corporation, USA) at 37°C for 4-6 hours. Diges-tion products were purified and after addition of the internal standard (Genescan –500 ABI 401734, Life Technology Corporation, California, USA) and loading buffer (Hi-Di formamide) DNA was denaturized during 3 minutes at 95 °C and transferred directly to ice for minimum of 13 minutes. Electrophoresis was performed in the short capillary/POP polymer in the Run module “GS STR pop 41 ml D 28 min” on an ABI 310 automated DNA Sequencer (AME Biosci-ence A/S., Toroed, Norway) with extended running time to 40 minutes. T-RFLP was generated for filter GAC1 during a period of one year for the layers of 7 min EBCT and 23 min EBCT. The T-RFLP fingerprints were compared using Pearson correlation. A dendrogram was derived by the unweight pair-group method using arithmetic averages (Bionumeric software version 3.0. Applied Maths NV, Sint-Martens-Latem, Belgium).
ResultsThe T-RFLP fingerprints, representing the bacterial community on GAC, grouped in two major clusters (Fig. 6.1) which showed an increase in diversity. Cluster A comprised the communities during the first two months (72 – 2044 BV) of operation and cluster B comprised the com-munities during the next 10 months. The fingerprints from the top and middle section of the filter bed in cluster B were highly similar (> 80 %) and randomly distributed.
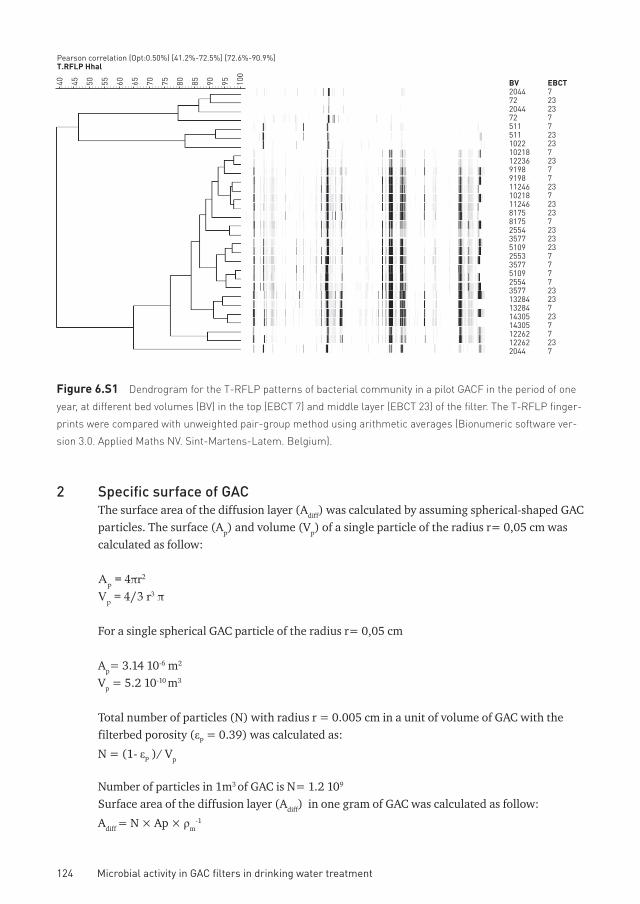
124 Microbial activity in GAC filters in drinking water treatment
figure 6.s1 dendrogram for the t-rFlP patterns of bacterial community in a pilot GacF in the period of one
year, at different bed volumes (BV) in the top (eBct 7) and middle layer (eBct 23) of the filter. the t-rFlP finger-
prints were compared with unweighted pair-group method using arithmetic averages (Bionumeric software ver-
sion 3.0. applied Maths nV. Sint-Martens-latem. Belgium).
2 Specific surface of GACThe surface area of the diffusion layer (Adiff) was calculated by assuming spherical-shaped GAC particles. The surface (Ap) and volume (Vp) of a single particle of the radius r= 0,05 cm was calculated as follow:
Ap = 4πr2
Vp = 4/3 r3 π
For a single spherical GAC particle of the radius r= 0,05 cm
Ap= 3.14 10-6 m2
Vp = 5.2 10-10 m3
Total number of particles (N) with radius r = 0.005 cm in a unit of volume of GAC with the filterbed porosity (εP = 0.39) was calculated as:
N = (1- εP )/ Vp
Number of particles in 1m3 of GAC is N= 1.2 109
Surface area of the diffusion layer (Adiff) in one gram of GAC was calculated as follow:
Adiff = N × Ap × ρm-1
BV204472204472511511102210218122369198919811246102181124681758175255435775109255335775109255435771328413284143051430512262122622044
EBCT7232377232372377237232372323237777232372377237
Pearson correlation (Opt:0.50%) [41.2%-72.5%] [72.6%-90.9%]T.RFLP Hhal
40 45 50 55 60 65 70 75 80 85 90 95 100

125Chapter 6 Polaromonas as model for analyzing the microbial utilization of NOM in GACF
figure 6.s1 dendrogram for the t-rFlP patterns of bacterial community in a pilot GacF in the period of one
year, at different bed volumes (BV) in the top (eBct 7) and middle layer (eBct 23) of the filter. the t-rFlP finger-
prints were compared with unweighted pair-group method using arithmetic averages (Bionumeric software ver-
sion 3.0. applied Maths nV. Sint-Martens-latem. Belgium).
2 Specific surface of GACThe surface area of the diffusion layer (Adiff) was calculated by assuming spherical-shaped GAC particles. The surface (Ap) and volume (Vp) of a single particle of the radius r= 0,05 cm was calculated as follow:
Ap = 4πr2
Vp = 4/3 r3 π
For a single spherical GAC particle of the radius r= 0,05 cm
Ap= 3.14 10-6 m2
Vp = 5.2 10-10 m3
Total number of particles (N) with radius r = 0.005 cm in a unit of volume of GAC with the filterbed porosity (εP = 0.39) was calculated as:
N = (1- εP )/ Vp
Number of particles in 1m3 of GAC is N= 1.2 109
Surface area of the diffusion layer (Adiff) in one gram of GAC was calculated as follow:
Adiff = N × Ap × ρm-1
Where ρm is density of GAC (0.432 g cm-3)
Adiff = 8.5 m2 kg-1 GAC (85 cm2 g-1GAC)
GAC properties, such as effective particle size (1 mm) and bed density (0.432 g cm-3) were obtained from CABOT product information sheet No. 2213 (JUN 2103) for NORIT® GAC 830.
Table 6.s1 the surface area for all pores derived from Bet analysis and the surface area of micro-, meso- and
macropores of Gac 830 derived from mercury intrusion analysis as provided by cabot.
Pore radius
[nm]
Pore volume
[cm3 g-1 gac]
surface area
[m2 g-1 gac] (% of BeT)
all pores 0.5032 924 (100)
>2 (mesopores) 0.42068 83 (9%)
2-50 0.24599 81 (9%)
>50 (macropores) 0.17469 1.7 (0.2%)
>500 0.0784 0.070 (0.008%)

126 Microbial activity in GAC filters in drinking water treatment
* exhausted Gac, ** steady state (running time not reported).
removal organic carbon
filter type run time eBcT
(min)
Tºc reference
20-40%
10-20%
doc Gac
Sand
750 days Sontheimer and hubele 1986
45% toc Gac * ** 4-26 lechevallier et al. 1992
17% dual media
10% refractory doc
Gac 200 days 10 20 Servais et al. 1994a
30-40% Bdoc
21-27% toc Gac 1 year 9.2 13-27 Wang et al. 1995
16-20% toc Sand, anthracite
10% doc anthracite 10 10 carlson and amy 1998
27% toc Gac * ** 20 5-16 uhl 2000
5-15% doc Glass/ Pumice/Sand
10-15% doc Sand ** 13-17 12-22 Fonseca et al. 2001
20-30% doc+o3 Sand
10% doc Gac 4 years 20 4-20 Bonne et al. 2002
10% toc Gac 2 years chowdhury et al. 2013
3 NOM removal in biological filters
Table 6.s2 rlative removal of noM in the steady state phase in biological filters.
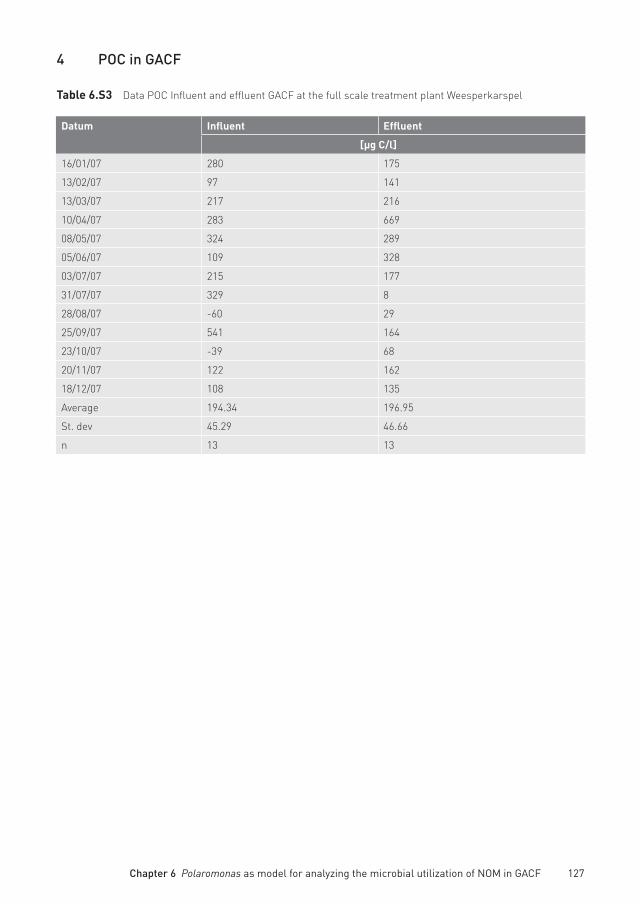
127Chapter 6 Polaromonas as model for analyzing the microbial utilization of NOM in GACF
4 POC in GACF
Table 6.s3 data Poc influent and effluent GacF at the full scale treatment plant Weesperkarspel
datum influent effluent
[µg c/l]
16/01/07 280 175
13/02/07 97 141
13/03/07 217 216
10/04/07 283 669
08/05/07 324 289
05/06/07 109 328
03/07/07 215 177
31/07/07 329 8
28/08/07 -60 29
25/09/07 541 164
23/10/07 -39 68
20/11/07 122 162
18/12/07 108 135
average 194.34 196.95
St. dev 45.29 46.66
n 13 13


7General diScuSSion
CHAPTER

130 Microbial activity in GAC filters in drinking water treatment
7.1 sTudy oBjecTives
The investigations described in the previous chapters were carried out to analyse the micro-biological processes in relation to the GAC characteristics and the removal of natural organic matter (NOM) in Granular Activated Carbon filters (GACFs) in water treatment. The main goal of the study was to obtain a qualitative description of the interactions between microbial activity and the surface characteristics of GAC. For this purpose the concentration of active bacterial biomass in GACFs, the identity and properties of the predominating bacteria and the effects of the adsorptive properties of GAC on biodegradation were studied. These issues were addressed by using ATP as a parameter for the concentration of active bacterial biomass. Classical cultivation-based and molecular methods were used to quantify and characterize the microbial communities in various full-scale filters at six surface-water treatment plants, three groundwater-treatment plants and two pilot plants in the Netherlands. The selected water sup-plies varied in type and concentration of NOM in the raw water, pre-treatment and the opera-tional conditions of the GACFs. Furthermore, the growth kinetics of two Polaromonas strains, the predominating genus in GACFs, was studied in batch experiments. The pilot plant studies, at a groundwater-treatment plant and at a surface-water treatment plant, were carried out to assess the microbial activity in GACFs under controlled conditions. In this discussion, the results described in the previous chapters are further analysed, in combination with data avail-able in the literature, with focus on:
1. The effect of GAC surface characteristics on the microbial activity and biodegradation in GACFs.
2. The mechanisms behind the enhanced performance of GACFs. 3. The significance of insights obtained in this study for drinking water treatment practice.
7.2 characTerisTics of gac filTraTion in waTer TreaTmenT
7.2.1 Comparison of GACFs with rapid sand filters (RSFs)The removal of biodegradable compounds in biological filtration processes is affected by (i) contact time, (ii) nature of biomass carrier (specific surface area), (iii) concentration and nature of biodegradable compounds in the influent, and (iv) temperature. In the Nether-lands, contact times of biological processes applied in water treatment range from several months to several years (dune passage and river bank filtration), several hours (SSF), and less than one hour (RSF, GACF). GACFs and SSFs generally are operated at the end of the treatment train, whereas RSFs are mainly used for the removal of particles, from coagulation /sedimentation processes in pre-treatment of surface-water or from the oxidation of iron and manganese in groundwater treatment. Consequently, RSFs are backwashed more frequently than GACFs (see also Chapter 1). Typical operational characteristic of the different biologi-cal filtration processes applied in water treatment in the Netherlands are presented in Table 7.1. Many studies have shown that GACFs support more biological activity than filter beds of inert media (see Chapter 1 and Chapter 6). Given the similarities in process conditions in GACFs and RSFs, or sand-anthracite (dual-media) filters, a comparison of GAC filtration

131Chapter 7 General discussion
with RS filtration is relevant for analysing the effects of specific GAC characteristics on the biological activity.
The contact time and loading rates in GACFs and RFSs are in the same range, but at some loca-tions GACFs are operated at a higher loading rate and/or a longer contact time than RSFs. The ranges of the bacterial biomass concentrations (ATP) in GACFs and RSFs do not differ from each other (P = 0.158; Chapter 2). The similarity in size of the filter material provides a simi-lar surface of the diffusion layer in both types of filters, 21 – 52 cm2 cm-3 at D values between 1.8 and 0.7 mm, respectively. However, the highly porous structure of the GAC particles pro-vides a larger surface area (e.g. c. 300 cm2 cm-3 in Norit 830; Table 7.2) for attachment of bac-teria (pores D > 1000 nm) and a total intra-particle area available for adsorption of organic contaminants and NOM (c. 400 m2 cm-3)
Table 7.1 operational conditions and performance indicators for investigated full-scale (FS) GacFs, rSFs and
SSFs (chapter 2) and for the pilot plant GacF, respectively (chapter 6). hlr, hydraulic loading rate (m3m-2h-1);
olr, organic loading rate (g m-2h-1); eBct, empty bed contact time; d = diameter of filter material; atP, concen-
tration of bacteria in filter bed (ng cm-3 filter material); ddoc and do2 are the relative removal of doc and oxygen,
respectively, related to the influent concentration; n, number of filters investigated.
filter type hlr olr eBcT d aTP ddoc do2
[m3m-2h-1] [gm-2h-1] [min] [mm] [µg m-3] % %
gacf fs Min 2.7 6.2 10 0.8 24 13* 4*
(n=30) Max 26 55 45 1.7 5067 58* 42*
P50 8 26.5 16 1.0 326 30* 20*
rsf(dmf) fs Min 3.5 7.4 5 0.7 16 0 1
(n=9) Max 11 23 25 3.5 2592 47 33
P50 5 8 12 1.8 319 15 13
gacf PP** Min 1.6 9.6 35 0.8# 110 13 14
(n=1) Max 1.7 532 29 80
P50 1.0 267 20 32
ssf fs Min 0.2 0.5 30 0.3 18 n.a. <1
(n=3) Max 0.5 3 240 1.2 93 n.a <1
P50 0.7 n.a <1
* calculated from values in mixed effluent of full-scale Gac filters; ** calculated from data of one pilot plant Gac
in the pseudo-steady state” (chapter 6); n.a., data not available. # values for the material in one GacF.

132 Microbial activity in GAC filters in drinking water treatment
The comparison of the efficiency of NOM removal by biological activity in GACFs and in filters with inert materials is complicated by the adsorptive removal in GACFs. Furthermore the NOM removal in GACFs and in RSFs is affected by the position of these filters in water treatment. For example, the application of ozonation in pre-treatment increases the concentration of eas-ily biodegradable organic compounds (e.g. van der Kooij and Hijnen 1984), thereby increasing the contribution of biological activity to the DOC removal by GAC filtration (Sontheimer and Hubele 1987).
The adsorptive removal rate in GACFs generally decreases after approximately 10,000 to 20,000 BVs (Chapter 6; Peel and Benedek 1983), and the slow removal rate phase has been defined as “(pseudo) steady state” phase. In this phase the removal is relatively stable (Chap-ter 6, Fig. 1B,D) and it has been suggested that in this phase, NOM is primarily removed by biodegradation (Servais et al. 1994, Wang et al. 1995, Velten et al. 2011). However, Peel and Benedek (1980, 1983) demonstrated that in this phase the slow adsorption is the consequence of the slow diffusion of low-molecular-weight compounds in the micropores.
Although the continiung NOM removal in GACFs in the steady state phase has been attributed to slow adsorption, research consistently provided evidence for an enhanced microbial activ-ity in GACFs (Eberhardt 1975; Sontheimer et al. 1978; van der Kooij 1983; Chudyk and Sno-eyink 1984; Nishijima et al. 1992, Servais et al. 1994, Wang et al. 1995, Jones et al. 1998; Uhl 2000; Klimenko et al. 2004; Aktas and Cecen 2007). Factors enhancing microbial activity and the consequences of microbial activity in GACFs will be analysed in the next paragraph.
Table 7.2 the area for surface diffusion of a Gac or a sand particle with a diameter of 1 mm, the surface area
of all intraparticle pores in Gac 830 derived from Bet analysis and the surface area of micro-, meso- and mac-
ropores of Gac 830 derived from mercury intrusion analysis as provided by cabot. sheet no. 2213 (JUn 2103) for
norIT® gaC 830.
Pore radius
[nm]
Pore volume
[cm3 cm-3 gac]
surface area
[m2 cm-3 gac] (% of BeT)
all pores 0.2174 400 (100)
>2 (mesopores) 0.1817 36 (9)
2-50 0.1063 35 (9)
>50 (macropores) 0.0755 0.7 (0.2)
>500 (accessible for bacteria) 0.0339 0.030 (0.008)
Surface diffusion layer n.a. 0.0037 (0.0009)
n.a. not applicable.

133Chapter 7 General discussion
7.3 facTors enhancing The microBial acTiviTy in gac filTer Beds
7.3.1 Operational conditions and GAC characteristicsIn GAC filters (GACFs) organic compounds are removed by adsorption and biodegradation and many studies have shown that microbial activity in GAC filter bed is enhanced as com-pared to filtration by filter beds of sand or anthracite. However, the question is: does adsorp-tion of organic compounds enhance microbial activity, or is the enhanced microbial activity in GACFs caused by certain conditions in the GACF?. The operational conditions (HLR, OLR) of GACFs resemble those of RSFs, whereas SSFs are operated at a much lower loading rates and a much longer contact time (several hours, e.g. 240 minutes) (Table 7.1). The flow velocity in GACFs and RSF fall in the same range and also is not a rate-limiting factor in biological pro-cesses (Huck et al. 2013). However, frequent backwashing of RSFs is applied to prevent filter bed clogging. Backwashing of GACFs is applied less frequently, as the pressure drop occurs less quickly than in RSFs. Furthermore, GACFs are backwashed less vigorously than RSFs because of the lower specific weight of GAC (0.4 – 0.5 g cm-3) as compared to sand (2.6 g cm-3) and anthracite (1.5 -1.8 g cm-3). Hence, the enhanced microbial activity in GACFs may be related to a less efficient backwashing and/or specific GAC characteristics. Huck and Sozansky (2008) and Uhl (2000) showed that contact time and the specific surface area are the most important factors affecting the NOM removal in biological filters. As contact times in RSFs and GACFs are within the same range (Table 7.1), the focus will be on the nature and size of surface of the filter material. GAC differs from sand, and also from anthracite, by the surface geometry affecting the sur-face area per unit of bed volume available for bacterial attachment and its physicochemical properties. The grain size considerably affects the specific surface area in a biofilter, but the roughness (porosity) of the material also plays an important role in this respect. The exter-nal surface for diffusion of organic compounds, oxygen and inorganic nutrients to the filter bed material can be derived by assuming a spherical shape of the grains and is estimated at c. 35 cm2 cm-3 for particles of 1 mm diameter and lower for particles with a larger diameter, typical for sand and anthracite in RSFs (Table 7.1). The intraparticle porosity of GAC (0.2174 cm3 cm-3 , Table 7.2) is much higher than the negligible intraparticle porosity of quartz-based sand (Brusseau 1993). The high intraparticle porosity of GAC is associated with a large spe-cific surface area (c. 400 m2 cm-3) as derived from nitrogen adsorption, and c. 36 m2 cm-3 for the surface of the pores with a diameter > 4 nm (Table 7.2). The specific surface of the pores with a diameter > 1 µm, which are accessible for bacteria, represents only 0.0302 m2 cm-3 (c. 300 cm2 cm-3), which is <0.1% of the surface in the pores > 4 nm diameter. Therefore, GAC provides a 10 times larger area for attachment of bacteria as compared to sand or anthracite with the same size (c. 35 cm2 cm-3). Furthermore, the pores < 10 µm may provide protection to grazing protozoa (Wright et al. 1995) and invertebrates and to shear forces during back-washing.
The surface chemistry of GAC also differs from the surface chemistry of sand. The graphite-based GAC particles have a hydrophobic surface, whereas the surface of the silicate-based sand particles is negatively charged. In both materials, metal ions and functional groups containing

134 Microbial activity in GAC filters in drinking water treatment
oxygen are present at the surface, increasing its polarity and charge. Although the majority of the GAC surface is hydrophobic, certain parts of the GAC surface are charged due to the pres-ence of surface oxides, metals and functional groups. The charge of the GAC surface, which depends on the ionic strength and pH, will be negative for most GAC applications in drinking water treatment (Prober et al. 1975, Sontheimer et. al., 1988; Snoeyink and Summers 1999; Ypsalsky et al. 2009). Attachment to a hydrophobic surface results in a decrease of the surface-free energy (van Loosdrecht et al. 1989, Bos et al. 1999), and the hydrophobic nature of GAC facilitates the adsorption of hydrophobic components. The surface charge facilitates interac-tions with polar components, enhancing thereby the adsorption of NOM and the bacterial attachment and making the GAC more favourable for bacterial attachment than sand. The ini-tially reversible attachment is transformed to irreversible attachment by the hydrophobic and electrostatic interactions between the bacteria and the GAC surface.
7.3.2 Effect of GAC surface properties on microbial activity and community composition
The total direct cell counts (TDC) of 30 GACFs in 9 full-scale treatment plants ranged from 1 x 10⁹ cells cm-3 to 4 x 10¹⁰ cells cm-3 (Chapter 2, Table 2.2). With a surface area of c. 300 cm2 cm-3 accessible to bacteria, these concentrations range from 3 x 10⁶ to 1.3 x 10⁸ cells cm-2, indicating that the average surface coverage ranged from less than 1.5% to c. 65%, when assuming com-plete coverage at 2 x 10⁸ cells cm-2 (for cells of 0.5 x 1.0 µm). These percentages may be lower because bacteria may be smaller than 0.5 x 1.0 µm and are also present on on particulate or-ganic carbon (POC) in the spaces between the GAC particles (Chapter 2, Camper et al. 1986). The TDCs on sand in rapid sand filters ranged from 2 x 10⁷ to 2 x 10¹⁰ cells cm-3, corresponding with 5.7 x 10⁵ to 5.7 x 10⁸ cells cm-2 at a specific surface area of c. 35 cm2 cm-3. These data sug-gest that the concentration of attached bacteria on GACF and RSF does not clearly differ from each other. However, the interpretation of these data is complicated by the effect of the opera-tional conditions of the involved GACFs and RSFs, e.g. the GACFs are positioned at the end of the treatment train, whereas RSFs are part of pre-treatment. Furthermore, at a high concen-tration, when backwashing is required, the surface coverage of sand exceeds 100% implying that many bacteria are not directly attached to the surface, but associated with other bacteria, making backwashing more effective.
TDC concentrations reported for drinking water exposed surfaces in model distribution sys-tems ranged from about 4 x 10⁶ cells cm-2 to 7 x 10⁶ cells cm-2 (Mathieu et al. 1993) and were 2.6 x 10⁶ cells cm-2 in a system supplied with treated groundwater (AOC 6 µg C L-1) (Boe-Han-sen et al. 2002). In a biofilm monitor supplied with treated groundwater (DOC = 2.4 mg L-1, AOC = 5 µg C L-1) at a flow rate of 0.2 m s-1, a TDC concentration of 107 cells cm-2 was observed (van der Kooij et al. 2003). Hence, the TDC values on sand (RSF) and GAC may attain a level that is one order of magnitude higher than the concentration on surfaces exposed to drinking water with a low growth potential. However, cells may differ in size and activity and therefore, the ATP concentration is a better parameter for comparing biofilm concentrations than TDC values. Table 2.2 in Chapter 2 shows that the ATP concentrations in GACFs and RSF ranged from about 25 ng ATP cm-3 to 5000 ng ATP cm-3 and did not differ significantly. However, the median value of the amount of ATP cell-1 in RSFs (0.36 fg) was more than 10 times higher than in the GACFs (0.021 fg). Obviously, bacterial cells in GACFs are smaller and/or less active

135Chapter 7 General discussion
than those in RSFs. This difference can be attributed to a difference in growth rate, viz. slow growth in GACFs (net specific growth rate < 0.016 d-1, derived from the bacterial biomass ac-cumulation rate (Chapter 6) and rapid growth in RSFs due to weak attachment in combination with the effect of the frequent backwashing of the filter beds. The observations on the rate of growth on GAC also confirm earlier reports on slow microbial growth in GACFs (Bancroft et al. 1983) and are consistent with calculations of the growth rate in biofilms in model distribution systems (Mathieu et al. 1993; Boe Hansen et al. 2002). Furthermore, the suggested relation-ship between growth rate and ATP level cell-1 is consistent with recently published observa-tions demonstrating an ATP level < 0.1 fg ATP cell-1 in bacteria in biofilms at a low growth rate, whereas levels of 0.2 to 0.5 fg ATP cell-1 were observed in bacteria in rapidly growing biofilms (Sack et al. 2014). Hence, microbial growth in GACFs is characterized by the presence of small cells, a limited surface coverage and slow growth, indicating that growth is limited by the supply of biodegradable compounds.
The impact of the GAC surface on bacterial attachment is clearly demonstrated by the inten-sity and duration of ultrasonic treatment required for the removal (detachment) of bacterial biomass from GAC (240 Watt) as compared to sand (80-120 Watt) (Chapter 2). Billen et al. (1992) also showed an increased attachment rate (2 times) and a decrease detachment rate (5 times) with GAC as compared to sand. The high similarity between GAC communities from different locations (Chapter 4) suggests that the surface characteristics of GAC have a strong effect on the bacterial community composition. The temporal stability of the bacterial com-munity composition in a pilot plant pilot GACF (Chapter 4, 6) shows that the first colonizers of the GAC surface remain predominant throughout the operation of a filter in spite of seasonal changes in water quality and changes in apparent DOC concentration accumulated on GAC. Furthermore, the composition of the bacterial community on GAC differs from the composi-tion of bacterial communities in other fresh-water environments, e.g. T-RFLP patterns of GACFs and RFSs from same location showed less similarity than those of GAC communities from different locations (Chapter 4). Furthermore, the genus Polaromonas predominates in GAC filters (Chapter 3, 4) but is not frequently reported as important constituent of aquatic bacterial communities, except in bottled drinking water (Loy et al. 2005) and in a system distributing drinking water treated by ion exchange (IEX) (Liu et al. 2014). Experiments with Polaromonas strains isolated from GAC filters demonstrated that these bacteria are special-ized in the utilization of carboxylic and aromatic compounds, whereas carbohydrates are very poorly utilized (Chapters 4, 5). Furthermore, two Polaromonas strains, isolated from GACFs, exhibited low half-saturation constant (Ks) values for acetate and benzoate, 0.015 µM and 0.04 µM, respectively. These properties are consistent with other studies on this genus (Mattes et al. 2008) and observations of these bacteria in ultra-oligotrophic environments (Niemi et al. 2009, Loy et al. 2005, Liu et al. 2014). The specific nature of the bacterial community in GACFs in water treatment is also demonstrated by the presence of another predominating bacterial group detected with molecular methods and not by culture in the GACFs. These organisms are most closely related to members of the candidate order TRA3-20 (Edwards et al. 1999) of the Betaproteobacteria at the approximate genus-level (≥95% sequence similarity). Currently, no information is available about physiological characteristics of these bacteria, nor about their preferred habitat or niche because of the limited number of observations of this organism in the environment. The presence of representatives of species from the order Rhizobiales indi-

136 Microbial activity in GAC filters in drinking water treatment
cates the availability of amino acids and/or NH3 in the GACFs. Amino acids and ammonium are efficiently removed by biological processes in pre-treatment, but may be present in GACFs as a result of biomass turn-over processes. Protozoa grazing on bacteria release relatively large amounts of these compounds (Sherr and Sherr 2002). The intensity of protozoan grazing depends on the concentration of prey bacteria and water temperature (Schreiber et al. 1997, Wang et al. 2014, Pernthaler 2005).
7.3.3 Effect of adsorptive properties of GAC on the availability of growth substrates
The increasing bacterial activity in the initial phase of GAC filtration (Chapter 6, Fig. 3) indi-cates that sufficient substrate is available for maintenance and growth in virgin GAC filters and is consistent with other reports (Servais et al. 1991, 1994, Wang et al. 1995, Velten et al. 2007). At the beginning of the operational period, organic compounds and bacteria are simultaneously adsorbed to the GAC surface and the adsorptive processes decrease the NOM concentration in the bulk phase by more than 50% (Chapter 6). Hence, in the initial period, substrates available for growth of the attached bacteria mainly are non-adsorbable organic compounds. In this phase, adsorption of NOM on GAC may enhance transportation of biode-gradable compounds to the bacteria in the GAC pores. The stability of the bacterial commu-nity composition, as described in Chapters 4 and 6, suggests that the nature of the substrates used for bacterial growth and maintenance does not change in the operational period or that the first colonizers are able to adapt to changes in the composition of the available substrate. However, the question to be answered is whether or not adsorbed organic compounds are available for bacteria.
One of the most frequently used explanations for the enhanced microbial activity in GACFs is the utilisation of adsorbed compounds (e.g. Eberhardt 1975, Sontheimer et al. 1978, Speitel et al. 1989, Nishijima et al. 1992, Jones et al. 1998, Aktas and Cecen 2007). However, this notion was and is not generally accepted (e.g. van der Kooij 1983, Peel and Benedek 1983; Sontheimer and Hubele 1987; Huck et al. 2014). Two difficulties are related to the hypothesis of an adsorption-enhanced biodegradation: (i) the majority of the adsorbed compounds is located in micropores which are not accessible to bacteria, and (ii) adsorbed compounds can only be utilized after desorption.
The molecular weight of NOM components varies between <500 - > 300,000 g mol-1, with the majority (c. 90%) < 10,000 g mol-1 (Thurman et al. 1982; Newcombe et al. 1997; Kilduff et al. 1996; Perminova et al. 2003). The size of molecules from different molecular-weight fractions ranges between 0.5 - 3 nm (Thurman et al. 1982; Perminova et al. 2003 Newcombe et al. 1997) indicating that the majority of the NOM components is adsorbed in pores with D < 5 nm. The surface of pores accessible to bacteria (D > 500 nm), represents less than 0.08% of the total GAC surface available for the NOM adsorption. Hence, most NOM components (>> 99%) are adsorbed on surfaces not accessible to bacteria.
Bacterial uptake of compounds requires mobility of the substrate, and adsorbed substrates can only become available for bacteria after desorption. Desorption of an adsorbed compound may occur at a reversed concentration gradient or by competitive adsorption. The utilization

137Chapter 7 General discussion
of adsorbed substrates has been demonstrated experimentally for single compounds (e.g. phe-nol) at high bulk phase concentrations (200 ppm) irrelevant for drinking water treatment and conditions creating a reverse concentration gradient (Andrews and Chi Tien 1981, Chudyk and Snoeyink 1984, Goeddertz et al. 1988, Speitel et al. 1989, Hutchinson and Robinson 1990). For humic substances (HS), which are the major fractions of organic carbon in the GACFs in-fluents, a reverse gradient is unlikely to occur at the relatively constant NOM concentration in the feed water. However, competitive adsorption may play a role, and compounds with a high absorbability can potentially replace adsorbed compounds with a lower absorbability. Obser-vations that smaller NOM components are better absorbed by GAC (Summers and Roberts 1986) have been confirmed by Kilduff et al. (1996) who demonstrated competition between NOM components and an adsorptive fractionation based on molecular size. Summers and Robberts (1988) hypothesized that adsorbed HS undergo a conformational change when a certain solid phase concentration on GAC has been reached, and that in this process utilizable components might become available to the attached microorganisms. An increase in bioavail-ability of humic compounds has also been observed after the adsorption to iron oxides in the soil and aquatic environments (Camper 2004). Stumm and Morgan (1981) suggested that the adsorption on iron oxide surfaces forces the humic molecules to collapse, allowing for maxi-mal points of interaction between their oxygen-containing functional groups and iron-oxide surface sites through ligand exchange or H-binding mechanisms. The collapse of the molecule may cause it to uncoil and expand, exposing the previously hidden usable functional groups (Gu et al. 1994), making them available for microbial attack (Camper, 2004). However, such utilization would require adsorption onto a surface accessible to bacteria, which is not the case with GAC. Furthermore, the recently developed supramolecular concept of the HS structure implies that HS are not high-molecular-weight polymeric compounds, thus making the utili-zation of uncoiled molecular structures unlikely. The supramolecular concept, however, may provide a hypothesis for an adsorption-enhanced utilization of NOM. This concept is based on observations that HS include a large variety of relatively small molecular organic components (200 - 2500 Da) held together by weak chemical interactions such as hydrophobic associa-tions, charge interactions, metal bridging and hydrogen bonds (Conte and Piccolo 1999; Sut-ton and Sposito 2005). Consequently, the micelle-like HS aggregates are more susceptible to structural changes than the previously assumed polymeric structure, and adsorption to the hydrophobic or charged GAC surface may lead to micelle disruption and release of low mo-lecular weight compounds, as has been observed by the addition of specific chemicals to HS solutions (Sutton and Sposito 2005).
Overall, two mechanisms with the potential to increase the bioavailability of NOM compo-nents absorbed in GACFs exist: (i) adsorptive fractionation based on molecular size (competi-tion) and (ii) adsorption induced release of biodegradable components during the process of reorientation of supramolecular structures (micelles) of HS on the GAC surface. These mecha-nisms should occur in pores < 500 nm, because the surface of the pores accessible to bacteria is too small (<0.1 %) to play a significant role.
In the pilot plant GACF, after c. 100 days, the removal rate decreased, and at that point on average c. 120 mg of DOC was removed per g GAC in the top layer (Chapter 6. Fig. 6.2A). Assuming that all the removed NOM is adsorbed and evenly distributed on the GAC surface

138 Microbial activity in GAC filters in drinking water treatment
available for NOM adsorption in the pores > 1.0 nm (83 m2 g-1), the average concentration would correspond to 0.14 µg C cm-2. A BGAC concentration of 300 ng ATP g-1 GAC (Chapter 6, Fig. 6.3) and a maintenance coefficient of 0.065 µg C ng-1 ATP d-1 (at 15 ºC) would cor-respond to an uptake of 20 µg C g-1 d-1. At an accessible surface area of 300 cm2 g-1, an appar-ent amount of 42 µg C (300 x 0.14 µg C) is present. This estimation confirms that the com-pounds adsorbed onto the GAC surface accessible to bacteria cannot fulfil the maintenance energy requirements of the microbial community. Hence, desorption of substrates from the surface not accessible to bacteria (83 m2 g-1) is needed, but data about the rate of desorption, related to the reassembling of adsorbed HS are not available. However, in the pilot plant GACF the specific oxygen consumption in the middle and bottom segments did not differ from each other (Chapter 6, Fig. 6.4) despite the difference in the specific DOC removal. Therefore it can be concluded that the contribution of desorbing compounds to the microbial activity is very limited.
From the considerations and calculations described above, it can be concluded that the en-hanced microbiological activity in GACFs is related to the strong attachment of bacteria onto a relatively large surface in pores providing shelter against predation and shear forces, and that adsorbed NOM plays a negligible role in the biological processes in GACF.
7.4 PracTical significance and fuTure PersPecTives
The microbial activity in GACFs in water treatment is usually regarded as beneficial due to the additional removal of NOM from the influent by biodegradation processes that result in an extension of the periods between the regenerations. However, the strong attachment of bacte-ria onto GAC and the poor backwashing efficiency cause an accumulation of living and dead biomass in GACFs. The disproportion between oxygen utilisation and DOC removal indicates a biomass turnover associated with protozoan and invertebrate activity. The release of these organisms and biomass aggregates (detritus) in the form of particulate organic carbon (POC) will affect the effluent water quality and may impair the biological stability. The most impor-tant factors that affect the accumulation and turnover of biomass in GAC filters are GAC prop-erties (porosity, hydrophobicity and functional groups), influent quality (NOM), and back-washing regime. The control of microbial activity in GACF and the emission of the POC from the GACFs therefore can be improved by (i) decreasing the concentration of growth-promoting compounds by adapting pre-treatment, (ii) improving the backwashing of GACFs, (iii) ap-propriate post-treatment and (iv) selection of GAC with more appropriate surface properties. GAC with more macropores on the outer surface can provide more hiding places for bacteria and hamper protozoan activity reducing thereby biomass turnover and the emission of POC. Another option is to reduce the microbial activity in GACFs by using GAC without pores acces-sible to bacteria. Also removal of most easily biodegradable compounds from the influent by pre-treatment with RSF (or DMF) can reduce the biological activity in GACFs. From the water quality parameters, the nature and concentration of NOM are the most important aspects af-fecting the biological processes in GACFs. Alternative pre-treatment for the removal of NOM, e.g. by ion exchange preceding GAC filtration might improve the efficiency of GAC filtration in the removal of micro-pollutants. To limit accumulation and release of biomass (aggregates) in

139Chapter 7 General discussion
the effluent an adequate pretreatment (rapid-sand filtration or dual-media filtration) or post-treatment (slow sand filtration or ultrafiltration) may further improve the benefits of biologi-cal processes in GAC filters.
A number of issues require further research:
• ThepresenceofPOCintheinfluentanditseffectonthebiologicalprocesseshasattainedin-sufficient attention in the studies on GAC filtration in water treatment;
• Similarly,thepresenceofPOCintheGACfiltrateanditseffectonfoulingandmicrobialre-growth in distribution systems require more investigations;
• There-evaluationofthethresholdlevelsforNOMinrelationtoregrowthandbiologicalstabil-ity in distribution networks could help to optimize GAC filtration and limit the release of POC and dissolved organic carbon produced by the biomass.
• Theappropriatepre-treatment,post-treatmentandbackwashingproceduretominimizetherelease of POC from GACFs.
The investigations described in this thesis provided a simple method for assessing the bacterial activity (as ATP) in GACFs. Application of this method in GACFs and other biological filtration processes can provide quantitative information about the level of biological activity and sup-port measures aiming at reducing or promoting such activity. Furthermore, the use of ATP as parameter for bacterial biomass facilitates comparison between biological processes in a wide range of aquatic habitats, including drinking water distribution systems.
Information on nutritional properties and growth parameters of Polaromonas (Chapter 3, 4, 5) are useful for modelling the removal of biodegradable organic compounds. However, the nature and concentration of compounds promoting bacterial growth in GACFs are still un-resolved. Information about the identity of the predominating bacteria and their metabolic properties can be used to elucidate the nature of such compounds. This approach requires the isolation and further study of the predominant species in GACFs, including bacteria classified as TRA3-20 (Chapter 4).
7.5 references
Aktas O., and Cecen F. (2007). Bioregeneration of
activated carbon: A review. International Biodeteriora-
tion & Biodegradation., 59, 257–272.
Andrews G.F., and Tien C. (1981). Bacterial film
growth on adsorbent surfaces. AlChE Journal, 27, 396-
405.
Bancroft K., Maloney S. W., McElhaney J., Suffet
I. H., and Pipes W. O. (1983). Assessment of bacterial
growth and total organic carbon removal on granular
activated carbon contactors. Appl. Environ. Microbiol.,
46,683-688.
Beckett R. (1990). The surface chemistry of humic
substances in aquatic systems. In: Beckett, R. (Ed.),
Surface and Colloid Chemistry in Natural Waters and
Water Treatment. Plenum, New York, NY, pp. 3 – 16.
Billen G., Servais P., Bouillot P. and Ventresque C.
(1992). Functioning of biological filters used in drink-
ing water treatment – the CHABROL model. J. Water
SRT-Aqua, 41, 231-241.
Bos R., van der Mei H.C., and Busscher H.J.
(1999). Physico-chemistry of initial microbial adhesive
interactions – its mechanisms and methods for study.

140 Microbial activity in GAC filters in drinking water treatment
FEMS Microbiol. Reviews 23,179-230.
Boe-Hansen R. Albrechtsen H.J., Arvin E. and Jor-
gensen C. (2002). Bulk water phase and biofilm growth
in drinking water at low nutrient conditions. Wat. Res.,
36, 4477-4486.
Brusseau M.L., (1993). The influence of solute
size, pore water velocity and intraparticle porosity n
solute dispersion and transport in soil. Wat.Resources
Res., 29(4),1071-1080.
Camper A. (2004). Involvement of humic sub-
stances in regrowth. International Journal of Food Mi-
crobiology., 92,355– 364.
Camper A. K., LeChevallier M. W., Broadaway S.
C., and McFeters G. A. (1985). Growth and persistence
of pathogens on granular activated carbon filters. Appl.
Environ. Microbiol., 50,1378-1382.
Carlson K.H. and Amy G.L. (1998). BOM removal
during biofiltration J. AWWA 90(12), 42-52.
Chudyk W. and Snoeyink V.L. (1984). Bioregen-
eration of activated carbon saturated with phenol.
Environ. Sci. Technol., 18(1), 1-5.
Conte P., and Piccolo A. (1999). Conformational
arrangement of dissolved humic substances. Influence
of solution composition on association of humic mol-
ecules. Environ.Sci.Technol. 33(10), 1682-1690.
Eberhardt M., Madsen S., and Sontheimer H.
(1975). Untersuchungen zur Verwendung biologisch
arbeitender Aktivkholefilter bei der Trinkwasseraufbe-
reitung, gwf-Wasser/Abwasser116(6), 245-247.
Edwards K.J., Goebel B.M., Rodgers T.M., Schrenk
M.O., Gihring T.M., Cardona M.M., HuB., McGuire
M.M., Hamers R.J., Pace N.R. and Banfield J.F. (1999).
Geomicrobiology of pyrite (FeS2) dissolution: a case
study at Iron Mountain, California. Geomicrobiology J.
16, 155-179.
Goeddertz J.G., Matsumoto M.R., and Weber S.
(1988). Ofline bioregeneration of granular activated
carbon. J. Environ. Eng.,114(5),1063-1075.
Huck, P. M., Fedorak, P. M. & Anderson, W. B.
(1991). Formation and removal of assimilable organic
carbon during biological treatment. J. AWWA, 83(12),
69–80.
Huck P. M., Zhang S., and Price M.L. (1994). BOM
removal during biological treatment: a first-order
model. J. AWWA, 86(6), 61-71
Huck P. M., and M. M. Sozanski. (2008). Biologi-
cal filtration for membrane pre-treatment and other
applications: towards the development of a practically-
oriented performance parameter Journal of Water
Supply: Research and Technology—AQUA, 57.4.
Huck P.M., Siembidaosch, and M.M. Sozansky.
(2014). Biological filtration for divers applications: to-
wards the development of a unified conceptual design
approach pp 363-399. In Microbial growth in drinking-
water supplies. Van der Kooij, D. and van der Wielen,
P.W.J. J. (eds.), IWA Publishing, London, UK.
Hutchinson, D.W., and Robinson C.W. (1990).
“A Microbial Regeneration Process for Granular Ac-
tivated Carbon –II. Regeneration Studies.” Wat. Res.,
24(10),1217-1223.
Jones L.R., Oven S.A., Horrell P., and Burns R.G.
(1998). Bacterial inocultation of granular activated
carbon filters for the removal of atrazine from surface
water. Wat. Res., 32(8), 2542-2549.
Kilduff J.E., Karanfil T., Chin Y.P, and Weber W.J.
(1996). Adsorption of natural organic polyelectrolytes
by activated carbon: a size exclusion chromatography
study. Environ. Sci. Technol., 30,1336-1343.
Kim D., Miyahara T., and Noike T. (1997). Effect of
C/N ration on the bioregeneration of biological acti-
vated carbon. Wat. Sci. Technol., 36, 239-249.
Klimenko N., Smolin S., Rgechanyk S., Kofanov V.,
Nevynna L., Samoylenko L. (2004). Bioregeneration of
activated carbons by bacterial degraders after adsortpi-
on of surfactants from aqueous sollutions. Colloids and
surfaces A: Physicochem. Eng. Aspects. 230, 141-158.
Liu, G.,Bakker G.L., Li S., Vreeburg J.H., Verberk
J.Q., Medema G.J., Liu W.T., Van Dijk J.C. (2014).
Pyrosequencing reveals bacterial communities in
unchlorinated drinking water distribution system: an
integral study of bulk water, suspended solids, loose
deposits, and pipe wall biofilm. Environ. Sci. Technol.,
48(10), 5467-5476.
Loy, A., Beisker, W., and Meier, H. (2005). Diver-
sity of bacteria growing in natural mineral water after
bottling. Appl. Environ. Microbiol., (71), 3624-3632.
Mathieu L., Block J.C., Dutean M., Maillard J. and
Reasoner D. (1993). Control of biofilm accumulation
in drinking water distribution systems. Water Supply
11(3/4), 365-376.

141Chapter 7 General discussion
Mattes T.E., Alexander A.K., Richardson P.M.,
Munk A.C., Han C.S., Stothard P., Coleman N.V.
(2008).The genome of Polaromonas sp. strain JS666:
insights into the evolution of a hydrocarbon- and
xenobiotic-degrading bacterium, and features of
relevance to biotechnology. Appl. Environ. Microbiol.,
74(20),6405-6416.
Nagayev V.V. and Sirotkin A.S. (1998). Biological
methods of water treatment: biological regeneration of
activated carbon. J. WC&T. 20(9),44-51.
Newcombe G., Drikas M., Assemi S., and Beckett
R. (1997). Influence of characterizes natural organic
material on activated carbon adsorption: I. Characteri-
sation of concentrated reservoir water. Wat.Res., 31,
965-972.
Niemi R.M., Heiskanen I., Heine R., and Rapala J.
(2009). Previously uncultured b-Proteobacteria domi-
nate in biologically active granular activated carbon
(BAC) filters. Water Res., 43(20), 5075-5086.
Nijishima W., Tojo M., Okada M., and A. Mu-
rakami. (1992). Biodegradation of organic substances
by biological activated carbon – simulation of bacterial
activity on granular activated carbon. Wat. Sci. Tech-
nol., 26(9-11), 2031-2034.
Peel R.G., and A. Benedek. (1983). Biodegradation
and adsorption within activated carbon adsorbers. J
WPCF 55(9),1168-1173.
Perminova I.V., Frimmel F. H., V. Kudryavtsev A.,
Kulikova N. A., Abbt-Braun G., Hesse S., and Petrosyan
V.S. (2003). Molecular weight characteristics of humic
substances from different environments as determined
by size exclusion chromatography and their statistical
evaluation. Environ. Sci. Technol., 37 (11), 2477–2485.
Pernthaler J. (2005). Predation on prokaryotes in
the water column and its ecological implications. Nat
Rev. Microbiol., 3(7), 537-546.
Prober, R., Pyeha J.J., and Kidon W.E. (1975).
Interaction of activated carbon with oxygen. AlChe
Journal 21(6), 1200-1204.
Sack, E. L. W., van der Wielen P. W. J. J., and van
der Kooij D. (2014). Polysaccharides and proteins
added to flowing drinking water at microgram-per-liter
levels promote the formation of biofilms predominated
by Bacteroidetes and Proteobacteria. Appl. Environ.
Microbiol., 80, 2360-2371.
Schreiber H., Schoenen D., and Traunspurger W.
(1997). Invertebrate colonisation of granular activated
carbon filters. Wat. Res., 31(4),743-748.
Servais P., B. Cauchi and G.Billen. (1994). Experi-
mental study and modeling bacterial activity in biologi-
cal activated carbon filters. Water Supply, 14, 223-231.
Servais, P., Billen G., Ventresque C. and Bablon
G.P. (1991). Microbiological activity in GAC filters at
the Choisy-le-Roi treatment plant. J. AWWA, 83 (2),62-
68.
Sherr, E.B. and Sherr B.F. (2002). Significant of
predation by protists in aquatic microbial food webs.
Antonie Van Leewenhoek International Journal of Gen-
eral and Molecular Microbiology, 81, 293-308.
Snoeyink V.L., Summers R.S. (1999). In Water
Quality and Treatment; (Chapter 13). (5th ed) McGraw-
Hill, New York, NY.
Sontheimer H., Heilker E., Jekel M.R., Nolte H.and
Vollmer F.H. (1978). The Mülheim process. J. AWWA
70(7), 393.
Sontheimer H., Crittenden J.C., and Summers
R.S. (1988). Activated Carbon for Water treatment.;
AWWA-DVGW Forschungstelle Engler Bunte Instituut,
Karlsruhe.
Speitel G.E., Turakhia M. H. and Lu C. (1989).
Initiation of micropollutant biodegradation in virgin
GAC columns. J. AWWA 81 (4), 168-176.
Steinberg C. E. W. (2003). Ecology of Humic Sub-
stances in Fresh Waters. Springer, Heidelberg
Stumm, W., and Morgan J.J. (1981). Aquatic chem-
istry: Chemical equilibria and rates in natural water.
New York: John Wiley and Sons.
Sutton, R., and Sposito, G. (2005). Molecular
structure in soil humic substances: The new view. Envi-
ron. Sci. Technol., 39, 9009-9015.
Thurman, E.M., R.L. Wershaw, R.L. Malcolm and
D.J. Pinckney. (1982). Molecular size of aquatic humic
substances. Gorg. Geochem., 4,27-35.
Uhl, W. (2001). Modeling biological DOM-removal
in drinking water treatment filters – a new approach.
Proceedings AWWA Water Quality Technology Confer-
ence, Nashville, USA. CDROM, Wed7, paper 4. Ameri-
can Water Works Association, Denver, CO.
Uhl, W. (2000). Biofiltration processes for or-
ganic matter removal. In: Rehm, H.-J.; Reed, G. (eds),

142 Microbial activity in GAC filters in drinking water treatment
Biotechnology, 2nd completely revised ed. Vol. 11c, Envi-
ronmental Processes III (Vol.eds Klein, J.;Winter J.) pp
457-478Wiley-VCH, Weinheim, New York.
Van der Aa, L.T.J., Kolpa R.J., Rietveld L.C.,and
Van Dijk J.C. (2012). Improved removal of pesticides in
biological granular activated carbon filters by pre-oxi-
dation of natural organic matter. Journal of Water Sup-
ply: Research and Technology – AQUA, 61(3), 153-163.
Van der Aa, L.T.J., Rietveld L.C., Van Dijk J.C.
(2011). Effects of ozonation and temperature on the
biodegradation of NOM in biological granular activated
carbon filters. Drinking water engineering and science,
4(24-25), 25-35.
Van der Kooij D. (1983). Biological processes in
carbon filters. In: Activated carbon in drinking water
technology. Cooperative report KIWA-AWWA research
foundation.
Van der Kooij D. (2003). Managing regrowth in
drinking water distribution systems. In Heterotrophic
plate counts and drinking water safety, eds. J.Bartman,
J.Cotruvo, M.Exner, C.Frickner, A.Glasmacher. IWA
publishing, London, UK.
Van der Kooij, D., and Veenendaal, H.R. (2014).
Regrowth problems and biological stabiltiy assesment
in the Netherlands. Chapter 11. In Microbial growth in
drinking-water supplies. van der Kooij, D. and van der
Wielen, P.W.J. J. (eds.), IWA Publishing, London, UK.
Van Loosdrecht M., Nyklema J., Norde W., and
Zehnder A.B. (1990). Influence of interfaces on micro-
bial activity 1990. Microbiol. Reviews., 54(1), 75-87.
Velten S., Hammes F., Boller M., and Egli T.
(2007). Rapid and direct estimation of active biomass
on granular activated carbon trought adenosine tree-
phosphate (ATP) determination. Wat. Res. 41(9),
1973-1983.
Velten S., Boller M., Köster O., Helbing J., Wei-
lenmann H.U., Hammes F. (2011). Characterization of
natural organic matter adsorption in granular activated
carbon adsorbers. Wat. Res., 45(13), 3951-3959.
Wang J.Z., Summers R.S. and Miltner R. J. (1995)
Biofiltration performance: part 1, relationship to bio-
mass. Filtration: J. AWWA, 87, 55-63.
Wang Q.,You W., Li X., Yang Y., and Liu L., (2014).
Seasonal changes in the invertebrate community of
granular activated carbon filters and control technolo-
gies. Wat. Res., 51, 2016-2227.
Wright D. A. Killham K., Glover L. A., and Prosser
J.I. (1995). Role of pore size location in determining
bacterial activity during predation by protozoa in soil.
Appl. Environ. Microbiol., 61(10), 3537-3543.
Yapsaklı, K., Çeçen F., Aktas Ö., and Can Z.S.
(2009). Impact of surface properties of granular ac-
tivated carbon and preozonation on adsorption and
desorption of natural organic matter. Environ. Eng. Sci.,
26 (3), 489-500.

8SuMMarY
SaMenVattinG
acKnoWledGeMentS
aBout the author
liSt oF PuBlicationtS
diPloMa For SPecialiSed Phd traininG
SUPPLEMENTS

144 Microbial activity in GAC filters in drinking water treatment
This thesis focuses on the contribution of the bacterial community in granular activated carbon filters (GACFs) in water treatment to the removal of natural organic matter (NOM). Observations in full-scale treatment plants, laboratory experiments and pilot-plant studies were conducted with the aim of describing the interactions between the adsorption processes and microbial activity in GACFs. For this purpose (i) a method for measuring the abundance of active bacteria on GAC was developed and evaluated; (ii) the bacteria predominating in the bacterial community in GACFs were isolated and identified, with cultivation-dependent and molecular approaches (iii) the physiological properties of a predominant species were eluci-dated and (iv) the microbial activity and adsorption of NOM in a pilot plant GACF were quanti-fied and their relationships were analysed.
A method for measuring the concentration of active bacterial biomass in GACFs was developed as described in Chapter 2, using high-energy sonication at a power input of 40 W for the remov-al of attached microorganisms and subsequent quantification of adenosine triphosphate (ATP). A series of six to eight sonication treatments of two minutes each was needed to yield more than 90% of the attached active bacteria, thereby demonstrating strong attachment of the bacteria to the GAC surface. The ATP concentrations in 30 full-scale GACFs and nine rapid sand filters (RSFs) at nine treatment plants in the Netherlands ranged from 25 to 5000 ng ATP cm-3 GAC, with the highest concentrations at long filter run times and receiving water treated with ozone. Although RSFs and GACFs exhibited similar activity, the median value of the ATP content per bacterial cell in the RSFs (3.6x10⁻⁷ ng ATP/cell) was approximately 17 times higher compared to bacteria in GACFs (2.1x10⁻⁸ ng ATP/cell); indicating that most bacteria in the GACFs were in the stationary growth phase, whereas bacteria in the RSFs were in the exponential growth phase.
As described in Chapter 3, genomic fingerprinting and 16S rRNA gene sequence analysis of the predominant cultivable bacteria from 21 GACFs in nine water treatment plants in the Netherlands revealed that most of the isolates from GAC belonged to the Betaproteobacteria (68%) or Alphaproteobacteria (25%). Polaromonas was almost always present in the GACFs (86%), whereas members of the genera Hydrogenophaga, Sphingomonas and Afipia were iso-lated from 43%, 33% and 29% of the filter beds, respectively. The predominant genus Polar-omonas, which has mainly been observed in oligotrophic freshwater environments, included a total of 23 different genotypes, as revealed by AFLP analysis.
Cultivation independent assessment, based on the sequence and T-RFLP (terminal restriction length polymorfism) fingerprint analysis of bacterial 16S rRNA genes, identified a total of 135 operational taxonomic units (OTUs) in both full-scale and pilot-plant GACFs at five drinking water treatment plants (Chapter 4). In concordance with the cultivation-based study, the most abundant OTUs from the GACFs belonged to the Betaproteobacteria (43% of all sequenc-es) and Alphaproteobacteria (38%), with representatives from the genera Polaromonas (11%), Afipia, Sphingomonas, Variovorax and unclassified Commamonadaceae. Furthermore, the cultivation-independent approach additionally revealed the presence of the TRA3-20 group of yet uncultured Betaproteobacteria (14.5%), Acidobacteria (7%), and the alphaproteobacterial families Bradyrhizobiaceae (9%) and Hyphomicrobiaceae (7%) from the order Rhizobiales.
summary

145Summary
The assessment of bacterial diversity by T-RFLP analysis revealed a relatively high similar-ity (>60%) between the communities in the GACFs at different locations. High temporal as well as spatial stability was observed in the community in a pilot-plant filter over a period of 18 months. The predominant species were evenly distributed (Shannon evenness index 0.82±0.06 of the T-RFLP fragments). An increase in richness during the maturation of the community in the pilot-plant filter was accompanied by an increase in relative abundance of predominant fragments, confirming the importance of these bacteria in the microbial activity.
The classification of the predominant bacteria and the metabolic properties of their cultured relatives, indicated that most bacteria on GAC are chemo-organotrophic aerobes that grow slowly at low concentrations of carboxylic and aromatic acids or chemolithrophic nitrifiers and can utilize either ammonia or nitrite as a source of energy. The nutritional versatility and growth kinetics of two Polaromonas strains isolated from two GACFs, representing the pre-dominating bacteria in the investigated GACFs, were studied in batch culture with mixed and individual substrates at concentrations typical for drinking water (Chapter 5). The favoured substrates for growth are carboxylic acids and aromatic acids, while only a few amino acids and carbohydrates were utilized a sole source of energy and carbon. Enhanced growth on the mixture of amino acids, when compared to growth on individual amino acids, indicated that most amino acids may be utilized as source of carbon. The maximum growth rate (0.09-0.11 h-1) was attained at low substrate concentrations, and low half-saturation constants were observed for the growth on acetate (0.015µM) and benzoate (0.039 µM), respectively. Hence, in GACFs low-molecular-weight organic compounds can be utilized at the microgram-per-litre level.
To elucidate the relationship between adsorption and biodegradation of NOM, bacterial growth and the removal of dissolved organic carbon (DOC) were analyzed in a pilot plant GACF that was operated at the surface-water treatment pilot plant of Weesperkarspel (Wa-ternet, The Netherlands) for 602 days as described in Chapter 6. NOM removal was approxi-mately four times faster in the initial phase I (days 0-100) than in the second phase II (days 100-602). The bacterial accumulation rate (BAR) on GAC was higher after 7 minutes of empty bed contact time (1.6 ng ATP g-1 GAC day-1) than after 23 minutes (1.1 ng ATP g-1 GAC day-1) reaching a maximal concentration of 315 – 530 ng ATP g-1 GAC after approximately 250 days. From these data, it was derived that the net specific growth rate of the bacteria on GAC was very low (< 0.016 d-1), i.e. a mean doubling time > 40 days. At a temperature above 15 °C the bacterial ATP concentration decreased rapidly, but oxygen consumption increased, indi-cating biomass turnover by protozoan and invertebrate activity in the filter bed. The ratio of oxygen consumption and DOC removal exceeded the theoretical value (2.8 mg O2 mg C-1) for complete NOM oxidation at temperatures >10°C (3.9-11.2 mg O2 mg -1 C), thus confirming biomass turnover at elevated temperature. The apparent specific substrate utilization rate (0.2 – 1.8 µg DOC ng -1 ATP day-1) in phase II approached the maintenance coefficient of Polaromo-nas for growth on acetate at lower temperatures and the maximal specific utilization rate at high temperatures. Adsorption and biodegradation occurred simultaneously in both phases, but the removal of NOM by adsorption predominated in phase I, whereas biodegradation was more pronounced in phase II.
146 Microbial activity in GAC filters in drinking water treatment
The surface characteristics of GAC affect the microbial activity in GACFs in different ways. The hydrophobic and charged GAC surface strengthens bacterial attachment, and the high porosity of the outer surface prevents the washout of bacteria and protect them from protozoan preda-tion. Excess oxygen utilization as compared to the removal of dissolved organic carbon (DOC) was associated with a decrease of the concentration of bacterial biomass on GAC at tempera-tures > 15ºC, indicating the presence of accumulated dead and living biomass, originating from the influent and/or from microbial growth. The high ratio of the cumulative oxygen removal and the cumulative DOC removal may also be attributed the binding of oxygen by GAC surface, and/or to the utilization of adsorbed compounds. Direct utilization of adsorbed compounds is unlikely to occur, but the reassembling of supramolecular aggregates of humic substances adsorbed onto GAC is a potential mechanism for the release of biodegradable compounds from the adsorbed humic aggregates. Calculations however, indicate that the con-tribution of these released compounds to the microbial activity is most likely negligible when compared to the activity induced by the uptake of biodegradable compounds from the water.
In conclusion, the investigations described in this thesis revealed that the bacterial activity in GACFs is affected by the GAC-surface properties promoting bacterial attachment. The microbi-al activity in GAC filters is usually regarded as beneficial due to the additional removal of NOM from the influent by biodegradation processes that result in an extension of periods between regenerations. However, the strong attachment of bacteria to GAC and poor backwashing effi-ciency enhance accumulation of dead and living biomass in GACFs, resulting in biomass-turn-over processes in summer. Release of compounds and (micro)organisms, e.g. invertebrates, produced by these processes will affect the effluent water quality. Apparently, benefits and disadvantages of microbial activity in GAC filters need to be balanced.
GAC materials with more macropores accessible for bacterial attachment and growth are suit-able if GAC filtration is used to remove biodegradable compounds from the effluent. However, the effects of GAC filtration on biological stability of the effluent under these conditions need to be reevaluated regarding the emission of living and dead biomass (aggregates) from the GACF. If removal of micropollutants is the main goal of GAC filtration, microporous GAC ma-terials with less mesopores and macropores could provide a better performance. To limit accu-mulation and release of biomass (aggregates) in the effluent an adequate pretreatment (rapid sand filtration or dual-media filtration) or posttreatment (slow sand filtration or ultrafiltra-tion) may further improve the benefits of biological processes in GAC filters. Optimization of the backwashing procedure might also be considered.
The concentration and properties of available growth substrates in GACFs require further stud-ies, as well as the impact of particulate organic carbon on biological activity in GACFs. Efforts to isolate the predominant and yet uncultivated microorganisms and study their preferred growth substrates and other characteristic will add to the information presented here about the importance of the release of bioavailable components from supramolecular structures of NOM induced by adsorption to the GAC surface. This knowledge may lead to further optimiza-tion of biodegradation processes in GAC filters.

147Samenvatting
samenvaTTing
Het onderzoek beschreven in dit proefschrift richtte zich op de bijdrage van de bacteriële ge-meenschap aan de verwijdering van natuurlijk organisch materiaal (NOM) in granulaire ac-tieve koolfilters (GACFs) bij de drinkwaterbereiding. Metingen in praktijkinstallaties, proefin-stallaties en laboratoriumexperimenten zijn uitgevoerd om de microbiële activiteit in GACFs te meten en interacties met adsorptieprocessen te beschrijven. Hierbij werd (i) een methode voor het meten van de concentratie van actieve bacteriën op GAC ontwikkeld en geëvalueerd; (ii) werden de dominante bacterietypen van de bacteriële gemeenschappen in GACFs geïsoleerd en geïdentificeerd met kweekafhankelijke en moleculaire technieken, (iii) werden de fysiolo-gische eigenschappen van enkele dominante bacteriesoorten opgehelderd en (iv) werden de microbiële activiteit en adsorptie van NOM gekwantificeerd en hun relaties geanalyseerd in een GACF proefinstallatie. Hoofdstuk 2 beschrijft de ontwikkeling van een methode voor het meten van de concentra-tie van de actieve bacteriële biomassa in GACFs. Deze methode is gebaseerd op het gebruik van hoog energetisch ultrasoon geluid met een vermogen van 40 W voor het losmaken van de geadsorbeerde micro-organismen en de analyse van adenosinetrifosfaat (ATP) voor de kwantificering van de microbiële activiteit. Een reeks van zes tot acht behandelingen met hoog energetisch ultrasoon geluid van twee minuten bleek nodig om meer dan 90% van de geadsor-beerde bacteriën te verwijderen van het GAC-oppervlak, hetgeen duidt op sterke hechting van de bacteriën aan GAC. De ATP-concentratie in 30 praktijk GACFs en negen snelle zandfilters (RSFs) in negen drinkwaterinstallaties in Nederland varieerde tussen 25-5000 ng ATP cm-3 fil-termateriaal. De hoogste concentraties werden waargenomen in de filters met lange looptijden en filters die werden gevoed met water dat is behandeld met ozon. een In de RSFs en GACFs werd een vergelijkbare activiteit gevonden, maar de mediaanwaarde van het ATP-gehalte per bacteriecel was in de RSFs (3.6 x10⁻⁷ ng ATP/cel) meer dan tien keer hoger dan van de bacteriën in de GACFs (2.1x10⁻⁸ ng ATP/cel). Blijkbaar zijn de meeste bacteriën in de GACFs in de stationaire groeifase, in tegenstelling tot de bacteriën in de RSFs die in de exponentiële groeifase zijn.
In hoofdstuk 3 wordt de identificatie beschreven van de kweekbare bacteriën die dominant zijn in GACFs. Onderzoek van bacteriën uit 21 GACFs van negen waterbehandelingsinstallaties in Nederland met behulp van genomische fingerprints (amplified fragment length polymor-phism, AFLP) en sequentie-analyse van het 16S ribosomaal RNA-gen wees uit dat de dat het merendeel van de dominante soorten in GACFs behoort tot de Betaproteobacteria (68%) en de Alphaproteobacteria (25 %). Bacteriën van het geslacht Polaromonas zijn bijna altijd aange-troffen in deze GACFs (86%), terwijl vertegenwoordigers van de geslachten Hydrogenophaga, Sphingomonas en Afipia werden geïsoleerd uit respectievelijk 43%, 33% en 29% van de filters. Het geslacht Polaromonas, dat voornamelijk wordt waargenomen in oligotrofe aquatische mili-eus, was vertegenwoordigd met 23 verschillende genotypen, gebaseerd op de AFLP-analyse.
Een kweek-onafhankelijke studie, gebaseerd op de sequentie-analyse en de T-RFLP finger-print (Terminal Restriction Fragment Length Polymorphism) van bacteriële 16S rRNA genen, afkomstig uit GACFs van vijf praktijkinstallaties en twee proefinstallaties, resulteerde in de

148 Microbial activity in GAC filters in drinking water treatment
detectie van in totaal 135 operationele taxonomische eenheden (OTU’s), (hoofdstuk 4). Evenals bij de kweek-afhankelijke studie, behoorden de meest dominante OTU’s uit de GACFs tot de Betaproteobacteria (43%) en Alphaproteobacteria (38%), met vertegenwoordigers uit de geslachten Polaromonas (11%), Afipia, Sphingomonas, Variovorax en familie Commamo-nadaceae. Bovendien, bleek uit de toepassing van de kweek-onafhankelijke werkwijze dat een aantal groepen die niet werden gekweekt een belangrijk deel uitmaken van de bacteriële gemeenschappen in de onderzochte GACFs. Hierbij vormden een nog niet gekweekte groep binnen de Betaproteobacteria (“TRA3-20 groep”, 14.5%), de Acidobacteria (7%), en vertegen-woordigers van de families Bradyrhizobiaceae (9%) en Hyphomicrobiaceae (7%) van de orde Rhizobiales de belangrijkste groepen. De beoordeling van bacteriële diversiteit met de t-RFLP analyse toonde een relatief hoge mate van overeenkomst (> 60%) tussen de gemeenschappen in de GACFs van de verschillende lo-caties. In filters uit een proefinstallatie werd een hoge temporele en ruimtelijke stabiliteit van de bacteriële gemeenschap waargenomen over een periode van 18 maanden. De dominante soorten waren gelijkmatig verdeeld (Shannon index 0.82 ± 0.06 van de t-RFLP fragmenten). Een toename van het aantal soorten tijdens de rijping van de bacteriële gemeenschap in het proefinstallatiefilter ging gepaard met een toename van het relatieve aandeel van de dominante soorten, waarmee het belang van deze bacteriën in de microbiële activiteit werd bevestigd. De classificatie van de belangrijkste bacteriën en de fysiologische eigenschappen van de meest verwante gekweekte soorten geven aan dat de meeste bacteriën op GAC behoren tot aërobe chemo-organotrofe soorten, die kunnen groeien bij lage concentraties van carbonzuren en aromatische zuren. Ook zijn chemolithotrofe bacteriën die ammoniak of nitriet als energie-bron kunnen gebruiken, aangetroffen. De substraatvoorkeur en de groeikinetiek van twee Polaromonas stammen, geïsoleerd uit twee GACFs, werden onderzocht in batchexperimenten met mengsels en individuele afbreekbare stoffen bij concentraties van enkele microgrammen per liter (hoofdstuk 5). De voorkeursubstraten voor groei van deze twee Polaromonas stam-men waren carbonzuren en aromatische zuren, terwijl slechts enkele aminozuren en koolhy-draten werden gebruikt als enige bron van koolstof en energie. De relatief sterke groei op een mengsel van aminozuren, geeft aan dat de meeste aminozuren wel gebruikt kunnen worden als koolstofbron. De maximale groeisnelheid (0.09-0.11 h-1) werd bereikt bij een lage sub-straat concentratie, en lage Monod-constanten werden waargenomen voor de groei op acetaat (0.015 µM) en benzoaat (0.039 µM). Dit betekent dat in GACFs laag-moleculaire organische verbindingen kunnen worden omgezet bij concentraties van enkele microgrammen-per-liter.
Om de relatie tussen adsorptie en biologische afbraak van NOM nader te bestuderen werd de groei van bacteriën en de verwijdering van opgeloste organische koolstof (DOC) gemeten in een GACF-proefinstallatie die gedurende 602 dagen in bedrijf was op een locatie waar drinkwater wordt bereid uit oppervlaktewater (Weesperkarspel, Waternet, Nederland, hoofdstuk 6). De verwijdering van NOM was in fase I (dagen 0-100) ongeveer vier keer sneller dan in fase II (100-602 dagen) van de looptijd. De snelheid van bacteriële accumulatie (BAR) op GAC was hoger na 7 minuten contacttijd (1.6 ng ATP g -1 GAC dag-1) dan na 23 minuten (1,1 ng ATP g -1 GAC dag-1). Een maximale concentratie van 315-530 ng ATP g -1 GAC werd bereikt na een looptijd van ongeveer 250 dagen. Uit de gegevens werd afgeleid dat de netto specifieke
149Samenvatting
groeisnelheid van de bacteriën op GAC erg laag was (<0,016 d-1), d.w.z. een gemiddelde verdubbelingstijd van meer dan 40 dagen. Bij een temperatuur boven 15 °C daalde de bac-teriële ATP-concentratie snel, terwijl het zuurstofverbruik sterk toenam hetgeen duidt op de consumptie van geaccumuleerde bacteriële biomassa door protozoa en (activiteit van) andere ongewervelde dieren in het filterbed. Bij temperaturen boven 10 °C is de verhouding tussen zuurstofverbruik en DOC-verwijdering (3.9-11.2 mg O2 mg-1 C) hoger dan de hoeveelheid (2.8 mg O2 mg-1 C) die nodig is voor complete NOM-oxidatie en bevestigt de omzetting van bio-massa bij verhoogde temperatuur. De schijnbare specifieke substraatomzettingssnelheid (0,2-1,8 µg DOC ng -1 ATP dag-1) in fase II benaderde de handhavingscoëfficiënt van Polaromonas voor groei op acetaat bij lagere temperaturen en de maximale specifieke omzettingssnelheid bij hoge temperaturen. Adsorptie en biodegradatie traden naast elkaar op in beide fasen, maar de verwijdering van NOM door adsorptie overheerste in fase I, terwijl de biologische afbraak relatief sterk was in fase II.
De eigenschappen van het GAC-oppervlak beïnvloeden de microbiële activiteit in GACFs op verschillende manieren. Het hydrofobe en geladen GAC-oppervlak versterkt de aanhechting van bacteriën, en de hoge porositeit van het buitenoppervlak voorkomt de uitspoeling van bacteriën en biedt bescherming tegen predatie door protozoa. De overmaat van zuurstofver-bruik, in verhouding met de verwijdering van opgeloste organische koolstof (DOC), en de gelijktijdige afname van de concentratie van bacteriële biomassa op GAC bij temperaturen > 15 °C, wijst op de aanwezigheid van geaccumuleerde dode en levende biomassa, afkomstig van het influent en van microbiële groei. Het overmatige zuurstofverbruik kan ook worden toegeschreven aan de consumptie van zuurstof door GAC oppervlak of de omzetting van gead-sorbeerde verbindingen. Directe benutting van de geadsorbeerde organische verbindingen is onwaarschijnlijk, maar de verandering van structuur van de supramoleculaire aggregaten van de op GAC-geadsorbeerde humuscomponenten is een potentieel mechanisme voor het vrijko-men van biologisch afbreekbare verbindingen. Uit de berekeningen blijkt echter dat microbio-logische activiteit door omzetting van verbindingen die eventueel vrijkomen uit geadsorbeerde humuscomponenten waarschijnlijk verwaarloosbaar is ten opzichte van de activiteit als gevolg van de opname van biologisch afbreekbare verbindingen uit het water.
Op basis van het in dit proefschrift beschreven onderzoek kan worden geconcludeerd dat de bacteriële activiteit in GACFs wordt beïnvloed door de eigenschappen van het GAC-oppervlak die de aanhechting en retentie van bacteriën sterk bevorderen. De microbiële activiteit in GAC-filters wordt meestal beschouwd als gunstig vanwege de bijkomende verwijdering van NOM uit het influent door biologische processen, die kan leiden tot een verlenging van de periode tussen de regeneraties. Echter, de sterke hechting van bacteriën aan het GAC-oppervlak en de geringe efficiëntie van het terugspoelen van GACFs leiden tot ophoping van dode en levende biomassa in GACFs met versterkte omzetting van biomassa in de zomer als gevolg. Het vrij-komen van biomassabestanddelen en (micro) organismen, waaronder ongewervelde dieren, door deze processen beïnvloedt de effluentkwaliteit. De voor- en nadelen van de microbiële activiteit in GAC-filters dienen dus goed te worden afgewogen.
GAC typen met veel macroporiën die toegankelijk zijn voor aanhechting en groei van bacteriën zijn geschikt als GAC-filtratie wordt toegepast voor de verwijdering van biologisch afbreekbare

150 Microbial activity in GAC filters in drinking water treatment
stoffen uit het water. Echter, het effect van GAC-filtratie op de biologische stabiliteit van het effluent onder deze omstandigheden moet mede worden beoordeeld met betrekking tot de levering van levende en dode biomassa (aggregaten) door de GACFs. Indien verwijdering van microverontreinigingen het belangrijkste doel is van GAC-filtratie, kan een microporeus GAC-materiaal met minder meso- en macroporiën een beter resultaat geven. Een adequate voorbe-handelingstap (snelle zandfiltratie of dubbellaagsfiltratie) en/of een nabehandeling (langzame zandfiltratie of ultrafiltratie) kan de accumulatie en/of het vrijkomen van biomassa (aggrega-ten) beperken waardoor de voordelen van biologische processen in GAC-filters beter kunnen worden benut. Optimalisatie van de terugspoelprocedure kan eveneens worden overwogen.
De invloed van deeltjes-gebonden organische koolstof op de biologische activiteit in GACFs en op de kwaliteit van het effluent vereist verder onderzoek. Onderzoek van de dominante en nog niet gekweekte micro-organismen voor het bepalen van de favoriete groeisubstraten, de groeikinetiek en de substraatopname in de stationaire fase kan informatie geven over het vrij-komen van biologisch beschikbare componenten van supramoleculaire structuren van NOM geïnduceerd door adsorptie aan het GAC-oppervlak. Deze kennis kan leiden tot verdere opti-malisatie van de biologische processen in GAC-filters.

151Acknowledgements
acknowledgemenTs
It was a privilege to have this opportunity to work in excellent conditions, under the great guidance, on a subject that has intrigued me since the beginning of my studies. I would like to express my sincere gratitude to all who contributed in various ways and made it possible to finalize this dissertation.
To my supervisor, Prof. Dr. Ir. D. van der Kooij, who recognised and stimulated my curiosity, I am grateful for my path was elucidated with his valuable knowledge and experience as well as for the enduring encouragement and constructive criticism. During many inspiring discus-sions, he taught me how to focus on the balance between the interests of science and practical applications and how to discover the delusions in concepts.
To my supervisor, Prof. Dr. H. Smidt, I am grateful for his valuable support and guidance through the rules and regulations of the university and for his invaluable expert help in the last steps of the preparation of this thesis.
To my colleagues from Amsterdam Water Supply, Prof. Dr. Ir. J.P. van der Hoek and Dr. J. Schellart, I am grateful for entrusting me with this great opportunity and providing ex-cellent working conditions. To my dear colleague, René van der Aa, with whom I started this journey, I owe Very special thank for arranging the pilot-plant experiments, lively and inspir-ing discussions, and especially for the fun we had during the sampling of GAC.
To all the members of the BAKF Steering Committee and BAKF Project Group, especially Jos Boere and Walter Siegers, and all the members of the PBC Microbiology, especially Dr. T. Suylen and Dr. W. Hoogenboezem, I am grateful for their attention, valuable questions, discussions and suggestions regarding this research.
Working at KWR Watercycle Research Institute (former KIWA) was an excellent experience. Bart Wullings and Leo Heijnen, thank you very much for introducing and guiding me trough the molecular techniques. I am grateful to Harm Veenendaal, and especially Anke Brouwer who showed me the way in the Laboratory for Microbiology, to Toon Braat for his meticulous work on growth experiments and to Stefan Voost for his help with the T-RFLP analysis. I was happy to share the office with Dr. W. Hijnen and Dr. P. Smeets and enjoy discussions about science, but also other important things in life.
The time I have spent at the Laboratory for Microbiology of WUR, under the warm supervi-sion of Anton Akkermans, who unfortunately is not here with us any more to see the end of this project, was quite different from the time I spent in the highly organized laboratories of Amsterdam Water Supply and KWR. Wilma Akkermans and Hans Heilig, thank you very much for all the help and guidance trough the dense forest of students from all sides of the planet growing and flourishing harmoniously together. My warm and dear memories are reserved for talented and hard working Mirjana Rajilic-Stojanovic who made me proud that we are from the same country.

152 Microbial activity in GAC filters in drinking water treatment
From my current employer, Het Waterlaboratorium, I wish to express my sincere gratitude all my colleagues and Dr. M. Tielemans and Mr. F. Schutter for their patience and support during the long finalization process of this thesis. My special appreciation is reserved for Dr. R. Steen for his enduring trust and encouragement and for helping me to create the conditions neces-sary for finishing the thesis. Ruud, thank you also for helping me write a proper Samenvatting.
I shall not forget to express my gratitude to my beloved family and friends who were there for me throughout the years. I especially wish to acknowledge Mr. Richard Anthony who helped me with the English, and Mr. Dragan Nastasic who designed the cover of this book. My fascina-tion with water started already in the early days on the soft banks of the mighty river Danube, one of the greatest teachers I ever encountered.

153About the author
aBouT The auThor
Aleksandra Knezev (1967, Novi Sad, Yugoslavia) received her degree in Bio-organic Chemistry, at the University of Novi Sad in 1990. She has lived in the Netherlands since 1991. Her carrier in the field of drinking water research started in 1996 at the Amsterdam Water Supply, Depart-ment of Water Quality. Between 2000-2005 she worked at KWR Water Cycle Research (former KIWA Water Research) and Wageningen University on her PhD. Since 2006, she has been working as Senior Consultant for Biology at Het Waterlaboratorium in Haarlem, the company providing water quality control services to the water supply companies in the west part of the Netherlands. She coordinates the research programme of the Biology Department with the main goal to maintain a high level of quality and efficiency for the routine water quality ser-vices as well as introduce novel methods and techniques into the drinking water practice. She is a member of the Thematic Group on Biological Activity of the Joint Research Programme (BTO) of the Water Supply Companies in the Netherlands and is regularly involved in various research projects. These projects involve collaboration with the Faculty of Civil Engineering and Geosciences of the TU Delft, the Netherlands and UNESCO-IHE Institute for Water Educa-tion, Delft, the Netherlands. Her main research interest is aquatic microbial ecology, in partic-ular attached growth and control of biological stability in drinking-water systems. Aleksandra is committed to helping ensure the acceptance and implementation of novel methods into the routine monitoring of drinking water quality.

154 Microbial activity in GAC filters in drinking water treatment
lisT of PuBlicaTions
Magic-Knezev A. and van der Kooij D. (2004). Optimisation and significance of ATP analy-sis for measuring active biomass in granular activated carbon filters used in water treatment. Wat. Res., 38(18), 3971-3979.
Magic-Knezev A. and van der Kooij D. (2006). Nutritional versatility of two Polaromonas-related bacteria isolated from biological granular activated carbon filters. Pp. 303-311. In: Re-cent progress in slow sand and alternative biofiltration processes. R. Gimbel. N.J.G. Graham. M. R. Collins Eds. IWA Publishing. London.
Magic-Knezev A., Wullings B., and van der Kooij D. (2009). Polaromonas and Hydroge-nophaga species are the predominant bacteria cultured from granular activated carbon filters in water treatment. J. Appl. Microbiol., 107(5),1457-1467.
Magic-Knezev A., Zandvliet L., Oorthuizen W.A., and van der Mark E.J. (2014). Value of adenosine tri-phosphate and total cell count for the assessment of general microbial water quality after sand filtration. Pp.51-58. In Progress in slow sand and alternative biofiltration pro-cesses. N. Nakamoto, N.J.G. Graham, M. R. Collins, R. Gimbel, Eds. IWA Publishing. London.
van der Aa L.T.J., Magic-Knezev A., Rietveld L.C., and van Dijk J.C. (2006). Biomass devel-opment in biological activated carbon filters. Pp. 293-302. In Progress in slow sand and alterna-tive biofiltration processes. N. Nakamoto, N.J.G. Graham, M. R. Collins, R. Gimbel, Eds. IWA Publishing. London.
Dullemont Y., Schijven J. F., Hijnen W.A.M., Colin M., Magic-Knezev A., and Oorthuizen W. (2006). Removal of MS2 phage, Escherichia coli and Campylobacter lari by slow sand filtra-tion. Pp. 12-20. In: Recent progress in slow sand and alternative biofiltration processes. R. Gim-bel. N.J.G. Graham. M. R. Collins Eds. IWA Publishing. London.
Maeng S. K., Sharma S. K., Amy G., and Magic-Knezev A. (2008). Fate of bulk organic mat-ter, nitrogen, and pharmaceutically active compounds in batch experiments simulating soil aquifer treatment (SAT) using primary effluent. Water Sci. Technol., 57(12), 1999–2007.
Liu G., Terhorst G.G., Guo H., van der Mark E.J., Bakker G.J., Magic-Knezev A. van der Wielen P.W.J.J., and Verberk, J.Q.J.C. (2011). Biofilm on suspended material in two unchlo-rinated drinking water distribution systems. In s.n. (Ed.), IWA Biofilm conference 2011: pro-cesses in biofilms (pp. 1-12). Shanghai: IWA.
Maeng S.K., Sharma S.K., Abel C.D., Magic-Knezev A., Amy G.L. (2011). Role of biodegra-dation in the removal of pharmaceutically active compounds with different bulk organic mat-ter characteristics through managed aquifer recharge: batch and column studies. Wat. Res., 45(16), 4722-4736.

155List of publications
Hammes F., Boon N., Vital M., Ross P., Magic-Knezev A., and Dignum M. (2011). Bacterial colonization of pellet softening reactors used during drinking water treatment. Appl. Environ. Microbiol., 77(3), 1041-1048.
Maeng S.K., Sharma S.K., Abel C.D., Magic-Knezev A., Song K.G., and Amy G.L. (2012). Effects of effluent organic matter characteristics on the removal of bulk organic matter and selected pharmaceutically active compounds during managed aquifer recharge: Column study. J. Contam. Hydrol., 140-141, 139-149.
Vital M., Dignum M., Magic-Knezev A., Ross P., Rietveld L., and Hammes F. (2012). Flow cytometry and adenosine tri-phosphate analysis: alternative possibilities to evaluate major bacteriological changes in drinking water treatment and distribution systems. Wat. Res., 46(15), 4665-4676.
Liu G., Ling F. Q., Magic-Knezev A., Liu W. T., Verberk J. Q. J. C., and van Dijk J. C. (2013). Quantification and identification of particle-associated bacteria in unchlorinated drinking water from three treatment plants by cultivation-independent methods. Wat. Res., 47(10), 3523-3533.
Ross P. S., Hammes F., Dignum M., Magic-Knezev A., Hambsch B., and Rietveld L. C. (2013). A comparative study of three different assimilable organic carbon (AOC) methods: results of a round-robin test. Water Sci. Technol.: Water Supply 13(4), 1024–1033.
Schijven J.F., van den Berg H.H., Colin M., Dullemont Y., Hijnen W.A., Magic-Knezev A., Oorthuizen W.A., and Wubbels G. (2013). A mathematical model for removal of human patho-genic viruses and bacteria by slow sand filtration under variable operational conditions. Wat. Res., 47(7), 2592-2602.
Oorthuizen W.A., Magic-Knezev A., and Cui F. (2014). Effect of sudden changes of slow sand filtration rate on number of bacteria and particles in effluent. Pp.135-140. In Progress in slow sand and alternative biofiltration processes. N. Nakamoto, N.J.G. Graham, M. R. Collins, R. Gimbel, eds. IWA Publishing. London.
Schijven J.F., van den Berg H.H., Colin M., Dullemont Y., Hijnen W.A., Magic-Knezev A., Oorthuizen W.A., and Wubbels G. (2014). Slow sand flitration process model for removal of microorganisms. Pp. 141-147. In Progress in slow sand and alternative biofiltration processes. N. Nakamoto, N.J.G. Graham, M. R. Collins, R. Gimbel, eds. IWA Publishing. London.

156 Microbial activity in GAC filters in drinking water treatment
diPloma for sPecialised Phd Training

157Diploma for specialised PhD training

Lay-out: Inkahootz, AmsterdamBackgound photo for abstract sections: photo provided by Cabot Norit Nederland B.V.Cover: [email protected] by: www.gvo.nl