metroaccess revenue vehicle fleet management plan · metroaccess . revenue vehicle . fleet...
TRANSCRIPT
MetroAccess Revenue Vehicle Fleet Management Plan
April 2009
D Department of access services
2
Table of Contents Page # Purpose (Opening Statement) 4 Section 1: Introduction 5 Regional Significance Growing Interest 6 Best Ride in the Nation 6 Beyond ADA 6 Current Fleet 7 Section 2: Typology of Specialized Transit Services 9 in the Washington D.C. Region Regional Demand for Paratransit Services Metro Service Levels 10 Measuring Performance 13 Section 3: Demand for Revenue Vehicles 16 Quality of Service 16 MACS Service Operations 16 Cancelations 17 The Planning Process 17 Determining Demand 18 Peak Vehicle Requirements 19 Section 4: Supply of Revenue Vehicles 20 Supply and Useful Life of Revenue Vehicles 20 Vehicle Age 21 Vehicle Miles 21 The Fleet 23 Spare Ratio 23 Vehicle Failure Definitions 24 Roadway Failures 24 Section 5: Summary of Vehicle Demand 26 Planned Vehicle Procurement and Replacement 26 Anticipated Growth 26 Conclusion 29 Appendix A: Growing Interest of Specialized Transportation Services in the Washington D.C. Region 30 Appendix B: Fleet by Age and Accumulated Miles 32 Glossary of Terms 34
3
List of Tables Page # Table 2.1 Disabled Populations in the Washington D.C. Compact Area 10 Table 4-1 Vehicle Inventory: Age and Mileage by Quadrants Denoting Corresponding Service-Life Standards 22 Table 4-2 FY 2009 Revenue Fleet 23 Table 4-3 MACS Forecasted Ridership and Fleet Statistics 23 Table 5.1 MACS Ridership Growth and Scheduled Procurement 27 Table 5-2 MACS Long Term Ridership Growth and Anticipated Vehicle Procurement Requirement 28 List of Charts Chart 2.1 Types of Disabilities in the Washington Region 9 Chart 2.2 Top Transit Cities 11 Chart 2.3 Percentage of Disabled Population in Metropolitan Areas 11 Chart 2.4 Metro Growth in Ridership 12 Chart 2.5 Change in Paratransit Ridership 12 Chart 2.6 MACS Trips by Hours 15 Chart 2-7 Percentage of MACS Trips by Time Period 15 Chart 3.1 Ridership Forecast and Fleet Needs 18 Chart 3.2 Vehicle in Service Time of Day 19 Chart 4-1 MACS Vehicles Past Metro’s Retirement Age 21 Chart 4-2 MACS Vehicles beyond minimum service-life miles 22 Chart 4-3 Roadway Failures 25 Chart 4.4 Percentages and Total Fleet by Vehicle Year (Age) 25 Chart 5.1 Scheduled Procurements and MACS Vehicle Statistics 27 Chart B-1 Distribution of Fleet by Vehicle Type and Vehicle Year (Age) 32 Chart B-2 Distribution of E-350 Vehicle by Age and Accumulated Miles 32 Chart B-3 Distribution of Crown Victoria Vehicle by Age and Accumulated Miles 33 Chart B-4 Distribution of Ford Taurus by Age and Accumulated Miles 33 List of Maps Map 1-1 Metro Compact Area 5 Map 1-2 MACS Fare Zones 7 Map 2-1 Paratransit Trip Activity 14
4
Purpose The purpose of this report is to provide information, analysis and recommendations on the Washington Metropolitan Area Transit Authority’s (Metro) current and projected fleet requirements for MetroAccess (MACS) paratransit service provided through contract by the Department of Access Services (ACCS). The first section of the report provides an introduction, with background information on ACCS and the regional significance of Metro’s specialized transportation service. The following sections will document the performance of MACS, referencing Metro statistics, regional studies and peer transit authority statistics. The remainder of the report will methodically chart the increased demand for paratransit service, the corresponding fleet needs and a summation of vehicle supply and demand. One of the objectives of our fleet management plan is to properly plan for and carry out the overall management of MACS vehicle fleet. Because demand continues to grow while Metro resources are scarce, the importance of having a plan cannot be overstated. The intent is to update the plan on a regular basis and to have the plan become an input into the Authority’s capital and operating budget preparation.
5
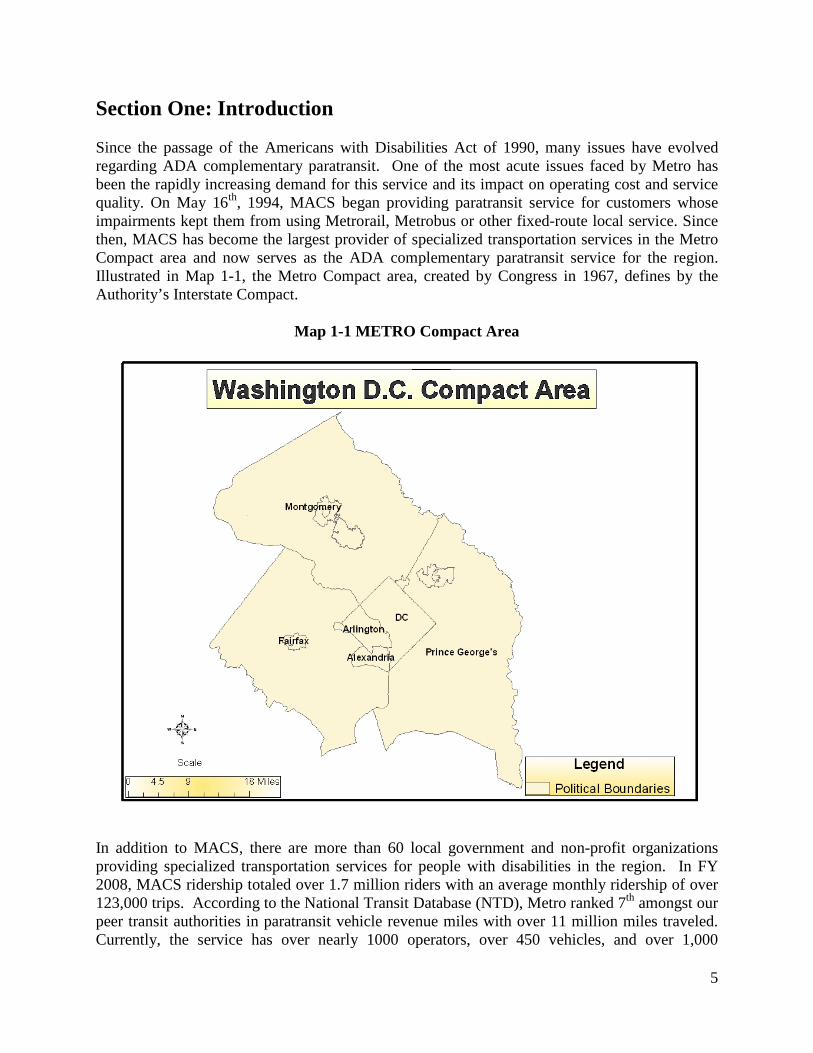
Section One: Introduction Since the passage of the Americans with Disabilities Act of 1990, many issues have evolved regarding ADA complementary paratransit. One of the most acute issues faced by Metro has been the rapidly increasing demand for this service and its impact on operating cost and service quality. On May 16th, 1994, MACS began providing paratransit service for customers whose impairments kept them from using Metrorail, Metrobus or other fixed-route local service. Since then, MACS has become the largest provider of specialized transportation services in the Metro Compact area and now serves as the ADA complementary paratransit service for the region. Illustrated in Map 1-1, the Metro Compact area, created by Congress in 1967, defines by the Authority’s Interstate Compact.
Map 1-1 METRO Compact Area
In addition to MACS, there are more than 60 local government and non-profit organizations providing specialized transportation services for people with disabilities in the region. In FY 2008, MACS ridership totaled over 1.7 million riders with an average monthly ridership of over 123,000 trips. According to the National Transit Database (NTD), Metro ranked 7th amongst our peer transit authorities in paratransit vehicle revenue miles with over 11 million miles traveled. Currently, the service has over nearly 1000 operators, over 450 vehicles, and over 1,000
6
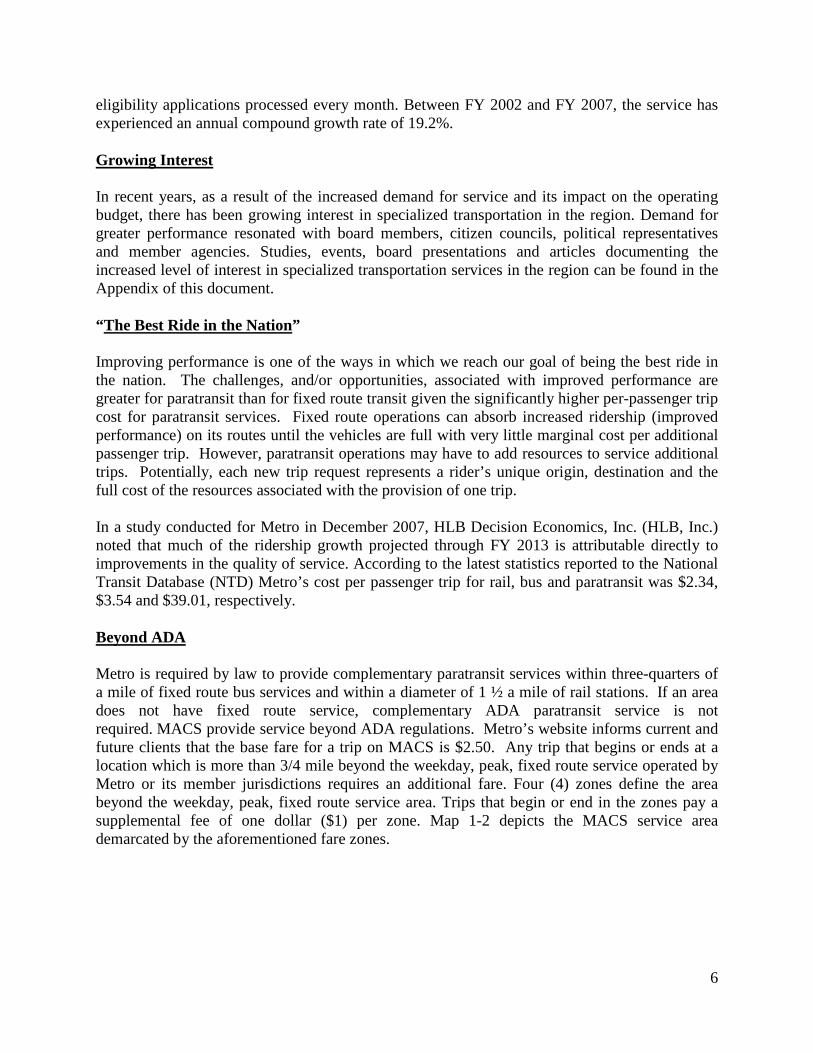
eligibility applications processed every month. Between FY 2002 and FY 2007, the service has experienced an annual compound growth rate of 19.2%. Growing Interest In recent years, as a result of the increased demand for service and its impact on the operating budget, there has been growing interest in specialized transportation in the region. Demand for greater performance resonated with board members, citizen councils, political representatives and member agencies. Studies, events, board presentations and articles documenting the increased level of interest in specialized transportation services in the region can be found in the Appendix of this document. “The Best Ride in the Nation” Improving performance is one of the ways in which we reach our goal of being the best ride in the nation. The challenges, and/or opportunities, associated with improved performance are greater for paratransit than for fixed route transit given the significantly higher per-passenger trip cost for paratransit services. Fixed route operations can absorb increased ridership (improved performance) on its routes until the vehicles are full with very little marginal cost per additional passenger trip. However, paratransit operations may have to add resources to service additional trips. Potentially, each new trip request represents a rider’s unique origin, destination and the full cost of the resources associated with the provision of one trip. In a study conducted for Metro in December 2007, HLB Decision Economics, Inc. (HLB, Inc.) noted that much of the ridership growth projected through FY 2013 is attributable directly to improvements in the quality of service. According to the latest statistics reported to the National Transit Database (NTD) Metro’s cost per passenger trip for rail, bus and paratransit was $2.34, $3.54 and $39.01, respectively. Beyond ADA Metro is required by law to provide complementary paratransit services within three-quarters of a mile of fixed route bus services and within a diameter of 1 ½ a mile of rail stations. If an area does not have fixed route service, complementary ADA paratransit service is not required. MACS provide service beyond ADA regulations. Metro’s website informs current and future clients that the base fare for a trip on MACS is $2.50. Any trip that begins or ends at a location which is more than 3/4 mile beyond the weekday, peak, fixed route service operated by Metro or its member jurisdictions requires an additional fare. Four (4) zones define the area beyond the weekday, peak, fixed route service area. Trips that begin or end in the zones pay a supplemental fee of one dollar ($1) per zone. Map 1-2 depicts the MACS service area demarcated by the aforementioned fare zones.
7
Map 1-2 MACS Fare Zones
Current Fleet This plan discusses those vehicles provided by Metro for use only in MACS service. Vehicles are dispersed among garages through Washington, Maryland and Virginia, to meet demand for service and to be as close as possible to eligible customers, trip origins and destinations. Currently, MACS does not have enough equipment to sufficiently meet demand. As such, the service is supplemented by taxi service. It is the goal of this fleet plan to 1) grow the fleet to a sufficient number to operate without the need to purchase supplemental taxi service and 2) operate with, and employ, the fundamental principles and practices of fleet management.
8
Organization of this document Section Two summarizes and documents MACS performance, referencing Metro statistics, regional studies and peer transit authority statistics. Section Three provides specifics on the demand for revenue vehicles as they relate to quality of service and Metro’s strategic initiatives. Also reviewed in this section is the planning process for developing peak vehicle requirements. Section Four assesses the current inventory and useful life of MACS revenue fleet vehicles. The remainder of the document focuses on vehicle needs for the duration of this fleet plan and the balance of vehicle supply and demand.
9
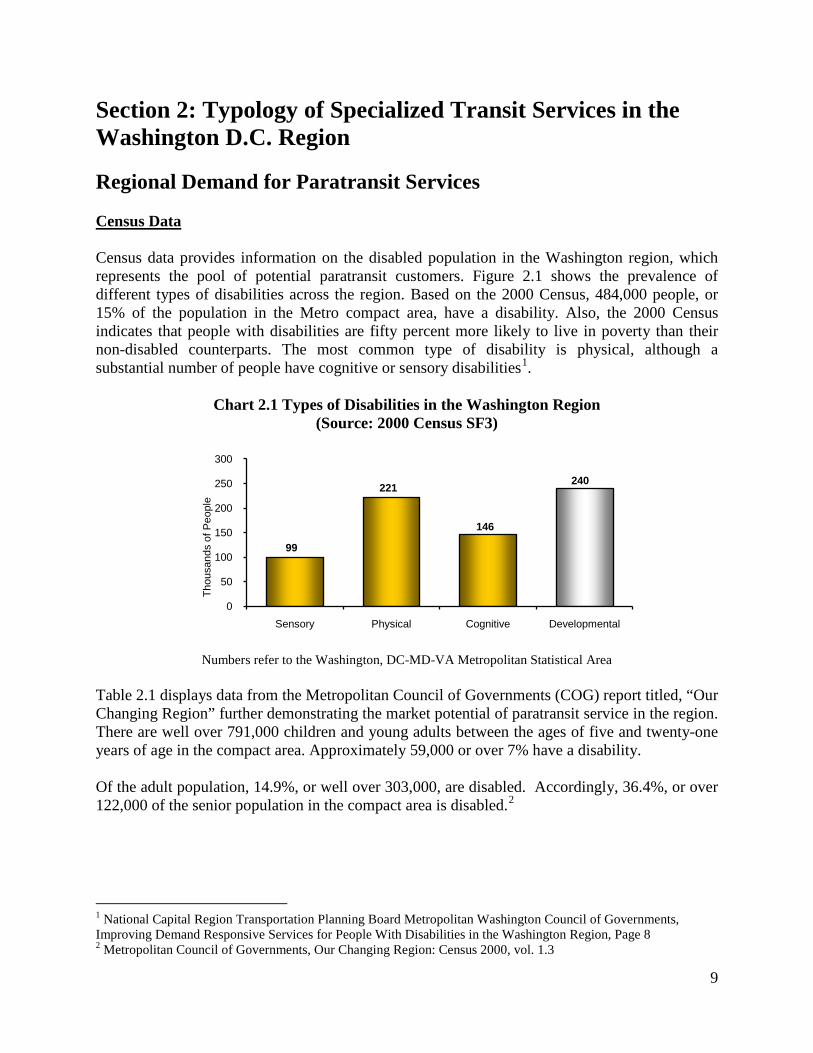
Section 2: Typology of Specialized Transit Services in the Washington D.C. Region Regional Demand for Paratransit Services Census Data Census data provides information on the disabled population in the Washington region, which represents the pool of potential paratransit customers. Figure 2.1 shows the prevalence of different types of disabilities across the region. Based on the 2000 Census, 484,000 people, or 15% of the population in the Metro compact area, have a disability. Also, the 2000 Census indicates that people with disabilities are fifty percent more likely to live in poverty than their non-disabled counterparts. The most common type of disability is physical, although a substantial number of people have cognitive or sensory disabilities1
Chart 2.1 Types of Disabilities in the Washington Region (Source: 2000 Census SF3)
.
Numbers refer to the Washington, DC-MD-VA Metropolitan Statistical Area
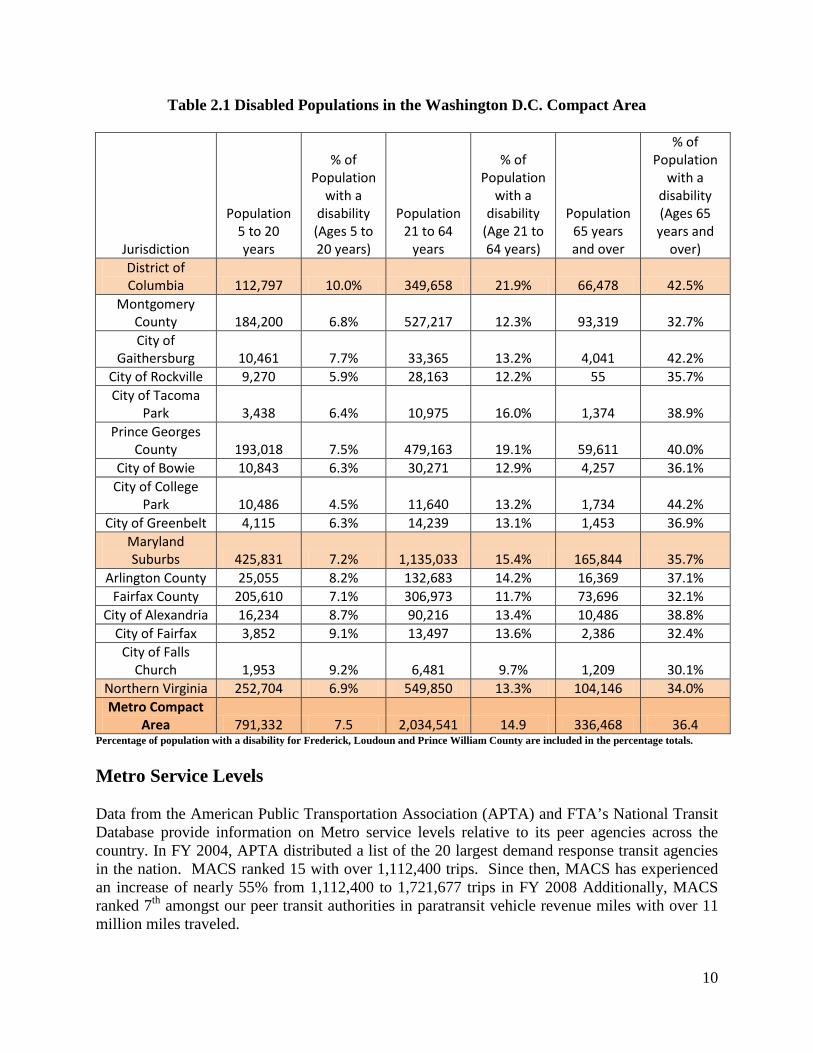
Table 2.1 displays data from the Metropolitan Council of Governments (COG) report titled, “Our Changing Region” further demonstrating the market potential of paratransit service in the region. There are well over 791,000 children and young adults between the ages of five and twenty-one years of age in the compact area. Approximately 59,000 or over 7% have a disability. Of the adult population, 14.9%, or well over 303,000, are disabled. Accordingly, 36.4%, or over 122,000 of the senior population in the compact area is disabled.2
1 National Capital Region Transportation Planning Board Metropolitan Washington Council of Governments, Improving Demand Responsive Services for People With Disabilities in the Washington Region, Page 8 2 Metropolitan Council of Governments, Our Changing Region: Census 2000, vol. 1.3
99
221
146
240
0
50
100
150
200
250
300
Sensory Physical Cognitive Developmental
Thou
sand
s of
Peo
ple
10
Table 2.1 Disabled Populations in the Washington D.C. Compact Area
Jurisdiction
Population 5 to 20 years
% of Population
with a disability (Ages 5 to 20 years)
Population 21 to 64
years
% of Population
with a disability
(Age 21 to 64 years)
Population 65 years and over
% of Population
with a disability (Ages 65 years and
over) District of Columbia 112,797 10.0% 349,658 21.9% 66,478 42.5%
Montgomery County 184,200 6.8% 527,217 12.3% 93,319 32.7% City of
Gaithersburg 10,461 7.7% 33,365 13.2% 4,041 42.2% City of Rockville 9,270 5.9% 28,163 12.2% 55 35.7% City of Tacoma
Park 3,438 6.4% 10,975 16.0% 1,374 38.9% Prince Georges
County 193,018 7.5% 479,163 19.1% 59,611 40.0% City of Bowie 10,843 6.3% 30,271 12.9% 4,257 36.1%
City of College Park 10,486 4.5% 11,640 13.2% 1,734 44.2%
City of Greenbelt 4,115 6.3% 14,239 13.1% 1,453 36.9% Maryland Suburbs 425,831 7.2% 1,135,033 15.4% 165,844 35.7%
Arlington County 25,055 8.2% 132,683 14.2% 16,369 37.1% Fairfax County 205,610 7.1% 306,973 11.7% 73,696 32.1%
City of Alexandria 16,234 8.7% 90,216 13.4% 10,486 38.8% City of Fairfax 3,852 9.1% 13,497 13.6% 2,386 32.4%
City of Falls Church 1,953 9.2% 6,481 9.7% 1,209 30.1%
Northern Virginia 252,704 6.9% 549,850 13.3% 104,146 34.0% Metro Compact
Area 791,332 7.5 2,034,541 14.9 336,468 36.4 Percentage of population with a disability for Frederick, Loudoun and Prince William County are included in the percentage totals.
Metro Service Levels Data from the American Public Transportation Association (APTA) and FTA’s National Transit Database provide information on Metro service levels relative to its peer agencies across the country. In FY 2004, APTA distributed a list of the 20 largest demand response transit agencies in the nation. MACS ranked 15 with over 1,112,400 trips. Since then, MACS has experienced an increase of nearly 55% from 1,112,400 to 1,721,677 trips in FY 2008 Additionally, MACS ranked 7th amongst our peer transit authorities in paratransit vehicle revenue miles with over 11 million miles traveled.
11
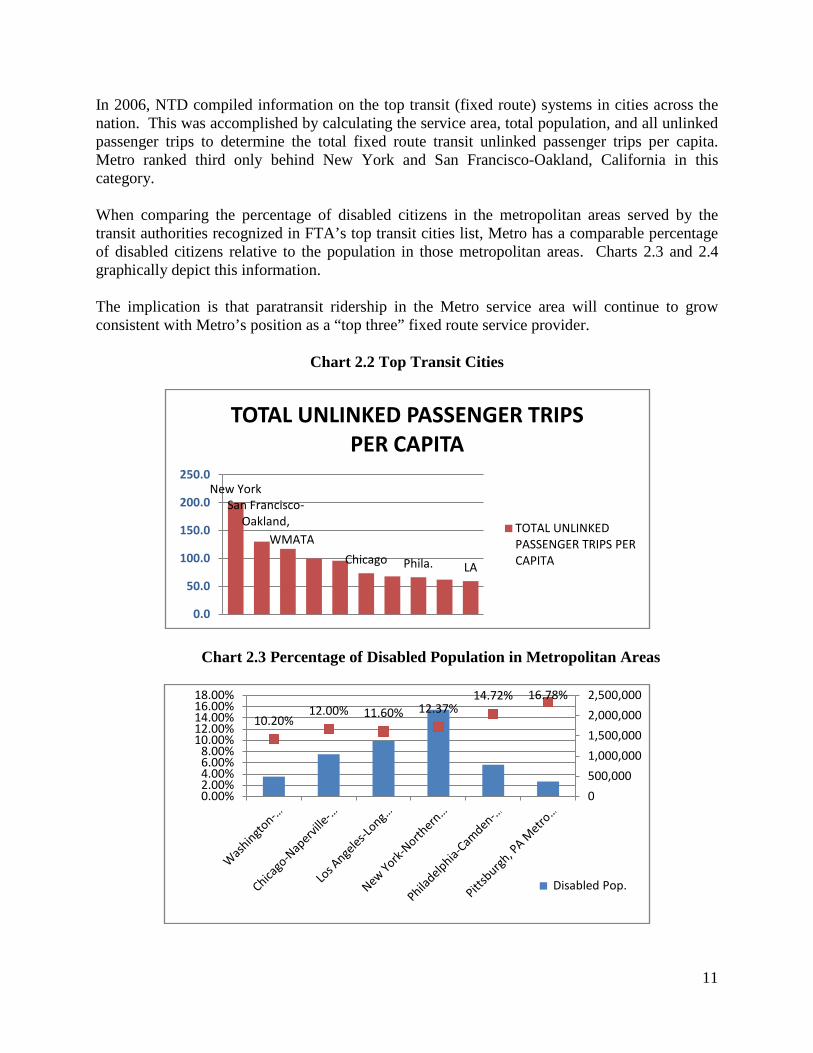
In 2006, NTD compiled information on the top transit (fixed route) systems in cities across the nation. This was accomplished by calculating the service area, total population, and all unlinked passenger trips to determine the total fixed route transit unlinked passenger trips per capita. Metro ranked third only behind New York and San Francisco-Oakland, California in this category. When comparing the percentage of disabled citizens in the metropolitan areas served by the transit authorities recognized in FTA’s top transit cities list, Metro has a comparable percentage of disabled citizens relative to the population in those metropolitan areas. Charts 2.3 and 2.4 graphically depict this information. The implication is that paratransit ridership in the Metro service area will continue to grow consistent with Metro’s position as a “top three” fixed route service provider.
Chart 2.2 Top Transit Cities
Chart 2.3 Percentage of Disabled Population in Metropolitan Areas
New YorkSan Francisco-
Oakland, WMATA
Chicago Phila. LA
0.0
50.0
100.0
150.0
200.0
250.0
TOTAL UNLINKED PASSENGER TRIPS PER CAPITA
TOTAL UNLINKED PASSENGER TRIPS PER CAPITA
10.20%12.00% 11.60% 12.37%
14.72% 16.78%
0
500,000
1,000,000
1,500,000
2,000,000
2,500,000
0.00%2.00%4.00%6.00%8.00%
10.00%12.00%14.00%16.00%18.00%
Disabled Pop.
12
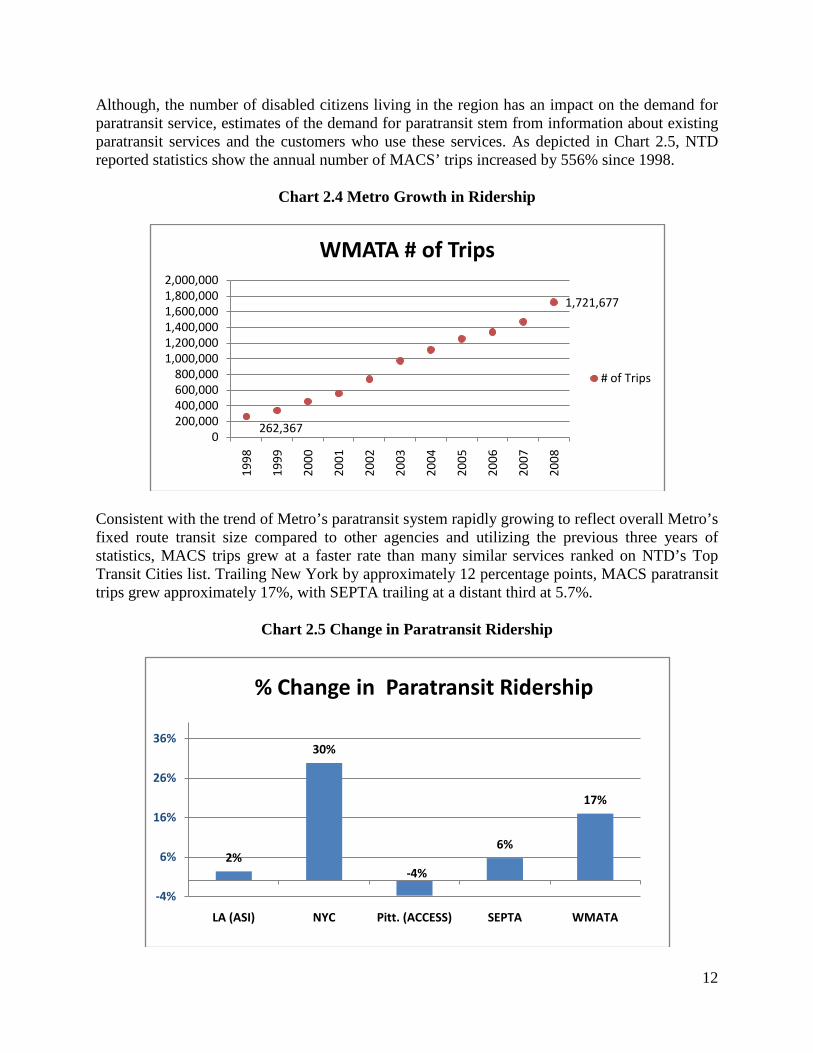
Although, the number of disabled citizens living in the region has an impact on the demand for paratransit service, estimates of the demand for paratransit stem from information about existing paratransit services and the customers who use these services. As depicted in Chart 2.5, NTD reported statistics show the annual number of MACS’ trips increased by 556% since 1998.
Chart 2.4 Metro Growth in Ridership
Consistent with the trend of Metro’s paratransit system rapidly growing to reflect overall Metro’s fixed route transit size compared to other agencies and utilizing the previous three years of statistics, MACS trips grew at a faster rate than many similar services ranked on NTD’s Top Transit Cities list. Trailing New York by approximately 12 percentage points, MACS paratransit trips grew approximately 17%, with SEPTA trailing at a distant third at 5.7%.
Chart 2.5 Change in Paratransit Ridership
262,367
1,721,677
0200,000400,000600,000800,000
1,000,0001,200,0001,400,0001,600,0001,800,0002,000,000
1998
1999
2000
2001
2002
2003
2004
2005
2006
2007
2008
WMATA # of Trips
# of Trips
2%
30%
-4%
6%
17%
-4%
6%
16%
26%
36%
LA (ASI) NYC Pitt. (ACCESS) SEPTA WMATA
% Change in Paratransit Ridership
13
Measuring Performance
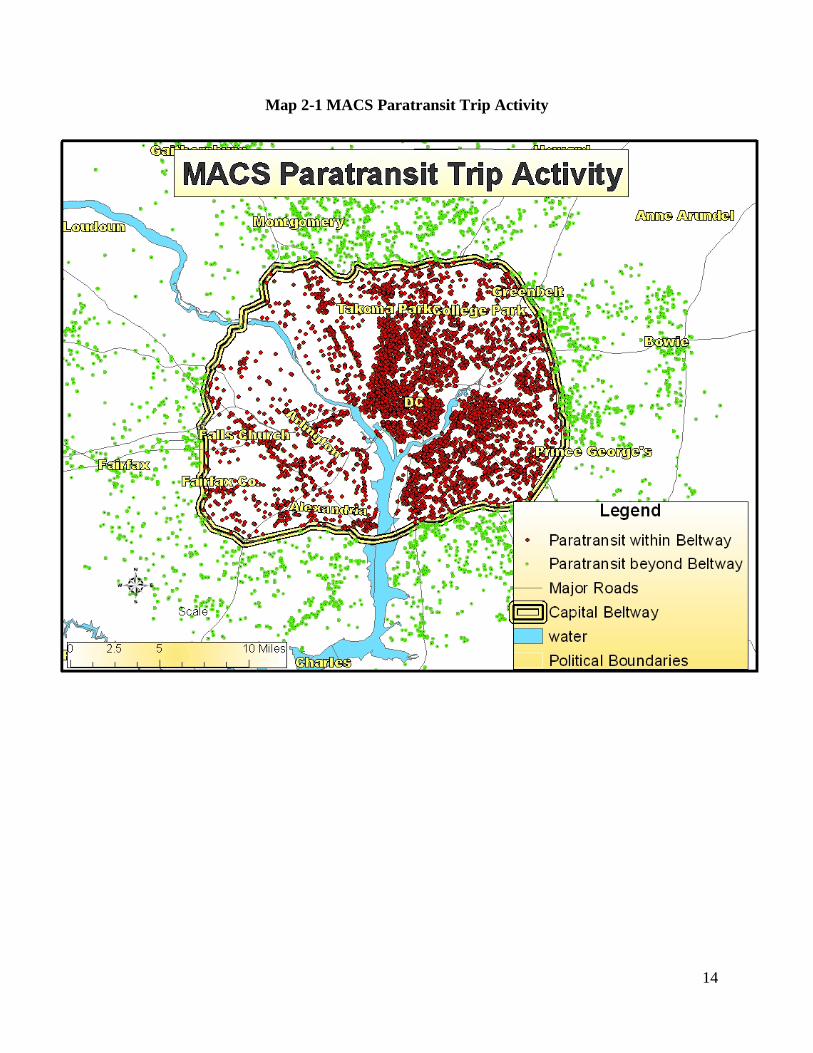
As noted in Section 1, there has been growing interest in specialized transportation in the region caused by an escalating growth in demand for service and financial constraints. As pressure to improve performance ensues, senior management staff has responded by establishing, or re-establishing, baseline performance metrics to measure performance. As with most performance measurement systems, the process begins with establishing goals and objectives for service. One of the operational performance goals associated with ACCS Strategic Plan is to expand MACS fleet to improve on-time-performance and decrease the number of missed and excessively late trips. During the month of June 2008, with over 129,000 completed trips, MACS vehicles traveled over 1.5 million miles and provided over 138,000 hours of service. Utilizing all of the vehicles in the MACS fleet, revenue service hours and miles were approximately 85% of total platform hours and miles. System wide, On-Time Performance was 92.12%. Factors Affecting Performance The Washington D.C. region is the third most congested traffic area in the nation. Street congestion in highly urbanized areas directly affects average vehicle speed and passenger travel time. A continued decline in vehicle speed eventually will prompt an increase in the number of vehicles necessary to increase, or operate at, the present level of service. Trips on the periphery benefit from the increase in vehicles; however, trips in highly congested areas require more time to perform trips within the established pick-up window of time. As depicted in Map 2-1, over 51% of performed trips in the region are destined to or originate within the Capital Beltway.
14
Map 2-1 MACS Paratransit Trip Activity
15
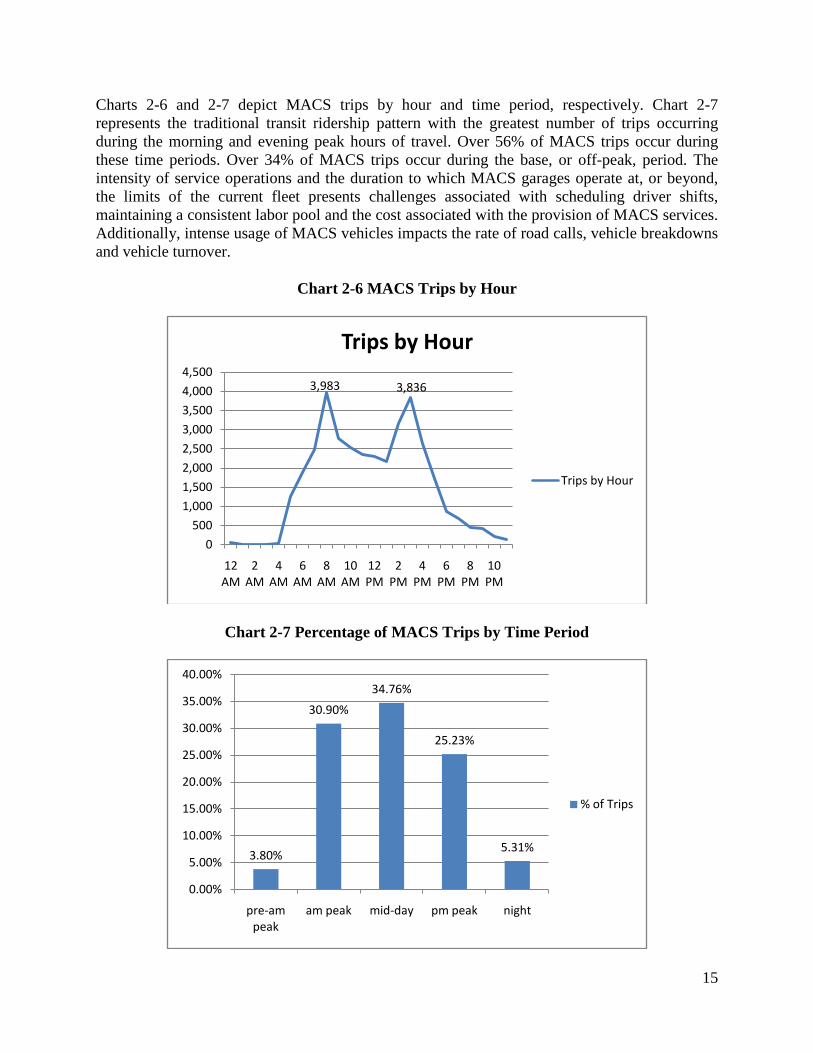
Charts 2-6 and 2-7 depict MACS trips by hour and time period, respectively. Chart 2-7 represents the traditional transit ridership pattern with the greatest number of trips occurring during the morning and evening peak hours of travel. Over 56% of MACS trips occur during these time periods. Over 34% of MACS trips occur during the base, or off-peak, period. The intensity of service operations and the duration to which MACS garages operate at, or beyond, the limits of the current fleet presents challenges associated with scheduling driver shifts, maintaining a consistent labor pool and the cost associated with the provision of MACS services. Additionally, intense usage of MACS vehicles impacts the rate of road calls, vehicle breakdowns and vehicle turnover.
Chart 2-6 MACS Trips by Hour
Chart 2-7 Percentage of MACS Trips by Time Period
3,983 3,836
0
500
1,000
1,500
2,000
2,500
3,000
3,500
4,000
4,500
12 AM
2 AM
4 AM
6 AM
8 AM
10 AM
12 PM
2 PM
4 PM
6 PM
8 PM
10 PM
Trips by Hour
Trips by Hour
3.80%
30.90%
34.76%
25.23%
5.31%
0.00%
5.00%
10.00%
15.00%
20.00%
25.00%
30.00%
35.00%
40.00%
pre-am peak
am peak mid-day pm peak night
% of Trips
16
Section Three: Demand for Revenue Vehicles Quality of Service Committed to providing exemplary customer service, ACCS is mindful of the public’s perception of the service we provide. As such, one of ACCS internal goals is to deliver a high quality service that, to the greatest extent possible, shapes a positive image of MACS operations. Unlike the performance measures used to describe the quality of service reported to FTA and the vehicle performance measures used in the Highway Capacity Manual, passenger perception is the metric used by the public to measure the quality of transit system performance. Although we rely on our vehicle operators, schedulers, reservationist and customer service representatives to be our front line ambassadors, senior Metro staff have been working to reshape policies within the constraints of operating budgets and policy decisions to improve service delivery. For MACS, maintaining good quality service becomes increasingly important because demand for paratransit service is growing. As such, demand for revenue vehicles intensifies over time. Since 1998 passenger trips increased over 556% from 262,367 to over 1.7 million trips in FY2008. A total of 129,000 trips occurred during the month of June 2008 alone. Over 64 percent of these trips were subscription trips to medical facilities and employee work sites. The major element in providing the service depends heavily on the quality of the vehicles available to provide the service. A major element in providing a quality service is to have sufficient vehicles to meet the demand, and to adequately maintain the vehicles in a state of good repair and to replace overage vehicles when they reach the end of their useful life. This plan incorporates the following elements into providing sufficient vehicles that are reliable and the backbone of providing good quality service: The goal is to replace vehicles when they reach the end of their useful life, in order to
ensure that the fleets reliable and does not exceed the manufacturer’s life expectancy projections. This plan incorporates this strategy by replacing approximately ¼ of the fleet every year, and therefore maintaining an average vehicle age of 2 years.
To maintain vehicles in a state of good repair requires a sustained maintenance program both for preventative maintenance and the capability to respond to vehicle mechanical failures. To provide a quality service while maintaining an ongoing maintenance program requires sufficient spare vehicles to ensure the daily pull-out requirements. This plan is developed around having an overall 15% spare ratio, which is the industry norm.
Operational vehicles as part of the daily pull-out that are available to respond to the unanticipated demands, service interruptions, breakdowns or service delay problems. This plan incorporates these strategic operational spares by having 3% vehicles as part of the daily requirement.
MACS Service Operations MACS service operations are “demand driven.” That is, the quantity of service provided is dependent on the number passenger trips requested. Paratransit customers can reserve trips from one to seven days in advance. After the reservation occurs, changes occur in the schedule as new
17
trips occupy capacity within the system. Trips scheduled early in the seven day scheduling window take priority on the schedule. This may impact the times for riders with subsequent trip request. To the greatest extent possible, schedulers optimize the schedule in an attempt to achieve the following policy guidelines: (1) pick up passengers on time; and (2) utilize the least amount of time and vehicles. Schedulers analyze the schedule on a regular basis to make adjustments for subsequent trip requests, cancellations and to monitor supply and demand. MACS currently has a mix of vans and sedans in its fleet. The fleet mix and availability are matched against the specific service needs. Integral to the scheduling process is the importance of placing accessible vehicles throughout the service area for optimal flexibility in a dynamic operating environment. Cancellations The impact of a cancelled trip on paratransit service operations varies by when the cancellation occurs. Cancellations made at different times have a tiered impact on service; the closer the cancellation occurs to the time of the scheduled pick-up, the more severe the impact.3
• Estimate Passenger Demand: The first step in the service planning process is to determine demand for paratransit service. This is accomplished by actual counts of passenger trips coupled with estimates of future demand. Future demand estimates have been made by HLB Decision Economics, Inc. For the purpose of this fleet management plan, passenger demand is projected 5 years into the future, and takes into account regional growth estimates from the MWCOG.
As such, schedulers finalize schedules as close to the day of travel as possible. Once the schedules are built and adjustments are made for cancellations, manifests are created for operation. The result of this daily process is scheduled, and rescheduled, vehicle requirements by size and by trip location. The Planning Process The following describes the task of the planning process that determines fleet size:
• Utilize Established Productivity Standards, Hours per Vehicle Year, Rides per Vehicle
Year and the Resulting Vehicles Required. This is a simple calculation that derives from strategic policy initiatives and existing vehicle statistics.
• Determine Spare Vehicles: On average, MACS vehicles travel well over 45,000 miles per year. Intensive use of vehicles drives frequent maintenance intervals. As such, Metro recommends that we maintain a 12% spare ratio.
3Transit Cooperative Research Program Report 124, Guidebook for Measuring, Assessing, and Improving Performance of Demand-Response Transportation
18
• Determine the Strategic Vehicle Requirement: Vehicle reliability history helps determine the number of vehicles needed as “strategic spares.” Strategic spares are vehicles staged during peak periods at key locations for quick replacement of breakdowns or for response to unusual circumstances, accidents, weather, unannounced major detours, or other unforeseen circumstances. They help ensure reliable service to the public. Three percent strategic vehicles will accommodate MACS’ daily operations needs.
• Determine Total Vehicles Needed: This is the sum of the vehicles required to maintain
current productivity standards and those required to respond to observed and projected passenger demand.
• Determine Scheduled Procurement and Resulting Fleet Needs: A simple calculation
resulting from the number of vehicles at the beginning of the year, the required expansion based on forecasted ridership and the required replacement vehicles.
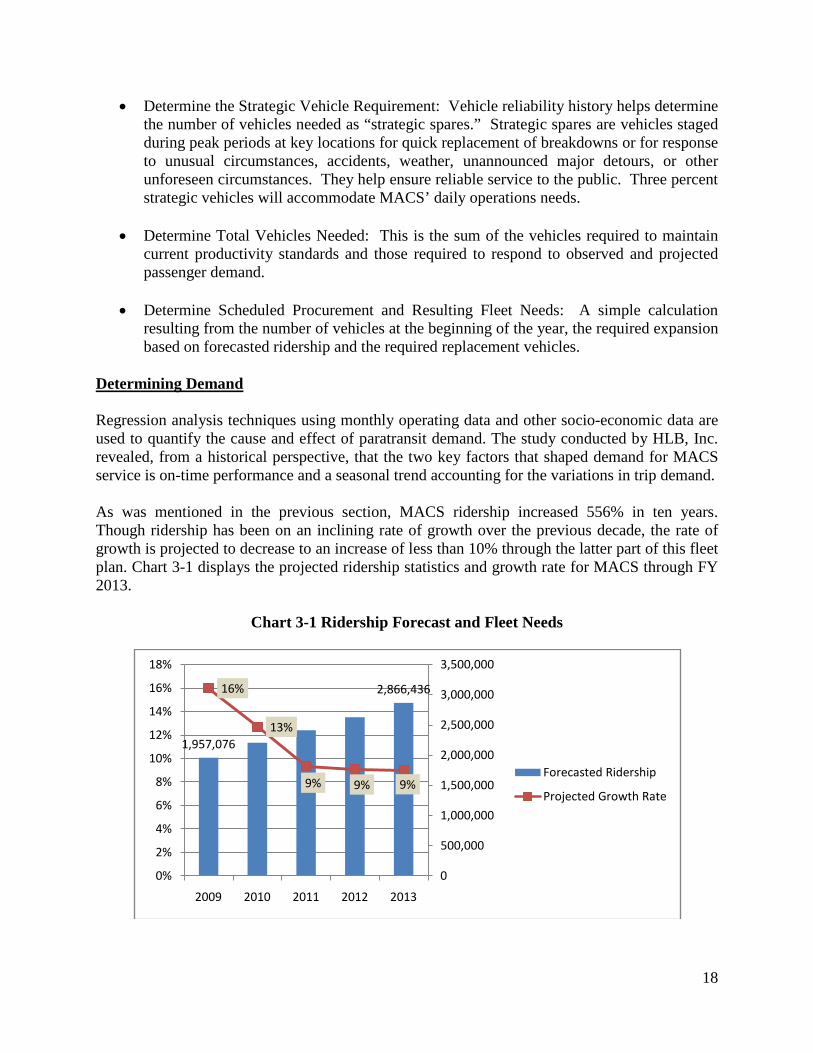
Determining Demand Regression analysis techniques using monthly operating data and other socio-economic data are used to quantify the cause and effect of paratransit demand. The study conducted by HLB, Inc. revealed, from a historical perspective, that the two key factors that shaped demand for MACS service is on-time performance and a seasonal trend accounting for the variations in trip demand. As was mentioned in the previous section, MACS ridership increased 556% in ten years. Though ridership has been on an inclining rate of growth over the previous decade, the rate of growth is projected to decrease to an increase of less than 10% through the latter part of this fleet plan. Chart 3-1 displays the projected ridership statistics and growth rate for MACS through FY 2013.
Chart 3-1 Ridership Forecast and Fleet Needs
1,957,076
2,866,43616%
13%
9% 9% 9%
0
500,000
1,000,000
1,500,000
2,000,000
2,500,000
3,000,000
3,500,000
0%
2%
4%
6%
8%
10%
12%
14%
16%
18%
2009 2010 2011 2012 2013
Forecasted Ridership
Projected Growth Rate
19
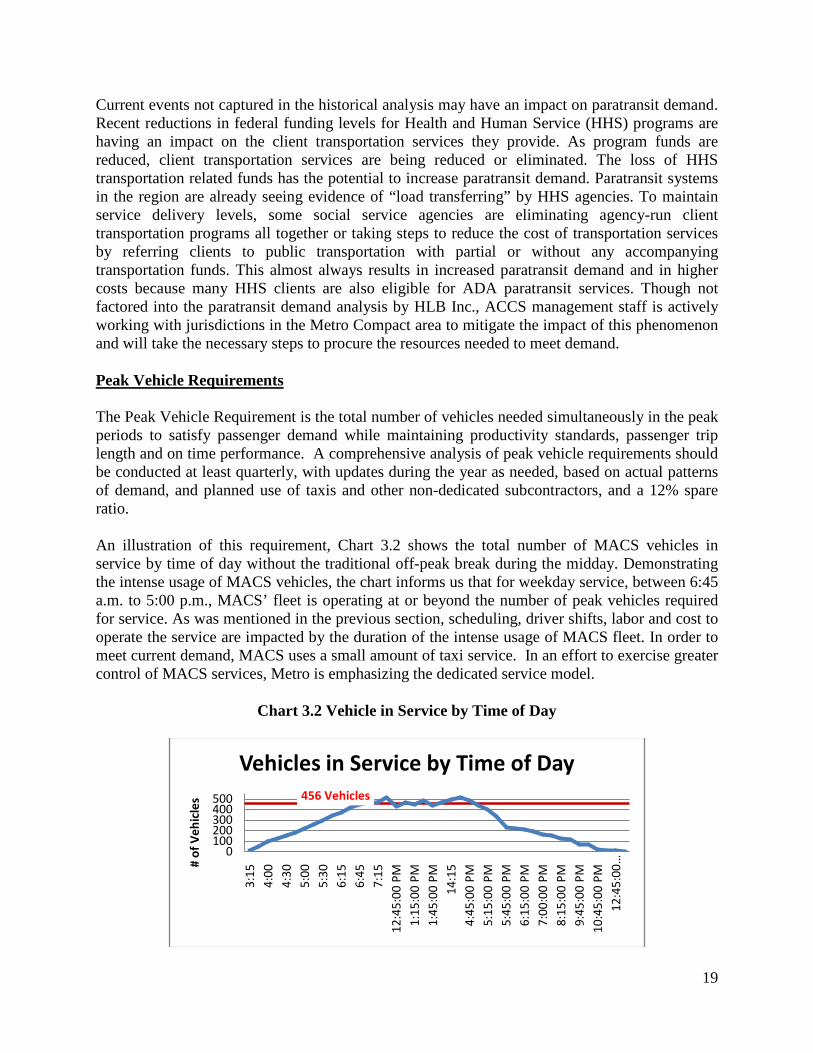
Current events not captured in the historical analysis may have an impact on paratransit demand. Recent reductions in federal funding levels for Health and Human Service (HHS) programs are having an impact on the client transportation services they provide. As program funds are reduced, client transportation services are being reduced or eliminated. The loss of HHS transportation related funds has the potential to increase paratransit demand. Paratransit systems in the region are already seeing evidence of “load transferring” by HHS agencies. To maintain service delivery levels, some social service agencies are eliminating agency-run client transportation programs all together or taking steps to reduce the cost of transportation services by referring clients to public transportation with partial or without any accompanying transportation funds. This almost always results in increased paratransit demand and in higher costs because many HHS clients are also eligible for ADA paratransit services. Though not factored into the paratransit demand analysis by HLB Inc., ACCS management staff is actively working with jurisdictions in the Metro Compact area to mitigate the impact of this phenomenon and will take the necessary steps to procure the resources needed to meet demand. Peak Vehicle Requirements The Peak Vehicle Requirement is the total number of vehicles needed simultaneously in the peak periods to satisfy passenger demand while maintaining productivity standards, passenger trip length and on time performance. A comprehensive analysis of peak vehicle requirements should be conducted at least quarterly, with updates during the year as needed, based on actual patterns of demand, and planned use of taxis and other non-dedicated subcontractors, and a 12% spare ratio. An illustration of this requirement, Chart 3.2 shows the total number of MACS vehicles in service by time of day without the traditional off-peak break during the midday. Demonstrating the intense usage of MACS vehicles, the chart informs us that for weekday service, between 6:45 a.m. to 5:00 p.m., MACS’ fleet is operating at or beyond the number of peak vehicles required for service. As was mentioned in the previous section, scheduling, driver shifts, labor and cost to operate the service are impacted by the duration of the intense usage of MACS fleet. In order to meet current demand, MACS uses a small amount of taxi service. In an effort to exercise greater control of MACS services, Metro is emphasizing the dedicated service model.
Chart 3.2 Vehicle in Service by Time of Day
456 Vehicles
0100200300400500
3:15
4:00
4:30
5:00
5:30
6:15
6:45
7:15
12:4
5:00
PM
1:15
:00
PM1:
45:0
0 PM
14:1
54:
45:0
0 PM
5:15
:00
PM5:
45:0
0 PM
6:15
:00
PM7:
00:0
0 PM
8:15
:00
PM9:
45:0
0 PM
10:4
5:00
PM
12:4
5:00
…# of
Veh
icle
s
Vehicles in Service by Time of Day
20
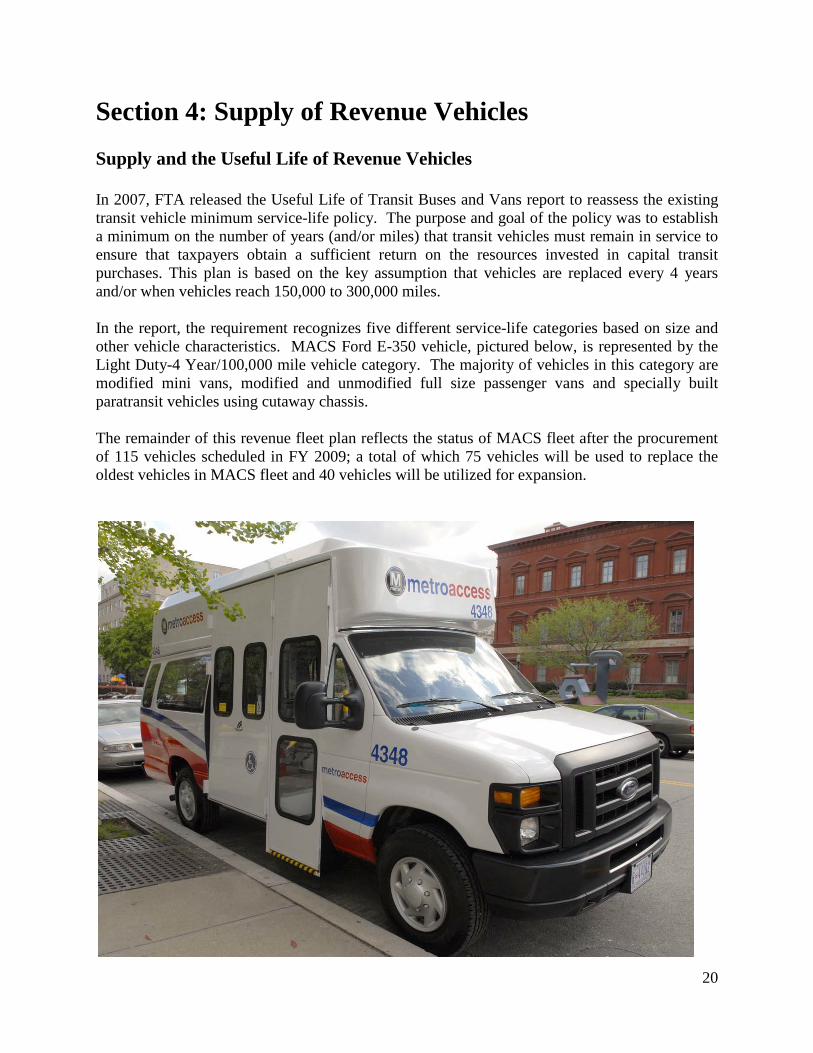
Section 4: Supply of Revenue Vehicles Supply and the Useful Life of Revenue Vehicles In 2007, FTA released the Useful Life of Transit Buses and Vans report to reassess the existing transit vehicle minimum service-life policy. The purpose and goal of the policy was to establish a minimum on the number of years (and/or miles) that transit vehicles must remain in service to ensure that taxpayers obtain a sufficient return on the resources invested in capital transit purchases. This plan is based on the key assumption that vehicles are replaced every 4 years and/or when vehicles reach 150,000 to 300,000 miles. In the report, the requirement recognizes five different service-life categories based on size and other vehicle characteristics. MACS Ford E-350 vehicle, pictured below, is represented by the Light Duty-4 Year/100,000 mile vehicle category. The majority of vehicles in this category are modified mini vans, modified and unmodified full size passenger vans and specially built paratransit vehicles using cutaway chassis. The remainder of this revenue fleet plan reflects the status of MACS fleet after the procurement of 115 vehicles scheduled in FY 2009; a total of which 75 vehicles will be used to replace the oldest vehicles in MACS fleet and 40 vehicles will be utilized for expansion.
21
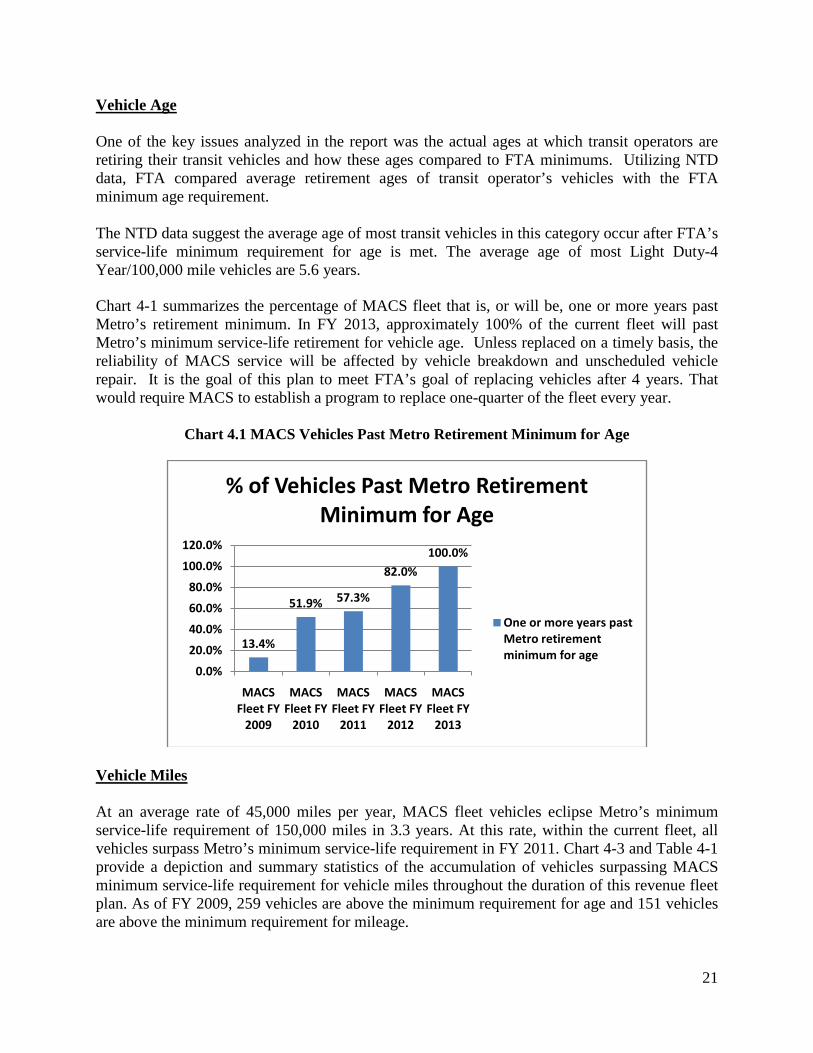
Vehicle Age One of the key issues analyzed in the report was the actual ages at which transit operators are retiring their transit vehicles and how these ages compared to FTA minimums. Utilizing NTD data, FTA compared average retirement ages of transit operator’s vehicles with the FTA minimum age requirement. The NTD data suggest the average age of most transit vehicles in this category occur after FTA’s service-life minimum requirement for age is met. The average age of most Light Duty-4 Year/100,000 mile vehicles are 5.6 years. Chart 4-1 summarizes the percentage of MACS fleet that is, or will be, one or more years past Metro’s retirement minimum. In FY 2013, approximately 100% of the current fleet will past Metro’s minimum service-life retirement for vehicle age. Unless replaced on a timely basis, the reliability of MACS service will be affected by vehicle breakdown and unscheduled vehicle repair. It is the goal of this plan to meet FTA’s goal of replacing vehicles after 4 years. That would require MACS to establish a program to replace one-quarter of the fleet every year.
Chart 4.1 MACS Vehicles Past Metro Retirement Minimum for Age
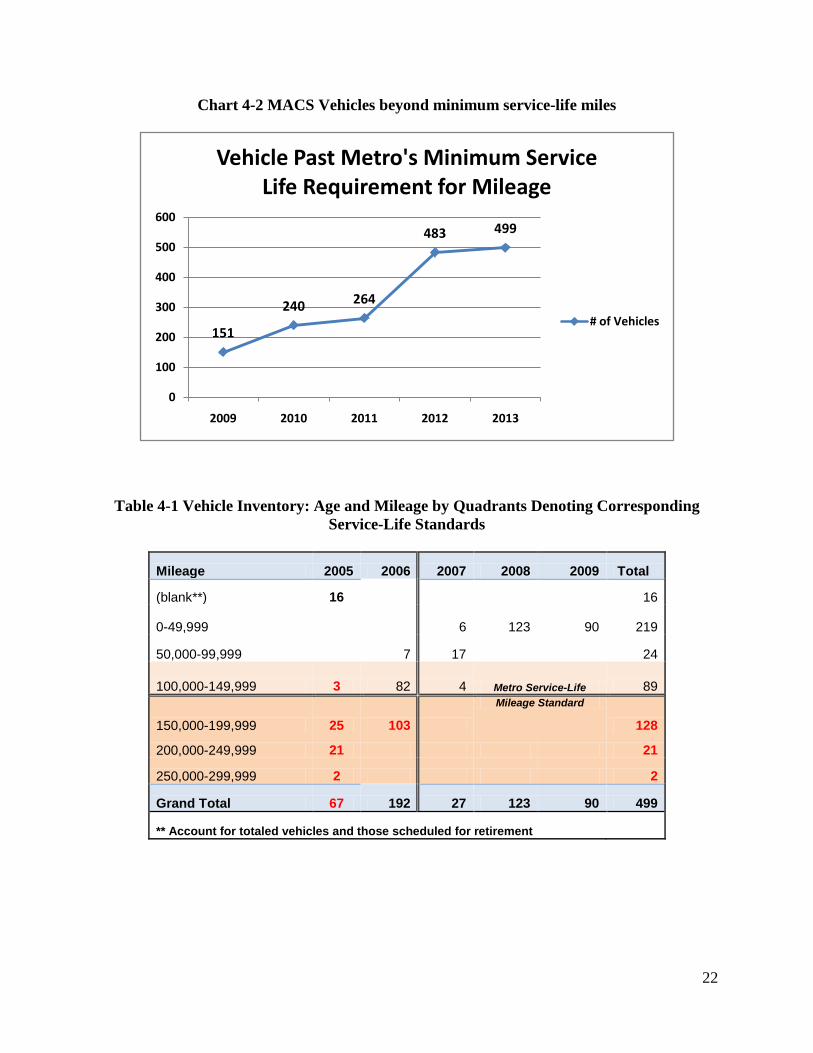
Vehicle Miles At an average rate of 45,000 miles per year, MACS fleet vehicles eclipse Metro’s minimum service-life requirement of 150,000 miles in 3.3 years. At this rate, within the current fleet, all vehicles surpass Metro’s minimum service-life requirement in FY 2011. Chart 4-3 and Table 4-1 provide a depiction and summary statistics of the accumulation of vehicles surpassing MACS minimum service-life requirement for vehicle miles throughout the duration of this revenue fleet plan. As of FY 2009, 259 vehicles are above the minimum requirement for age and 151 vehicles are above the minimum requirement for mileage.
13.4%
51.9% 57.3%
82.0%100.0%
0.0%
20.0%
40.0%
60.0%
80.0%
100.0%
120.0%
MACS Fleet FY
2009
MACS Fleet FY
2010
MACS Fleet FY
2011
MACS Fleet FY
2012
MACS Fleet FY
2013
% of Vehicles Past Metro Retirement Minimum for Age
One or more years past Metro retirement minimum for age
22
Chart 4-2 MACS Vehicles beyond minimum service-life miles
Table 4-1 Vehicle Inventory: Age and Mileage by Quadrants Denoting Corresponding Service-Life Standards
Mileage 2005 2006 2007 2008 2009 Total
(blank**) 16
16
0-49,999
6 123 90 219
50,000-99,999
7 17
24
100,000-149,999 3 82 4 Metro Service-Life 89
150,000-199,999 25 103
Mileage Standard
128
200,000-249,999 21 21
250,000-299,999 2 2
Grand Total 67 192 27 123 90 499
** Account for totaled vehicles and those scheduled for retirement
151
240 264
483 499
0
100
200
300
400
500
600
2009 2010 2011 2012 2013
Vehicle Past Metro's Minimum Service Life Requirement for Mileage
# of Vehicles
23
The Fleet In FY 2009, after the procurement of the 115 vehicles mentioned above, MACS active revenue fleet will consist of 499 vehicles. The vehicle inventory includes the vehicles used for revenue service, maintenance requirements, spares and training. The inventory will consist of 400 vans and 99 sedans. Approximately 38.48% of the fleet will be comprised of calendar year 2006 vehicles and the average age of the fleet will be approximately 2.05 years of age.
Table 4-2 FY 2009 Revenue Fleet
Vans Sedans Spare
Vehicles Spare Ratio
Total Fleet
400 99 43 9.4% 499
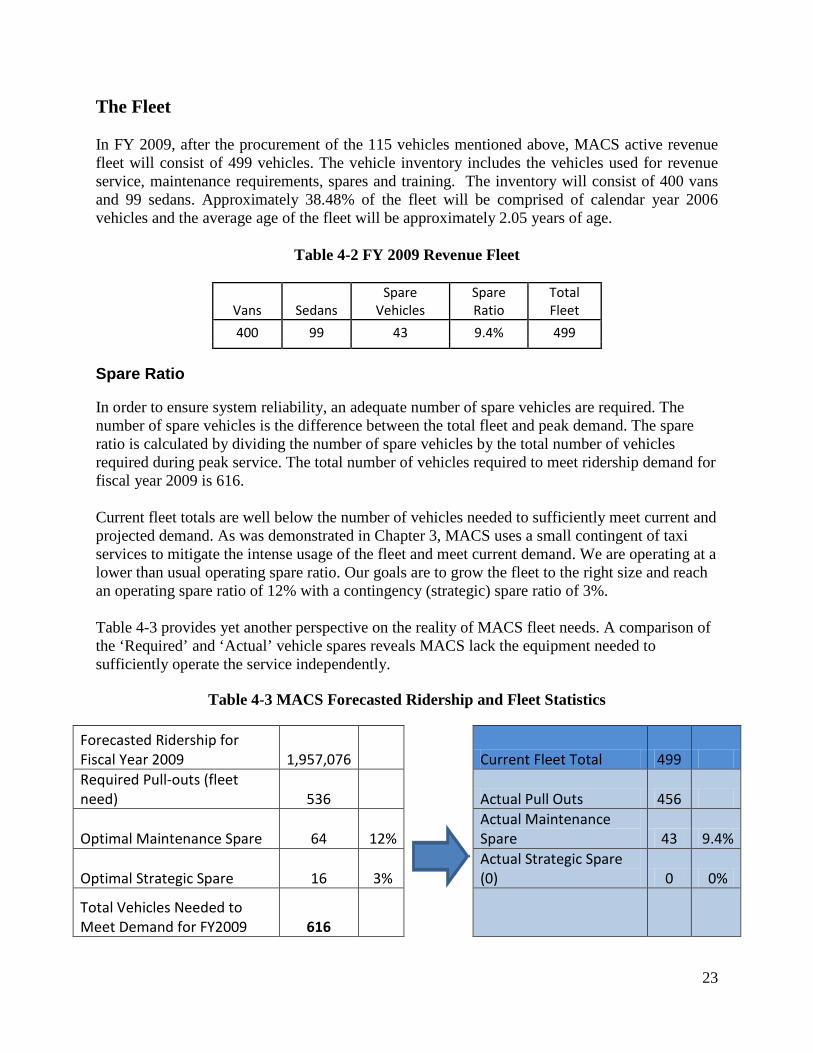
Spare Ratio In order to ensure system reliability, an adequate number of spare vehicles are required. The number of spare vehicles is the difference between the total fleet and peak demand. The spare ratio is calculated by dividing the number of spare vehicles by the total number of vehicles required during peak service. The total number of vehicles required to meet ridership demand for fiscal year 2009 is 616. Current fleet totals are well below the number of vehicles needed to sufficiently meet current and projected demand. As was demonstrated in Chapter 3, MACS uses a small contingent of taxi services to mitigate the intense usage of the fleet and meet current demand. We are operating at a lower than usual operating spare ratio. Our goals are to grow the fleet to the right size and reach an operating spare ratio of 12% with a contingency (strategic) spare ratio of 3%. Table 4-3 provides yet another perspective on the reality of MACS fleet needs. A comparison of the ‘Required’ and ‘Actual’ vehicle spares reveals MACS lack the equipment needed to sufficiently operate the service independently.
Table 4-3 MACS Forecasted Ridership and Fleet Statistics
Forecasted Ridership for Fiscal Year 2009 1,957,076
Current Fleet Total 499
Required Pull-outs (fleet need) 536
Actual Pull Outs 456
Optimal Maintenance Spare 64 12% Actual Maintenance Spare 43 9.4%
Optimal Strategic Spare 16 3% Actual Strategic Spare (0) 0 0%
Total Vehicles Needed to Meet Demand for FY2009 616
24
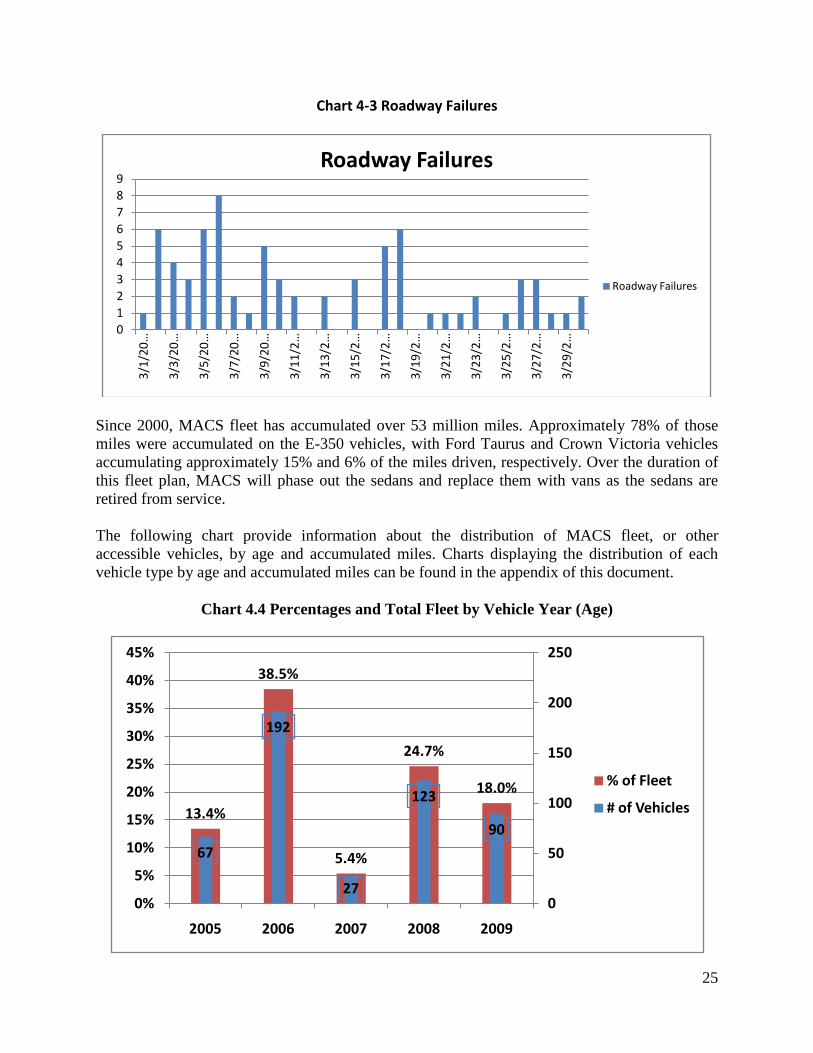
WMATA currently provides MACS service through a single prime contractor who is responsible for all phases of the current MACS operation. The scope of services includes, but is not limited providing and/or subcontracting for maintenance and parking, directly providing street operations, hiring and supervising, subcontracting with private providers and taxi companies for street operations and call center operations, IT support and all other work necessary for operation of ADA compliant paratransit service. WMATA’s contract provides for adjustments to be made in the number of vehicles provided, facilities required to operate and maintain the vehicles and maintenance requirements consistent with manufacturer recommendations. However, part of our long term strategy to address the maintenance issues associated with the growth mentioned in Section 3 is to plan for and move toward a network of Metro owned or controlled operations facilities. Although not necessary to deal with capacity to provide parking and maintenance, provided for under the contract, it is thought that Metro ownership would provide better overall long term management of the service. Vehicle Failure Definitions Safety is first in all operation decisions. Whenever there is an indication of a problem with safety-related equipment, the vehicle is removed from service. This action eliminates all known risks to passengers, and is consistent with WMATA’s System Safety Program Plan. Loose lug nuts, brake failures, engine overheat conditions, coolant system malfunction are examples of safety-related failures that require a vehicle to be removed from service immediately. In addition to safety related failures, MACS removes vehicles from service as a result of a number of situations. For example, if a vehicle is vandalized with significant graffiti or other major damage and if a vehicle is soiled by a sick passenger, it is removed from service immediately. Roadway Failures The ripple effect of a vehicle going down while in service can inconvenience paratransit clients whose trip is lengthened and travel experience is impacted negatively by circumstances that are at times beyond the control of all involved in providing the service. The feedback MACS receives in the form of passenger complaints is immediate. MetroAccess clients do not hesitate to let us know when the quality of service does not meet their high expectations. MACS tracks vehicle incidents daily, weekly and monthly. Chart 4-4 illustrates the number of road failures for the month of March 2009. The total number of road failure for this time period was 73 with an average of 2.5 per day.
25
Chart 4-3 Roadway Failures
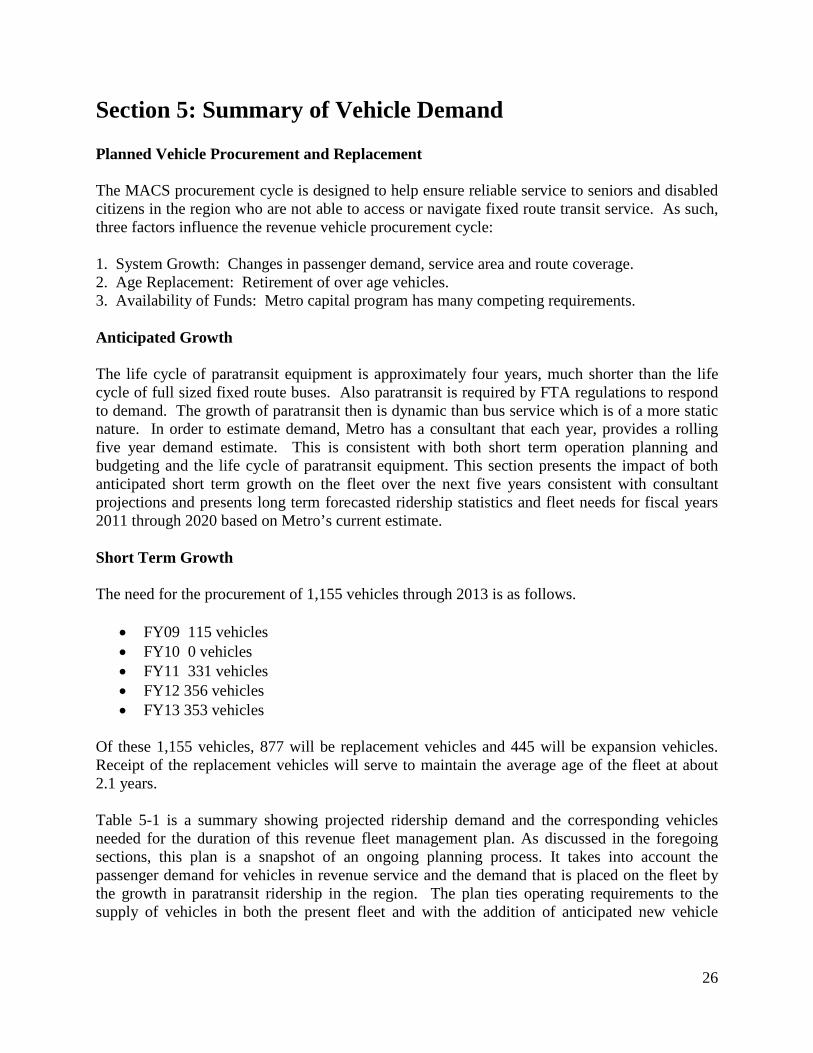
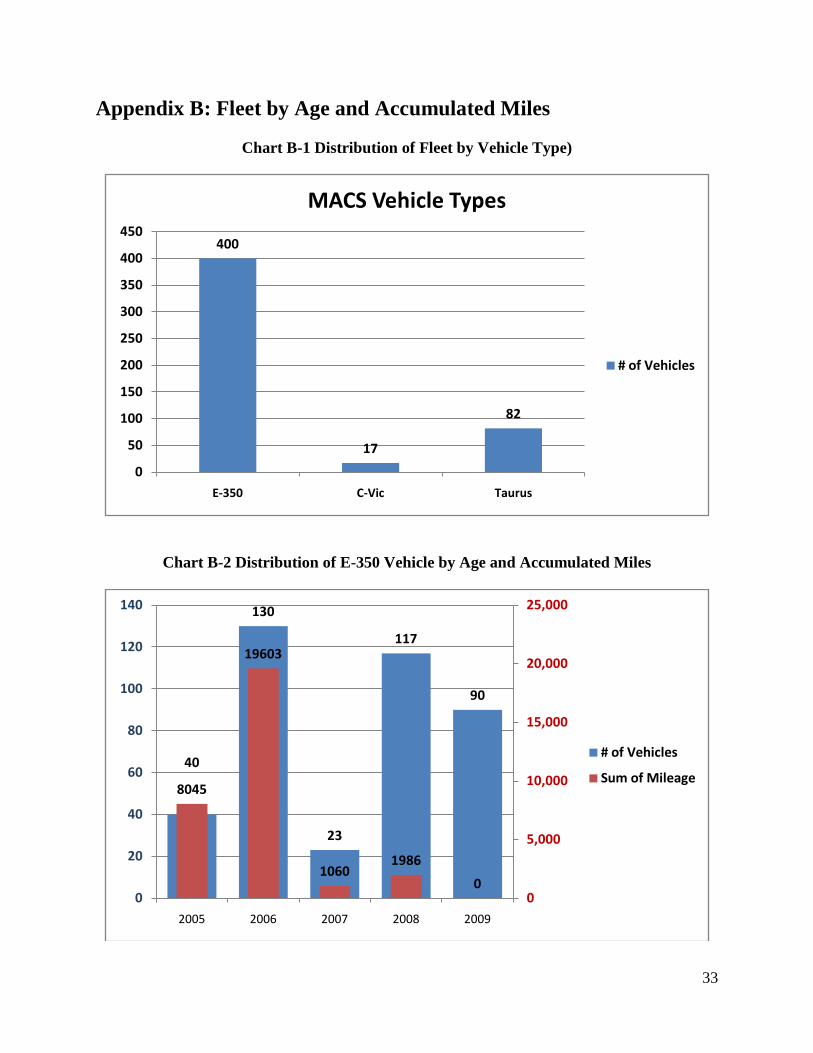
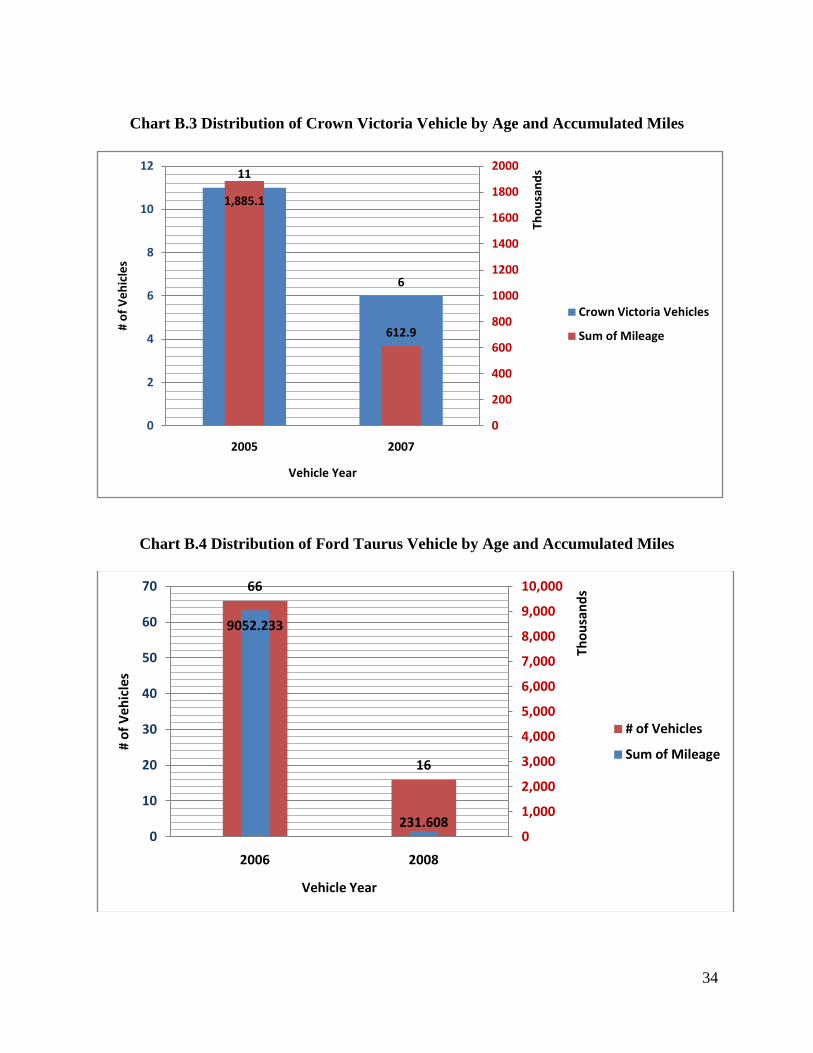
Since 2000, MACS fleet has accumulated over 53 million miles. Approximately 78% of those miles were accumulated on the E-350 vehicles, with Ford Taurus and Crown Victoria vehicles accumulating approximately 15% and 6% of the miles driven, respectively. Over the duration of this fleet plan, MACS will phase out the sedans and replace them with vans as the sedans are retired from service. The following chart provide information about the distribution of MACS fleet, or other accessible vehicles, by age and accumulated miles. Charts displaying the distribution of each vehicle type by age and accumulated miles can be found in the appendix of this document.
Chart 4.4 Percentages and Total Fleet by Vehicle Year (Age)
0123456789
3/1/
20…
3/3/
20…
3/5/
20…
3/7/
20…
3/9/
20…
3/11
/2…
3/13
/2…
3/15
/2…
3/17
/2…
3/19
/2…
3/21
/2…
3/23
/2…
3/25
/2…
3/27
/2…
3/29
/2…
Roadway Failures
Roadway Failures
13.4%
38.5%
5.4%
24.7%
18.0%
67
192
27
123
90
0
50
100
150
200
250
0%
5%
10%
15%
20%
25%
30%
35%
40%
45%
2005 2006 2007 2008 2009
% of Fleet
# of Vehicles
26
Section 5: Summary of Vehicle Demand Planned Vehicle Procurement and Replacement The MACS procurement cycle is designed to help ensure reliable service to seniors and disabled citizens in the region who are not able to access or navigate fixed route transit service. As such, three factors influence the revenue vehicle procurement cycle: 1. System Growth: Changes in passenger demand, service area and route coverage. 2. Age Replacement: Retirement of over age vehicles. 3. Availability of Funds: Metro capital program has many competing requirements.
Anticipated Growth The life cycle of paratransit equipment is approximately four years, much shorter than the life cycle of full sized fixed route buses. Also paratransit is required by FTA regulations to respond to demand. The growth of paratransit then is dynamic than bus service which is of a more static nature. In order to estimate demand, Metro has a consultant that each year, provides a rolling five year demand estimate. This is consistent with both short term operation planning and budgeting and the life cycle of paratransit equipment. This section presents the impact of both anticipated short term growth on the fleet over the next five years consistent with consultant projections and presents long term forecasted ridership statistics and fleet needs for fiscal years 2011 through 2020 based on Metro’s current estimate. Short Term Growth The need for the procurement of 1,155 vehicles through 2013 is as follows.
• FY09 115 vehicles • FY10 0 vehicles • FY11 331 vehicles • FY12 356 vehicles • FY13 353 vehicles
Of these 1,155 vehicles, 877 will be replacement vehicles and 445 will be expansion vehicles. Receipt of the replacement vehicles will serve to maintain the average age of the fleet at about 2.1 years. Table 5-1 is a summary showing projected ridership demand and the corresponding vehicles needed for the duration of this revenue fleet management plan. As discussed in the foregoing sections, this plan is a snapshot of an ongoing planning process. It takes into account the passenger demand for vehicles in revenue service and the demand that is placed on the fleet by the growth in paratransit ridership in the region. The plan ties operating requirements to the supply of vehicles in both the present fleet and with the addition of anticipated new vehicle
27
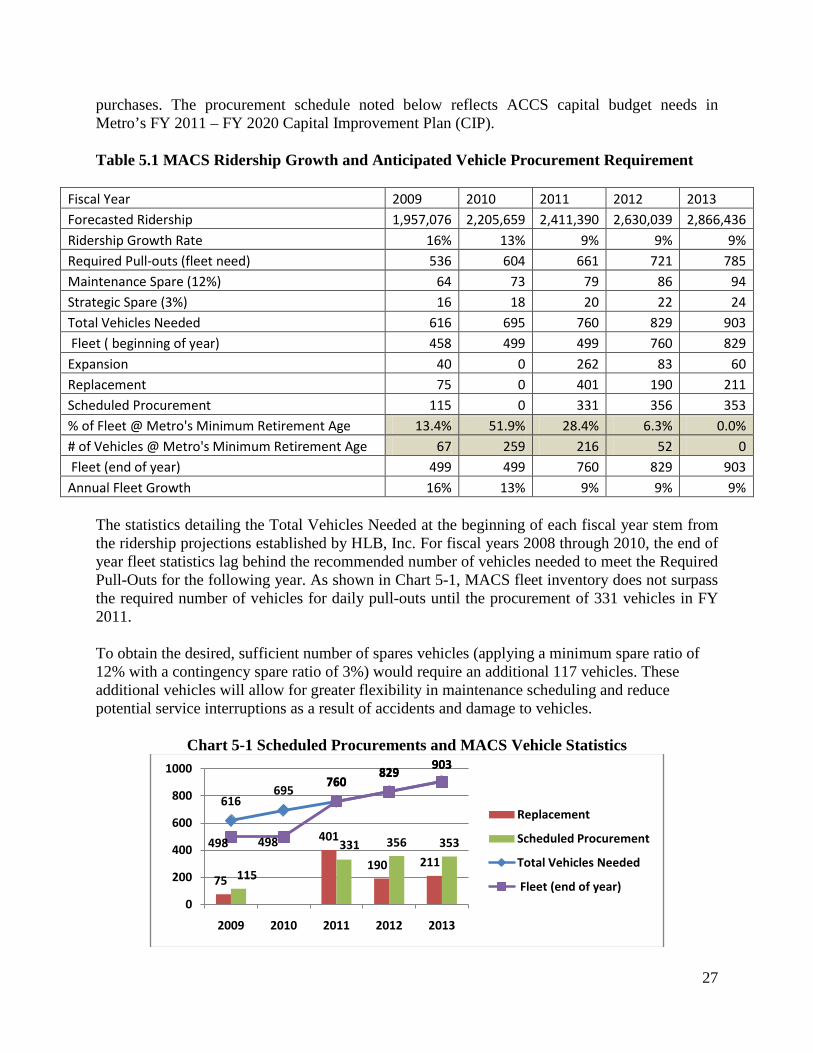
purchases. The procurement schedule noted below reflects ACCS capital budget needs in Metro’s FY 2011 – FY 2020 Capital Improvement Plan (CIP). Table 5.1 MACS Ridership Growth and Anticipated Vehicle Procurement Requirement
Fiscal Year 2009 2010 2011 2012 2013 Forecasted Ridership 1,957,076 2,205,659 2,411,390 2,630,039 2,866,436 Ridership Growth Rate 16% 13% 9% 9% 9% Required Pull-outs (fleet need) 536 604 661 721 785 Maintenance Spare (12%) 64 73 79 86 94 Strategic Spare (3%) 16 18 20 22 24 Total Vehicles Needed 616 695 760 829 903 Fleet ( beginning of year) 458 499 499 760 829 Expansion 40 0 262 83 60 Replacement 75 0 401 190 211 Scheduled Procurement 115 0 331 356 353 % of Fleet @ Metro's Minimum Retirement Age 13.4% 51.9% 28.4% 6.3% 0.0% # of Vehicles @ Metro's Minimum Retirement Age 67 259 216 52 0 Fleet (end of year) 499 499 760 829 903 Annual Fleet Growth 16% 13% 9% 9% 9%
The statistics detailing the Total Vehicles Needed at the beginning of each fiscal year stem from the ridership projections established by HLB, Inc. For fiscal years 2008 through 2010, the end of year fleet statistics lag behind the recommended number of vehicles needed to meet the Required Pull-Outs for the following year. As shown in Chart 5-1, MACS fleet inventory does not surpass the required number of vehicles for daily pull-outs until the procurement of 331 vehicles in FY 2011. To obtain the desired, sufficient number of spares vehicles (applying a minimum spare ratio of 12% with a contingency spare ratio of 3%) would require an additional 117 vehicles. These additional vehicles will allow for greater flexibility in maintenance scheduling and reduce potential service interruptions as a result of accidents and damage to vehicles.
Chart 5-1 Scheduled Procurements and MACS Vehicle Statistics
75
401
190 211115
331 356 353
616695
760829
903
498 498
760829
903
0
200
400
600
800
1000
2009 2010 2011 2012 2013
Replacement
Scheduled Procurement
Total Vehicles Needed
Fleet (end of year)
28
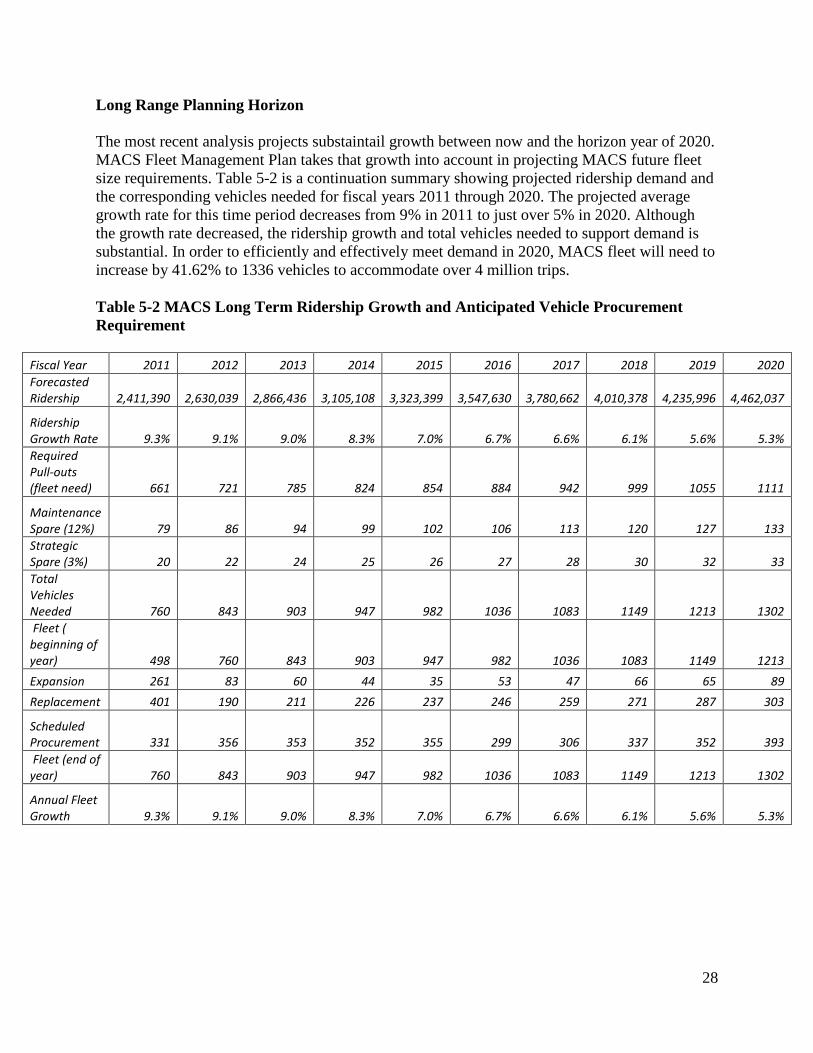
Long Range Planning Horizon The most recent analysis projects substaintail growth between now and the horizon year of 2020. MACS Fleet Management Plan takes that growth into account in projecting MACS future fleet size requirements. Table 5-2 is a continuation summary showing projected ridership demand and the corresponding vehicles needed for fiscal years 2011 through 2020. The projected average growth rate for this time period decreases from 9% in 2011 to just over 5% in 2020. Although the growth rate decreased, the ridership growth and total vehicles needed to support demand is substantial. In order to efficiently and effectively meet demand in 2020, MACS fleet will need to increase by 41.62% to 1336 vehicles to accommodate over 4 million trips. Table 5-2 MACS Long Term Ridership Growth and Anticipated Vehicle Procurement Requirement
Fiscal Year 2011 2012 2013 2014 2015 2016 2017 2018 2019 2020 Forecasted Ridership 2,411,390 2,630,039 2,866,436 3,105,108 3,323,399 3,547,630 3,780,662 4,010,378 4,235,996 4,462,037
Ridership Growth Rate 9.3% 9.1% 9.0% 8.3% 7.0% 6.7% 6.6% 6.1% 5.6% 5.3% Required Pull-outs (fleet need) 661 721 785 824 854 884 942 999 1055 1111
Maintenance Spare (12%) 79 86 94 99 102 106 113 120 127 133 Strategic Spare (3%) 20 22 24 25 26 27 28 30 32 33 Total Vehicles Needed 760 843 903 947 982 1036 1083 1149 1213 1302 Fleet ( beginning of year) 498 760 843 903 947 982 1036 1083 1149 1213
Expansion 261 83 60 44 35 53 47 66 65 89
Replacement 401 190 211 226 237 246 259 271 287 303
Scheduled Procurement 331 356 353 352 355 299 306 337 352 393 Fleet (end of year) 760 843 903 947 982 1036 1083 1149 1213 1302
Annual Fleet Growth 9.3% 9.1% 9.0% 8.3% 7.0% 6.7% 6.6% 6.1% 5.6% 5.3%
29
Conclusion The information, analysis and recommendations on the current and projected fleet requirements in this plan represent the commitment required to ensure sufficient, reliable and safe vehicles in order to provide a series of realistic short term improvements in the MACS fleet and to provide a high quality of service to our customers. Analysis of both Census Bureau data and Metro’s position in levels of fixed route and paratransit service relative to other large transit agencies indicate that MACS will undergo continued growth in service. This growth is consistent with prior growth history and confirmed by recent econometric ridership projections done by HLB, Inc. The phenomenon known as “load transferring” will have to be factored into future ridership projections if it is determined that MACS operations are impacted by additional passengers not considered in the HLB, Inc. analysis. ACCS management staff will monitor this situation closely and will determine if steps need to be taken to procure additional equipment to meet the transportation needs of HHS clients affected by federal reductions in transportation funds. Currently there are large numbers of MetroAccess vehicles whose service life will be exceeded within the next two years. Additionally, there are vehicles in the fleet that currently exceed FTA’s Service Life Minimums. Throughout the duration of the fleet plan, ridership is projected to increase from 1,957,076 in FY 2009 to well over 2.8 million passengers in FY 2013, requiring the procurement of 1,302 vehicles for growth, replacement and to ensure sufficient numbers of maintenance and operations spares. According to FTA Circular 9030.1C, a reasonable spare ratio should not exceed 20 percent of the vehicles operated in maximum service. MACS expects that a spare ratio of 12% with a contingency spare ratio of 3% is sufficient to provide required maintenance and servicing for the entire fleet. The current spare ratio is below industry standards and is insufficient to meet proper operations and maintenance requirements. The intense usage of MACS’ fleet and the challenges associated with MACS garages operating at, or beyond, capacity will continue at least until FY 2011 when the fleet inventory exceeds the number of vehicles required for daily pull-outs. ACCS is preparing to procure the vehicles noted in this plan in the next five years. The recommendations proposed in this plan will improve the mobility of seniors and disabled citizens in the region and improve the quality of life for those with mobility challenges. In conclusion, the plan lays out a process that responds to the growth of specialized transportation demand in the region; minimizes operating cost by capitalizing the fleet, and ensures reliable service by keeping the average age of the fleet at/or below FTA standards. As

30
Metro implements this plan, MACS will be in a position to carry over 40% more passengers over the next 5 years efficiently and reliably. This ultimately positions Metro to be the best ride in the nation.
31
Appendix A: Growing Interest of Specialized Transportation Services in the Washington D.C. Region
• In December 2002, Metro contracted with WB&A (formally known as Widener-Burrows and Associates) to conduct a MACS Customer Satisfaction Survey. Of the five MACS services measured, the Application Process and the ability of MACS operators to arrive at an appointment on time received the lowest satisfaction scores.
• In September 2003, MACS Cost Containment Strategy was presented to Metro’s Board of Directors.
• In December 2003, Metro commissioned the KFH Group to initiate the Specialized
Transportation Study to provide information, analysis and recommendations on the cost effectiveness of the MACS delivery system. In addition, the study was designed to work with a Regional Task Force to compile information needed to work towards regional coordination of paratransit services and identify available coordination options.
• In October 2004, the Access for All (AFA) Advisory Committee of the National Capital Region Transportation Planning Board (TPB) sponsored the Disability Awareness Day event to highlight the transportation challenges faced by people with disabilities.
• During the months of April and December 2005, the study, “Improving Demand Responsive Services for People with Disabilities in the Washington Region” was commissioned by TPB and Metro.
• In January 2006, MACS changed contactors from LogistiCare to MV Transportation. Afterwards, a series of press releases document the transition and ensuing service improvements.
• Metro Board created the Ad Hoc MetroAccess Advisory Committee as part of its efforts to improve the service on February 23rd, 2006. Numerous improvements identified by Metro staff, the Ad Hoc Committee and consultants were implemented.
• In December 2006, Metro’s Board approved more than $6 million in improvements for MetroAccess, including switching from curb-to-curb to door-to-door service.
• Metro’s Department of Access Services hosted a Disability Awareness Event and Forum on Accessible Transportation Options for People with Disabilities on Wednesday, November 28, 2007. Members of the Metro Board of Directors and the General Manager, Deputy General Manager and Assistant General Managers of Bus, Rail and ACCS were each paired with a customer with a disability from his or her jurisdiction. Each team traveled together on Metrobus, Metrorail or MACS from their local jurisdiction to Metro Headquarters for the Forum. Important goals of the Forum were to raise awareness of the critical role that accessible public transportation plays in the lives of people with
32
disabilities and to recognize that universal access benefits all customers while traveling on Metro.
• In June 2008, as a follow up to the Improving Demand Responsive Services for People with Disabilities in the Washington Region study, TPB and Metro commissioned Transystems, Inc. and the KFH Group to conduct an assessment of MACS operations. The report recognized significant improvements to MACS since the 2006 study but acknowledged that the HLB ridership projections highlight the need for systematic planning of fleet expansion.
33
Appendix B: Fleet by Age and Accumulated Miles
Chart B-1 Distribution of Fleet by Vehicle Type)
Chart B-2 Distribution of E-350 Vehicle by Age and Accumulated Miles
400
17
82
0
50
100
150
200
250
300
350
400
450
E-350 C-Vic Taurus
MACS Vehicle Types
# of Vehicles
40
130
23
117
90
8045
19603
10601986
00
5,000
10,000
15,000
20,000
25,000
0
20
40
60
80
100
120
140
2005 2006 2007 2008 2009
# of Vehicles
Sum of Mileage
34
Chart B.3 Distribution of Crown Victoria Vehicle by Age and Accumulated Miles
Chart B.4 Distribution of Ford Taurus Vehicle by Age and Accumulated Miles
11
6
1,885.1
612.9
0
200
400
600
800
1000
1200
1400
1600
1800
2000
0
2
4
6
8
10
12
2005 2007
Thou
sand
s
# of
Veh
icle
s
Vehicle Year
Crown Victoria Vehicles
Sum of Mileage
66
16
9052.233
231.6080
1,000
2,000
3,000
4,000
5,000
6,000
7,000
8,000
9,000
10,000
0
10
20
30
40
50
60
70
2006 2008
Thou
sand
s
# of
Veh
icle
s
Vehicle Year
# of Vehicles
Sum of Mileage
35
Glossary ACCS: Metro’s Department of Access Services Americans with Disabilities Act of 1990 (ADA): The ADA is a wide-ranging civil rights law that prohibits, under certain circumstances, discrimination based on disability. American Public Transportation Association (APTA): APTA serves as an advocate for the advancement of public transportation programs and initiatives in the United States. Since its founding in 1882, APTA has educated the public about the benefits of public transportation through organized bus, light rail, rapid transit and other programs. It lobbies Congress and local government bodies in favor of public transportation improvements and new developments. Base Period: The time period between the morning and evening peak periods when transit service is generally scheduled on a constant interval; also known as "off-peak period". Disability: a lack of ability relative to a personal or group standard. Disability may involve physical impairment, sensory impairment, cognitive or intellectual impairment, mental disorder (also known as psychiatric disability), or various types of chronic disease. A disability may occur during a person's lifetime or may be present from birth. Developmental Disability: a term used to describe life-long disabilities attributable to mental and/or physical or combination of mental and physical impairments, manifested prior to age twenty-two. The term is used most commonly to refer to disabilities affecting daily functioning in three or more of the following areas:
• capacity for independent living • economic self-sufficiency • learning • mobility • receptive and expressive language • self-care • self-direction
Department of Health and Human Services: a Cabinet department of the United States government with the goal of protecting the health of all Americans and providing essential human services. Federal Transit Administration: an agency within the United States Department of Transportation (DOT) that provides financial and technical assistance to local public transit systems. The FTA is one of ten modal administrations within the DOT. MetroAccess (MACS): a shared ride, door-to-door paratransit service for people who cannot use public transportation due to a disability. Metropolitan Washington Council of Governments (MWCOG): a regional consortium of local governments in the Washington D.C. metropolitan area. MWCOG also has members from
36
the Maryland and Virginia state governments, as well as the United States Congress which has jurisdiction over the District of Columbia. MWCOG is focused on regional issues including economic development, transportation, public safety, and the environment. National Transit Database: is the Federal Transit Administration's (FTA's) primary national database for statistics on the transit industry. Paratransit: Comparable transportation service required by the ADA for people with disabilities who are unable to use fixed-route transportation systems. (APTA)
Paratransit Eligibility: Paratransit eligibility relates to whether or not an individual can use the transportation entity’s fixed route system. Thus, eligibility is a functional determination of a person’s ability to use the regular transit system as it currently exists, and not simply a medical or psychiatric diagnosis.
Peak Period: Morning and afternoon time periods when transit riding is heaviest. Peak Vehicle Requirement - Those vehicles that are necessary to provide the minimum amount of service designated for the peak hour or peak period. Peak/Base Ratio: The number of vehicles operated in passenger service during the peak period divided by the number operated during the base (off-peak) period. Washington Metropolitan Area Transit Authority (Metro) Compact area: The Metro transit zone that consists of the District of Columbia, the suburban Maryland counties of Montgomery and Prince George’s and the Northern Virginia counties of Arlington, Fairfax and Loudoun and the cities of Alexandria, Fairfax and Falls Church.