methanosarcinaceae and acetate-oxidizing pathways dominate in high-rate thermophilic anaerobic...
TRANSCRIPT

1
Methanosarcinaceae and acetate oxidising pathways 1
dominate in high-rate thermophilic anaerobic 2
digestion of waste activated sludge 3
Dang P. Ho, Paul D. Jensen, Damien J. Batstone* 4
Advanced Water Management Centre, The University of Queensland, St Lucia, QLD 4072, 5
Australia 6
(E-mails: [email protected]; [email protected]; [email protected]) 7
8
ABSTRACT 9
This study investigates the process of high rate, high temperature methanogenesis to enable 10
very high volumetric loading during anaerobic digestion of waste activated sludge. Reducing 11
the HRT from 15-20 days in mesophilic digestion down to 3 days was achievable at a 12
thermophilic temperature (55 oC) with stable digester performance and methanogenic activity. 13
A volatile solids (VS) destruction of 33-35% was achieved on waste activated sludge, 14
comparable to mesophilic processes with low organic acid levels (<200 mg/L COD). Methane 15
yield (VS basis) was 150-180 LCH4/kgVSadded. According to 16S rRNA pyrotag sequencing 16
and FISH the methanogenic community was dominated by Methanosarcinaceae, which have a 17
high level of metabolic capability, including acetoclastic and hydrogenotrophic 18
methanogenesis. Loss of function at two days HRT was accompanied by a loss of the 19
methanogens according to pyrotag sequencing. The two acetate conversion pathways namely 20
AEM Accepts, published online ahead of print on 16 August 2013Appl. Environ. Microbiol. doi:10.1128/AEM.01730-13Copyright © 2013, American Society for Microbiology. All Rights Reserved.

2
acetoclastic methanogenesis and syntrophic acetate oxidation were quantified by stable carbon 21
isotope ratio mass spectrometry. The results showed that the majority of methane was 22
generated by non-acetoclastic pathways, both in the reactors, and in off-line batch tests 23
confirming that syntrophic acetate-oxidation is a key pathway at elevated temperatures. The 24
proportion of methane due to acetate cleavage increased later in the batch, and it is likely that 25
stable oxidation in the continuous reactor was maintained by application of the consistently 26
low retention time. 27

3
INTRODUCTION 28
Anaerobic digestion (AD) is a biological process which has been widely used for waste 29
activated sludge and primary sludge stabilisation. It offers substantial advantages over 30
alternative stabilisation techniques, including low energy requirements, good quality biosolids 31
product, energy recovery in the form of methane (CH4) gas, and the possibility of nutrient 32
recovery (1),(2). Conventional anaerobic digesters are operated at mesophilic temperature (35 33
ºC) with a long hydraulic retention time (HRT) of 15-20 days on waste activated sludge 34
(WAS), which is excess bacterial material and residual organics from combined aerobic 35
treatment of wastewater, and more than 20 days on primary sludge (PS), which is the settled 36
fraction from raw wastewater (3),(4). Long treatment times are a key disadvantage of anaerobic 37
digestion requiring large tank volumes and consequently, high capital cost, as well as increased 38
mixing and maintenance costs. Therefore, reducing digester volume would strongly enhance 39
the competitiveness of anaerobic technologies. 40
Thermophilic anaerobic digestion (55 ºC-70 ºC) is an alternative to conventional mesophilic 41
anaerobic digestion (35 °C). The majority of systems are operated at 55 °C (5),(6) as higher 42
temperatures can result in instability due to ammonia inhibition and reduced operability (2). 43
Thermophilic anaerobic digestion offers higher destruction of pathogens and organic solids as 44
well as potentially enhances methane production. Several studies have shown that 45
improvements in performance in thermophilic digestion are mainly due to an increase in 46
hydrolysis coefficient (7),(8),(9), which determines speed of degradation, rather than due to an 47
increase in the fraction of degradable material. In addition to this advantage, the growth rates of 48
thermophilic methanogens are 2-3 times higher than those of mesophilic methanogens (10). 49
Therefore, the HRT can theoretically be reduced to 5-8 days at 55 ºC. Recent studies have 50
reported substantial methanogenic activities at a short HRT of 2-4 days in the thermophilic pre-51

4
treatment stage of a two-stage temperature phased anaerobic digestion (TPAD) (11) when fed 52
activated sludge. 53
The main risk with a short HRT is washout of methanogens as well as other functional 54
groups, causing build-up of organic acids and a decreased pH (12). A key concern of elevated 55
temperatures is the decrease in pKa of the ammonium/ammonia (NH4+/NH3) acid-base pair, 56
which means the NH3 concentration will be 2-3 times higher for a given pH, potentially 57
causing ammonia inhibition (1-2 mM) (2). 58
The microbial composition and distribution in anaerobic digesters has been the focus of 59
recent studies using high throughput molecular techniques. The bacterial and archaeal 60
community structures are highly diverse and affected by substrate composition (6),(13),(14), 61
HRT (12) and operating temperature (6),(15). Two methanogenic pathways from acetate have 62
been reported including (i) direct acetate cleavage in acetoclastic methanogenic archaea, such 63
as Methanosarcina and Methanosaeta and (ii) non-acetoclastic oxidation, i.e., the syntrophic 64
association of acetate-oxidizing organisms and hydrogenotrophic methanogens including 65
Methanobacteriales (5),(16). The latter involves interspecies electron transfer, in which acetate 66
oxidisers transfer electrons through an electron carrier such as hydrogen or formate (17) while 67
maintaining the concentration of the electron carrier low (18). Increase in temperature leads to 68
thermodynamic favorability of the oxidation component of the process (19),(20). Hypothesized 69
mechanisms such as direct interspecies electron transfer (17),(21) would be similarly enhanced 70
through enhancement of the oxidation component. Next generation pyrosequencing has further 71
clarified methanogenic populations in thermophilic systems (6),(15), confirming broad 72
diversity, but generally an increased dominance of Methanosarcina over Methanosaeta 73
compared to mesophilic systems. 74

5
The relative contribution to methanogenesis via the different metabolic pathways can be 75
determined using the stable isotopic signatures of 13C/12C. The technique has been used mostly 76
to study biogenic methane formation in anoxic environments and has shown that production of 77
δCH4 from reduction of CO2 exhibits larger fractionation than that from cleavage of acetate 78
(22),(23). In an anaerobic digester context, it can be used to study the relative contribution 79
from acetate cleavage and oxidation, with oxidation resulting in a lower 13CH4 isotopic 80
signature (δ13CH4) due to differential partitioning of bicarbonate to methane during 81
hydrogenotrophic methanogenesis (23). 82
In this paper, we determined the potential of high-rate, high temperature methanogenic 83
digestion as a replacement technology for conventional mesophilic digestion of organic solids 84
at the most commonly applied thermophilic temperature of 55 °C. The analysis was based on 85
operation of laboratory scale continuous anaerobic digesters operating on waste activated 86
sludge (WAS) for approximately one year. HRT was reduced to 2-4 days in order to determine 87
the limitation of methanogenesis. Analytical techniques focused on identifying kinetic 88
capacity, limits, mechanism, and identity of the functional digester and its community for 89
thermophilic anaerobic digestion. 90
MATERIALS AND METHODS 91
Substrate 92
Substrate was biological nutrient removal (BNR) waste activated sludge (WAS) (10-day 93
aerobic sludge age) collected from Elanora wastewater treatment plant, located at Gold Coast, 94
Australia. The feed was thickened to obtain total solids (TS) of 2-3% and stored at 95
approximately 4 °C prior to feeding to minimise degradation and preserve integrity of the 96
material. Seed sludge was collected from a mesophilic anaerobic digester from the Oxley 97

6
Creek wastewater treatment plant in Brisbane, Australia. Thickened WAS was fed to each 98
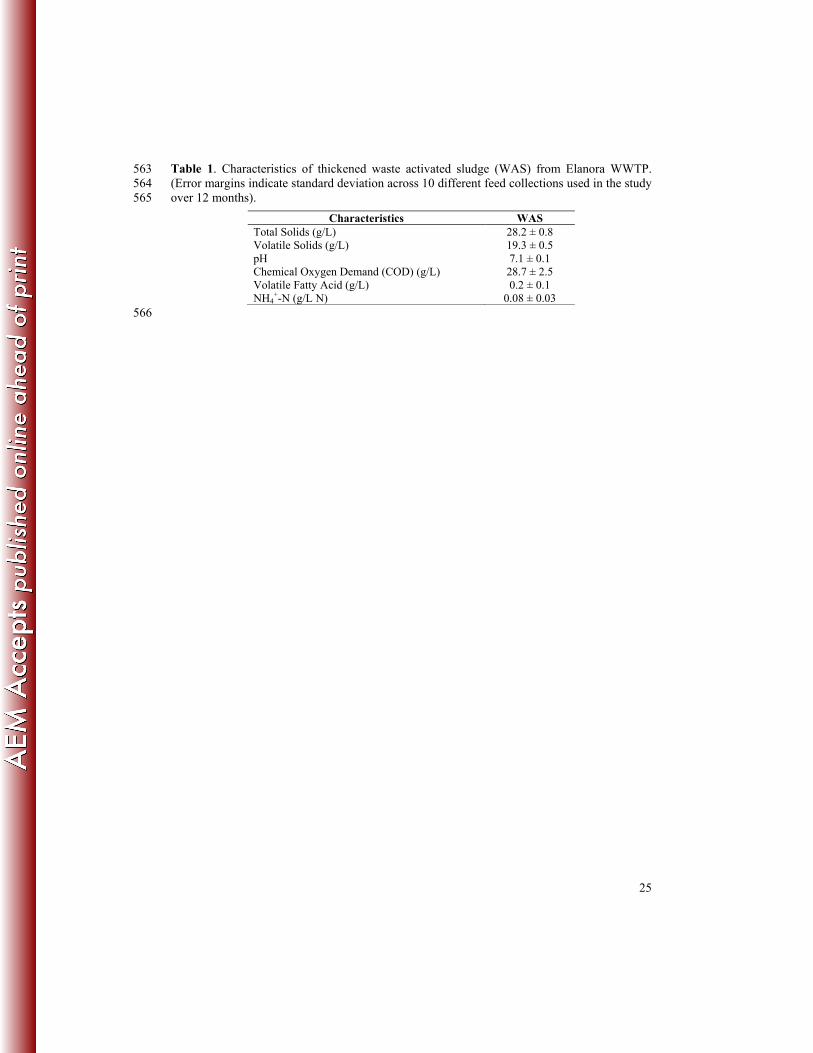
single stage reactor in a short pulse every four hours. The average characteristics of WAS are 99
shown in Table 1. 100
Experimental set up and operational protocol 101
The experimental platform consisted of two single stage thermophilic reactors (1 L working 102
volume) operated in a semi-continuous mode at the temperature of 55 oC and neutral pH 103
(Figure 1). One reactor served as a control and was operated at constant hydraulic retention 104
time (HRT) of 4 days throughout the experimental programme; the second reactor acted as an 105
experimental system with HRT as the experimental variable. Reactor temperature was 106
controlled by circulating hot water inside the reactors’ water jackets from a water bath 107
maintained at 55 oC. Reactors were fed at intervals of 4 hours (6 times daily). During feed 108
events, fresh feed sludge was added to the reactors and an equal volume of effluent was 109
withdrawn simultaneously using multi-head peristaltic pump. The experimental reactors were 110
operated at three HRTs, starting from 4-day to 2-day HRT and ran for a total of 350 days: 111
(I) 4-day HRT (200 days) 112
(II) 3-day HRT (100 days) 113
(III) 2-day HRT (50 days) 114
Biogas and volumetric methane production rates, pH, volatile fatty acids (VFAs) and 115
volatile solid (VS) destruction were closely monitored to evaluate process performance. 116
Analytical methods 117
Digestate was collected from each reactor three times per week for chemical analyses including 118
total solids (TS), volatile solids (VS), volatile fatty acid (VFA), chemical oxygen demand 119
(COD) and ammonium–nitrogen (NH4+-N). Analysis followed Standard Methods (24). Biogas 120

7
volume was measured daily from each reactor using tipping bucket gas meters and 121
continuously logged online, while gas composition (H2, CO2 and CH4) was determined using a 122
Perkin Elmer gas chromatograph (GC) equipped with thermal conductivity detector (GC-123
TCD). 124
VS destruction 125
The two calculation methods used to determine VS destruction were the Van Kleeck equation 126
and the mass balance equation. The Van Kleeck equation (Eq. 1) assumes the amount of 127
mineral solids is conserved during digestion (25), and uses the volatile fractions (VS/TS – 128
VSfrac) in the inlet and outlet as references. 129
VS destruction % = x 100 (Eq. 1) 130
where VSfraci and VSfrac0 are volatile fraction (VS/TS) in the inlet and outlet solids, 131
respectively. 132
The mass balance equation (Eq. 2) uses VS concentrations in the inlet (feed) and outlet 133
(effluent), expressed as 134
VS destruction % = x 100 (Eq. 2) 135
where VSconci and VSconc0 are VS concentrations (g/L) of inlet and outlet, respectively. 136
In addition, batch biochemical degradability tests (BMPs) were conducted on inlet and 137
outlet to provide an independent assessment of process performance while specific 138
methanogenic activity (SMA) tests were performed to evaluate the specific function of 139
microbial communities within the continuous digesters. The test protocols are listed below. 140
Assay for residual biochemical methane potential 141
Biochemical methane potential (BMP) tests were employed to determine the residual methane 142
potential from digestion residues and assess the stability of the effluent. The method is based 143

8
on Angelidaki et al. (26). Batch digestions were performed in 160 ml non-stirred glass serum 144
bottles (100 ml working volume) at 37 oC. Inoculum was collected from a mesophilic 145
anaerobic digester operating at a municipal wastewater treatment plant in Brisbane, Australia. 146
Substrates used in the BMP tests were digestates collected from the thermophilic reactors on 147
day 137, day 249, and day 323, respectively. The inoculum to substrate ratio used in the BMP 148
test was 1:1 (VS basis). All tests were carried out in triplicate, triplicate blanks were conducted 149
to correct for background methane from the inoculums. Error bars represent 95% confidence in 150
error based on the average of the triplicate (two-tailed t-test). 151
The key kinetic parameters of BMP test are degradation extent (fd) which is the fraction of 152
the substrate that may be converted to methane and apparent first order hydrolysis rate 153
coefficient (khyd), which determines speed of degradation. The parameters fd and khyd were 154
estimated by optimising fd and khyd in a simple first order model through Aquasim 2.1d as done 155
in the batch tests presented in Batstone et al. (27). 156
Continuous Modeling 157
Continuous reactor modeling was done to determine that measures of degradability sourced 158
through BMP were representative of reactor performance. The test continuous reactor was 159
modeled using the IWA ADM1 (28) in Aquasim 2.1d, the WAS interface model of Nopens et 160
al. (29), the observed COD:VS ratios as given in Table 1, and measured biomass nitrogen 161
content. Input material degradability (fd) and hydrolysis coefficient (khyd) were simultaneously 162
estimated using both gas flow and effluent solids concentration (two parameter searches were 163
done), using secant searches, with parameter uncertainty reported as linear uncorrelated 164
estimates of 95% confidence regions based on two tailed t-tests. Model source files are 165
available from the corresponding author on request. 166

9
Specific methanogenic activity (SMA) tests 167
Methanogenic activity tests were performed in non-stirred, 160 ml serum bottles incubated at 168
55 ºC. Each bottle contained 10 ml inoculum and 90 ml basic anaerobic (BA) medium (100 ml 169
total liquid volume). BA medium was prepared according to Angelidaki et al. (26) while 170
inoculum was harvested from the continuous thermophilic reactors during the steady state, 171
particularly at day 137 (period I), day 270 (period II) and day 342 (period III). Sodium acetate 172
and sodium formate were added as the substrates to concentrations of 3 g/L and 6 g/L, 173
respectively to determine acetoclastic and hydrogenotrophic activity. Blanks contained 174
inoculum and medium without the substrate. Formate was chosen as an alternative source of 175
electron donor to H2 in the reduction of CO2 since they are thermodynamically and 176
stoichiometrically similar (30). All bottles were flushed with high purity N2 gas for 3 min (1 177
L/min), sealed with a rubber stopper retained with an aluminum crimp-cap and stored in 178
temperature controlled incubators at 55 oC (±1 oC). All tests were carried out in triplicates, and 179
all error bars indicate 95% confidence in the average of the triplicate. Gas production, 180
composition and substrate contents were monitored throughout the experimental period. 181
Specific methanogenic activity was determined by regression against the linear section of the 182
methane evolution curve. 183
Stable carbon isotopic signature 184
The gas samples for stable carbon isotopic analysis of δ13CH4 and δ13CO2 were collected in a 185
time series in 5 ml exetainers during the SMA tests. The principle of 13C/12C fractionation is 186
discussed in Conrad (31). Isotopic fractionation evaluates enrichment of one isotope relative to 187
another in specific products and infers the generation pathway based on partitioning through 188
the metabolic process. The fraction of CH4 produced from CO2 reduction pathway to total CH4, 189
fmc is calculated as follow: 190

10
fmc = (δCH4 – δma)/(δmc – δma) (Eq. 3) 191
with δCH4 is the measured variable, δma and δmc are isotopic values of acetate-derived CH4 and 192
CO2-derived CH4, respectively. 193
Generally, microbes preferentially utilise 12C compounds over 13C compounds (23). 194
According to the literature, hydrogenotrophic methanogenesis exhibits a significantly larger 195
fractionation factor than that of acetate-dependent methanogenesis due to the ability to select 196
12C preferentially during methanogenesis (31),(32). The fractionation values measured in pure 197
cultures of CO2-reducers (hydrogen utilisers) range between 1.031 and 1.077 and from 1.007 to 198
1.027 for the acetoclastic pathway (31). The apparent fractionation (α) can be calculated as 199
α = COCH (Eq. 4) 200
The relative contributions of acetate-derived CH4 (δma) and CO2-derived CH4 (δmc) to total 201
CH4 (δCH4) can be quantified using the following mass balance equation: 202
δCH4 = fmcδmc + (1-fmc)δma (Eq. 5) 203
Thus, fmc is solved by: 204
fmc = (δCH4 – δma)/(δmc – δma) (Eq. 6) 205
δma was chosen at an average value of -33‰ according to reference (31) whereas δmc was 206
chosen based on the dominant acetoclastic methanogens obtained from the pyrotag sequencing 207
results. 208
The analyses of isotopic signatures were performed using an Isoprime Gas Chromatograph 209
Combustion Isotope Ratio Mass Spectrometer (GC-c-IRMS) linked to an Agilent 7890A gas 210
chromatograph with a CP-Poraplot Q column (50 m x 0.32 mm), with helium as the carrier gas. 211
A CO2/CH4 (1:1) gas mixture standard (δ13CO2 = -18.76‰ and δ13CH4 = -40.14‰) was 212
injected before and after gas analysis. Each sample was run in duplicate and all reported δ13C 213
values have a precision with an average standard deviation of 0.3‰. 214

11
Molecular analysis 215
The analysis of microbial community structure and diversity were determined at stable 216
operation using FISH and 16S rRNA gene pyrosequencing. FISH was performed as described 217
in Amann et al. (33). FISH preparations were visualized with a Zeiss LSM 510 Meta confocal 218
laser-scanning microscope (CLSM) using three excitation channels (488 nm, green emission, 219
545 nm, red emission and 633 nm, blue emission). FISH probes used in this study included 220
Eub338mix (5’- GCTGCCTCCCGTAGGAGT-3’) probes for most Bacteria (34), Arc915 (5’-221
GTGCTCCCCCG CCAATTCCT-3’) probes for most Archaea (35), Sarci551 (5’-222
GACCCAATAATCACG ATCAC-3’) for genus Methanosarcina (36), and Ttoga660 (5’-223
GTTCCGTCTCCCTCTACC-3’) for order Thermotogales (37). 224
Genomic DNA was extracted from the dewatered pellets using a FastDNA® Spin kit for 225
soil. The quantity and quality of the extracted DNA was measured using a NanoDrop ND-1000 226
spectrophotometer (NanoDrop Technology, Rockland, DE) and agarose gel (0.8%, w/v) 227
electrophoresis. The primers used for pyrotag sequencing were 962f (5’-AAACTYAA 228
AKGAATTGACGG-3’) and 1392r (5’-ACGGGCGGTGT-GTAC-3’) (33). 16S rRNA gene 229
pyrosequencing was carried out according to Roche 454 protocols using a Roche 454 GS FLX 230
sequencer (Roche, Switzerland). Sequences that were shorter than 350 bp in length and reads 231
containing any unresolved nucleotides were removed from the pyrosequencing-derived 232
datasets. Operational taxonomic units (OTUs) were determined for each denoised sequence 233
dataset by using the uclust OTU picker version 1.2.21q of the QIIME software pipeline (38). 234
RESULTS 235
Reactor performance 236

12
Process performance of both control and experimental reactors were evaluated by VS 237
destruction, production of methane and organic acids levels. Figure 2 shows fluctuating VS 238
destruction for the control reactor at an average of 33-35% using both mass balance and Van 239
Kleeck equations, indicating consistency between the two measures. While VS destruction 240
showed some variation, this is to be expected where the analysis is momentary. The 241
performance of the test reactor was comparable to that of the control across the first two 242
periods when HRT was reduced from 4 days to 3 days. However, at 2-day HRT, VS 243
destruction varied greatly between the two methods, indicating non-steady state issues. 244
In most cases, H2 was not detected (and therefore below the detection limit of 0.1%) while 245
CH4 accounted for more than 60% of biogas composition and 30% for CO2. Total methane 246
production obtained during the 4-day and 3-day HRT periods were relatively similar and 247
ranged between 150-180 L CH4/kgVSadded as shown in Figure 3. However, gas production 248
decreased by 30% with the HRT shortened further to 2 days. The key measure to determine 249
process stability was VFA concentration as shown in Table 2. The concentrations of C2-C4 250
VFAs were low (<200 mg/L COD) at 4-day HRT in both the control and test reactors, then 251
increased consistently to approximately 500 mg/L COD at shorter HRTs (Table 2). pH values 252
of the digesters decreased from 7.04 at 4-day HRT to 6.89 at 3-day HRT and varied in the 253
range of 6.74-7.04 during the 2-day HRT. The ammonia concentrations in both digesters varied 254
in the range of 700-1000 mg/L and were not affected by changes in HRT. 255
Digestate degradability 256
The digestates produced at different HRTs were assessed using BMP tests. A summary of the 257
hydrolysis rate coefficients and degradability fractions determined using the non-linear 258
parameter estimation method is shown in Table 3, while the cumulative methane production 259
are shown in Figure 4. The degradability of feed sludge was estimated at approximately 41% 260

13
with an average gas production of 210-230 L CH4/kgVSadded over 40-day incubation. The 261
values were in agreement with previous studies (4),(7). 262
Figure 5 shows analysis of residual methane potential of the digestates collected from each 263
reactor as compared to that of feed sludge. Recalcitrant component is based on the material not 264
converted to methane (1-fd). The material calculated as destroyed in reactors is the difference 265
between feed and digestate potentials. This showed that the 4-day and 3-day HRT continuous 266
thermophilic reactors degraded 80% of the available material, while the 2-day HRT system, 267
only converted 50% of the available material, leaving a less stabilised product. The 268
thermophilic reactors themselves made an additional 10% available to degradation as seen by 269
the drop in recalcitrant component. Model-based analysis results in Figure 5 show that the 270
BMP was a good estimate of in-reactor performance to determine fd, as the input degradability 271
estimated based on model outputs aligned well with material as analysed by BMP. Uncertainty 272
in model-based estimates of fd was high due to correlation with khyd and the limited amount of 273
dynamic operation. khyd was estimated at 1.5 and 2.5 d-1 (solids and gas respectively), though 274
with an uncertainty on the order of ± 1 d-1. 275
Specific methanogenic activity (SMA) tests 276
Acetate uptake rate was in the range of 0.69-0.81 gCOD/gVS.d while formate uptake doubled 277
that at 1.4-1.5 gCOD/gVS.d (Table 4). There were no significant differences in the substrate 278
uptake rates compared between different retention time digesters. Blanks are also shown 279
(Figure 6), demonstrating that endogenous methane production was negligible compared with 280
substrate-derived methane production. 281
The stable carbon isotopic signatures of CH4/CO2 and the fractionation factors of acetate 282
and formate degradation are presented in Figure 6. The results indicate formate was degraded 283

14
and as expected, δCO2 and δCH4 were both enriched in 12C (-18‰ and -60‰, respectively). 284
The isotopic signatures became more negative (i.e., further enriched in 12C) with increasing 285
uptake of formate. On the contrary, the produced methane become increasing heavier during 286
acetate conversion, suggesting a gradual shift of the dominant pathway from hydrogenotrophic 287
to acetoclastic methanogenesis as the reaction proceeded. In all cases, except at the end of the 288
acetate batch (last two points), the majority of the methane was apparently hydrogen derived. 289
Community structure 290
FISH analyses were carried out to determine the active methanogenic and bacterial 291
populations. Fluorescence microscopy of FISH samples collected at different time points 292
always found archaea dominated by Methanosarcina (in magenta) with a complete overlap 293
between total archaea (Arc915-cy3 probe in red) and Methanosarcina-specific (Sarci551-cy5 294
probe in blue) (Figure 7). However, during the 2-day HRT period the portion of 295
Methanosarcina was much lower, suggesting a decrease in their relative abundance. Instead, 296
we found the thermophilic bacteria in the order of Thermotogales (in yellow representing the 297
overlap between Eub338mix-FITC and Ttoga660-cy3 probes). 298
Pyrotag sequencing results confirmed the dominance of archaeal family members of 299
Methanosarcinaceae with Methanobacteriaceae also present at approximately 15-20% of the 300
methanogenic population (Figure 8). The bacterial community composed mainly of phyla 301
Proteobacteria (notably Alpha- and Betaproteobacteria), Bacteroidetes (mainly assigned to 302
class Sphingobacteria), and Chloroflexi (dominating by class Anaerolineae) which were 303
abundant in the feed sludge. There was a significant increase in phylum Firmicutes (20-30%) 304
affiliated on the order level to Clostridiales in the digester samples and a noticeable presence of 305
order Thermotogales (5-10%) in the microbial communities harvested from the digesters at 306
shorter HRT. It is consistent with FISH analyses and previous findings by (6),(20). 307

15
The methanogenic population dropped from 25-30% to less than 5% of total microbial 308
population as the HRT was shortened from 4-day to 2-day. The bacterial community was 309
mostly influenced by the feed microbial composition but the level of diversity varied in 310
response to operating conditions, in this case HRT. The microbial communities obtained at 4-311
day (day 25-200) and 3-day (day 245-287) HRTs were similar and remained consistent 312
throughout the operating periods. During 2-day HRT period (day 300-350), the bacterial 313
population changed strongly over time, which likely contributed to the large variation in VS 314
destruction and process instability under these conditions. The key functional groups were still 315
prevalent with a noticeable shift in abundance toward thermophilic members of Firmicutes and 316
Thermotogae and a drop in the phylum Chloroflexi. 317
DISCUSSION 318
The overall performance of the high-rate thermophilic anaerobic digesters in this study was 319
comparable with the results obtained from mesophilic digesters operated at 15-20 day HRT 320
reported by Ge et al. (7) and Bolzonella et al. (39) and better than those operated at reduced 321
HRTs (8-12 days) reported by Lee et al. (12) and Nges et al., (40). Contradicting to these 322
previous studies, methanogenesis of the high-rate system in the current study remained 323
relatively stable with consistently low VFA content of <200 mg/L at 3 and 4-day HRTs. In 324
previous studies, a short HRT of 2-4 days was mainly used in the thermophilic pre-treatment 325
stage to intensify hydrolysis rather than methanogenesis; thus gas production was relatively 326
low (11),(39). This is not the case for our system, and reasons for this may include the 327
consistent and stable start-up and operation at a low HRT, which selected from the start for 328
competent organisms in this context. More than 80% of the available material was degraded 329
and subsequently converted to methane at the HRT of 3-4 days which is consistent with a high 330
hydrolysis coefficient. 331

16
Stable methanogenesis achieved in this study can be attributed to higher reaction rates at 332
elevated temperature and changes in microbial community structure and their metabolic 333
pathways in response to thermodynamic changes and short retention time pressure. As reported 334
earlier (3),(7), hydrolysis rate was almost double when increasing the temperature from 35 oC 335
to 55 oC and the improvement was transferred to the subsequent processes. Likewise, apparent 336
methanogenic coefficients increased from 0.37 d-1 under mesophilic conditions (3) to 0.77 d-1 337
for acetoclastic methanogenesis and 1.4 d-1 for hydrogenotrophic methanogenesis under 338
thermophilic digestion. Uptake on formate (as a proxy for hydrogenotrophic methanogenesis) 339
was higher than on acetate, which is in agreement with previous studies (3),(14). The results 340
therefore indicated hydrolysis and methanogenesis were both improved at 55 oC. At 2-day 341
HRT, methanogenic coefficients were similar to the values obtained at 3 and 4-day HRTs, yet 342
the overall performance of the continuous digesters decreased. The main failure mode at low 343
HRT was loss of methanogenesis, rather than loss of the primary hydrolysis, evidenced by drop 344
in gas flow, and accumulation of acetate and C3+ acids. This indicates that methanogenesis is 345
the rate-limiting step at high temperatures (rather than hydrolysis), and that unlike many 346
mesophilic systems, hydraulic failure can be determined by increase in intermediates, rather 347
than un-hydrolysed material simply washing out. 348
When examining the methanogenic pathways in particular using isotopic fractionation 349
analysis (4 day HRT), we observed a shift from CO2-reducing methanogenesis to acetate 350
cleavage at the end of the batch test. However, the continuous system was consistently 351
dominated by oxidation, with fmc larger than the theoretical 33% (41), possibly due to constant 352
washout and replacement of the microbial communities in the continuous digesters. The 353
observation suggests cleavage may dominate again at longer retention times. The 354
thermodynamic shifts in methanogenic pathways with respect to increase in temperature have 355
also been reported by (16),(42), suggesting that high temperature and short HRT favors the 356

17
syntrophic association between acetate oxidisers and hydrogenotrophic methanogens which 357
may include Methanosarcinaceae and Methanobacteriaceae. Methanobacteriaceae have 358
previously only been found to be hydrogen and formate utilizing, while Methanosarcinaceae 359
can also cleave acetate, with the metabolic possibility also for acetate oxidation to hydrogen 360
(43),(44). The high level of formate activity may be due to activity by Methanobacteriaceae 361
since Methanosarcinaceae have not been previously observed to grow on formate (though the 362
genes for this do exist (45)). We believe part of the reason the reactors were stable at low HRT 363
is that applying a short HRT from the start enabled a stable dominance of oxidation capacity, 364
which was further favored by the higher temperature. 365
The microbial community structures of mesophilic anaerobic digesters have been well 366
documented with the dominant bacterial groups of Chloroflexi, Bacteroidetes, and Firmicutes 367
and archaeal members of Methanomicrobiales and Methanosaetaceae (13),(46). However, the 368
pyrotag sequencing results showed the exclusive dominance of Methanosarcinaceae and the 369
hydrogenotrophic methanogens Methanomicrobiaceae including the genera of 370
Methanobrevibacter, Methanothermobacter and Methanobacterium in the thermophilic 371
digesters. Methanosarcinaceae which is dominating in the thermophilic digester are capable of 372
either hydrogenotrophic or acetoclastic methanogenesis. The absence of obligate acetoclastic 373
Methanosaetaceae could be attributed to a high ammonia level (5) and short HRT which 374
imposes selective pressure on the slow-growing microorganisms (the maximum growth rates 375
were 0.2 d-1 for Methanosaetaceae and 0.6 d-1 for Methanosarcinaceae (3),(47)). 376
Only a limited number of syntrophic acetate oxidation bacteria have been isolated and 377
characterized, including thermophilic bacteria Thermacetogenium phaeum (48) belonging to 378
phylum Firmicutes, Thermotoga lettinga strain TMO (49) belonging to phylum Thermotogae, 379
and two mesophilic bacteria both belonging to phylum Firmicutes (50). These phyla were 380

18
dominant in the thermophilic biogas reactors, with increasing abundance of the orders 381
Clostridiales and Thermotogales at shorter HRTs. While hypothetical acetate oxidizing 382
members from Chloroflexi were lost at 2-day HRT, this appears to have been off-set by the 383
increase in other acetate oxidising candidates. In fact, the drop in Methanosarcinaceae (from 384
almost 20% down to <5%) was the most distinguishable microbial characteristic of the change 385
from pre- to post-failure. It suggests that the system collapsed mainly due to loss of 386
methanogens, rather than the reduced activity of the syntrophs. Indeed, if syntrophic bacterial 387
acetate oxidisers were lost while Methanosarcinaceae were retained, one would expect 388
methanogenesis would be maintained through acetoclastic methanogenesis rather than acetate 389
oxidation, which was not the case. 390
A significant reduction of HRT from 15-20 days down to 3-4 days means that the sludge 391
daily flow rate could be increased up to five times or the digester volume could be likewise 392
reduced. The heating demand for thermophilic digesters operated at 55 oC can be provided 393
from methane production using cogeneration. Furthermore, where semi-batch operation is 394
applied, the material meets standards for pathogen destruction (51). The VS destruction of the 395
thermophilic digester was 33-35%, which is comparable to what would be achieved at 396
approximately 12-15 days in a mesophilic digester (based on BMP results). Residual 397
degradability at 4 days and 3 days was 0.20, which is comparable to the commonly applied 398
standard of 17% (52) and indicates the material is suitable for direct reuse or after additional 399
minor conditioning. 400

19
Acknowledgements 401
Dang Ho is an Environmental Biotechnology Cooperative Research Centre Ph.D. student 402
through project P23, and the project received funding support from the EBCRC. Dr. Damien 403
Batstone is the recipient of an ARC Research Fellowship and this project was supported under 404
Australian Research Council’s Discovery Projects funding scheme (project number 405
DP0985000). Paul Jensen is an MLA/AMPC research fellow. We thank Beatrice-Keller 406
Lehmann and Kim Baublys from the University of Queensland for assistance with analysis.407
20
REFERENCES 408
1. Tchobanoglous G, Burton FL, Stensel HD. Wastewater Engineering, treatment and reuse. 4th 409
ed. New York, NY (US): McGraw-Hill; 2003. 410
2. Batstone DJ, Jensen PD. Anaerobic processes. In: Wilderer P, editor. Treatise on Water 411
Science: Elisevier B.V.; 2011. p. 615-639. 412
3. Siegrist H, Vogt D, Garcia-Heras JL, Gujer W. Mathematical model for meso- and thermophilic 413
anaerobic sewage sludge digestion. environmental Science & Technology 2002;36(5):1113-1123. 414
4. Metcalf & Eddy I. Wastewater engineering: treatment and reuse. 4th ed. ed. Boston: McGraw 415
Hill; 2003. 416
5. Karakashev D, Batstone DJ, Trably E, Angelidaki I. Acetate oxidation is the dominant 417
methanogenic pathway from acetate in the absence of Methanosaetaceae. Applied and Environmental 418
Microbiology 2006;72(7):5138-5141. 419
6. Sundberg C, Al-Soud WA, Larsson M, Alm E, Yekta SS, Svensson BH, Sorensen SJ, Karlsson 420
A. 454 pyrosequencing analyses of bacterial and archaeal richness in 21 full-scale biogas digesters. 421
FEMS Microbiology Ecology 2013:1-15. 422
7. Ge H, Jensen PD, Batstone DJ. Temperature phased anaerobic digestion increases apparent 423
hydrolysis rate for waste activated sludge. Water Research 2011;45(4):1597-1606. 424
8. Song Y-C, Kwon S-J, Woo J-H. Mesophilic and thermophilic temperature co-phase anaerobic 425
digestion compared with single-stage mesophilic- and thermophilic digestion of sewage sludge. Water 426
Research 2004;38(7):1653-1662. 427
9. Kim JK, Oh BR, Chun YN, Kim SW. Effects of temperature and hydraulic retention time on 428
anaerobic digestion of food waste. Journal of Bioscience and Bioengineering 2006;102(4 ):328-332. 429
10. Van Lier JB, Hulsbeek J, Stams AJ, Lettinga G. Temperature susceptibility of thermophilic 430
methanogenic sludge: implications for reactor start-up and operation. Bioresource Technology 431
1993;43:227-235. 432
11. Ge H, Jensen PD, Batstone DJ. Increased temperature in the thermophilic stage in temperature 433
phased anaerobic digestion (TPAD) improves degradability of waste activated sludge. Journal of 434
Hazardous Materials 2011;187(1-3):355-361. 435
12. Lee I-S, Parameswaran P, Rittmann BE. Effects of solids retention time on methanogenesis in 436
anaerobic digestion of thickened mixed sludge. Bioresource Technology 2011;102(22):10266-10272. 437
13. Riviere D, Desvignes V, Pelletier E, Chaussonnerie S, Guermazi S, Weissenbach J, Li T, 438
Camacho P, Sghir A. Towards the definition of a core of microorganisms involved in anaerobic 439
digestion of sludge. ISME J 2009;3(6):700-714. 440

21
14. Regueiro L, Veiga P, Figueroa Mn, Alonso-Gutierrez J, Stams AJM, Lema JM, Carballa M. 441
Relationship between microbial activity and microbial community structure in six full-scale anaerobic 442
digesters. Microbiological Research 2012;167(10):581-589. 443
15. Demirel B, Scherer P. The roles of acetotrophic and hydrogenotrophic methanogens during 444
anaerobic conversion of biomass to methane: a review. Reviews in Environmental Science and 445
Bio/Technology 2008;7(2):173-190. 446
16. Sasaki D, Hori T, Haruta S, Ueno Y, Ishii M, Igarashi Y. Methanogenic pathway and 447
community structure in a thermophilic anaerobic digestion process of organic solid waste. Journal of 448
Bioscience and Bioengineering 2011;111(1):41-46. 449
17. Morita M, Malvankar NS, Franks AE, Summers ZM, Giloteaux L, Rotaru AE, Rotaru C, 450
Lovley DR. Potential for direct interspecies electron transer in methanogenic wastewater digester 451
aggregates. mBio 2011;2(4):1-8. 452
18. Lee MJ, Zinder SH. Hydrogen partial pressures in a thermophilic acetate-oxidising 453
methanogenic coculture. Applied and Environmental Microbiology 1988;54:1457-1461. 454
19. Petersen SP, Ahring BK. Acetate oxidation in a thermophilic anaerobic sewage-sludge digestor: 455
the importance of non-aceticlastic methanogenesis from acetate. FEMS Microbiology Letters 456
1991;86(2):149-152. 457
20. Goberna M, Insam H, Franke-Whittle IH. Effect of Biowaste Sludge Maturation on the 458
Diversity of Thermophilic Bacteria and Archaea in an Anaerobic Reactor. Applied and Environmental 459
Microbiology 2009;75(8):2566-2572. 460
21. Rotaru A-E, Shrestha PM, Liu F, Ueki T, Nevin K, Summers ZM, Lovley DR. Interspecies 461
Electron Transfer via Hydrogen and Formate Rather than Direct Electrical Connections in Cocultures of 462
Pelobacter carbinolicus and Geobacter sulfurreducens. Applied and Environmental Microbiology 463
2012;78(21):7645-7651. 464
22. Fey A, Claus P, Conrad R. Temporal change of 13C-isotope signatures and methanogenic 465
pathways in rice field soil incubated anoxically at different temperatures. Geochimica et Cosmochimica 466
Acta 2004;68(2):293-306. 467
23. Laukenmann S, Polag D, Heuwinkel H, Creule M, Gronauer A, Lelieveld J, Keppler F. 468
Identification of methanogenic pathways in anaerobic digesters using stable carbon isotopes. 469
Engineering in Life Sciences 2010;10(6):509-514. 470
24. APHA. Standard methods for the examination of water & wastewater. 21st ed. Washington, 471
DC: American Public Health Association; 2005. 472
25. Switzenbaum MS, Farrell JB, Pincince AB. Relationship between the Van Kleeck and Mass-473
Balance Calculation of Volatile Solids Loss. Water Environment Research 2003;75(4):377-380. 474

22
26. Angelidaki I, Alves M, Bolzonella D, Borzacconi J, Campose L, Guwy AJ, Kalyuznyi S, 475
Jenicek P, Van Lier JB. Defining the biomethane potential (BMP) of solid organic wastes and energy 476
crops: a proposed protocol for batch assays. Water Science & Technology 2009;59(5):927-934. 477
27. Batstone DJ, Tait S, Starrenburg D. Estimation of hydrolysis parameters in full-scale anerobic 478
digesters. Biotechnology and Bioengineering 2009;102(5):1513-1520. 479
28. Batstone DJ, Keller J, Angelidaki I, Kalyuznyi S, Pavlostathis SG, Rozzi A, Sanders WTM, 480
Siegrist H, Vavilin VA. IWA Task Group for Mathematical Modelling of Anaerobic Digestion 481
Processes. London, UK.: IWA Publishing; 2002. 482
29. Nopens I, Batstone DJ, Copp JB, Jeppsson U, Volcke E, Alex J, Vanrolleghem PA. An 483
ASM/ADM model interface for dynamic plant-wide simulation. Water Research 2009;43(7):1913-484
1923. 485
30. Batstone DJ, Keller J, Newell RB, Newland M. Modelling anaerobic degradation of complex 486
wastewate. II: parameter estimation and validation using slaughterhouse effluent. Bioresource 487
Technology 2000;75:75-85. 488
31. Conrad R. Quantification of methanogenic pathways using stable carbon isotopic signatures: a 489
review and a proposal. Organic Geochemistry 2005;36(5):739-752. 490
32. Whiticar MJ, Faber E, Schoell M. Biogenic methane formation in marine and freshwater 491
environments: CO2 reduction vs. acetate fermentation-Isotope evidence. Geochimica et Cosmochimica 492
Acta 1986;50(5):693-709. 493
33. Amann RI, Ludwig W, Schleifer KH. Phylogenetic identification and in situ detection of 494
individual microbial cells without cultivation. Microbiological Reviews 1995;59(1):143-169. 495
34. Stahl DA, Amann RI. Development and application of nucleic acid probes. In: Stackbrandt E, 496
Goodfellow, M., editor. Nucleic Acid Techniques in Bacterial Systematics. Chichester, England: John 497
Wiley & Sons Ltd.; 1991. p. 205-248. 498
35. Raskin L, Stromley JM, Rittmann BE, Stahl DA. Group-specific 16S rRNA hybridization 499
probes to describe natural communities of methanogens. Applied and Environmental Microbiology 500
1994;60(4):1232-1240. 501
36. Sorensen A, Torsvik V, Torsvik T, Poulsen L, Ahring B. Whole-cell hybridisation of 502
Methanosarcina cells with two new oligonucleotide probes. Applied and Environmental Microbiology 503
1997;63:3043-3050. 504
37. Harmsen H, Prieur D, Jeanthon C. Group-specific 16S rRNA-targeted oligonucleotide probes to 505
identify thermophilic bacteria in marine hydrothermal vents. Applied and Environmental Microbiology 506
1997;63(10):4061-4068. 507
38. Caporaso JG, Kuczynski J, Stombaugh J, Bittinger K, Bushman FD, Costello EK, Fierer N, 508
Pena AG, Goodrich JK, Gordon JI, Huttley GA, Kelley ST, Knights D, Koenig JE, Ley RE, Lozupone 509
CA, McDonald D, Muegge BD, Pirrung M, Reeder J, Sevinsky JR, Turnbaugh PJ, Walters WA, 510

23
Widmann J, Yatsunenko T, Zaneveld J, Knight R. QIIME allows analysis of high-throughput 511
community sequencing data. Nature Methods 2010;7(5):335-336. 512
39. Bolzonella D, Pavan P, Battistoni P, Cecchi F. Mesophilic anaerobic digestion of waste 513
activated sludge: influence of the solid retention time in the wastewater treatment process. Process 514
Biochemistry 2005;40(3-4):1453-1460. 515
40. Nges IA, Liu J. Effects of solid retention time on anaerobic digestion of dewatered-sewage 516
sludge in mesophilic and thermophilic conditions. Renewable Energy 2010;35(10):2200-2206. 517
41. Penning H, Conrad R. Quantification of carbon flow from stable isotope fractionation in rice 518
field soils with different organic matter content. Organic Geochemistry 2007;38(12):2058-2069. 519
42. Hao L-P, Lui F, He P-J, Li L, Shao L-M. Predominant Contribution of Syntrophic Acetate 520
Oxidation to Thermophilic Methane Formation at High Acetate Concentrations. Environmental Science 521
& Technology 2011;45(2):508-513. 522
43. Valentine DL, Blanton DC, Reeburgh WS. Hydrogen production by methanogens under low-523
hydrogen conditions. Archives of Microbiology 2000;174(6):415-421. 524
44. Heimann AC, Batstone DJ, Jakobsen R. Methanosarcina spp. Drive Vinyl Chloride 525
Dechlorination via Interspecies Hydrogen Transfer. Applied and Environmental Microbiology 526
2006;72(4):2942-2949. 527
45. Maeder DL, Anderson I, Brettin TS, Bruce DC, Gilna P, Han CS, Lapidus A, Metcalf WW, 528
Saunders E, Tapia R, Sowers KR. The Methanosarcina barkeri Genome: Comparative Analysis with 529
Methanosarcina acetivorans and Methanosarcina mazei Reveals Extensive Rearrangement within 530
Methanosarcinal Genomes. Journal of Bacteriology 2006;188(22):7922-7931. 531
46. Westerholm M, Roos S, Schnurer A. Syntrophaceticus schinkii gen. nov., sp. nov., an 532
anaerobic, syntrophic acetate-oxidizing bacterium isolated from a mesophilic anaerobic filter. FEMS 533
Microbiology Letter 2010;309(100-104). 534
47. Vavilin VA, Qu X, Mazeas L, Lemunier M, Duquennoi C, He P, Bouchez T. Methanosarcina as 535
the dominant aceticlastic methanogens during mesophilic anaerobic digestion of putrescible waste. 536
Antonie van Leeuwenhoek, International Journal of General and Molecular Microbiology 537
2008;94(4):593-605. 538
48. Hattori S. Syntrophic acetate-oxidizing microbes in methanogenic environments. Microbes and 539
Environments 2008;23(2):118-127. 540
49. Balk M, Weijma J, Stams AJ. Thermotoga lettingae sp. nov., a novel thermophilic, methanol-541
degrading bacterium isolated from a thermophilic anaerobic reactor. International Journal of Systematic 542
and Evolutionary Microbiology 2002;52:1361-1368. 543
50. Schnürer A, Zellner G, Svensson BH. Mesophilic syntrophic acetate oxidation during methane 544
formation in biogas reactors. FEMS Microbiology Ecology 1999;29(3):249-261. 545

24
51. Paul E, Carrere H, Batstone DJ. Thermal methods to enhance biological treatment processes. 546
In: Paul E, Liu Y, editors. Biological Sludge Minimisation and Biomaterials/Bioenergy Recovery 547
Technologies. First ed: John Wiley & Sons, Inc.; 2012. p. 373-404. 548
52. US. Environmental Protection Agency. A plain English Guide to the EPA Part 503 Biosolids 549
Rule. In: Environmental Protection Agency 8322/R-93-003. Washington, DC, USA; 1994. 550
551
AUTHOR INFORMATION 552
Corresponding Author 553
* Damien Batstone 554
Phone: +61 7 3346 9051 555
Email [email protected] 556
Notes. 557
The authors declare no competing financial interest. 558
559
Author Contributions 560
The manuscript was written through contributions of all authors. All authors have given 561
approval to the final version of the manuscript. 562
25
Table 1. Characteristics of thickened waste activated sludge (WAS) from Elanora WWTP. 563 (Error margins indicate standard deviation across 10 different feed collections used in the study 564 over 12 months). 565
Characteristics WASTotal Solids (g/L) 28.2 ± 0.8 Volatile Solids (g/L) 19.3 ± 0.5 pH 7.1 ± 0.1 Chemical Oxygen Demand (COD) (g/L) 28.7 ± 2.5 Volatile Fatty Acid (g/L) 0.2 ± 0.1 NH4
+-N (g/L N) 0.08 ± 0.03 566

26
Table 2. Summary of volatile fatty acids compared between the control and test reactors across 567 three operating periods. 568
Total VFAs (mg/L COD)
Acetate (mg/L COD)
Propionate (mg/L COD)
C4+ acids (mg/L COD)
Period I Control 175 ± 68 97 ± 28 65 ± 24 13 ± 7 4-day HRT 104 ± 53 67 ± 30 32 ± 23 5 ± 2
Period II Control 164 ± 43 104 ± 18 51 ± 28 10 ± 3 3-day HRT 254 ± 82 171 ± 49 77 ± 30 5 ± 3
Period III Control 98 ± 19 79 ± 17 11 ± 4 8 ± 2 2-day HRT 497 ± 224 301 ± 182 142 ± 67 54 ± 28
Error margins indicate standard deviation across different measurements over each period.569

27
Table 3. Comparison of degradation parameters of feed WAS and short HRT digester effluent 570 fitted using model based analysis. 571
khyd
(d-1) fd Bo
L CH4/kgVSadded Feed material (WAS) 0.19 ± 0.040 0.41 ± 0.18 222 ± 12 4-day HRT 3-day HRT 2-day HRT
0.18 ± 0.010 0.19 ± 0.014 0.17 ± 0.010
0.20 ± 0.011 0.20 ± 0.010 0.31 ± 0.012
131 ± 9 128 ± 10 170 ± 7
khyd is the apparent first order hydrolysis coefficient; fd is the degradation fraction; B0 is the 572 methane production potential. Samples of 4-day, 3-day and 2-day HRT were collected on day 573 137, day 249, and day 323, respectively. Error margins indicate standard deviation of the 574 triplicate. 575

28
Table 4. Summary of kinetic parameters for the acetate-utilizing (km,ac) and 576
hydrogenotrophic (km,for) methanogenesis. 577
km,ac
gCOD/gVS.d km,for
gCOD/gVS.d
4-day HRT 3-day HRT 2-day HRT
0.77 ± 0.022 0.69 ± 0.018 0.81 ± 0.069
1.4 ± 0.13 1.5 ± 0.17 1.4 ± 0.20
Samples of 4-day, 3-day and 2-day HRT were collected on day 137, day 270, and day 342, 578 respectively Error margins indicate standard deviation of the triplicate. 579
580

29
581
Figure 1. Schematic diagram of the bench scale thermophilic reactor. 582

30
583
Figure 2. Volatile solid destruction for mass balance (●) and Van Kleeck (○) calculation on the 584 control reactor (top) and test reactor (bottom). VS destruction of the test reactor when operated 585 at 3 and 4-day HRTs were stable and comparable with that of the control reactor; but it varied 586 strongly at 2-day HRT (Vertical lines indicate transitions from 4-3-2 day HRT in the test 587 reactor). 588

31
589
Figure 3. Gas production of control and experimental reactors. 590
Time (day)
0 50 100 150 200 250 300 350
Met
hane
(L/
kgV
Sad
ded)
0
50
100
150
200Control reactorTest reactor
(I) (II) (III)

32
591
Figure 4. Cumulative methane production from the residual degradation tests (points represent 592 experimental measurements, error bars are 95% confidence intervals based on triplicate 593 analyses and lines represent model fit). 594
Time (day)
0 10 20 30 40 50
Me
than
e (L
/kgV
Sad
ded)
0
50
100
150
200
250
Feed sludge (day 137, day 249, day 323)4d_HRT (day 137) 3d_HRT (day 249)2d_HRT (day 323)

33
595
Figure 5. Comparison of degradable fractions of feed WAS and short HRT digesters (error 596 bars are 95% confidence in mean VS destruction and based on triplicate analyses of the BMP 597 tests). Potentials for 4d, 3d, and 2d taken from the experimental reactor on day 137, day 249, 598 and day 323, respectively. Estimates of in-reactor performance based on average ± error on 599 two data sets, ie. gas data and VS data for 6 measurements around these days. Continuous 600 results based on parameter estimation (khyd,fd) with simulation of whole data set. 601
0
10
20
30
40
50
60
70
80
90
100
Feed WAS 2d 3d 4d continuousgas
continuoussolids
gCO
D (%
)
Destroyed in reactors Residual degradable Recalcitrant
Control reactor Control reactor (gas) (solids)

34
Time (day)
0 1 2 3 4
δ13 C
(o /o
o)
-80
-70
-60
-50
-40
-30
-20
-10fm
c
0.3
0.4
0.5
0.6
0.7
0.8
Time (day)
0.0 0.2 0.4 0.6 0.8 1.0 1.2 1.4
δ13 C
(o /o
o)
-80
-70
-60
-50
-40
-30
-20
-10
fmc
0.3
0.4
0.5
0.6
0.7
0.8
Time (day)
0 2 4 6 8
CO
D (
g/L)
0.0
0.5
1.0
1.5
2.0
2.5
3.0
3.5
Acetate MethaneBlank (methane)
Time (day)
0.0 0.5 1.0 1.5 2.0
CO
D (
g/L)
0.0
0.5
1.0
1.5
2.0
2.5
3.0
3.5
Formate Methane
Figure 6. Evolution of δ13C of CH4 and CO2, and the fraction of CH4 produced from CO2 602 reduction pathway (fmc) during the acetate (top) and formate (bottom) conversion (noted that 603 time scales for acetate and formate are different). (Error bar are 95% confidence based on 604 triplicate analyses; solid lines represent δCO2 and δCH4; short dash line represents fmc). SMA 605 based on samples taken on day 137 (4-day HRT). 606
δCO2
δCH4
fmc
fmc
δCH4
δCO2

35
Figure 7. FISH images of the microbial consortia derived from (a) waste activated sludge; (b) 607 thermophilic digester at day 200 (4-day HRT); (c) thermophilic digester at day 285 (3-day 608 HRT); and (d) digester at day 330 (2-day HRT). Bacteria (Eub338mix) are in green, aggregates 609 of Methanosarcina (Sarci551) are in pink, and rod-shaped bacteria Thermotogales (Ttoga660) 610 are in yellow. 611

36
612
613
Figure 8. Relative abundances of phylogenetic groups in the thermophilic digesters collected 614 at different operating times and then grouped in terms of HRTs. Bacterial communities are 615 presented by the dominating phyla while the archaeal Euryachaeota are presented by the 616 dominating families of Methanosarcinaceae and Methanobacteriaceae. Phylogenetic groups 617 accounting for ≤ 0.5% of all classified sequences are summarised in the artificial group 618 ‘others’. 619
4-day HRT 3-day HRT 2-day HRT