meteorology – a revenue generating science · meteorology – a revenue generating science ......
TRANSCRIPT

Meteorology – a Revenue Generating Science A mapping of meteorological services with an economic assessment of selected cases

2
Meteorology – a Revenue Generating Science A mapping of meteorological services with an economic assessment of selected cases March 2006 Published by: The Ministry of Transport and Energy Frederiksholm Kanal 27 DK-1220 København K e-mail: [email protected] www.trm.dk ISBN: Cover: Design Factory Cover Photos: Street photo: Lars Andersen Windmills: Export Promotion Denmark Issue: 300 Print: Glumsø Bogtrykkeri A/S The publication is swan marked

3
Contents 1. Introduction ........................................................................................................................................ 5 2. Meteorology Generates Value ...................................................................................................... 7
2.1 What Is Meteorological Service? ....................................................................................................... 7 2.2. How Is A Meteorological Service Produced? .................................................................................. 8 2.3. Strict Quality Requirements for Meteorological Service ............................................................. 9 2.4. Who Uses Meteorological Services? .............................................................................................. 10 2.5. Statement of the Value of Meteorological Services ..................................................................... 11 2.6. Examples of Meteorology as a Revenue Generating Science.................................................... 11 2.7. Future Challenges............................................................................................................................. 14
3. Information Flow at DMI ................................................................................................................. 15 3.1. Purpose ............................................................................................................................................... 15 3.2. Data .................................................................................................................................................... 15 3.3. Processes ............................................................................................................................................ 17 3.4. Products ............................................................................................................................................. 17
4. Method for Mapping the Economic Value of Meteorological Services.......................... 20 4.1 Methodological Framework...................................................................................................... 20 4.2. Proposed Analytic Framework for the Economic Assessment of Meteorological Services 25 4.3. Quantification of Cost Categories................................................................................................. 26
5. Overview of the Economic Value of DMI’s Services ............................................................................ 28 5.1. The Categories ................................................................................................................................... 28 5.2. The Products’ Importance and Financing ..................................................................................... 29
6. Economic Aspects of DMI’s Specific Products ..................................................................................... 32 6.1. Consulting Services and Education ............................................................................................... 32 6.2. Research Results............................................................................................................................... 32 6.3. Sea Ice Information ......................................................................................................................... 33 6.4. Answering enquiries ........................................................................................................................ 35 6.5. Radar and Lightning Information ................................................................................................ 36 6.6. Raw and Semi-Processed Observation Data ............................................................................... 38 6.7. Climate Monitoring .......................................................................................................................... 39 6.8. Extreme Rain Information ............................................................................................................. 41 6.9. Oil Drift Predictions ......................................................................................................................... 43 6.10. Storm Surge Warnings.................................................................................................................. 44 6.11. Oceanography ................................................................................................................................. 46 6.12. Slippery-Road Warnings .............................................................................................................. 48 6.13. Military Products........................................................................................................................... 50 6.14. Sale of Magnetic Instruments...................................................................................................... 51 6.15. Health Warnings ........................................................................................................................... 51 6.16. Aviation Weather........................................................................................................................... 52 6.17. Emergency Alert Scheme .............................................................................................................. 54 6.18. Ordinary Weather Forecasts/Warnings .................................................................................... 55 6.19. Extreme weather warnings .......................................................................................................... 58 6.20. Routing information ..................................................................................................................... 59 6.21. Variation charts.............................................................................................................................. 60 6.22. Cosmic radiation warning ........................................................................................................... 60
Appendix 1: Case on Shipping forecasts .................................................................................................... 61 Appendix 2: Case on Squadron 722 ........................................................................................................... 66 Appendix 3: Case on Meteorological icy road warnings.......................................................................... 71

4

5
1. Introduction The 23 March is World Meteorological Day and marks the anniversary of the foundation of the World Meteorological Organization (WMO). WMO was founded in 1950 and is a Specialized Agency of the United Nations. This year, also Denmark contributes to the celebration of this day by publishing this report about the economic value of meteorological service. The report documents the fact that timely and correct meteorological services in the form of, for instance, weather forecasts and weather warnings are being used and create value in a great variety of contexts in Denmark. The report illustrates the extent and scope of the meteorological services, exemplifying how these services contribute to expedient planning, economically and with regard to safety, of weather-dependent activities. Furthermore, the report explains the mechanisms behind the meteorological services, a research based process founded on a high tech system of models and large quantities of data from a very fine-meshed international network of observations. In Denmark, there is a long tradition of the state rendering meteorological services available to society. Thus, the first meteorological institute was founded in 1872. Both the state’s commitment and the long tradition testify to the vital economic importance of weather forecasting information. It is, however, only with this report that a systematic assessment of the economic impact of meteorological services is made in a Danish context. The political responsibility for the meteorological service of society rests with the Ministry of Transport and Energy and is exercised through the state institution Danish Meteorological Institute (DMI). DMI was established in 1990 by merging the then Meteorological Institute with the Meteorological Service for Civil Aviation and the Meteorological Service for Defence. The tasks of DMI include, among other:
Monitoring weather and climate and preparing warnings and forecasts for Denmark, Greenland and the Faroe Islands
Collection and communication of information concerning meteorology, climatology and oceanography
Research activities aimed at improving the scientific basis of DMI’s operational activities DMI employs a little over 350 people, and annually the production costs of the meteorological services total approx. DKK 260m, of which DKK 125m is financed by the state, while the rest is funded by professional users of DMI’s services, hereunder in particular civil aviation. Similar to other state supply utilities, DMI experiences a gradual exposure to competition on selected DMI services from private suppliers. There is thus a market for meteorological services taking form, comprising both Danish and foreign suppliers, among who may be mentioned Vejr2 A/S. This exposure to competition contributes in a positive way to the general development of the meteorological area. The report consists of a general overview and a series of parts systematically mapping the use of meteorological services, as well as a number of selected case studies assessing the economic value thereof.

6
Sections 3-8 and the appendices have been prepared by the consultancy firm COWI on behalf of the Ministry of Transport and Energy with the participation of DMI and the Danish Transport Research Institute (DTF).

7
2. Meteorology Creates Value 2.1 What Is Meteorological Service? It is part of most people’s daily routine to keep informed about the weather: how it is, and how it will develop in the next few hours or days. More or less consciously, this information forms the basis of a number of everyday decisions. Is it time for mittens, should we postpone our sail for tomorrow, should I dry the washing outdoors or indoors, etc. The most well-known meteorological service is the regular weather forecasts and warnings on the radio, TV, Internet, and so on, which are used in a variety of contexts, cf. Table 1. Table 1: Use of ordinary weather forecasts/warnings Examples of users Use Examples of benefits The general public Used to keep informed about the
weather The pleasure of being able to plan outdoors activities well in advance
The tourist sector Used to keep its customers informed about the expected weather at the destination
The possibility of packing e.g. the right clothes and equipment for the vacation
The leisure sector Used to keep informed about the weather
The pleasure of being able to plan outdoors activities well in advance
The energy sector Used in connection with energy supply operations, both as regards energy sources and needs
Direct savings and a more environmentally correct exploitation of energy sources, e.g. by optimum exploitation of wind energy
The shipping trade Used to keep informed about the weather on the route and for planning an alternative course
Direct savings in the form of time and equipment - e.g. in the fishing trade
The agricultural sector Used for planning both sowing, harvesting, and irrigation
Among other things savings on fertilizer and pest controllers. Harvesting at the right time saves costs of drying
The building sector Used to keep informed about the weather
Some building processes are not possible in e.g. frosty weather
The manufacturing sector Used to predict the demand for weather-dependent products such as ice creams
A sufficient stock of e.g. ice cream to meet the demand
However, meteorological services cover a lot more than ordinary weather forecasts. For instance, DMI’s meteorological services comprise 22 main categories including among other the following specialized services:
Services aimed at civil aviation Weather routing of vessels Storm surge warnings Slippery-road warnings Sea ice information Health warnings
It is thus characteristic that part of the meteorological services, e.g. ordinary weather forecasts, weather and slippery-road warnings are aimed at very large user segments, while other services are targeted at highly specialist user segments, to whose concrete needs the specific service is carefully dedicated. This applies, for instance, to weather routing and sea ice information.

8
Some services are prepared at regular intervals, e.g. weather forecasts and aviation forecasts, while other are prepared only as needed or upon request. Some meteorological services are operated around the clock. 2.2. How Is A Meteorological Service Produced? Meteorological service is the end product of a vast number of complex and high technological processes. Figure 1 illustrates the process from observation across analyses and prognoses until the meteorological service reaches its widespread user segment. Figure 1: From observation to meteorological service
Row 1: Ice reconnaissance – vessels and buoys – weather station – radiosonde – weather satellite – weather radar – aeroplane Row 2: Aviation – agriculture Row 3: Emergency alert scheme – weather service/monitoring, weather forecasts, warnings – computer calculated prognoses/client communication and contact – computer and communication centre – database and enquiries/weather and climate research Row 4: Land and marine transport – building and construction – Defence – energy – the public and media – the fishing trade – health and leisure Source: Vejr for enhver, DMI 1997 © Oneman Grafisk Design The most important ‘raw material’ for the production of meteorological services is observations of the current condition of the atmosphere at selected points. There is a close connection between the quality of the meteorological service and the quality and quantity of its observational basis. The technological development has entailed greater efficiency and significantly improved observations and observation networks. Thus, the land-based observations have been automated to a considerable degree, while at the same time observations based on satellites and radar systems are increasingly employed.
9
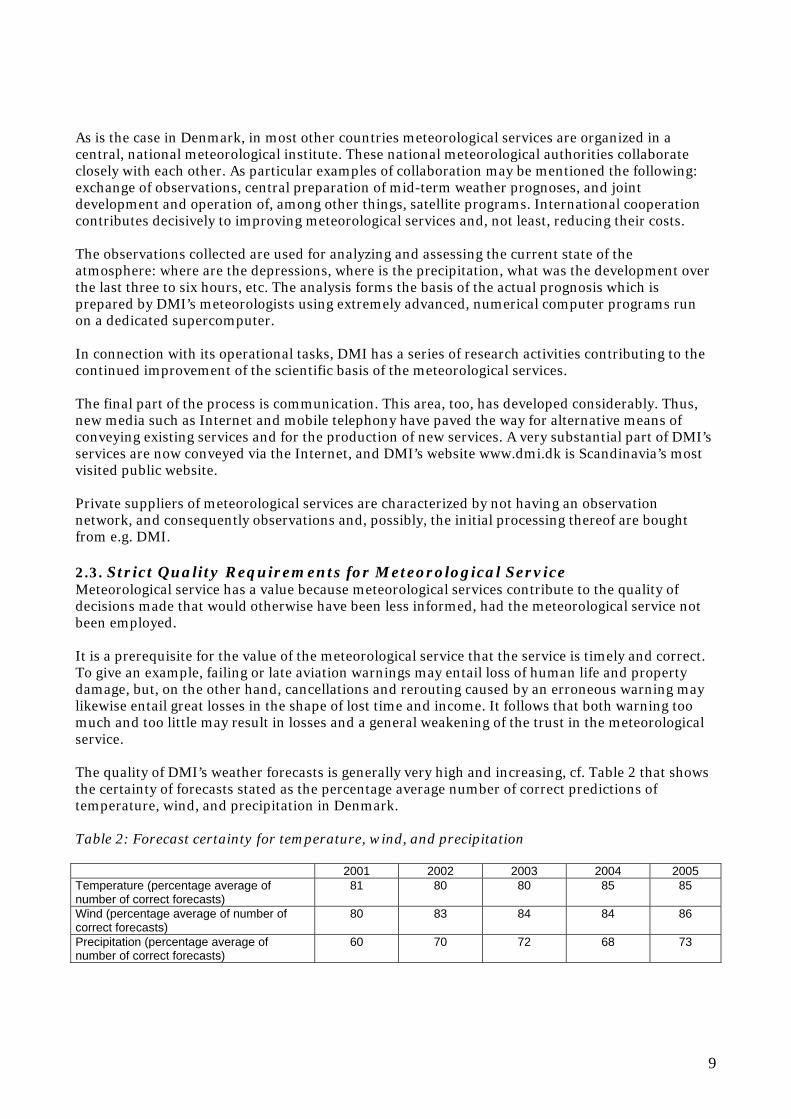
As is the case in Denmark, in most other countries meteorological services are organized in a central, national meteorological institute. These national meteorological authorities collaborate closely with each other. As particular examples of collaboration may be mentioned the following: exchange of observations, central preparation of mid-term weather prognoses, and joint development and operation of, among other things, satellite programs. International cooperation contributes decisively to improving meteorological services and, not least, reducing their costs. The observations collected are used for analyzing and assessing the current state of the atmosphere: where are the depressions, where is the precipitation, what was the development over the last three to six hours, etc. The analysis forms the basis of the actual prognosis which is prepared by DMI’s meteorologists using extremely advanced, numerical computer programs run on a dedicated supercomputer. In connection with its operational tasks, DMI has a series of research activities contributing to the continued improvement of the scientific basis of the meteorological services. The final part of the process is communication. This area, too, has developed considerably. Thus, new media such as Internet and mobile telephony have paved the way for alternative means of conveying existing services and for the production of new services. A very substantial part of DMI’s services are now conveyed via the Internet, and DMI’s website www.dmi.dk is Scandinavia’s most visited public website. Private suppliers of meteorological services are characterized by not having an observation network, and consequently observations and, possibly, the initial processing thereof are bought from e.g. DMI. 2.3. Strict Quality Requirements for Meteorological Service Meteorological service has a value because meteorological services contribute to the quality of decisions made that would otherwise have been less informed, had the meteorological service not been employed. It is a prerequisite for the value of the meteorological service that the service is timely and correct. To give an example, failing or late aviation warnings may entail loss of human life and property damage, but, on the other hand, cancellations and rerouting caused by an erroneous warning may likewise entail great losses in the shape of lost time and income. It follows that both warning too much and too little may result in losses and a general weakening of the trust in the meteorological service. The quality of DMI’s weather forecasts is generally very high and increasing, cf. Table 2 that shows the certainty of forecasts stated as the percentage average number of correct predictions of temperature, wind, and precipitation in Denmark. Table 2: Forecast certainty for temperature, wind, and precipitation 2001 2002 2003 2004 2005 Temperature (percentage average of number of correct forecasts)
81 80 80 85 85
Wind (percentage average of number of correct forecasts)
80 83 84 84 86
Precipitation (percentage average of number of correct forecasts)
60 70 72 68 73

10
There are very strict quality requirements for DMI’s meteorological services. Among other things, the quality is ensured by means of ISO certifications, auditing by international organizations, and the yearly results contract between DMI and the department of the Ministry of Transport and Energy. The quality is measured, among other things, on a so-called quality index for DMI’s numeric weather prognoses. These prognoses form part of the basis of many of DMI’s services, and they are also used by other weather services, e.g. the television stations DR-TV and TV2. Technically, the index sums up the quality of the numeric prognoses by a weighted average of the percentage average of the number of correct forecasts of temperature, wind, and precipitation in Denmark, and of the wind and temperature in Greenland and the Faroe Islands. The quality of DMI’s services has increased generally since 2001, and the quality requirements will be tightened in both 2006 and 2007, cf. Table 3 below. Table 3: Quality index for DMI* 2001 2002 2003 2004 2005 2006 2007
Quality Index* 100 102 103 106 107 109 111
*The values 2001 through 2005 are achieved results, while the values for 2006 and 2007 are required results 2.4. Who Uses Meteorological Services? DMI’s meteorological services are used in a wide variety of contexts, where correct and timely knowledge of weather, climate and oceanographic conditions has a planning and/or safety value. In the table below, examples of use and benefits of meteorological services for key user segments have been listed. The table documents the way meteorological services are used in a number of contexts and renders probable their economic value. Table 4: User segments and examples of use and benefits User segments Use Examples of Benefits The general public General information about the weather development and
planning basis of outdoor activities Reduced loss of time and property
Defence, police and emergency managers
Planning basis as regards imminent extreme weather situations, hereunder e.g. evacuation Planning basis of military action and exercises
Reduced loss of human life and property
Environment authorities
Planning basis as regards e.g. prediction of where an oil spill at sea will hit the coast
Reduced loss of natural and environmental riches and property
Road authorities Planning basis of slippery-road prevention and road projecting
Reduced loss of human life, property, time. Reduced use of salt and consequently reduced environmental strain
The agricultural sector
Planning basis as regards choice of crops and determining the time for sowing, fertilization, irrigation, spraying, and harvesting
Higher yield and redu-ced costs of irrigation, fertilization, and spraying, with subse-quent reduction of environmental strain

11
Aviation Planning basis as regards going through with a flight, the choice of route, etc.
Reduced loss of human life, property, and fuel
The shipping and fishing trades
Planning basis as regards going through with the voyage, the choice of route, etc.
Reduced loss of human life and property
Insurance companies Decision basis as regards the settlement of an insurance claim
Correct compensation paid out
The building sector Decision basis as regards the implementation of major construction works. E.g. when erecting a scaffold tower
Reduced loss of human life and property
Climate researchers Data basis of climate research and decision basis of climate policy
Scientifically well-documented climate research
Politicians Decision basis as regards climate policy Scientifically well-documented climate policy
The energy sector Decision basis as regards, among other things, the planning of energy supply, e.g. for estimating the wind power potential for the next 24 hours
Improved exploitation of energy resources
2.5. Statement of the Value of Meteorological Services Typically, the value of meteorological services is that it may contribute to the reduction of losses in connection with weather phenomena. A correct high tide warning may for instance offer an opportunity for evacuation, and a correct storm warning may leave time for postponing a planned sea voyage. In both cases, the value consists of loss reduction. The concrete value of the meteorological service to the individual user depends on a number of factors. Typically, two situations are compared, where the decision of going through with an activity was taken, respectively, with and without meteorological service. The gain or the reduced loss achieved by the individual using meteorological service is the expression of its value. The methodological basis of economic analysis in the meteorology field is not as well-developed as it is in the rest of the transport field, where in recent years a harmonized method for calculating e.g. time values has been worked out. However, if the specific meteorological service is used by many decision-makers, and if it can be rendered probable that the information is of great economic significance to each of them, then this can be taken to mean that the meteorological service all in all has a great economic significance. This rule of thumb forms the basis of the mapping of the meteorological services in Sections 3-8. 2.6. Examples of Meteorology as a Revenue Generating Science Many examples may be given that meteorological services contribute to a valuable improvement of the user’s decision-making basis in connection with the planning of weather-dependent activities. For instance, DMI’s forecasts of wind conditions save the energy sector seven digit sums. In Denmark, there are more than 5,000 wind mills producing on average 20 per cent of the aggregate Danish electricity consumption. The utility suppliers have to supplement the wind mill power production with electricity from the free market. It is therefore important to know exactly the quantity of energy the mills may be expected to produce, and preferably a few days in advance. DMI’s meteorological models allow for highly detailed predictions of the wind conditions around
12
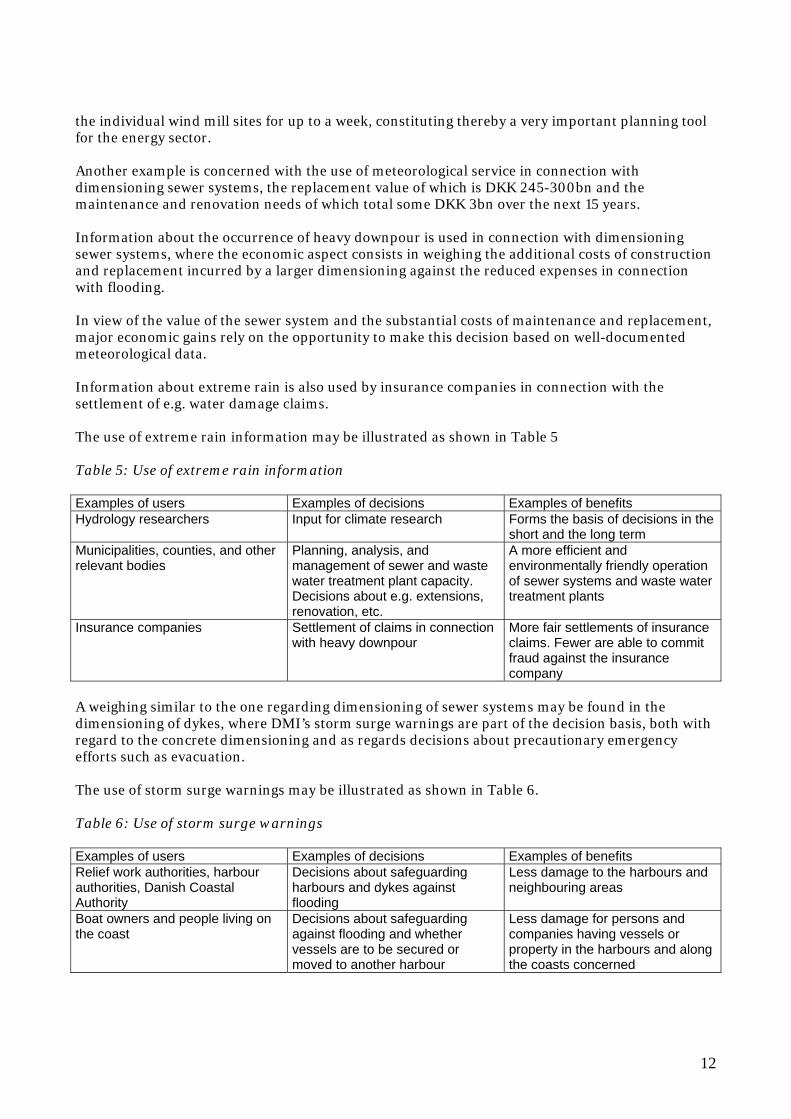
the individual wind mill sites for up to a week, constituting thereby a very important planning tool for the energy sector. Another example is concerned with the use of meteorological service in connection with dimensioning sewer systems, the replacement value of which is DKK 245-300bn and the maintenance and renovation needs of which total some DKK 3bn over the next 15 years. Information about the occurrence of heavy downpour is used in connection with dimensioning sewer systems, where the economic aspect consists in weighing the additional costs of construction and replacement incurred by a larger dimensioning against the reduced expenses in connection with flooding. In view of the value of the sewer system and the substantial costs of maintenance and replacement, major economic gains rely on the opportunity to make this decision based on well-documented meteorological data. Information about extreme rain is also used by insurance companies in connection with the settlement of e.g. water damage claims. The use of extreme rain information may be illustrated as shown in Table 5 Table 5: Use of extreme rain information Examples of users Examples of decisions Examples of benefits Hydrology researchers Input for climate research Forms the basis of decisions in the
short and the long term Municipalities, counties, and other relevant bodies
Planning, analysis, and management of sewer and waste water treatment plant capacity. Decisions about e.g. extensions, renovation, etc.
A more efficient and environmentally friendly operation of sewer systems and waste water treatment plants
Insurance companies Settlement of claims in connection with heavy downpour
More fair settlements of insurance claims. Fewer are able to commit fraud against the insurance company
A weighing similar to the one regarding dimensioning of sewer systems may be found in the dimensioning of dykes, where DMI’s storm surge warnings are part of the decision basis, both with regard to the concrete dimensioning and as regards decisions about precautionary emergency efforts such as evacuation. The use of storm surge warnings may be illustrated as shown in Table 6. Table 6: Use of storm surge warnings Examples of users Examples of decisions Examples of benefits Relief work authorities, harbour authorities, Danish Coastal Authority
Decisions about safeguarding harbours and dykes against flooding
Less damage to the harbours and neighbouring areas
Boat owners and people living on the coast
Decisions about safeguarding against flooding and whether vessels are to be secured or moved to another harbour
Less damage for persons and companies having vessels or property in the harbours and along the coasts concerned

13
A fourth example is DMI’s slippery-road warnings, which form the basis in part of the road-users’ decisions regarding means of transportation, hour for, and speed, and route of travelling, and in part of the road authorities’ planning of slippery-road prevention. The meteorological service thus paves the way for time gains, because the road-users reach their destinations faster, and reduced costs due to a reduction in the number of traffic accidents. The economic value of slippery-road warnings may be illustrated by comparing the time gain achieved by the road-users owing to improved passability resulting from timely road salting/snow clearance with the costs of road salting/snow clearance and warning. The economic calculation discussed in detail in Appendix 3 shows that gains and costs break even, if slippery-road prevention reduces the slippery-road period by a bit less than seven hours. That is to say that if the slippery-road warning and the subsequent slippery-road prevention lead to the period, where road-users experience slippery roads, being reduced by seven hours a year, the system yields a profit. DMI’s slippery-road warnings thus are of significant economic value. It may be added that the slippery-road warnings also contribute to a reduced number of accidents; this was not included in the above calculation. A fifth example illustrates how meteorological service may address both the future and the historical weather development. DMI issues both lightning forecasts and statistics of actual lightning occurrences. The forecasts are used e.g. in connection with decisions about cancellation or rerouting of aeroplanes and contribute in this way decisively to aviation safety and economy. Information about the actual occurrences of lightning strokes is used by utility suppliers in connection with fault-finding when lightning strokes have caused damage. In this manner, meteorological service contributes to a shorter duration of a power cut which is of great economic value. The use of lightning information may be illustrated as shown in Table 7. Table 7 : Use of lightning information Examples of users Examples of decisions Examples of benefits Utility suppliers Used for locating reported errors
on the grid and power stations. Decisions may be e.g. the allocation of staff, and whether to shut down or open various installations, etc.
Faster damage repair work on the supply network. Increased reliability of supply for citizens and companies
Insurance companies Used for settling insurance claims concerning fire and electrical appliances. Decisions may be e.g. whether there are grounds for compensation in a given case
More fair settlements of insurance claims. Fewer are able to commit fraud against the insurance company
Aviation Used to determine whether it is safe to fly and by what route to fly
Prevents accidents caused by lightning strokes in aeroplanes

14
2.7. Future Challenges Meteorological services generate value in a large variety of contexts because, among other reasons, they have been finely adjusted to the many different needs in society for such services. It is an important challenge to ensure that the quality of meteorological services may continue to increase, and that the meteorological services are adjusted to society’s numerous needs for knowledge about the weather development. DMI is therefore constantly working on refining its products and on developing new products. To this end, an effort is made always to have an up-to-date technological infrastructure, just as international research and development projects regarding the improvement of the data basis and analytical methods are highly prioritized. As an example, it is worth mentioning that in 2006 DMI will extend the seven day forecast out to ten days. With this, DMI and society profit from many years’ international collaboration within the framework of the European Centre for Medium-Range Weather Forecasts (ECMWF) about developing and improving the quality of the mid-term weather prognoses, they being the basis of this development. The perspectives of new and more user-targeted meteorological services are great, and aided by new and improved technological possibilities meteorology will also in the future generate revenue. The continued development of the economic analysis may be an important analytical tool in the continued development of the meteorology field.

15
3. Information Flow at DMI 3.1. Purpose The first step in the analysis of the economic value of meteorological services is to determine which services are offered by DMI, and how they connect with each other. In Section 3, the existing information flow at DMI is therefore reviewed. For the sake of clarity, the description will be divided into three different elements:
Data: including measurements from a broad range of sources in Denmark and data received from sources abroad
Processes: comprising the processing of the data received, e.g. various models and real time information handling in large databases
Products: the results of the data and the processes, e.g. in the shape of weather forecasts, warnings, and so on
These three elements constitute the DMI information flow and may be seen combined in Figure 3.1. As is clear from the figure, by far the majority of the services depend on meteorological data from many sources, just as most of the data are used in several contexts. The blue boxes show the raw data used by DMI, the grey boxes show the processes, while the red boxes show the product groups. The blue boxes appear in three nuances, light blue for the data collected by DMI itself, and dark blue for the boxes DMI does not collect itself. The medium blue boxes illustrate that DMI handles the collection of some of the data, while some are received from other sources. The arrows of the chart illustrate how information in the shape of e.g. observations flows to the processes where it is used, and from there to the product groups that are the result of the data processing. The blue arrows indicate that the data are raw or semi-processed. The red arrows indicate that the data have been subject to further processing, e.g. in a model or by being integrated with other data in a database. Figure 3.1. Information flow at DMI (large version on inside cover)
In the following, the data, processes, and products present in the figure are described in more detail. 3.2. Data DMI collects data from a number of sources – some financed by DMI (possibly through commercial activities), others via international networks of meteorological data exchange.
16
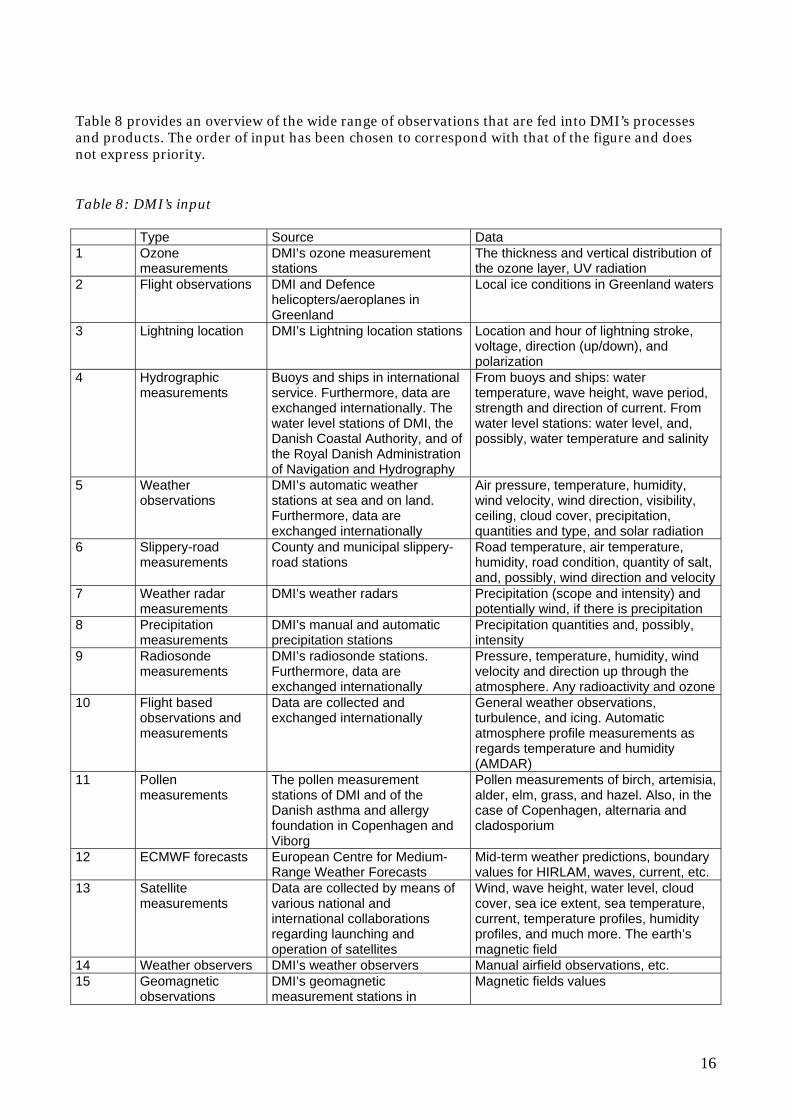
Table 8 provides an overview of the wide range of observations that are fed into DMI’s processes and products. The order of input has been chosen to correspond with that of the figure and does not express priority. Table 8: DMI’s input Type Source Data 1 Ozone
measurements DMI’s ozone measurement stations
The thickness and vertical distribution of the ozone layer, UV radiation
2 Flight observations DMI and Defence helicopters/aeroplanes in Greenland
Local ice conditions in Greenland waters
3 Lightning location DMI’s Lightning location stations Location and hour of lightning stroke, voltage, direction (up/down), and polarization
4 Hydrographic measurements
Buoys and ships in international service. Furthermore, data are exchanged internationally. The water level stations of DMI, the Danish Coastal Authority, and of the Royal Danish Administration of Navigation and Hydrography
From buoys and ships: water temperature, wave height, wave period, strength and direction of current. From water level stations: water level, and, possibly, water temperature and salinity
5 Weather observations
DMI’s automatic weather stations at sea and on land. Furthermore, data are exchanged internationally
Air pressure, temperature, humidity, wind velocity, wind direction, visibility, ceiling, cloud cover, precipitation, quantities and type, and solar radiation
6 Slippery-road measurements
County and municipal slippery-road stations
Road temperature, air temperature, humidity, road condition, quantity of salt, and, possibly, wind direction and velocity
7 Weather radar measurements
DMI’s weather radars Precipitation (scope and intensity) and potentially wind, if there is precipitation
8 Precipitation measurements
DMI’s manual and automatic precipitation stations
Precipitation quantities and, possibly, intensity
9 Radiosonde measurements
DMI’s radiosonde stations. Furthermore, data are exchanged internationally
Pressure, temperature, humidity, wind velocity and direction up through the atmosphere. Any radioactivity and ozone
10 Flight based observations and measurements
Data are collected and exchanged internationally
General weather observations, turbulence, and icing. Automatic atmosphere profile measurements as regards temperature and humidity (AMDAR)
11 Pollen measurements
The pollen measurement stations of DMI and of the Danish asthma and allergy foundation in Copenhagen and Viborg
Pollen measurements of birch, artemisia, alder, elm, grass, and hazel. Also, in the case of Copenhagen, alternaria and cladosporium
12 ECMWF forecasts European Centre for Medium-Range Weather Forecasts
Mid-term weather predictions, boundary values for HIRLAM, waves, current, etc.
13 Satellite measurements
Data are collected by means of various national and international collaborations regarding launching and operation of satellites
Wind, wave height, water level, cloud cover, sea ice extent, sea temperature, current, temperature profiles, humidity profiles, and much more. The earth’s magnetic field
14 Weather observers DMI’s weather observers Manual airfield observations, etc. 15 Geomagnetic
observations DMI’s geomagnetic measurement stations in
Magnetic fields values

17
Denmark and Greenland 16 Ionosphere
measurements DMI’s own measurement stations in collaboration with international partners
Electro-magnetic conditions in space and at the earth’s surface
3.3. Processes DMI uses a large number of processes in its work. These processes comprise generally specialist knowledge, observation databases, models, etc. Table 9 provides an overview of the primary processes at DMI Table 9: DMI’s processes Process Comments Chemistry model This model uses input from, among other sources, HIRLAM for the purpose of smog
and ozone warnings Knowledge base Consists of the aggregate specialist knowledge of DMI’s employees and the
information stored in the institute’s databases Observation databases
DMI has a series of observation databases, of which the most important ones are the climate database and various real time databases. The real time database contains the most recent observations, while the climate database contains historical data (more than 48 hours old)
Climate modelling Climate modelling is used to predict the future climate in Denmark in the long term Weather modelling Modelling and preparation of weather predictions are carried out by means of DMI’s
High Resolution Limited Area Model (HIRLAM). These predictions are used both directly to form the basis of weather forecasts and indirectly in other models. The models are run on a high speed computer
Ocean model This model uses input from, among other sources, HIRLAM for the preparation of oceanographic prognoses, hereunder predictions of water levels along the coast to be used for storm surge warnings
Slippery-road model This model uses input from, among other sources, HIRLAM for the preparation of slippery-road predictions
Air spread model This model uses input from, among other sources, HIRLAM for the preparation of spread and deposit predictions of e.g. chemical, bacteriological, and radioactive pollution of the atmosphere
Meteorologist’s desk This tool is an IT system collecting and presenting all the knowledge needed by the meteorologists in order to interpret and communicate weather predictions
dmi.dk DMI’s website is not merely a communication service to the public, but is also used for actually generating certain special products, e.g. in the shape of graphics
3.4. Products The data collection and the processing lead to a great number of different products. For the sake of clarity, the products have been placed in product groups that may profitably be regarded under one heading. Table 10 provides an overview of the product groups offered by DMI. Table 10: DMI’s product groups Product group Description 1 Consulting services and
education DMI carries out investigations, solves special assignments, etc., of a meteorological, climatological, or oceanographic nature. Furthermore, DMI has a teaching obligation regarding the education of meteorologists at the University of Copenhagen

18
2 Research projects Carries out research projects within the institute’s fields. For instance tasks put up for tender by EU
3 Sea ice information The product group sea ice information covers information about the passability of the waters at Greenland, hereunder the location and thickness of the ice, and routing guidance as to the safest/most energy efficient route (ice piloting)
4 Answering enquiries The product group answering enquiries comprises e.g. parliamentary questions, queries from the police, insurance companies, interviews with the press, school services, and enquiries from private citizens and companies
5 Radar and lightning information Radar and lightning information covers, among other things, current overviews of lightning strokes and radar images published on DMI’s website, and special information about lightning occurrences
6 Raw observation data Very often, DMI conveys or sells weather data to e.g. authorities, researchers and others, who on an ad hoc basis need specific information about the current or past weather situation
7 Climate monitoring The product group climate monitoring covers generally the many different climate activities that DMI are involved in. Climate scenarios, seasonal predictions, etc.
8 Extreme rain information Information about the occurrence of extreme precipitation is used in arrear by insurance companies and others, in real time for the management of overfall constructions, basins, etc., and future-oriented for the dimensioning of new sewer systems, etc.
9 Oil drift predictions Oil drift predictions show where oil spills are expected to head (or, possibly, where the spill occurred)
10 Storm surge warnings Storm surge warnings are warnings about an expected raised water level in exposed harbours or low-lying land areas
11 Oceanography Oceanography is primarily predictions of current, waves, and sea temperature. The information is used by e.g. the shipping and fishing trades, the off shore industry and yachters. Is conveyed primarily through www.dmi.dk
12 Slippery-road warnings Slippery-road warnings are warnings of possible occurrences of slippery roads and are used by municipal authorities in connection with snow clearance, salting, etc., and as a general warning to road-users
13 Military products Military products comprise such products and services as are needed for carrying out military operations, hereunder peace-keeping tasks abroad
14 Magnetic instruments The manufacture and international vending of high precision magnetic instruments
15 Health warnings The product group health warnings comprises e.g. pollen and sun warnings
16 Aviation weather The product group comprises four products: METAR – the current weather at the airport, TAF – the weather in the next hours, SIGMET – danger alerts, and TREND – landing prognoses out to two hours
17 Emergency alert scheme Nuclear and chemical emergencies, smog and ozone alerts, veterinarian alert scheme, and terror emergency alert
18 Ordinary weather forecasts/warnings
The product group Ordinary weather forecasts/warnings covers, respectively, the general forecasts issued by DMI, including regional forecasts, sea areas forecasts, world weather, skiing forecasts out to 1-7 days, and gale, storm, and icing warnings. Communication takes place through a variety of media (dmi.dk, radio, television, telephone, newspapers, etc.)
19
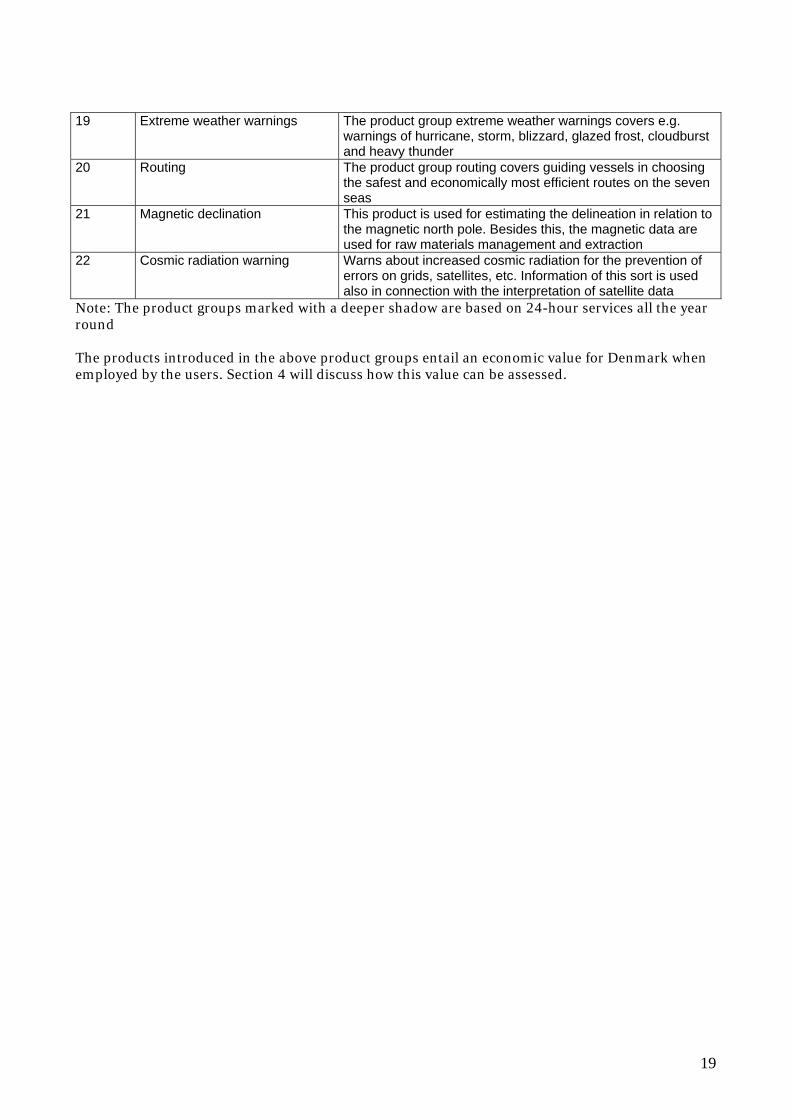
19 Extreme weather warnings The product group extreme weather warnings covers e.g. warnings of hurricane, storm, blizzard, glazed frost, cloudburst and heavy thunder
20 Routing The product group routing covers guiding vessels in choosing the safest and economically most efficient routes on the seven seas
21 Magnetic declination This product is used for estimating the delineation in relation to the magnetic north pole. Besides this, the magnetic data are used for raw materials management and extraction
22 Cosmic radiation warning Warns about increased cosmic radiation for the prevention of errors on grids, satellites, etc. Information of this sort is used also in connection with the interpretation of satellite data
Note: The product groups marked with a deeper shadow are based on 24-hour services all the year round The products introduced in the above product groups entail an economic value for Denmark when employed by the users. Section 4 will discuss how this value can be assessed.

20
4. Method for Mapping the Economic Value of Meteorological Services In very general terms, the economic value of an activity is measured by mapping benefits and disadvantages of a situation ‘with the activity’ compared to the situation ‘without the activity’. This applies, whether the activity is a road investment or a meteorological service. In its manual for economic analysis, its applied methods and practice (‘Manual for samfundsøkonomisk analyse – anvendt metode of praksis på transportområdet’), the Danish Ministry of Transport and Energy provides a number of recommendations with respect to the transport area, where these analyses are widely used. In the meteorology field, economic analyses have not been employed to any large extent, but the reasoning behind the methodology is to a certain degree analogous with the transport area. In Section 4, first the theoretical framework for economic analyses in the field of meteorology will be briefly described. It will show that the decisions taken on the basis of the meteorological information is the centre of rotation in a mapping of the economic value of the information. Subsequently, it will be discussed which types of decisions are taken on the basis of the information. Finally, a proposal for an analytical framework for economical analyses in the field of meteorology will be made, and a possible quantification of the effects will be discussed. 4.1 Methodological Framework The methodological framework is derived from a literature study, which may be found in Appendix 1, and illustrated with examples. The economic value of information, hereunder meteorological value, may be generated in two different ways:
1. Information causing a decision to be altered (flying/not flying, taking/not taking medicine for pollen allergy, etc.)
2. Information causing no alteration of a decision, but which is nevertheless of some worth to the receiver (it is good to know that the weather will be fine tomorrow) – a kind of existence value
Of the two, the value of the information under item 1 is the more thoroughly treated in the literature, and it is also this type of information that this report will primarily discuss. First of all, information under item 2 is more difficult to sum up, and, secondly, the risk of double counting in relation to item 1 is imminent. Information mentioned under item 2 is therefore discussed only briefly in subsection 4.3. The economic value of meteorological information of type 1 may be mapped as follows:
1. Identify the event and the appurtenant information 2. Identify the decision-maker 3. Identify the basic situation 4. Identify the decision 5. Identify the costs and gains of taking the decision and of not taking the decision 6. Calculate the economic value
These steps will be discussed into the following.

21
1. Identify the event and the appurtenant information Usually, it is fairly simple to identify the observed event and also the appurtenant information. The event may be a hurricane and the information a hurricane warning. Or the event may be a lightning stroke and the appurtenant information a given date. 2. Identify the decision-maker The decision-maker must be the person or authority directly taking a decision regarding the event and based on the information1. 3. Identify the basic situation The basic situation is the situation the decision-maker is in without the information. Quite often, it may be difficult to identify the basic situation2; but it is absolutely pivotal in order to assess the economic value that the comparison is clearly defined. It will vary from case to case which point of departure – or basic situation – is the relevant one. In the vast majority of cases, the literature employs the basic situation, where information is not available at all. Another option is to refer to different levels of information; this is theoretically possible, but extremely difficult in practice. In most cases, the information concerns the weather in the near future. Therefore, the information will be able to supplement the subjective opinion about the weather, which the decision-maker may be presumed to have formed in advance. By merely looking out the window, the decision-maker will have a reasonably fair impression of the weather in the shorter term. Because of this, it is reasonable to assume that the decision-maker will have a moderate level of knowledge concerning the future weather in advance. There is a twist to the story, though. In some cases, the question is what the weather is like elsewhere – say, high up in the air in the case of pilots. Also here it may be assumed that a pilot’s considerable experience with reading the weather will afford him a certain level of knowledge. This is also reflected in the fact that Squadron 722 uses the weather forecasts the more intensively in bad weather. The decision-maker may form his own idea of the future weather in several ways. As mentioned already, he may look out the window and have an impression of the weather for the next couple of hours3. If the time frame is slightly longer, an assumption of persistence may be used. Persistence is a frequently used term in meteorology suggesting that a sensible guess at the weather tomorrow is the weather today. Persistence is also used as a basic situation when DMI assesses the quality of its weather forecasts. 4. Identify the decision Usually, the decision is readily identified. It may be, for instance, whether to fly, whether to secure the windows in case of a hurricane warning, whether to pay out compensation following a lightning stroke, whether to give the boat’s moorings some slack, etc. The decisions that are improved by DMI’s product groups may be divided into three categories – illustrated here with a few examples:
1 There may easily be many persons affected by the decision, but they are less relevant in this step 2 This applies also to the transport area, and it is thoroughly discussed in the manual from the Ministry of Transport and Energy 3 The weather in Denmark is more stable than in many other countries. Moving about in mountainous areas, for instance, it is very important to pay attention to the weather, as it may change very rapidly

22
Decisions as to the safety of going through with an activity Appendix 1. Is it safe to fly/sail/drive/go now?
Decisions as to the performance of an activity Appendix 2. Which route should I choose when I fly/sail? Appendix 3. Should we have a garden party or stay indoors? Appendix 4. How is the new sewer system/bridge/house to be dimensioned?
Decisions as to the safety of human life or property Appendix 5. Should I dismantle the scaffolding? Appendix 6. Should I move my boat? Appendix 7. Should I spray against potato blight?
5. Identify the costs and gains of taking the decision and of not taking the decision Costs and gains of the decision (and the action occasioned by the decision) will hereinafter be drawn up in a matrix as the one shown below. Table 11: Cost matrix No decision/action Decision/action Event A happens Type 1 costs Type 2 costs Event A does not happen Type 3 costs Type 4 costs In the table below, an example is given, where the event is a hurricane, the information is a hurricane warning, and the decision concerns securing a property. Table 12: Cost matrix in the case of a hurricane and the decision to secure a property Does not secure property Secures property Hurricane Damage costs to a non-secured
property owing to a hurricane Costs of materials. Time for securing the property. Any damages to the property in spite of its having been secured. Anxiety about the coming hurricane. Etc.
No hurricane 0 Same as above The various types of costs are discussed below.
Type 1 costs are typically the greatest costs, namely the cases where no action has been taken, and the event occurs anyway. It may be costs in connection with flooding, fatalities, or the like
Type 2 costs are typically smaller than Type 1 costs. They are the direct costs of taking action (covering up, not flying, or the like), the damage of taking the decision, and the damages occurring in spite of taking the decision
Type 3 costs are typically relatively low, frequently 0: action was not taken, but also the event never occurred
Type 4 costs are usually equal to Type 2 costs, but they are not necessarily identical Evidently, in most cases it will be sufficient to map type 1 and 2 costs, because 3 and 4 will usually be consequent thereof. It is important to realize that the economic consequences of a decision for society does not always match the personal economic consequences on which the decision was based. People, who are insured, is an example: here the personal economic costs may be low because the persons will be compensated, whereas the economic costs for society are higher. Another example is the decision whether or not to drive, even though a slippery-road warning has been issued. The personal economic consideration would be to balance the importance of one’s business against the expected

23
loss of having an accident – this including the problems of perhaps having to go to hospital. The economic consequences for society of a person having a car accident are greater. They include also e.g. the costs of the hospitalisation itself. Assessment of cost types 1-4 in the different combinations of decision/action and the result of the event will constitute the basis of the further calculation of the economic value to society of meteorological information. 6. Calculating the Economic Value The economic value of the information is based on the difference in expected value of the decision, one would have made without the information, and the decision made having the information. The value of meteorological information is therefore not to be evaluated on the success of the weather prediction, but on the economic value of the information to the decision-maker, before the result of the weather is known. The decision-maker bases his decision on the expected value of the various possible actions at his disposal. He opts for the action with the highest expected value. In a case such as a hurricane, where all possible actions entail a potential loss, the action with the least potential loss is chosen. When the decision-maker receives the meteorological information, this must be combined with his existing, subjective opinion about the weather (i.e. his knowledge about the weather in the basic situation, as identified under item 3) in a consistent manner. This is done by means of so-called Bayesian updating. In this way, the meteorological information alters the probability distribution, on which the assessment of a given action’s expected value is based. It follows that the expected value of the decision-maker’s possible actions is altered also. It is when this alteration in the expected value occasions a change of behaviour that the information is of economic value. Quite often, the updating of the probability distribution in the meteorological field may be illustrated as in the figure below. Figure 4.1 Illustration of the basic situation – the decision-maker’s assessment of the probability of event A with and without the information Assessment of the probability of event A without the information (columns omitted, translator’s note)
Assessment of the probability of event A with the information
The figure illustrates that the information makes a difference, insofar as it alters the decision-maker’s perception of the probability of event A. Sometimes, e.g. in the case of lightning strokes, Y will be close to 100, in the sense that after the fact DMI may say with great certainty, whether or not there was a lightning stroke. The box below illustrates how updated probability distributions influence the decision-maker’s actions, and how this may afford the information a value.

24
Box 1: Example of calculation of economic value (in DKK) Example: Hurricane warning The probability of a hurricane tomorrow – without information from DMI: 5%4 The probability of a hurricane tomorrow – with information from DMI: 30%5 The costs of securing the property is set at a presumed 51,000, and it is presumed that the securing hinders any damage from the hurricane, if it occurs. Finally, it is presumed that a hurricane will cause damage to an unsecured property in the amount of 1,000,000. Costs Does not secure Secures Hurricane 1,000,000 51,000 No hurricane 0 51,000 Expected costs without information Does not secure: 5%*1,000,000 + 95%*0 = 50,000 Secures: 5%*51,000 + 95%*51,000 = 51,000 The decision of not securing having the highest expected value (lowest costs), the decision-maker chooses on this background not to secure the property. Expected costs with information Does not secure: 30%*1,000,000 + 70%*0 = 300,000 Secures: 30%*51,000 + 70%*51,000 = 51,000 The decision-maker chooses here to secure the property, this being expectedly by far the least expensive solution Had the decision-maker not received the information from DMI, he would have maintained his decision not to secure his house. The economic value consequently is: 300,000 – 51,000 = 249,000 Note that in order to calculate the aggregate economic value to society, it is necessary to sum over all the decision-makers, who get a value from the information6. In order for this to make sense, it is necessary to assume that all the decision-markers are in the same basic situation, i.e. that they share the same expectations with regard to the weather, before they receive information from DMI. The probability of a hurricane occurring – given that no information is received from DMI – is therefore assumed to be an expression of the average hurricane frequency conditioned by the current weather situation. Note that it is valuable to identify the probability distribution whether the decision-maker does or does not receive the information. Without the information, for example, the distribution will vary according to the experience of the decision-maker.
4 This percentage indicates the decision-maker’s expectation of a hurricane tomorrow, based on his own experience with the weather, including, among other things, the hurricane frequency at this time of year. 5 Normally, DMI only predicts hurricane/no hurricane and not probabilities. In the example, it is assumed that the warning means, from experience, that there is a 30% probability of a hurricane, and this is known to the decision-makers. 6 In some cases, there will be only one decision-maker. In such an event, obviously the summing issue is a moot point.

25
Thus, quantifying the effect of the information on the decision-maker’s probability distribution may possibly be the most difficult task connected with the statement of the economic value of meteorological information. The realized value to society depends, as mentioned before, on the degree, to which the weather forecast subsequently alters the decision-makers’ estimate of the probability of the given weather occurring. This estimate forms the basis of the decision-makers’ actions, so the better the decision basis at hand, the more optimal the decision-makers’ actions. It being, as mentioned above, difficult empirically to measure the degree, to which weather forecasts alter the decision-makers’ estimate, one may instead choose to ‘calculate backwards’, that is to say to calculate, how much weather forecasts have to alter the decision-makers’ estimate (and thus their actions) in order for the economic value to society to stay positive. The point of departure of this analysis is an assessment of how much society saves every time DMI correctly warns about or predicts a given kind of weather. In the analyses, the starting point will therefore be how many expenses the weather forecasts may contribute to ‘sparing’ society in the shape of prevented accidents, fatalities, and so on compared to the costs of the effort. The calculation is comparable to the values appearing in the chart in the example in box 4.1. This approach, also called a cost-effectiveness analysis, lies behind the calculations in the three case studies and the general overview over the importance of DMI’s services in Section 5. By going through the six steps for mapping the economic value to society of a meteorological piece of information as described earlier, it is thus possible to map its economic value to society. For the purpose of facilitating this assessment in practice, we have, based on consultations with DMI and inspiration from existing literature in the area, set up a generalized, analytic framework for identifying the weather forecasts’ possible influence on the economy. The analytic framework may be profitably used for economic analysis in the field of meteorology. 4.2. Proposed Analytic Framework for the Economic Assessment of Meteorological Services The ambition of the analytic framework is to be able to fill out charts like those exemplified in box 4.1. An analytic framework for the assessment of the economic significance of the different situations and actions is therefore needed. The economic significance to society of each of DMI’s products varies of course, depending on the product observed. However, it is to a very large extent the same elements that form part of the economic analysis. Consequently, it is possible to set up a general analytic framework applicable to the vast majority of DMI’s products7. The general analytic framework contains three main topics: Consequences for people, property, and nature and the environment. Under each heading, the directly quantifiable costs and the additional economic costs for society are found. These dimensions are illustrated in the table below.
7 Excepted are some types of research that do not in the same way lead to concrete actions among users. The economic value to society of research probably has to be measured indirectly by means of the aggregate economic value of improved products from DMI. This type of question, however, cannot be analyzed within the outlined, general analytic framework

26
Table 13: Cost categories for an economic analysis of meteorological information Consequences for Direct costs Additional costs People For example: hospital costs/costs
of relief services. Loss of income For example: Loss of welfare in connection with e.g. death, illness or problems
Property (including production facilities in the shape of machinery and livestock)
For example: costs of repairs, renovation and protective measures
For example: loss of cultural values and sentimental values
Nature and the environment For example: expenses for renovation and protective measures
For example: loss of amenity value
When one wishes to conduct an economic assessment of a certain kind of meteorological information (product), one must for each of the cost types 1-4 described in Table 11 go through the chart and investigate which of the above cost categories are relevant. 4.3. Quantification of Cost Categories The economic value to society of a given thing – for instance, a weather forecast – must, as described above, be measured in monetary terms. Some of the costs may be quantified fairly precisely. This goes e.g. for costs of injuries in connection with accidents, say, hospital and medicine expenses, lost income, and so on. The same applies to costs in connection with property being lost, needing repairs, moving, or protective measures. Loss of welfare in connection with illness, death or problems is also one of the areas, where economic analysis has made considerable headway. It is possible to measure in financial terms human life and various illnesses, whereas costs of problems for instance may be measured on a time basis. As regards traffic economic assessments, a standard practice has evolved, by which the value is measured in lost time. Finally, there are the consequences which are exceedingly difficult to quantify, e.g. loss of amenity value with respect to cultural objects, nature values, and property of sentimental value. These items may be assessed by means of e.g. specially prepared questionnaires. Such investigations are subject to a fairly great uncertainty, though. Other than this, cf. the Ministry of Transport and Energy’s manual for economic analysis, where the valuation of key elements are described. Quantification of existence value Quantification of the existence value of meteorological information - i.e. that it is of economic value to society to have weather forecasts, even though decisions are not based on them – constitutes a particular problem. Example: Weather forecasts on holidays It is widely used among charter companies to put up weather forecasts for Denmark on their information boards, so that the tourist may experience a certain malicious pleasure from being on vacation. The existence value may very well be real, and it may indeed be mapped by means of specially prepared questionnaires.

27
In this regard, one must be careful, though, not to double count, the respondents perhaps having difficulties distinguishing the value of the information used for making decisions (and which are therefore counted elsewhere) from the information not improving a decision.

28
5. Overview of the Economic Value of DMI’s Services To present an overview of the economic value of DMI’s services, we have subdivided DMI’s product groups according to their importance to various user groups. Subsequently, we have used the analytic framework at a general level8 and then grouped DMI’s product groups by their expected economic value. The allocation of the individual products and users is based on considerations described in Section 6. 5.1. The Categories The categorization is based on the number of decision-makers receiving DMI’s products and the extent of the economic significance of the information. The economic significance is here measured as the cost-loss ratio9. For each decision, the potential losses the decision-maker may suffer, if he does not have/uses the information about the weather from e.g. DMI, will be considered. If there are many decision-makers, and if the information is of great economic importance to each of them, then the product is of great economic value all in all. On the other hand, the economic importance is smaller if there are few decision-makers, and if the economic importance to each of them is small. Assessing whether a product that influences many decision-makers, but is of comparatively small importance to each of them, is more important all in all than a product, which has few decision-makers, but to each of whom it is of comparatively great importance, is indeed more difficult. Thus, the ordering of the categories should not be taken to mean that we have determined which of these two situations is of the greater economic importance. There is neither an obvious nor an ‘official’ definition of precisely how many decision-makers constitute ‘many’, nor exactly when a product, from an economic perspective, is ‘very important’. In this project, the groups have been pragmatically subdivided as shown in table 14 below, Table 14: Definition of categories Nomenclature Definition Few < 1,000 direct decision-makers Many > 1,000 direct decision-makers Important < DKK 1,000 per decision-maker per decision Very important > DKK 1,000 per decision-maker per decision By direct decision-makers is meant persons/companies taking decisions based on the DMI information. Persons/companies affected by these decisions do not count as direct users. The limits of 1,000 direct receivers and DKK 1,000 per decision are established on pragmatic considerations, but the concrete values are in fact of minor importance. The limits will, in most cases, be far away. A fighter-plane, for instance, lost due to lightning stroke will cost several million, while, presumably, for the general public the personal value of a given information in many cases will be economically miniscule. Likewise, the number of private citizens/fishermen/farmers has to counted in millions or tens of thousands, whereas there are only a few e.g. insurance companies in Denmark. Moreover, it must be noted that the economic importance of a product may vary from one decision-maker to the other. As a result, here the typical (or average) importance of the product to the group of decision-makers will be considered. This corresponds to the way, in which economic importance is to be calculated according to Section 4, where the centre of rotation is the decisions made based on the information. An example might 8 As basic situation we have taken as our point of departure that the information was not available at all 9 See Appendix 1 for a precise definition of this concept

29
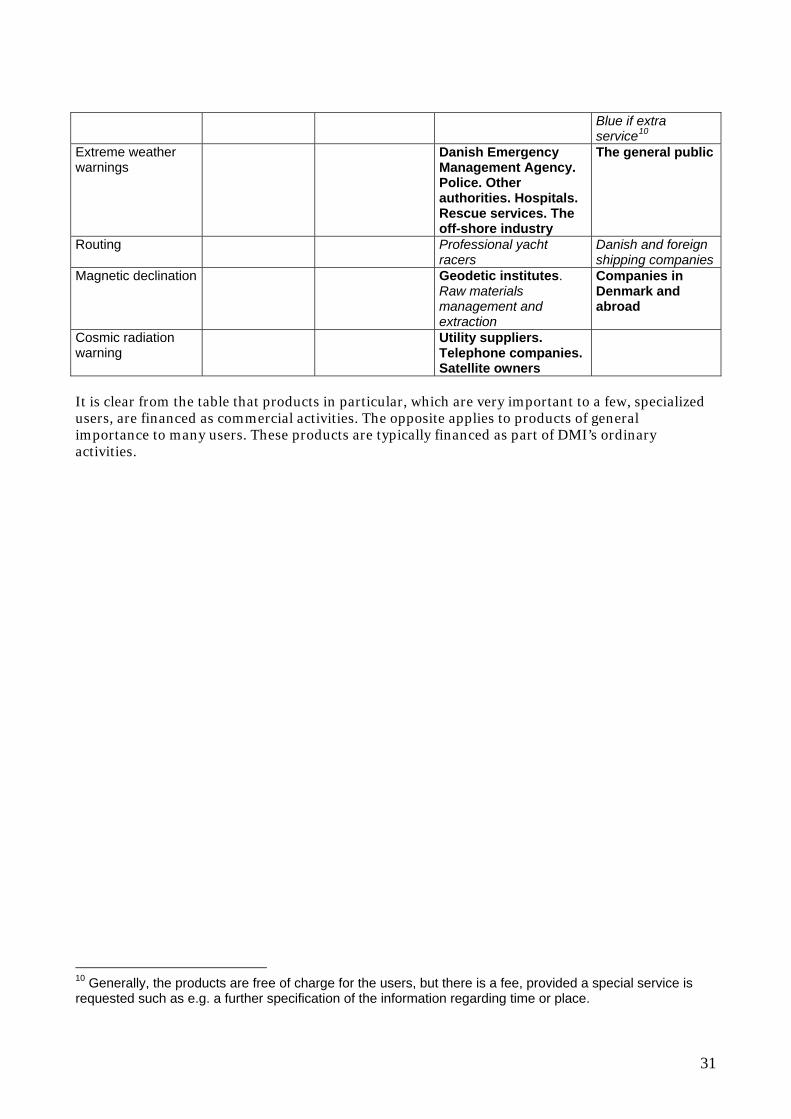
be aviation weather, where the direct decision-makers are the airline companies and so on, while the indirectly affected are the travellers. The travellers do not count as users because they do not make any decisions themselves based on the information. On the other hand, the value of the travellers’ lives count, when the economic loss in connection with e.g. a plane crash is to be calculated. The table below shows the categorization of DMI’s product groups for various decision-makers. The overview shows the most important users and the economic importance. Furthermore, it must be noted that DMI is not listed as a user, even though many of the products are also used internally. 5.2. The Products’ Importance and Financing It is, furthermore, interesting to observe the connection between the importance of DMI’s products to the users and the price the users may pay for the products. The table below shows by means of colour codes whether users pay for the product or if it is a free service:
Users written in italic concerns commercial activities Users written in bold concerns ordinary activities (Financial Act appropriation) Users underscored concerns the source of funds ‘other financing’, this including e.g. en
route funds, appropriations from other authorities, and so on Users written in CAPITALS concerns mixed financing, where the source of funds cannot be
reasonably categorized Some users receive different products within the same product group, where some are financed as commercial activities, while others are not. For the sake of clarity, however, only four colours are used, indicating the primary form of financing. Table 15: Categorization of DMI’s products by number of decision-makers and importance Estimated importance
Important Very important
Decision-makers Few Many Few Many Consulting services and education
The University of Copenhagen. VARIOUS USERS FOR SPECIAL ASSIGNMENTS
Research results Meteorological institutes. DANISH AND FOREIGN RESEARCH GROUPS
Sea ice information Fishermen and sealers in Greenland
Grønlands kommando. 1. squadron. Climate researchers. Shipping companies. Raw materials searching
Answering enquiries School services. Police and courts
The general public. Companies
The Danish Parliament. Insurance companies. The press
Engineers and architects
Radar and lightning information
The general public
Utility suppliers. Insurance companies. Defence. Naviair/airports

30
Raw observation data
The general public. Companies. Societies
Other meteorological institutes abroad. Commercial meteorological services. Insurance companies. Researchers. Counties
The agricultural sector
Climate monitoring The Danish Parliament Engineers and architects. Researchers
Extreme rain information
Hydrology researchers. Municipalities, counties, and other relevant bodies. Insurance companies
Oil drift predictions Environmental authorities. Emergency management authorities. Municipalities and counties
Storm surge warnings
Emergency management authorities. Harbour authorities. Danish Coastal Authority
Boat owners. People living on the coast
Oceanography Yachters Researchers. The off-shore industry
The shipping and fishing trades
Slippery-road warnings
Transport authorities. Municipalities and counties. The Danish Road Directorate. The bridges
Road-users
Military products Defence Magnetic instruments
Public institutions worldwide
Health warnings The general public, incl. people with allergies
Aviation weather Airports. Airline companies. Defence pilots
Other pilots
Emergency alert scheme
Danish Emergency Management Agency. Police. Other authorities
The agricultural sector. Veterinary authorities. The general public
Ordinary weather forecasts/warnings
The general public. The tourist industry. The leisure sector
The energy sector The shipping and fishing trades. The transport sector. The agricultural sector. The building sector. Manufacturers.
31
Blue if extra service10
Extreme weather warnings
Danish Emergency Management Agency. Police. Other authorities. Hospitals. Rescue services. The off-shore industry
The general public
Routing Professional yacht racers
Danish and foreign shipping companies
Magnetic declination Geodetic institutes. Raw materials management and extraction
Companies in Denmark and abroad
Cosmic radiation warning
Utility suppliers. Telephone companies. Satellite owners
It is clear from the table that products in particular, which are very important to a few, specialized users, are financed as commercial activities. The opposite applies to products of general importance to many users. These products are typically financed as part of DMI’s ordinary activities.
10 Generally, the products are free of charge for the users, but there is a fee, provided a special service is requested such as e.g. a further specification of the information regarding time or place.

32
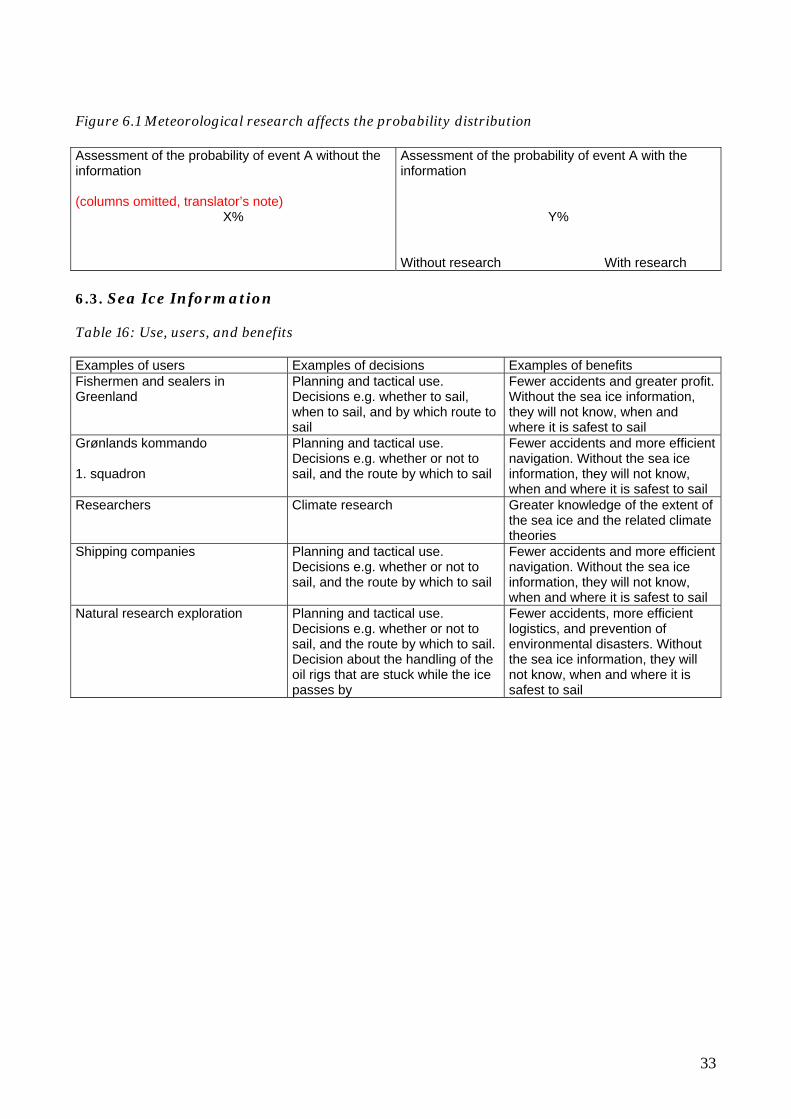
6. Economic Aspects of DMI’s Specific Products This section provides an overview of the users of the individual product groups as well as examples of the decisions the users make based on DMI’s information. Subsequently, the outlined analytic framework will be used on DMI’s product groups. The analysis thus points to the most important consequences to be included in an economic analysis of the product groups11. Generally, the number of decisions made based on the various products is difficult to discover. Many decisions are, after all, a series of part decisions. A ship’s captain must, for example, first decide whether he will sail, when he will sail, which route he will take, etc. As an approximation of the number of decisions, we have chosen to use the number of decision-makers. Undoubtedly, the number of decision-makers varies a great deal, depending on how specialized the information is, the time of year, etc. As a result, the only parameter used, based on interviews with DMI, is whether the number of decision-makers may be presumed to constitute more or less than 1,000. For some product groups, it makes no sense to prepare a complete overview, the value being different to the individual - and very varied – receivers of the product. This will be stated under the product. 6.1. Consulting Services and Education A complete overview of decisions cannot be prepared, the use being specific for the individual customer types. A special customer is the University of Copenhagen, where DMI teaches the university’s meteorology students. It may be presumed that these users are a relatively small group of people (less than 1,000 a year?), to whom the information in this product group is very important. The very fact that the users of these products take the trouble to request/pay for these special consulting services from DMI must imply that many of the decisions made by the users based on the information have a value of more than DKK 1,000. However, it cannot be ruled out that there are users of DMI’s consulting services, who make decisions, where the loss of a failed weather prediction is less than DKK 1,000. 6.2. Research Results The unique thing about research results is that, unlike the other product groups, they do not occasion concrete decisions. Instead, in many cases the research results have an impact on the certainty of the forecasts. In other words, Y in the figure below increases more with research than without it. Consequently, research affects the economic value of many, if not all, meteorological products.
11 Note that costs caused by the weather, and which are inevitable, regardless of the weather having been predicted or not, do not form part of the assessment. The reason is that these costs do not count as part of the economic value of weather forecasts – although of course they do count in the economic value of the weather.
33
Figure 6.1 Meteorological research affects the probability distribution Assessment of the probability of event A without the information (columns omitted, translator’s note)
X%
Assessment of the probability of event A with the information
Y% Without research With research
6.3. Sea Ice Information Table 16: Use, users, and benefits Examples of users Examples of decisions Examples of benefits Fishermen and sealers in Greenland
Planning and tactical use. Decisions e.g. whether to sail, when to sail, and by which route to sail
Fewer accidents and greater profit. Without the sea ice information, they will not know, when and where it is safest to sail
Grønlands kommando 1. squadron
Planning and tactical use. Decisions e.g. whether or not to sail, and the route by which to sail
Fewer accidents and more efficient navigation. Without the sea ice information, they will not know, when and where it is safest to sail
Researchers Climate research Greater knowledge of the extent of the sea ice and the related climate theories
Shipping companies Planning and tactical use. Decisions e.g. whether or not to sail, and the route by which to sail
Fewer accidents and more efficient navigation. Without the sea ice information, they will not know, when and where it is safest to sail
Natural research exploration Planning and tactical use. Decisions e.g. whether or not to sail, and the route by which to sail. Decision about the handling of the oil rigs that are stuck while the ice passes by
Fewer accidents, more efficient logistics, and prevention of environmental disasters. Without the sea ice information, they will not know, when and where it is safest to sail

34
Table 17: Estimated number of decision-makers and value Examples of users Number of decision-makers Estimated value Fishermen and sealers in Greenland
There are probably less than 1,000 fishermen and sealers in Greenland using sea ice information from DMI
Each decision probably has a value less DKK 1,000, fishermen and sealers presumably having in-depth knowledge of local conditions
Grønlands kommando 1. squadron
There are probably less than 1,000 officers making decisions based sea ice information
Each decision probably has a value larger than DKK 1,000, the economic consequences of a shipwreck being very substantial. Moreover, the sea ice information is probably of great value to the decisions of the ship’s captain and, as a result, to the probability of a shipwreck
Researchers There are probably less than 1,000 climate researchers worldwide using sea ice information during their research
Climate research overall probably has a value larger than DKK 1,000
Shipping companies There are probably less than 1,000 masters/ship’s captains navigating Greenland waters on a regular basis
Each decision probably has a value larger than DKK 1,000, the economic consequences of a shipwreck being very substantial. Moreover, the sea ice information is probably of great value to the decisions of the ship’s captain and, as a result, to the probability of a shipwreck
Natural research exploration There are 3-4 exploration companies where perhaps a handful of executives make decisions based on sea ice information
Each decision probably has a value larger than DKK 1,000, the economic consequences of a shipwreck being very substantial. Moreover, the sea ice information is probably of great value to the decisions of the ship’s captain and, as a result, to the probability of a shipwreck
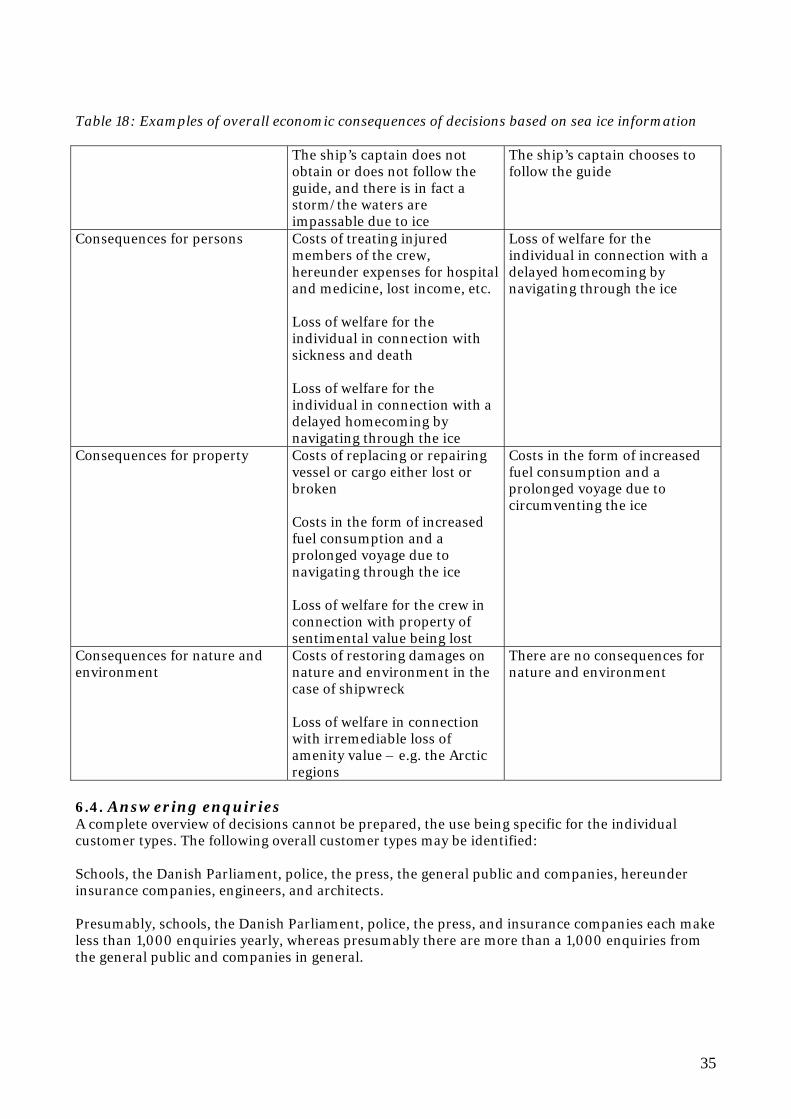
35
Table 18: Examples of overall economic consequences of decisions based on sea ice information The ship’s captain does not
obtain or does not follow the guide, and there is in fact a storm/the waters are impassable due to ice
The ship’s captain chooses to follow the guide
Consequences for persons Costs of treating injured members of the crew, hereunder expenses for hospital and medicine, lost income, etc. Loss of welfare for the individual in connection with sickness and death Loss of welfare for the individual in connection with a delayed homecoming by navigating through the ice
Loss of welfare for the individual in connection with a delayed homecoming by navigating through the ice
Consequences for property Costs of replacing or repairing vessel or cargo either lost or broken Costs in the form of increased fuel consumption and a prolonged voyage due to navigating through the ice Loss of welfare for the crew in connection with property of sentimental value being lost
Costs in the form of increased fuel consumption and a prolonged voyage due to circumventing the ice
Consequences for nature and environment
Costs of restoring damages on nature and environment in the case of shipwreck Loss of welfare in connection with irremediable loss of amenity value – e.g. the Arctic regions
There are no consequences for nature and environment
6.4. Answering enquiries A complete overview of decisions cannot be prepared, the use being specific for the individual customer types. The following overall customer types may be identified: Schools, the Danish Parliament, police, the press, the general public and companies, hereunder insurance companies, engineers, and architects. Presumably, schools, the Danish Parliament, police, the press, and insurance companies each make less than 1,000 enquiries yearly, whereas presumably there are more than a 1,000 enquiries from the general public and companies in general.

36
Most enquiries are probably made in connection with decisions where further information about the weather, additional to the decision-maker’s own expectation, has a value of less than DKK 1,000 (e.g. in connection with the planning of outdoor activities, general background information about the weather, etc.). However, it cannot be ruled out that sometimes the value is larger. It is probably only the Parliament, insurance companies, engineers, and architects that make decisions, where additional information about the weather has a value above DKK 1,000. The insurance companies, however, are probably able to settle claims without information from DMI about the weather, but the increased certainty of their decision probably saves the companies more than DKK 1,000 per enquiry. 6.5. Radar and Lightning Information Among other things, predictions of lightning are used for security as regards work on overhead high-voltage transmission lines and for warning pilots of any thunder in the area. However, part of the product ‘lightning information’ is a special case in this connection because it is not a question of prediction but of confirming an event. As a result, the analytic framework is only partially suitable for this product. Table 19: Use, users, and benefits Examples of users Examples of decisions Examples of benefits The general public Used by citizens as information
basis regarding the risk of rain and thunder this afternoon. Furthermore, lightning information is probably used by citizens, who are affected by damage to buildings, livestock or electrical installations. Leads e.g. probably to decisions about taking further precautions against the risk of lightning strokes, for instance in the form of a lightning rod
Makes it possible for the public to plan outdoor activities. Affords the public a possible explanation as to how the damage occurred Probably less damage in the future caused by lightning stroke
Utility suppliers Used, among other things, to locate reported errors on grid and power stations. Decisions may be e.g. the allocation of staff, and whether to shut down or open given installations, etc.
Faster damage repair work on the supply network. Increased reliability of supply for citizens and companies.
Insurance companies Used for settling insurance claims concerning fire and electrical appliances. Decisions may be e.g. whether there are grounds for compensation in a given case.
More fair settlements of insurance claims. Fewer are able to commit fraud against the insurance company.
Defence Used to determine whether it is safe to fly and by what route to fly
Prevents accidents caused by lightning strokes in aeroplanes
Naviair Used to determine whether it is safe to fly and by what route to fly
Prevents accidents caused by lightning strokes in aeroplanes

37
Table 20: Estimated number of decision-makers and value Examples of users Number of decision-makers Estimated value The general public The part of the public being
affected by lightning strokes (probably more than 1,000 yearly)
The general public probably only makes very few decisions based on lightning information, and further information concerning lightning strokes in relation to the public’s own assessment of the risk probably has a value less than DKK 1,000 for each. Even though some decisions are probably more costly – e.g. the installation of a lightning rod – concrete information from DMI will probably only to a very limited extent influence people’s decision whether or not to safeguard themselves
Utility suppliers There are two utility suppliers using this DMI service. There are probably less than a 1,000 decision-makers employed with these using DMI lightning information
The value of the lightning information to the utility suppliers is probably considerably higher than DKK 1,000. In other countries, lightning location systems are established by the utility suppliers themselves
Insurance companies There are 15 insurance companies using this DMI service. There are probably less than a 1,000 decision-makers employed with these using DMI lightning information
The insurance companies probably make decisions, where information about the weather additional to the insurance company’s own investigation of the event is worth more than DKK 1,000. The insurance companies are probably able to settle claims without information from DMI about concrete lightning strokes, but the increased certainty of their decision probably saves the companies more than DKK 1,000 per case
Defence Few decision-makers in the Defence, probably less than 1,000 using radar and lightning information
The value of a plane is very high. This combined with the risk of accidents probably makes the value of the information more than DKK 1,000
Naviair Few decision-makers at Naviair, probably less than 1,000 using radar and lightning information
The value of a plane is very high. This combined with the risk of accidents probably makes the value of the information more than DKK 1,000

38
Table 21: Examples of overall economic consequences of decisions based on sea ice information People do not act based on the
information about lightning occurrences
People choose to act based on the information about lightning occurrences
Consequences for persons No consequences for persons Reduced loss of welfare in connection with settlement of claims
Consequence for property No consequences for property Reduced compensations in connection with insurance claims, where it may be determined that the event was not caused by lightning. It must be added, though, that probably the lion’s share of this amount must be regarded as merely a transfer, the damage requiring repair in any case. Reduced costs of repairs of power stations and cables due to faster fault-finding
Consequences for nature and environment
No consequences for nature and environment
No consequences for nature and environment
6.6. Raw and Semi-Processed Observation Data A complete overview of decisions cannot be prepared, the use being specific for the individual customer types. The list of users includes among others: Yachting clubs, the general public, meteorological institutes abroad, commercial, meteorological services, insurance companies, researchers, counties, police and courts, the agricultural sector, engineers, and architects, the building sector. DMI’s web statistics on dmi.dk show that far more than 1,000 members of the public use raw and semi-processed observation data from DMI. Likewise, farmers, companies, and societies, each group of which comprise more than 1,000 decision-makers. On the other hand, yachting clubs, meteorological institutes abroad, commercial, meteorological services, insurance companies, researchers, and counties probably each group of which comprise less than 1,000 decision-makers. In many cases, a separate enquiry (or fee) to obtain meteorological raw data from DMI is required, which is probably used mainly in connection to decisions with a value of more than DKK 1,000. The exception is leisure related use e.g. by the general public, companies, and societies where decisions in connection with the planning of outdoor activities are probably of a lower economic value.

39
6.7. Climate Monitoring Table 22: Use, users and benefits Examples of users Examples of decisions Examples of benefits The Danish Parliament The parliament makes a number of
decisions, where climate issues are addressed
Reduced discharge of climate-affecting agents
Researchers Researchers probably do not make concrete decisions based on climate monitoring. Rather, it is used as input for climate research
Climate research provides greater knowledge about climate development causes and effects
Engineers and architects Decisions regarding design and dimensioning of building constructions
Correct dimensioning of e.g. insulation, correct choice of concrete, etc., allowing for the expected climate development
Table 23: Estimated number of decision-makers and value Examples of users Number of decision-makers Estimated value The Danish Parliament There are less than 1,000
decision-makers in the parliament The value of avoiding climate change is probably higher than DKK 1,000 per political decision
Researchers There are probably more than 1,000 climate researchers worldwide
Climate research as a whole is probably of a value higher than DKK 1,000
Engineers and architects There are probably more than 1,000 engineers and architects using knowledge about the climate development in Denmark in their daily work
Among engineers, there is a tradition of overdimensioning just to be on the safe side. Therefore, climate monitoring will probably only in a few cases influence design and construction of buildings. Still, it must be presumed that climate monitoring has a value of more than DKK 1,000, because the costs of faulty construction are extremely high. For instance, the Copenhagen Metro has been secured against the risk of a raised sea level
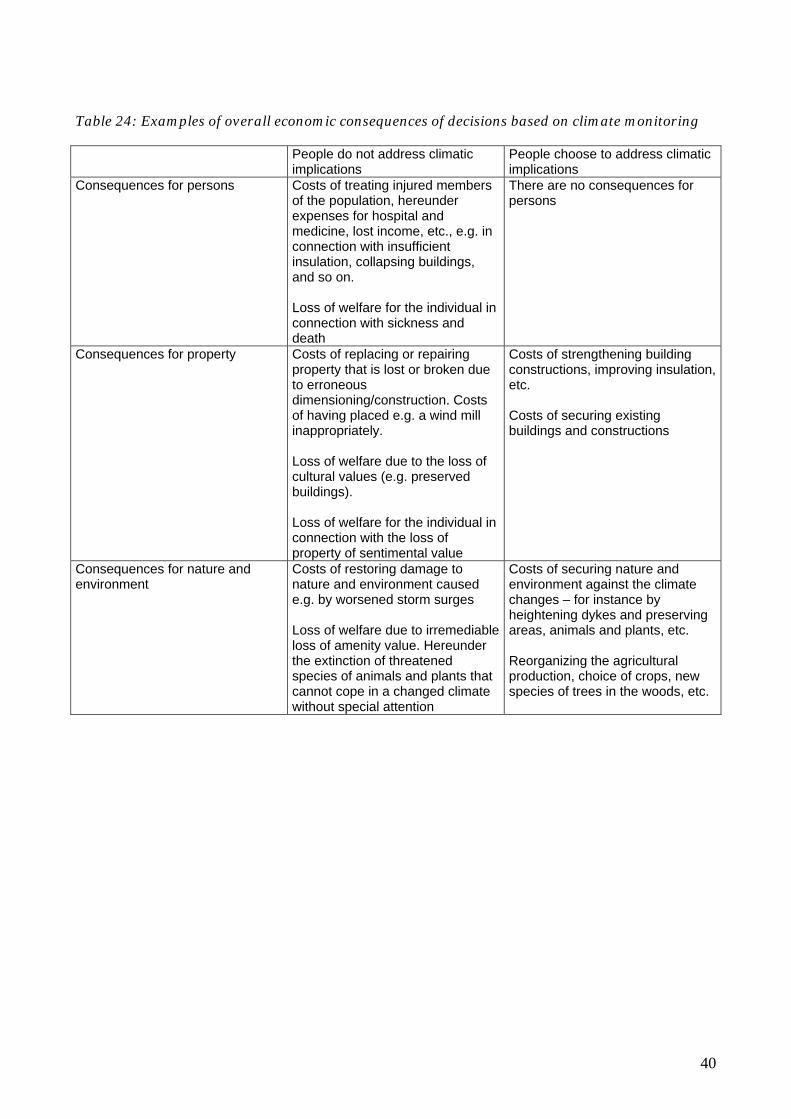
40
Table 24: Examples of overall economic consequences of decisions based on climate monitoring People do not address climatic
implications People choose to address climatic implications
Consequences for persons Costs of treating injured members of the population, hereunder expenses for hospital and medicine, lost income, etc., e.g. in connection with insufficient insulation, collapsing buildings, and so on. Loss of welfare for the individual in connection with sickness and death
There are no consequences for persons
Consequences for property Costs of replacing or repairing property that is lost or broken due to erroneous dimensioning/construction. Costs of having placed e.g. a wind mill inappropriately. Loss of welfare due to the loss of cultural values (e.g. preserved buildings). Loss of welfare for the individual in connection with the loss of property of sentimental value
Costs of strengthening building constructions, improving insulation, etc. Costs of securing existing buildings and constructions
Consequences for nature and environment
Costs of restoring damage to nature and environment caused e.g. by worsened storm surges Loss of welfare due to irremediable loss of amenity value. Hereunder the extinction of threatened species of animals and plants that cannot cope in a changed climate without special attention
Costs of securing nature and environment against the climate changes – for instance by heightening dykes and preserving areas, animals and plants, etc. Reorganizing the agricultural production, choice of crops, new species of trees in the woods, etc.

41
6.8. Extreme Rain Information Table 25: Use, users and benefits Examples of users Examples of decisions Examples of benefits Hydrology researchers Researchers probably do not make
concrete decisions based on extreme rain information. Rather, it is used as input for climate research
Forms the basis of decision in the short and the long term
Municipalities, counties, and other relevant bodies
Used to plan, analyze and manage sewer and water treatment facilities. Decisions about e.g. extension, renovation, etc.
More efficient and environmentally friendly operation of sewers and water treatment facilities
Insurance companies Used to settle insurance claims in connection with heavy downpour. Decisions may be e.g. whether there are grounds for paying compensation in a given case
More fair settlements of insurance claims. Fewer are able to commit fraud against the insurance company
Table 26: Estimated number of decision-makers and value Examples of users Number of decision-makers Estimated value Researchers There are probably less than 1,000
climate researchers worldwide Climate research as a whole probably has a value in the excess of DKK 1,000
Municipalities, counties, and other relevant bodies
There are probably less than 1,000 decision-makers at municipalities, counties, and other relevant bodies making decisions about dimensioning public sewer systems
Municipalities, counties, and other relevant bodies probably make decisions, where information about extreme rain additional to their own expectations has a value higher than DKK 1,000. They are probably able to make sensible decisions without the extreme rain information, but the information probably has a relatively large importance. The increased certainty of the decision probably saves the authorities more than DKK 1,000 per decision, rebuilding/extension of sewer systems and water treatment facilities being large investments
Insurance companies There are 15 insurance companies using this DMI service. There are probably less than 1,000 decision-makers with these companies using the extreme rain information from DMI
Insurance companies probably make decisions, where information about extreme rain additional to the insurance company’s own investigation has a value higher than DKK 1,000. The insurance companies are probably able to settle the claims without information from DMI concerning concrete extreme rain events, but the increased certainty of the decision probably saves the companies more than DKK 1,000 per case

42
Table 27: Examples of overall economic consequences of decisions based on extreme rain information People do not take the information
into consideration People choose to take the information into consideration
Consequences for persons Costs of treating injured members of the crew, hereunder expenses for hospital and medicine, lost income, etc., for example in connection with wrong dimensioning of sewers, bridges, tunnel constructions, and so on. Loss of welfare for the individual in connection with sickness and death
There are no consequences for persons
Consequences for property Costs of replacing or repairing property that is lost or broken due to erroneous dimensioning/construction. Loss of welfare due to the loss of cultural values (e.g. preserved buildings). Loss of welfare for the individual due to loss of property of sentimental value
Costs of strengthening/improving building constructions, etc. Costs of securing existing buildings and constructions against sewer flooding/spills
Consequences for nature and environment
Costs of restoring damage to nature and environment caused e.g. by spills from overloaded sewer systems and water treatment facilities. Loss of welfare due to irremediable loss of amenity value.
Costs of securing nature and environment against sewer flooding/spills
Mini case: Towards a statement of the value of extreme rain value When optimizing the dimensioning of the sewer systems, the increased costs of construction or replacement caused by larger dimensioning are balanced against the expected decreasing insurance company compensations to the claimants as well as public costs of cleaning and restoring nature areas. Thus, optimum dimensioning of the sewer systems permits a risk of flooding, extending the sewer system dimensioning being economically unprofitable. Since 1979, the Danish Water Pollution Control Committee has established and operated, in cooperation with DMI and a number of municipalities, automatic precipitation gauges in more than 40 urban areas around the country. Since 1996, these measurements have been used in connection with the projecting and analysis of sewer systems [source: Skrift nr. 26: Regional variation i ekstremregn I Danmark, IDA Spildevandskomitéen, 1999]. In future renovations or new constructions of sewer systems, these new estimates of the frequency of extreme rain will be taken into consideration. Estimates from 1999 show that the dimensioning in several major urban areas was excessive, whereas the dimensioning of sewer systems in less populated areas was inadequate. Using the municipality of Aalborg as a point of departure – that town being judged to have one of the most comprehensive overviews of the sewer system’s extent, value, and state -

43
the replacement value of the entire Danish sewer system is estimated at DKK 245-300bn with maintenance and renovation needs over the next 15 years totalling 3.1bn per annum [source: ATV nyt maj 2001, The Danish Academy of Technical Sciences]. It follows that extreme rain information from DMI must save society the added expenses of either constructing/rebuilding sewer systems or of compensations in the wake of the flooding that would occur, had this basis of determining the optimum dimensioning of the sewer systems not existed. The size of this amount, though, is difficult to determine, but it could well be a substantial part of the estimated DKK 3.1bn per annum. 6.9. Oil Drift Predictions Table 28: Use, users and benefits Examples of users Examples of decisions Examples of benefits Environmental authorities, emergency management authorities, and municipalities and counties
Used to plan and carry out environmental operations at sea in order to prevent the oil from landing on our coasts. Decisions about e.g. the methods to be adopted for cleaning
Reduced costs of cleaning and a better marine environment
Table 29: Estimated number of decision-makers and value Examples of users Number of decision-makers Estimated value Environmental authorities, emergency management authorities, and municipalities and counties
There are probably less than 1,000 decision-makers with environmental authorities, emergency work authorities, and municipalities and counties making decisions concerning oil spill cleaning
Municipalities, counties, and other relevant authorities probably make decisions, where information about the oil drift additional to their expectation has a value of more than DKK 1,000. They are probably able to make sensible decisions without oil drift predictions, but the information is probably of relatively great importance. The added certainty of the decisions probably saves the authorities more than DKK 1,000 per decision, the costs of cleaning, once the oil hits shore, being considerable

44
Table 30: Examples of overall economic consequences of decisions based on oil drift predictions People do not use oil drift
predictions People choose to use oil drift predictions
Consequences for persons Costs of treating injured persons, who have been in contact with the oil, hereunder expenses for hospital and medicine, lost income, etc. Loss of welfare for the individual due to sickness and death
There are no consequences for persons
Consequences for property Costs of replacing or repairing property lost or broken because of the oil
Reduced costs due to more expedient and efficient oil containment/skimming
Consequences for nature and environment
Costs of restoring damage to nature and environment caused by the oil Loss of welfare due to irremediable loss of amenity value
6.10. Storm Surge Warnings Table 31: Use, users and benefits Examples of users Examples of decisions Examples of benefits Emergency management authorities, harbour authorities, Danish Coastal Authority
Used, among other things, for deciding whether harbours and dykes are to be secured against floods
Less damage to harbour facilities and neighbouring areas
Boat owners, people living on the coast
Used for judging whether there will be a flood and for deciding, if vessels are to be secured or moved
Less damage to persons and companies having vessels or property in the affected harbours
Table 32: Estimated number of decision-makers and value Examples of users Number of decision-makers Estimated value Emergency management authorities, harbour authorities, Danish Coastal Authority
There are probably less than 1,000 decision-makers with emergency management authorities, harbour authorities, and the Danish Coastal Authority making decisions about storm surge precautions
The relevant authorities probably make decisions, where information about the risk of a storm surge additional to their own expectation has a value higher than DKK 1,000. It is very difficult to safeguard oneself against a storm surge without a DMI warning. Consequently, DMI’s warnings are of great importance to decisions regarding storm surge precautions. The increased certainty of the decisions probably saves the authorities more than DKK 1,000 per decision, the costs of not taking precautions in the event of a

45
storm surge – or of taking unnecessary precautions – are extremely high
Boat owners, people living on the coast
Boat owners and people living in the exposed areas along the coast constitute far more than 1,000 persons
The local population probably make decisions, where information about the risk of a storm surge additional to their own expectation has a value higher than DKK 1,000. It is very difficult to safeguard oneself against a storm surge without a DMI warning. Consequently, DMI’s warnings are of great importance to decisions regarding storm surge precautions. The increased certainty of the decisions probably saves the authorities more than DKK 1,000 per decision, the costs of not taking precautions in the event of a storm surge – or of taking unnecessary precautions – are extremely high
Table 33: Examples of overall economic consequences of decisions based on storm surge warnings People do not act, and a storm
surge/extreme weather in fact occurs
People choose to act based on the warning
Consequences for persons Costs of treating the injured, hereunder expenses for hospital and medicine, lost income, etc. Loss of welfare for the individual due to sickness and death
Costs of evacuating, fees for emergency services, etc. Loss of welfare in the shape of the trouble of taking precautions against the storm surge or extreme weather (filling sandbags, etc.) or evacuating, lost income, injuries and death in connection with accidents during the evacuation
Consequences for property Costs of replacing or repairing property lost or broken Loss of welfare due to loss of cultural values (e.g. preserved buildings) Loss of welfare for the individual due to loss of property of sentimental value
Costs of moving or securing property in the areas covered by the warnings
Consequences for nature and environment
Costs of restoring damages on nature and environment in the case of shipwreck Loss of welfare due to irremediable loss of amenity value
Costs of securing nature and environment against the storm surge or the extreme weather – e.g. strengthening dykes, fell exposed trees, etc.

46
Mini case: Towards a Statement of the Value of Storm Surge Warnings As was the case with extreme rain information, DMI’s storm surge warnings save society the added expenses of either rebuilding or compensating the losses resulting from the flooding that would occur, if there was no informational basis for obtaining optimum dimensioning of dykes and emergency services. The costs of maintaining the dykes and other coastal protection are estimated at DKK 170m, of which DKK 120m is used on the west coast of Jutland, and DKK 50m is used along the inner sea waters [Ole Juul Jensen, COWI]. Compensations paid by the Danish Storm Council appear below. Year Paid DKK Number of cases 1991 1,419,466 42 1992 508,079 30 1993 42,378,432 1022 1995 24,159,412 558 1999 30,704,846 356 2002 550,000 33 2003 141,796 5 Yearly average 7,681,695 157 Even though the above data give the gist of the amounts, again it is difficult to determine, how much further these costs would be from the optimum level, if DMI’s services did not exist or were not followed. 6.11. Oceanography Table 35: Use, users and benefits Examples of users Examples of decisions Examples of benefits Yachters Decisions whether it is safe to sail
given the current and wave conditions
Fewer accidents. Without this knowledge, they would not know when and where it is safest to sail
Researchers Researchers probably do not make concrete decisions based on oceanography. Rather, it is used as input for oceanographic research
Forms the decision basis of planning in the short and the long term
The off-shore industry Decisions about the construction of installations
Fewer accidents and earnings growth
The shipping trades Decisions whether it is safe to sail given the current and wave conditions
Fewer accidents and earnings growth. Without this knowledge, they would not know when and where it is safest to sail
The fishing trade Decisions whether it is safe to sail given the current and wave conditions
Fewer accidents and earnings growth. Without this knowledge, they would not know when and where it is safest to sail

47
Table 36: Estimated number of decision-makers and value Examples of users Number of decision-makers Estimated value Yachters There are probably a lot more than
1,000 yachters using the current and wave forecasts
Each decision probably has a value less than DKK 1,000, the risk of shipwreck due to current or waves being relatively small under the conditions where yachters sail
Researchers There are probably less than 1,000 researchers using this service
Oceanographic research probably has a value higher than DKK 1,000
The off-shore industry There are only a couple of companies operating in Danish waters
Each decision probably has a value higher than DKK 1,000, the economic consequences of a shipwreck being extremely severe. Moreover, knowledge of oceanography probably is of great importance to the ship’s captain’s decisions of thus for the probability of shipwreck
The shipping trades There are probably more than 1,000 in the shipping trade using current and wave forecasts
Each decision probably has a value higher than DKK 1,000, the economic consequences of a shipwreck being extremely severe. Moreover, knowledge of oceanography probably is of great importance to the ship’s captain’s decisions of thus for the probability of shipwreck
The fishing trade There are probably more than 1,000 fishermen using current and wave forecasts
Each decision probably has a value higher than DKK 1,000, the economic consequences of a shipwreck being extremely severe. Moreover, knowledge of oceanography probably is of great importance to the ship’s captain’s decisions of thus for the probability of shipwreck

48
Table 37: Examples of overall economic consequences of decisions based on oceanography People disregard current, wave,
and temperature forecasts People choose to act based on current, wave, and temperature forecasts
Consequences for persons Costs of treating the injured, hereunder expenses for hospital and medicine, lost income, etc. Loss of welfare for the individual due to sickness and death
Lost income e.g. for fishermen Loss of welfare in the form of trouble and lost time owing to non-completion of planned activities at sea, be they leisure or business related
Consequences for property Costs of replacing or repairing property lost or broken due to accident or shipwreck Loss of welfare due to loss of property of sentimental value
Costs in the form of increased fuel consumption and a prolonged voyage due to circumventing the ice
Consequences for nature and environment
Costs of restoring damage on nature and environment in the case of accident and shipwreck Loss of welfare due to loss of irremediable amenity value
There are no consequences for nature and environment
6.12. Slippery-Road Warnings Table 38: Use, users, and benefits Examples of users Examples of decisions Examples of benefits Transport authorities, municipalities and counties, the Danish Road Directorate, and the bridges
Used, among other things, for planning salting, and for deciding when to summon personnel for snow clearance
Reduces possibly resources consumption and the environmental strain with counties and municipalities, when salting and summoning personnel only takes place at the time and in the areas where slippery roads are likely to occur An important benefit is the reduced time of slippery roads
Road-users Find out, whether or not it is wise to drive, and whether it is necessary to calculate with more time. Decisions about driving/not driving, route, and speed
Fewer slippery-road accidents Fewer delays

49
Table 39: Estimated number of decision-makers and value Examples of users Number of decision-makers Estimated value Transport authorities, municipalities and counties, the Danish Road Directorate, and the bridges
There are probably less than 1,000 decision-makers with municipalities, counties, and other road authorities making decisions about salting/clearance
The value of each decision is probably well above DKK 1,000, salting and summoning personnel being expensive Moreover, it is expensive to salt, once the road has become slippery, because a lot of time is wasted
Road-users There are probably less than 1,000 decision-makers with the transport authorities, but a lot more than 1,000 decision-makers among the road-users contemplating driving/not driving, etc.
The value of the decision about driving or not, or driving more carefully, is probably higher than DKK 1,000 per decision. damage in connection with traffic accidents being costly It is also expensive to be stuck due to the state of the roads, or to be late
Table 40: Examples of overall economic consequences of decisions based on slippery-road warnings People do not act, and the road is
in fact slippery People choose to act based on the warning
Consequences for persons Costs of treating the injured in connection with slippery-road accidents, hereunder expenses for hospital and medicine, lost income, etc. Loss of welfare for the individual due to sickness and death Loss of welfare in the shape of trouble/loss of time due to driving on a slippery road
Costs of treating the injured, hereunder expenses for hospital and medicine, lost income, etc. in connection with accidents during salting/clearance Loss of welfare due to the trouble of taking precautions against the state of the roads, e.g. delays, lost income, sickness, and death
Consequences for property Costs of replacing or repairing property (vehicles) lost or broken Loss of welfare for the individual due to the loss of property of sentimental value
Costs of salting and clearance of the areas covered by the warning Salt damage to vehicles if the salting is excessive
Consequences for nature and environment
There are no consequences for nature and environment
Costs of polluting nature with salt, if the salting is excessive
See case about slippery-road warnings for a statement of the total economic value.

50
6.13. Military Products Table 41 Use, users, and benefits Examples of users Use Examples of benefits Defence Used e.g. for planning exercises Reduced risk for personnel and
materiel Table 42 Estimated number of decision-makers and value Examples of users Number of decision-makers Estimated value Defence There are probably les than 1,000
officers in the Defence making decisions about going through with exercises, etc., based on DMI forecasts
The value of each decision is probably a lot higher than DKK 1,000, since rescheduling an exercise to another day probably costs a lot more
Table 43 Examples of overall economic consequences of decisions based on military products The Defence does not act based on
the information The Defence chooses to act based on the information
Consequences for persons Costs of treating the injured, hereunder expenses for hospital and medicine, lost income, etc., due to inadequate precautions against the weather Loss of welfare for the individual due to sickness and death Loss of welfare for civilians, who are unnecessarily inconvenienced by the military activities – e.g. noise, emissions, risk of being hit by stray bullets
Costs of altering the time and course of exercises, etc. as compared to the original plans Loss of welfare due to the trouble of altering the time and course of exercises, etc. as compared to the original plans, insofar as it affects the personnel’s off-duty hours
Consequences for property Costs of replacing or repairing property lost or broken due to accidents during the exercise owing to inadequate precautions against the weather Loss of welfare due to the loss of cultural values (e.g. preserved buildings) Loss of welfare for the individual due to the loss of property of sentimental value
There are no consequences for property
Consequences for nature and environment
Costs of polluting nature with unnecessary emissions of noise, gasses, projectiles, etc. Loss of welfare due to irremediable loss of amenity value
There are no consequences for nature and environment

51
6.14. Sale of Magnetic Instruments Magnetic instruments cannot be analyzed within the established analytic framework, they being not strictly speaking a meteorological product. This appears also from Figure 3.1. 6.15. Health Warnings Table 44: Use, users, and benefits Examples of users Use Examples of benefits The general public Used to find out, how long one can
stay in the sun – use of sunscreen Reduced number of cancer cases
People with allergies Used e.g. by doctors and people with allergies to plan medication
Reduced inconvenience and number of deaths caused by allergic attacks Fewer sick days and more work
Table 45: Estimated number of decision-makers and value Examples of users Number of decision-makers Estimated value The general public The general population comprises
more than 1,000 persons The value of sun warnings to the general public is probably low – and less than DKK 1,000, since the experienced costs of a possible cancer case has to be discounted a very long time back
People with allergies There are more than 1,000 people with allergies in Denmark
The value for people with allergies is probably high – and much higher than DKK 1,000, people with allergies being in immediate risk of their lives during an attack The value of prevented lost income due to illness
Table 46: Examples of overall economic consequences of decisions based on health warnings People do not act, and they are
sunburned/have an allergy attack People choose to act based on the warning
Consequences for persons Costs of treating the people harmed, hereunder expenses for hospital and medicine, lost income, etc. Loss of welfare for the individual due to sickness and death
Costs of sunscreen and asthma medicine Loss of welfare due to the trouble taking precautions against the sun/pollen
Consequences for property No consequences for property No consequences for property Consequences for nature and environment
No consequences for nature and environment
No consequences for nature and environment

52
Mini-case: Towards a Statement of the Value of Health Warnings According to Table 46, heeding ozone, sun, and pollen warnings only has consequences for people, not for either property or nature. As was the case with e.g. storm surge warnings and extreme rain information, it is not possible to isolate a situation, where DMI’s prognosis is not taken into consideration. However, it is necessary to calculate with an economic gain from the treatment and lost income that is avoided by people using sunscreen, asthma medicine, etc. in the appropriate doses. This gain is perceived as the reduced period from the optimum dimensioning to the prevention of potential harm brought about by the warning. Thus, there is probably a connection between the fact that people, who e.g. use sunscreen either of their own accord or because of DMI’s warnings feature less prominently in statistics over people being treated for skin cancer than people, who do not use sunscreen. The Danish Cancer Society observes in its publication about Danes’ sun habits, ‘Danskernes solvaner 2004’, that 80 per cent of 1027 persons questioned take precautions against sunburn. DMI’s health warning may have been a contributing factor to this high percentage, since the study points out that the persons questioned have a higher level of knowledge than before about sunscreen’s preventive effect on skin cancer (the study was made 1994-2004). Regarding the pollen warning, it is shown that the costs of treatment or prevention of chronic obstructive airway disease (typically asthma) have increased by 22 per cent since 2000 to DKK 1.3bn per annum in 2004. DMI’s pollen warnings may have had an influence on this increase. The increase is also a sign that asthma and similar diseases are a growing problem, but that improved treatments are available. Hence, warnings may be expected to be of great value in the future. Table 47: Yearly turnover in Denmark of ‘Drugs for obstructive airway diseases’ 2000 2001 2002 2003 2004 DKK m 821 827 918 977 1,003 The share of this changed behaviour attributable to the use of DMI’s warnings and the economic savings and gains thereof cannot, however, be determined more closely. 6.16. Aviation Weather Table 48: Use, users, and benefits Examples of users Use Examples of benefits Airports
Used for traffic planning in and around airports
A statutory prerequisite for operating an airport
Airline companies Used e.g. for planning routes and estimating the amount of fuel to be tanked prior to take-off
A prerequisite for safe civilian aviation. Reduces the airlines’ resources consumption
Defence pilots Used for planning military flights A prerequisite for conducting military flights and operations
Other pilots Used e.g. for determining whether or not it is safe to go through with a flight, for planning routes, and for estimating the amount of fuel to be tanked prior to take-off
A prerequisite for safe civilian flights

53
Table 49: Estimated number of decision-makers and value Examples of users Number of decision-makers Estimated value Airports
There are 29 airports in Denmark and Greenland. There are probably less than 1,000 persons (incl. air traffic controllers) making decisions about the traffic at airports
The value of each decision probably exceeds by far DKK 1,000, an airplane accident being very costly
Airline companies All airline companies – incl. the foreign ones. There are probably less than 1,000 persons making decisions about the airline company’s flights based on the aviation weather
The value of each decision probably exceeds by far DKK 1,000, an airplane accident being very costly
Defence pilots Defence pilots. Foreign defences in connection with exercises and operations. There are probably less than 1,000 of these decision-makers
The value of each decision probably exceeds by far DKK 1,000, an airplane accident being very costly
Other pilots Civilian aviators in Denmark, of which 1,200 have registered for Internet access
The value of each decision probably exceeds by far DKK 1,000, an airplane accident being very costly
The value of detouring or landing at the wrong airport, if one has taken off and the weather deteriorates, is in itself quite considerable. Table 50: Examples of overall economic consequences of decisions based on aviation weather The captain/air traffic control does
not request or does not follow the guide, and there is in fact bad weather
The captain/air traffic control chooses to follow the guide
Consequences for persons Costs of treating the injured, hereunder expenses for hospital and medicine, lost income, etc., in connection with airline accidents Loss of welfare for the individual due to the discomfort of experiencing unnecessary turbulence, sickness, and death Loss of welfare for the individual due to a delayed homecoming from flying through the storm
Loss of welfare for the individual due to a delayed departure or a delayed arrival owing to the plane circumventing the storm or landing in another airport
Consequences for property Costs of replacing or repairing plane or cargo lost or broken Costs in the form of increased fuel consumption and a prolonged flight due to flying through the storm or landing at another airport Loss of welfare due to loss of
Costs of circumventing the storm/landing in another airport owing to increased fuel consumption and a prolonged flight

54
cultural values (e.g. preserved buildings) in a plane crash Loss of welfare due to loss of property of sentimental value in a plane crash
Consequences for nature and property
There are no consequences for nature and environment
There are no consequences for nature and environment
See case about Squadron 722 for an indication of the economic value. 6.17. Emergency Alert Scheme Table 51: Use, users, and benefits Examples of users Use Examples of benefits The Danish Emergency Management Agency, police and other authorities
Used for protection against various threats
Avoid sickness and accidents among the general public
The agricultural sector and veteri-nary authorities
Used e.g. for protection against airborne animal diseases
Reduced number of sick livestock and subsequent treatment/destruction
The general public Used for protection against various threats
Avoid sickness and accidents among the general public
Table 52: Estimated number of decision-makers and value Examples of users Number of decision-makers Estimated value The Danish Emergency Management Agency, police and other authorities
There are probably less than 1,000 decision-makers with the authorities making decisions about initiating evacuations, warning the public, etc.
The value of these warnings is probably a lot higher than DKK 1,000, many lives being at stake in connection with accidents and leaks
The agricultural sector and veteri-nary authorities
There are probably more than 1,000 farmers and persons with the veterinary authorities using warnings of airborne diseases, etc.
The value of the farmers’ livestock and crops exceeds by far DKK 1,000
The general public The general public constitutes far more than 1,000 persons
The value of discovering e.g. that there is an on-going evacuation or that one should indoors is probably higher than DKK 1,000
Table 53: Examples of overall economic consequences of decisions based on environmental emergency alert schemes People do not act based on the
information People choose to act based on the information
Consequences for persons Costs of treating the injured, hereunder expenses for hospital and medicine, lost income, etc., in connection with nuclear leaks, gas leaks, terrorist attack, etc. Loss of welfare for the individual
Costs of evacuating, paying the emergency services, police, etc. Loss of welfare due to the trouble of taking precautions against the danger or the trouble of evacuation, loss of income,

55
due to sickness and death sickness, and death in connection with accidents during the evacuation
Consequences for property Costs of replacing or repairing property lost or broken due to the leak Loss of welfare due to loss of cultural values (e.g. preserved buildings) Loss of welfare for the individual due to the loss of property of sentimental value
Costs of protecting the property and livestock against the threat
Consequences for nature and environment
Costs of nature being polluted by unnecessary gas emissions, biological weapons, or destroyed by explosions, etc. Loss of welfare due to irremediable loss of amenity value
Depending on the concrete threat, but probably no consequences for nature and environment in the long term. Except for the construction of ‘fire breaks’
6.18. Ordinary Weather Forecasts/Warnings Table 54: Use, users, and benefits Examples of users Use Examples of benefits The general public Used to keep informed about the
weather The pleasure of being able to plan outdoor activities well in advance
The tourist industry Used for keeping users informed about the expected weather at the destination
It is e.g. possible to pack the right clothes and equipment for the vacation
The leisure sector Used to keep informed about the weather
The pleasure of being able to plan outdoor activities well in advance
The energy sector Used in connection with the operation of energy supply, both as regards energy sources and needs
Direct savings and a more environmentally correct exploitation of the energy resources, e.g. by optimum exploitation of wind energy
The shipping and fishing trades Used for keeping informed about the weather on the route and planning alternatives
Direct savings due to reduced loss of time and equipment for e.g. fishermen
The agricultural sector These are special forecasts used for planning various activities
Reduced costs of e.g. fertilizer and pest controllers. Harvesting at the right time reduces the costs of drying
The building sector Used for keeping informed about the weather
Some building processes are not possible in e.g. frosty weather
Manufacturers Used for predicting the demand for weather-dependent products such as ice cream
Sufficient ice cream, for instance, in stock to meet the demand

56
Table 55: Estimated number of decision-makers and value
Examples of users
Number of decision-makers Estimated value
The general public Constitutes far more than 1,000 people
In general, the importance of the general public’s decisions based on weather forecasts probably averages at a value of less than DKK 1,000.
The tourist industry Decision-makers probably constitute more than 1,000 people as well
In general, the importance of the tourist industry’s decisions based on weather forecasts probably averages at a value of less than DKK 1,000.
The leisure sector Decision-makers probably constitute more than 1,000 people as well
In general, the importance of the leisure sector’s (such as scout leaders’) decisions based on weather forecasts probably averages at a value of less than DKK 1,000.
The energy sector The business comprises approximately 50 energy companies and probably fewer than 1,000 people who make decisions based on information about the weather
The importance of decisions in the energy sector probably has a value that far exceeds DKK 1,000, as it is costly to start up combined heat and power plants (or shut them down) temporarily.
The shipping industry
The shipping industry probably comprises more than 1,000 people who make decisions based on weather information
The importance of decisions in the shipping industry probably has a value that far exceeds DKK 1,000, as it is costly to purchase new fishing nets and other equipment.
The farming community
The farming community probably comprises more than 1,000 people who make decisions based on weather information
The importance of decisions in the energy sector probably has a value that far exceeds DKK 1,000 alone due to the fact that the crop yield increases if fertilizers and pesticide sprays are used at the right times.
The construction sector
The construction sector probably comprises more than 1,000 people who make decisions based on weather information
The importance of decisions in the construction sector probably has a value that far exceeds DKK 1,000 alone due to the fact that work can be organized in such a way that bad weather does not cause a total stop of activities.
The manufacturing business
The manufacturing business probably comprises more than 1,000 people who make decisions based on weather information
The importance of decisions in the manufacturing business probably has a value that far exceeds DKK 1,000 alone due to the fact that highly weather dependant productions can bee adjusted according to expected needs with respect to forecasted weather conditions.

57
Table 56: Examples of overall economic consequences of decisions made in view of ordinary weather forecasts and warnings
People do not take action in view of the weather forecast
People choose to react to the weather forecast
Consequences for humans
Costs of treatment of injured and ill persons, including hospital and drug costs, lost earnings, etc., due to inadequate clothing. Loss of amenities to individuals in connection with discomfort due to illness or possibly death - e.g. due to heat stroke, pneumonia, etc. Loss of amenities to individuals as a result of freezing, becoming wet, sunburnt, etc., as a result of not using sunscreen/an umbrella/gloves, etc.
Lost earnings/revenue in connection with cancellation of commercial outdoor events/activities Loss of amenities in the form of inconvenience and lost time because planned outdoor activities - for pleasure and business - could not be carried out.
Consequences for property
Costs of replacing or repairing lost or damaged property as a result of becoming wet, melting in the heat, etc. Loss of amenities in connection with lost property of sentimental value. Lost revenue as a result of production of too few or too many seasonal products, such as ice cream.
Costs of securing property against the weather. Loss of amenities in the form of inconvenience and lost time related to securing property against the weather - such as bringing in the laundry, closing windows, etc.
Consequences for nature and the environment
No consequences for nature or the environment
No consequences for nature or the environment

58
6.19. Extreme weather warnings This table is identical to that of flood warnings.
Table 57
People do not take action and a flood/extreme weather actually occurs
People choose to take action in view of the warning
Consequences for humans
Costs of treatment of injured persons, including hospital and drug costs, lost earnings, etc. Loss of amenities to individuals in connection with illness and death.
Costs related to evacuations, wages for rescue services, etc. Loss of amenities in the form of difficulties in protecting against the flood or the extreme weather (filling sandbags, etc.) or evacuating people, lost earnings, illness and death in connection with accidents during the evacuation.
Consequences for property
Costs of replacing or repairing lost or damaged property Loss of amenities in connection with loss of cultural assets (such as protected buildings). Loss of amenities to individuals in connection with lost property of sentimental value.
Costs of moving or securing property in the areas affected by the warning
Consequences for nature and the environment
Costs for restoring nature and the environment Loss of welfare due to irremediable loss of amenity value
Costs of securing nature and the environment against the flood or the extreme weather - such as reinforcing dams and cutting exposed trees.
Mini-case: Towards an indication of the value of extreme weather warnings The data concerning the extreme weather warning are the same as those concerning the flood warning with the addition that the Danish Storm Council has undertaken to subsidize approximately DKK 429 million for the replanting efforts following the storm-damage to forests (i.e. affected private forest areas) in 1999.

59
6.20. Routing information This table is identical to that of Sea ice information.
Table 58
The captain does not obtain or does not use the information and bad weather/impassible weather due to ice actually occurs
The captain chooses to use the information
Consequences for humans
Costs of treatment of injured crew members, including hospital and drug costs, lost earnings, etc. Loss of amenities to individuals in connection with illness and death Loss of amenities to individuals in connection with delayed return as a result of going through the bad weather/ice
Loss of amenities to individuals in connection with delayed return as a result of going round the bad weather/ice
Consequences for property
Costs of replacing or repairing the ship or lost or damaged cargo. Costs of sailing through the bad weather/ice in the form of increased fuel consumption and extended run Loss of amenities to crew members in connection with lost property of sentimental value.
Costs of sailing round the bad weather/ice in the form of increased fuel consumption and extended run
Consequences for nature and the environment
Costs of restoring nature and the environment in case of sinking Loss of welfare due to irremediable loss of amenity value - such as the Arctic regions
No consequences for nature or the environment

60
6.21. Variation charts
Table 59
People do not use variation charts
People use variation charts
Consequences for humans
Costs of treatment of injured persons, including hospital and drug costs, lost earnings, etc., as a result of people having lost their way. Loss of amenities to individuals in connection with illness and death. Loss of amenities to individuals as a result of people having lost their way
No consequences for humans.
Consequences for property
Costs of replacing or repairing lost or damaged property because an indication of exact location or orientation could not be defined. Loss of amenities in connection with lost property of sentimental value.
No consequences for property
Consequences for nature and the environment
No consequences for nature or the environment
No consequences for nature or the environment
6.22. Cosmic radiation warning
Table 60
People do not take action, and an increase in cosmic radiation actually occurs
People choose to take action in view of the warning
Consequences for humans
No consequences for humans
No consequences for humans
Consequences for property
Costs of replacing or repairing lost or damaged satellites and radio equipment
Costs of securing satellites and radio equipment
Consequences for nature and the environment
No consequences for nature or the environment
No consequences for nature or the environment

61
Appendix 1: Case on Shipping forecasts DMI issues special forecasts several times a day for the Danish waters. These forecasts can be found on DMI's website or heard via telephone (+45) 1853. They are transmitted on longwave and mediumwave. Up until 31 May 2005, these forecasts were issued five times a day; at 5:45 am, 8:45 am, 11:45 am, 5:45 pm and 10:45 pm. Due to budget cutbacks and a shift in priorities, it was decided that as from 1 June 2005, the 8:45 am shipping forecast would be cancelled. This raised critique from pleasure and commercial craft that were highly dependent on this particular forecast. Consequently, it was decided to cancel the 5:45 am forecast and bring back the forecast at 8:45 am. As from 12 December 2005, DMI issues a shipping forecast for selected sea areas at 5:45 am. Because of the high demand for the 8:45 am shipping forecast, it has been decided that DMI's shipping forecasts are to be the focus of a distinct case study. The study will seek to uncover how great demand is and how much value the forecasts have to the users. Within the framework of the ongoing project, it is not possible to go into a detailed quantitative analysis of the value of DMI's shipping forecasts. This case study is thus limited to a more general description of the users and problem areas in which shipping forecasts play an important role as well as a simple calculation example of their value to prevent accidents at sea. This value may be an indication of how much value can be contributed by DMI if the shipping forecasts help to prevent just one accident. Delimitation of DMI’s product In order to analyze the value of shipping forecasts, a clear delimitation is required of what constitutes a shipping forecast. This will ensure that the value of the shipping forecast is not confused with the value of the ordinary weather forecast, which is also presumed to contain information about the weather, at least in the areas of the Danish waters close to shore. The shipping forecast is a forecast exclusively focused on the weather conditions in the Danish waters. These include wind speed, wave height, current, temperature, visibility, precipitation and salinity. Information about all these factors concerning the Danish waters is available on DMI's website. Information on longwave and telephone (+45) 1853 is limited to wind speed, wind force, precipitation and temperature for all Danish waters. Shipping forecasts are transmitted via four different types of media. Four times a day, the latest shipping forecast is transmitted via longwave and mediumwave. The shipping forecasts are also readily available on the Internet and by telephone (+45) 1853. This means that the shipping forecast is available at all hours for many users. The forecasts are, however, updated only those four times a day when they are transmitted via longwave and mediumwave as well. Shipping forecasts can thus be delimited to a few specific media. However, the information is readily available at all times to anyone who has a telephone or access to the Internet. Affected users Shipping forecasts potentially affect anyone who travels at sea in Denmark. More specifically, these users include recreational and commercial craft, drilling rigs, surfers and divers. This was also reflected on the list of participants at the negotiations that took place in the wake of DMI's cancellation of the 8:45 am forecast. The Danish Sailing Association, the Danish Security Council of Watersport, the Danish Fishermen’s Association and the Danish Ship-owners’ Association participated in the negotiations.

62
However, if attention is focused exclusively on the shipping forecasts transmitted via longwave and mediumwave, the number of frequent users is somewhat limited. They comprise primarily boats and vessels at sea which do not have access to this information via telephone or the Internet. In the case of pleasure craft, these seafarers are very far from shore for a long period of time (spending nights at sea, etc.). The same is the case for commercial craft. Surfers and divers are assumed to stay in areas close to shore and to be at sea for a short period of time. Thus, they do not have the same need for radio transmitted forecasts. Decisions Many diverse decisions are made in view of information about the weather at sea. Not only is the group of potential users quite substantial; it is also spread out over many activities. A common feature of all these decisions is, however, that equipment and human lives are at stake. Pleasure craft The decisions that pleasure craft can make in view of shipping forecasts primarily concern the choice of seaways and whether to go out on the water at all. In the case of seafarers who are planning a cruise, it is important to know whether it is safe to go out. If they do go out, current and wind conditions are of great importance as to which route to choose. Wind and current can make it very difficult to enter ports, etc. Commercial craft Commercial craft probably have a high tolerance threshold for bad weather because they are on the water for professional purposes. This merely strengthens the requirement for quality shipping forecasts, as marginal changes in the weather can have severe consequences. First of all, commercial craft must decide whether a sinking is likely. Commercial fishermen must also determine the risk of losing or damaging nets, equipment and cargo. Divers For the most part, diving is a leisure activity that requires a high level of safety. Thus, relatively stable weather conditions on the surface are important as well as in-depth knowledge of present current patterns in the diving area. Drilling rigs Drillings rigs should be able to resist almost anything. However, sometimes drilling rigs are evacuated in case of hurricane warnings. Rarely, though, will average shipping forecasts have significant impact on drilling rig procedures. Data The value of an accident at sea is to be calculated. This can only be calculated using numbers for the Danish commercial navy, as the statistics for private boat owners in Denmark are not sufficient. In Denmark, pleasure craft less than 15 m long are not registered. A Swedish attempt to register all boats has clearly shown that it is an impossible task. According to an unofficial estimate from the Danish Security Council of Watersport, there are approximately 500.000 recreational craft in Denmark. In contrast to the fleet of recreational craft, detailed statistics are available about number and size of commercial craft. Table shows the development in the number of merchant vessels and fishing vessels in the decade from 1994 to 2003. In 2003, a total of 6,405 vessels were registered in Denmark for commercial use.

63
Table 61: Size of the Danish commercial fleet distributed on merchant and fishing vessels
1994 1995 1996 1997 1998 1999 2.000 2001 2002 2003 Merchant vessels total
2,063 2,048 2,037 2,065 2,048 2,054 2,068 2,021 2,036 2,046
Registered fishing vessels total
5,737 6,135 5,769 5,507 5,141 4,996 4,933 4,826 4,626 4,359
Source: Danish Maritime Authority (2003). Ulykker til søs (Accidents at sea).
Table shows the number of signed-on crew members on vessels registered in Denmark as of 30 September of the year and how many of these were Danish. This is not a fair representation of the number of people employed in the shipping industry, seeing that people on leave and people who are ill or on holiday are not included. It does, however, give a clear picture of the level of staffing on the vessels. In 2003, vessels registered in Denmark had 9,132 people signed on.
Table 62: Total number of signed-on crew members on board vessels registered in Denmark
1994 1995 1996 1997 1998 1999 2.000 2001 2002 2003 Total 8,485 8,453 8,301 10,038 9,714 8,809 9,217 8,961 9,082 9,132Percentage of Danes (%) 76.4 72.6 68.7 73.1 70.5 66.8 65.2 63.5 66.8 63.3Source: Danish Maritime Authority (2003). Ulykker til søs (Accidents at sea).
Table 63 shows the number of accidents at sea where the outcome was serious. In 2003, a total of 13 accidents at sea resulted in sinking or serious damage and injuries.
Table 63: Number of accidents at sea resulting in sinking or other severe damage or injuries
1994 1995 1996 1997 1998 1999 2.000 2001 2002 2003 Sinking 31 16 25 21 12 24 14 19 22 8 Other serious outcome 17 24 22 16 11 12 16 13 6 5 Source: Danish Maritime Authority (2003). Ulykker til søs (Accidents at sea).
Bad weather is only one of many causes of accidents at sea. Other causes are other vessels, lighthouse and buoy errors as well as operational and technical errors. The accidents where it can be assumed that information from DMI may have an effect occur as a result of ice or extreme weather conditions. 2003 had 6 accidents of this type, equivalent to approximately 10% of all accidents at sea involving merchant and fishing vessels.

64
Table 64: Accidents in the Danish commercial fleet due to extreme weather conditions and ice
1994 1995 1996 1997 1998 1999 2.000 2001 2002 2003 Merchant vessels 8 8 19 4 5 12 2 6 4 4 Fishing vessels 2 3 1 2 1 4 2 - 2 2 All accidents at sea (regardless of cause) involving merchant and fishing vessels
85 101 101 94 91 86 70 84 75 66
Source: Danish Maritime Authority (2003). Ulykker til søs (Accidents at sea).
In addition to damage to vessel equipment as a result of accidents, the people on board often suffer injuries as well. Table 65 shows the number of serious work-related accidents on vessels resulting in death or permanent unfitness for work. In 2003, 16 deaths occurred on Danish vessels.
Table 65: Number of work-related accidents due to accidents at sea distributed on level of injury
1994 1995 1996 1997 1998 1999 2000 2001 2002 2003 Merchant and fishing vessels
- Permanent unfitness for work
3 1 1 2
- Deaths 17 4 3 5 6 13 8 5 2 16 Source: Danish Maritime Authority (2003). Ulykker til søs (Accidents at sea).
Value The economic value of shipping forecasts is determined by how great importance the information has to the individual seafarer’s decisions and by the number of many seafarers. However, it is not possible to calculate this on the basis of the available data. Instead, the average cost of an accident at sea can be calculated.
Telephone inquiries to insurance companies have made it possible to estimate the average value of a vessel in the Danish commercial fleet to be approximately DKK 5.6 million. According to the catalogue of key values (Nøgletalskataloget), a human life in Denmark is worth DKK 10.4 million.
The average cost of an accident at sea can be calculated by multiplying the average number of serious work-related accidents (including deaths) by the value of a human life and add this to the average value of a vessel. This equation gives an average cost per accident at sea of DKK 6.65 million.12
In addition to the direct costs of sea accidents, costs of rescue operations should be added. The frequencies used as the basis for the calculations above are all based on the actual frequency of accidents. This means that the effect of rescue efforts has been included. In the case study on Rescue Squadron 722, the costs of an average rescue operation were calculated to be DKK 54,000.
12 This estimate has to be a bit too high because it has been assumed that all serious work-related accidents (i.e. accidents that result in either death or permanent unfitness for work) can be valued equivalent to a human life. Another reason why this estimate has to be a little too high is that it has been assumed that all serious accidents at sea result in the loss of the total value of the vessel (whether it sinks or not).

65
Altogether, it means that if additional information from DMI can prevent one single accident at sea caused by extreme weather conditions, it is estimated to have a value of approximately DKK 6.7 million.
Based on these calculations, it is not possible to determine the actual value of the shipping forecasts. The accident statistics have been compiled in a situation where shipping forecasts were available. This could mean that the frequency of fatal and serious accidents at sea would be higher in a situation where this information is not available. Consequently, it is possible that not only would there be more accidents, but they would also be more serious.
The only conclusion that can be drawn with fair certainty is that the value of DMI's shipping forecasts to commercial craft constitutes at least DKK 6.7 million multiplied by the number of serious accidents at sea in the commercial fleet that are prevented by the shipping forecasts. This should be seen in the light that shipping forecasts are issued in response to recommendations from the IMO (International Maritime Organization). At the same time, everyone who is at sea is exposed to risk and is highly dependent on weather information. Thus, to the value that has been enumerated above should be added the effect on pleasure craft, divers, surfers, etc., which have not been valued here, but clearly must be expected to be positive.

66
Appendix 2: Case on Squadron 722 DMI issues several different weather forecasts and warnings that are used for aviation purposes. An important user of this information is Squadron 722 - helicopter rescue unit - which searches for and rescues injured persons by helicopter. This case study seeks to uncover the importance of these weather forecasts to Squadron 722 and to society. This case has been chosen because of an expectation that the value of the decisions made by Squadron 722 will be relatively easier to quantify than that of other users of flight weather forecasts. Furthermore, there is access to more and better data. Within the framework of the ongoing project, it is not possible to go into a detailed quantitative analysis of the value of DMI's flight weather forecasts. This case study is thus limited to a more general description of Squadron 722’s use of weather forecasts as well as a simple quantification of cost-effectiveness. This value may be an indication of how much value can be contributed by DMI if the flight weather forecasts help to rescue just one injured person. Squadron 722 and its responsibilities The Royal Danish Air Force Rescue Squadron - Squadron 722 - comprises a good 100 people and 8 helicopters distributed on the three wings in Ålborg, Skrydstrup and Roskilde. Thus, the Squadron’s efforts, which are coordinated by the Rescue Coordination Centre Karup, cover all of Denmark and stand by at all hours of the day, every day of the year. Squadron 722 has three main tasks: • Rescue missions - such as search for and rescue of people in need at sea • Air ambulance missions- such as transport of emergency patients from the island of Bornholm
to Rigshospitalet, the National University Hospital in Copenhagen • Environmental missions - such as investigation of the source of any oil spills in the ocean Squadron 722 takes off approximately 600 times a year. Last year had fewer hours in the air than usual - approximately 3,100 compared to the usual approximately 3,500. Out of these hours, approximately 1,000 are mission hours and the others are exercises. Furthermore, Squadron 722 has approximately 50 environmental missions per year, looking for oil spills. To date, Squadron 722 has flown approximately 14,500 missions and rescued approximately 9,000 people, of which many would have been dead otherwise. In addition, a number of dead people have been recovered. Approximately 5 times per year, Squadron 722 has to give up flying a mission because of the weather. Delimitation of case This case is exclusively focused on the importance of information from DMI in connection with the individual vessel captain’s decision to fly/not to fly a rescue mission, as this question is best suited for economic quantification. In addition, the crew members on board the helicopters continuously make many decisions based on the current and expected weather - such as ongoing decisions as to whether or not it is worth continuing the search and where to search as well as a number of decisions related to the aspect of flying in itself. It is, however, very difficult to document the consequences of these decisions. The reason is that it is not possible to monitor, obviously, the ongoing process inside the pilot’s head. The Rescue Coordination Centre Karup also makes a number of decisions based on information from DMI. These include decisions regarding the wing from where the rescue helicopter is sent; the

67
helicopter that is closest to the scene of the accident is not necessarily the one that will be able to arrive first (or most safely). It depends on factors such as the weather and the expected development in the weather on the routes that the helicopters from the different wings would have to take in order to arrive at the scene. These decisions are also difficult to document from an economic point of view because so many other factors than the weather are at work. The helicopters could already be busy elsewhere. Furthermore, it would be difficult and challenging to fully document these factors. These reflections do, however, form an important basis for the calculation of the socio-economic importance of the decision to fly/not to fly. Importance of DMI to Squadron 722 Weather information is decisive in order to fly the helicopters and carry out rescue operations. The decision of whether or not flying is allowed is based on a set of fixed and unbreakable international rules. These rules concern factors such as cloud base and visibility. However, the rules can be broken in rescue operations. Squadron 722 uses weather forecasts from DMI extensively in its work. It is necessary for the crew members to be aware at all times of the weather especially in the winter and in bad weather, so that they know at all times if and how a rescue operation can be initiated. The weather information is used for planning purposes both before and during the mission. It may be a matter of whether or not it is safe to go out or how to fly. The most important thing is that the weather allows the helicopter to land safely again and that the conditions make it possible to locate the injured persons. The services that Squadron 722 uses most often from DMI are mainly precipitation forecasts, METAR (information about the weather at the airport right now), TAF (detailed short-term predictions about cloud base, wind direction, dew point, temperature, etc.) and METFORECAST (daily report about any ice in the clouds). For rescue operations at sea, local information about the weather is also gathered from drilling rigs in the North Sea - including information about wave height and expected wave height. Several factors may act as "show stoppers" in a rescue operation, such as: • Fog at the air field or in the search area • Very severe thunderstorms that are impossible to circumvent (summer) • Freezing rain (winter) Most often, the rescue coordination centre will, however, be able to send a helicopter from one of the two other wings. Thus, it is only on very rare occasions that attempts to rescue people in need have to be aborted. Furthermore, Squadron 722 will soon be given new helicopters capable of flying in even worse weather conditions. Rescue operations - especially at sea - can prove impossible, though, because of the weather even though flying the helicopter may be possible. This is the case in situations with high humidity or fog. High humidity obstructs the capability of the infrared camera to locate people in the water. Similarly, fog may also make it impossible to visually locate people at sea. Whether or not it is worthwhile to go out now or it is better to wait for a while is determined by means of satellite photos of the search area. In situations with local fog in the area, it is better to wait for a while before going out because the fog would make it impossible to locate any people in need anyway. Squadron 722 receives its information primarily from DMI's public website. This information is equivalent to the text messages that they can otherwise receive directly. On DMI's website, Squadron 722 has access to the information that is available to the public, including radar and

68
satellite photos, which are updated every 3-4 hours. In addition, a few people have unofficial access to the latest radar and satellite photos, which are updated every 10 minutes and are not normally available to the public. If Squadron 722 did not have access to information about the current and expected weather from DMI, it would have several consequences. First of all, too many rescue operations would be cancelled due to lack of overview of how safe it is to go out. Similarly, more accidents involving the helicopters would probably occur. Second of all, the crew would not be equally able to plan the rescue operations, so that the helicopters and every light hour of the day could be utilized in the best way possible. Analysis A chart can be prepared as described in chapter 3 of the main report. The chart shows the economic consequences of the decision to fly/not to fly when bad weather has been predicted.
Table 66: Overview of costs in a rescue mission
Cost Flying No flying Bad weather Cost type 1.
Costs of flying plus the value of helicopter and crew times the probability of crash. Cannot be calculated as the probability of a crash in bad weather is unknown
Cost type 2. The value of a human life times the probability that the person could have been rescued: Approx. DKK 6.5 million
Good weather Cost type 3. Costs of flying: Approx. DKK 54,000
Cost type 4. The value of a human life times the probability that the person could have been rescued: Approx. DKK 6.5 million
An attempt has been made to quantify in economic terms the value of each cell in the table. How these costs can be calculated has been described below. The unit is per mission. Cost type 1: A mission takes 1 hour and 38 minutes13 on average and one flight hour costs DKK 33,00014. This gives a total cost of flying of just under DKK 54,000 per mission. To this should be added the cost of a potential crash. There are 6 crew members on board the helicopter. They each have a value of DKK 10.4 million, amounting to DKK 62.4 million. In addition, a helicopter is worth DKK 51.3 million15. This gives a total value of a helicopter with crew of approximately DKK 114 million. 13 Source: Squadron 722. 14 Source: Defence Command Denmark, the amount is made up in accordance with the total cost principle. 15 Calculated as the cost in USD in 1964 in current DKK value. Since these are very old planes that are no longer available on the market, this price offers the best estimate. It should be noted that the present helicopters have been upgraded in terms of equipment compared to the original helicopters. Thus, the estimated figure is a bit too low.

69
In order to calculate cost type 1, the sum of the value of human lives and helicopter must then be multiplied by the risk of a crash. It is very difficult to quantify the risk of a crash in bad weather. So far, there has been only one (thankfully) serious accident involving Squadron 722’s current helicopters. It happened on 10 February 1968 during a search at night over the Wadden Sea where helicopter U-281 crashed and all people on board were killed. However, the helicopter in question did not crash because of the weather. Thus, since there has not been any crashes (thankfully) caused by the weather, the probability of a crash cannot be calculated - neither for good nor bad weather.16 Cost types 2 and 4 Cost types 2 and 4 are identical, i.e. the value of a human life times the probability that someone could have been rescued if a decision had been made to go out by helicopter. A human life is worth DKK 10.4 million. In approximately 14,500 missions, Squadron 722 has rescued approximately 9,000 lives. The probability of rescuing a human life on a given mission is thus equal to 9,000/14,500 missions, or approximately 62 percent. This means that cost types 2 and 4 constitute DKK 10.4 million times 62 percent, or DKK 6.5 million. Cost type 3 As calculated above under cost type 1, the total cost of flying is just under DKK 54,000 per mission. The economic value Information from DMI is only valuable if it makes the decision-maker - in this case Squadron 722's vessel captain - change his behaviour. If the vessel captain already has a subjective expectation that the weather is too bad for flying and DMI confirms this, or vice versa, if the vessel captain has a subjective expectation that it is safe to fly - and DMI confirms it, information from DMI is not of any value in this matter17. The problem is that it is extremely difficult - if not impossible - to say what the vessel captain’s subjective expectation of the weather would have been without DMI. He probably does not know it himself because the access to weather forecasts is an integrated part of his daily work. However, the figures in the section above give an indication of what sums are at stake. Just one prevented helicopter accident represents an economic benefit of DKK 114 million. Similarly, information from DMI that the conditions are good for flying is a significant benefit in those situations where the crew would be afraid to go out. For every mission that is initiated only because of sufficient information from DMI (and where Squadron 722 would not have gone out otherwise), society saves an average of DKK 6.5 million. The value can also be measured in a different way. The information in the section above can be comprised in one simple equation which indicates how much is at stake during each mission.
Alternatively, the price of a new helicopter could have been used, which is approximately DKK 140 million, but the new helicopters are much more advanced and in better condition than the present helicopters, so that estimate would be a bit too high. 16 Unfortunately, it also proved impossible to obtain information about how often Squadron 722 takes off even when it is not allowed to according to conventions. Thus, numbers for both the numerator and denominator in the equation are missing. 17 However, the information can still easily have a socio-economic value because Squadron 722 - as described in the introduction - makes many different decisions based on the information.

70
Table 67: Eeconomic value
Headline Value Economic value of helicopter and crew DKK 114 million Average socio-economic value of mission DKK 6.5 million Economic tolerable probability of crash 5.7 percent18
The equation shows that on each mission DKK 114 million is at stake to save DKK 6.5 million. This means that if the probability of a crash due to bad weather is less than 5.7 percent, Squadron 722 should go out on the mission. This calculation is, of course, only an indication of the pure economic value. In practice, a crash probability of 5.7 percent is probably not acceptable to neither society nor the individual crew members and their families involved.
18 This probability can also be viewed as a weighing of the two probabilities: The probability of bad weather and the probability of an accident during bad weather.

71
Appendix 3: Case on Meteorological Icy Road Warnings Case written by DTF. Introduction Traffic costs in connection with winter weather are significant. They concern accidents and time loss as a result of impassable roads. Traffic costs in connection with winter weather that have not been taken into account are even more significant. If attempts are made to guard against winter weather conditions, such as snow clearance and salting as well as overall caution, these costs may be reduced considerably. However, winter preparedness has costs as well. Both the direct operating expenses for snow clearance and road salting as well as the indirect costs, such as salt damage to vehicles and nature, including potential drinking water contamination. Snow clearance and prevention of icy roads are statutory. How it is done, however, is not statutory. When establishing the more specific details regarding implementation and enforcement of preventing icy roads, the benefits of winter control are thus weighed against the costs of enforcing this control. Winter preparedness in Denmark The Danish weather is characterized by fluctuating temperatures around the freezing point. This is precisely the critical point in terms of icy roads, which makes strong efforts to prevent icy roads necessary in Denmark. Consequently, salting is the most widespread action against icy roads. Alternatives such as using gravel are less effective in periods of major fluctuations between freezing weather and thaw. Over the last many years, better salting methods have been developed, so that the salt is utilized more efficiently, reducing salt usage and its external costs. At the same time, more advanced warning systems have been developed, so that icy roads can be prevented to a greater extent. In the past, efforts to combat icy roads were not initiated until icy road conditions had been observed. This is still the case in many municipalities. Without an automatic warning system, icy road conditions, or the risk of icy road conditions, are observed in different ways. For example by using patrol cars that drive around in the area and visually assess the risk of icy roads. The role of meteorologists in icy road warnings The meteorological service “icy road warnings” is aimed at optimizing icy road preparedness in the best way possible as regards the choice of time and means. The Danish Meteorological Institute (DMI) has developed an icy road warning system in collaboration with the Danish Road Directorate (VD) and the counties. It is used today by VD, the counties and some municipalities.19 As part of the system, measuring stations have been set up at different locations in the road network. The measuring stations measure road and weather conditions and transmit the
19 The examination is based on the existing (2005) municipal structure in Denmark. In connection with the structural reform, the counties will be abolished as of 2006, and at this time, significant efforts are at work in assigning roads from the counties to the Danish Road Directorate and the new large municipalities.

72
information to DMI as well as to main stations in the counties. Combined with data from other meteorological sources, DMI produces forecasts for roads and the geographical areas.20 With the current icy road warning system, notifications of risk of icy roads are issued 3 hours in advance in most cases. Today, salting can thus be used to a greater extent as a preventive measure. In this way, the problems are pre-empted. Consequently, it is possible that the number of hours during which road users experience icy roads can be reduced by using meteorological warnings against icy road conditions.21 Since the icy road warning system is linked to measuring stations and forecasts and thus makes observations of icy roads automatic, it has also been possible to reduce the number of weather patrols. Delimitation of sketch This sketch is based on a situation with or without a meteorological icy road warning system in Denmark. The subject of examination is not DMI against other weather services, but the situation where the alternative was less accurate predictions. In a situation without meteorological icy road preparedness, action will also be taken against the winter weather; however, people are not as well positioned to choose the optimum reaction and they will not in the same way be able to enforce preventive measures. A fair amount of literature is available about the socio-economic consequences of salting and other winter control measures (including OECD, 1989 and VD, 1979). These consequences include optimum choices of winter control measures. These will not be dealt with in the following examination. It is simply assumed that an optimum level of preparedness is in effect given the available information. Furthermore, the literature can be used as input for the considerations about valuation of the meteorological service. It is difficult to estimate the exact effect of good icy road warnings from DMI compared to overall winter preparedness. Thus, we have chosen to calculate benefits per shifted days per year, i.e. per icy day per year where precautions have been taken in advance. When compared to the expenses for the meteorological service “icy road warnings”, this can be used for break-even considerations. Cost benefit analysis of meteorological icy road warnings The primary elements of a socio-economic analysis of icy road control are: • passability/time savings • accidents • external effects (salt damage to nature, water contamination, road wear) • operating expenses
The socio-economic analysis of the meteorological service “icy road warnings” contains the same elements. The next step is to adjust these to the expected changed effect produced by icy road warnings. Passability/time savings In VD (1979), the effects of road salting on passability are calculated to be DKK 122 million (average estimate, DKK 8-315 million). These figures are based on an assessment of the expected delay that road users experience in a situation with salting compared to a situation without salting. This delay, distributed on the purpose of the trip, is translated into a value using time values for 20 The system has been described in the Danish Road Directorate (1996). 21 Currently, meteorological warnings against icy road conditions are also provided by the private weather service Vejr2. The measurements from the installed measuring stations are used by this weather service as well.

73
travel time. Calculations are simplified with unchanged traffic volumes. Moreover, effects of light traffic (bicycle, walk, motorized bike and motorcycle) are not examined. The same procedure will be followed broadly in the following, although updated to the latest available data. An important difference in the assumptions concerns minor delays. In the report from VD (1979), it is assumed that delays under 5 minutes do not have any value to road users (with the exception of lorries), and thus no value has been assigned to them. In our calculation, all delays are assigned the same value (per hour). This is in accordance with the guidelines set out in the manual of socio-economic analysis about applied methods and practices in the area of transport from the Danish Ministry of Transport and Energy (2002) (”Manual for socioøknomisk analyze – anvendt metode og praksis på transportområdet”) and with the catalogue of key values for application in socio-economic analyses in the area of transport published by the Ministry of Transport and Energy (2004) (” Nøgletalskatalog til brug for socioøkonomiske analyser på transportområdet”). Also, all road users are included here. In VD (1979), children under 16 are excluded, as they were not included in the Survey of Transport Habits (TU) at the time or in the assessment of time value.22 For the purpose of assessing the value of salting, an estimate is used in the calculations in VD (1979) of the number of days per year with icy road conditions without salting as well as the number of days per year with icy road conditions with salting. This estimate is 25 days without salting and 20 days with salting. It is thus assumed that it will never be possible to completely avoid icy road conditions, but they can be reduced considerably. The term ‘days per year with icy road conditions’, or 24 hours with icy road conditions, refers to a situation where all of Denmark is covered with ice for one day, or 24 hours. Of course, this happens very rarely. Usually, the roads are icy at different times around the country. The number of days with icy road conditions, or icy road hours, is thus a calculation term that refers to how often icy road conditions occur over the course of a season when everything is added together at one time. Since 1979, a significant improvement of winter preparedness has been seen. Hence, the number of days per year with icy road conditions is expected to be lower now. In this connection, the meteorological warning is expected to be an important element that can thus reduce the number of days per year with icy road conditions. In the following, road users’ time loss is assessed from one day per year with icy road conditions. Passenger cars: For the purpose of calculating the expected time loss from icy road conditions, a table is given showing the average speeds for different road types. The same speeds are used as in the VD report from 1979 except for motorways where the average speed today is approximately 119 km/hour (VD (2004)). It is estimated that the speed on motorways in winter conditions without salt is 70 km/hour (compared to the 65 km/hour in the VD report (1979)) and 115 km/hour in winter conditions with salt. Thus, it is possible to assess the average speed of passenger cars on days with winter conditions with or without road salting. In addition, a distribution of transport performance on road types is required. This is based on (www.vd.dk) where the split-up of municipality roads is not divided by town or outside town areas.
22 Here, children have not been excluded, as the passenger traffic performance is based on TU, which now includes people of ages 10-84.

74
Table 68: Speeds - Passenger cars
Proportion of transport
Normal road conditions
Winter conditions with salt
Winter conditions without salt
% Speed (km/hour) Motorways 21.8 119 115 70 Highways 37.5 80 80 60 Municipality roads (not town)
15.6 60 55 40
Town streets 25 45 45 35 Total 100 76.6 75.0 52.8
For the purpose of calculating the loss for road users, the figures for transport performance are required as well. The figures used for transport performance have been obtained from Statistics Denmark (2000) for 1999, which are revalued to 2003 figures by using a growth factor of 1.7% per year.
Table 69: Transport performance per average day
1999 Updated to 2003 Million km
Car as driver 82.20 87.93 Car as passenger 26.80 28.67 Car total 109.00 116.60 Million hours Hours in winter conditions with salt
1.45 1.56
Hours in winter conditions 2.06 2.21 Additional use in icy conditions
0.61 0.65
Note: 1.7% annual growth. Source: Statistics Denmark, Transport 2000.
This makes it possible to calculate the loss for road users in one day of icy road conditions when the roads have not been salted. The loss for road users is calculated by means of time values. Time values are given for normal driving time and for delay time. Delay time is more costly to road users than pure driving time. In this calculation, the time value of delays is used, as icy road conditions precisely make the trip longer than the normal driving time. For comparative purposes, the loss for road users is also given using the time value of normal driving time.
Table 70: Loss for road users under icy road conditions per day
Additional use hours
Time type Time value, DKK/hour
Loss for road users (DKK million)
0.65 Driving time 59 38.5 0.65 Delay time 89 58.1
Note: Time value is a weighed average according to distribution by purpose of trip.

75
Busses: The number of passengers in 1999 was 456.2 million per year. It is assumed that the number of passengers remains the same up until 2003. In VD (1979), an average delay of 5 minutes is assumed. The same assumption is applied here. This gives a total delay per day of 104,000 passenger hours. This covers all delays, including minor delays.
Table 71: Loss for road users, busses, DKK million
Delay Time type Time value Loss for road users
0.104 Driving time 59 6.15 0.104 Delay time 118 12.29
Lorries: The annual traffic performance of lorries (nationally, over 6 tons) was 1,495 million km in 1999 (Statistics Denmark, 2000). This figure is projected to 2003 by 1.7% per year. It is assumed that the average driving speed of lorries drops from 55 to 45 km/hour (as in VD (1979)). This comes out to 17,703 hours per day of additional use.
Table 72: Loss for road users, lorries, DKK million
Delay Time value (market price) Loss for road users 0.0177 348,000 6,161
The total loss for all road users is now:
Table 73: Loss for road users per day (delay time)
DKK million Cars 58,119 Busses 12,290 Lorries 6,161 Total 76,570
If the time value for pure driving time is used, the total loss for road users is found:
Table 74: Loss for road users per day (pure driving time)
DKK million Cars 38,528 Busses 6,145 Lorries 6,161 Total 50,834
76
If the meteorological service ”icy road warnings” can reduce the number of days per year with icy road conditions by 1 on an annual basis, the time saving is thus DKK 76.57 million. Please note that the calculations above are based on unchanged traffic volumes and means of transportation in connection with winter weather. This is a simplified assumption. The assumption leans towards overestimating the loss for road users, as it is expected that some road users will change their means of transportation or refrain from travelling. Accidents It is difficult to assess the effect on accidents of icy road warnings and prevention of icy road conditions in general. In the Danish Road Directorate (1979), the value of salting in relation to accidents is set to 0. Based on different Danish data and foreign experiences, no support is found to reject the claim that salting does not have any effect on the scope and severity of road traffic accidents. The reason may be that the effect of surprise by the experience of icy road conditions when roads are usually salted is considerable and that the speed is higher on salted roads compared to unsalted roads. By contrast, OECD (1989) concludes that efforts to prevent icy road conditions (de-icing) have a significantly positive effect on traffic safety. The conclusion is based on German studies of actual accidents viewed in relation to the timing of salt application as well as information from other OECD countries. More recent Danish data also suggest a reduction in the number of accidents due to icy road conditions in relation to the total number of accidents. However, this has not been tested further, and other factors may exist. Based on the above, salting and prevention of icy road conditions in Denmark are estimated to have a positive effect on traffic safety and thus on the costs of accidents. However, the effect may be minor. The effect of the meteorological service ”icy road warnings” on traffic safety is also expected to be minor. It is fair, nevertheless, to assume that it will be absolutely positive. As icy road warnings can make road users take extra precautions in traffic, it may have a positive effect on traffic safety. In cases where icy roads have been reported, road users may allow themselves extra travel time – and thus drive more safely – just as the effect of surprise from icy road conditions will be reduced. Finally, it is possible that salting has a positive effect on traffic safety if performed at more appropriate times, causing less inconvenience to traffic. All things considered, the effect of icy road warnings on traffic safety is estimated to be positive. However, no further attempts to quantify this effect will be made here; it is simply set to +. For informational purposes, it should be noted that one reported road traffic accident costs DKK 1,115,000.23 External effects The main external effects of icy road prevention (salting) are • salt damage to roadside trees and other local nature • possible contamination of water wells • salt damage to vehicles
A common feature of the external costs of using salt is that they are related to a great extent to the amount of salt used. Thus, it is of less interest at what time the salt is spread. In the assessment of
23 This is a key indicator used in other analyses involving traffic safety and accidents (Danish Ministry of Transport and Energy, 2004).

77
the consequence for external effects of the meteorological service ”icy road warnings”, it must then be assessed to what degree the warning is expected to increase or reduce the overall use of salt. On the face of it, it is difficult to determine this effect. On the one side, the meteorological warning can be expected to reduce the number of unnecessary salt applications; however, on the other side, the warning could increase the number of salt applications. In this sketch, the effect is thus estimated to be neutral and is not valued. A slight increase in the usage of salt might be expected, which can be indicated by means of a -. Operating expenses There are operating expenses related to meteorological warnings of icy road conditions to the meteorological institute, the Danish Road Directorate, the counties and municipalities. The Road Directorate and all the counties participate in the meteorological icy road warning system, whereas this is only the case for some of the municipalities. The municipalities’ expenses for winter preparedness show very significant differences. Thus, average expenses per km of municipality road varied from approximately DKK 440 to approximately DKK 73,600 in 200324 (source: road expenses of the municipalities (www.vd.dk)). These extreme differences reveal that, for one thing, there must be major regional differences in the weather-dictated need for winter preparedness. For another, there must be major differences in the possibility of enforcing winter preparedness measures. For a third thing, there must be major differences in the level of service that the municipalities choose in terms of winter preparedness.25 As mentioned earlier, meteorological warnings of icy road conditions are also offered by a private weather service. Thus, the task of assessing the costs specifically related to the meteorological service is made difficult when taking into consideration municipal differences. As a result, it is estimated that these average municipal expenses for winter preparedness measures cannot be used in the assessment of the total municipal costs of participating in the meteorological icy road warning system. Thus, an alternative approach has been selected to estimate the expenses related to the meteorological service “icy road warnings”. The users (the Danish Road Directorate, counties and municipalities) pay approximately DKK 4 million per year to DMI for receiving forecasts, etc. Icy road warnings are user-financed at DMI, and so it is assumed that DMI’s expenses for this service are equivalent to the DKK 4 million.26 However, not all municipalities have signed up for the icy road warning system. Consequently, in order to perform national calculations, it is assumed that all municipalities sign up for the system. The majority of DMI’s expenses for the icy road warning system depends on the number of municipalities, so there will be only a slight increase in these expenses. Based on an estimate, this will produce additional expenses to DMI of DKK 1 million if all municipalities sign up for the system; thus, DMI’s annual operating expenses amount to DKK 5 million. According to the latest statement, 38 municipalities had signed up for the system at DMI. In addition, the Danish Road Directorate, counties and municipalities have operating expenses themselves in connection with the system. At this time, 315 measuring stations have been installed around the country, each with an annual maintenance cost of approximately DKK 20,000.
24 When disregarding the Cities of Copenhagen and Frederiksberg. Also, winter expenses for two municipalities were set to 0, which has been disregarded here. 25 In general, costs are higher for the major towns, highest in the Greater Copenhagen area, where there is also more traffic. This is true whether or not the municipalities participate in the meteorological warning system. 26 DMI’s operating expenses in connection with the icy road warning system constituted DKK 4,066,200 in 2004. In addition, DMI had revenue of DKK 1,759,615 for system upgrading (source: DMI).

78
If the system is distributed to all municipalities, additional measuring stations will be required as well. Many of the new municipalities have already had measuring stations installed, but it is assumed - very simply - that for each new municipality, an additional measuring station is required. Thus, another 233 measuring stations will be required, i.e. a total of 548 measuring stations. Annual maintenance expenses will then amount to just under DKK 11 million. Operating expenses for the system at DMI and at the Danish Road Directorate, counties and municipalities thus total to DKK 16 million. Alternatively, without an icy road warning system, more patrolling would be required for visual assessment of the risk of icy road conditions. If the icy road warning system leads to slightly increased usage of salt, expenses for salt will increase. However, it is very difficult to determine the size of these as well. The costs of patrolling depend on the chosen level of prevention of icy road conditions, but it does not seem unreasonable to expect it to be of the same order of magnitude as the operating expenses here. In turn, since salting expenses seem to move in the opposite direction, it has been decided not to value these effects, but merely indicate them by means of +. Thus, total expenses for the meteorological icy road warning system have been set to DKK 16 million per year. Summary of effects When summarizing the effects, it is important to be aware that operating expenses have been stated in factor prices and must thus be converted using the net duty factor of 1.17 in order to have market prices. In addition, a distortion loss due to public costs of 20 per cent should be added.
Table 75: Total effects
Element – financial estimate or qualitative description DKK (market prices) Accidents + passability/time loss 76.57 million external effects 0 (-) operating expenses warning system consequence for other operating expenses patrolling salt usage
- 18.72 million (-18.72 million)
(+)
(0 (-)) forvridningstab -3.2 million
Break-even It is very difficult to give an exact assessment of how much road users’ time loss could be reduced by means of icy road warnings. Instead, a break-even calculation is made showing the point when an equilibrium between benefits and costs is reached. It appears that the equilibrium between benefits and costs with the above values is reached at a reduction of icy road conditions of 6 hours and 52 minutes (0.29 days). If only the time period during which road users experience icy road conditions can be reduced by 6 hours and 52 minutes per year nationwide, a socio-economic surplus is achieved from using the system. If it is assumed that it takes an average of 1 hour to apply salt to an area if the salting

79
process is not started until the roads become icy27, the roads only have to become icy 6.9 times per year nationwide, which is not often. If instead, the time values of pure driving time were used, the break-even point would be found at 10 hours and 21 minutes. The above shows that major benefits can be gained from an efficient warning system for icy road conditions. In the calculations, potential positive effects in the form of a reduced number of accidents have not been included. Conclusion The examination of the socio-economic consequences of icy road warnings shows that the time effect of preventing reduced road conditions in nationwide traffic for just one hour represents a very significant benefit. Also, operating expenses for the meteorological warning system easily seem minor by comparison. Thus, only a slight improvement is required in road users’ possibility of driving on roads in good condition, approximately 6.9 hours nationwide, to make the system socio-economically cost-effective. Furthermore, it appears that there are major municipal differences in municipal expenses for winter preparedness. It is difficult not to imagine that there are also major differences in the municipal levels of service in terms of prevention of icy road conditions. It has yet to be seen how this will be affected by the upcoming structural reform when the counties are abolished and the responsibility of the roads is shared between the Danish Road Directorate and the new large municipalities. Literature Statistics Denmark (2000), Transport 2000. OECD (1989), Curtailing usage of de-icing agents in winter maintenance, The Danish Road Directorate (1979), Socioøkonomisk analyse af anvendelsen af vejsalt i vintervedligeholdelsen (Socio-economic analysis of the usage of road salt in winter maintenance). The Danish Road Directorate (1996), Glatførevarsling, notat nr. 39 (Icy road warnings, memorandum no. 39). The Danish Road Directorate (2004), Hastigheder 1999-2002, rapport 284 (Speeds 1999-2002, report 284). Ministry of Transport and Energy (2003), Manual for socioøkonomisk analyze – anvendt metode og praksis på transportområdet (Manual for socio-economic analyses - applied method and practice in the area of transport). Ministry of Transport and Energy (2004), Nøgletalskatalog til brug for socioøkonomiske analyser på transportområdet (Catalogue of key values for use in socio-economic analyses in the area of transport).
27 It is expected to take longer and the salt spreading vehicles alone will slow down traffic if, for instance, they go on the roads during peak travel times.

80
Appendix 4: Literature study This note is a literature study of how the value of meteorological services can be elucidated and have been elucidated before. The literature study first examines the standard theory that is ordinarily used in analyses of meteorological services. Second, selected studies from various countries are presented in which the described theory has been used.
It is important to emphasize that the value of a meteorological service must be assessed based on the importance of the information to society. This means that such analysis is not meant to elucidate the meaning of the weather, but exclusively the meaning of information hereon.
The methods used in assessments of the value of meteorological services are based mainly on economic theory of choices under uncertainty.
Thus, users of meteorological services are expected to act rationally from set principles concerning Bayesian updating of expectations and maximization of expected usefulness/profit. It is also important to establish how the individual user responds to risk, as this will have great impact on the user’s behaviour in light of a given “forecast/notification” from the meteorologist.
In terms of the value of meteorological information, it is important to keep in mind that the information rarely results in a direct opportunity to earn money, but, in contrast, to save costs of various types of damage.
Chapter 2 describes the applied theory of choices under uncertainty. Then, an illustrative example is given of how this theory may be applied (chapter 3). Chapter 4 describes the applications of the theory in connection with case studies of the value of meteorological services. Chapter 5 describes a selection of relevant case studies.
Choices under uncertainty In economic theory it is often assumed that everyone acts rationally. This means that all decisions are based on an objective assessment of the information at hand and what they mean in relation to a measurable success criterion. Thus, a decision-maker will, by definition, always make the optimum decision in a given situation and given the information available to him.
As far as decisions based on meteorological services are concerned, these are decisions that must be made under uncertainty. The decision-maker must decide how to make his benefit as significant as possible in the situation with which he is confronted. This requires several considerations of the level of uncertainty, costs and benefits of every possible combination of actions and weather conditions as well as willingness to accept risk. These elements are described in the following.
Bayesian updating It is a basic assumption in this type of analysis that the decision-maker can determine precisely how to respond to the probability of different weather outcomes. This is also referred to as the decision-maker’s subjective probability distribution.
A subjective probability distribution may consist of the decision-maker’s personal weather expectations and the meteorologist’s announcement about weather expectations. These two probability distributions are related by means of Bayesian updating, which is considered further in Box 1. The basic principle in Bayesian updating is that new information from the meteorologists will affect the probability distribution that the decision-maker uses in a rational and consistent way.
It is a basic assumption that the future weather is based on an objective probability distribution. The objective probability distribution of different outcomes of an event is equal to the true probability distribution behind the future weather. This distribution is usually unknown to all parties in the

81
decision process – including the meteorologist. That is why all decisions are based on the subjective probability distribution.
The meteorologist’s task is to identify as much as possible of the objective probability distribution for the future weather. The information from the meteorologist should thus be expected to lead the decision-maker’s subjective probability distribution towards a more correct expectation of the future weather. Herein lies the value of information from the meteorologist.
Bayesian updating also constitutes an initial indication of whether the meteorological service has value to the decision-maker. If the decision-maker’s probability distribution of the possible weather outcomes is not changed by the announcement from the meteorologists (see section 0 for a description hereof), the meteorological information will not affect the decision-maker’s choice. In that case, the information is of no value to the decision-maker.
Box 1 Bayesian updating28
It is assumed that the decision-maker has a prior subjective idea of the probability of the possible weather outcomes, which can be summarized in the probabilities ps where s = 1,..,S is all possible weather outcomes. Now it is assumed that there is a provider of meteorological information that can produce one of many possible weather notifications i =1,..,I. The decision-maker also has a prior subjective idea of the probability of receiving a specific piece of information qi. This probability is made up of conditional probabilities of being notified if the weather outcome is of the type s, qi,s .
∑=s
ssii pqq ,
By means of Bayes’ theorem, it is now possible to calculate the updated probability p*s,i that the weather will be of the type s, given the received information i.
i
ssiis q
pqp ,
, =∗
The conditional probability qi,s may be given as part of the meteorological service or it may be subjectively created based on prior experience with the weather service.
In order to calculate the socio-economic value of information, the value to all decision-makers who use the information must be summarized. To do so, additional assumptions of how individuals form their subjective expectations are required, seeing that it is not possible and makes no sense to consider each individual as unique. In other words, it is necessary to use a consideration of averages. It must be expected that the decision-maker’s subjective probability distribution is adjusted over time as he gains experiences with the weather. Thus, it is fair to assume that all decision-makers have the same subjective probability distribution equivalent to the empirically observed distribution of the weather. This type of expectations is also referred to as rational expectations. If a decision is required about an action in the month of August, it makes sense to base it on the weather in August as it has been over the last many years. This is a good approximation of the objective probability distribution of the weather in the future month of August.
28 This representation is based on Katz & Murphy (1997, chapter 3).

82
Definition of subjective probability In the remainder of this literature study and in the method used in the case studies in the report, the subjective probability distribution will be defined as the empirical distribution of the weather. Ex-ante and ex-post value of information Information may be of different value to the user depending on the time when the value of the information is determined. The value that the user attaches to additional information before he has received the information is different from the value of the information after he has received it. The reason is that before he receives the information, the decision-maker has to use his subjective expectations to assess the probability of receiving a specific message from the meteorologist. If the value of the information is assessed before the decision-maker has received the information, it is referred to as an ex-ante assessment. Reversely, it is an ex-post assessment if the value is assessed after the decision-maker has received it. In an ex-ante assessment, consideration should be taken to the fact that the information has not yet been received. Basically, it is thus determined how willing the decision-maker is to pay for the additional information. This is done based on the decision-maker’s subjective expectations of the distribution of possible messages from the meteorologist29. Returning to Box 1 on Bayesian updating, it is clear that this possibility is also contained in the formula for updating. An ex-post assessment is more straightforward. The decision-maker has now received the information from the meteorologist. It is thus determined how much this information is worth in relation to the decision-maker’s optimum action with and without said information. Selected method of assessment The remainder of this report is based on an ex-post description of the value of information. This is how most people have analyzed the issue so far. It is much more complicated to consider the issue from an ex-ante approach because many scenarios must be considered. As it is, the expected value of an action must be calculated for every possible announcement from DMI. Expected value A decision under uncertainty is based on the expected value of the many possible actions. For every possible action, the expected value of the action is calculated as a weighed average of the value of the action in each of the possible weather outcomes. This means that the subjective probability (in this case the empirically observed frequency) of rain must be multiplied by the value of the action in case of rain, etc. The mathematical representation of this type of valuation is summarized in Box 2.
29 A rational agent is considered who bases his subjective expectations about the weather on the empirical distribution. Hence, this is equal to what the agent is willing to pay for information that will improve the basis of decision in relation to a simple assessment of the average weather in the previous years.

83
Box 1 Expected value and usefulness
It is assumed that the decision-maker has a choice between a = 1,..,A actions which are important to his expected profit or use. It is furthermore assumed that there is a consistent method of assigning value to each choice a. This may be dependent on choices made by other decision-makers. In order to analyze the decision process in a mathematical environment, the assignment of value must be formulated as a function of the choice a, the weather event s and other problem-specific parametres. Such assignment of value may be in terms of money or in terms of usefulness. The functional form determines how the decision-maker responds to risk. In a situation where the decision-maker has not received any information from the meteorologist, the expected value of action a can be calculated from the subjective probability distribution ps.
∑∑ ==S
ss
sDMIWithout psaVpaEV 1,),()(
EV(a) refers to the expected (E) value (V) of the action a. The value function V(a,s) assigns a value to every possible combination of action a and weather s. The decision-maker’s position on risk determines the functional form of V(a,s). The decision-maker then chooses the action a that gives him the highest expected value. Given updated probability distributions p*s,i of the possible events given the information i, the value of the action a to the decision-maker can be calculated in the case where the decision-maker receives information from DMI.
∑∑ == ∗∗
Sis
sisDMIWith psaVpaEV 1,),()( ,,
Depending on who the decision-maker is, several different formulations of value may be required. Most often, companies will seek to maximize the expected financial profit of a given choice. In certain cases, it may be assumed that some individuals also use this approach. However, it is not unreasonable to make the claim that many individuals have a different perception of risk than do companies. An example of how risk tolerance plays a role in individuals’ decisions is given in Katz & Murphy (1997). If an individual is given the option of either DKK 1 in his hand or DKK 2 with a probability of 50% and DKK 0 with a probability of 50%, the person will most likely not be concerned with which of the two solutions he chooses. The expected value of the two solutions is the same, i.e. DKK 1. This is referred to as being risk neutral. Now the same problem is presented where, instead, the matter is DKK 1 million with certainty or DKK 2 million with a probability of 50%. In this situation, it is not unreasonable to assume that many people would have a strong preference towards having the one million with certainty as opposed to the uncertainty of the 2 millions. If that is the case, the individual is referred to as being risk-averse. These individuals do not like uncertainty in their personal set of values. In other words, receiving twice the amount of money does not represent twice the value to a risk-averse individual. The decision-maker chooses the action that gives him the highest expected value. If an update of the subjective probability distribution based on new information makes the decision-maker choose to act differently, the information has been of value to the decision-maker. The personal financial value of the information is equivalent to the difference between the expected value of the optimum action before and after information from DMI is received. The expected value of both actions is assessed based on the subjective probability distribution updated with information from DMI (see also box 2).
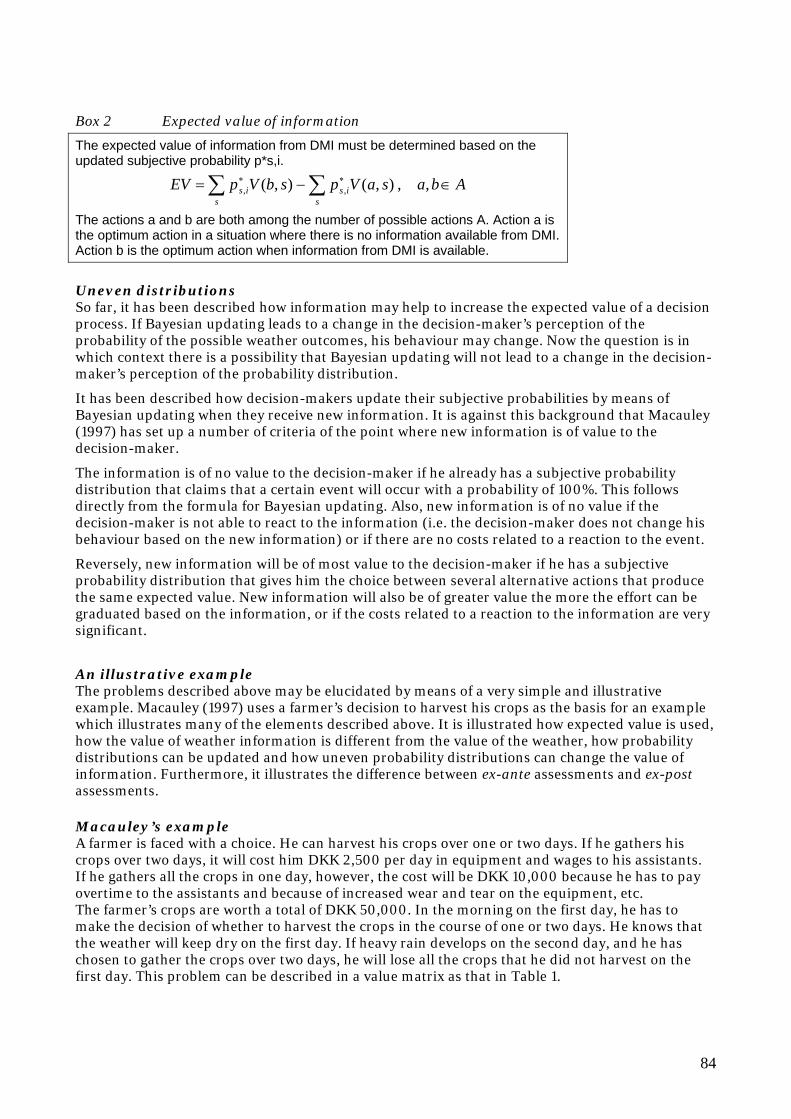
84
Box 2 Expected value of information
The expected value of information from DMI must be determined based on the updated subjective probability p*s,i.
AbasaVpsbVpEVs
iss
is ∈−= ∑∑ ∗∗ ,,),(),( ,,
The actions a and b are both among the number of possible actions A. Action a is the optimum action in a situation where there is no information available from DMI. Action b is the optimum action when information from DMI is available.
Uneven distributions So far, it has been described how information may help to increase the expected value of a decision process. If Bayesian updating leads to a change in the decision-maker’s perception of the probability of the possible weather outcomes, his behaviour may change. Now the question is in which context there is a possibility that Bayesian updating will not lead to a change in the decision-maker’s perception of the probability distribution.
It has been described how decision-makers update their subjective probabilities by means of Bayesian updating when they receive new information. It is against this background that Macauley (1997) has set up a number of criteria of the point where new information is of value to the decision-maker.
The information is of no value to the decision-maker if he already has a subjective probability distribution that claims that a certain event will occur with a probability of 100%. This follows directly from the formula for Bayesian updating. Also, new information is of no value if the decision-maker is not able to react to the information (i.e. the decision-maker does not change his behaviour based on the new information) or if there are no costs related to a reaction to the event.
Reversely, new information will be of most value to the decision-maker if he has a subjective probability distribution that gives him the choice between several alternative actions that produce the same expected value. New information will also be of greater value the more the effort can be graduated based on the information, or if the costs related to a reaction to the information are very significant.
An illustrative example The problems described above may be elucidated by means of a very simple and illustrative example. Macauley (1997) uses a farmer’s decision to harvest his crops as the basis for an example which illustrates many of the elements described above. It is illustrated how expected value is used, how the value of weather information is different from the value of the weather, how probability distributions can be updated and how uneven probability distributions can change the value of information. Furthermore, it illustrates the difference between ex-ante assessments and ex-post assessments. Macauley’s example A farmer is faced with a choice. He can harvest his crops over one or two days. If he gathers his crops over two days, it will cost him DKK 2,500 per day in equipment and wages to his assistants. If he gathers all the crops in one day, however, the cost will be DKK 10,000 because he has to pay overtime to the assistants and because of increased wear and tear on the equipment, etc. The farmer’s crops are worth a total of DKK 50,000. In the morning on the first day, he has to make the decision of whether to harvest the crops in the course of one or two days. He knows that the weather will keep dry on the first day. If heavy rain develops on the second day, and he has chosen to gather the crops over two days, he will lose all the crops that he did not harvest on the first day. This problem can be described in a value matrix as that in Table 1.

85
Table 76: Proceeds in the four possible scenarios
Heavy rain on the second day
No heavy rain on the second day
Harvest in one day 40,000 40,000 Harvest over two days 22,500 45,000
Initially, it is assumed that the farmer has not had access to information about the weather except from his own assumptions and experiences. The farmer thus has a subjective probability distribution P over the weather on the second day. The farmer must now compare the expected value of the harvest in the two scenarios in which he gathers the crops over one or two days. ( )( ) )1(000,45500,22
000,40
2
1
PPVE
VE
days
day
−⋅+⋅=
=
When solving the equation system for P, it appears that if the farmer believes that there is a probability of less than 22% of rain on the second day, he is likely to harvest the crops over two days. At a probability of rain on the second day of exactly 22%, the expected value of the two alternatives is the same, i.e. DKK 40,000. At a probability of rain higher than 22%, the expected value of gathering the crops over two days will be lower than the value of gathering them in one single day. Now it is assumed that the farmer can supplement his own expectations with a 100% correct forecast from DMI well ahead of time before he has to make his final decision. However, the farmer does not know what the forecast will be - rain or no rain. This is an ex-ante approach of measuring the value of the information. The ex-post approach will assume that he had already received the information. The farmer uses his prior probability distribution P to calculate the expected value of the harvest before he learns the forecast from DMI. The difference is that the farmer now knows that when the decision has to be made, he will know the weather with 100% certainty. The value of the forecast from DMI is thus that the farmer’s expected value of the harvest - before he receives the forecast - now is between DKK 40,000 and DKK 45,000. ( ) )1(000,45000,40 PPVE
DMI−⋅+⋅=
Although the farmer has not yet received the forecast from DMI, it means that it is no longer necessary for the farmer to worry about the situation where he loses half of his harvest and has to settle with proceeds of DKK 22,500. The two problems are illustrated in the figure below. It appears that in the case where information from DMI is not available, the expected value of the harvest at probabilities of rain above 22% will always be DKK 40,000. The ex-ante value of DMI's forecast is the difference between the expected value in the two scenarios, i.e. the vertical distance between the two lines. This distance depends on the farmer’s subjective probability distribution P. It appears that the value of DMI's forecast is the highest exactly at the point where the farmer would have been the most in doubt without this information about what to do, i.e. at P = 22%. At this point, the forecast from DMI is worth DKK 3,888. If the farmer has no doubts at all about the weather on the second day, i.e. at P=0 or P=1, the information from DMI will be of no value.

86
Figure 1 Expected value of harvest. (Broken line: without information from DMI)
The ex-post value of information from DMI will not have the same significance to the farmer. In this case, his subjective probability distribution is updated. This means that the expected value of his optimum action moves along the broken line in the figure above. If the update of his subjective probability distribution means that his behaviour does not change, he has had no value of the additional information. The decision-maker does not change his action if his subjective probability distribution both before and after the Bayesian update is lower or higher than 22%. A fundamental precondition in this example is that the farmer is risk neutral. Had he been risk-averse, his expected values of harvesting the crops over the course of one and two days would have been the same already at a probability of rain lower than 22%. Furthermore, it would not have been possible to calculate the value of the information and his willingness to pay in terms of money. In contrast, it would have been necessary to measure the value of usefulness instead. Practical considerations In the above, the theoretical background for choices under uncertainty was described. The description included the calculation of the expected value of an action in a case where information from DMI is not available and one where information is available. It was also described how to update probability distributions by means of Bayesian updating. This theory is, however, not necessarily practicable to use on a selected case. This section explains some of the methods and considerations that make it possible, based on the theory of choices under uncertainty, to measure the value of information. Quality of information So far, only the importance of information has been examined. That is, how information from DMI can be of value to a decision-maker. This section examines how the quality of information may play a role. On the face of it, it seems obvious that better information must have greater value. However, this depends on the existence of a perfect method for measuring quality, which is not a matter of course. In many cases, there is no other option than to settle with measuring quality based on indicators that do not necessarily give a completely true and fair view.
39
40
41
42
43
44
45
0% 10% 20% 30% 40% 50% 60% 70% 80% 90% 100%
Probability of rain
DKK 1,000 kr. 3,888

87
Doswell & Brooks (1998) describe these problems by means of an example. The table below is meant to represent a count of events. For example, the event "hurricane" has been predicted, but not observed z times over a given period.
Table 77: Count of events and forecast of, for example, a hurricane
Predicted \ Observed Yes No Yes x z No y w
A measurement of information quality could be the probability of hurricane predictions, i.e. x/(x+y). Another measurement could be a measurement of the number of false alarms z/(x+z). A decision-maker who is dependent on a low rate of false alarms will be in distress if quality is measured based on the probability of predicting the event. The reason is that the probability of predicting the event can be increased if the event is predicted more often. However, this will also increase the number of false alarms. One case study could be hurricanes or floods. It is imperative that warnings of hurricanes and floods are issued. This points in the direction that quality should be measured based on the probability of predicting the event. However, evacuations and increased preparedness are very costly as are false alarms, which points in the opposite direction. There is also a risk that the general public will no longer trust the warnings if they are wrong and issued too often. As a main rule, the value of better information is also more difficult to measure than the value of information per se. As Doswell III & Brooks (1998) state: “If we have difficulty measuring quantitatively the precise value of the forecasts, we are further challenged to determine the tendencies in the accuracy-value-relationship.” The reason is, in part, that there is not necessarily a fixed correlation between quality and value, as described in the example above. However, it must be assumed that a qualitative improvement will also mean an increase in the information value on average. Even if this assumption holds true, it may be very slight increases, which can be difficult to measure. Craft (1998) has made an attempt to quantify the value of qualitative changes in weather information on the Great Lakes in the United States (Lake Erie, Lake Ontario, Lake Michigan, Lake Huron and Lake Superior). Over a period of 15 years from 1873 and onwards, major changes occurred in the number of weather stations around the great lakes. This information has been compared to the development in freight traffic on the lakes in the same period and the number of sinking cases. Craft discovers that the marginal weather station contributed with a reduction in lost freight and vessels of approximately 1%. Cost/Loss Ratio In the example in chapter 0, it was shown that the farmer would have gained the same value from harvesting his crops in one day as over two days if his subjective probability of rain was 22%. At the same time, it appeared that it was at this value of the probability distribution that the value of information from DMI was the highest. The 22% was found by solving an equation system considering P. However, this value can also be found by means of another and more practical method, requiring less information. The difference in the cost to the farmer by harvesting his crops over one or two days was DKK 5,000. The potential loss to the farmer by harvesting the crops over two days was the value of half of the harvest - DKK 22,500. If the cost is divided by the loss 5,000/22,500, the result is exactly 22%.

88
This is referred to as a Cost/Loss ratio. This ratio indicates how likely an event must be before the decision-maker is willing to act in order to avoid the potential harmful effects of the event. The difference between prescriptive and descriptive studies Two main approaches exist within economic literature on information value - the prescriptive approach and the descriptive approach. Both approaches seek to quantify the value of information and how information has affected decision-makers’ actions. The two approaches are very similar. They are both based on an analysis of the individual decision process as it is described above. The decisive difference lies in the way that decision-makers’ actions are defined. The starting point of a prescriptive study is the theoretically optimum action plan based on theories on choices under uncertainty. The starting point of a descriptive study, however, is the actual actions and decisions made by real decision-makers. Thus, a prescriptive study may be carried out with very little information and communication with the actual decision-makers. A descriptive study, on the other hand, requires a close dialogue with the decision-makers to uncover their actual decision processes. While prescriptive studies often result in a proper valuation of information, this is very rarely possible in descriptive studies. The reason is the considerably higher level of complexity involved in examining real decision processes in descriptive studies. This complexity is ascribable to the fact that real decision rules are not necessarily directly dependent on the information whose value it is attempted to uncover. These problems are not found in prescriptive studies. Empirical studies In addition to prescriptive and descriptive studies, empirical studies of information value can also be conducted. While prescriptive and descriptive studies are based on an assessment of the expected information value, an empirical study is based on the realized information value. Craft (1998) - see section 3.2 - is an example of an empirical study. An empirical study will often be based on a situation where changes have occurred in the information from the meteorologists. It could be a new type of service, temporary interruptions of a service or permanent closing of services due to budget cuts or the like. An empirical study can also be based on a poll or a survey of decision-makers’ valuation of information. However, an empirical approach requires a quite substantial amount of data compared to a prescriptive study. It also requires that the effect of the information can be separated from other significant factors. The approach does, nevertheless, offer the distinct advantage that assumptions about subjective probability distributions over the weather and the information from the meteorologists are not necessary. Case studies This chapter describes a small selection of the extensive literature on the matter. The objective has been to cover as much material as possible in terms of both method and subject within the limited framework of this project. The subjects and methods described should, however, not be considered a complete description of neither the methods nor the subjects found within the overall subject - socio-economic analysis of meteorological services. Value of time on TV One of the most visible meteorological products is the daily weather forecasts on television. Major variations may be found in the length and frequency of the weather forecasts from one channel to the other. This may be a reflection of both different priorities, such as public service against private cost-effectiveness, and it may be a reflection of the valuation of weather forecasts of different

89
customer segments. In any case, it is possible to obtain an indirect indication of the value of the weather forecasts by calculating the value of "air-time". This issue is examined in Macauley (1997) without it leading to a valuation of weather forecasts on TV, though. One of the points that are discussed is how to value time with the current rate of commercials in the same time period. However, this approach is not applicable to public service channels, and so other measurements must be found to identify the value of weather forecasts on this type of channel. Before and after situations One methodology that has been used quite often on problems such as the present is empirical analyses of situations where a shift in the quality of the amount of information has occurred. A fine example of this type of analysis is Craft (1998), which was described earlier in this literature study. Studies such as this, however, require a measurable change in the information from the meteorologist and an appropriate length of time after the change has occurred, so that any behavioural changes have had time to break through on measurable economic variables. In addition, it must be possible to separate the effect of the weather forecast from other events during that period. Prescriptive studies As described above, prescriptive studies are based on an idealized correlation between information and action. This idealized thinking is combined with the actual costs of the decision subject to analysis. Katz & Murphy (1997) provide a thorough overview of prescriptive studies of a wide variety of weather dependent decisions. Wilks et al. (1993) look at the timing of the harvest of hay for fodder. Hay is usually left to dry on the field for a few days after being harvested. During those days, the hay is exposed to the risk of rain. This is complicated by the fact that the time of harvest cannot be postponed indefinitely. The hay quality decreases if it sits on the field after the optimum time of harvest. The information value is calculated in this study based on three basic scenarios. One where the decision-makers have subjective expectations equivalent to the empirically observed frequency of different weather conditions during the harvest period. One where the decision-makers’ expectations are based on persistence, and one where it is examined how the decision-maker will value a perfect forecast. The latter alternative is the same problem as that described in chapter 2.5. Wilks et al. (1993) reach the conclusion that weather forecasts should have a value of approximately USD 94 per hectare per year. Adams et al. (1995) look at the optimum choice of crops given long-range forecasts in the south-eastern United States where El Niño has had great impact on the climate. Since different crops require different growth conditions, it is of significant value to be able to choose the right crop for the expected climate. The decision-maker in this study is not the individual farmer, but, on the other hand, an imagined "planner" who seeks to maximize the socio-economic surplus. The value of the forecasts is assessed based on empirical observation of the climate and the perfect forecast. The study concludes that information about El Niño has a value in the order of USD 96 - 130 million per year. Descriptive studies As described earlier, it is very difficult to take a descriptive study to the point where it results in an estimate of the information value. Often, the study must stop with an assessment of the values that are at stake in making the decision and a description of the decision processes involved.

90
Anaman & Leylett (1996) measure the effect of a meteorological product targeted at cotton producers in Australia. The product was launched in 1992. From a poll among cotton producers a few years later, it was established that the producers saved approximately AUD 400,000 per producer per year by using the new information. The cost of the information to producers amounted to AUD 30,000 per producer per year. The survey does, however, raise many questions as to alternative explanations to the saved amounts. The alternative sources of information could have been improved during the intervening years, or the years following the implementation of the new service could have been exceptionally good for cotton production. Based on these objections, it is clear that the issue is much more complicated. Sonka et al. (1988) have used an approach in which the decision-makers are presented with fictitious meteorological information. They are then asked to decide how they would react in each case. In this case, the study results in a description of the correlation between climate forecasts and the actions taken by producers of seed corn based on the information. Bibliography Adams, R.M., Bryant, K.S., McCarl, B.A., Legler, D.M., O'Brien, J., Solow, A. & Weiher, R. (1995). Value of Improved Long-Range Weather Information. Contemporary Economic Policy. vol. XIII, pp. 10-19. Anaman, K.A. & Leyllet, S.C. (1996). Assessment of the Benefits of an Enhanced Weather Information Service for the Cotton Industry in Australia. Meteorological Application, vol. 3, pp. 127-136. Craft, E.D. (1998). The Value of Weather Information Services for Nineteenth-Century Great Lakes Shipping. The American Economic Review. vol. 88, No. 5, pp.1059-1076. Doswell III, C.A., & Brooks, H.E. (1998). Budget-Cutting and the Value of Weather Services. Weather and Forecasting. vol. 13, pp. 206-212. Katz, Richard W. & Allan H. Murphy. (1997). Economic Value of Weather and Climate Forecast. Cambridge University Press. Macauley, M.K. (1997). Some Dimensions of the Value of Weather Information: General Principles and a Taxonomy of Empirical Approaches. http://sciencepolicy.colorado.edu/socasp/weather1/macauley.html. Sonka, S.T., Changnon, S.A. & Hofing, S. (1988). Assessing Climate Information use in Agribusiness. II: Decision Experiments to Estimate Economic Value. Journal of Climate, vol. 1, pp. 766-774. Wilks, D.S., Pitt, R.E. & Fick, G.W. (1993). Modelling Optimal Alfalfa Harvest Scheduling Using Short Range Weather Forecasts. Agricultural Systems, vol. 42, pp. 247-305.