metafarms production index
TRANSCRIPT
MetaFarms Production Index
Nursery, Finishing, Wean-to-Finish Closeout Performance
Quarter 2 - 2021
Powered by:
Page 1 of 5Copyright © MetaFarms, Inc. All Rights Reserved.
The Information Platform for Agriculture
Page 2 of 5Copyright © MetaFarms, Inc. All Rights Reserved.
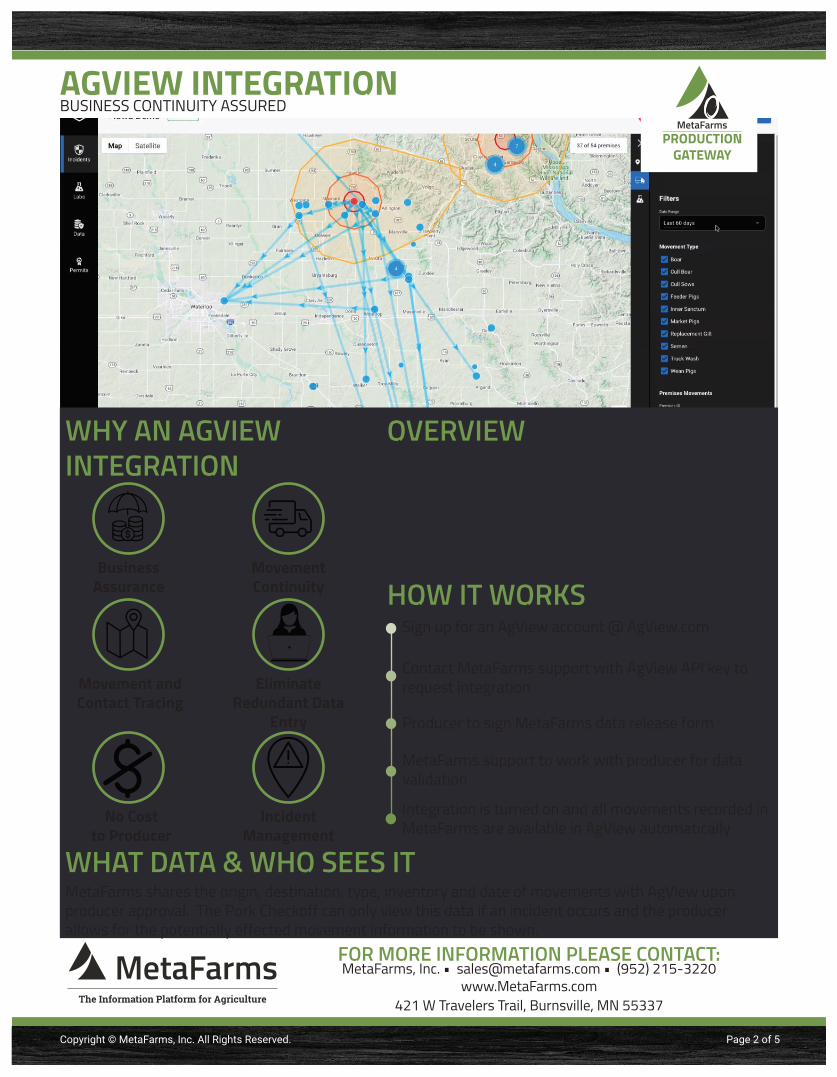
AGVIEW INTEGRATIONBUSINESS CONTINUITY ASSURED
OVERVIEWWHY AN AGVIEW INTEGRATION The integration assures producers business continuity, as
well as the ability to contact-trace and contain herds in real time if needed. By automatically sending movement data to AgView with producers approval, producers can continue to operate in the case of a disease outbreak as they will be able to quickly contain the impacted herd.
HOW IT WORKSSign up for an AgView account @ AgView.com
Integration is turned on and all movements recorded in MetaFarms are available in AgView automatically
MetaFarms support to work with producer for data validation
Producer to sign MetaFarms data release form
Contact MetaFarms support with AgView API key to request integration
The Information Platform for Agriculture
FOR MORE INFORMATION PLEASE CONTACT:MetaFarms, Inc. • [email protected] • (952) 215-3220
www.MetaFarms.com421 W Travelers Trail, Burnsville, MN 55337
No Cost to Producer
IncidentManagement
Movement and Contact Tracing
Eliminate Redundant Data
Entry
Business Assurance
Movement Continuity
WHAT DATA & WHO SEES ITMetaFarms shares the origin, destination, type, inventory and date of movements with AgView upon producer approval. The Pork Checkoff can only view this data if an incident occurs and the producer allows for the potentially effected movement information to be shown.
Copyright © MetaFarms, Inc. All Rights Reserved. Page 3 of 5
MetaFarms Production Index Q2 2021Compiled by the MetaFarms Analytics Team
The Q2 2021 MetaFarms Production Index is based on closeout performance for nursery, finishing and wean-to-finish groups and how they compare with the same period last year. Data has been scrubbed and made anonymous to protect confidentiality. Data sources are from pork producers using the MetaFarms Platform and represents over 500 pork production companies located in both the U.S. and Canada. Nursery data includes over 2,300 closeouts, finishing data includes over 2,800 closeouts and more than 850 single stocked wean-to-finish closeouts.
Keep in mind that nursery groups closed in Q2 started on feed between December 2020 to March 2021; finishing groups started on feed in October 2020 to February 2021; and wean-to-finish groups started on feed in August 2020 to January 2021.
Inside the Numbers: Comparing Q2 2020 to Q2 2021* Mortality % increased across all phases of production for the 2nd straight period*Q2 2021 Mortality % was the highest quarterly average in over 10 years for all production phases* Avg DOF decreased in all phases of production* Avg Out Weights went virtually unchanged in Finish and W2F* Q2 2020 Nursery & Finish Mortality % = 8.67%, W2F = 6.02%* Q2 2021 Nursery & Finish Mortality % = 9.67%, W2F = 6.66%
Graphs on following pages
The Information Platform for Agriculture
Copyright © MetaFarms, Inc. All Rights Reserved. Page 4 of 5
MetaFarms Production Index Q2 2021The Information Platform for Agriculture
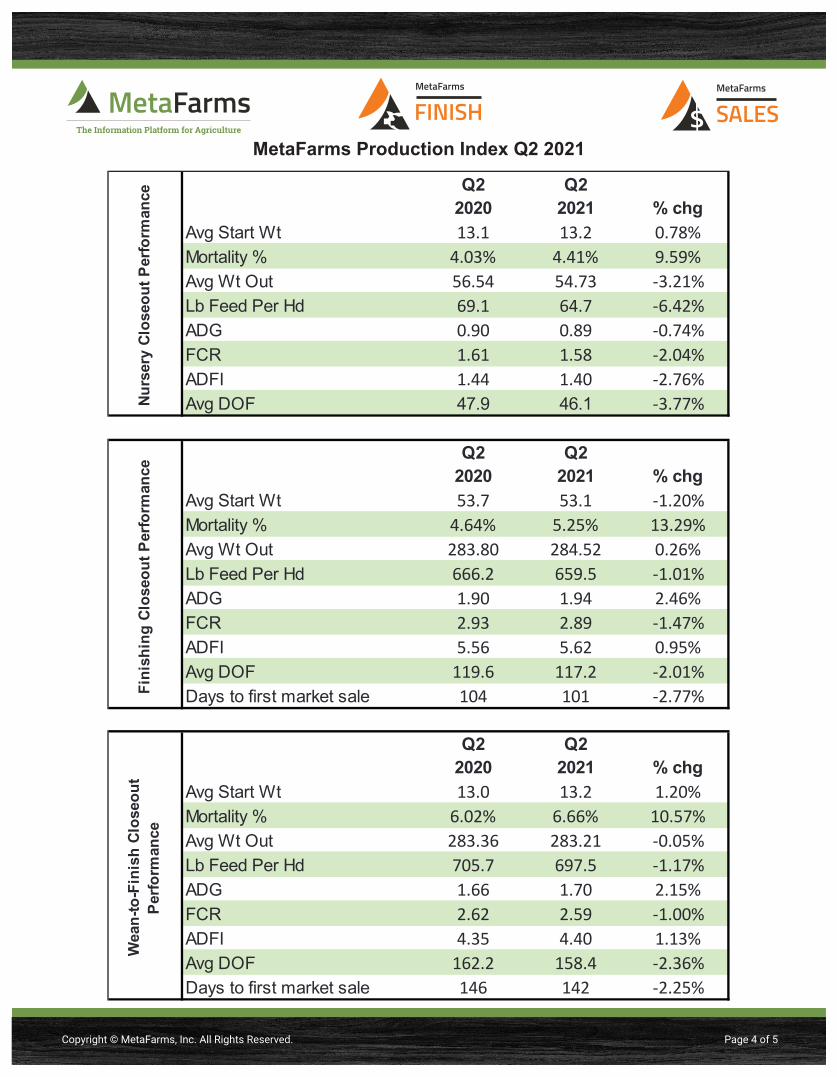
Q2 Q22020 2021 % chg
Avg Start Wt 13.1 13.2 0.78%Mortality % 4.03% 4.41% 9.59%Avg Wt Out 56.54 54.73 -3.21%Lb Feed Per Hd 69.1 64.7 -6.42%ADG 0.90 0.89 -0.74%FCR 1.61 1.58 -2.04%ADFI 1.44 1.40 -2.76%Avg DOF 47.9 46.1 -3.77%
Q2 Q22020 2021 % chg
Avg Start Wt 53.7 53.1 -1.20%Mortality % 4.64% 5.25% 13.29%Avg Wt Out 283.80 284.52 0.26%Lb Feed Per Hd 666.2 659.5 -1.01%ADG 1.90 1.94 2.46%FCR 2.93 2.89 -1.47%ADFI 5.56 5.62 0.95%Avg DOF 119.6 117.2 -2.01%Days to first market sale 104 101 -2.77%
Q2 Q22020 2021 % chg
Avg Start Wt 13.0 13.2 1.20%Mortality % 6.02% 6.66% 10.57%Avg Wt Out 283.36 283.21 -0.05%Lb Feed Per Hd 705.7 697.5 -1.17%ADG 1.66 1.70 2.15%FCR 2.62 2.59 -1.00%ADFI 4.35 4.40 1.13%Avg DOF 162.2 158.4 -2.36%Days to first market sale 146 142 -2.25%
Wea
n-to
-Fin
ish
Clos
eout
Pe
rform
ance
Nurs
ery
Clos
eout
Per
form
ance
Fini
shin
g Cl
oseo
ut P
erfo
rman
ce
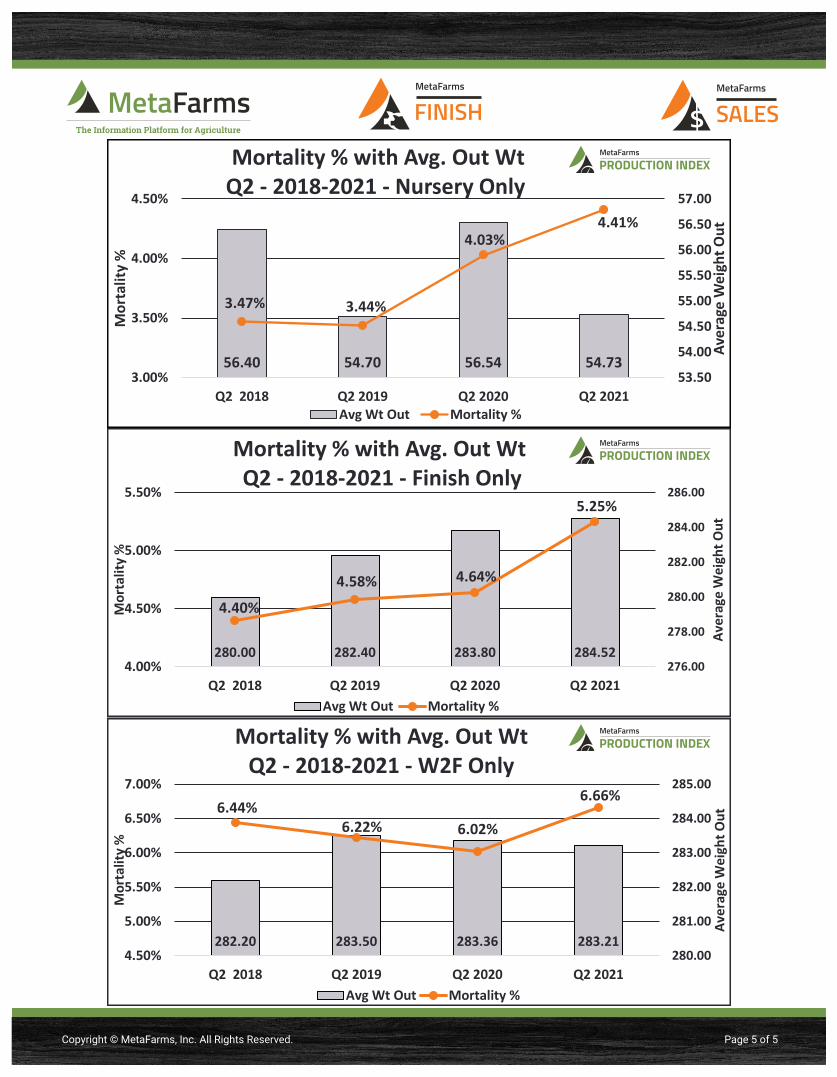
56.40 54.70 56.54 54.73
3.47% 3.44%
4.03%4.41%
53.50
54.00
54.50
55.00
55.50
56.00
56.50
57.00
3.00%
3.50%
4.00%
4.50%
Q2 2018 Q2 2019 Q2 2020 Q2 2021
Aver
age
Wei
ght O
ut
Mor
talit
y %
Mortality % with Avg. Out WtQ2 - 2018-2021 - Nursery Only
Avg Wt Out Mortality %
280.00 282.40 283.80 284.52
4.40%
4.58% 4.64%
5.25%
276.00
278.00
280.00
282.00
284.00
286.00
4.00%
4.50%
5.00%
5.50%
Q2 2018 Q2 2019 Q2 2020 Q2 2021
Aver
age
Wei
ght O
ut
Mor
talit
y %
Mortality % with Avg. Out WtQ2 - 2018-2021 - Finish Only
Avg Wt Out Mortality %
282.20 283.50 283.36 283.21
6.44%6.22% 6.02%
6.66%
280.00
281.00
282.00
283.00
284.00
285.00
4.50%
5.00%
5.50%
6.00%
6.50%
7.00%
Q2 2018 Q2 2019 Q2 2020 Q2 2021
Aver
age
Wei
ght O
ut
Mor
talit
y %
Mortality % with Avg. Out WtQ2 - 2018-2021 - W2F Only
Avg Wt Out Mortality %
Copyright © MetaFarms, Inc. All Rights Reserved. Page 5 of 5
The Information Platform for Agriculture