metabolism of primary astrocytes studied by...
TRANSCRIPT
Universidade Nova de Lisboa
Instituto de Tecnologia Química e Biológica
Metabolism of Primary Astrocytes Studied by NMR
Metabolic Trafficking and Neuroprotection
This dissertation was presented to obtain a Ph.D. degree in Biochemistry at the Instituto de Tecnologia Química e Biológica, Universidade Nova de Lisboa.
By Luís Maria de Figueiredo Mascarenhas Lopes da Fonseca
Supervised by Prof. Dr. Helena Santos
Oeiras, September, 2006

ii
From left to right: Dr. Manuel Carrondo, Dr. António Ferreira, Dr. Carlos Duarte,
Dr. Arne Schousboe, Luís Lopes da Fonseca, Dr. Helena Santos, Dr. Paula Alves,
Dr Carlos Geraldes and Dr. Miguel Teixeira. Oeiras, September 11, 2006.
Supervisor: Dr. Helena Santos.
Examiners: Dr. Arne Schousboe, Dr. Carlos Duarte, Dr. António Ferreira, Dr Carlos
Geraldes, Dr. Paula Alves and Dr. Manuel Carrondo.
Dissertation presented to obtain a Ph. D. degree in Biochemistry by Universidade
Nova de Lisboa, Instituto de Tecnologia Química e Biológica.
iii
ACKNOWLEDGEMENTS
I would like to start by thanking everyone that somehow helped me or contributed to
this thesis. A lot of people supported, encouraged and helped me with the work
presented in this thesis. So many that it is impossible to name them all. To all of
those my most sincere thanks.
I would also like to thank:
My supervisor, Prof. Dr. Helena Santos, for accepting me in her group, for the
continuing support and patience, and for never giving up on me. Especially, I would
like to thank her for her honesty, integrity, fairness and scientific rigor, and above all
for inspiring her best qualities on her students.
Prof. Dr. Manuel J. T. Carrondo, for giving me access to his internationally
recognized laboratory, for the excellent working conditions and for all valuable
discussions.
Prof. Dr. Ruy Pinto as director of the Instituto de Investigação Científica Bento da
Rocha Cabral, Prof. Dr. Cristina Santos and Sr. João for the support and kindness
shown by supplying most of the animals required for this work. I would also like to
thank Prof Dr. Ruy Pinto for all the motivation and fruitful discussions. But, most of all,
to express the honor that it was for me to have as a biochemistry teacher, a pupil of
Sir Hans Krebs himself.
Dr. Sebastián Cerdán, for opening his laboratory to me, for inviting me to
collaborate in his projects and for all the friendly discussions and sympathy shown. I
also would like to thank all Cerdán’s lab members: Alejandra Sierra, Marina Benito,
Tiago Rodrigues, Susana Garrido, Patricia Sánchez and Pilar López for making my
stay so enjoyable. Especially, Sandra for all the help in the experiments, Susy for
teaching me her techniques concerning the NMR samples and Tiago for all
encouragement and support.
Dr. Paula M. Alves, for introducing me to the daily life in the lab and teaching me
many of the techniques that I know today, and also for all the encouragement,
friendship, guidance, suggestions and endless support shown.
iv
Eng. José Luis Moreira, for all his teachings, discussions and examples of good
leadership, they shell not be forgotten.
Dr. António Maretzek, for all the help and knowledge supplied in all aspects of NMR
and computing.
Dr. António Ferreira for introducing me to the world of flux analysis and teaching me
the basics of the determination of metabolic fluxes by solving the sets of ODE’s.
Miguel Monteiro for putting up with my crazy experimental schedules, for all the help
in the experimental work, and friendship. I have no words to thank you, apart from
saying that I couldn’t have done all this work and remained sane without your help!
The ITQB staff that made my life easier, Miguel Loureiro, Isabel Baia, Luís Gonçalves,
Fátima Madeira and especially Cristina Barreiros who always made her best to
facilitate the lab ware that I required.
All my colleagues of the Animal Cell Technology group Angela Almeida, Dr Lídia
Gonçalves, Dr. Pedro Cruz, Dr. Helder Cruz, Dr. Verónica Carvalhal, Eng. Cristina
Peixoto, Rosário Clemente, Eng. Sandra Marques, Dr. Ana Coroadinha, Isabel
Marcelino, Délia Gonçalves, Dr. Luis Maranga, Marcos Sousa, Tiago Ferreira,
Marlene Carmo, Teresa Rodrigues, Carina Silva, Sónia Sá Santos, Sofia Leite, Hélio
Crespo, Célia Verissimo, Claudia Istrate (Multumesc) and Marta Mendes, for creating
a good working atmosphere and valuable incentive for my work.
All my colleagues of the 4th floor (and associates), from the Glycobiology group,
Prof. Dr. Júlia Costa, Dr. Victor Costa, Dr. Vanessa Morais, Angelina Palma, Teresa
Costa, Cidália Vila Verde, Catarina Brito, Nuno barata and Rui Almeida, from the
Biosensors laboratory Prof. Dr. Abel Oliva, Dr. Joana Miranda, Marta Silva, Elisabete
Nascimento and Óscar Silvestre, from the Mass spectrometry group Gonçalo Costa
and Elisabete Pires, from the ECBio Luís Apolónia and Vera Basto, from the Biotecnol
Telmo Graça, José Forte and Dr. Nuno Fontes, from the Plant cell biotechnology
laboratory, Dr. Alexandre Campos and from the IBET team Sandra Monteiro, Filipe
Pinto and Rui Gomes (Domo arigato). Thanks for the friendship, companionship,
suggestions, discussions and the most excellent times.
v
All my colleagues in the Cell Physiology & NMR group, Dr Pedro Lamosa, Dr Tiago
Faria, Dr. Claudia Sánchez, Dr. Clélia Neves, Dr. Helena Pereira, Dr. Mané Sampaio,
Dr. Margarida Santos, Dr. Nuno Borges, Dr Rute Neves, Dr Paula Fareleira, Rui Neves,
Anabela Bernardo, Ana Isabel Mingote, Ana Lúcia, Carla Jorge, Carla Patrícia
Almeida, Filipa Cardoso, João Cavalheiro, Luís Gafeira, Marta Rodrigues, Melinda
Noronha, Paula Gaspar, Rute Castro and Susana Gonçalves for all the help, support
and for the good working atmosphere. But especially to Dr Pedro Lamosa for all his
patience and teachings regarding theoretical and experimental NMR.
My good friend Dr. Ilídio Correia, for his continuing encouragement and friendship.
My parents and my sister for their continuing support and patience.
Sónia Cardoso for her love, understanding, patience and incentive.
And finally, Fundação para a Ciência e a Tecnologia – PRAXIS XXI, for the financial
support that made this doctoral work possible (PRAXIS XXI/BD/21532/99).

vi
ABSTRACT
The human brain is the product of 600 million years of evolution and it is by far the
most complex structure in the known universe. The vertebrates’ brain is composed of
several different cell types, which perform the different functions required. The two
most abundant cell types are neurons, which are the brain function unit, and glial
cells, which are responsible for a myriad of housekeeping, homeostatic and
structural functions. Glial metabolism is so far interconnected with the neuronal
metabolism, that it is difficult to state where one finishes and the other starts.
Trafficking between the two compartments include metabolites of almost all
metabolic pathways (glycolysis, TCA, amino acids, ketone bodies, etc) and also
ions.
Nuclear magnetic resonance was used as the primary technique to investigate the
effect of ethanol (40, 80, and 160 mM) on the levels of high-energy phosphates,
glycolytic flux, anaplerotic and oxidative fluxes to the tricarboxylic acid (TCA) cycle,
the contribution of the pentose phosphate pathway (PPP), and the uptake and
release of amino acids on primary cultures of rat astrocytes. On line 31P-NMR
spectroscopy showed that long-term exposure to ethanol caused a drop in the
levels of ATP and phosphocreatine. The ratio between the fluxes through the
pyruvate dehydrogenase and pyruvate carboxylase reactions also decreased,
whereas the glycolytic flux and the ratio between formation of lactate and glucose
consumption increased when cells were exposed to acute doses of ethanol. Flux
through the pentose phosphate pathway was not affected. The uptake of cysteine
and the release of glutamine were stimulated by ethanol, whereas the release of
methionine was inhibited. Moreover, the fractional enrichment in serine was
enhanced. The changes in the amino acid metabolism are interpreted as a
response to oxidative stress induced by ethanol.
Glutamate metabolism in astrocytes was studied using an experimental set-up that
simulates the role of neurons (glutamate producers and glutamine consumers) by
the addition of glutaminase to the culture medium. Thereby, a steady supply of
glutamate was imposed at the expense of glutamine, and the stress intensity was
vii
manipulated by changing the glutaminase concentration. Glutamate supply rates in
the range 8 to 23 nmol/min/mg protein were examined. When the glutamate supply
rate exceeded the uptake rate of this amino acid, a transient increase in the
extracellular concentration of glutamate was observed. In response to this stress, the
fluxes through the glutamate transporter and glutamine synthetase were
considerably increased and the extracellular concentration of glutamate was
eventually restored to a low level. The increased levels of glutamine synthetase were
demonstrated by immunoblotting analysis. The effect on glutamate metabolism of
the transaminase inhibitor, AOAA, and of NH4Cl was also investigated. The
accumulation of glutamate caused a concomitant reduction in the levels of
phosphocreatine, phosphoethanolamine and phosphocholine without affecting the
ATP pool. It was shown that glutamine synthetase is a key element in the control of
glutamate metabolism in astrocytic cultures. The metabolic fate of glutamate
depended greatly on the time of endurance to the challenge: in naive cells,
glutamate was primarily metabolised through the transaminase pathway, while in
well-adapted cells glutamate was converted almost exclusively through glutamine
synthetase.
We investigated the recycling of lactate between extracellular space and the
cytosolic pool of pyruvate through the monocarboxylate transporters of the plasma
membrane and the lactate dehydrogenase. For this purpose, primary cultures of
astrocytes and neurons were incubated in Krebs Ringer bicarbonate buffer
containing 50% 2H2O and [3-13C]lactate (1 to 20 mM). Samples of incubation
medium were collected at different time points and analyzed by 13C-NMR to
determine the deuteration kinetics of [3-13C]lactate. A mathematical model was
developed to analyze the time courses of lactate deuteration, which accounted for:
(i) the bidirectional lactate transport in and out of the cells, (ii) the intracellular
interconversion between lactate and pyruvate catalyzed by lactate dehydrogenase,
and (iii) the pyruvate consumption. Results demonstrate that lactate recycling
occurs in both cell types and increases with the extracellular concentrations of
lactate. In the same conditions astrocytes showed to have a higher lactate
recycling activity than neurons, which was due to the differences in the reaction
rates of the lactate dehydrogenase isozymes. Lacate dehydrogenase was the rate
viii
limiting step of lactate recycling process and favoured the neuronal pyruvate
consumption and the glial lactate production. The use of 13C-NMR spectroscopy to
detect deuteration in the geminal and vicinal positions of a carbon-13 labelled
precursor proved to be a powerful technique to study hydrogen turnover, providing
complementary information to the conventional 13C NMR method used to elucidate
carbon turnover.
We report the first approach for growth and maintenance of primary astrocytes in a
fully controlled environment. For this purpose, cells were immobilized in Cytodex
microcarriers and grown in a stirred tank bioreactor. Crucial bioreaction parameters
such as agitation rate, microcarrier type, and concentration, as well as cell
inoculum concentration were optimized. Cytodex 3 proved the best microcarrier for
astrocyte growth, with the highest cell densities obtained for 6 g/L of Cytodex 3 using
an inoculum of approx. 0.15 × 10⁶ cells/mL in vessels operated at 60 rpm, using a
re-feed operational mode consisting of complete medium replacement every 5
days. Using such optimized conditions, cells were maintained in steady-state for
approximately 24 days, allowing online monitoring and control of environmental
variables such as temperature, pH, and O2. To further test the advantages of this
fully controlled system, astrocytes were subjected to a 5 hours hypoxic stress. The
cell numbers were not affected by hypoxia but the glycolytic flux was enhanced
during this period. To check whether this experimental set-up was suitable for
metabolic flux analysis, the metabolism of [U-13C]glucose pulse was followed by 13C-
NMR for a period of 24-hour. The culture system described is a novel tool to study
brain cell metabolism, allowing sampling over time and the monitoring of cellular
behaviour in response to stressful conditions as well as during recovery.
Carbon-13 labelling experiments coupled to 13C-NMR techniques are a valuable
tool in metabolic flux analysis. In contrast to other techniques, 13C-NMR allows the
collection of quantitative as well as positional information of the 13C label within
molecules. These important features allow the characterization of metabolic
networks that cannot be approached by any other means. This is accomplished by
taking advantage of the 13C homo- and heteronuclear scalar coupling. These
multiple couplings result in the splitting of the original 13C resonance into a large
number of peaks, which makes the analysis of the 13C-NMR spectra difficult and
ix
requires the use of computer assistance. 13C multiplets are described as the sum of
fine-structures (doublets, triplets, quartets, etc). Furthermore, each fine-structure is
represented by a sum of positional constrained Pearson type VII functions. This
approach provides a means to identify the fine-structures within the multiplets. The
use of these simulating routines combined with a least-square fitting procedure
enabled the quantification of the areas of these fine-structures in a semi-automatic
fashion. This type of program may one day become fully automated, which would
greatly increase the informational output of the 13C-NMR techniques.
x
RESUMO
O cérebro humano é o resultado de 600 milhões de anos de evolução e é de
longe a mais complexa estrutura no universo. O cérebro dos vertebrados é
composto por vários tipos de células, que executam as diferentes funções
(necessárias). Os dois tipos de células mais abundantes são os neurónios, que são
as unidades funcionais do cérebro, e as células da glia, que são responsáveis por
todo um leque de funções de manutenção, homeoestáticas e estruturais. O
metabolismo das células da glia está de tal maneira intercruzado com o
metabolismo neuronal, que se torna difícil dizer onde um acaba e o outro começa.
O tráfego metabólico entre os dois compartimentos incluiu não só metabolítos de
quase todas as vias metabólicas (glicólise, ciclo dos ácidos tricarboxílicos, amino
ácidos, corpos cetónicos, etc.), mas também iões.
A ressonância magnética nuclear foi usada como técnica principal para investigar
o efeito do etanol (40, 80, 160 mM) nos níveis dos fosfatos energéticos, no fluxo
glicolítico, nos fluxos anapleroticos e oxidativos de entrada no ciclo dos ácidos
tricarboxílicos, na contribuição relativa da via dos fosfatos de pentose e no
transporte e libertação de amino ácidos em culturas primárias de astrócitos de
rato. Espectroscopia de RMN de 31P em tempo real mostrou que exposições longas
ao etanol causam uma descida nos níveis de ATP e fosfocreatina. A razão entre os
fluxos através das reacções de desidrogenase e de carboxilase do piruvato
também apresentaram uma diminuição, enquanto que o fluxo glicolítico e a razão
entre a formação de lactato e o consumo de glucose aumentaram quando as
células foram expostas a doses agudas de etanol. No entanto, o fluxo através da
via dos fosfatos de pentose não foi alterado. O transporte de cisteína e a
libertação de glutamina foram estimulados pelo etanol, enquanto que a libertação
de metionina foi inibida. Além de mais, o enriquecimento fraccional na serina foi
aumentado. As variações sofridas ao nível do metabolismo dos amino ácidos
foram interpretadas como uma resposta ao stress oxidativo induzido pelo etanol.
O metabolismo do glutamato em astrócitos foi estudado usando um sistema
experimental que simula a presença dos neurónios (como produtores de
xi
glutamaina e consumidores de glutamato) por adição de glutaminase ao meio de
cultura. Deste modo impôs-se um fluxo estável de glutamato à custa de glutamina
e a intensidade do stress foi manipulada por alteração da concentração de
glutaminase. Foram estudadas taxas de produção de glutamato entre 8 e
23 nmol/min/mg de proteína. Quando a taxa de produção de glutamato era
superior à taxa de transporte deste amino ácido, observou-se um aumento
transiente da concentração extracelular de glutamato. Em resposta a este stress,
os fluxos através do transportador de glutamato e da sintetase de glutamina foram
consideravelmente aumentados, o que levou, eventualmente, a que a
concentração extracelular de glutamato voltasse para valores baixos. Foi possível
observar por análise imunológica um aumento dos níveis de sintetase de
glutamina. Foram também estudados os efeitos do ácido amino-oxoacético e do
cloreto de amónio no metabolismo de glutamato. A acumulação de glutamato
causou uma redução concomitante nos níveis de fosfocreatina, fosfoetanolamina
e fosfocolina, sem no entanto afectar os níveis de ATP. Demonstrou-se que a
sintetase de glutamina é um elemento fundamental no controlo do metabolismo
de glutamato em astrócitos. O destino metabólico do glutamato depende
grandemente do tempo a que as células estiveram sujeitas ao stress: em células
que nunca foram expostas a glutamato, este foi primordialmente metabolizado
pela via da transaminase, enquanto que em células adaptadas à presença de
glutamato, este é quase exclusivamente metabolizado pela sintetase de
glutamina.
Investigamos a reciclagem de lactato entre o espaço extracelular e o piruvato
intracelular, através dos transportadores de monocarboxilatos da membrana
plasmática e do desidrogenase de lactato. Para isto, culturas primárias de
astrócitos e de neurónios foram incubadas em tampão de bicarbonato Krebs
Ringer contendo 50% de 2H2O e [3-13C]lactato (1 to 20 mM). Amostras do meio de
incubação foram recolhidas a diferentes tempos e analisadas por RMN de 13C para
determinar a cinética de deuteração do [3-13C]lactato. Um modelo matemático foi
desenvolvido para analisar o curso da deuteração do lactato, que teve em conta
(i) o transporte bidireccional de lactato para dentro e fora das células, (ii) a
interconversão entre lactato intracelular e piruvato catalizada pelo desidrogenase

xii
de lactato, e (iii) o consumo do piruvato. Os resultados demonstram que a
reciclagem de lactato ocorre em ambos os tipos da células, aumentando com a
concentração extracelular de lactato. Nas mesmas circunstâncias os astrócitos
mostraram ter uma actividade de reciclagem de lactato mais elevada do que os
neurónios, devido às diferenças nas taxas de reacção dos isoenzimas de
desidrogenase de lactato. Os resultados apontam para que o desidrogenase de
lactato seja o passo limitante do processo de reciclagem do lactato, favorecendo
o consumo neuronal de piruvato e a produção glial de lactato. O uso da
espectroscopia de RMN de 13C para a detecção da deuteração em posições
geminais e vicinais a um carbono 13, mostrou ser uma técnica poderosa para o
estudo da substituição do hidrogénio, fornecendo informações complementares ao
método RMN de 13C convencionalmente usado para elucidar substituições em
carbonos.
Relatamos aqui, a primeira tentativa para efectuar o crescimento e manutenção
de culturas primárias de astrócitos num ambiente inteiramente controlado. Para
este fim, as células foram imobilizadas em micro-suportes Cytodex e cultivadas
num bio-reactor agitado. Os parâmetros mais importantes da bio-reacção tais
como a taxa de agitação, o tipo e concentração de micro-suportes, assim como a
concentração do inóculo de células foram avaliados. O Cytodex 3 provou ser o
melhor suporte para o crescimento dos astrócitos. As densidades celulares mais
elevadas foram obtidas com 6 g/L de Cytodex 3, usando um inóculo de
aproximadamente 0.15 × 10⁶ celulas/mL, em bio-reactor operado a 60 RPM, com
trocas completas de meio todos os 5 dias. Nestas condições, as células foram
mantidas em estado estacionário, aproximadamente 24 dias, o que permitiu
monitorizar e controlar, em tempo real, parâmetros ambientais, tais como a
temperatura, o pH, e o oxigénio. Para testar as vantagens deste sistema
inteiramente controlado, submeteram-se astrócitos a um período de 5 horas de
hipóxia; o número de células não foi afectado pela hipóxia mas o fluxo glicolítico
foi superior durante o “stress” imposto. Verificou-se ainda se este sistema
experimental era apropriada para a análise de fluxos metabólicos. Para isso,
seguiu-se o metabolismo de [U-13C]glucose por RMN de 13C durante 24 horas. O
sistema da cultura aqui descrito constitui uma nova ferramenta para o estudo do
xiii
metabolismo de células de cérebro, permitindo a amostragem ao longo do tempo
e a monitorização do comportamento celular em resposta a condições de “stress”,
assim como durante os correspondentes períodos de recuperação.
As experiências com carbono marcado com 13C acopladas a técnicas de RMN de
13C constituem ferramentas valiosas na análise dos fluxos metabólicos. Em
contraste com outras técnicas, RMN de 13C permite a obtenção de dados
quantitativos assim como de informação posicional dos carbonos marcados com
13C dentro das moléculas. Estas características importantes permitem a
caracterização das redes metabólicas que não poderiam ser determinadas por
outros meios. Para isto, faz-se uso dos acoplamentos escalares homo e
heteronucleares do 13C. Estes acoplamentos múltiplos resultam na divisão das
ressonâncias originais do 13C em um grande número picos, o que torna a análise
dos espectros de RMN de 13C difícil, requerendo o auxílio de computadores. Os
multipletos de 13C foram descritos, matematicamente, como a soma de estruturas
finas (dupletos, tripletos, quadrupletos, etc.). Além disso, cada estrutura fina pode
ser representada por uma soma de funções de Pearson tipo VII. Esta aproximação
fornece os meios para identificar as estruturas finas dentro dos multipletos. O uso
destas rotinas de simulação combinadas com um procedimento apropriado de
ajuste de parâmetros pelo método da minimização da soma dos quadrados das
diferenças permitiu a quantificação das áreas destas estruturas finas de uma forma
semi-automática. Este tipo de programa pode um dia tornar-se completamente
automatizado, o que aumentaria em muito o volume de informação obtida através
das técnicas de RMN de 13C.
xiv
CONTENT
XV, Thesis Outline
XVIII, Abbreviations
001, Chapter 1 | Introduction
025, Chapter 2 | Ethanol Effect on Central Metabolism of Primary Astrocytes
Studied by 13C- and 31P-NMR Spectroscopy
051, Chapter 3 | Cultures of Rat Astrocytes Challenged with a Steady Supply of
Glutamate: a New Model to Study Flux Distribution in the Glutamate-Glutamine Cycle
081, Chapter 4 | Recycling of Lactate Through the Plasma Membrane of
Astrocytes and Neurons as Detected by (13C, 2H) NMR
107, Chapter 5 | Culturing Primary Brain Astrocytes Under a Fully Controlled
Environment in a Novel Bioreactor
129, Chapter 6 | General Conclusions
139, Appendix 1 | Isotopomeric Analysis by 13C-NMR
xv
THESIS OUTLINE Astrocytes are a very important part of the metabolic puzzle we call brain. Given
that until the year 2000 there hadn’t been any work done towards the full
determination of the metabolic fluxes in cultures of primary astrocytes, we selected
this goal as our final target.
In chapter 1, an introduction to the metabolism of astrocytes is made. Since this
thesis is the second one coming from the same lab and almost on the same
subject, an attempt was made to produce a different introduction to the
metabolism of brain cells. Therefore, this introduction targeted the astrocytes, which
are the “stars” of this work, and focused on the metabolic interactions between
these cells and neurons.
The measurement of the metabolic fluxes per se, although not yet accomplished,
was thought to be more meaningful if coupled to a stressful condition. In this way
we would known not only the distribution of the fluxes in control conditions but also
how cells react, metabolically, to a given stress. From the search of an interesting,
easily applied stress, emerged chapter 2. In this chapter the metabolism of ethanol
was investigated. The astrocytic metabolism showed to be quite resistant to the
effects of this substance, and in order to get some measurable differences between
control and ethanol exposed cells, ethanol concentrations had to be increased up
to 180 mM (8.3 g/L). Given that the maximum permitted by Portuguese law for the
blood alcohol concentration is 0.5 g/L, that above 1.2 g/L it is considered a felony
resulting in the imprisonment and that for the average unaccustomed person 4.8 g/L
of alcohol results in coma, ethanol was, in the end, considered a bad candidate for
a possible stressful agent in the metabolic flux determination. Practical reasons also
determined ethanol to be excluded, as this is a volatile substance which
evaporated from the culture medium and required either a special apparatus to get
constant concentrations, or in open systems, its concentration had to be monitored
and corrected as the experiment developed. Nevertheless, the effects of different
concentrations of ethanol on the levels of high-energy phosphates, glycolytic flux,
anaplerotic and oxidative fluxes to the tricarboxylic acid cycle, the contribution of
the pentose phosphate pathway, and the uptake and release of amino acids on

xvi
primary cultures of rat astrocytes are presented and discussed in this chapter. The
work reported in this chapter also showed the need for a procedure that would allow
for the deconvolution of 13C-NMR multiplets, as this would be a task required for the
determination of fluxes. This program was developed and described in appendix 1.
In chapter 3, glutamate was evaluated as a stressful agent for astrocytes. However
the astrocytic capacity to take up this amino acid did not favour its use for
metabolic flux analysis, since glutamate metabolism is fast and glutamate
concentrations decrease rapidly. Also, there is physiological limit to the
concentrations one can subject cells to. To solve these problems a process capable
of delivering a constant supply of glutamate was devised. In order to supply
astrocytes with a constant flux, glutaminase was introduced in the incubation
medium, thus ensuring the conversion of glutamine, present in the medium, into
glutamate and ammonia. This method has the advantage of, artificially, closing the
glutamate-glutamine cycle, which is an incomplete cycle in astrocyte cultures due
to the lack of neurons. The usage of this method allowed us to study the glutamate-
glutamine cycle in a more realistic manner. In this chapter this process was
characterized and the effects of glutaminase on cultures of astrocytes analysed
and discussed.
Previous observations revealed that astrocytes were able to produce lactate from
glucose or, in the absence of glucose, consume lactate. This feature required
clarification in order to be correctly modelled. Also, this type of bidirectional
transport may not be restricted to lactate transport, which increases the importance
of this type of studies. Glutamine transport by astrocytes, which plays a central role
in brain metabolism, may also show similar properties. However, to study the
transport of any given substance in both directions is not an easy task. This difficulty
was solved by the system recently developed by Dr. Sebastián Cerdán, capable of
studying fast exchange by 13C-NMR. In chapter 4, we apply Dr. Cerdán’s method to
the recycling of lactate through the plasma membrane up to the level of the
lactate dehydrogenase in primary cultures of neurons and astrocytes.
In chapter 5, we study alternative methods of culturing astrocytes, compatible with
metabolic flux analysis. Given that mono-layer culturing systems are not usable, as
xvii
they do not allow the medium composition to be monitored or controlled, cell
growth can not be measured and sampling of medium and cells, simultaneously, is
not possible in the same culture. For these reasons a reactor system was developed
and its operation mode characterized and optimized.
In chapter 6, the final remarks are made.
In appendix 1, it is shown how a software tool, for the deconvolution of 13C NMR
multiplets may be implemented. This software tool allows a faster and more reliable
method of integrating NMR peaks. Given the higher amount of information gathered
from 13C NMR experiments performed either with multiple (uniformly) labelled 13C
enriched substrates or with other nuclei, it is essential to have a process capable of
performing the determination of the areas of very closed together peaks. These
peaks arise from homo- or heteronuclear scalar coupling, and are almost always
semi-superimposed, which makes the standard area-determining processes
unreliable. In this chapter multiplets were modelled as sums of fine-structures, which
in turn were modelled as sums of positional constrained NMR peaks. NMR peaks do
not have a pure Gaussian or Lorentzian distributions, being more accurately
described by the Voigthian function. However, this function is difficult to work with
and to integrate so another function was proposed to simulate a NMR peak – the
Pearson type VII function.
xviii
ABBREVIATIONS
2D NMR Two dimensional nuclear magnetic resonance
AA Ascorbic acid, vitamin C
AAT Alanine aminotransferase, EC 2.6.1.2
ADP Adenosine diphosphate
AGC1 Aspartate/glutamate carrier 1
Ala Alanine
ANLS Astrocyte-neuronal lactate shuttle
AOAA Aminooxyacetic acid
AP Action potential
ATP Adenosine triphosphate
BCAT Branched-chain amino acid aminotransferase, EC 2.6.1.42
BMG Basement membrane gel
BSA Bovine serum albumin
c Center
CA Carbonic anhydrase
CNS Central nervous system
COSY Correlation spectroscopy
Cys Cysteine
CysGly Cysteinylglycine
GSSG Oxidized glutathione
DHA Dehydroascorbate
DMEM Dulbecco’s modified Eagle’s medium
DNA Deoxyribonucleic acid
EAAT Excitatory amino acid transporter
ECF Extracellular fluid
EDTA Ethylenediaminetetraacetic acid
FAS Foetal alcohol syndrome
FBS Foetal bovine serum
FGlycolys is Glycolytic flux
xix
FID Free induction decay
FLacate Lactate release flux
GDH Glutamate dehydrogenase, EC 1.4.1.2
GFAP Glial fibrillary acidic protein
GLAST Glutamate/aspartate transporter
Glc Glucose
Gln Glutamine
Glnase Glutaminase, EC 3.5.1.2
GlnT Glutamine transporter
GLT Glutamate transporters
GLT-1 Glutamate transporter 1
Glu Glutamate
GLUT Glucose transporter
GluT Glutamate transporter
GLUT1 Glucose transporter 1
GLUT3 Glucose transporter 3
Gly Glycine
GS Glutamine synthetase, EC 6.3.1.2
GSH Glutathione (reduced)
GUI Graphical user interface
h Height
HPLC High-performance liquid chromatography
HS Horse serum
IgG Immunoglobulin G
KIC α-Ketoisocaproic acid
Lac Lactate
LDH Lactate dehydrogenase, EC 1.1.1.27
LDH-1 Lactate dehydrogenase isoform 1
LDH-5 Lactate dehydrogenase isoform 5
Leu Leucine
MCT Monocarboxylate transporter
MCT1 Monocarboxylate transporter 1

xx
MCT2 Monocarboxylate transporter 2
MCT4 Monocarboxylate transporter 4
MLI Multiplet line intensity
Na+/K+ ATPase Na+/K+ exchanger, EC 3.6.3.9
NADH Nicotinamide adenine dinucleotide
NMR Nuclear magnetic resonance
NTP Nucleoside triphosphate
O1P Transmitter frequency offset 1
p Parameter p of the Pearson type VII function
PAG Phosphate-activated glutaminase, EC 3.5.1.2
PBS Phosphate-buffered saline
PC Pyruvate carboxylase, EC 6.4.1.1
PCr Phosphocreatine
Pd Probability of deuteration
PDH Pyruvate dehydrogenase (lipoamide) complex, EC 1.2.1.51
Pi Inorganic phosphate
Pi(ext) Extracellular inorganic phosphate
Pi(int) Intracellular inorganic phosphate
PNS Peripheral nervous system
ppm Parts per million
PPP Pentose phosphate pathway
prot Protein
Pyr Pyruvate
SAT1 System A transporter 1
SDS-PAGE Sodium dodecyl sulfate polyacrylamide gel electrophoresis
SI Size of real spectrum
SN1 System N transporter 1
SVCT2 Sodium-dependent vitamin-C transporter 1
SW Spectral width
TA Transaminase
TBS Tris-buffered saline
TCA tricarboxylic acid
xxi
Tris 2-amino-2-hydroxymethyl-1,3-propanediol
Ve Extracellular volume
Vi Intracellular volume
w Width
WALTZ Wide-band alternating phase low power technique for zero-
residue splitting
αKG α-ketoglutarate or 2-oxoglutarate
γ-ATP Refers to the γ-phosphate of an ATP molecule
γGluCys γ-Glutamylcysteine
γGT γ-glutamyl transferase, EC 2.3.2.2
γ-NTP Refers to the γ-phosphate of a NTP molecule

xxii

CHAPTER 1
Introduction
Chapter | 1
2
Chapter | 1 | Contents
03, The Brain
06, Neuronal-Glial Metabolism
07, Ionic Interactions Between Astrocytes and Neurons
08, Metabolic Trafficking
09, Glutamate-Glutamine Cycle
11, Nitrogen Shuttling
14, Anti-Oxidants in the Brain
15, Ketone Bodies Metabolism
15, Metabolic Differences Between Astrocytes and Neurons
16, Models for the Study of Brain Metabolism
17, Primary Cultures of Brain Cells
18, References

Introduction
3
The Brain
Since the appearance of the first animals on this planet that the development of
nervous systems was a highly favoured process throughout evolution. Nervous
systems allowed animals to react to and interact with the environment with
unpreceding speed and complexity, paving the way to the development of more
complex animals. The first nervous systems were simple nerve nets, but early in the
evolution nature began to concentrate nervous cells in small aggregates, resulting
in the appearance of ganglia, as is the case of Platyhelminthes, which have a
nervous system composed of several interconnected ganglia. In the course of
evolution the head ganglion became larger and more complex, and ended up
taking over the other ganglia, resulting in a brain. The brain together with the spinal
cord form the central nervous system (CNS) which processes and controls all motor
and sensor functions and is also responsible for memory and behaviour. (Thompson,
1993)
The brain comprises several types of cells that can be generally divided in neurons
and glia. Neurons are the brain’s functional unit. They are very specialized cells
committed to the transport and processing of the nervous signal. Neurons are
classified functionally into three categories: sensory neurons, interneurons and motor
neurons. In essence they play the three different roles of an informational system:
input, process and output. Sensory neurons transform physical stimuli into electrical
signals and deliver these signals to the interneurons. Interneurons are the most
abundant type of neurons and are organized in networks responsible for most of the
complex computations that produce behaviour. Motor neurons innervate the
effector organs (like the muscles or gland cells) and are in charge of sending the
output signals to the organ responsible for the resulting action (physical or
chemical). Neurons transport the nervous signal electrically throughout their
dendrites, cell bodies and axons and transmit nervous signals from one neuron to
the next, chemically (with rare exceptions), through the synapses. In resting
conditions the neuron has an asymmetric distribution of sodium and potassium ions
across its cytosolic membrane, thus maintaining the neuronal membrane polarized.
The polarization results from the action of the Na+/K+ ATPase, which pumps three
Na+ ions out and two K+ ions into the cell for each ATP molecule hydrolysed. The

Chapter | 1
4
nervous signal consists in a depolarization of the neuronal membrane, which is
transmitted along the dendrites and axons in a unidirectional way. The
depolarization is possible due to the presence of special proteins of which the
voltage-gated Na+ and K+ channels are the most important. Thus the passage of a
signal is accompanied by short local increases of extracellular K+ and intracellular
Na+. When the signal (depolarization) reaches the axon terminal, the presynaptic
element, special voltage-gated Ca2+ channels, allow the entry of Ca2+, which
causes the synaptic vesicles to fuse with the presynaptic membrane and release the
neurotransmitter into the synaptic cleft. Once released, the neurotransmitter
molecules diffuse and bind the ligand-gated ion channels in the post-synaptic
membrane, which may lead to the depolarization of the next neuron. The
neurotransmitter is either enzymatically inactivated and the products recycled by
the presynaptic element, or removed by the neurons involved in the synapse or by a
neighbouring cell.
It was Rudolf Virchow who first named glial cells back in the XIX century, as
neuroglia. These cells were named after what was thought to be their only function,
neuro glue (‘Nervenkitt’), i.e. the glue that holds neurons together (Dermietzel and
Spray, 1998; Perea and Araque, 2002; Kimelberg, 2004). Nowadays glial cells are
recognized as having several other functions besides providing mere physical
support to neurons. Studies on glial cells in the last years have been changing our
views on the fundamental neuronal liaison, the synapse, and what was once
considered to be a purely neuronal affair is now recognized as a ‘ménage à trois ’,
where the glial cells play a very important third-party role in the formation, induction,
maturation, maintenance and termination of the relationship between the two
partners (Araque et al., 1999; Pfrieger, 2002; Slezak and Pfrieger, 2003). Moreover,
from an evolutionary point of view the presence of multifunctional glial cells, may
have allowed the neuronal evolution to follow a path of progressive specialization,
which resulted in a neuronal cell highly specialized in processing, encoding and
transferring information. The phylogenetic analysis is quite clear: in leeches a
ganglion with 25 to 30 neurons has only one glial cell; in a human brain there are
1.4 astrocytes per neuron (Nedergaard et al., 2003). As the nervous systems grew in
complexity it became necessary to isolate the different circuits to avoid cross talks.
(Laming et al., 2000) Glial cells may have evolved to isolate the different

Introduction
5
components and avoid events such as neurotransmitter spill over from neighbouring
synapses.
Glial cells are divided into macroglia and microglia. The microglia are not true glial
cells but originate from the immune system and invade the brain during gestation.
Their main function is to provide some immunological defence in the brain.
Macroglia encompasses the myelinating glia, the ependymoglia and the astrocytes.
Oligodendrocytes and their peripheral nervous system (PNS) counterparts, the
myelinating Schwann cells, are responsible for the myelination of the neuronal axons
to attain electrical insulation and achieve higher rates of signal transmission. These
cells achieve this goal by ensheathing the axons with several layers of extensions of
their own cytoplasmatic membrane. During the myelination process the membranes
are enriched in special lipids like cholesterol, cerebrosides and ethanolamine
phospholipids. Ependymoglia are an important group of cells that line the interior of
the cerebral ventricles and other cavities of the brain and spinal cord.
Ependymoglia include the tanycytes, which form the ventricular cerebrospinal fluid
interface, the ependymal cells in the pia limitans, and the Müller cells in the retina.
Astrocytes, as the name reveals, are star-shaped cells with non-excitable
membranes, responsible for the majority of the housekeeping functions in the brain.
Apart from being responsible for the physical support of the brain during
development, the astrocytes assist in the guidance of neurons, axons and dendrites,
and intervene in the formation (and destruction) of synapses. In the mature brain,
astrocytes are responsible for the formation and maintenance of the blood-brain
barrier, for the removal of neurotransmitters (either by uptake or by enzymatic
inactivation), for the control of the composition of the extracellular fluid, and for the
supply of nutrients and the removal of products of neuronal metabolism. By evolving
into cells capable of performing all housekeeping functions needed by neurons, the
astrocytes released the neurons from these tasks, allowing them to evolve into very
specialized cells in the transmission of the nervous signal. Thus, the more
complicated the nervous system got, i.e. the higher an animal is in the phylogenetic
tree, the greater was the demand on astrocytes to sustain an increasingly
specialized number of neurons.
Chapter | 1
6
Neuronal-Glial Metabolism
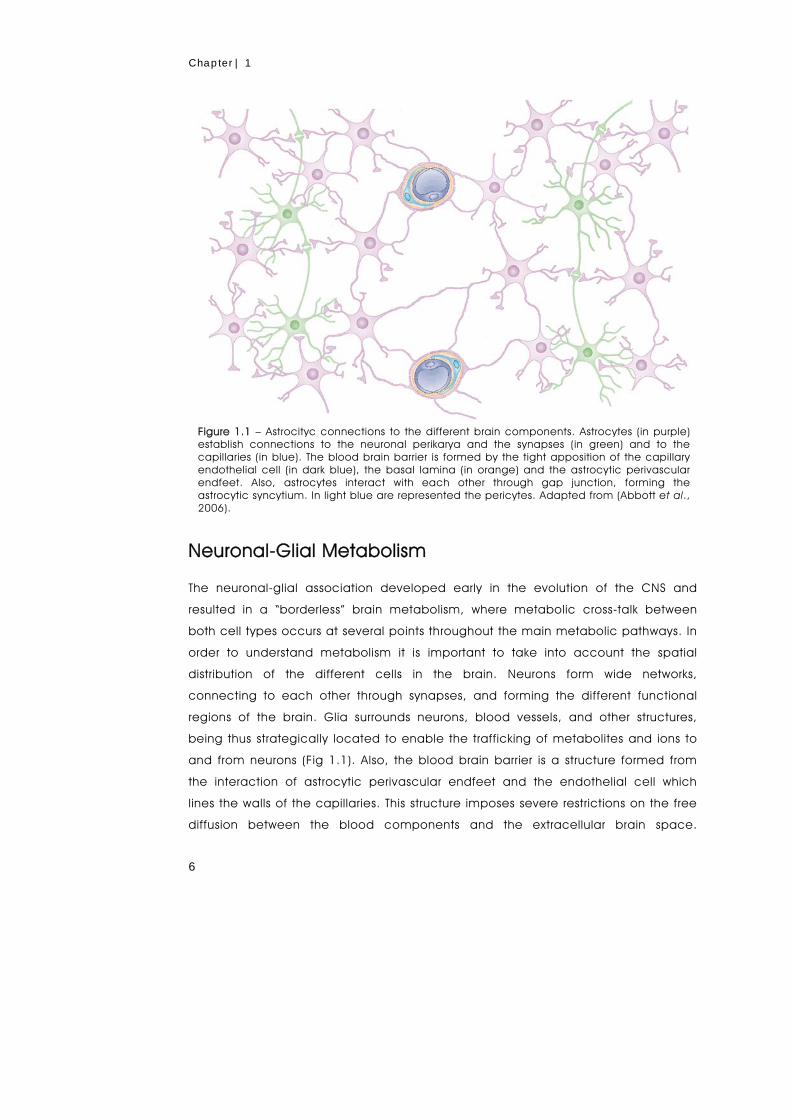
The neuronal-glial association developed early in the evolution of the CNS and
resulted in a “borderless” brain metabolism, where metabolic cross-talk between
both cell types occurs at several points throughout the main metabolic pathways. In
order to understand metabolism it is important to take into account the spatial
distribution of the different cells in the brain. Neurons form wide networks,
connecting to each other through synapses, and forming the different functional
regions of the brain. Glia surrounds neurons, blood vessels, and other structures,
being thus strategically located to enable the trafficking of metabolites and ions to
and from neurons (Fig 1.1). Also, the blood brain barrier is a structure formed from
the interaction of astrocytic perivascular endfeet and the endothelial cell which
lines the walls of the capillaries. This structure imposes severe restrictions on the free
diffusion between the blood components and the extracellular brain space.
Figure 1.1 – Astrocityc connections to the different brain components. Astrocytes (in purple) establish connections to the neuronal perikarya and the synapses (in green) and to the capillaries (in blue). The blood brain barrier is formed by the tight apposition of the capillary endothelial cell (in dark blue), the basal lamina (in orange) and the astrocytic perivascular endfeet. Also, astrocytes interact with each other through gap junction, forming the astrocytic syncytium. In light blue are represented the pericytes. Adapted from (Abbott et al., 2006).
Introduction
7
Furthermore, astrocytes are connected to each other through specialized structures
called gap junctions, which enable direct intercellular communication between the
cytoplasm of neighbouring cells, forming what is denominated a panglial syncytium
(Fig 1.1). Given the wide number of interactions between astrocytes and neurons,
these will be divided in two kinds: ionic and metabolic.
Ionic Interactions Between Astrocytes and Neurons
The transport of the nervous signal is associated with ions fluxes, especially K+ and
Na+. Furthermore, cerebral metabolism can also lead to the production ions. In
K+
K+
K+
K+ K+
Glu
K+
Na+
Lac CO2
CO2
HCO3-
Na+
HCO3-
Na+
Lac
Lac H+
H+
K+
K+
K+
Glc
Glc
+H+
CA
K+
K+
K+
K+ K+
Glu
K+
Na+
Lac CO2
CO2
HCO3-HCO3-
Na+
HCO3-HCO3-
Na+
Lac
Lac H+
H+
K+
K+
K+
Glc
Glc
+H+
CA
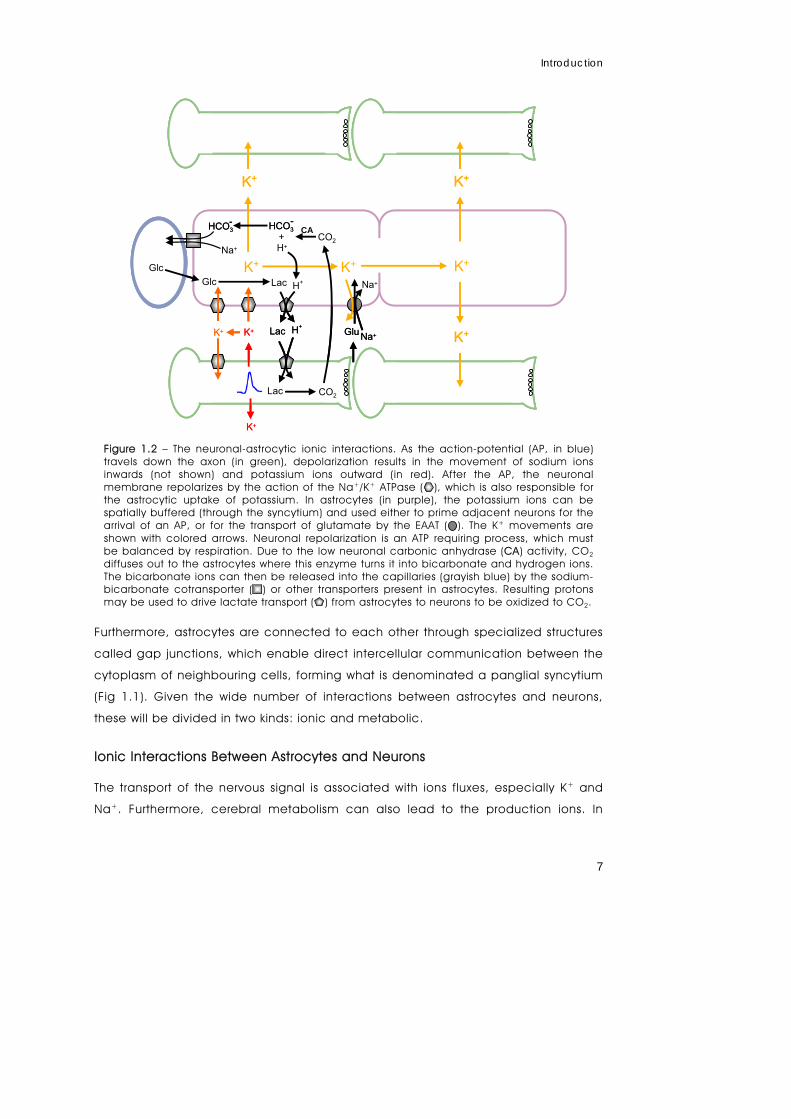
Figure 1.2 – The neuronal-astrocytic ionic interactions. As the action-potential (AP, in blue) travels down the axon (in green), depolarization results in the movement of sodium ions inwards (not shown) and potassium ions outward (in red). After the AP, the neuronal membrane repolarizes by the action of the Na+/K+ ATPase ( ), which is also responsible for the astrocytic uptake of potassium. In astrocytes (in purple), the potassium ions can be spatially buffered (through the syncytium) and used either to prime adjacent neurons for the arrival of an AP, or for the transport of glutamate by the EAAT ( ). The K+ movements are shown with colored arrows. Neuronal repolarization is an ATP requiring process, which must be balanced by respiration. Due to the low neuronal carbonic anhydrase (CA) activity, CO2 diffuses out to the astrocytes where this enzyme turns it into bicarbonate and hydrogen ions. The bicarbonate ions can then be released into the capillaries (grayish blue) by the sodium-bicarbonate cotransporter ( ) or other transporters present in astrocytes. Resulting protons may be used to drive lactate transport ( ) from astrocytes to neurons to be oxidized to CO2.

Chapter | 1
8
Figure 1.2 are illustrated some of the ionic interactions between astrocytes and
neurons. Upon the action potential-dependent K+ release, astrocytes, having a
relatively high K+ permeability and a more negative membrane potential than
neurons (Walz, 1989; Deitmer, 2001), take up this ion through the K+/Na+ ATPase
(Ransom et al., 2000). This aids the neurons repolarization and protects them from
elevated extracellular K+ concentrations (Laming et al., 2000). The astrocytic
transported K+ can then be redistributed throughout the syncytium via the gap
junctions (spatial buffering) and either used for the uptake of glutamate, in synaptic
regions, or may be released in regions where the K+ equilibrium potential is more
negative than the membrane potential (Ransom et al., 2000). Ultimately, the end
product of oxidative metabolism is CO2. However, the carbonic anhydrase (CA),
which reversibly catalyses the conversion of carbonic acid to protons and
bicarbonate ions, is present mainly in glia and endothelial cells (Giacobini, 1961;
Cammer and Tansey, 1988; Cammer and Zhang, 1991; Nogradi et al., 2003), thus
making astrocytes the removers of neuronal CO2. The bicarbonate ions generated in
this way are then exchanged with Na+ ions, with a 2:1 stoichiometry, using the
electrogenic transmembrane-gradient. The protons may either be expelled through
the H+/Na+ exchanger, or used to drive lactate out of the astrocytes through the
monocarboxylate transporter (MCT, for review see Laming et al., 2000; Deitmer,
2001).
Metabolic Trafficking
Cerebral energy consumption is very high. Although the human mature brain only
weighs 2% of the total body weight, it consumes 25% of the body’s energy supply,
20% of total body oxygen, and receives 15% of the cardiac output (Clarke and
Sokoloff, 1994; Wiesinger et al., 1997). In resting conditions the oxygen
consumption to glucose utilization ratio is 5.5, indicating that more than 90% of the
consumed glucose is completely oxidized to CO2 and H2O (Clarke and Sokoloff,
1994). Nevertheless, this does not reveal where the glucose is actually oxidized.
According with the astrocyte-neuronal lactate shuttle (ANLS) hypothesis (Pellerin and
Magistretti, 1994), astrocytes take up the blood-borne glucose, through GLUT1
(Morgello et al., 1995) and metabolise it to pyruvate via glycolysis (Embden-
Meyerhof pathway). Pyruvate is then oxidised to lactate by the lactate
dehydrogenase isoform 5 (LDH-5) and released through the monocarboxylate
Introduction
9
transport 1 (MCT1) and 4 (MCT4) (Hertz and Dienel, 2005). Lactate can be taken up
by the neuron (through MCT2), where it is oxidised back to pyruvate (through LDH-1).
Pyruvate is oxidised via the tricarboxylic acid (TCA) cycle to fuel the energy-
consuming processes.
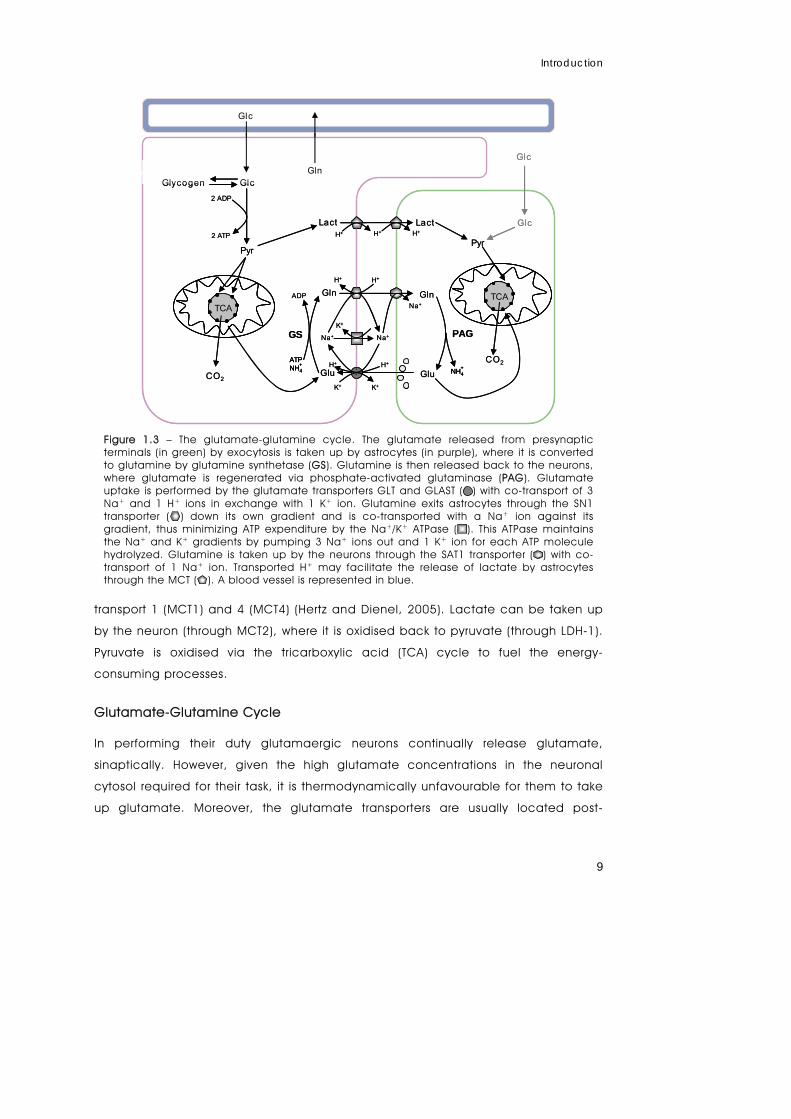
Glutamate-Glutamine Cycle
In performing their duty glutamaergic neurons continually release glutamate,
sinaptically. However, given the high glutamate concentrations in the neuronal
cytosol required for their task, it is thermodynamically unfavourable for them to take
up glutamate. Moreover, the glutamate transporters are usually located post-
Gln
Glu
Pyr
Lact
Pyr
Lact
CO2
Na+Na+
K+K+
K+
Gln
Glu
ADP
ATPNH4
+
NH4+
Glc
H+H+
Na+
H+H+
GlcGlycogen
2 ADP
2 ATP
GS PAG
Glc
GlcH+H+ H+
Gln
TCA
CO2
TCAGln
Glu
Pyr
Lact
Pyr
Lact
CO2
Na+Na+
K+K+
K+
Gln
Glu
ADP
ATPNH4
+ATPNH4
+
NH4+
NH4+
Glc
H+H+
Na+
H+H+
GlcGlycogen
2 ADP
2 ATP
GS PAG
Glc
GlcH+H+ H+
Gln
TCATCATCA
CO2
TCATCATCA
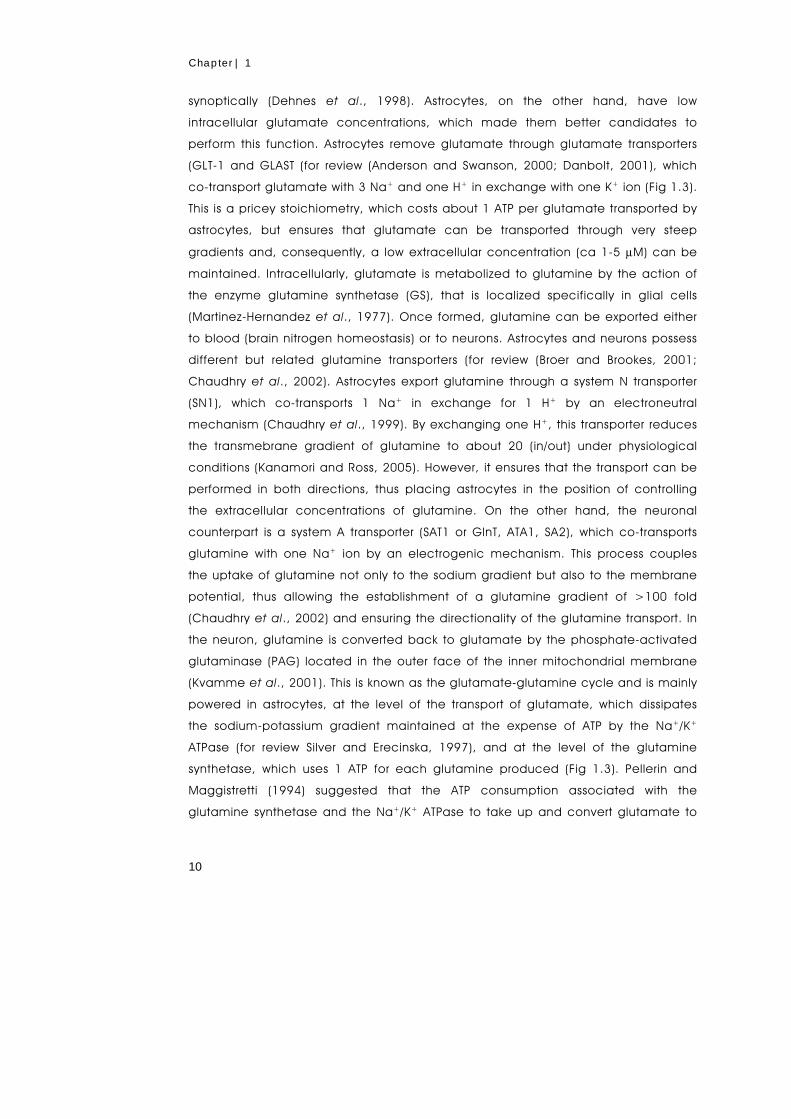
Figure 1.3 – The glutamate-glutamine cycle. The glutamate released from presynaptic terminals (in green) by exocytosis is taken up by astrocytes (in purple), where it is converted to glutamine by glutamine synthetase (GS). Glutamine is then released back to the neurons, where glutamate is regenerated via phosphate-activated glutaminase (PAG). Glutamate uptake is performed by the glutamate transporters GLT and GLAST ( ) with co-transport of 3 Na+ and 1 H+ ions in exchange with 1 K+ ion. Glutamine exits astrocytes through the SN1 transporter ( ) down its own gradient and is co-transported with a Na+ ion against its gradient, thus minimizing ATP expenditure by the Na+/K+ ATPase ( ). This ATPase maintains the Na+ and K+ gradients by pumping 3 Na+ ions out and 1 K+ ion for each ATP molecule hydrolyzed. Glutamine is taken up by the neurons through the SAT1 transporter ( ) with co-transport of 1 Na+ ion. Transported H+ may facilitate the release of lactate by astrocytes through the MCT ( ). A blood vessel is represented in blue.
Chapter | 1
10
synoptically (Dehnes et al., 1998). Astrocytes, on the other hand, have low
intracellular glutamate concentrations, which made them better candidates to
perform this function. Astrocytes remove glutamate through glutamate transporters
(GLT-1 and GLAST (for review (Anderson and Swanson, 2000; Danbolt, 2001), which
co-transport glutamate with 3 Na+ and one H+ in exchange with one K+ ion (Fig 1.3).
This is a pricey stoichiometry, which costs about 1 ATP per glutamate transported by
astrocytes, but ensures that glutamate can be transported through very steep
gradients and, consequently, a low extracellular concentration (ca 1-5 μM) can be
maintained. Intracellularly, glutamate is metabolized to glutamine by the action of
the enzyme glutamine synthetase (GS), that is localized specifically in glial cells
(Martinez-Hernandez et al., 1977). Once formed, glutamine can be exported either
to blood (brain nitrogen homeostasis) or to neurons. Astrocytes and neurons possess
different but related glutamine transporters (for review (Broer and Brookes, 2001;
Chaudhry et al., 2002). Astrocytes export glutamine through a system N transporter
(SN1), which co-transports 1 Na+ in exchange for 1 H+ by an electroneutral
mechanism (Chaudhry et al., 1999). By exchanging one H+, this transporter reduces
the transmebrane gradient of glutamine to about 20 (in/out) under physiological
conditions (Kanamori and Ross, 2005). However, it ensures that the transport can be
performed in both directions, thus placing astrocytes in the position of controlling
the extracellular concentrations of glutamine. On the other hand, the neuronal
counterpart is a system A transporter (SAT1 or GlnT, ATA1, SA2), which co-transports
glutamine with one Na+ ion by an electrogenic mechanism. This process couples
the uptake of glutamine not only to the sodium gradient but also to the membrane
potential, thus allowing the establishment of a glutamine gradient of >100 fold
(Chaudhry et al., 2002) and ensuring the directionality of the glutamine transport. In
the neuron, glutamine is converted back to glutamate by the phosphate-activated
glutaminase (PAG) located in the outer face of the inner mitochondrial membrane
(Kvamme et al., 2001). This is known as the glutamate-glutamine cycle and is mainly
powered in astrocytes, at the level of the transport of glutamate, which dissipates
the sodium-potassium gradient maintained at the expense of ATP by the Na+/K+
ATPase (for review Silver and Erecinska, 1997), and at the level of the glutamine
synthetase, which uses 1 ATP for each glutamine produced (Fig 1.3). Pellerin and
Maggistretti (1994) suggested that the ATP consumption associated with the
glutamine synthetase and the Na+/K+ ATPase to take up and convert glutamate to
Introduction
11
glutamine induces the activation of the astrocytic glycolysis. In this way, activity in
the glutamate-glutamine cycle increases the glycolytic flux, which produces the
required 2 ATP for this cycle and 2 lactate molecules used to fuel the neuronal
metabolism. It has also been shown, by NADH fluorescence imaging, that astrocytes
have a substantial cytoplasmatic NADH fraction, indicative of a higher glycolytic
capacity, whereas neurons exhibit a granular distribution of NADH compatible with a
mitochondrial origin (Kasischke et al., 2004). Moreover, the same authors also
provide compelling evidence that neuronal stimulation leads to an increase in the
astrocytic glycolysis, compatible with a stimulation-dependent astrocyte to neuron
lactate transfer. Although these results confirm the ANLS hypothesis there are still a
number of points not fully explained (for review see Gladden, 2004), one of which is
the fact that neurons do express a glucose transporter (GLUT3, Vannucci et al.,
1997). This suggests that neurons also consume glucose, present in the extracellular
space of the cortex in a concentration of 1.66 and 0.82 mM in rats and humans,
respectively (Abi-Saab et al., 2002). In order for this to occur, either glucose can
pass through the vessels to the extracellular fluid (ECF), avoiding the blood-brain
barrier, or the glial syncytium allows the diffusion of glucose. This latter hypothesis
seems unlikely due to the presence of hexokinase and the absence of glucose 6-
phosphate phosphatase (Gotoh et al., 2000). The balance of metabolites in this
cycle is performed by both cells. However, while neurons are only able to remove
glutamate by oxidation via the TCA cycle, astrocytes are also able to produce
glutamate from glycolytic precursors, by carboxylation of pyruvate to oxaloacetate
(Yu et al., 1983; Shank et al., 1985; Cesar and Hamprecht, 1995). This astrocytic
enzyme, pyruvate carboxylase, performs the anaplerotic reaction that allows the
synthesis of glutamate from the TCA metabolite, α-ketoglutarate. Astrocytes are able
to remove the excess of glutamate by either oxidation through the TCA cycle, like
neurons, or by releasing glutamine into the blood-stream.
Nitrogen Shuttling
One major consequence of the glutamate-glutamine cycle is the net transport of
nitrogen from the astrocytic to the neuronal compartment. In order to maintain a
nitrogen homeostasis a method of shuttling the nitrogen back to astrocytes should
exist. Due to the toxic nature of the ammonium ion it is unlikely, but not impossible
(Marcaggi and Coles, 2001), that these ions are transported back to the astrocytic
Chapter | 1
12
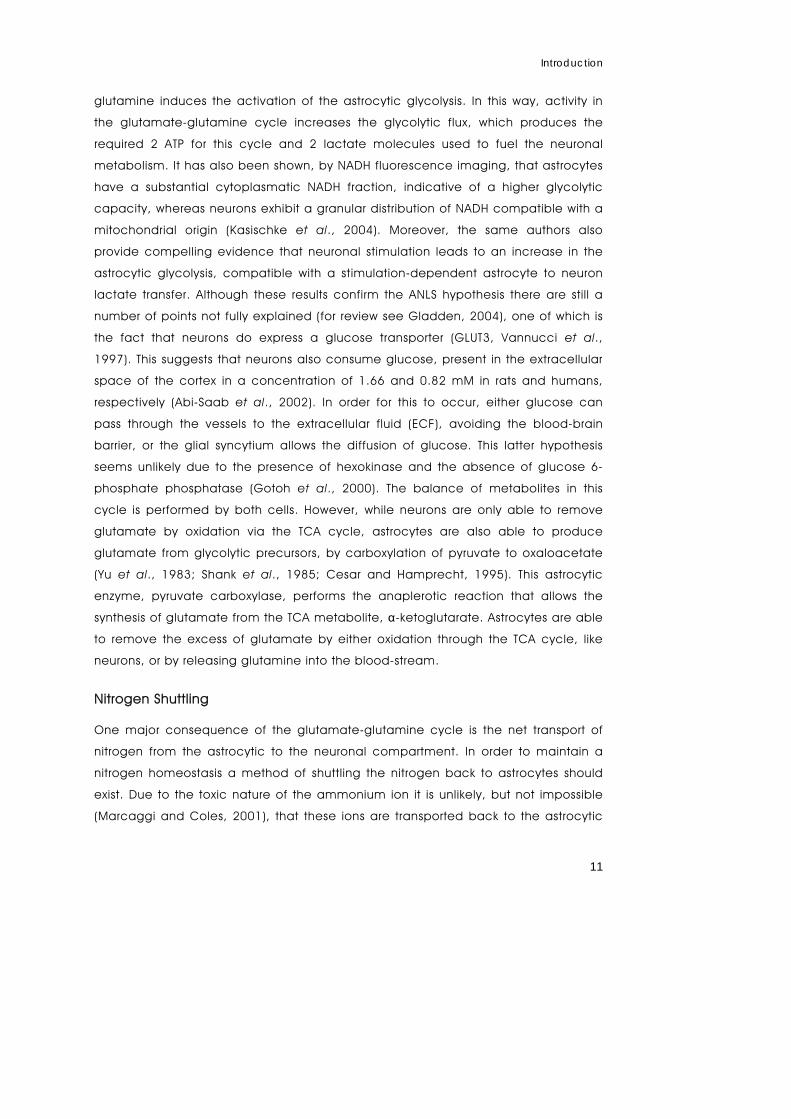
compartment in this form (Fig. 1.4.). In 1996, Yudkoff and coworkers (Yudkoff et al.,
1996b; Yudkoff et al., 1996a) proposed the existence of a branched-chain amino
acid nitrogen cycle where α-ketoisocaproate or α-ketoisovalerate were the potential
candidates to transport the ammonium back to astrocytes in the form of their amino
conjugates leucine and valine, respectively. Once in the astrocytic compartment,
these amino acids could be deaminated to generate ammonium ions and their
carbon backbones (branched-chain α-keto acids) recycled back to neurons (Fig.
1.4.). Recently, Sakai and collaborators (Sakai et al., 2004) showed that 15N-
enrichment of the amide-N of rat brain glutamine from [15N]leucine, was greater
than that of the bulk ammonium pool, suggesting that compartmentalization of the
three enzymatic activities required, i.e. branched-chain amino acid
aminotransferase, glutamate dehydrogenase, and glutamine synthetase. In 2000
Figure 1.4 – Nitrogen shuttling between astrocytes and neurons. Schematic representation of the glutamate-glutamine cycle, the lactate-alanine shuttle, and branched-chain amino acid nitrogen cycle between glutamatergic neurons and astrocytes. Glutamine is deaminated in the neuronal compartment to glutamate and ammonium ions by the phosphate-activated glutaminase (PAG). The nitrogen shuttle models propose that these ions can be used to aminate α-ketoglutarate to glutamate by the glutamate dehydrogenase (GDH), which then passes the amino group to pyruvate or to α-ketoisocaproate (KIC) by either the alanine or the branched-chain amino acid aminotransferases (AAT or BCAT) to form alanine or leucine, respectively. These amino acids would be then released by neurons and taken up by astrocytes, which would use the same enzymatic activities to generate free ammonium. The ammonium could be re-used in the
Introduction
13
another model, called the lactate-alanine shuttle, was proposed to describe the
transfer of nitrogen between neurons and astrocytes (Waagepetersen et al., 2000;
Zwingmann et al., 2000). In this model the proposed carrier is pyruvate, which is
aminated to alanine in the neurons and released to be taken up by astrocytes. In
the astrocytes alanine could be deaminated back to pyruvate and the pyruvate
returned to neurons as lactate (Fig. 1.4.). Although both models use different
carriers, both suggest that the ammonium ion is transported as an amino acid. Also,
the models are not mutually exclusive and most probably occur simultaneously;
given the absence of an urea cycle in the brain it is possible that neurons do not
rely only on 2 or 3 amino acids, but that several amino acids may be used to shuttle
the ammonium back to astrocytes. Unfortunately, if several amino acids are indeed
used, the flux of each one will be small, making it difficult to quantitate fluxes and to
identify the actual ammonium carriers.
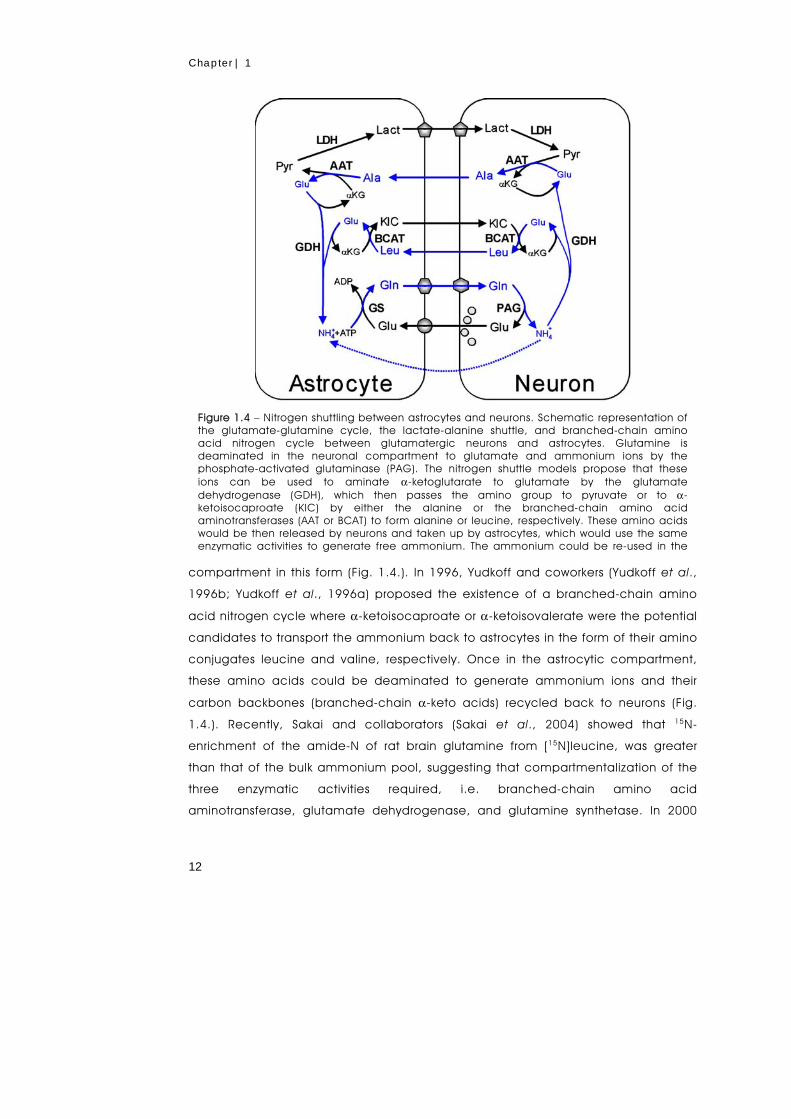
Figure 1.5 – Scheme of the proposed metabolic interaction between astrocytes and neurons in glutathione (GSH) metabolism. The GSH released from astroglial cells is a substrate for the astroglial ectoenzyme γ-glutamyl transferase (γGT). X represents an acceptor of the γ-glutamyl moiety transferred by γGT from GSH. CysGly, generated by the γGT reaction, serves as a precursor for neuronal GSH. Most probably, the hydrolysis of CysGly for neuronal utilization occurs via a neuronal ectopeptidase. In addition, glutamine is released from astrocytes and used by neurons as a precursor for the glutamate necessary as neurotransmitter and for GSH synthesis (adapted from Dringen et al., 2000).

Chapter | 1
14
Anti-Oxidants in the Brain
The interactions between astrocytes and neurons are not restricted to central
metabolism, but extend to other metabolic pathways, as is the case of the anti
oxidative pathways of glutathione (GSH, Fig 1.5) and ascorbic acid (AA, vitamin C,
Fig 1.6). Initially, neurons were considered to have less glutathione than astrocytes
(Cooper, 1997), however in 1999 Dringen and coworkers (Dringen et al., 1999)
showed that astrocytes were able to supply neurons with precursors required for the
synthesis of glutathione, and thereby neurons were able to attain similar intracellular
levels of this anti-oxidant. It was proposed (Fig. 1.5.) by the same authors that
astrocytes release to the extracellular space newly synthesized glutathione, which is
cleaved by a γ-glutamyl transpeptidase to generate cysteinylglycine (Dringen et al.,
1997). This dipeptide is subsequently cleaved by the neuronal ectoenzyme
aminopeptidase N and the amino acids cysteine and glycine generated are
subsequently taken up and used as precursors for the synthesis of neuronal
glutathione (Dringen et al., 2001).
Vitamin C (Fig. 1.6.) has an active role in the protection against free radicals and
has been suggested to be recycled between astrocytes and neurons.
AA
Astrocyte Neuron
AA AANa+ Na+
DHA DHA DHA
AA
Astrocyte Neuron
AA AANa+ Na+
DHA DHA DHA
Figure 1.6 – Neuron-astrocyte interaction for vitamin C recycling in the nervous system. Vitamin C (ascorbic acid, AA) recycling associated with neuron-astrocyte interaction requires a specific AA uptake in neurons ( ) and DHA uptake in astrocytes ( ). SVCT2 ( ) is expressed principally in neurons and mediates temperature- and sodium-dependent AA uptake. GLUT1 ( ) is expressed in astrocytes and mediates glucose-DHA uptake. It has been postulated that intracellularly, AA is oxidized in neurons (in red) generating DHA, which may exit neurons through facilitated transport via GLUT1 or GLUT3 ( ). In the extracellular space AA may be oxidized (in red) to DHA, while providing extracellular antioxidant protection. DHA is incorporated into the astrocytes through GLUT1. Inside astrocytes, DHA is reduced (in blue) back to AA, which may be released and taken up again by neurons via SVCT2. This recycling model may work as an efficient system for the salvage of vitamin C by avoiding the irreversible hydrolysis of DHA produced by antioxidative protection of both the intracellular neuronal compartment and the extracellular milieu (adapted from Astuya et al., 2005).
Introduction
15
Dehydroascorbate (DHA) in high concentration may be toxic. In response to this
toxicity, astrocytes remove this molecule through GLUT1 and reduce it back to
ascorbate (AA). Once released, ascorbate may either protect the extracellular
milieu from free radicals or may be transported by the SVCT2 to neurons, where it
exerts a protective role. Once oxidized, the DHA exits the neurons through the
glucose transporters (GLUT1 or GLUT3), becoming available to be transported by
astrocytes (Astuya et al., 2005).
Ketone Bodies Metabolism
Recent evidence suggests that astrocytes might also supply neurons with significant
amounts of ketone bodies like acetoacetate and 3-hydroxybutyrate from fatty acids
or leucine. It has also been shown that glutamate increases astrocytic ketogenesis
and that 3-hydroxybutyrate, like lactate, can replace glucose and preserve
neuronal synaptic function. These findings suggest a more important role of ketone
bodies in brain energy metabolism than thought thus far (for review Guzman and
Blazquez, 2001).
Metabolic Differences Between Astrocytes and Neurons
As mentioned above, the metabolism of astrocytes and neurons interact with each
other at several points, with metabolic trafficking occurring at these points. However,
there are several metabolic features in the metabolism of each cell type, that
although not directly associated with metabolic trafficking, impose restrictions on
how the trafficking occurs. One of the most important features is the lack of
pyruvate carboxylase in neurons (Yu et al., 1983; Shank et al., 1985; Cesar and
Hamprecht, 1995). The lack of pyruvate carboxylase prevents neurons from using
glycolytic substrates to increase, anapleroticly, the pools of the TCA cycle
intermediates, thus rendering neurons dependent on the surrounding astrocytes for
the supply of TCA cycle intermediate related metabolites (Schousboe et al., 1997).
This feature also places astrocytes virtually in control of the pool of glutamate, which
can have serious repercussions. For example, inhibitors of the carbonic anhydrase
can be used to treat epilepsy, because limiting the availability of bicarbonate may
lead to a diminished flux through pyruvate carboxylase, which in turn may reduce
the pool of glutamate, the main excitatory amino acid (Gamberino et al., 1997).
Chapter | 1
16
Insofar as mitochondrial metabolism is concerned there are differences between
the two cell types in the shuttling of the reducing equivalents from cytoplasm to the
mitochondria. There are two ways of performing this shuttling in the brain: through
the malate-aspartate shuttle or through the glycerol 3-phosphate shuttle. Of the two
processes, the malate-aspartate shuttle is better known than the glycerol 3-
phosphate shuttle which has been claimed to have little importance in the brain
(Nguyen et al., 2003). However, more studies are required given that this shuttling
system seems to be differentially expressed in the different brain cells (McKenna et
al., 2006). In what concerns the malate-aspartate shuttle, astrocytes exhibit
considerately lower levels of AGC1 protein (aralar1, the Ca2+-sensitive aspartate-
glutamate carrier) which appears to be the rate-limiting step of this shuttle (del Arco
et al., 2002), and also lower levels of activity of the malate-aspartate shuttle than
neurons (Ramos et al., 2003). Thus evidence, suggests that astrocytes do not shuttle
their cytosolic reducing equivalents to the mitochondria, but probably use most of
them to reduce pyruvate to lactate in agreement with their predominant glycolytic
nature.
In the brain, glycogen is found exclusively in the glial compartment and accordingly
the glycogenolytic enzyme, glycogen phosphorylase, is astrocyte-specific (for review
Wiesinger et al., 1997). Given the intermediate position of astrocytes between
capillaries and neurons, glycogen functions as a glucose (and probably lactate)
buffer, allowing not only the astrocytes themselves to survive a hypoglycaemic
period, but also neurons by supplying them with glycogen-born lactate (Tekkok et
al., 2005).
Models for the Study of Brain Metabolism
The brain is a complex object of study. Apart from the highly heterogeneous cellular
make-up, as described above, the mammalian brain is enclosed in a head
composed of soft tissue and bone. From the inside, as from the outside, the brain is
difficult to reach. The highly selective nature of the blood-brain barrier makes it
difficult for substances to reach the brain. The in vivo model, i.e. the brain inside a
living organism, has been used with some degree of success in metabolic studies
(Bouzier et al., 2000; Sibson et al., 2001; Kanamori et al., 2002; Merle et al., 2002;
de Graaf et al., 2004; Xu et al., 2004) but other organs like the liver usually interfere.
Introduction
17
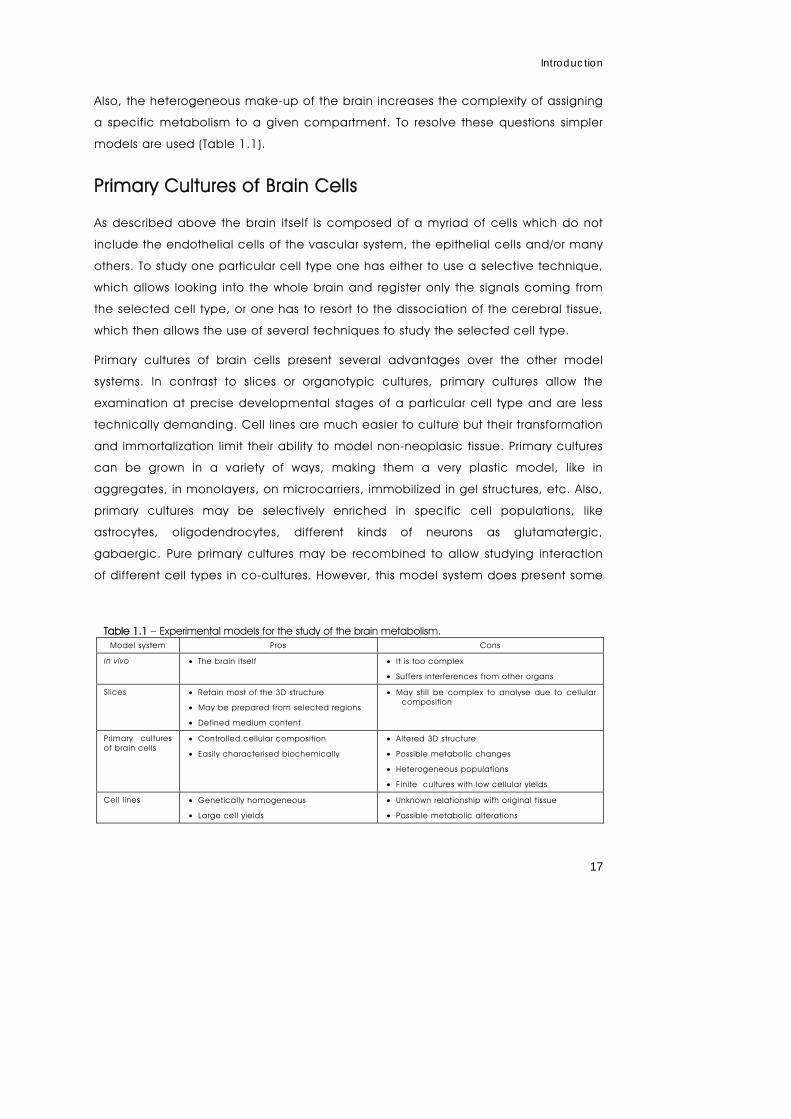
Also, the heterogeneous make-up of the brain increases the complexity of assigning
a specific metabolism to a given compartment. To resolve these questions simpler
models are used (Table 1.1).
Primary Cultures of Brain Cells
As described above the brain itself is composed of a myriad of cells which do not
include the endothelial cells of the vascular system, the epithelial cells and/or many
others. To study one particular cell type one has either to use a selective technique,
which allows looking into the whole brain and register only the signals coming from
the selected cell type, or one has to resort to the dissociation of the cerebral tissue,
which then allows the use of several techniques to study the selected cell type.
Primary cultures of brain cells present several advantages over the other model
systems. In contrast to slices or organotypic cultures, primary cultures allow the
examination at precise developmental stages of a particular cell type and are less
technically demanding. Cell lines are much easier to culture but their transformation
and immortalization limit their ability to model non-neoplasic tissue. Primary cultures
can be grown in a variety of ways, making them a very plastic model, like in
aggregates, in monolayers, on microcarriers, immobilized in gel structures, etc. Also,
primary cultures may be selectively enriched in specific cell populations, like
astrocytes, oligodendrocytes, different kinds of neurons as glutamatergic,
gabaergic. Pure primary cultures may be recombined to allow studying interaction
of different cell types in co-cultures. However, this model system does present some
Table 1.1 – Experimental models for the study of the brain metabolism. Model system Pros Cons
In vivo • The brain itself • It is too complex
• Suffers interferences from other organs
Slices • Retain most of the 3D structure
• May be prepared from selected regions
• Defined medium content
• May sti l l be complex to analyse due to cellular composition
Primary cultures of brain cells
• Controlled cellular composition
• Easily characterised biochemically
• Altered 3D structure
• Possible metabolic changes
• Heterogeneous populations
• Finite cultures with low cellular yields
Cell l ines • Genetically homogeneous
• Large cell yields
• Unknown relationship with original tissue
• Possible metabolic alterations
Chapter | 1
18
disadvantages: by destroying the three-dimensional structure of the tissues, cells
lose their natural contacts between each other, which may, ultimately, result in
altered phenotypes. Moreover, the time spent in culture and the medium
composition can also have repercussions on cell metabolism.
In this work primary cultures of astrocytes were used because this model system
allowed studying astrocytic metabolism with different techniques, for example, cells
can be cultured in static conditions, which can be easily coupled to high resolution
NMR studies of cellular extracts. Also, furthermore cells may be immobilized in
different matrices, which enable their use for metabolic studies with bioreactors
under fully controlled conditions or for time-dependent in vivo NMR studies.
REFERENCES
Abbott N. J., Ronnback L. and Hansson E. (2006) Astrocyte-endothelial interactions
at the blood-brain barrier. Nat. Rev. Neurosci. 7, 41-53.
Abi-Saab W. M., Maggs D. G., Jones T., Jacob R., Srihari V., Thompson J., Kerr D.,
Leone P., Krystal J. H., Spencer D. D., During M. J. and Sherwin R. S. (2002)
Striking differences in glucose and lactate levels between brain extracellular
fluid and plasma in conscious human subjects: effects of hyperglycemia and
hypoglycemia. J. Cereb. Blood Flow Metab. 22, 271-279.
Anderson C. M. and Swanson R. A. (2000) Astrocyte glutamate transport: review of
properties, regulation, and physiological functions. Glia 32, 1-14.
Araque A., Parpura V., Sanzgiri R. P. and Haydon P. G. (1999) Tripartite synapses:
glia, the unacknowledged partner. Trends Neurosci. 22, 208-215.
Astuya A., Caprile T., Castro M., Salazar K., Garcia Mde L., Reinicke K., Rodriguez F.,
Vera J. C., Millan C., Ulloa V., Low M., Martinez F. and Nualart F. (2005)
Vitamin C uptake and recycling among normal and tumor cells from the
central nervous system. J. Neurosci. Res. 79, 146-156.
Bouzier A. K., Thiaudiere E., Biran M., Rouland R., Canioni P. and Merle M. (2000) The
metabolism of [3-13C]lactate in the rat brain is specific of a pyruvate
carboxylase-deprived compartment. J. Neurochem. 75, 480-486.
Broer S. and Brookes N. (2001) Transfer of glutamine between astrocytes and
neurons. J. Neurochem. 77, 705-719.
Introduction
19
Cammer W. and Tansey F. A. (1988) Carbonic anhydrase immunostaining in
astrocytes in the rat cerebral cortex. J. Neurochem. 50, 319-322.
Cammer W. and Zhang H. (1991) Comparison of immunocytochemical staining of
astrocytes, oligodendrocytes, and myelinated fibers in the brains of carbonic
anhydrase II-deficient mice and normal littermates. J. Neuroimmunol. 34, 81-
86.
Cesar M. and Hamprecht B. (1995) Immunocytochemical examination of neural rat
and mouse primary cultures using monoclonal antibodies raised against
pyruvate carboxylase. J. Neurochem. 64, 2312-2318.
Chaudhry F. A., Reimer R. J. and Edwards R. H. (2002) The glutamine commute: take
the N line and transfer to the A. J. Cell Biol. 157, 349-355.
Chaudhry F. A., Reimer R. J., Krizaj D., Barber D., Storm-Mathisen J., Copenhagen D.
R. and Edwards R. H. (1999) Molecular analysis of system N suggests novel
physiological roles in nitrogen metabolism and synaptic transmission. Cell 99,
769-780.
Clarke D. D. and Sokoloff L. (1994) Circulation and energy metabolism of the brain,
in Basic Neurochemistry - molecular, cellular and medical aspects, 6th
Edition (G.J. Siegel B. W. A., R.W. Albers, S. K. Fisher, and M. D. Uhler, ed.), p
637–670. Lippincott - Raven, New York.
Cooper A. J. L. (1997) Glutathione in the brain: disorders of glutathione metabolism.,
in The Molecular and Genetic Basis of Neurological Disease (R.N. Rosenberg
S. B. P., S. DiMauro, R.L. Barchi and L.M. Kunk, ed.), pp 1195-1230.
Butterworth-Heinemann, Boston.
Danbolt N. C. (2001) Glutamate uptake. Prog. Neurobiol. 65, 1-105.
de Graaf R. A., Mason G. F., Patel A. B., Rothman D. L. and Behar K. L. (2004)
Regional glucose metabolism and glutamatergic neurotransmission in rat
brain in vivo. Proc. Natl. Acad. Sci. U. S. A. 101, 12700-12705.
Dehnes Y., Chaudhry F. A., Ullensvang K., Lehre K. P., Storm-Mathisen J. and Danbolt
N. C. (1998) The glutamate transporter EAAT4 in rat cerebellar Purkinje cells: a
glutamate-gated chloride channel concentrated near the synapse in parts of
the dendritic membrane facing astroglia. J. Neurosci. 18, 3606-3619.
Deitmer J. W. (2001) Strategies for metabolic exchange between glial cells and
neurons. Respir. Physiol. 129, 71-81.
Chapter | 1
20
del Arco A., Morcillo J., Martinez-Morales J. R., Galian C., Martos V., Bovolenta P.
and Satrustegui J. (2002) Expression of the aspartate/glutamate mitochondrial
carriers aralar1 and citrin during development and in adult rat tissues. Eur. J.
Biochem. 269, 3313-3320.
Dermietzel R. and Spray D. C. (1998) From neuro-glue ('Nervenkitt') to glia: a
prologue. Glia 24, 1-7.
Dringen R., Kranich O. and Hamprecht B. (1997) The gamma-glutamyl
transpeptidase inhibitor acivicin preserves glutathione released by astroglial
cells in culture. Neurochem. Res. 22, 727-733.
Dringen R., Pfeiffer B. and Hamprecht B. (1999) Synthesis of the antioxidant
glutathione in neurons: supply by astrocytes of CysGly as precursor for
neuronal glutathione. J. Neurosci. 19, 562-569.
Dringen R., Gutterer J. M., Gros C. and Hirrlinger J. (2001) Aminopeptidase N
mediates the utilization of the GSH precursor CysGly by cultured neurons. J.
Neurosci. Res. 66, 1003-1008.
Gamberino W. C., Berkich D. A., Lynch C. J., Xu B. and LaNoue K. F. (1997) Role of
pyruvate carboxylase in facilitation of synthesis of glutamate and glutamine in
cultured astrocytes. J. Neurochem. 69, 2312-2325.
Giacobini E. (1961) Localization of carbonic anhydrase in the nervous system.
Science 134, 1524-1525.
Gladden L. B. (2004) Lactate metabolism: a new paradigm for the third millennium.
J. Physiol. 558, 5-30.
Gotoh J., Itoh Y., Kuang T. Y., Cook M., Law M. J. and Sokoloff L. (2000) Negligible
glucose-6-phosphatase activity in cultured astroglia. J. Neurochem. 74, 1400-
1408.
Guzman M. and Blazquez C. (2001) Is there an astrocyte-neuron ketone body
shuttle? Trends Endocrinol. Metab. 12, 169-173.
Hertz L. and Dienel G. A. (2005) Lactate transport and transporters: general
principles and functional roles in brain cells. J. Neurosci. Res. 79, 11-18.
Kanamori K. and Ross B. D. (2005) Suppression of glial glutamine release to the
extracellular fluid studied in vivo by NMR and microdialysis in
hyperammonemic rat brain. J. Neurochem. 94, 74-85.

Introduction
21
Kanamori K., Ross B. D. and Kondrat R. W. (2002) Glial uptake of neurotransmitter
glutamate from the extracellular fluid studied in vivo by microdialysis and 13C
NMR. J. Neurochem. 83, 682-695.
Kasischke K. A., Vishwasrao H. D., Fisher P. J., Zipfel W. R. and Webb W. W. (2004)
Neural activity triggers neuronal oxidative metabolism followed by astrocytic
glycolysis. Science 305, 99-103.
Kimelberg H. K. (2004) The problem of astrocyte identity. Neurochem. Int. 45, 191-
202.
Kvamme E., Torgner I. A. and Roberg B. (2001) Kinetics and localization of brain
phosphate activated glutaminase. J. Neurosci. Res. 66, 951-958.
Laming P. R., Kimelberg H., Robinson S., Salm A., Hawrylak N., Muller C., Roots B.
and Ng K. (2000) Neuronal-glial interactions and behaviour. Neurosci.
Biobehav. Rev. 24, 295-340.
Marcaggi P. and Coles J. A. (2001) Ammonium in nervous tissue: transport across
cell membranes, fluxes from neurons to glial cells, and role in signalling. Prog.
Neurobiol. 64, 157-183.
Martinez-Hernandez A., Bell K. P. and Norenberg M. D. (1977) Glutamine synthetase:
glial localization in brain. Science 195, 1356-1358.
McKenna M. C., Waagepetersen H. S., Schousboe A. and Sonnewald U. (2006)
Neuronal and astrocytic shuttle mechanisms for cytosolic-mitochondrial
transfer of reducing equivalents: current evidence and pharmacological
tools. Biochem. Pharmacol. 71, 399-407.
Merle M., Bouzier-Sore A. K. and Canioni P. (2002) Time-dependence of the
contribution of pyruvate carboxylase versus pyruvate dehydrogenase to rat
brain glutamine labelling from [1-13C]glucose metabolism. J. Neurochem. 82,
47-57.
Morgello S., Uson R. R., Schwartz E. J. and Haber R. S. (1995) The human blood-brain
barrier glucose transporter (GLUT1) is a glucose transporter of gray matter
astrocytes. Glia 14, 43-54.
Nedergaard M., Ransom B. and Goldman S. A. (2003) New roles for astrocytes:
redefining the functional architecture of the brain. Trends Neurosci. 26, 523-
530.

Chapter | 1
22
Nguyen N. H., Brathe A. and Hassel B. (2003) Neuronal uptake and metabolism of
glycerol and the neuronal expression of mitochondrial glycerol-3-phosphate
dehydrogenase. J. Neurochem. 85, 831-842.
Nogradi A., Domoki F., Degi R., Borda S., Pakaski M., Szabo A. and Bari F. (2003) Up-
regulation of cerebral carbonic anhydrase by anoxic stress in piglets. J.
Neurochem. 85, 843-850.
Pellerin L. and Magistretti P. J. (1994) Glutamate uptake into astrocytes stimulates
aerobic glycolysis: a mechanism coupling neuronal activity to glucose
utilization. Proc. Natl. Acad. Sci. U. S. A. 91, 10625-10629.
Perea G. and Araque A. (2002) Communication between astrocytes and neurons: a
complex language. J. Physiol. Paris 96, 199-207.
Pfrieger F. W. (2002) Role of glia in synapse development. Curr. Opin. Neurobiol. 12,
486-490.
Ramos M., del Arco A., Pardo B., Martinez-Serrano A., Martinez-Morales J. R.,
Kobayashi K., Yasuda T., Bogonez E., Bovolenta P., Saheki T. and Satrustegui J.
(2003) Developmental changes in the Ca2+-regulated mitochondrial
aspartate-glutamate carrier aralar1 in brain and prominent expression in the
spinal cord. Brain Res. Dev. Brain Res. 143, 33-46.
Ransom C. B., Ransom B. R. and Sontheimer H. (2000) Activity-dependent
extracellular K+ accumulation in rat optic nerve: the role of glial and axonal
Na+ pumps. J. Physiol. 522, 427-442.
Sakai R., Cohen D. M., Henry J. F., Burrin D. G. and Reeds P. J. (2004) Leucine-
nitrogen metabolism in the brain of conscious rats: its role as a nitrogen
carrier in glutamate synthesis in glial and neuronal metabolic compartments.
J. Neurochem. 88, 612-622.
Schousboe A., Westergaard N., Waagepetersen H. S., Larsson O. M., Bakken I. J. and
Sonnewald U. (1997) Trafficking between glia and neurons of TCA cycle
intermediates and related metabolites. Glia 21, 99-105.
Shank R. P., Bennett G. S., Freytag S. O. and Campbell G. L. (1985) Pyruvate
carboxylase: an astrocyte-specific enzyme implicated in the replenishment of
amino acid neurotransmitter pools. Brain Res. 329, 364-367.
Sibson N. R., Mason G. F., Shen J., Cline G. W., Herskovits A. Z., Wall J. E., Behar K. L.,
Rothman D. L. and Shulman R. G. (2001) In vivo 13C NMR measurement of
Introduction
23
neurotransmitter glutamate cycling, anaplerosis and TCA cycle flux in rat brain
during. J. Neurochem. 76, 975-989.
Silver I. A. and Erecinska M. (1997) Energetic demands of the Na+/K+ ATPase in
mammalian astrocytes. Glia 21, 35-45.
Slezak M. and Pfrieger F. W. (2003) New roles for astrocytes: regulation of CNS
synaptogenesis. Trends Neurosci. 26, 531-535.
Tekkok S. B., Brown A. M., Westenbroek R., Pellerin L. and Ransom B. R. (2005) Transfer
of glycogen-derived lactate from astrocytes to axons via specific
monocarboxylate transporters supports mouse optic nerve activity. J.
Neurosci. Res. 81, 644-652.
Thompson R. F. (1993) The brain - a neuroscience primer. W. H. Freeman and
Company, New York.
Vannucci S. J., Maher F. and Simpson I. A. (1997) Glucose transporter proteins in
brain: delivery of glucose to neurons and glia. Glia 21, 2-21.
Waagepetersen H. S., Sonnewald U., Larsson O. M. and Schousboe A. (2000) A
possible role of alanine for ammonia transfer between astrocytes and
glutamatergic neurons. J. Neurochem. 75, 471-479.
Walz W. (1989) Role of glial cells in the regulation of the brain ion microenvironment.
Prog. Neurobiol. 33, 309-333.
Wiesinger H., Hamprecht B. and Dringen R. (1997) Metabolic pathways for glucose in
astrocytes. Glia 21, 22-34.
Xu Y., Oz G., LaNoue K. F., Keiger C. J., Berkich D. A., Gruetter R. and Hutson S. H.
(2004) Whole-brain glutamate metabolism evaluated by steady-state kinetics
using a double-isotope procedure: effects of gabapentin. J. Neurochem. 90,
1104-1116.
Yu A. C., Drejer J., Hertz L. and Schousboe A. (1983) Pyruvate carboxylase activity in
primary cultures of astrocytes and neurons. J. Neurochem. 41, 1484-1487.
Yudkoff M., Daikhin Y., Nelson D., Nissim I. and Erecinska M. (1996a) Neuronal
metabolism of branched-chain amino acids: flux through the
aminotransferase pathway in synaptosomes. J. Neurochem. 66, 2136-2145.
Yudkoff M., Daikhin Y., Grunstein L., Nissim I., Stern J. and Pleasure D. (1996b)
Astrocyte leucine metabolism: significance of branched-chain amino acid
transamination. J. Neurochem. 66, 378-385.

Chapter | 1
24
Zwingmann C., Richter-Landsberg C., Brand A. and Leibfritz D. (2000) NMR
spectroscopic study on the metabolic fate of [3-13C]alanine in astrocytes,
neurons, and cocultures: implications for glia-neuron interactions in
neurotransmitter metabolism. Glia 32, 286-303.
CHAPTER 2
Ethanol Effect on Central Metabolism of
Primary Astrocytes Studied by 13C-
and 31P-NMR Spectroscopy
This chapter is published in:
Fonseca L. L., Alves P. M., Carrondo M. J. T. & Santos H. (2001) J. Neurosci. Res. 66, 803-811.

Chapter | 2
26
Chapter | 2 | Contents
27, Abstract
28, Introduction
29, Experimental Procedures Materials Cell Culture Experiments with Monolayer Cultures In Vivo NMR Studies Experiments Performed in Spinner Vessels Spectroscopy Cell Quantification and Analytical Methods Determination of Flux Ratios from Isotopomer Analysis
35, Results Effects on Amino Acid Metabolism Effects on Glycolysis Effects on the Metabolic Fluxes Through Pyruvate Dehydrogenase and Pyruvate
Carboxylase Effects on the Pentose Phosphate Pathway Activity Effects on the Energy Level Effects on the Oxygen Consumption Rate Catabolism of [2-13C]ethanol
43, Discussion
46, Acknowledgements and Work Contributions
46, References
Effect of Ethanol on Primary Astrocytes Cultures
27
ABSTRACT
Nuclear magnetic resonance was used as the primary technique to investigate the
effect of ethanol (40, 80, and 160 mM) on the levels of high-energy phosphates,
glycolytic flux, anaplerotic and oxidative fluxes to the tricarboxylic acid (TCA) cycle,
the contribution of the pentose phosphate pathway (PPP), and the uptake and
release of amino acids on primary cultures of rat astrocytes. On line 31P-NMR
spectroscopy showed that long-term exposure to ethanol caused a drop in the
levels of ATP and phosphocreatine. The ratio between the fluxes through the
pyruvate dehydrogenase and pyruvate carboxylase reactions also decreased,
whereas the glycolytic flux and the ratio between formation of lactate and glucose
consumption increased when cells were exposed to acute doses of ethanol. Flux
through the pentose phosphate pathway was not affected. The uptake of cysteine
and the release of glutamine were stimulated by ethanol, whereas the release of
methionine was inhibited. Moreover, the fractional enrichment in serine was
enhanced. The changes in the amino acid metabolism are interpreted as a
response to oxidative stress induced by ethanol.

Chapter | 2
28
INTRODUCTION
The impact of ethanol on central nervous system development and metabolism has
become an increasingly important issue because of the detrimental effects of
alcoholism in modern societies. In particular, in adult humans, ethanol intake
causes behaviour changes that can go from mood alterations and anxiety relief
(10–30 mM), to impairment of memory and motor control (>30 mM), and to narcosis
(>80 mM) (Little, 1991). Chronic alcoholics are more tolerant and require higher
concentrations of ethanol to exhibit these effects. During pregnancy, ethanol has
deleterious consequences on the development of the foetal central nervous system
due to depression of neurogenesis, delayed and aberrant neuronal migration, and
altered formation of axonal and dendritic projections (Miller, 1992).
Cell membranes are particularly susceptible to ethanol toxicity. An immediate
consequence is the increased fluidity, which is counterbalanced by the long term
alteration of the lipid composition toward a higher cholesterol content and an
increased ratio of saturated to unsaturated fatty acids (Leonard, 1987). Furthermore,
almost all of the important physiopathological targets for ethanol in neural cells
appear to be specific membrane proteins such as, ion channels, transporters, and
neurotransmitter receptors (Diamond and Gordon, 1997).
Studies with cultures of astrocytes have shown that ethanol impairs cell proliferation
(Guerri et al., 1990) possibly by interfering with the stimulatory effect of trophic
factors (Luo and Miller, 1996). Moreover, cell swelling, alterations of the
cytoskeleton, increased production of reactive oxygen species, and depletion of
glutathione have been reported (Renau-Piqueras et al., 1989; Kimelberg et al.,
1993; Montoliu et al., 1995).
The interpretation of experimental data on brain metabolism with living animals is
complicated due not only to brain compartmentalization but also to interference of
other organs. In this study, we used primary cultures of rat astrocytes to assess the
effect of ethanol on different aspects of metabolism of this type of brain cells.
Although a large volume of data is available on the effect of ethanol on whole brain

Effect of Ethanol on Primary Astrocytes Cultures
29
physiology, very little is known at the level of the impact on major metabolic
pathways of individual nerve cell types (Guerri and Renau-Piqueras, 1997).
Nuclear magnetic resonance (NMR) spectroscopy comprises a very broad range of
powerful techniques that allow the study of metabolism directly in living cells
(Gadian, 1995). It is possible to perform interleaved acquisition of data from
different nuclei in the same sample, reducing the experimental variability and
enabling the probing of complementary aspects of cell physiology. In particular, in
the case of 13C-NMR, the isotopomer pattern analysis of metabolites enables the
assessment of metabolic flux ratios through different and even competing pathways
(Lapidot and Gopher, 1994; Bachelard, 1998; Alves et al., 2000b). The inherent low
sensitivity of this technique can be overcome by the use of high cell densities. For
this purpose, various cell immobilization techniques can be applied that allow
metabolic events to be monitored from several hours up to a few days (Alves et al.,
1996b; Barbotin et al., 2001). An experimental set-up optimized in our group
enabled us to monitor on line the energetic status of primary astrocytes and neurons
when subjected to several metabolic insults (Alves et al., 2000a).
In this study the same methodology was used to assess the effects of acute doses of
ethanol on the metabolism of rat cortical astrocytes, namely by examining the
levels of high-energy phosphates, glycolytic flux, anaplerotic and oxidative fluxes to
the tricarboxylic acid (TCA) cycle, the contribution of the pentose phosphate
pathway (PPP), and uptake and release of amino acids.
EXPERIMENTAL PROCEDURES
Materials
Dulbecco’s modified Eagle’s medium (DMEM), foetal bovine serum (FBS), phosphate-
buffered saline (PBS) and trypsin-EDTA were purchased from GIBCO (Glasgow, UK).
The 13C labelled glucose and ethanol were from Isomed (Madrid, Spain). Culture
dishes and flasks were obtained from Nunc (Roskilde, Denmark). Matrigel solution
was from Serva (Heidelberg, Germany). CultiSpher S microcarriers were a generous
gift from Dr. Kjell Nilsson (Percell, Lund, Sweden). Kits for analytical determinations

Chapter | 2
30
were from Boehringer-Mannheim Biochemicals (Germany). Other chemicals were of
the purest grade available from regular commercial sources.
Cell Culture
Primary cultures of astrocytes were prepared from 1–2-day-old Wistar rats as
described before (Richter-Landsberg and Besser, 1994; Alves et al., 1996a). After
4 weeks in culture, cells were either subcultured in 15 cm dishes or immobilized in
300 mm diameter BMG threads according to methodologies previously described
(Alves et al., 1996a) or in CultiSpher microcarriers as described below. In every case
cells were kept for another 5 days in the incubator.
Experiments with Monolayer Cultures
These experiments were designed to assess the effect of ethanol (final
concentration 40, 80, and 160 mM) on glucose and amino acid metabolism.
Confluent monolayers of astrocytes were used. The medium was removed, cells
were washed once with PBS, and new medium was added (DMEM containing
10% FBS, 4 mM glutamine, 5 mM of 13C-labeled glucose, and different
concentrations of ethanol). Experiments were performed with [1-13C]glucose,
[2-13C]glucose or [U-13C6]glucose.
Due to the volatile nature of ethanol, culture dishes were placed in sealed
containers (Luo and Miller, 1996). First, the bottom of each plastic container was
covered with 400 mL of a solution containing phosphoric acid (80 mM final
concentration) and ethanol at a concentration identical to that of the medium
present in the culture dishes. Controls without ethanol were also prepared. To
generate a 7% CO2 atmosphere, 1.4 g of sodium carbonate was added
immediately before sealing the containers. Cell cultures were incubated at 37°C
different periods of time (4 and 24 hours for the experiments with 40 mM ethanol, 5,
10, 15, and 36 hours for the experiments with 80 mM ethanol, and 36 hours for the
experiments with 160 mM ethanol). At the end of each incubation period, the
medium from each dish was collected, an aliquot saved for measurement of
glucose, lactate content, and LDH (L-lactate dehydrogenase, EC 1.1.1.27) activity,
and the remaining medium was lyophilized. Cells were washed twice with ice-cold

Effect of Ethanol on Primary Astrocytes Cultures
31
solution of NaCl (9 g/L), dishes were placed in liquid nitrogen and 1 mL of cold 7%
(v/v) perchloric acid was added to each plate. The resulting mixture was scraped
off, the contents from four dishes were pooled and centrifuged (4,000 × g, 10 min,
4°C). The pellets were treated overnight with 0.1 M NaOH and the protein content
was determined using the Pierce protein assay. The supernatants were neutralized
and centrifuged and the resulting supernatant was lyophilized. For NMR
spectroscopy analysis, the residues of lyophilized media and cell extracts were
dissolved in D2O containing 0.1% (v/v) dioxane, used as an internal concentration
standard. Each experiment was repeated two or three times. Aliquots from some of
these samples were used for amino acid quantification.
In Vivo NMR Studies
For in vivo NMR experiments astrocytes immobilized in BMG threads were transferred
to a 10 mm NMR tube fitted with a perfusion insert (Alves et al., 1996a; Flögel et al.,
1994). Typical amounts of biomass corresponded to 100 mg DNA per experiment.
Cells were perfused at 1.5 mL/min with DMEM containing 0.5% FBS and 5 mM
[1-13C]glucose, at 37°C and continuously gassed with 95% O2/5% CO2 (Fig. 2.1).
SOS
Detection zone
100 mL vessel
95% O25% CO2
T
1.5 ml.min-1
Immobilized cells
SOS
Detection zone
100 mL vessel
95% O25% CO2
T
1.5 ml.min-1
Immobilized cells
Figure 2.1 – Experimental set up for in vivo NMR analysis of astrocytes. Cells immobilized in BMG threads were placed in a 10 mm NMR tube and perfused with medium at a rate of 1.5 mL/min. The medium was maintained at 37ºC and continuously gassed with a mixture of 95% O2 and 5% CO2.
Chapter | 2
32
Ethanol was added to the perfusion medium to obtain the desired final
concentration and supplements were added whenever necessary to compensate
for ethanol evaporation. In all the experiments 13C- and 31P-NMR spectra were
acquired alternately before and after ethanol addition. Each experiment was
repeated twice, using independent cell batches. 13C-NMR was also used to
evaluate ethanol metabolism. For this purpose, DMEM containing 0.5% FBS, 40 mM
[2-13C]ethanol and 5 mM glucose was used for cell perfusion during ≈24 hours. The
ethanol concentration in the perfusion medium was determined using the area of
the C2 resonance of ethanol calibrated with high-performance liquid
chromatography (HPLC) measurements.
Experiments Performed in Spinner Vessels
To determine oxygen uptake and perform long-term (up to 72 hours) incubations
with ethanol, astrocytes were immobilized in CultiSpher S microcarriers and grown in
spinner vessels with DMEM containing 10% FBS. Spinners were inoculated with
3×10⁷ cells and 3 g/L of microcarriers. Cells were allowed to attach for 2 hours,
without agitation. After this time, agitation was started at low speed (40 rpm) and
24 hours later speed was increased to 50 rpm. Spinner vessels were kept in the
incubator for 5–7 days, during which 50% of the culture medium was changed every
48 hours. Experiments were performed with DMEM containing 10% FBS, 5 mM
glucose and 80 mM ethanol. At given time points, samples with or without beads
were taken and analyzed for oxygen uptake or by 13C-NMR. To assess the
metabolism of ethanol by 13C-NMR, [2-13C]ethanol was used.
Spectroscopy
31P- and 13C-NMR spectra of astrocytes immobilized in BMG threads were acquired
with a quadruple nuclei probe head (10 mm diameter) in a Bruker DRX500 operating
at a frequency of 202.45 MHz and 125.77 MHz, respectively. Typically, 31P spectra
were acquired with 500 transients, a 66° flip angle, repetition time 2.1 sec, spectral
width 9.0 kHz, data size 8 K; data were transformed using 20 Hz line broadening.
Phosphocreatine and NTP in each experiment were estimated from the peak areas
of PCr and γ-NTP and expressed as percentage of control conditions. Extracellular
Effect of Ethanol on Primary Astrocytes Cultures
33
and intracellular pH values were calculated from the chemical shift of inorganic
phosphate (Pi) relative to phosphocreatine (PCr) at 0 ppm. Curves of the chemical
shift vs. pH were obtained with DMEM at 37°C. 13C spectra were acquired with 1,024
transients, a 60° flip angle, repetition time 1.54 sec and proton decoupling with
wide-band alternating phase low-power technique for zero-residue splitting
sequence (WALTZ). Data were processed with 10 Hz line broadening. Chemical shifts
were referenced to the C1 signal of β-D-glucose at 96.8 ppm.
Glucose and lactate concentrations in the perfusion medium were quantified using
enzyme kits in samples collected at several time points. These values were used to
convert the integrated areas of the peaks to concentrations. Proton decoupled
13C-NMR spectra of lyophilized culture medium samples and cellular extracts (pH
7.2) were acquired with 40 K data points using a 60° pulse angle and 31 kHz
spectral width. Proton decoupling was applied during the acquisition using the
WALTZ sequence. The total recycle delay and number of transients were 20.7 sec
and 4,096. Spectra were recorded at a temperature of 300 K. Chemical shifts were
reported relative to dioxane at 66.98 ppm. Assignments were made by comparison
with chemical shifts found in the literature for metabolic intermediates (Cerdan et
al., 1990; Hassel et al., 1994). The total amount of 13C under a particular resonance
was calculated by integration of the peaks and whenever necessary, with
application of deconvolution routines. Dioxane was used as an internal
concentration standard. Spin relaxation was examined using up to 31 sec of recycle
delay and determined to be 98% for carboxyl carbons with the selected acquisition
conditions. The isotopic enrichments were determined as described earlier, after
evaluation of the total amounts of each metabolite (Badar-Goffer et al., 1990).
Cell Quantification and Analytical Methods
The extent of cell lysis was assessed by determination of LDH released to the
medium (Vassault, 1983). Total protein was determined using kit 23220 from Pierce
(Rockford, IL). Glucose, lactate, glutamate, and glutamine were quantified in the
culture medium using enzymatic assays from Boehringer-Mannheim Biochemicals
(Germany): kits 716251, 139084, 139092 without and with asparaginase,
respectively. Complete analysis of amino acids composition was done using the

Chapter | 2
34
Pico-Tag (Waters) method. Amino acids were derivatized by the phenyl-
isothiocyanate method and quantified by HPLC. The Pico-Tag system consisted of a
Nova-Pak C18 column (WAT 011695), a Waters 510 pump, an automatic injector
Waters 717 and a tunable absorbance detector 486. Data acquisition was
performed on a PC using software from Millenium.
DNA quantification was used to evaluate the amount of cells in each experiment
whenever protein measurements were unreliable due to the proteinic nature of gel
threads and microcarriers. Cells were washed with PBS, incubated in water for
30 min at 37°C and disrupted with three freeze-thaw cycles in liquid nitrogen. DNA
was quantified with a method involving Hoechst 33258 staining (Rago et al., 1990).
A linear correlation between DNA and protein contents was observed using
monolayer cultures and the conversion factor was 26.1±1.7 mg of protein per μg of
DNA.
Ethanol was quantified by HPLC using a Shodex Sugar SH 1011 column from Waters
at 50°C, sulfuric acid (0.01 M) as mobile phase. A linear correlation was found
between the HPLC areas and the ethanol concentrations allowing for the calibration
of the 13C-NMR data.
Oxygen uptake was measured using a Clark-type electrode in a stirred temperature
controlled chamber. All measurements were performed after calibration with water
and medium, using nitrogen and air for 0% and 100% oxygen saturation,
respectively. Results were handled assuming a molar concentration of dissolved
oxygen at 37°C (assay temperature) of 214 μM.
Determination of Flux Ratios from Isotopomer Analysis
The ratio between pyruvate dehydrogenase (PDH, pyruvate dehydrogenase
(lipoamide) complex, EC 1.2.4.1, EC 2.3.1.12, EC 1.8.1.4) and pyruvate carboxylase
(PC, pyruvate carboxylase, EC 6.4.1.1) fluxes were evaluated by the ratio of the
following glutamine isotopomers (Lapidot and Gopher, 1994):
[ ] [ ][ ] [ ]2
133
133
132
13
C2,3C1,2,3C3,4,5C4,5
−+−−+−
(Eq 2.1)
Effect of Ethanol on Primary Astrocytes Cultures
35
The ratio between fluxes via the pentose phosphate pathway and glycolysis was
determined as (Mancuso et al., 1994):
[ ][ ]lactate C22
lactate C1513
13
−×−×
(Eq 2.2)
RESULTS
To evaluate the effect of ethanol on astrocytic metabolism several biochemical
parameters were monitored: glucose consumption and lactate production rates,
lactate to glucose ratio, ATP and PCr levels, intracellular pH, protein content, and
protein to DNA ratio. Preliminary experiments showed that 24 hours exposure to 40
mM ethanol had no influence on these biochemical parameters when compared to
controls (data not shown); therefore, results for 80 and 160 mM ethanol
concentrations are reported here.
Effects on Amino Acid Metabolism
Analysis of the lyophilized medium resulting from 5–15 hours incubations of astrocyte
monolayer cultures with [1-13C]glucose showed that 80 mM ethanol induced the
uptake of cysteine, inhibited the release of methionine and increased the fractional
enrichment on C3 of serine without changing significantly the release of this amino
acid (Fig. 2.2). Although no notable differences were found in the labelling patterns
of glutamine in cultures exposed to 80 mM ethanol for more than 5 hours, the
amount of this amino acid in the culture medium increased by approximately 50%,
relative to the control cultures, at the end of a 15 hours exposure. Uptake and
release of other amino acids were not affected.
Effects on Glycolysis
Long exposure times (36 hours) and high ethanol concentrations (80 mM and
160 mM) were also imposed using monolayer cultures of astrocytes. The labelled
substrate ([U-13C]glucose or [2-13C]glucose) was supplied at time 24 hours after the
start of the incubation with ethanol so that potential alterations on astrocytic
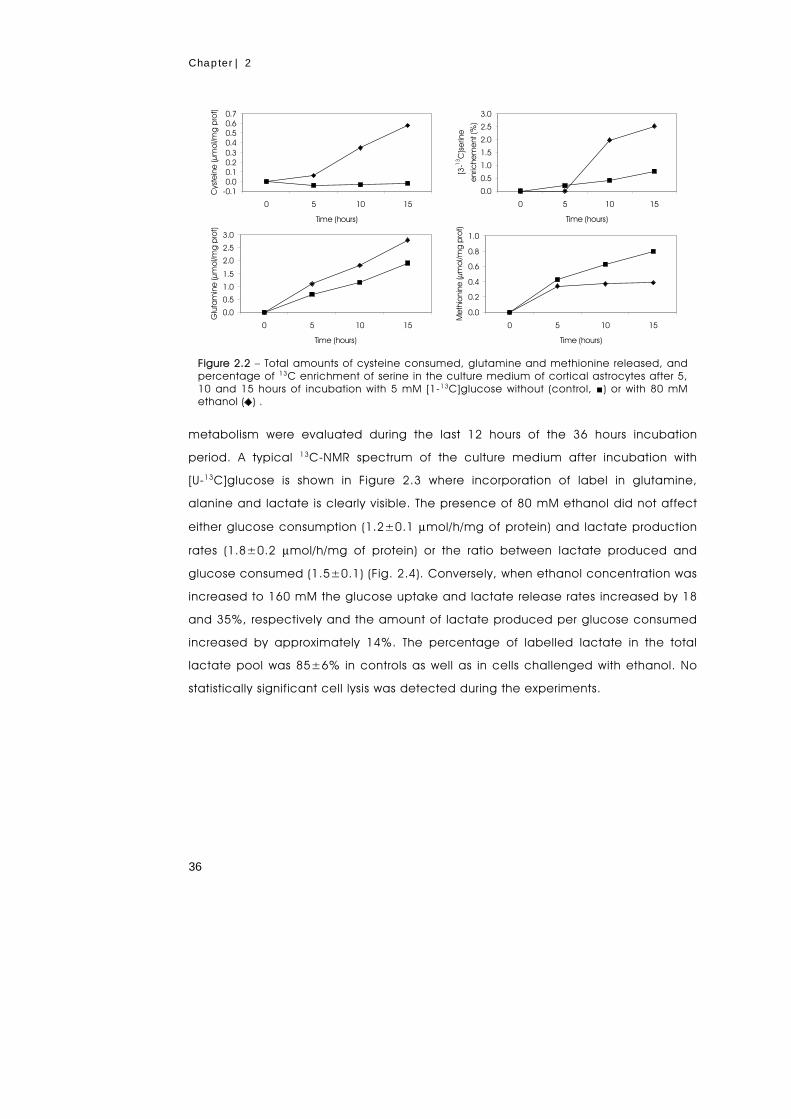
Chapter | 2
36
metabolism were evaluated during the last 12 hours of the 36 hours incubation
period. A typical 13C-NMR spectrum of the culture medium after incubation with
[U-13C]glucose is shown in Figure 2.3 where incorporation of label in glutamine,
alanine and lactate is clearly visible. The presence of 80 mM ethanol did not affect
either glucose consumption (1.2±0.1 μmol/h/mg of protein) and lactate production
rates (1.8±0.2 μmol/h/mg of protein) or the ratio between lactate produced and
glucose consumed (1.5±0.1) (Fig. 2.4). Conversely, when ethanol concentration was
increased to 160 mM the glucose uptake and lactate release rates increased by 18
and 35%, respectively and the amount of lactate produced per glucose consumed
increased by approximately 14%. The percentage of labelled lactate in the total
lactate pool was 85±6% in controls as well as in cells challenged with ethanol. No
statistically significant cell lysis was detected during the experiments.
-0.10.00.10.20.30.40.50.60.7
0 5 10 15
Time (hours)C
yste
ine
(μm
ol/m
g p
rot)
0.0
0.5
1.0
1.5
2.0
2.5
3.0
0 5 10 15
Time (hours)
[3-1
3 C]s
erin
e
enric
hem
ent
(%)
0.0
0.5
1.0
1.5
2.0
2.5
3.0
0 5 10 15
Time (hours)
Glu
tam
ine
(μm
ol/m
g pr
ot)
0.0
0.2
0.4
0.6
0.8
1.0
0 5 10 15
Time (hours)
Met
hion
ine
(μm
ol/m
g pr
ot)
Figure 2.2 – Total amounts of cysteine consumed, glutamine and methionine released, and percentage of 13C enrichment of serine in the culture medium of cortical astrocytes after 5, 10 and 15 hours of incubation with 5 mM [1-13C]glucose without (control, ■) or with 80 mM ethanol ( ) .
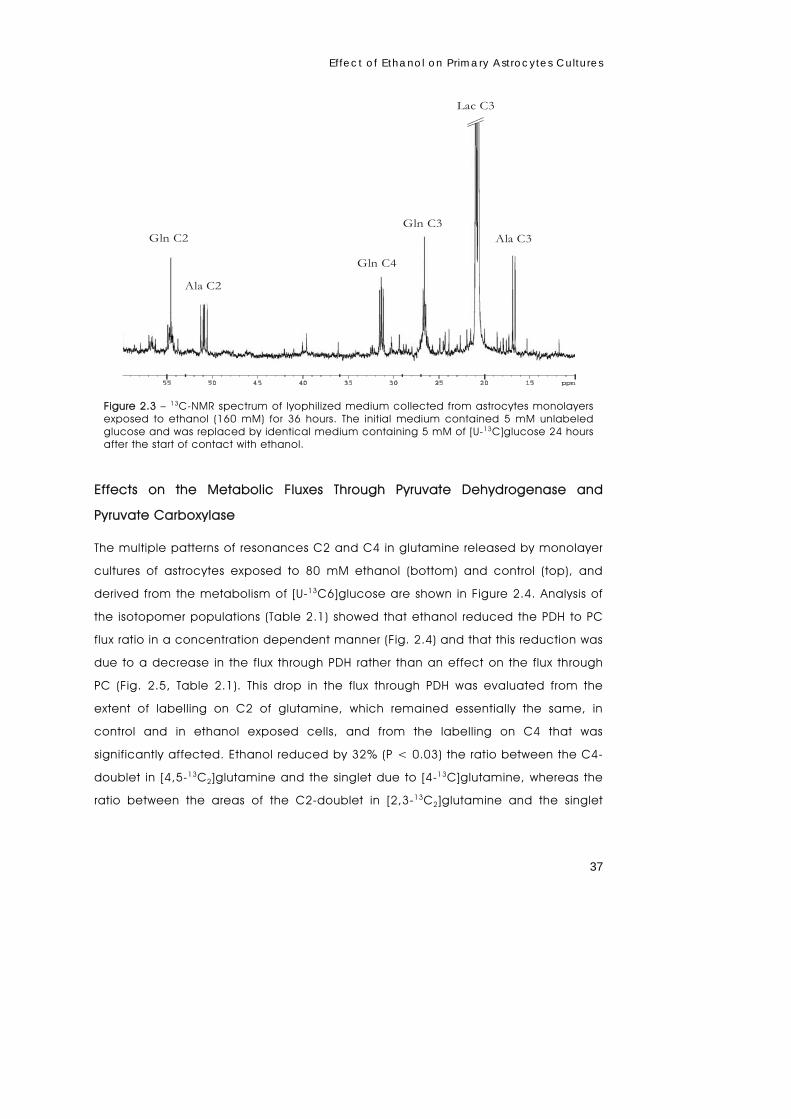
Effect of Ethanol on Primary Astrocytes Cultures
37
Effects on the Metabolic Fluxes Through Pyruvate Dehydrogenase and
Pyruvate Carboxylase
The multiple patterns of resonances C2 and C4 in glutamine released by monolayer
cultures of astrocytes exposed to 80 mM ethanol (bottom) and control (top), and
derived from the metabolism of [U-13C6]glucose are shown in Figure 2.4. Analysis of
the isotopomer populations (Table 2.1) showed that ethanol reduced the PDH to PC
flux ratio in a concentration dependent manner (Fig. 2.4) and that this reduction was
due to a decrease in the flux through PDH rather than an effect on the flux through
PC (Fig. 2.5, Table 2.1). This drop in the flux through PDH was evaluated from the
extent of labelling on C2 of glutamine, which remained essentially the same, in
control and in ethanol exposed cells, and from the labelling on C4 that was
significantly affected. Ethanol reduced by 32% (P < 0.03) the ratio between the C4-
doublet in [4,5-13C2]glutamine and the singlet due to [4-13C]glutamine, whereas the
ratio between the areas of the C2-doublet in [2,3-13C2]glutamine and the singlet
Lac C3
Ala C2
Gln C2 Ala C3
Gln C4
Gln C3
Figure 2.3 – 13C-NMR spectrum of lyophilized medium collected from astrocytes monolayers exposed to ethanol (160 mM) for 36 hours. The initial medium contained 5 mM unlabeled glucose and was replaced by identical medium containing 5 mM of [U-13C]glucose 24 hours after the start of contact with ethanol.

Chapter | 2
38
due to [2-13C]glutamine was reduced by 13% (P > 0.8). In control conditions the flux
ratio between PDH and PC was approximately 2.3.
Effects on the Pentose Phosphate Pathway Activity
The analysis of the labelling pattern in lactate derived from the metabolism of
[2-13C]glucose showed that the PPP activity relative to glycolysis remained within the
control levels of 4.5±1.0% when monolayer cultures of astrocytes were exposed to
80 mM ethanol for 36 hours.
Table 2.1 – Isotopomer populations (nmol/mg protein) of individual carbons of glutamine released by cortical astrocytes (36 hours exposure to ethanol 160 mM or to control conditions). The initial medium contained 5 mM unlabeled glucose and 24-hours after incubation with ethanol it was replaced by identical medium containing 5 mM of [U-13C]glucose.
Glutamine Isotopomers
Control Ethanol
2-13C 46 40 2,3-13C2 124 126 1,2-13C2 80 91 1,2,3-13C3 42 46 4-13C 14 16 4,5-13C2 329 276 3,4-13C2 0 0 3,4,5-13C3 110 61
****
** * **
***
0%20%40%60%80%
100%120%140%160%
Glucose consumptionrate
Lactate productionrate
Lac/Glc PDH/PC
Figure 2.4 – Ethanol effects on glucose consumption rate, lactate production rate, glucose to lactate ratio and pyruvate dehydrogenase to pyruvate carboxylase flux ratio determined in monolayers cultures of astrocytes. Values are relative to the respective controls assumed to be 100. * P<0.001; **P<0.01; ***P<0.04; ****P>0.1. Bar colour code White, control; grey, 80 mM ethanol; black, 160 mM ethanol.
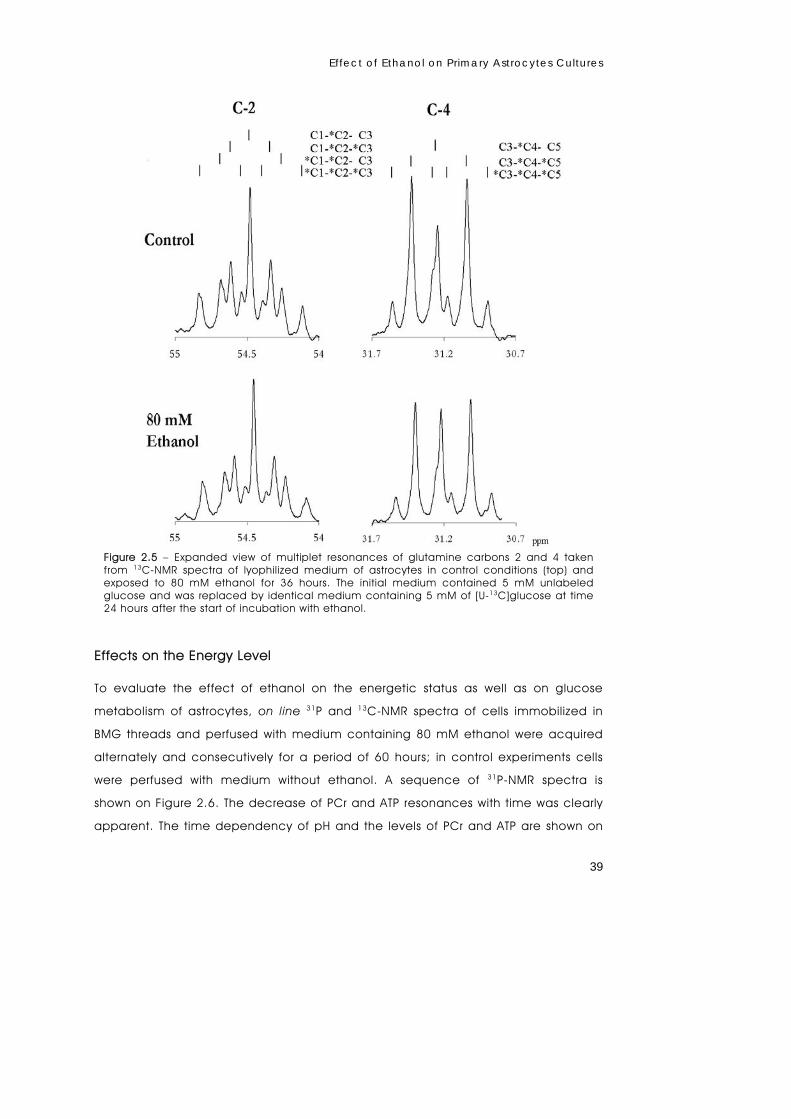
Effect of Ethanol on Primary Astrocytes Cultures
39
Effects on the Energy Level
To evaluate the effect of ethanol on the energetic status as well as on glucose
metabolism of astrocytes, on line 31P and 13C-NMR spectra of cells immobilized in
BMG threads and perfused with medium containing 80 mM ethanol were acquired
alternately and consecutively for a period of 60 hours; in control experiments cells
were perfused with medium without ethanol. A sequence of 31P-NMR spectra is
shown on Figure 2.6. The decrease of PCr and ATP resonances with time was clearly
apparent. The time dependency of pH and the levels of PCr and ATP are shown on
Figure 2.5 – Expanded view of multiplet resonances of glutamine carbons 2 and 4 taken from 13C-NMR spectra of lyophilized medium of astrocytes in control conditions (top) and exposed to 80 mM ethanol for 36 hours. The initial medium contained 5 mM unlabeled glucose and was replaced by identical medium containing 5 mM of [U-13C]glucose at time 24 hours after the start of incubation with ethanol.

Chapter | 2
40
Figure 2.7. The level of phosphocreatine decreased steadily (1.0±0.1% per hour)
whereas ATP remained constant for about 18 hours, dropping thereafter at a rate of
1.2±0.2% per hour. The addition of ethanol did not affect the intracellular pH, which
was approximately 7.2.
The increase of phosphatidylcholine and phosphatidylethanolamine (resonances
at 6.4 and 6.8 ppm, respectively) observed during the first 24 hours could not be
definitely correlated with the presence of ethanol because this trend was not
apparent in duplicates of this experiment. The glucose uptake rate and lactate
production were evaluated in the same cells using on line 13C-NMR and 5 mM
[1-13C]glucose in the perfusion medium, (Fig. 2.8). For the period of time studied (up
NTP
PCrPME
Pi (ext)
Pi (int)
0 -4 -848 -16-12 ppm
b
a
c
d
Figure 2.6 – Effect of 80 mM ethanol on the high-energy phosphate compounds of astrocytes immobilised in BMG threads. 31P-NMR spectra were obtained before (a), 24 h (b), 48 h (c) and 60 h (d) after addition of 80 mM ethanol. Assignments: PME, phosphomonoesters; Pi(int), intracellular inorganic phosphate; Pi(ext), extracellular inorganic phosphate; PCr, phosphocreatine; NTP, nucleoside triphosphate.
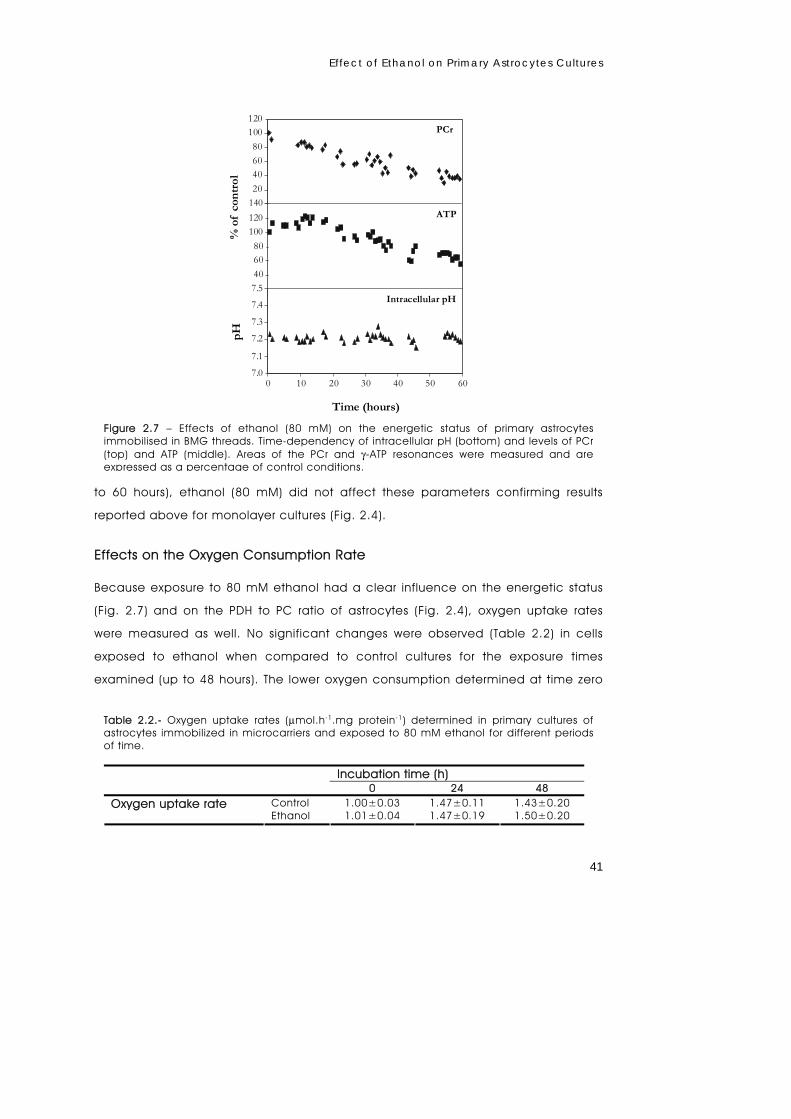
Effect of Ethanol on Primary Astrocytes Cultures
41
to 60 hours), ethanol (80 mM) did not affect these parameters confirming results
reported above for monolayer cultures (Fig. 2.4).
Effects on the Oxygen Consumption Rate
Because exposure to 80 mM ethanol had a clear influence on the energetic status
(Fig. 2.7) and on the PDH to PC ratio of astrocytes (Fig. 2.4), oxygen uptake rates
were measured as well. No significant changes were observed (Table 2.2) in cells
exposed to ethanol when compared to control cultures for the exposure times
examined (up to 48 hours). The lower oxygen consumption determined at time zero
20
406080
100120
PCr
40
6080
100120
140ATP
7.0
7.1
7.2
7.3
7.4
7.5
0 10 20 30 40 50 60
Intracellular pH
Time (hours)
pH%
of
cont
rol
Figure 2.7 – Effects of ethanol (80 mM) on the energetic status of primary astrocytes immobilised in BMG threads. Time-dependency of intracellular pH (bottom) and levels of PCr (top) and ATP (middle). Areas of the PCr and γ-ATP resonances were measured and are expressed as a percentage of control conditions.
Table 2.2.- Oxygen uptake rates (μmol.h-1.mg protein-1) determined in primary cultures of astrocytes immobilized in microcarriers and exposed to 80 mM ethanol for different periods of time.
Incubation time (h) 0 24 48
Control 1.00±0.03 1.47±0.11 1.43±0.20 Oxygen uptake rate Ethanol 1.01±0.04 1.47±0.19 1.50±0.20

Chapter | 2
42
for both control and ethanol exposed cells was interpreted as a metabolic response
to medium replacement.
Catabolism of [2-13C]ethanol
The capacity of astrocytes to metabolize ethanol was assessed by 13C-NMR using
[2-13C]ethanol in the culture medium. No detectable incorporation of label was
found in spectra acquired on line with cells immobilized in BMG threads and
perfused with medium containing 40 mM [2-13C]ethanol for a period of 24 hours.
Results obtained with cells cultured in microcarriers using spinner vessels also
showed that 80 mM [2-13C]ethanol was not metabolized while in contact with the
cells for up to 72 hours (data not shown). In these experiments ethanol metabolism
was evaluated based on the assumption that any metabolized labelled ethanol ([2-
13C]ethanol) would lead to an increase in the 13C enrichment in the astrocytic end
products of metabolism.
Figure 2.8 – Sequence of 13C-NMR spectra of immobilized primary astrocytes, exposed to ethanol (80 mM). Cells were supplied with two pulses of [1-13C]glucose (at 2.2h and 12.3h) and ethanol (3.2h). In Yellow is show the build up of labelled 13C in the glycogen pool, in blue consumption of the glucose, in red the production of [3-13C]lactate and in green the level of ethanol (natural abundance).
Effect of Ethanol on Primary Astrocytes Cultures
43
DISCUSSION
The effect of ethanol on astrocytes is a very important issue, because these cells are
responsible not only for the normal development of the central nervous system but
also for the maintenance of normal neuronal physiology and survival (Guerri and
Renau-Piqueras, 1997). At concentrations up to 40 mM, and for exposure times up
to 24 hours, ethanol showed no effect on astrocytic metabolism, as assessed by the
glucose consumption and lactate production rates, ATP and PCr levels, and
intracellular pH. Conversely, exposure to higher concentrations of ethanol (80 mM
for 15 hours) affected the amino acid metabolism of astrocytes. Ethanol stimulated
cysteine uptake, glutamine release, increased fractional enrichment on C3 of serine
and inhibited methionine release without affecting the release of either serine or
glycine (Fig. 2.2). Chronic ethanol consumption has been associated with an
increased content of cytochrome P450 2E1 (Montoliu et al., 1994; Tindberg and
Ingelman-Sundberg, 1996) and in the formation of reactive oxygen species
(Montoliu et al., 1994), which, in turn, can lead to the depletion of endogenous
antioxidants, such as glutathione (Montoliu et al., 1995). Under these circumstances
the synthesis of glutathione needs to be enhanced, which can only be
accomplished at the expense of glutamate, cysteine and glycine. According to
Dringen and Hamprecht (1996) astrocytes can use several amino acids as
precursors of these three amino acids. In particular, serine is used as a precursor for
glycine in glutathione synthesis. Therefore, the observed increase in the metabolic
flux through the serine pathway and in the cysteine uptake (Fig. 2.2) could be
associated with the ethanol-induced depletion of glutathione. On the other hand,
the inhibition in the release of methionine could be related to the function of this
amino acid as a donor of the SH group for the synthesis of cysteine. Although recent
studies suggest that methionine cannot be used by astrocytes as a cysteine
precursor for the synthesis of glutathione (Kranich et al., 1998), this observation, on
Chapter | 2
44
its own, does not preclude the presence of a metabolic pathway for the conversion
of methionine to cysteine.
Ethanol at 80 mM concentration slightly decreased the PDH to PC flux ratio, but a
higher ethanol concentration caused a clear flux reduction through the PDH
reaction. This result correlates with the observed increase in the ratio of lactate
produced/glucose consumed, suggesting a stimulation of the conversion of
pyruvate to lactate rather than to acetyl-CoA. It is known that in brain mitochondria,
the calcium steady-state concentration is maintained by an electrogenic uniporter
and a Na1/Ca21 antiporter (Rottenberg and Scarpa, 1974; Crompton et al., 1978).
Although the uniporter is not affected by pharmacological concentrations of
ethanol (Rottenberg and Marbach, 1991, 1992), the Na1/Ca21 antiporter is
stimulated, and thus, exposure to ethanol leads to the reduction of the steady-state
concentration of calcium in the mitochondrial matrix (Li et al., 1995). Because
several NAD-linked dehydrogenases of the mitochondrial matrix, namely, the PDH,
isocitrate dehydrogenase, and 2-oxoglutarate dehydrogenase are activated by
calcium (Hansford, 1985; Mc-Cormack et al., 1990), it is possible that the observed
reduction of the PDH activity in vivo is a reflection of the activation by ethanol of the
Na1/ Ca21 antiporter and consequent reduction of brain mitochondrial calcium.
The depression of the PDH activity induced by ethanol is also accompanied by the
enhancement of glucose consumption and lactate release in an attempt to
maintain the cell energetic charge; however, the logical decrease of the oxygen
uptake rate was not observed for 80 mM ethanol and higher doses were not
examined for this purpose. It is conceivable that ethanol induced the expression of
enzymes such as cytochrome P450 2E1, capable of consuming oxygen. Also, it
should be noted, that only the metabolism of glucose and amino acids were
probed here, and potential effects on the metabolism of other substrates present in
the medium were not investigated. The PCr and ATP level in astrocytes was
considerably affected by the long-term exposure to ethanol, the observed
stimulation of glycolysis being insufficient to compensate for the higher energy
demand in the presence of this stressing agent. It is interesting to compare this
finding with the remarkable capacity showed by identical cultures of astrocytes to
maintain the levels of ATP and PCr when subjected to several hours under hypoxia

Effect of Ethanol on Primary Astrocytes Cultures
45
(Alves et al., 2000a). Mild conditions (40 mM ethanol, 5 hours), caused no significant
changes in the energetic status of primary astrocytic cultures. Preliminary results
obtained for primary cultures of cortical neurons also showed no effects on the
energetic status when these cells were subjected to 80 mM of ethanol up to
15 hours (data not shown). Denays et al. (1993), however, reported a small transient
increase in the PCr level in rat brain 60–130 min after injection of a single dose of
ethanol (equivalent to 21 mM of ethanol in the blood). This discrepancy may be
merely due to the different experimental models used in the two studies. It is
possible that the effect observed by those authors is not caused by phenomena at
the cellular level but at a higher level of hierarchy of the brain such as cell–cell
interactions (e.g., astrocyte–neuron) or organ interactions (e.g., liver– brain).
Interestingly, Desmoulin et al. (1987) reported ethanol effects similar to ours (drop in
ATP levels and maintenance of the intracellular pH) in livers of fed rats perfused with
70 mM of ethanol. Although there are reports of ethanol metabolism to
acetaldehyde by the catalase-H2O2 system in brain homogenate (Aragon et al.,
1992) and of conversion of ethanol to acetate in astrocytes (Wickramasinghe, 1987;
Montoliu et al., 1995), we failed to detect 13C-labeled species derived from
[2-13C]ethanol. Montoliu et al. (1995) showed that in astrocytes, ethanol induces the
expression of cytochrome P450 2E1 that uses ethanol as substrate (for review see
Lieber, 1997). It is likely that the sensitivity limitations of the NMR technique did not
allow for the detection of the low levels expected for eventual ethanol catabolites.
Also, it is worth mentioning that the effects of ethanol in vivo are not only due to the
presence of this substance, but also to the presence of the main catabolite,
acetaldehyde, which has been shown to reach concentrations of 50 μM in the
blood of humans after an intoxicating dose of ethanol (Majchrowicz and Mendelson,
1970; Westcott et al., 1980). In summary, high doses of ethanol caused stimulation
of the glycolytic flux, a depression of the flux to the TCA cycle via pyruvate
dehydrogenase and a drop in the energetic charge of astrocytes. Furthermore, the
alterations observed on amino acid release and uptake suggest an enhancement
of the glutathione demand, which is compatible with an ethanol-induced response
to oxidative stress.
Chapter | 2
46
ACKNOWLEDGEMENTS AND WORK CONTRIBUTIONS
I am grateful to Dr. Paula Chicau, ITQB, Oeiras for the amino acid determination.
REFERENCES
Alves P.M., Fonseca L.L., Peixoto C.C., Almeida A.C., Carrondo M.J.T., Santos H.
(2000a). NMR studies on energy metabolism of immobilized primary neurons
and astrocytes during hypoxia, ischemia and hypoglycemia. NMR Biomed.
13, 438–448.
Alves P.M., Nunes R., Zhang C., Maycock C.D., Sonnewald U., Carrondo M.J.T.,
Santos H. (2000b). Metabolism of [3-13C]malate in primary cultures of mouse
astrocytes. Dev. Neurosci. 22, 456–462.
Alves P.M., Flögel U., Brand A., Leibfritz D., Carrondo M.J.T., Santos H., Sonnewald U.
(1996a). Immobilization of primary astrocytes and neurons for on-line
monitoring of biochemical processes by NMR. Dev. Neurosci. 18, 478–483.
Alves P.M., Moreira J.L., Rodrigues J.M., Aunins J.G., Carrondo M.J.T. (1996b). Two-
dimensional vs. three-dimensional culture systems: effects on growth and
productivity of BHK cells. Biotechnol. Bioeng. 52, 429–432.
Aragon C.M., Rogan F., Amit Z. (1992). Ethanol metabolism in rat brain
homogenates by a catalase-H2O2 system. Biochem. Pharmacol. 44, 93–98.
Bachelard H. (1998). Landmarks in the application of 13C-magnetic resonance
spectroscopy to studies of neuronal/glial relationships. Dev. Neurosci. 20,
277–288.
Badar-Goffer R.S., Bachelard H.S., Morris P.G. (1990). Cerebral metabolism of
acetate and glucose studied by 13C-NMR spectroscopy. Biochem. J. 282,
133–139.
Barbotin J.N., Portais J.C., Alves P.M., Santos H. (2001). NMR and immobilized cells.
In: Wijffels R, editor. Immobilized cells. Springer lab manual. Springer-Verlag. p
123–138.
Effect of Ethanol on Primary Astrocytes Cultures
47
Cerdan S., Kunnecke B., Seeling J. (1990). Cerebral metabolism of [1,2-13C]acetate
as detected by in vivo and in vitro 13C NMR. J. Biol. Chem. 265, 12916 –
12926.
Crompton M., Moser R., Ludi H., Carafoli E. (1978). The interrelations between the
transport of sodium and calcium in mitochondria of various mammalian
tissues. Eur. J. Biochem. 82, 25–31.
Denays R., Chao S.L., Mathur-Devré R., Jeghers O., Frühling J., Noël P., Ham H.R.
(1993). Metabolic changes in the rat brain after acute and chronic ethanol
intoxication: a 31P-NMR spectroscopy study. Magn. Reson. Med. 29, 719 –723.
Desmoulin F., Cozzone P.J., Canioni P. (1987). Phosphorus-31 nuclear magnetic
resonance study of phosphorylated metabolites compartmentation,
intracellular pH and phosphorylation state during normoxia, hypoxia and
ethanol perfusion, in the perfused rat liver. Eur. J. Biochem. 162, 151–159.
Diamond I., Gordon A.S. (1997). Cellular and molecular neuroscience of alcoholism.
Physiol. Rev. 77, 1–20.
Dringen R., Hamprecht B. (1996). Glutathione content as an indicator for the
presence of metabolic pathways of amino acids in astroglial cultures. J.
Neurochem. 67, 1375–1381.
Flögel U., Willker W., Leibfritz D. (1994). Regulation of intracellular pH in neuronal and
glial tumor cells, studied by multinuclear NMR spectroscopy. NMR Biomed. 7,
157–166.
Gadian D.G. (1995). NMR and its applications to living systems. London: Oxford
University Press.
Guerri C., Renau-Piqueras J. (1997). Alcohol, astroglia, and brain development. Mol.
Neurobiol. 15, 65– 81.
Guerri C., Saez R., Sancho-Tello M., Martin de Aquilera E., Renau-Piqueras J. (1990).
Ethanol alters astrocyte development: a study of critical periods using primary
cultures. Neurochem. Res. 15, 559 –565.
Hansford R.G. (1985). Relation between mitochondrial calcium transport and control
of energy metabolism. Rev. Physiol. Biochem. Pharmacol. 102, 1–72.

Chapter | 2
48
Hassel B., Sonnewald U., Unsgard G., Fonnum F. (1994). NMR spectroscopy of
cultured astrocytes: effects of glutamine and the gliotoxin fluorocitrate. J.
Neurochem. 62, 2187–2194.
Kimelberg H.K., Cheema M., O’Connor E.R., Tong H., Goderie S.K., Rossman P.A.
(1993). Ethanol-induced aspartate and taurine release from primary astrocyte
cultures J. Neurochem. 60, 1682–1689.
Kranich O., Drigen R., Sandberg M., Hamprecht B. (1998). Utilization of cysteine and
cysteine precursors for the synthesis of glutathione in astroglial cultures:
preference for cystine. Glia 22, 11–18.
Lapidot A., Gopher A. (1994). Cerebral metabolic compartmentation. Estimation of
glucose flux via carboxylase/pyruvate dehydrogenase by 13C NMR isotopomer
analysis of D-[U-13C]glucose metabolites. J. Biol. Chem. 269, 27198 –27208.
Leonard B.E. (1987). Ethanol as a neurotoxin. Biochem. Pharmacol. 36, 2055–2059.
Li H.L., Moreno-Sanchez R., Rottenberg H. (1995). Alcohol inhibits the activation of
NAD-linked dehydrogenases by calcium in brain and heart mitochondria.
Biochim. Biophys. Acta 1236, 306 –316.
Lieber C.S. (1997). Cytochrome P-4502E1: its physiological and pathological role.
Physiol. Rev. 77, 517–544.
Little H.J. (1991). Mechanisms that may underlie the behavioral effects of ethanol.
Prog. Neurobiol. 36, 171–194.
Luo J., Miller M.W. (1996). Ethanol inhibits basic fibroblast growth factor mediated
proliferation of C6 astrocytoma cells. J. Neurochem. 67, 1448–1456.
Majchrowicz E., Mendelson J.H. (1970). Blood concentrations of acetaldehyde and
ethanol in chronic alcoholics. Science 168, 1100 –1102.
Mancuso A., Sharfstein S.T., Tucker S.N., Clark D.S., Blanch H.W. (1994). Examination
of primary metabolic pathways in a murine hybridoma with carbon-13 NMR
spectroscopy. Biotechnol. Bioeng. 44, 563–585.
McCormack J.G., Halestrap A.P., Denton R.M. (1990). Role of calcium ions in
regulation of mammalian intramitochondrial metabolism. Physiol. Rev. 70,
391– 425.
Miller M.W. (1992). The effects of prenatal exposure to ethanol on cell proliferation
and neuronal migration. In: Miller M, editor. Development of the central

Effect of Ethanol on Primary Astrocytes Cultures
49
nervous system: effects of alcohol and opiates. New York: Alan R. Liss. p 47–
69.
Montoliu C., Sancho-Tello M., Azorin I., Burgal M., Valles S., Renau-Piqueras J., Guerri
C. (1995). Ethanol increases cytochrome P4502E1 and induces oxidative stress
in astrocytes. J. Neurochem. 65, 2561–2570.
Montoliu C., Valles S, Renau-Piqueras J, Guerri C. (1994). Ethanol-induced oxygen
radical formation and lipid peroxidation in rat brain: effect of chronic alcohol
consumption. J. Neurochem. 63, 1855–1862.
Rago R., Mitchen J., Wilding G. (1990). DNA fluorometric assay in 96-well tissue
culture plates using Hoescht 33258 after cell lysis by freezing in distilled water.
Anal. Biochem. 191, 31–34.
Renau-Piqueras J., Zaragoza R., De Paz P., Baguena-Cervellera R., Megias L., Guerri
C. (1989). Effects of prolonged ethanol exposure on the glial fibrillary acidic
protein-containing intermediate filaments of astrocytes in primary culture: a
quantitative immunofluorescence and immunogold electron microscopic
study. J. Histochem. Cytochem. 37, 229 –240.
Richter-Landsberg C., Besser A. (1994). Effects of organotins on rat brain astrocytes
in culture. J. Neurochem. 63, 2202–2209.
Rottenberg H., Marbach M. (1991). Alcohol stimulates Na1/Ca21 exchange in brain
mitochondria. Life Sci. 48, 987–994.
Rottenberg H., Marbach M. (1992). The effect of alkanols on Ca21 transport in brain
mitochondria. Cell Calcium 13, 41– 47.
Rottenberg H., Scarpa A. (1974). Calcium uptake and membrane potential in
mitochondria. Biochemistry 13, 4811– 4817.
Tindberg N., Ingelman-Sundberg M. (1996). Expression, catalytic activity, and
inducibility of cytochrome P450 2E1 (CYP2E1) in the rat central nervous
system. J. Neurochem. 67, 2066 –2073.
Vassault A. (1983). Lactate dehydrogenase: UV-method with pyruvate and NADH. In:
Bergmeyer HU, Bergmeyer J, Grassl M, editors. Methods of enzymatic analysis,
Vol. III. Weiheim: VerlagChemie. p 118–126.
Westcott J.Y., Weiner H., Shultz J., Myers R.D. (1980). In vivo acetaldehyde in the
brain of the rat treated with ethanol. Biochem. Pharmacol. 29, 411–417.
Chapter | 2
50
Wickramasinghe S.N. (1987). Neuroglial and neuroblastoma cell lines are capable of
metabolizing ethanol via an alcohol-dehydrogenase independent pathway.
Alcohol Clin. Exp. Res. 11, 234 –237.
CHAPTER 3
Cultures of Rat Astrocytes Challenged with
a Steady Supply of Glutamate: a New
Model to Study Flux Distribution in
the Glutamate-Glutamine Cycle
This chapter is published in:
Fonseca L. L., Monteiro M. A., Alves P. M., Carrondo M. J. T. & Santos H. (2005) Glia 51, 286-296.
Chapter | 3
52
Chapter | 3 | Contents
53, Abstract
54, Introduction
56, Experimental Procedures Cell Culture Glutaminase Reaction Metabolic Studies In Vivo NMR Studies Spectroscopy Glutamine Synthetase Quantification by Western Blot Cell Quantification and Analytical Methods Model for Data Analysis Statistics
62, Results Effect of Different Rates of Glutamate Supply Extracellular and Intracellular Profiles of Glutamate and Glutamine Effect of AOAA Effect of Ammonium Chloride Calculation of Metabolic Fluxes Relative Contributions of the Alternative Routes Directing Glutamate to the TCA Cycle Levels of Glutamine Synthetase by Immunoblotting Glucose Uptake and Lactate Release Levels of Phosphorylated Metabolites by in Vivo 31P NMR
70, Discussion
75, Acknowledgements and Work Contributions
75, References
Astrocytes Under a Steady Supply of Glutamate
53
ABSTRACT
Glutamate metabolism in astrocytes was studied using an experimental set-up that
simulates the role of neurons (glutamate producers and glutamine consumers) by
the addition of glutaminase to the culture medium. Thereby, a steady supply of
glutamate was imposed at the expense of glutamine, and the stress intensity was
manipulated by changing the glutaminase concentration. Glutamate supply rates in
the range 8 to 23 nmol/min/mg of protein were examined. When the glutamate
supply rate exceeded the uptake rate of this amino acid, a transient increase in the
extracellular concentration of glutamate was observed. In response to this stress, the
fluxes through the glutamate transporter and glutamine synthetase were
considerably increased and the extracellular concentration of glutamate was
eventually restored to a low level. The increased levels of glutamine synthetase were
demonstrated by immunoblotting analysis. The effect on glutamate metabolism of
the transaminase inhibitor, AOAA, and of NH4Cl was also investigated. The
accumulation of glutamate caused a concomitant reduction in the levels of
phosphocreatine, phosphoethanolamine and phosphocholine without affecting the
ATP pool. It was shown that glutamine synthetase is a key element in the control of
glutamate metabolism in astrocytic cultures. The metabolic fate of glutamate
depended greatly on the time of endurance to the challenge: in naive cells,
glutamate was primarily metabolized through the transaminase pathway, while in
well-adapted cells glutamate was converted almost exclusively through glutamine
synthetase.

Chapter | 3
54
INTRODUCTION
Glutamate is the main excitatory neurotransmitter in the mammalian central nervous
system (Fonnum, 1984). Synaptic glutamate concentration is determined by the
equilibrium between pre-synaptic release, diffusion, binding and uptake. When this
balance is pathologically shifted towards increasing glutamate concentrations,
neuronal cells die through a process of excitotoxicity, which is due to excessive or
prolonged activation of the receptors for this neurotransmitter (for review see (Doble,
1999)).
Astrocytes play a key role in the process of preventing neuronal cell death by
excitotoxicity. Glutamate is rapidly taken up by these cells due to the presence of
specific transporter proteins (GLAST and GLT-1) that couple the transport of
glutamate to the translocation of sodium and potassium at the expense of their
transmembrane gradients (Gegelashvili and Schousboe, 1997). Intracellularly,
glutamate is converted to glutamine by glutamine synthetase (EC 6.3.1.2; GS)
(Norenberg and Martinez-Hernandez, 1979) or metabolised to α-ketoglutarate by the
action of glutamate dehydrogenase (EC 1.4.1.2; GDH) or one of the transaminases
(EC 1.6.1.X; TA). In addition, glutamate can be diverted to the synthesis of proteins
and glutathione.
Glutamine derived from glutamate is released by astrocytes, subsequently taken up
by neurons and converted back to glutamate. The glutamate-glutamine cycle plays
a very important physiological role since it allows for the maintenance of a low intra-
synaptic concentration of glutamate while enabling neurons to be supplied with the
metabolic precursor of this neurotransmitter in a harmless form. Given the lack of
anaplerotic enzymes needed for the de novo synthesis of glutamate in neurons,
glutamate must be converted to glutamine in astrocytes to prevent depletion of the
glutamate pool in the brain (Hertz, 2004).
Previous studies on glutamate metabolism have provided a wide range of values for
the ratio between the fluxes to glutamine (via glutamine synthetase) and to
α−ketoglutarate (via glutamate dehydrogenase and transaminases) (Westergaard et
al., 1995). For example, Farinelli and Nicklas (1992) found that 70% of the supplied
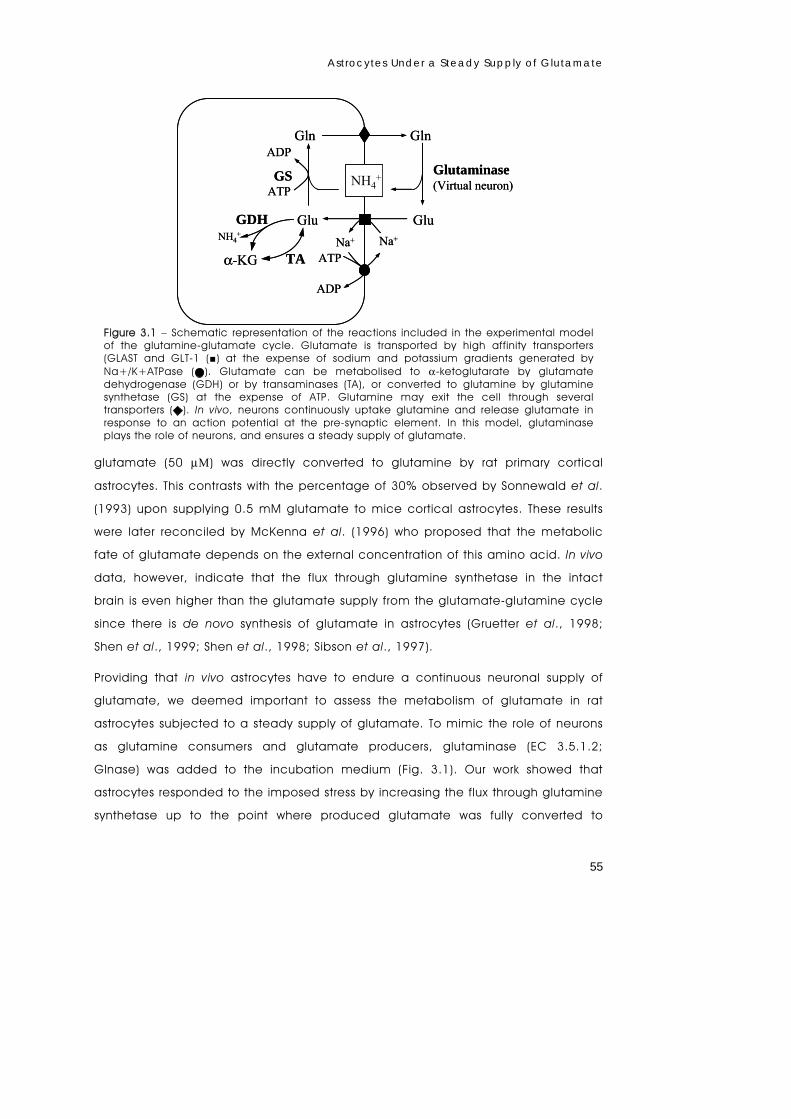
Astrocytes Under a Steady Supply of Glutamate
55
glutamate (50 μM) was directly converted to glutamine by rat primary cortical
astrocytes. This contrasts with the percentage of 30% observed by Sonnewald et al.
(1993) upon supplying 0.5 mM glutamate to mice cortical astrocytes. These results
were later reconciled by McKenna et al. (1996) who proposed that the metabolic
fate of glutamate depends on the external concentration of this amino acid. In vivo
data, however, indicate that the flux through glutamine synthetase in the intact
brain is even higher than the glutamate supply from the glutamate-glutamine cycle
since there is de novo synthesis of glutamate in astrocytes (Gruetter et al., 1998;
Shen et al., 1999; Shen et al., 1998; Sibson et al., 1997).
Providing that in vivo astrocytes have to endure a continuous neuronal supply of
glutamate, we deemed important to assess the metabolism of glutamate in rat
astrocytes subjected to a steady supply of glutamate. To mimic the role of neurons
as glutamine consumers and glutamate producers, glutaminase (EC 3.5.1.2;
Glnase) was added to the incubation medium (Fig. 3.1). Our work showed that
astrocytes responded to the imposed stress by increasing the flux through glutamine
synthetase up to the point where produced glutamate was fully converted to
GlnGln
GluGlu
GSATP
ADP
Na+Na+
ATP
ADP
Glutaminase(Virtual neuron)NH4
+
TA
GDH
α-KG
NH4+
GlnGln
GluGlu
GSATP
ADP
Na+Na+
ATP
ADP
Glutaminase(Virtual neuron)NH4
+NH4+
TA
GDH
α-KG
NH4+
Figure 3.1 – Schematic representation of the reactions included in the experimental model of the glutamine-glutamate cycle. Glutamate is transported by high affinity transporters (GLAST and GLT-1 (■) at the expense of sodium and potassium gradients generated by Na+/K+ATPase ( ). Glutamate can be metabolised to α-ketoglutarate by glutamate dehydrogenase (GDH) or by transaminases (TA), or converted to glutamine by glutamine synthetase (GS) at the expense of ATP. Glutamine may exit the cell through several transporters ( ). In vivo, neurons continuously uptake glutamine and release glutamate in response to an action potential at the pre-synaptic element. In this model, glutaminase plays the role of neurons, and ensures a steady supply of glutamate.
Chapter | 3
56
glutamine in steady state conditions. The fate of glutamate was highly dependent
on the time of exposure to glutamate. It is also shown that glutamate reduced the
cell energetic level and affected lipid metabolism.
EXPERIMENTAL PROCEDURES
Cell Culture
Primary cultures of astrocytes were prepared from 1- to 2-day-old Wistar rats as
described before (Richter-Landsberg and Besser, 1994). After 4 weeks in culture at
37ºC with 7% CO2 atmosphere, the cells were either subcultured in 15 cm culture
dishes (Nunc, Roskilde, Denmark) or immobilized in 300 μm diameter basement
membrane gel (BMG; Serva, Heidelberg, Germany) threads according to
methodologies described previously (Alves et al. 1996). In every case cells were
kept for another 5 days in the incubator under the conditions mentioned above.
Cells were cultured in DMEM (GIBCO, Glasgow, U.K.) with 10% FBS (GIBCO) and
100 U/mL of penicillin/streptomycin (GIBCO), which was changed twice per week.
Glutaminase Reaction
Glutaminase activity used throughout this work is a side reaction catalyzed by L-
asparaginase (EC 3.5.1.1; Roche Diagnostics GmbH, Mannheim, Germany). DMEM
does not contain asparagine and we verified that the rate of glutamate production
by this enzyme was proportional to the concentration of enzyme in DMEM containing
3-4 mM glutamine. Therefore, we are confident that the reaction catalysed in DMEM
upon addition of L-asparaginase is the hydrolysis of glutamine to glutamate and
ammonia. Hereafter this activity will be designated glutaminase.
Metabolic Studies
Incubations with glutaminase were performed in 15 cm culture dishes with 30 mL of
DMEM containing 10% FCS, 2 g/L of glucose and 100 U/mL of
penicillin/streptomycin. Glutaminase was added to obtain the desired rate of
glutamate supply (between 0.038 and 0.110 enzyme units) and in some experiments

Astrocytes Under a Steady Supply of Glutamate
57
1 mM aminooxyacetic acid (AOAA) or 10 mM of NH4Cl were added simultaneously
with glutaminase. Control experiments without addition of glutaminase were also
performed. Samples of the incubation medium (120 μL) were taken every 2 to
3 hours for the determination of external glutamate, glutamine, and glutamate
supply rate; the total volume withdrawn from each plate never exceeded 5% of the
initial volume of the plate. For the analysis of the intracellular content of glutamate
and glutamine, one plate was randomly selected at a given time point, the
supernatant was removed and the cells washed twice with a cold solution of NaCl
(9 g/L). The dishes were immediately placed in liquid nitrogen and the cells
extracted with ice-cold ethanol (70%). The extracts were centrifuged (12,000 g for
30 min at 4ºC), the supernatants saved and the pellets washed in ice-cold ethanol
(70%) and centrifuged again. Both supernatant solutions were pooled together and
freeze-dried. Solid residues were suspended in 500 μL of PBS and analysed for their
content in glutamate and glutamine. The pellets were boiled for a few minutes in 1
mL of 35 mM Tris (pH 6.8) with 2% SDS; to ensure complete protein dissolution 1 mL
of 35 mM Tris (pH 6.8) containing 8% ureia was added to each sample. Protein
solutions were used to determine the total protein content and to measure the levels
of glutamine synthetase by Western blot. Experiments were repeated at least three
times, using independent cell batches and yielding comparable metabolic profiles.
In Vivo NMR Studies
For in vivo NMR experiments, astrocytes immobilized in BMG threads were transferred
to a 10-mm NMR tube fitted with a perfusion insert (Alves et al., 1996; Flögel et al.,
1994). Typical amounts of biomass corresponded to 100 μg DNA per experiment.
Cells were perfused at 1.5 mL/min with DMEM containing 0.5 % FBS and 2 g/L of
glucose, at 37ºC and continuously gassed with 95%O2/5%CO2. After a period of
data acquisition under control conditions (approximately 12 hours), glutaminase was
added to obtain the desired rate of supply of glutamate. 31P NMR spectra were
subsequently acquired consecutively every 20 minutes up to approximately
48 hours. Each experiment was repeated twice with independent cell batches.
Chapter | 3
58
Spectroscopy
31P-NMR spectra of astrocytes immobilized in BMG threads were acquired with a
quadruple nuclei probe head (10-mm diameter) in a Bruker DRX500 operating at a
frequency of 202.45 MHz. A width at half-height of 15 Hz for the water signal could
be routinely obtained. Typically, 31P-NMR spectra were acquired with 512 transients,
a 66º flip angle, repetition time 2.1 s, spectral width 9.0 kHz, data size 8 K; data
were zero filled to 16 K and transformed using 20 Hz line broadening.
Phosphocreatine and ATP in each experiment were estimated from the peak areas
of PCr and γ-ATP and expressed as percentage of control conditions. Extracellular
and intracellular pH values were calculated from the chemical shift of inorganic
phosphate (Pi) relative to phosphocreatine at 0 ppm. Curves of the chemical shift
versus pH were obtained with DMEM at 37ºC.
Glutamine Synthetase Quantification by Western Blot
For SDS-PAGE, protein samples (10 μL) in 35 mM Tris with 1% SDS and 4 M urea were
mixed with the same volume of sample buffer (80 mM Tris HCl (pH 6.8) with 2% SDS,
10% glycerol, 0.1 M dithiothreitol and 0.001% bromophenol blue). SDS PAGE was
carried out on 8% polyacrylamine gels with a 3.8% stacking gel accordingly to
Laemmli (1970) for 1 hour in running buffer (25 mM Tris (pH 8.3) with 192 mM glycine
and 0.1% SDS) at 180 V and 14ºC. Protein transfer onto nitrocellulose membrane
(Amersham Biosciences, UK) was done using a semi-dry system (Bio-Rad) for 1 h at
2 mA/cm2, with all components imbibed in transfer buffer (25 mM Tris (pH 8.3) with
192 mM glycine and 20% methanol). Membranes were blocked with 5% (w/v) skim
milk powder (Merck) in TBS (0.05 M Tris (pH 8.0) with 0.138 M NaCl and 0.0027 M KCl,
Sigma) for 1 h following an incubation with 1:500 goat polyclonal IgG anti glutamine
synthetase (Santa Cruz Biotechnology, USA) in TBS with 0.2% Tween and 0.5% skim
milk powder over night. Finally the membranes were incubated with 1:5000 donkey
anti-goat IgG conjugated with horseradish peroxidase (Santa Cruz Biotechnology,
USA) in TBS with 0.2% Tween and 2% skim milk powder for 1 h. All incubations were
performed at room temperature with orbital agitation and between incubations the
membranes were washed 3 times with 0.2% Tween in TBS for 5 min. Detection was
performed with ECL plus Western Blotting Detection System (Amersham Biosciences,
Astrocytes Under a Steady Supply of Glutamate
59
UK) and the membranes were used to impress a photographic film (Kodak X-OMAT
LS, Sigma). Samples containing glutamine synthetase showed a band with an
apparent weight between 40 and 50 kDa, which was absent when the membranes
were not incubated with goat polyclonal IgG anti-glutamine synthetase.
Quantification was performed with an algorithm developed in our lab in MATLABTM
(The MathWorks, Inc) that numerically integrates band volume. The amount of
protein in a given band was expressed as the ratio between the respective volume
and the average volume of bands in control samples. Gel to gel variations were
accounted for by running in each gel a control (sample without addition of
glutaminase) and expressing the volume of each band relative to the volume of the
control sample in the same gel.
Cell Quantification and Analytical Methods
The extent of cell lysis during the experiments was assessed by determination of
lactate dehydrogenase (LDH, EC 1.1.1.27) released to the medium as previously
described (Vassault, 1983). The incubation of cells with glutaminase did not affect
the extent of LDH release. Total protein was determined using the kit 23220 from
Pierce (Rockford, Md, USA). Glutamate, glutamine, glucose and lactate were
quantified in the culture medium or in extracts using an YSI 2700 Select system (YSI
Life Sciences, USA) under the standard operation conditions advised by the supplier.
Glutamate and glutamine determinations were performed immediately after
sampling. Determination of the glutamate supply rate was performed by incubation
of the samples of culture medium at 37ºC and quantification of glutamate as a
function of time.
DNA quantification was used to evaluate the amount of cells when immobilized in
BMG threads since protein measurements were not reliable due to the
proteinaceous nature of the BMG. Cells were washed with PBS, incubated in water
for 30 minutes at 37ºC and disrupted with three freeze-thaw cycles in liquid
nitrogen. DNA was quantified according to previously described methods involving
Hoechst 33258 staining (Fonseca et al., 2001; Kissane and Robins, 1958; Rago et
al., 1990). A linear correlation between DNA and protein content was observed using
monolayer cultures: a ratio of 19.5 mg of protein per mg of DNA was obtained.

Chapter | 3
60
Model for Data Analysis
A mathematical model (Eq. 3.1-3.4) taking into account the reactions involved in
the metabolism of glutamate in astrocytes (Fig. 3.1) was developed to allow the
calculation of the relevant fluxes.
Glnase, GluT, GS, and GlnT represent the fluxes through glutaminase, glutamate
transporter, glutamine synthetase, and glutamine transporter, respectively. GDHTA
designates the flux of glutamate towards α-ketoglutarate (TCA cycle). The time
courses for glutamate and glutamine (intra and extracellular pools) and the
glutamate supply rate (glutaminase activity) were fitted to polynomial functions with
the Spline Toolbox supplied with MATLABTM using the least-square method with up to 2
knots. First-order time derivatives of these functions were used to replace the
derivatives in equations 3.1-3.4, thus rendering an analytical solution to the given
set of equations as functions of the 4 variables (GluT, GS, GlnT, and GDHTA).

Astrocytes Under a Steady Supply of Glutamate
61
Simulations of the ammonium concentration were performed using the above-
calculated fluxes. Three different scenarios, in respect to the set of reactions
assumed to be involved in the metabolism of ammonium, were tested. In hypothesis
1, glutaminase is the only enzyme involved (Eq. 3.5); hypothesis 2 considers
glutaminase and glutamine synthetase (Eq. 3.6); and hypothesis 3 considers
glutaminase, glutamine synthetase, and glutamate dehydrogenase (Eq. 3.7). The
concentrations determined within these three scenarios were compared with the
experimental results. Throughout the manuscript, the expression “glutamate supply
rate” refers to the activity of glutaminase divided by the total biomass, hence this
“rate” has the units of a metabolic flux.
Statistics
Two-tailed Student’s t-tests, assuming unequal variances, were used to determine
whether there were any significant differences between groups of samples under
different experimental conditions. A level of p < 0.02 was considered statistically
significant.
0.0
1.0
2.0
3.0
4.0
-20 -10 0 10 20 30 40 50
Time (hours)
[Gln
] (m
M)
0.0
0.2
0.4
0.6
0.8
1.0
[Glu
] (m
M)
0.0
1.0
2.0
3.0
4.0
-20 -10 0 10 20 30 40 50
Time (hours)
[Gln
] (m
M)
0.0
0.2
0.4
0.6
0.8
1.0
[Glu
] (m
M)
Figure 3.2 – Extracellular concentrations of glutamate ( ) and glutamine ( ) before and after the addition of glutaminase to a culture of astrocytes. During the first 20 hours the culture was under control conditions. After addition of glutaminase to the medium at time zero (indicated by the arrow), glutamate was accumulated and subsequently consumed while glutamine decreased until reaching a steady state level of 1.3 mM.
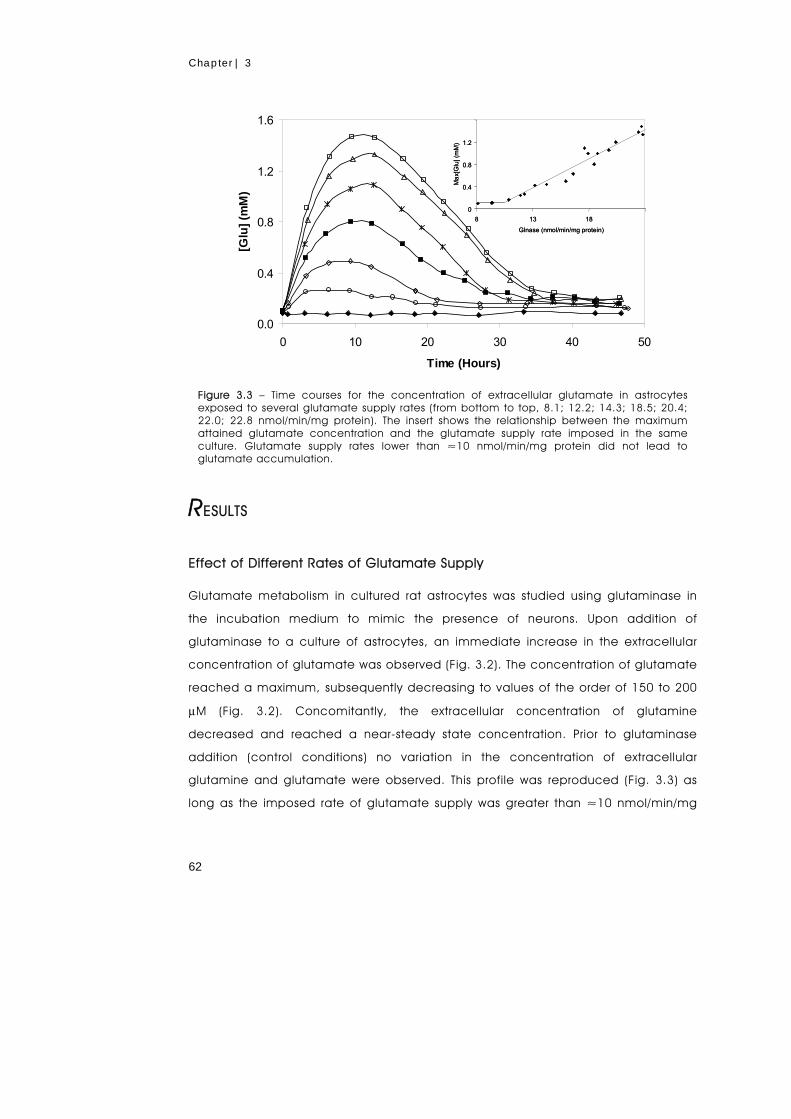
Chapter | 3
62
RESULTS
Effect of Different Rates of Glutamate Supply
Glutamate metabolism in cultured rat astrocytes was studied using glutaminase in
the incubation medium to mimic the presence of neurons. Upon addition of
glutaminase to a culture of astrocytes, an immediate increase in the extracellular
concentration of glutamate was observed (Fig. 3.2). The concentration of glutamate
reached a maximum, subsequently decreasing to values of the order of 150 to 200
μM (Fig. 3.2). Concomitantly, the extracellular concentration of glutamine
decreased and reached a near-steady state concentration. Prior to glutaminase
addition (control conditions) no variation in the concentration of extracellular
glutamine and glutamate were observed. This profile was reproduced (Fig. 3.3) as
long as the imposed rate of glutamate supply was greater than ≈10 nmol/min/mg
0.0
0.4
0.8
1.2
1.6
0 10 20 30 40 50
Time (Hours)
[Glu
] (m
M)
0
0.4
0.8
1.2
8 13 18
Glnase (nmol/min/mg protein)
Ma
x[G
lu] (
mM
)
0.0
0.4
0.8
1.2
1.6
0 10 20 30 40 50
Time (Hours)
[Glu
] (m
M)
0
0.4
0.8
1.2
8 13 18
Glnase (nmol/min/mg protein)
Ma
x[G
lu] (
mM
)
0
0.4
0.8
1.2
8 13 18
Glnase (nmol/min/mg protein)
Ma
x[G
lu] (
mM
)
Figure 3.3 – Time courses for the concentration of extracellular glutamate in astrocytes exposed to several glutamate supply rates (from bottom to top, 8.1; 12.2; 14.3; 18.5; 20.4; 22.0; 22.8 nmol/min/mg protein). The insert shows the relationship between the maximum attained glutamate concentration and the glutamate supply rate imposed in the same culture. Glutamate supply rates lower than ≈10 nmol/min/mg protein did not lead to glutamate accumulation.
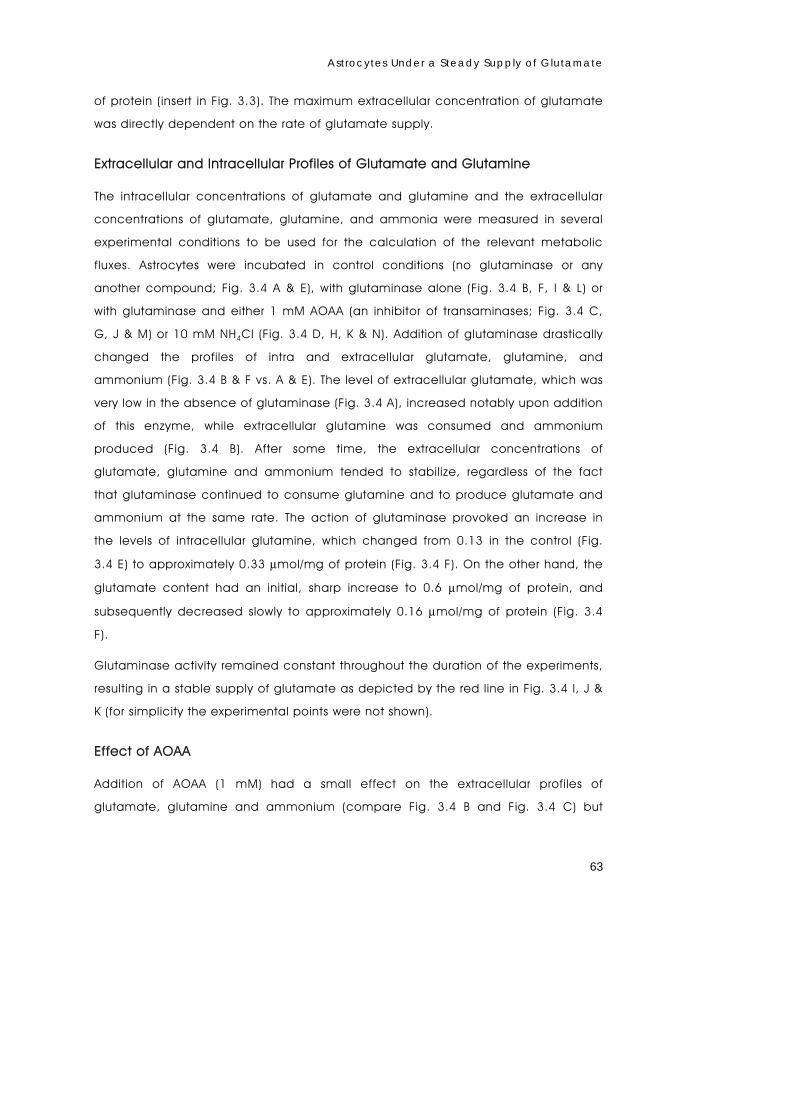
Astrocytes Under a Steady Supply of Glutamate
63
of protein (insert in Fig. 3.3). The maximum extracellular concentration of glutamate
was directly dependent on the rate of glutamate supply.
Extracellular and Intracellular Profiles of Glutamate and Glutamine
The intracellular concentrations of glutamate and glutamine and the extracellular
concentrations of glutamate, glutamine, and ammonia were measured in several
experimental conditions to be used for the calculation of the relevant metabolic
fluxes. Astrocytes were incubated in control conditions (no glutaminase or any
another compound; Fig. 3.4 A & E), with glutaminase alone (Fig. 3.4 B, F, I & L) or
with glutaminase and either 1 mM AOAA (an inhibitor of transaminases; Fig. 3.4 C,
G, J & M) or 10 mM NH4Cl (Fig. 3.4 D, H, K & N). Addition of glutaminase drastically
changed the profiles of intra and extracellular glutamate, glutamine, and
ammonium (Fig. 3.4 B & F vs. A & E). The level of extracellular glutamate, which was
very low in the absence of glutaminase (Fig. 3.4 A), increased notably upon addition
of this enzyme, while extracellular glutamine was consumed and ammonium
produced (Fig. 3.4 B). After some time, the extracellular concentrations of
glutamate, glutamine and ammonium tended to stabilize, regardless of the fact
that glutaminase continued to consume glutamine and to produce glutamate and
ammonium at the same rate. The action of glutaminase provoked an increase in
the levels of intracellular glutamine, which changed from 0.13 in the control (Fig.
3.4 E) to approximately 0.33 μmol/mg of protein (Fig. 3.4 F). On the other hand, the
glutamate content had an initial, sharp increase to 0.6 μmol/mg of protein, and
subsequently decreased slowly to approximately 0.16 μmol/mg of protein (Fig. 3.4
F).
Glutaminase activity remained constant throughout the duration of the experiments,
resulting in a stable supply of glutamate as depicted by the red line in Fig. 3.4 I, J &
K (for simplicity the experimental points were not shown).
Effect of AOAA
Addition of AOAA (1 mM) had a small effect on the extracellular profiles of
glutamate, glutamine and ammonium (compare Fig. 3.4 B and Fig. 3.4 C) but
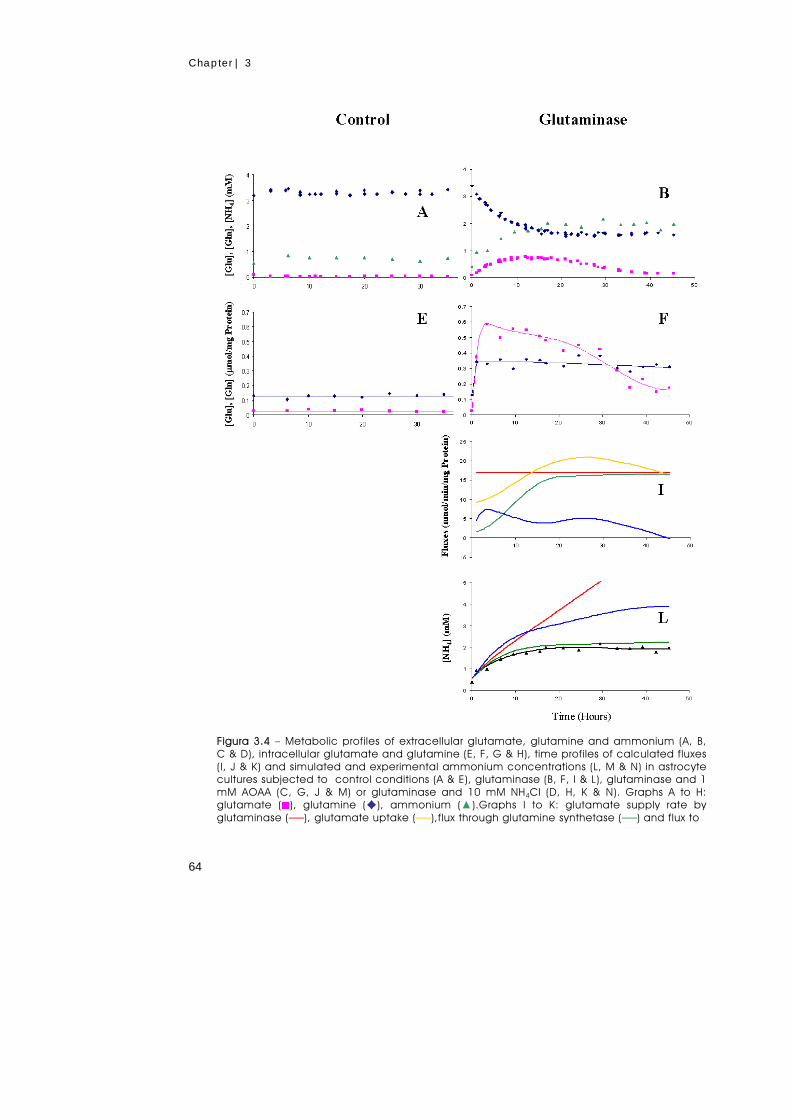
Chapter | 3
64
Figura 3.4 – Metabolic profiles of extracellular glutamate, glutamine and ammonium (A, B, C & D), intracellular glutamate and glutamine (E, F, G & H), time profiles of calculated fluxes (I, J & K) and simulated and experimental ammonium concentrations (L, M & N) in astrocyte cultures subjected to control conditions (A & E), glutaminase (B, F, I & L), glutaminase and 1 mM AOAA (C, G, J & M) or glutaminase and 10 mM NH4Cl (D, H, K & N). Graphs A to H: glutamate ( ), glutamine ( ), ammonium (▲).Graphs I to K: glutamate supply rate by glutaminase (──), glutamate uptake (──),flux through glutamine synthetase (──) and flux to
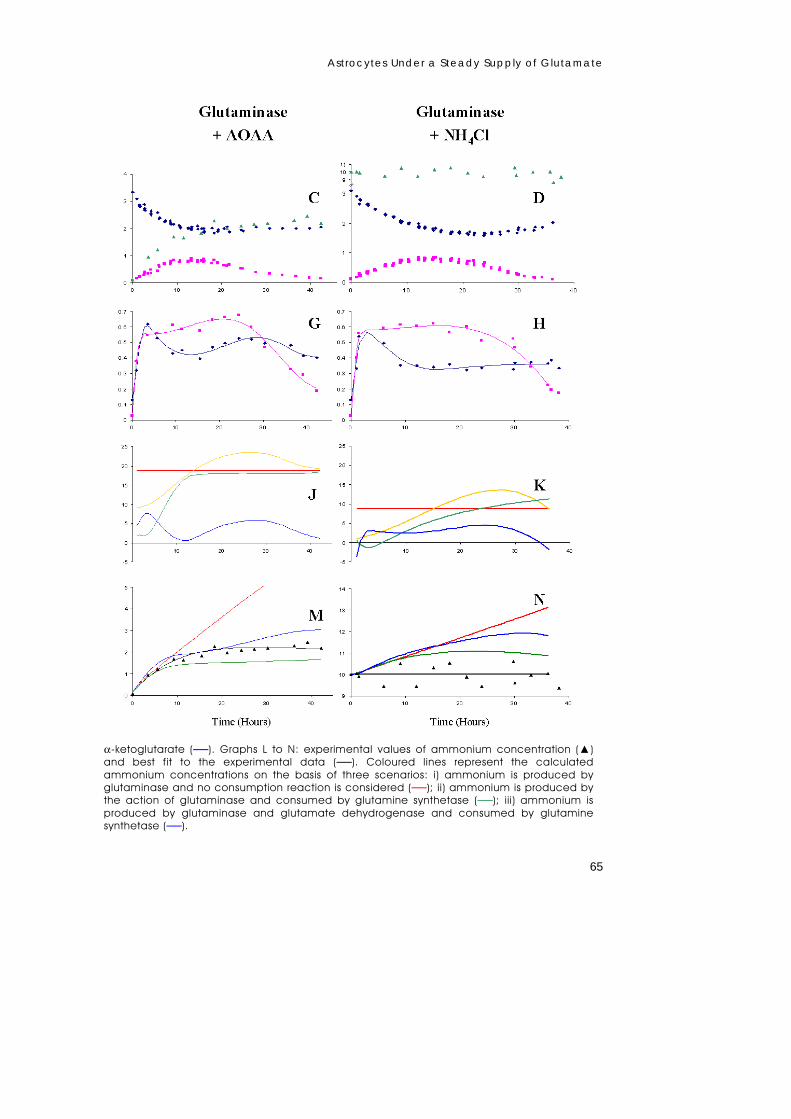
Astrocytes Under a Steady Supply of Glutamate
65
α-ketoglutarate (──). Graphs L to N: experimental values of ammonium concentration (▲) and best fit to the experimental data (──). Coloured lines represent the calculated ammonium concentrations on the basis of three scenarios: i) ammonium is produced by glutaminase and no consumption reaction is considered (──); ii) ammonium is produced by the action of glutaminase and consumed by glutamine synthetase (──); iii) ammonium is produced by glutaminase and glutamate dehydrogenase and consumed by glutamine synthetase (──).

Chapter | 3
66
clearly changed the intracellular profiles of glutamate and glutamine (Fig. 3.4 G).
The addition of the inhibitor resulted in a greater intracellular accumulation of
glutamate for a longer period of time, and a different profile for glutamine
accumulation with higher intracellular levels of this amino acid. The intracellular
content of glutamine peaked initially to around 0.6 μmol/mg of protein, a feature
not observed in the absence of AOAA, and then dropped to values similar to those
obtained in the absence of AOAA.
Effect of Ammonium Chloride
When astrocytes were exposed to glutaminase and 10 mM NH4Cl, the levels of
extracellular glutamate were similar to those obtained with glutaminase alone
(compare Fig. 3.4 B & D). However, cells subjected to NH4Cl endured a significantly
lower glutamate supply rate (see calculation of fluxes below), which was due to an
inhibition of glutaminase caused by the presence of NH4Cl, an end-product of the
reaction catalysed by this enzyme. The profile of extracellular glutamine was
generally similar to that observed in the presence of glutaminase alone, except for
the increase in the glutamine level towards the end of the experiment. The
ammonium concentration in the medium did not vary significantly (Fig. 3.4 D). The
intracellular profiles (Fig. 3.4 H) were generally similar to those observed in the
presence of AOAA.
Calculation of Metabolic Fluxes
The results obtained for the extra (Fig. 3.4 B, C & D) and intracellular (Fig. 3.4 F, G &
H) concentrations of glutamate, glutamine and ammonia, were used as input data
for the calculation of the relevant fluxes considered in the model system depicted in
Fig. 3.1. The time course of glutamate uptake and the fluxes associated with
glutamate metabolism are shown in Fig. 3.4 I, J & K. Upon addition of glutaminase
to the medium (Fig. 3.4 I), cells consumed glutamate at a rate of
9.0 nmol/min/mg of protein, significantly lower than the imposed rate of supply
(16.8 nmol/min/mg of protein), resulting in the extracellular accumulation of
glutamate. During the initial 13 hours the transport capacity of astrocytes increased
until reaching the imposed rate of glutamate supply; as a consequence the
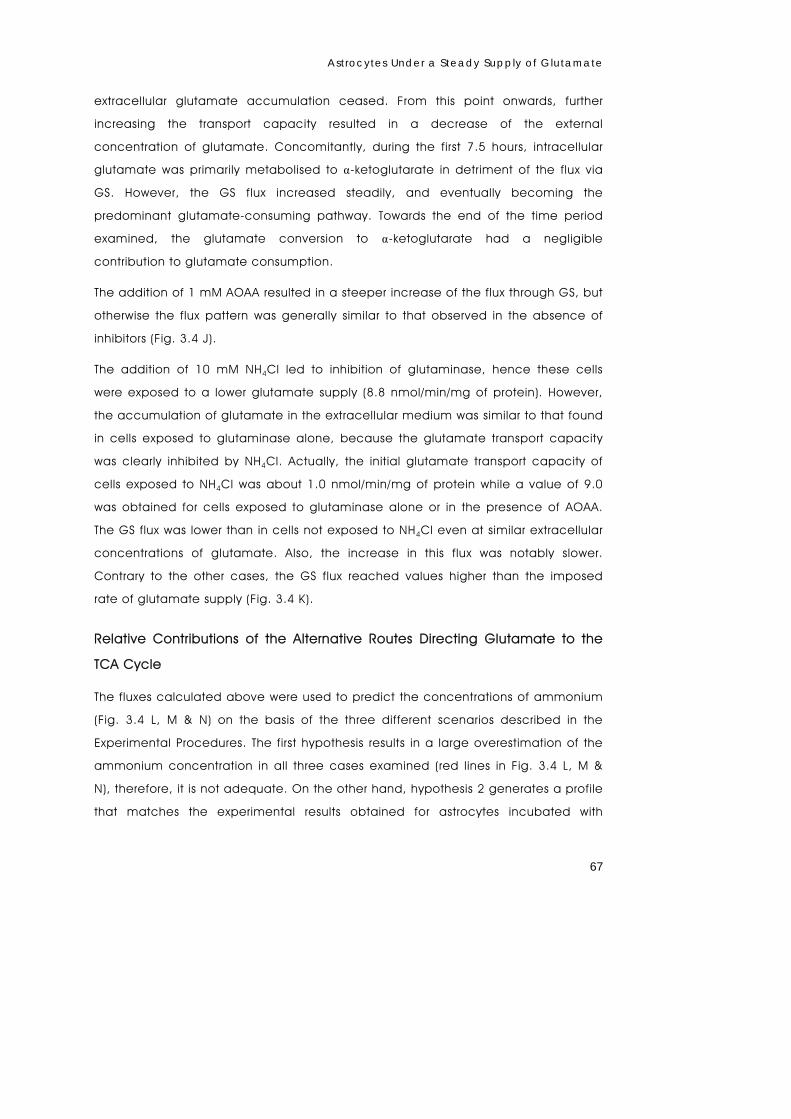
Astrocytes Under a Steady Supply of Glutamate
67
extracellular glutamate accumulation ceased. From this point onwards, further
increasing the transport capacity resulted in a decrease of the external
concentration of glutamate. Concomitantly, during the first 7.5 hours, intracellular
glutamate was primarily metabolised to α-ketoglutarate in detriment of the flux via
GS. However, the GS flux increased steadily, and eventually becoming the
predominant glutamate-consuming pathway. Towards the end of the time period
examined, the glutamate conversion to α-ketoglutarate had a negligible
contribution to glutamate consumption.
The addition of 1 mM AOAA resulted in a steeper increase of the flux through GS, but
otherwise the flux pattern was generally similar to that observed in the absence of
inhibitors (Fig. 3.4 J).
The addition of 10 mM NH4Cl led to inhibition of glutaminase, hence these cells
were exposed to a lower glutamate supply (8.8 nmol/min/mg of protein). However,
the accumulation of glutamate in the extracellular medium was similar to that found
in cells exposed to glutaminase alone, because the glutamate transport capacity
was clearly inhibited by NH4Cl. Actually, the initial glutamate transport capacity of
cells exposed to NH4Cl was about 1.0 nmol/min/mg of protein while a value of 9.0
was obtained for cells exposed to glutaminase alone or in the presence of AOAA.
The GS flux was lower than in cells not exposed to NH4Cl even at similar extracellular
concentrations of glutamate. Also, the increase in this flux was notably slower.
Contrary to the other cases, the GS flux reached values higher than the imposed
rate of glutamate supply (Fig. 3.4 K).
Relative Contributions of the Alternative Routes Directing Glutamate to the
TCA Cycle
The fluxes calculated above were used to predict the concentrations of ammonium
(Fig. 3.4 L, M & N) on the basis of the three different scenarios described in the
Experimental Procedures. The first hypothesis results in a large overestimation of the
ammonium concentration in all three cases examined (red lines in Fig. 3.4 L, M &
N), therefore, it is not adequate. On the other hand, hypothesis 2 generates a profile
that matches the experimental results obtained for astrocytes incubated with

Chapter | 3
68
glutaminase alone (Fig. 3.4 L). In the case where astrocytes were incubated with
glutaminase and AOAA (Fig. 3.4 M) the experimental results fall between the values
predicted by hypotheses 2 and 3. All three scenarios led to a substantial
overestimation of the experimental results obtained for astrocytes incubated with
glutaminase and NH4Cl (Fig. 3.4 N).
Levels of Glutamine Synthetase by Immunoblotting
Western blot analysis of cell extracts showed a statistically significant (p<0.002)
increase in the level of GS in the cell groups exposed to glutaminase alone and to
glutaminase and AOAA, after 10 and 5 hours of exposure, respectively. No
statistically significant differences were found between cells in control conditions,
cells exposed to glutaminase alone for less than 10 hours, cells exposed to
glutaminase and AOAA for less than 5 hours, or cells exposed to glutaminase and
NH4Cl (Fig. 3.5).
0
2
4
6
8
10
Control Glnase<10h
Glnase>10h
Glnase+AOAA
<5h
Glnase+AOAA
>5h
Glnase+NH4
GS
exp
ress
ion
(n-fold
control l
eve
ls)
p<0.001
p<0.002
Glnase+NH4Cl0-38h
Glu
tam
ine s
ynth
eta
se(n
-fold
con
trol
leve
ls)
Control0-40h
Glnase0-10h
Glnase10-45h
Glnase+AOAA
0-5h
Glnase+AOAA 5-43h
n=8 n=6
n=17
n=3
n=12
n=15
Figure 3.5 – Glutamine synthetase levels determined by Western blot analysis in extracts of astrocyte cultures incubated with glutaminase for less than 10 hours (Glnase 0-10 h), or more than 10 hours (Glnase 10-45 h), glutaminase plus 1 mM AOAA for less than 5 hours (Glnase+AOAA 0-5 h) or more (Glnase+AOAA 5-43 h), and glutaminase plus 10 mM NH4Cl (Glnase+NH4Cl 0-38 h). Results are expressed as n-fold of control levels; p is the statistic significance level compared with the control.

Astrocytes Under a Steady Supply of Glutamate
69
Glucose Uptake and Lactate Release
Results obtained for glucose uptake and lactate release rates are presented in
Table 3.1. Glucose uptake and lactate release rates were significantly higher
(p<0.001) in all cell groups exposed to glutaminase as compared to control
conditions.
Levels of Phosphorylated Metabolites by in Vivo 31P NMR
Phosphocholine, phosphoethanolamine, phosphocreatine and ATP as well as the
intracellular pH were determined by 31P NMR directly in immobilized astrocytes (Fig.
3.6). In the bottom spectrum, acquired while cells were perfused with control
medium, the resonances of phosphocholine, phosphoethanolamine, inorganic
phosphate (extra and intracellular), phosphocreatine and ATP were easily detected.
In the upper spectrum, acquired after the addition of glutaminase and when
glutamate reached the highest level (540 μM), it is apparent a strong reduction of
Table 3.2 – Levels of phosphorylated metabolites determined by in vivo 31P-NMR in rat astrocytes subjected to a steady supply of glutamate or in control conditions (prior to the addition of glutaminase).
[Glu] (μM)
PC (%)a
PE (%)a
Phosphocreatine (%)a
ATP (%)a
Intracellular pH
Control 6 ± 11 100 ± 3 100 ± 10 100 ± 5 100 ± 5 7.23 ± 0.02
Max[Glu]b 540 ± 29 53 ± 4 60 ± 6 22 ± 4 111 ± 5 7.09 ± 0.02
PC, Phosphocholine; PE, Phosphoethanolamine. a Values are expressed as a percentage of control values. b Values determined at the maximum of glutamate accumulation.
Table 3.1 – Glucose uptake rate, lactate release rate, and ratio between glucose uptake and lactate release rates in rat astrocyte cultures exposed to a steady supply of glutamate generated by glutaminase activity.
Glutamate supply rate (nmol/min/mg protein)
Glucose uptake rate (nmol/min/mg protein)
Lactate release rate (nmol/min/mg protein)
Lac/Glc
Control 0 8.9 ± 0.3 17.2 ± 2.1 1.9 ± 0.3
Glnase 16.8 ± 3.1 13.1 ± 2.1§ 22.6 ± 3.6§ 1.7 ± 0.1
Glnase + AOAA 18.8 ± 3.6 15.4 ± 0.8§ 31.1 ± 1.4§,‡ 2.0 ± 0.1‡
Glnase + NH4Cl 8.8 ± 1.8 15.1 ± 1.0§ 25.8 ± 1.2§ 1.7 ± 0.1
§ Statistically different from control values (p<0.001) ‡ Statistically different from glutaminase values (p<0.001)
Chapter | 3
70
the phosphocreatine resonance, a slight reduction in both phosphocholine and
phosphoethanolamine, a small increase in the ATP resonances, and a down-field
shift of the resonance due to the intracellular inorganic phosphate (intracellular
acidification). These changes are summarized in Table 3.2.
DISCUSSION
Neuronal activity, which involves a continuous release of glutamate, can only be
sustained under normal conditions if the extracellular levels of this amino acid are
kept low (Shaw et al., 1995). This desideratum is achieved in the brain through the
glutamate-glutamine cycle. Thus far, glutamate metabolism has been studied in
astrocytic cultures incubated with specific concentrations of this amino acid
(A)
(B)
PCr
Pi(int)
Pi(ext)
PE
PC
γ-ATPα-ATP
β-ATP
8 6 4 2 0 -2 -4 -6 -8 -10 -12 -14 -16 ppm
(A)
(B)
PCr
Pi(int)
Pi(ext)
PE
PC
γ-ATPα-ATP
β-ATP
8 6 4 2 0 -2 -4 -6 -8 -10 -12 -14 -16 ppm
Figure 3.6 – 31P-NMR spectra of astrocytes immobilized in biomembrane gel threads perfused with DMEM. A: spectrum acquired under control conditions; B: spectrum acquired at the maximum level of glutamate accumulation (540 μM) after addition of glutaminase. Assignments: PE, phosphoethanolamine; PC, phosphocholine; Pi, inorganic phosphate; ext, extracellular; int, intracellular; PCr, phosphocreatine
Astrocytes Under a Steady Supply of Glutamate
71
(Farinelli and Nicklas, 1992; McKenna et al., 1996; Sonnewald et al., 1993). Here, we
used an experimental approach that mimics the actual glutamate-glutamine cycle
in the brain, where glutamate is continuously released by neurons and recycled to
glutamine in astrocytes. In this model system, the glutamate-releasing role of
neurons is performed by glutaminase, added to the incubation medium; in this way,
astrocytes are subjected to a continuous supply of glutamate as in the brain.
At glutamate supply rates lower than ≈10 nmol/min/mg of protein, astrocytes were
able to take up all the glutamate, but at higher supply rates, glutamate
accumulated in the extracellular space up to around 10 hours, decreasing
afterwards (Fig. 3.3). The maximum level of extracellular glutamate increased with
the imposed rate of supply, but astrocytes were able to respond efficiently to this
stress by increasing the rate of glutamate uptake in a short time.
During the initial period of adaptation, glutamate removal was ensured primarily by
conversion to α-ketoglutarate, but the glutamate flux through GS increased notably
(about 9 fold), thus becoming the major glutamate-metabolising pathway (Fig. 3.4
I). Furthermore, the increase in the flux via GS was associated with an increase in the
level of GS (Fig. 3.5). Our results also suggest that there was a direct correlation
between the extent of GS activation and the intensity of the imposed stress, at least
within the range of glutamate supply rates examined (Fig. 3.3).
Glutamine synthetase activity has been shown to increase during postnatal
development (Virgili et al., 1990); in contrast, a strong reduction in GS is observed in
pure cultures of astrocytes prepared from rat brains in various stages of
development (Stanimirovic et al., 1999). Glutamine synthetase, however, was up-
regulated in astrocytes co-cultured with neurons (Mearow et al., 1990). These
findings suggest that GS activity in pure cultures of astrocytes does not represent the
in vivo activity of this enzyme (Stanimirovic et al., 1999). It is possible that the
enzymes required to metabolise glutamate are down regulated due to lack of
challenge during the culture preparation. When challenged with a steady supply of
glutamate in the experimental set-up used here, astrocytes recovered their natural
capacity to metabolise this amino acid, primarily through conversion to glutamine.
Our results corroborate the view of other authors (Stanimirovic et al., 1999) that,
Chapter | 3
72
although cultured astrocytes lose their in vivo phenotype, they still retain the ability
to up regulate GS activity.
Most studies on glutamate metabolism in astrocytes (Farinelli and Nicklas, 1992;
McKenna et al., 1996; Schousboe et al., 1993; Sonnewald et al., 1993; Sonnewald
et al., 1997) were performed with short-time incubations (up to 2 hours); our work
shows that after 2 hours of exposure to glutamate the flux through GS was only 12%
of that attained at the end, and the conversion of glutamate to α-ketoglutarate was
the prevalent pathway for glutamate utilization (Fig. 3.4 I). Furthermore, the level of
GS remained low during the first 10 hours of exposure to glutamate, a result
reflecting the long time required for up-regulation of this enzyme (Fig. 3.5). Thus, if
cells are challenged for only a few hours with increasing concentrations of
glutamate it is expected that the relative contribution of the flux to the TCA cycle will
increase accordingly, as reported by McKenna et al. (1996). Our experimental
model system shows that the fate of glutamate is largely dependent on the
activation of GS rather than on the extracellular concentration of glutamate. In fact,
the flux towards the TCA did not change considerably for most of the experiment
(30 hours), despite the range of exogenous glutamate concentrations experienced
by the culture (0-780 μM) over that time period. Moreover, when the concentrations
of glutamate and glutamine reached a steady state (no further change in the
extracellular concentration of glutamate or glutamine), the flux of glutamate to the
TCA cycle became negligible as compared to the flux through GS. In conclusion,
the results on flux distribution obtained in experiments with short-incubation times
should be regarded with caution since they may not represent adequately the
behaviour of astrocytes in the brain.
The mathematical model used to rationalize the experimental data also allowed for
the calculation of the flux distribution through transaminases and glutamate
dehydrogenase. In cells incubated with glutaminase alone, glutamate was
channelled to the TCA cycle exclusively via the transaminases pathway (Fig. 3.4 L),
but the model also shows that when the transaminase inhibitor AOAA was used, the
flux distribution was shifted towards the glutamate dehydrogenase pathway (Fig. 3.4
M). This result is in agreement with the higher ratio between lactate release and
Astrocytes Under a Steady Supply of Glutamate
73
glucose uptake rates observed in the presence of the inhibitor AOAA (Table 3.1).
Interestingly, the total flux to the TCA cycle did not change appreciably. A notable
acceleration of the flux through GS was induced by the presence of the inhibitor
(compare Fig. 3.4 J & I), which was accompanied by a decrease in the time
required to enhance the level of GS (Fig. 3.5). It appears that the presence of AOAA
exerted an extra pressure for the up-regulation of GS.
The glutamate/glutamine cycle is a generally accepted picture of the interaction
between astrocytes and neurons to deal with glutamate toxicity; however, the
process that shuttles the nitrogen produced in neurons and needed by astrocytes is
poorly understood. Branched-chain amino acids and alanine (as opposed to
ammonium) have been proposed as candidates for moving nitrogen between
neurons and astrocytes (Lieth et al., 2001; Waagepetersen et al., 2000; Yudkoff et
al., 1996). The cell system used in this work is able to recycle efficiently glutamate,
but leads to the production of ammonium by glutaminase. Interestingly, ammonium
in the medium reaches a steady state at a concentration of approx. 2 mM,
indicating that astrocytes are able to utilize this nitrogen source. Contradictory
results appear in the literature concerning the effects of ammonium on glutamate
metabolism: Huang et al. (1994) have shown that chronic exposure to ammonium
results in increased glutamine synthesis; on the other hand, other authors observed
little or no increase in the formation of glutamine, and reported a reduction of the
oxidative metabolism of glutamate (Yu et al., 1984). Therefore, we investigated the
effect of 2 mM ammonium on astrocytes with the experimental set-up used in this
study. No changes were observed in the profiles of extracellular glutamate and
glutamine in comparison with experiments carried out without ammonium;
furthermore, glutaminase was not inhibited by this level of ammonium (results not
shown). Also, it was deemed interesting to study the effect of ammonium on the
metabolism of astrocytes. At a concentration of 10 mM, ammonium caused a
reduction of about 50% in the activity of glutaminase and hence the rate of
glutamate supply decreased to 8.8 nmol/min/mg of protein (compare Fig. 3.4 I &
K). At this low rate of glutamate supply, astrocytes incubated with glutaminase alone
did not accumulate glutamate (Fig. 3.3); in contrast, cells treated with ammonium
showed a profile of glutamate accumulation (Fig. 3.4 D) similar to that of cells
Chapter | 3
74
exposed to a 2 fold higher glutamate supply rate, which evidences the inhibitory
effect of ammonium in glutamate uptake. In vivo as well as in vitro models for
hyperammonemia have shown a reduction at the level of transcription as well as
expression of genes encoding the glutamate transporters GLAST and GLT-1 (Chan
and Butterworth, 1999; Chan et al., 2000). Ammonium also affected the profile of
the flux through GS (Fig. 3.4 K); moreover, the glutamate-dependent enhancement
of the level of GS observed in the absence of ammonium, was suppressed (Fig. 3.5).
This result shows that the observed stimulation of the GS activity was not due to an
increase in the amount of protein, but to other regulatory factors. It is worth noting
that, for incubation periods longer than 24 hours the flux through GS outweighed the
glutamate supply rate (Fig. 3.4 K), leading to an increase in the extracellular
glutamine synthesized from glutamate derived from the TCA cycle (Fig. 3.4 D). This
unexpected result is interpreted as being part of a strategy for ammonium
detoxification.
According to the model proposed by Pellerin and Magistretti (1994), the glutamate-
glutamine cycle is coupled to the glycolytic pathway. Our results corroborate this
model insofar as glucose uptake rates are stimulated in the presence of glutamate
(Table 3.1). This stimulation is justified by the fact that glutamate metabolism is very
expensive from the energetic point of view mainly for two reasons: the transport of
glutamate is fuelled by sodium and potassium gradients, which are built by the
Na+/K+ ATPase at the expense of ATP; also, the conversion of glutamate to
glutamine is an ATP-consuming process. The ATP content of astrocytes did not
change appreciably upon glutaminase addition, but a drastic reduction in the level
of PCr was observed (Table 3.2). This suggests an increased energy demand, but the
level of ATP is maintained at the expense of the PCr pool, as observed in response
to short times under ischemia (Alves et al., 2000). Decreased PCr /ATP ratios in
astrocytes challenged with glutamate in a discontinuous experimental set-up have
been reported earlier (Sonnewald et al., 1997).
Perhaps more interesting was the clear reduction in the level of phosphocholine and
phosphoethanolamine, two precursors in the synthesis of phospholipids. In mouse
neocortical neurons, glutamate induces the production of the unusual lipids
N-acylethanolamine and N-acylphosphatidylethanolamine (Hansen et al., 1995),

Astrocytes Under a Steady Supply of Glutamate
75
which are also found in mammalian tissues undergoing degenerative changes
(Schmid et al., 1990). Therefore, it is conceivable that similar glutamate-induced
processes could occur in astrocytes that would account for the drop observed in the
pools of precursors.
In conclusion, data presented here show that astrocytes adapted efficiently to a
constant supply of glutamate by increasing glutamate uptake and GS activity up to
levels similar to the imposed glutamate supply rate. The metabolic fate of
glutamate depended greatly on the time of endurance to the challenge: in naïve
cells, glutamate was primarily metabolised through the transaminase pathway, while
in well-adapted cells glutamate was converted almost exclusively through GS. The
evidence and conclusions presented herein confirm that the experimental set-up
developed in this work to study glutamate metabolism, constitutes a more
representative model of the in vivo condition than other systems using cultures of
astrocytes with single additions of glutamate.
ACKNOWLEDGEMENTS AND WORK CONTRIBUTIONS
I am grateful to Dr. Cristina Peixoto and to Dr. Victor Sousa, ITQB, Oeiras for the
enlightening discussions and endless suggestions on the improvement of the quality
of the Western Blots.
REFERENCES
Alves P.M., Flögel U., Brand A., Leibfritz D., Carrondo M.J.T., Santos H., Sonnewald U.
(1996). Immobilization of primary astrocytes and neurons for on-line
monitoring of biochemical processes by NMR. Dev. Neurosci. 18, 478-483.
Alves P.M., Fonseca L.L., Peixoto C.C., Almeida A.C., Carrondo M.J.T., Santos H.
(2000). NMR studies on energy metabolism of immobilized primary neurons
and astrocytes during hypoxia, ischemia and hypoglycemia. NMR. Biomed.
13, 438-48.
Chan H., Butterworth R.F. (1999). Evidence for an astrocytic glutamate transporter
deficit in hepatic encephalopathy. Neurochem. Res. 24, 1397-401.
Chapter | 3
76
Chan H., Hazell A.S., Desjardins P., Butterworth R.F. (2000). Effects of ammonia on
glutamate transporter (GLAST) protein and mRNA in cultured rat cortical
astrocytes. Neurochem. Int. 37, 243-8.
Doble A. (1999). The role of excitotoxicity in neurodegenerative disease: implications
for therapy. Pharmacol. Ther. 81, 163-221.
Farinelli S.E., Nicklas W.J. (1992). Glutamate metabolism in rat cortical astrocyte
cultures. J. Neurochem. 58, 1905-15.
Flögel U., Willker W., Leibfritz D. (1994). Regulation of intracellular pH in neuronal and
glial tumour cells, studied by multinuclear NMR spectroscopy. NMR Biomed. 7,
157-166.
Fonnum F. (1984). Glutamate: a neurotransmitter in mammalian brain. J.
Neurochem. 42, 1-11.
Fonseca L.L., Alves P.M., Carrondo M.J.T., Santos H. (2001). Effect of ethanol on the
metabolism of primary astrocytes studied by 13C- and 31P-NMR spectroscopy.
J. Neurosci. Res. 66, 803-11.
Gegelashvili G., Schousboe A. (1997). High affinity glutamate transporters: regulation
of expression and activity. Mol. Pharmacol. 52, 6-15.
Gruetter R., Seaquist E.R., Kim S., Ugurbil K. (1998). Localized in vivo 13C-NMR of
glutamate metabolism in the human brain: initial results at 4 tesla. Dev.
Neurosci. 20, 380-8.
Hansen H.S., Lauritzen L., Strand A.M., Moesgaard B., Frandsen A. (1995). Glutamate
stimulates the formation of N-acylphosphatidylethanolamine and N-
acylethanolamine in cortical neurons in culture. Biochim. Biophys. Acta 1258,
303-8.
Hertz L. (2004). Intercellular metabolic compartmentation in the brain: past, present
and future. Neurochem. Int. 45, 285-96.
Huang R., Kala G., Murthy R.K., Hertz L. (1994). Effects of chronic exposure to
ammonia on glutamate and glutamine interconversion and
compartmentation in homogeneous primary cultures of mouse astrocytes.
Neurochem. Res. 19, 257-65.

Astrocytes Under a Steady Supply of Glutamate
77
Kissane J.M., Robins E. (1958). The fluorimetric measurement of deoxyribonucleic
acid in animal tissues with special reference to the central nervous system. J.
Biol. Chem. 233, 184-188.
Laemmli U.K. (1970). Cleavage of structural proteins during the assembly of the
head of bacteriophage T4. Nature 227, 680-5.
Lieth E., LaNoue K.F., Berkich D.A., Xu B., Ratz M., Taylor C., Hutson S.M. (2001).
Nitrogen shuttling between neurons and glial cells during glutamate synthesis.
J. Neurochem. 76, 1712-23.
McKenna M.C., Sonnewald U., Huang X., Stevenson J., Zielke H.R. (1996). Exogenous
glutamate concentration regulates the metabolic fate of glutamate in
astrocytes. J. Neurochem. 66, 386-93.
Mearow K.M., Mill J.F., Freese E. (1990). Neuron-glial interactions involved in the
regulation of glutamine synthetase. Glia 3, 385-92.
Norenberg M.D., Martinez-Hernandez A. (1979). Fine structural localization of
glutamine synthetase in astrocytes of rat brain. Brain Res. 161, 303-10.
Pellerin L., Magistretti P.J. (1994). Glutamate uptake into astrocytes stimulates
aerobic glycolysis: a mechanism coupling neuronal activity to glucose
utilization. Proc. Natl. Acad. Sci. U.S.A. 91, 10625-9.
Rago R., Mitchen J., Wilding G. (1990). DNA fluorometric assay in 96-well tissue
culture plates using Hoescht 33258 after cell lysis by freezing in distilled water.
Anal. Biochem. 191, 31-34.
Richter-Landsberg C., Besser A. (1994). Effects of organotins on rat brain astrocytes
in culture. J. Neurochem. 63, 2202-9.
Schmid H.H., Schmid P.C., Natarajan V. (1990). N-acylated glycerophospholipids
and their derivatives. Prog. Lipid Res. 29, 1-43.
Schousboe A., Westergaard N., Sonnewald U., Petersen S.B., Huang R., Peng L., Hertz
L. (1993). Glutamate and glutamine metabolism and compartmentation in
astrocytes. Dev. Neurosci. 15, 359-66.
Shaw P.J., Forrest V., Ince P.G., Richardson J.P., Wastell H.J. (1995). CSF and plasma
amino acid levels in motor neuron disease: elevation of CSF glutamate in a
subset of patients. Neurodegeneration 4, 209-16.
Chapter | 3
78
Shen J., Petersen K.F., Behar K.L., Brown P., Nixon T.W., Mason G.F., Petroff O.A.,
Shulman G.I., Shulman R.G., Rothman D.L. (1999). Determination of the rate of
the glutamate/glutamine cycle in the human brain by in vivo 13C NMR. Proc.
Natl. Acad. Sci. U.S.A. 96, 8235-40.
Shen J., Sibson N.R., Cline G., Behar K.L., Rothman D.L., Shulman R.G. (1998). 15N-
NMR spectroscopy studies of ammonia transport and glutamine synthesis in
the hyperammonemic rat brain. Dev. Neurosci. 20, 434-43.
Sibson N.R., Dhankhar A., Mason G.F., Behar K.L., Rothman D.L., Shulman R.G.
(1997). In vivo 13C NMR measurements of cerebral glutamine synthesis as
evidence for glutamate-glutamine cycling. Proc. Natl. Acad. Sci. U.S.A. 94,
2699-704.
Sonnewald U., Westergaard N., Petersen S.B., Unsgard G., Schousboe A. (1993).
Metabolism of [U-13C]glutamate in astrocytes studied by 13C NMR
spectroscopy: incorporation of more label into lactate than into glutamine
demonstrates the importance of the tricarboxylic acid cycle. J. Neurochem.
61, 1179-82.
Sonnewald U., Westergaard N., Schousboe A. (1997). Glutamate transport and
metabolism in astrocytes. Glia 21, 56-63.
Stanimirovic D.B., Ball R., Small D.L., Muruganandam A. (1999). Developmental
regulation of glutamate transporters and glutamine synthetase activity in
astrocyte cultures differentiated in vitro. Int. J. Dev. Neurosci. 17, 173-84.
Vassault A. (1983). Lactate dehydrogenase: UV-method with pyruvate and NADH. In:
Bergmeyer HU, Bergmeyer J, Grassl M, editors. Methods of enzymatic analysis.
Weiheim: VerlagChemie. p 118-126.
Virgili M., Barnabei O., Contestabile A. (1990). Regional maturation of
neurotransmitter-related and glial markers during postnatal development in
the rat. Int. J. Dev. Neurosci. 8, 159-66.
Waagepetersen H.S., Sonnewald U., Larsson O.M., Schousboe A. (2000). A possible
role of alanine for ammonia transfer between astrocytes and glutamatergic
neurons. J. Neurochem. 75, 471-9.
Astrocytes Under a Steady Supply of Glutamate
79
Westergaard N., Sonnewald U., Schousboe A. (1995). Metabolic trafficking between
neurons and astrocytes: the glutamate/glutamine cycle revisited. Dev.
Neurosci. 17, 203-11.
Yu A.C., Schousboe A., Hertz L. (1984). Influence of pathological concentrations of
ammonia on metabolic fate of 14C-labeled glutamate in astrocytes in primary
cultures. J. Neurochem. 42, 594-7.
Yudkoff M., Daikhin Y., Grunstein L., Nissim I., Stern J., Pleasure D. (1996). Astrocyte
leucine metabolism: significance of branched-chain amino acid
transamination. J. Neurochem. 66, 378-85.

Chapter | 3
80
CHAPTER 4
Lactate Recycling Through the Plasma
Membrane of Astrocytes and Neurons
as Detected by (13C, 2H) NMR
Results in this chapter were submitted for
publication as:
Fonseca L. L., Sierra A., Santos H. & Cerdán S (2006) J. Cereb. Blood Flow Metab.
Chapter | 4
82
Chapter | 4 | Contents
083, Abstract
084, Introduction
085, Experimental Procedures Materials Cell Culture Recycling Experiments Substrate Switching Experiments 13C NMR Spectroscopy Cell Quantification and Analytical Methods Mathematical Model for Data Analysis Statistics
090, Results Lactate Metabolism in Primary Astrocytes Lactate Recycling in Brain Cells Modelling the Lactate Recycling in Brain Cells Characterization of the Observed Kinetics Determination of the Equilibrium Constants and Flux Partition Ratios Statistical Analysis of the Results Effect of Glucose, Lactate and Glutamate on the Kinetics of Lactate Metabolism
101, Discussion
103, Acknowledgements and Work Contributions
104, References

Lactate Recycling in Astrocytes and Neurons
83
ABSTRACT
We investigated the recycling of lactate between extracellular space and the
cytosolic pool of pyruvate through the monocarboxylate transporters of the plasma
membrane and the lactate dehydrogenase. For this purpose, primary cultures of
astrocytes and neurons were incubated in Krebs Ringer bicarbonate buffer
containing 50% 2H2O and [3-13C]lactate (1 to 20 mM). Samples of incubation
medium were collected at different times points and analyzed by 13C-NMR to
determine the deuteration kinetics of [3-13C]lactate. A mathematical model was
developed to analyse the time courses of lactate deuteration, which accounted for:
(i) the bidirectional lactate transport in and out of the cells, (ii) the intracellular
interconversion between lactate and pyruvate catalyzed by lactate dehydrogenase,
and (iii) the pyruvate consumption. Results demonstrate that lactate recycling
occurs in both cell types and increases with higher extracellular concentrations of
lactate. In the same conditions astrocytes showed to have a higher lactate
recycling activity than neurons, which was due to the differences in the reaction
rates of the lactate dehydrogenase isozymes. Lacate dehydrogenase was the rate
limiting step of lactate recycling process and favoured the neuronal pyruvate
consumption and the glial lactate production. The use of 13C-NMR spectroscopy to
detect deuteration in the geminal and vicinal positions of a carbon-13 labelled
precursor proved to be a powerful technique to study hydrogen turnover, providing
complementary information to the conventional 13C NMR method used to elucidate
carbon turnover.
Chapter | 4
84
INTRODUCTION
Lactate metabolism in brain cells is the cross road linking the glycolytic pathways to
the tricarboxylic acid cycles of astrocytes and neurons. In the astrocyte-neuron
lactate shuttle hypothesis (ANLSH) assumes that lactate is produced by astrocytes
and consumed by neurons (Pellerin and Magistretti, 1994). In agreement with this
theory, astrocytes and neurons express differently the isozymes and the transporters
required to metabolize lactate. Lactate transport is ensured in the mammalian brain
by the family of monocarboxylate transporters (MCT’s) (Bergersen et al., 2002). In
mouse it has been shown that astrocytes express only MCT1 and neurons MCT2
(Pierre et al., 2000). Similar evidences, obtained with rats, suggest that neurons only
express MCT2 but astrocytes may express both MCT1 and MCT2 (Gerhart et al.,
1998; Hanu et al., 2000). Transport kinetic studies performed on MCT-expressing
Xenopus laevis oocytes suggest that MCT1 and MCT2 favour the transport of lactate
outwards or inwards, respectively (Broer et al., 1997; Broer et al., 1998; Broer et al.,
1999), thus supporting the ANLSH. More recently MCT4 was shown to be expressed in
rat brain and characterized as being a transporter optimized for lactate release
(Dimmer et al., 2000). This transporter shows a differential expression pattern in the
brain, and it has been shown to be present in astrocytes and absent in neurons
(Bergersen et al., 2001; Rafiki et al., 2003).
Lactate dehydrogenase (LDH) has also been shown to be differently expressed in
neurons and astrocytes (Bittar et al., 1996; Laughton et al., 2000). Astrocytes express
LDH-5, the same isozyme expressed in muscle cells and thought to favour lactate
formation, while neurons express LDH-1, the heart type isozyme thought to favour
lactate consumption.
Lactate consumption and production has been shown to occur in cultures of
astrocytes or neurons but, to our knowledge, recycling of this metabolite has never
been investigated, probably because this is a difficult process to measure. By using
[3-13C]lactate and replacing 50% of the water (1H2O) in the incubation medium by
2H2O it became possible to follow lactate recycling (Rodrigues et al., 2005). In this
technique, the transported [3-13C]lactate is metabolized to [3-13C]pyruvate, which in
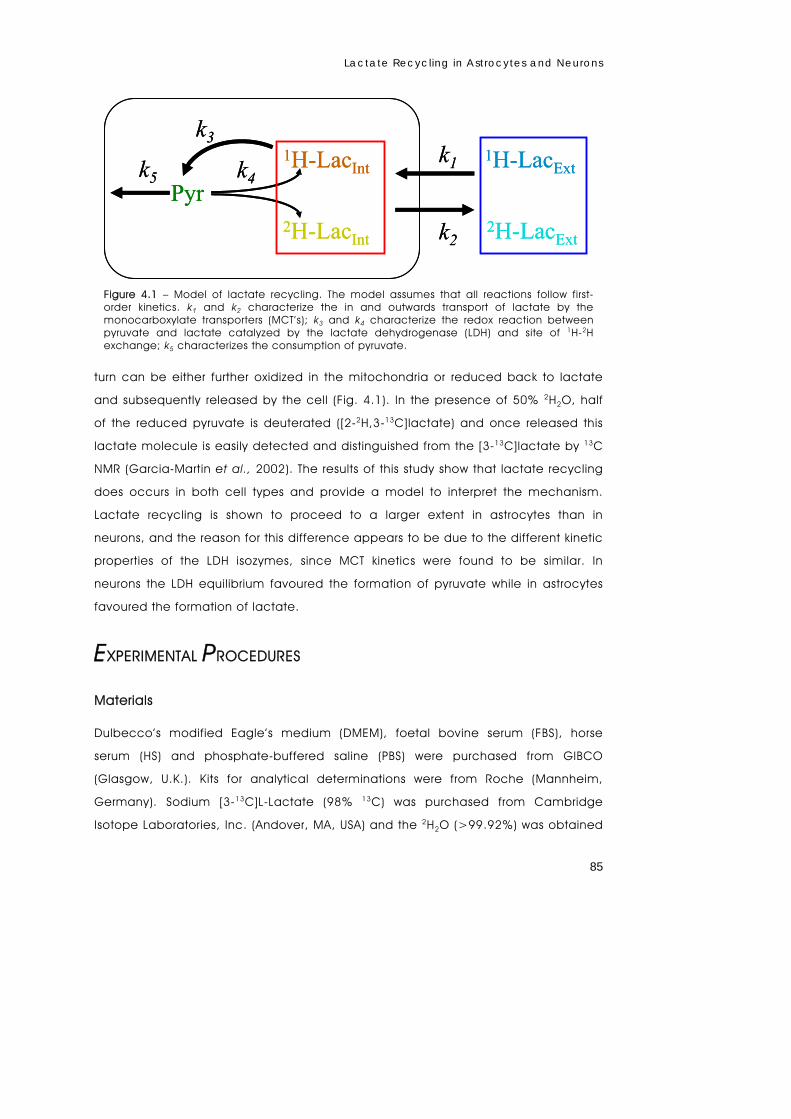
Lactate Recycling in Astrocytes and Neurons
85
turn can be either further oxidized in the mitochondria or reduced back to lactate
and subsequently released by the cell (Fig. 4.1). In the presence of 50% 2H2O, half
of the reduced pyruvate is deuterated ([2-2H,3-13C]lactate) and once released this
lactate molecule is easily detected and distinguished from the [3-13C]lactate by 13C
NMR (Garcia-Martin et al., 2002). The results of this study show that lactate recycling
does occurs in both cell types and provide a model to interpret the mechanism.
Lactate recycling is shown to proceed to a larger extent in astrocytes than in
neurons, and the reason for this difference appears to be due to the different kinetic
properties of the LDH isozymes, since MCT kinetics were found to be similar. In
neurons the LDH equilibrium favoured the formation of pyruvate while in astrocytes
favoured the formation of lactate.
EXPERIMENTAL PROCEDURES
Materials
Dulbecco’s modified Eagle’s medium (DMEM), foetal bovine serum (FBS), horse
serum (HS) and phosphate-buffered saline (PBS) were purchased from GIBCO
(Glasgow, U.K.). Kits for analytical determinations were from Roche (Mannheim,
Germany). Sodium [3-13C]L-Lactate (98% 13C) was purchased from Cambridge
Isotope Laboratories, Inc. (Andover, MA, USA) and the 2H2O (>99.92%) was obtained
1H-LacExt
2H-LacExt
1H-LacInt
2H-LacInt
Pyr
k1
k2
k3k4k5
1H-LacExt
2H-LacExt
1H-LacInt
2H-LacInt
Pyr
k1
k2
k3k4k5
Figure 4.1 – Model of lactate recycling. The model assumes that all reactions follow first-order kinetics. k1 and k2 characterize the in and outwards transport of lactate by the monocarboxylate transporters (MCT’s); k3 and k4 characterize the redox reaction between pyruvate and lactate catalyzed by the lactate dehydrogenase (LDH) and site of 1H-2H exchange; k5 characterizes the consumption of pyruvate.
Chapter | 4
86
from Apollo Scientific (Cheshire, UK). Other chemicals were of the purest grade
available from regular commercial sources.
Cell Culture
Primary cultures of cortical astrocytes were prepared from newborn (up to 2-day-old)
Wistar rats. In short, the cortices were removed and cleaned from the meninges. The
tissue obtained was minced, ressuspended with a pipette and vortexed for 1 minute.
The resulting suspension was passed through a 80 μm filter and the cells seeded in
poly-lysine coated 8 cm plate with 10 mL of DMEM containing 10% FBS, 10% HS,
10 mM HEPES, 2.5 μg/mL of fungizone and 100 U/mL of penicillin/streptomycin.
Plates were maintained in a humidified incubator chamber at 37ºC with 5% CO2.
After one week in culture cells were transferred to DMEM with 5% FBS, 5% HS, 10
mM HEPES, 2.5 μg/mL of fungizone and 100 U/mL of penicillin/streptomycin.
Confluent cultures were obtained and used for experiments after two weeks in
culture.
Primary cultures of cortical neurons were prepared from embryos of Wistar rats with
17 days of gestation. In short, after removal of the embryos, the brains were
removed, cleaned, and the cortical areas collected in a PBS solution with 6 mM
glucose and 1% BSA. The tissue obtained was minced and ressuspended with a
pipette. The suspension was passed through a 80 μm filter and the cells seeded at
1.3×10⁶ cells/mL in poly-lysine coated 8 cm plates with 10 mL of culture medium
(DMEM with 15 mM HEPES, 2.5 μg/mL of fungizone, 100 U/mL of
penicillin/streptomycin, 5 ng/mL Na2SeO4, 5 μg/mL insulin, 5 μg/mL transferrin,
6.3 ng/mL progesterone and 100 μM putrescine) containing 5% FBS, 5% HS. The
plates were maintained in a humidified incubator chamber at 37ºC with 5% CO2.
After 24 hours of culture, the cells were transferred to culture medium without serum
and maintained for 6 more days in culture. Cytosine β-D-arabinofuranoside (10 μM)
was added to the culture medium 48 hours before the experiments.
Lactate Recycling in Astrocytes and Neurons
87
Recycling Experiments
When ready for use, the plates with the primary cultures of brain cells were washed
with 5 mL of PBS and incubated with 12 mL of Krebs Ringer bicarbonate buffer
(119 mM NaCl, 24 mM HEPES, 4.7 mM KCl, 1.2 mM MgSO4, 1.2 mM KH2PO4 and
1.3 mM CaCl2, pH 7.4) in 50% 2H2O, containing different concentrations of
[3-13C]lactate (5 and 10 mM for neurons and 1, 5, 10 and 20 mM for astrocytes).
Samples of 600 μL of medium were taken at 0, 3, 6, 12, 24 and 48 hours of
incubation. After measuring the pH, each sample was heat inactivated by
incubation at 80ºC for 20 minutes, and centrifuged at 10,000×g for 10 minutes. The
supernatant solutions were saved and frozen until NMR analysis. At the end of the 48
hour period, after collection of the last sample, cells were washed and treated with
perchloric acid. The cell extracts were centrifuged at 10,000×g and 4ºC for 20 min
and the acid insoluble precipitate used to measure the total protein content.
Substrate Switching Experiments
Substrate switching experiments in astrocytes were carried out in cultured prepared
as described in Chapter 4. Glucose and lactate determination were quantified in
the culture medium using an YSI 2700 Select system (YSI Life Sciences, USA) under
the standard operation conditions advised by the supplier.
13C NMR Spectroscopy
Broad band proton decoupled 13C NMR spectra of the medium samples were
obtained at 11.7 Tesla with a Bruker Avance 500 WB spectrometer operating at
125.76 MHz. Spectra were acquired at 300 K, with 60º pulses and 7 s recycle time,
covering a 30 kHz sweep width. Spectra resulted from the sum of 700 FIDs, with 64k
points and zero-filled to 256k points prior to Fourier transformation. Broad band
proton decoupling was gated on during acquisition only. Chemical shifts were
calibrated with the resonance of a 10% (v/v) dioxane solution (67.4 ppm) placed in
a coaxial capillary. Quantification of the areas of the multiplets was achieved by
deconvolution using a MATLABTM program written for this purpose. Deconvolution was
performed by minimizing the difference between the acquired spectrum and a

Chapter | 4
88
simulated spectrum resulting from the sum of Pearson type VII functions (van Winden
et al., 2001).
Cell Quantification and Analytical Methods
Total protein was determined using kit 23220 from Pierce (Rockford, Md, USA).
Lactate was quantified in the culture medium using a spectrophotometric enzymatic
assay from Boehringer (Mannheim, Germany) kit 139084.
Mathematical Model for Data Analysis
A mathematical model was used to describe lactate recycling and the associated
kinetic processes (Fig. 4.1), which were modelled as having first-order kinetics (Φx=kx
[Substrate]). The model assumes three metabolite pools (extracellular and
intracellular lactate, and intracellular pyruvate), of which lactate can be found in
two forms (protonated and deuterated); two opposite transport reactions associated
with the activity of the MCT, characterized by the rate-constants k1 and k2; two
opposite reactions associated with the LDH activity and characterized by the rate-
constants k3 and k4; and one reaction for pyruvate consumption with the rate-
constant k5. The following equations were used to describe the lactate recycling:
where [1H-LacExt] and [1H-LacInt] represent the extra- and intracellular concentrations
of [3-13C]lactate; [2H-LacExt] and [2H-LacInt] are the extra and intracellular
concentrations of [3-13C, 2-2H]lactate; [Pyr] is the intracellular concentration of
[3-13C]pyruvate; k1-5 are the first-order kinetic constants associated to the five
[ ] [ ] [ ] ( )
[ ] [ ] [ ] ( )
[ ] [ ] [ ] [ ] [ ] ( ) ( )
[ ] [ ] [ ] [ ] [ ] ( )
[ ] [ ] [ ]( ) [ ] [ ] ( )4.5 Eq. PyrPyr Lac-HLac-H t
Pyr
4.4 Eq. PdPyrLac-HLac-HVV
Lac-HtLac-H
4.3 Eq. Pd1PyrLac-HLac-HVV
Lac-HtLac-H
4.2 Eq. VV
Lac-HLac-HtLac-H
4.1 Eq. VV
Lac-HLac-HtLac-H
Int2
Int1
Int2
Int2
i
eExt
2Int2
Int1
Int1
i
eExt
1Int1
e
iInt
2Ext
2Ext2
e
iInt
1Ext
1Ext1
543
4321
4321
21
21
kkk
kkkk
kkkk
kk
kk
⋅−⋅−⋅+=∂
∂
⋅⋅+⋅−⋅−⋅⋅=∂
∂
−⋅⋅+⋅−⋅−⋅⋅=∂
∂
⋅⋅+⋅−=∂
∂
⋅⋅+⋅−=∂
∂

Lactate Recycling in Astrocytes and Neurons
89
reactions (Fig. 4.1); Vi and Ve are the volumes of the intra and extracellular
compartments; and Pd is the probability of deuteration.
Since the transport reactions are associated with a change in compartments and
the intra and extracellular compartments have different volumes it was necessary to
correct the fluxes by converting intracellular concentrations into extracellular and
vice-versa. This was achieved by multiplying the concentrations by the ratio
between the volumes (Vi/Ve and Ve/Vi) of both compartments. The amount of
protonated or deuterated lactate formed from pyruvate was determined by the
probability of deuteration (Pd), hence the corresponding fluxes from pyruvate to
lactate characterized by k4 (eq. 4.3 and 4.4) were multiplied by either (1-Pd) or Pd. It
was assumed that the intracellular volumes of astrocytes and neurons are the same
and equal to 5.14 μL/mg protein (Bender et al., 1997), the initial concentration of
pyruvate was 0.143 mM, and the initial concentration of intracellular lactate was
1.32 mM. It was also assumed that both intra and extracellular lactate were, initially,
100% protonated. The probability of deuteration (Pd) was 0.5, due to the presence
of 50% 2H2O in the incubation medium. The space of possible solutions was
restricted to solutions where neither the concentration of pyruvate nor intracellular
lactate were able to attain values higher than the initial values.
Statistics
Results were presented as mean ± standard deviation. Two-tailed Student’s t-tests,
assuming unequal variances, were used to determine whether there were significant
differences between groups of samples under different experimental conditions. A
level of p < 0.05 was considered statistically significant. All experiments were
repeated three times in cell cultures prepared from different animals.

Chapter | 4
90
RESULTS
Lactate Metabolism in Primary Astrocytes
To study the metabolism of lactate in astrocytes a pulse of glucose was supplied to
a primary culture of astrocytes and the lactate production was followed. The
astrocytes rapidly consumed the supplied glucose (5 mM) and 20 hours later less
than 1 mM was left (Fig. 4.2). Concomitantly, there was the production of lactate
with the usual lactate to glucose ratio of 1.65 ± 0.05 (during the first 20 hours). This
production was only sustained while glucose was present in the medium. After
glucose exhaustion, cells switched to the consumption of lactate (from 40 hours
onwards). By assuming that the metabolism of glucose results in the production of
A
0
3
6
9
12
Con
cen
trat
ion
s (m
M)
B
-5
5
15
25
Flu
xes
(µm
ol/h
)
C
0
1
2
3
4
5
Flu
x (µ
mol
/h)
-5
0
0 40 80 120 160
Time (hours) Figure 4.2 – Glucose and lactate metabolism of a primary culture of astrocytes in a T-flask. In A, the time course of the concentrations of glucose ( ) and lactate () in the culture medium (DMEM containing 10% FBS, 1% penicillin/streptomycin). In B, the time course of the fluxes of glucose consumption (in pyruvate units ▬▬) and of lactate release (▬▬). In C, the time course of pyruvate oxidation (▬▬) in the same culture.
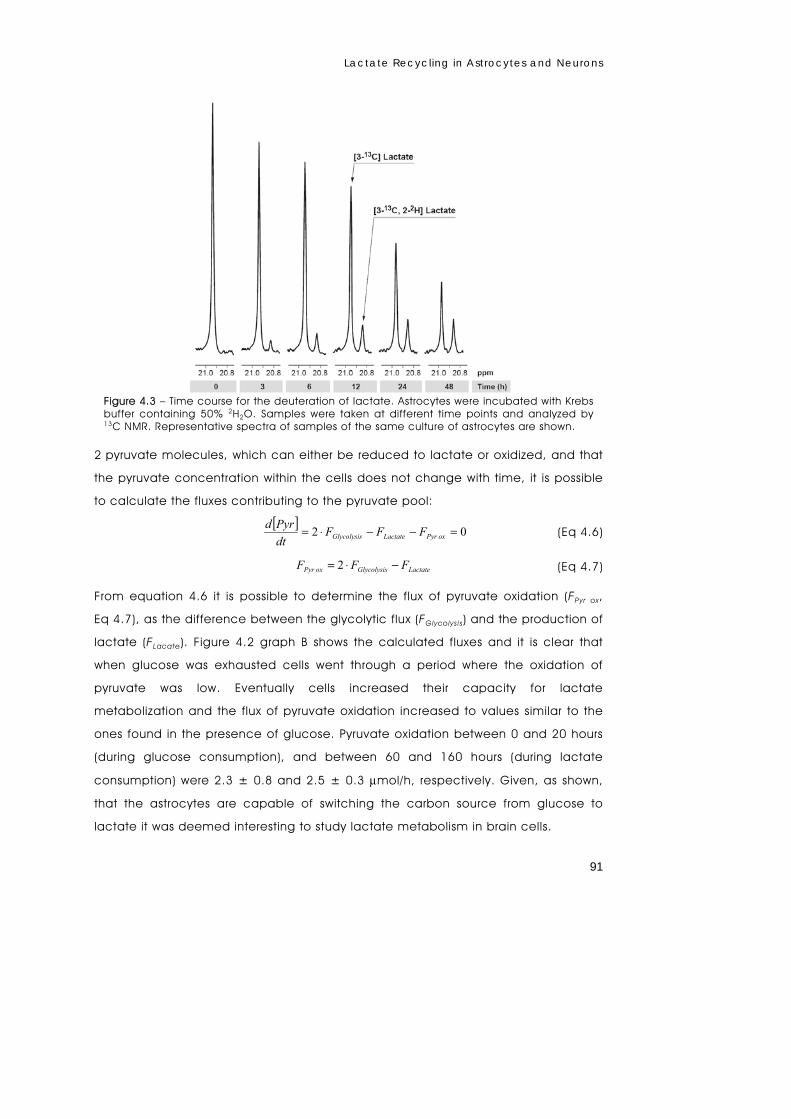
Lactate Recycling in Astrocytes and Neurons
91
2 pyruvate molecules, which can either be reduced to lactate or oxidized, and that
the pyruvate concentration within the cells does not change with time, it is possible
to calculate the fluxes contributing to the pyruvate pool:
[ ]02 =−−⋅= oxPyrLactateGlycolysis FFF
dtPyrd (Eq 4.6)
LactateGlycolysisoxPyr FFF −⋅= 2 (Eq 4.7)
From equation 4.6 it is possible to determine the flux of pyruvate oxidation (FPyr ox,
Eq 4.7), as the difference between the glycolytic flux (FGlycolys is) and the production of
lactate (FLacate). Figure 4.2 graph B shows the calculated fluxes and it is clear that
when glucose was exhausted cells went through a period where the oxidation of
pyruvate was low. Eventually cells increased their capacity for lactate
metabolization and the flux of pyruvate oxidation increased to values similar to the
ones found in the presence of glucose. Pyruvate oxidation between 0 and 20 hours
(during glucose consumption), and between 60 and 160 hours (during lactate
consumption) were 2.3 ± 0.8 and 2.5 ± 0.3 μmol/h, respectively. Given, as shown,
that the astrocytes are capable of switching the carbon source from glucose to
lactate it was deemed interesting to study lactate metabolism in brain cells.
Figure 4.3 – Time course for the deuteration of lactate. Astrocytes were incubated with Krebs buffer containing 50% 2H2O. Samples were taken at different time points and analyzed by 13C NMR. Representative spectra of samples of the same culture of astrocytes are shown.
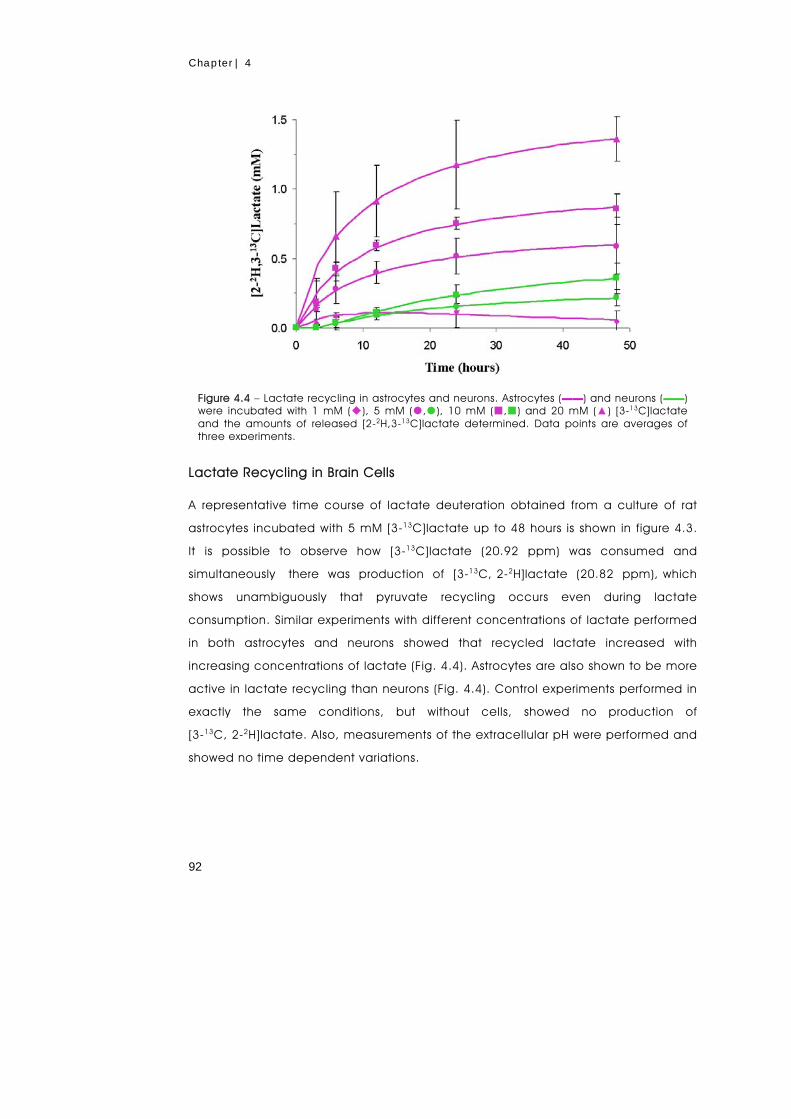
Chapter | 4
92
Lactate Recycling in Brain Cells
A representative time course of lactate deuteration obtained from a culture of rat
astrocytes incubated with 5 mM [3-13C]lactate up to 48 hours is shown in figure 4.3.
It is possible to observe how [3-13C]lactate (20.92 ppm) was consumed and
simultaneously there was production of [3-13C, 2-2H]lactate (20.82 ppm), which
shows unambiguously that pyruvate recycling occurs even during lactate
consumption. Similar experiments with different concentrations of lactate performed
in both astrocytes and neurons showed that recycled lactate increased with
increasing concentrations of lactate (Fig. 4.4). Astrocytes are also shown to be more
active in lactate recycling than neurons (Fig. 4.4). Control experiments performed in
exactly the same conditions, but without cells, showed no production of
[3-13C, 2-2H]lactate. Also, measurements of the extracellular pH were performed and
showed no time dependent variations.
Figure 4.4 – Lactate recycling in astrocytes and neurons. Astrocytes (▬▬) and neurons (▬▬) were incubated with 1 mM (), 5 mM (,), 10 mM (,) and 20 mM (▲) [3-13C]lactate and the amounts of released [2-2H,3-13C]lactate determined. Data points are averages of three experiments.

Lactate Recycling in Astrocytes and Neurons
93
Modelling the Lactate Recycling in Brain Cells
To extract information on the reactions behind these results (Figs. 4.3 and 4.4) a
mathematical model was developed which included the transport reactions of the
MCT, the LDH reactions and the reaction of consumption of pyruvate (Fig. 4.1). The
results obtained with this modelling approach are illustrated in Figure 4.5 for the
data obtained from an incubation of cortical astrocytes with 5 mM of [3-13C]lactate.
Figure 4.5 – Results obtained by fitting the data presented in A to the mathematical model described in Experimental Procedures. In A, the points represent experimental concentrations of protonated and deuterated extracellular lactate ( - [3-13C]lactate; ▲ - [2-2H,3-13C]lactate) and the lines are the best fits obtained from the model (▬▬ [3-13C]lactate; ▬▬ [2-2H,3-13C]lactate). In B, the total concentrations of extracellular lactate (▬▬), intracellular lactate (▬▬) and pyruvate (▬▬) obtained from the model and the experimental values for the total extracellular lactate () are shown. In C, the percentage of deuteration in extracellular (▬▬) and intracellular (▬▬) lactate obtained from the model as well as the experimentally obtained percentage of deuteration of the extracellular lactate () are shown. In D, scheme of the lactate recycling pathway.
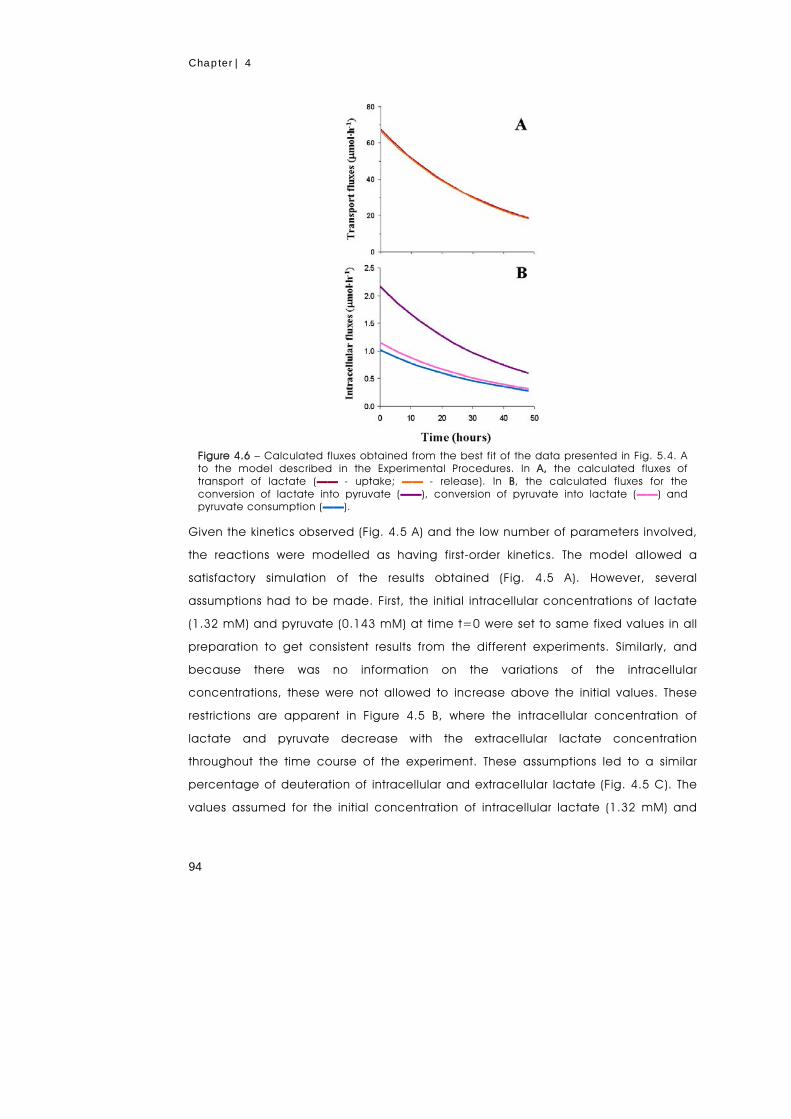
Chapter | 4
94
Given the kinetics observed (Fig. 4.5 A) and the low number of parameters involved,
the reactions were modelled as having first-order kinetics. The model allowed a
satisfactory simulation of the results obtained (Fig. 4.5 A). However, several
assumptions had to be made. First, the initial intracellular concentrations of lactate
(1.32 mM) and pyruvate (0.143 mM) at time t=0 were set to same fixed values in all
preparation to get consistent results from the different experiments. Similarly, and
because there was no information on the variations of the intracellular
concentrations, these were not allowed to increase above the initial values. These
restrictions are apparent in Figure 4.5 B, where the intracellular concentration of
lactate and pyruvate decrease with the extracellular lactate concentration
throughout the time course of the experiment. These assumptions led to a similar
percentage of deuteration of intracellular and extracellular lactate (Fig. 4.5 C). The
values assumed for the initial concentration of intracellular lactate (1.32 mM) and
Figure 4.6 – Calculated fluxes obtained from the best fit of the data presented in Fig. 5.4. A to the model described in the Experimental Procedures. In A, the calculated fluxes of transport of lactate (▬▬ - uptake; ▬▬ - release). In B, the calculated fluxes for the conversion of lactate into pyruvate (▬▬), conversion of pyruvate into lactate (▬▬) and pyruvate consumption (▬▬).
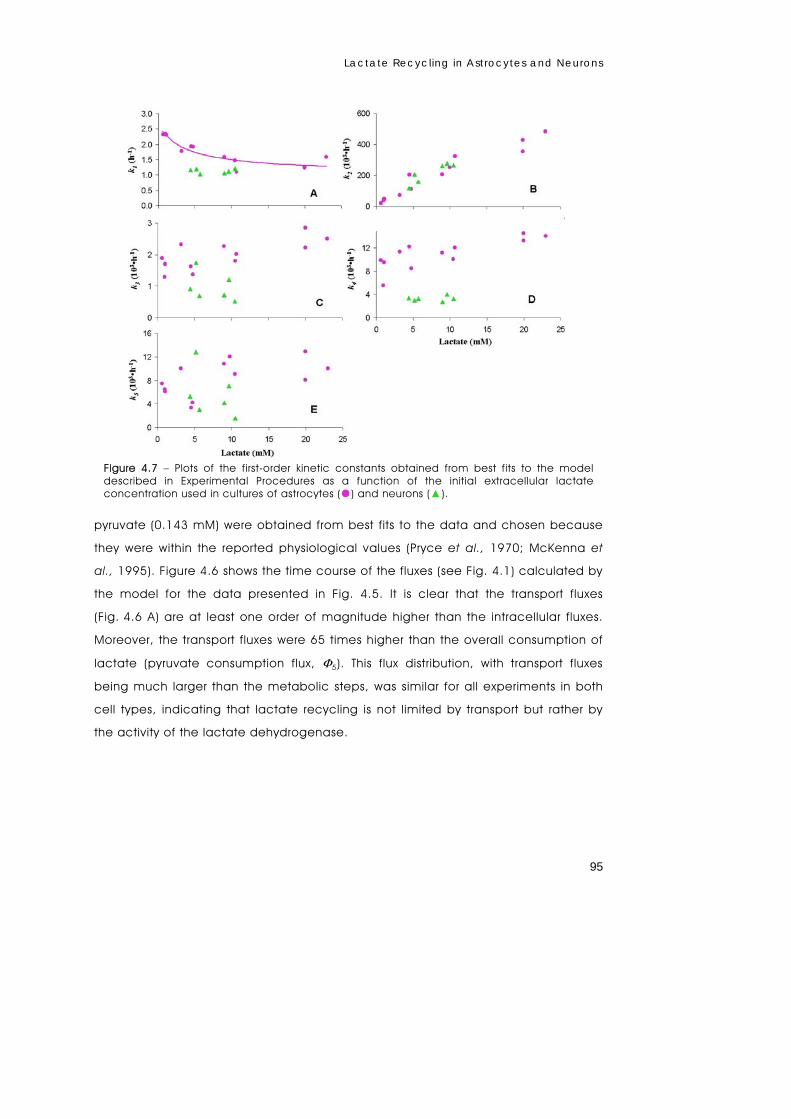
Lactate Recycling in Astrocytes and Neurons
95
pyruvate (0.143 mM) were obtained from best fits to the data and chosen because
they were within the reported physiological values (Pryce et al., 1970; McKenna et
al., 1995). Figure 4.6 shows the time course of the fluxes (see Fig. 4.1) calculated by
the model for the data presented in Fig. 4.5. It is clear that the transport fluxes
(Fig. 4.6 A) are at least one order of magnitude higher than the intracellular fluxes.
Moreover, the transport fluxes were 65 times higher than the overall consumption of
lactate (pyruvate consumption flux, Φ5). This flux distribution, with transport fluxes
being much larger than the metabolic steps, was similar for all experiments in both
cell types, indicating that lactate recycling is not limited by transport but rather by
the activity of the lactate dehydrogenase.
Figure 4.7 – Plots of the first-order kinetic constants obtained from best fits to the model described in Experimental Procedures as a function of the initial extracellular lactate concentration used in cultures of astrocytes () and neurons (▲).
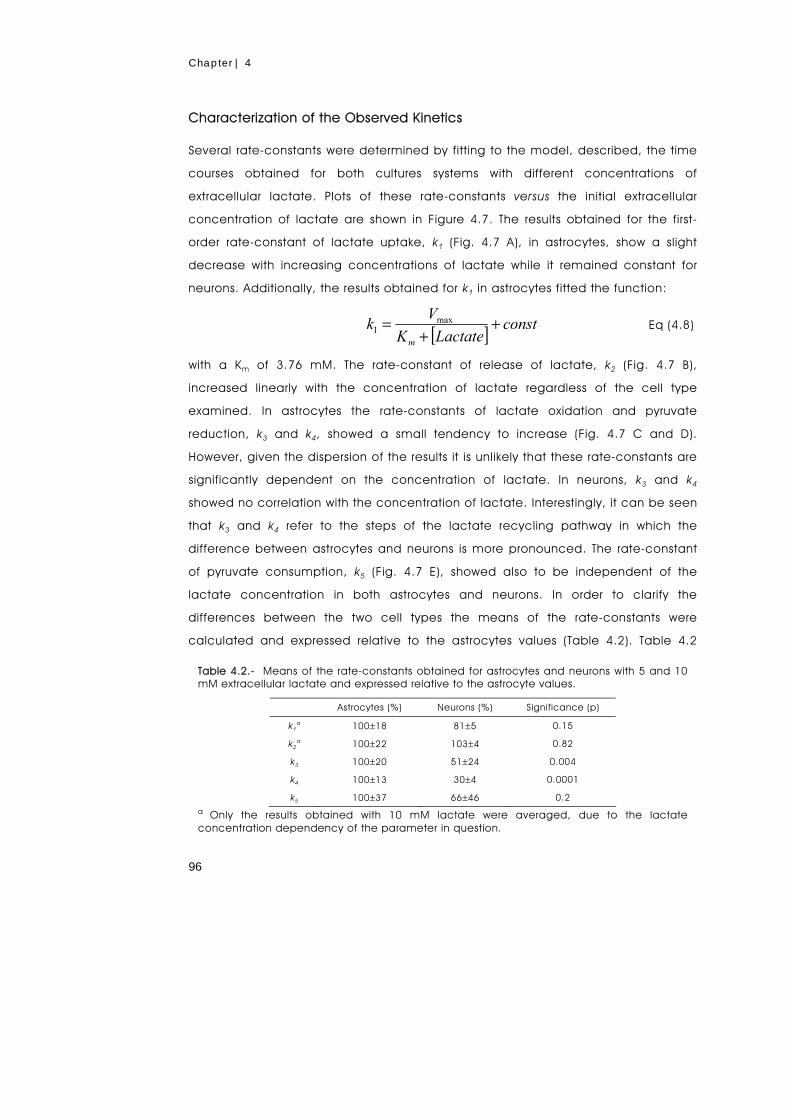
Chapter | 4
96
Characterization of the Observed Kinetics
Several rate-constants were determined by fitting to the model, described, the time
courses obtained for both cultures systems with different concentrations of
extracellular lactate. Plots of these rate-constants versus the initial extracellular
concentration of lactate are shown in Figure 4.7. The results obtained for the first-
order rate-constant of lactate uptake, k1 (Fig. 4.7 A), in astrocytes, show a slight
decrease with increasing concentrations of lactate while it remained constant for
neurons. Additionally, the results obtained for k1 in astrocytes fitted the function:
[ ] constLactateKVk
m
++
= max1 Eq (4.8)
with a Km of 3.76 mM. The rate-constant of release of lactate, k2 (Fig. 4.7 B),
increased linearly with the concentration of lactate regardless of the cell type
examined. In astrocytes the rate-constants of lactate oxidation and pyruvate
reduction, k3 and k4, showed a small tendency to increase (Fig. 4.7 C and D).
However, given the dispersion of the results it is unlikely that these rate-constants are
significantly dependent on the concentration of lactate. In neurons, k3 and k4
showed no correlation with the concentration of lactate. Interestingly, it can be seen
that k3 and k4 refer to the steps of the lactate recycling pathway in which the
difference between astrocytes and neurons is more pronounced. The rate-constant
of pyruvate consumption, k5 (Fig. 4.7 E), showed also to be independent of the
lactate concentration in both astrocytes and neurons. In order to clarify the
differences between the two cell types the means of the rate-constants were
calculated and expressed relative to the astrocytes values (Table 4.2). Table 4.2
Table 4.2.- Means of the rate-constants obtained for astrocytes and neurons with 5 and 10 mM extracellular lactate and expressed relative to the astrocyte values.
Astrocytes (%) Neurons (%) Significance (p)
k1a 100±18 81±5 0.15
k2a 100±22 103±4 0.82
k3 100±20 51±24 0.004
k4 100±13 30±4 0.0001
k5 100±37 66±46 0.2 a Only the results obtained with 10 mM lactate were averaged, due to the lactate concentration dependency of the parameter in question.
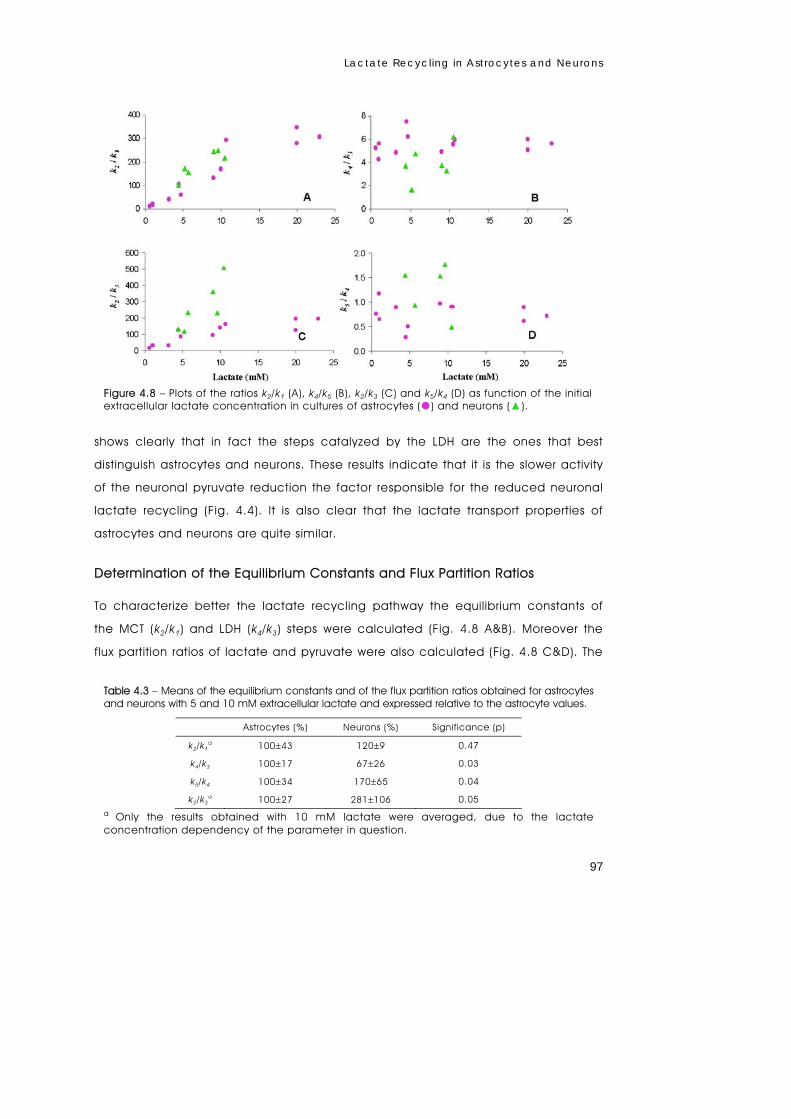
Lactate Recycling in Astrocytes and Neurons
97
shows clearly that in fact the steps catalyzed by the LDH are the ones that best
distinguish astrocytes and neurons. These results indicate that it is the slower activity
of the neuronal pyruvate reduction the factor responsible for the reduced neuronal
lactate recycling (Fig. 4.4). It is also clear that the lactate transport properties of
astrocytes and neurons are quite similar.
Determination of the Equilibrium Constants and Flux Partition Ratios
To characterize better the lactate recycling pathway the equilibrium constants of
the MCT (k2/k1) and LDH (k4/k3) steps were calculated (Fig. 4.8 A&B). Moreover the
flux partition ratios of lactate and pyruvate were also calculated (Fig. 4.8 C&D). The
Figure 4.8 – Plots of the ratios k2/k1 (A), k4/k5 (B), k2/k3 (C) and k5/k4 (D) as function of the initial extracellular lactate concentration in cultures of astrocytes () and neurons (▲).
Table 4.3 – Means of the equilibrium constants and of the flux partition ratios obtained for astrocytes and neurons with 5 and 10 mM extracellular lactate and expressed relative to the astrocyte values.
Astrocytes (%) Neurons (%) Significance (p)
k2/k1a 100±43 120±9 0.47
k4/k3 100±17 67±26 0.03
k5/k4 100±34 170±65 0.04
k2/k3a 100±27 281±106 0.05
a Only the results obtained with 10 mM lactate were averaged, due to the lactate concentration dependency of the parameter in question.
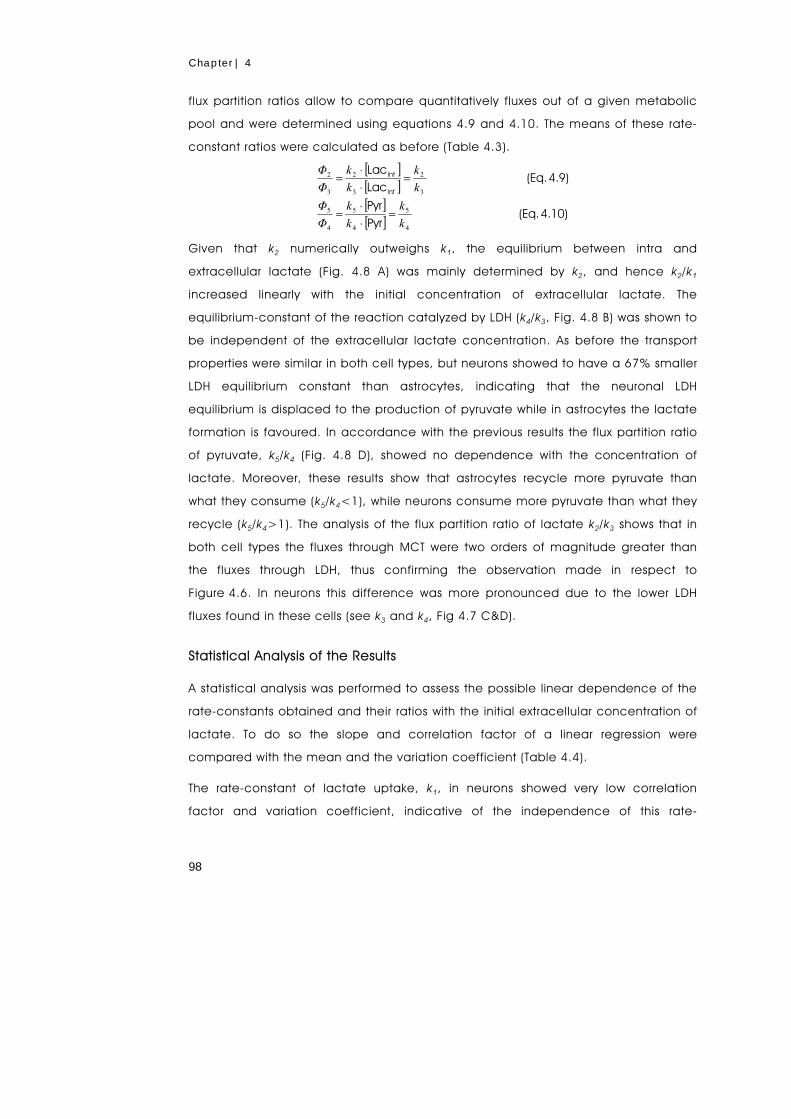
Chapter | 4
98
flux partition ratios allow to compare quantitatively fluxes out of a given metabolic
pool and were determined using equations 4.9 and 4.10. The means of these rate-
constant ratios were calculated as before (Table 4.3).
[ ][ ][ ][ ] 4.10) (Eq. PyrPyr
4.9) (Eq. LacLac
Int
Int
4
5
4
5
4
5
3
2
3
2
3
2
kk
kk
ΦΦ
kk
kk
ΦΦ
=⋅⋅
=
=⋅⋅
=
Given that k2 numerically outweighs k1, the equilibrium between intra and
extracellular lactate (Fig. 4.8 A) was mainly determined by k2, and hence k2/k1
increased linearly with the initial concentration of extracellular lactate. The
equilibrium-constant of the reaction catalyzed by LDH (k4/k3, Fig. 4.8 B) was shown to
be independent of the extracellular lactate concentration. As before the transport
properties were similar in both cell types, but neurons showed to have a 67% smaller
LDH equilibrium constant than astrocytes, indicating that the neuronal LDH
equilibrium is displaced to the production of pyruvate while in astrocytes the lactate
formation is favoured. In accordance with the previous results the flux partition ratio
of pyruvate, k5/k4 (Fig. 4.8 D), showed no dependence with the concentration of
lactate. Moreover, these results show that astrocytes recycle more pyruvate than
what they consume (k5/k4<1), while neurons consume more pyruvate than what they
recycle (k5/k4>1). The analysis of the flux partition ratio of lactate k2/k3 shows that in
both cell types the fluxes through MCT were two orders of magnitude greater than
the fluxes through LDH, thus confirming the observation made in respect to
Figure 4.6. In neurons this difference was more pronounced due to the lower LDH
fluxes found in these cells (see k3 and k4, Fig 4.7 C&D).
Statistical Analysis of the Results
A statistical analysis was performed to assess the possible linear dependence of the
rate-constants obtained and their ratios with the initial extracellular concentration of
lactate. To do so the slope and correlation factor of a linear regression were
compared with the mean and the variation coefficient (Table 4.4).
The rate-constant of lactate uptake, k1, in neurons showed very low correlation
factor and variation coefficient, indicative of the independence of this rate-
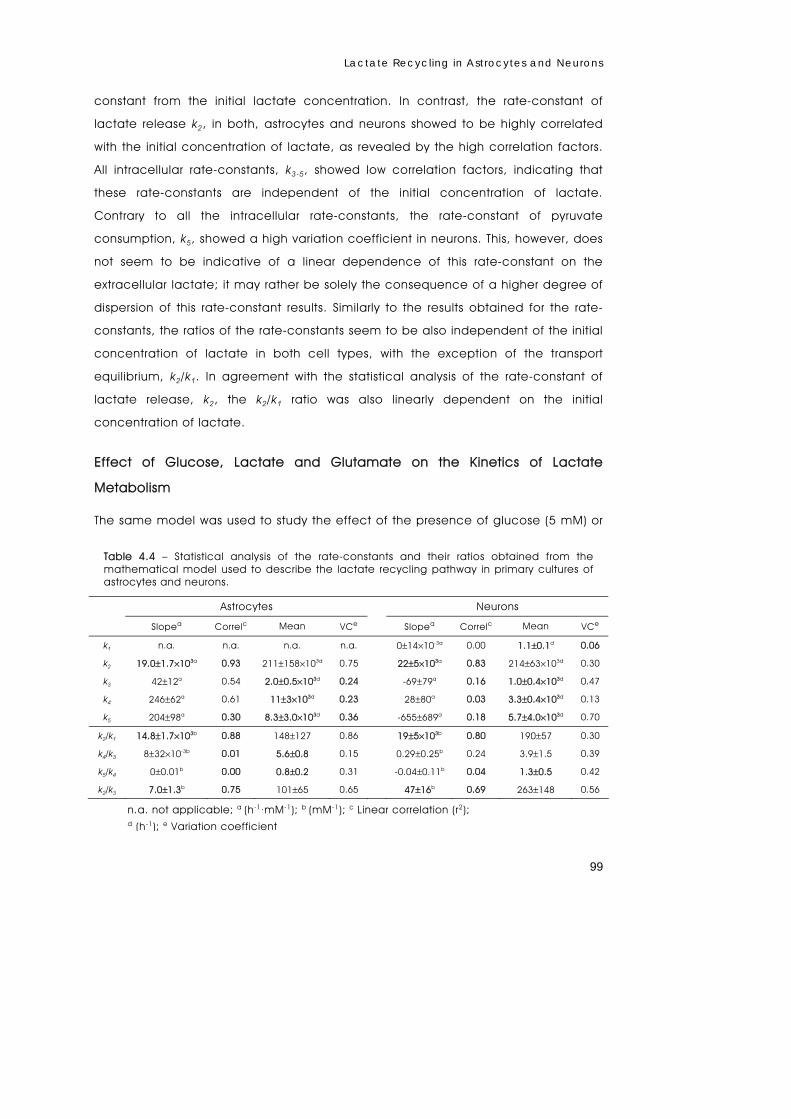
Lactate Recycling in Astrocytes and Neurons
99
constant from the initial lactate concentration. In contrast, the rate-constant of
lactate release k2, in both, astrocytes and neurons showed to be highly correlated
with the initial concentration of lactate, as revealed by the high correlation factors.
All intracellular rate-constants, k3-5, showed low correlation factors, indicating that
these rate-constants are independent of the initial concentration of lactate.
Contrary to all the intracellular rate-constants, the rate-constant of pyruvate
consumption, k5, showed a high variation coefficient in neurons. This, however, does
not seem to be indicative of a linear dependence of this rate-constant on the
extracellular lactate; it may rather be solely the consequence of a higher degree of
dispersion of this rate-constant results. Similarly to the results obtained for the rate-
constants, the ratios of the rate-constants seem to be also independent of the initial
concentration of lactate in both cell types, with the exception of the transport
equilibrium, k2/k1. In agreement with the statistical analysis of the rate-constant of
lactate release, k2, the k2/k1 ratio was also linearly dependent on the initial
concentration of lactate.
Effect of Glucose, Lactate and Glutamate on the Kinetics of Lactate
Metabolism
The same model was used to study the effect of the presence of glucose (5 mM) or
Table 4.4 – Statistical analysis of the rate-constants and their ratios obtained from the mathematical model used to describe the lactate recycling pathway in primary cultures of astrocytes and neurons.
Astrocytes Neurons
Slopea Correlc Mean VCe Slopea Correlc Mean VCe
k1 n.a. n.a. n.a. n.a. 0±14×10-3a 0.00 1.1±0.1d 0.06
k2 19.0±1.7×10³a 0.93 211±158×103d 0.75 22±5×10³a 0.83 214±63×103d 0.30
k3 42±12a 0.54 2.0±0.5×10³d 0.24 -69±79a 0.16 1.0±0.4×10³d 0.47
k4 246±62a 0.61 11±3×10³d 0.23 28±80a 0.03 3.3±0.4×10³d 0.13
k5 204±98a 0.30 8.3±3.0×10³d 0.36 -655±689a 0.18 5.7±4.0×10³d 0.70
k2/k1 14.8±1.7×10³b 0.88 148±127 0.86 19±5×10³b 0.80 190±57 0.30
k4/k3 8±32×10-3b 0.01 5.6±0.8 0.15 0.29±0.25b 0.24 3.9±1.5 0.39
k5/k4 0±0.01b 0.00 0.8±0.2 0.31 -0.04±0.11b 0.04 1.3±0.5 0.42
k2/k3 7.0±1.3b 0.75 101±65 0.65 47±16b 0.69 263±148 0.56
n.a. not applicable; a (h-1·mM-1); b (mM-1); c Linear correlation (r2); d (h-1); e Variation coefficient

Chapter | 4
100
glutamate (500 μM) and the effect of a pre-incubation of 3 days with media
containing 10 mM of lactate (without glucose) in astrocytes (Fig 4.9). All effects were
studied as described above but for a single concentration of lactate (10 mM). As it
can be seen in Figure 4.9, co-incubation with glucose (5 mM) increased the rate-
constants of both reactions catalyzed the LDH and of both transport steps mediated
by the MCT. Also noteworthy is the fact that the increments in k4 and k2 were higher
than the increments in k3 and k1, thus showing a preference for an increased
release of lactate rather than an increase in the uptake. Glucose, however, showed
no effect on the first-order rate-constant of pyruvate consumption. Given that
astrocytes seem to require some time to adapt to lactate consumption (Fig 4.2),
these cells were supplied with culture media containing 10 mM of lactate (without
glucose), 3 days before the study of the kinetic properties of the lactate recycling
pathway. In these astrocytes, no significant differences were found in the lactate
transport process. However, the rate-constants of both reactions coupled to the LDH
0.0
0.5
1.0
1.5
2.0
2.5
K1
0
200
400
600
K2
k 1(h
-1)
k 2(1
03 •h-1
)
k1 k2
0
2
4
6
K3
0
5
10
15
20
25
30
35
K4
0
5
10
15
20
25
30
K5
k 3(1
03 •h-1
)
k 4(1
03 •h-1
)
k 5(1
03 •h-1
)
k3 k4 k5
0.0
0.5
1.0
1.5
2.0
2.5
K1
0
200
400
600
K2
k 1(h
-1)
k 2(1
03 •h-1
)
k1 k2
0
2
4
6
K3
0
5
10
15
20
25
30
35
K4
0
5
10
15
20
25
30
K5
k 3(1
03 •h-1
)
k 4(1
03 •h-1
)
k 5(1
03 •h-1
)
k3 k4 k5 Figure 4.9 – Effects of co-incubation with 5 mM glucose (), or 500 μM of glutamate () and of pre-incubation for 3 days with 10 mM lactate () on the first-order rate-constants (k1, k2, k3, k4 and k5) determined from best fits to the model, for incubations with an initial concentration of [3-13C]lactate of 10 mM. Control values are also plotted () for reference.
Lactate Recycling in Astrocytes and Neurons
101
and of pyruvate consumption were increased. Co-incubation with glutamate
(500 μM) had no effect on the recycling of lactate.
DISCUSSION
Transport and metabolism of lactate are the key components in the hypothesis of
metabolic coupling between astrocytes and neurons. It has been shown that both
LDH and MCT isoforms are differentially and selectively distributed in these brain
cells; moreover, the distribution and kinetic properties of these isoforms support the
astrocyte-neuron lactate shuttle hypothesis (Pellerin and Magistretti, 2004). The
results obtained in the present study show that the rate-constants determined for
MCT were similar in neurons and astrocytes, but the same does not hold true for the
LDH equilibrium. In neurons the LDH equilibrium was more displaced towards the
production of pyruvate than in astrocytes. Additionally, neurons showed lower values
for the two rate-constants associated with the LDH reaction than astrocytes, thus
resulting in a slower responding equilibrium. Moreover, the flux partitioning at the
level of pyruvate clearly distinguishes the two cell types. While neurons consumed
more pyruvate than what they recycled back to lactate, astrocytes recycled more
pyruvate than what they consumed. These conclusions are in agreement with the
proposed model of lactate shuttling between astrocytes and neurons and it does
suggest that the distinctive behaviour of neurons and astrocytes in respect to the
fate of pyruvate is mainly due to differences at the level of the LDH isoforms rather
than to differences of the expressed MCT’s. In fact, the transport properties of both
cell types under the same conditions were similar, despite the different MCT isoform
expressed. However, given the lower Km of the neuronal lactate uptake system (Broer
et al., 1999), it is possible that in vivo the neuronal transporter outweighs its
astrocytic counterpart. In any case no differences between neurons and astrocytes
were found as far as the release of lactate is concerned.
The presence of glucose altered the flux distribution in the astrocytes. In fact
glucose increased the rates of the LDH and of MCT in both directions, which may be
due to an increased flux of glycolytic unlabeled pyruvate to lactate. This view is
corroborated also by the fact that the increases were higher in the rate-constants of
Chapter | 4
102
the reactions involved in the production and release of lactate This is indicative of a
shift of the equilibrium-constants, compatible with an increased flux of release of
unlabeled lactate. As shown, astrocytes were capable of switching from glucose to
lactate consumption. However this adaptation was not instantaneous, but it rather
took some time to occur (24 to 36 hours). Afterwards, astrocytes showed an effective
consumption of pyruvate, similar to the one found during glucose utilization. Similar
observations have been made in C6 glioma cells by Bouzier and collaborators,
(1998) who found that these cells had values of net 3-carbon unit entry in the same
range for both glucose or lactate consumption (350 and 265±95 nmol/h/mg of
protein, respectively). Also similar was the 75% yield of glucose conversion into
lactate. Culturing the astrocytes for 3 days in media with 10 mM lactate and without
glucose, before measuring lactate recycling, allowed the cells to adapt to this
substrate. This adaptation resulted in a faster equilibrium at the level of the LDH and
in an increased rate of consumption of pyruvate. However, it did not change the
rates of transport of lactate in either direction.
The simple model developed in this work, allowed retrieving useful information out of
the experimental data. Nevertheless, some assumptions had to be made to reduce
the space of possible solutions. While the assumption of first-order kinetics was valid
for the intracellular reactions, it was not satisfactory for the transport reactions as
evidenced by the dependence of the calculated rate constants on the extracellular
lactate concentration (Fig. 4.7). This differentiated behaviour was probably due to
the different range of substrate concentrations experienced by the enzymes and
transporters. In intracellular reactions the changes in substrate concentrations are
small and probably within the range of the Km of the enzymes, thus allowing the first-
order kinetics to be a good linear approximation of the Michaelis-Menten kinetics. In
the transport reactions the extracellular components may experience a wider range
of substrate concentrations, to which the linear approximation may not yield good
fits. As shown in Figure 4.7 A, the rate-constant for lactate uptake, k1, in astrocytes
could be fitted to the function Vmax/(Km+[LacExt]), which indicates that the uptake flux
(Φ1=k1 [LacExt]) had a Michaelian kinetics with a Km of 3.76 mM. In contrast, the
rate-constants determined for the release of lactate (k2) were linearly dependent on
the concentration of the “reaction product”, i.e., the extracellular concentration of
lactate. This odd feature probably reflects the limitation of the assumptions used,
which imposed an initial intracellular lactate concentration of 1.32 mM and did not

Lactate Recycling in Astrocytes and Neurons
103
allow solutions with the intracellular lactate concentration above this threshold. In
fact, given the nature of the facilitated lactate transport (Hertz and Dienel, 2005), it
is conceivable that increasing concentrations of extracellular lactate would lead to
increasing concentrations of intracellular lactate. By imposing a lack of
dependence of the intracellular lactate concentration on the extracellular lactate
concentration, this dependency was transferred to the rate-constant. Attempts to
avoid these discrepancies were made assuming that all reactions followed
Michaelis-Menten kinetics, but this led to an excessive number of degrees of
freedom for the available data. Furthermore, when it was assumed that all reactions
had first-order kinetics except for the uptake of lactate which was assumed to follow
Michaelis-Menten kinetics, the model did not generate satisfactory fits to the data.
Despite these drawbacks the conclusions rendered by the model were validated by
comparison with data from other authors. The Km of 3.76 mM obtained is in excellent
agreement with the published Km of 3.5 mM measured for MCT1 produced in
Xenopus laevis oocytes (Carpenter and Halestrap 1994; Broer et al., 1997), and is
within the same range of the Km of 7.7 mM reported for astrocytes (Broer et al.,
1997). Moreover, the reported Km’s for lactate uptake in neurons (0.4 mM,
Nedergaard and Goldman 1993) and in Xenopus laevis oocytes expressing MCT2
(0.74 mM, Broer et al., 1999), are lower than 1 mM, which could explain why in the
range of lactate concentrations examined in neurons (5-10 mM), the rate-constant
k1 showed to be independent of the extracellular lactate concentration.
In conclusion, data presented here shows that astrocytes have a greater lactate
recycling capacity than neurons, and that lactate has clearly different fates in
neurons and astrocytes. These differences were primarily due to the LDH properties,
since the monocarboxylate transporters performed very similar in both cell types.
ACKNOWLEDGEMENTS AND WORK CONTRIBUTIONS
We are grateful to Alejandra Sierra, IIB-CSCI, Madrid, Spain for the assistance
rendered in the cellular preparation, in the lactate recycling experiments, in the
samples analysis, and in the 13C-NMR spectra recording.
Chapter | 4
104
REFERENCES
Bender A. S., Young L. P. and Norenberg M. D. (1997) Effect of lactic acid on
L-glutamate uptake in cultured astrocytes: mechanistic considerations. Brain
Res. 750, 59-66.
Bergersen L., Rafiki A. and Ottersen O. P. (2002) Immunogold cytochemistry identifies
specialized membrane domains for monocarboxylate transport in the central
nervous system. Neurochem. Res. 27, 89-96.
Bergersen L., Waerhaug O., Helm J., Thomas M., Laake P., Davies A. J., Wilson M. C.,
Halestrap A. P. and Ottersen O. P. (2001) A novel postsynaptic density protein:
the monocarboxylate transporter MCT2 is co-localized with delta-glutamate
receptors in postsynaptic densities of parallel fiber-Purkinje cell synapses. Exp.
Brain Res. 136, 523-534.
Bittar P. G., Charnay Y., Pellerin L., Bouras C. and Magistretti P. J. (1996) Selective
distribution of lactate dehydrogenase isoenzymes in neurons and astrocytes of
human brain. J. Cereb. Blood Flow Metab. 16, 1079-1089.
Bouzier A. K., Goodwin R., de Gannes F. M., Valeins H., Voisin P., Canioni P., Merle M.
(1998) Compartmentation of lactate and glucose metabolism in C6 glioma
cells. A 13C and 1H NMR study. J. Biol. Chem. 273, 27162-27169.
Broer S., Broer A., Schneider H. P., Stegen C., Halestrap A. P. and Deitmer J. W.
(1999) Characterization of the high-affinity monocarboxylate transporter MCT2
in Xenopus laevis oocytes. Biochem. J. 341, 529-535.
Broer S., Rahman B., Pellegri G., Pellerin L., Martin J. L., Verleysdonk S., Hamprecht B.
and Magistretti P. J. (1997) Comparison of lactate transport in astroglial cells
and monocarboxylate transporter 1 (MCT 1) expressing Xenopus laevis
oocytes. Expression of two different monocarboxylate transporters in astroglial
cells and neurons. J. Biol. Chem. 272, 30096-30102.
Broer S., Schneider H. P., Broer A., Rahman B., Hamprecht B. and Deitmer J. W.
(1998) Characterization of the monocarboxylate transporter 1 expressed in
Xenopus laevis oocytes by changes in cytosolic pH. Biochem. J. 333, 167-
174.

Lactate Recycling in Astrocytes and Neurons
105
Carpenter L. and Halestrap A. P. (1994) The kinetics, substrate and inhibitor
specificity of the lactate transporter of Ehrlich-Lettre tumour cells studied with
the intracellular pH indicator BCECF. Biochem. J. 304, 751-760.
Dimmer K. S., Friedrich B., Lang F., Deitmer J. W. and Broer S. (2000) The low-affinity
monocarboxylate transporter MCT4 is adapted to the export of lactate in
highly glycolytic cells. Biochem. J. 350, 219-227.
Garcia-Martin M. L., Garcia-Espinosa M. A., Ballesteros P., Bruix M. and Cerdan S.
(2002) Hydrogen turnover and subcellular compartmentation of hepatic
[2-13C]glutamate and [3-13C]aspartate as detected by 13C NMR. J. Biol.
Chem. 277, 7799-7807.
Gerhart D. Z., Enerson B. E., Zhdankina O. Y., Leino R. L. and Drewes L. R. (1998)
Expression of the monocarboxylate transporter MCT2 by rat brain glia. Glia 22,
272-281.
Hanu R., McKenna M., O'Neill A., Resneck W. G. and Bloch R. J. (2000)
Monocarboxylic acid transporters, MCT1 and MCT2, in cortical astrocytes in
vitro and in vivo. Am. J. Physiol. Cell Physil. 278, C921-930.
Hertz L. and Dienel G. A. (2005) Lactate transport and transporters: general
principles and functional roles in brain cells. J. Neurosci. Res. 79, 11-18.
Laughton J. D., Charnay Y., Belloir B., Pellerin L., Magistretti P. J. and Bouras C.
(2000) Differential messenger RNA distribution of lactate dehydrogenase LDH-1
and LDH-5 isoforms in the rat brain. Neuroscience 96, 619-625.
McKenna M. C., Tildon J. T., Stevenson J. H., Huang X. and Kingwell K. G. (1995)
Regulation of mitochondrial and cytosolic malic enzymes from cultured rat
brain astrocytes. Neurochem. Res. 20, 1491-1501.
Nedergaard M. and Goldman S. A. (1993) Carrier-mediated transport of lactic acid
in cultured neurons and astrocytes. Am. J. Physiol. 265, R282-289.
Pellerin L. and Magistretti P. J. (1994) Glutamate uptake into astrocytes stimulates
aerobic glycolysis: a mechanism coupling neuronal activity to glucose
utilization. Proc. Natl. Acad. Sci. U.S.A. 91, 10625-10629.
Pellerin L. and Magistretti P. J. (2004) Neuroenergetics: calling upon astrocytes to
satisfy hungry neurons. Neuroscientist 10, 53-62.

Chapter | 4
106
Pierre K., Pellerin L., Debernardi R., Riederer B. M. and Magistretti P. J. (2000) Cell-
specific localization of monocarboxylate transporters, MCT1 and MCT2, in the
adult mouse brain revealed by double immunohistochemical labeling and
confocal microscopy. Neuroscience 100, 617-627.
Pryce J. D., Gant P. W. and Sau K. J. (1970) Normal concentrations of lactate,
glucose, and protein in cerebrospinal fluid, and the diagnostic implications of
abnormal concentrations. Clin. Chem. 16, 562-565.
Rafiki A., Boulland J. L., Halestrap A. P., Ottersen O. P. and Bergersen L. (2003) Highly
differential expression of the monocarboxylate transporters MCT2 and MCT4 in
the developing rat brain. Neuroscience 122, 677-688.
Rodrigues T. B., Gray H. L., Benito M., Garrido S., Sierra A., Geraldes C. F., Ballesteros
P. and Cerdan S. (2005) Futile cycling of lactate through the plasma
membrane of C6 glioma cells as detected by (13C, 2H) NMR. J. Neurosci. Res.
79, 119-127.
van Winden W. A., Heijnen J. J., Verheijen P. J. and Grievink J. (2001) A priori analysis
of metabolic flux identifiability from 13C-labeling data. Biotechnol. Bioeng. 74,
505-516.
CHAPTER 5
Culturing Primary Brain Astrocytes Under
a Fully Controlled Environment in
a Novel Bioreactor
This chapter is published in:
Santos S. S., Fonseca L. L., Monteiro M. A. R., Carrondo M. J. T. & Alves P. M. (2005) J. Neurosci. Res. 79, 26-32.
Chapter | 5
108
Chapter | 5 | Contents
109, Abstract
110, Introduction
111, Experimental Procedures Materials Cell Culture (Monolayers) Experiments in Stirred Conditions Spinner Vessels and Bioreactor Cell Culture in Microcarriers Sampling 13C NMR Spectroscopy
115, Results Effect of Microcarrier Type and Cell Inoculum Effect of Culture Operational Mode on Astrocyte Growth and Metabolism Effect of Microcarrier Concentration and Agitation Rate Culture of Primary Astrocytes in a Bioreactor: Mimicking Hypoxic Stress Culture of Primary Astrocytes in a Bioreactor: Carbon Labeling Experiment
121, Discussion
124, Acknowledgements and Work Contributions
125, References
Culturing Primary Astrocytes in Bioreactors
109
ABSTRACT
We report the first approach for growth and maintenance of primary astrocytes on a
fully controlled environment. For this purpose, cells were immobilized in Cytodex
microcarriers and grown in a stirred tank bioreactor. Crucial bioreaction parameters
such as agitation rate, microcarrier type, and concentration, as well as cell
inoculum concentration were assessed. Cytodex 3 proved the best microcarrier for
astrocyte growth, with the highest cell densities obtained for 6 g/L of Cytodex 3 using
an inoculum of approx. 0.15 × 10⁶ cells/mL in vessels operated at 60 rpm, using a
re-feed operational mode consisting of complete medium replacement every 5
days. Using such optimized conditions, cells were maintained in steady-state for
approximately 24 days, allowing online monitoring and control of environmental
variables such as temperature, pH, and O2. To further test the advantages of this
fully controlled system, astrocytes were subjected to a 5 hours hypoxic stress. The
cell numbers were not affected by hypoxia but the glycolytic flux was enhanced
during this period. To check whether this experimental set-up was suitable for
metabolic flux analysis, the metabolism of [U-13C]glucose pulse was followed by 13C-NMR for a period of 24-hour. The culture system described is a novel tool to
study brain cell metabolism, allowing sampling over time and the monitoring of
cellular behaviour in response to stressful conditions as well as during recovery.
Chapter | 5
110
INTRODUCTION
Elucidation of the underlying metabolic mechanisms associated with cell
degeneration in neurological disorders, such as Alzheimer's, Parkinson's, and
Huntington's diseases, remains a challenge in neuroscience. Because brain networks
are highly complex, simple model systems are useful to decipher basic biochemical
features of individual cell types. Primary brain cell cultures are well established
experimental models, in particular monolayer cell cultures (Hansson and Thorlin,
1999). Typically, cells are isolated from brains and grown as primary cultures in static
conditions using tissue culture flasks (T-flasks) or culture dishes. This method,
however, has restricted scalability, and working with large amounts of cells implies
the manipulation of multiple culture systems, which is difficult, time consuming, and
expensive. In addition, culture parameters such as pH and pO2 are difficult to
measure or control (Masters, 2000). Growing cells in stirred tank bioreactors
circumvents these difficulties: being hydrodynamically well characterized, they are
easy to scale-up and enable high cell densities, better homogeneity of cultures,
and reproducible experimental conditions, controllable through sensors as pH and
pO2 electrodes. Ease of sampling allows cell number, viability, and intracellular and
extracellular metabolites to be monitored over time.
Brain cells are anchorage-dependent and for scaling up from a static culture to a
stirred tank bioreactor, it is necessary to use some kind of support. Since van Wezel
(1967) first described a culture system using microcarriers as a solution for growing
anchorage-dependent cells, a wide range of carriers have been developed, using
different materials and surface types to culture a wide variety of cells. Microcarriers
have a high surface-to-volume ratio, permitting high yields of cells in small volumes,
efficient medium/cell separation, and are easily expanded and transferred,
facilitating experimental manipulation. We have reported immobilization of primary
brain cells in microcarriers and gel threads, under perfusion for in vivo NMR studies
of the metabolism of neurons and astrocytes (Alves et al., 1996a, 1997). However,
these studies were carried out on cells cultured in microcarriers using conventional
culture dishes in static conditions and not in stirred tanks.
The present work describes a novel stirred tank bioreactor system that enables
growth and maintenance of primary brain cells in a fully controlled environment.

Culturing Primary Astrocytes in Bioreactors
111
Although stirred conditions do not exist in brain, the cerebral system is vascularised
and therefore, does not have a static environment. Blood flow is highly connected
with metabolism of cerebral tissue (Guyton and Hall, 1996), reproduced in our
system by the ability to diffuse nutrients, oxygen, and metabolites and thus
simulating in vivo brain conditions. The concept of environmental movement was
applied in earlier studies to brain slices with perfusion methods to elucidate several
aspects of cerebral function; the velocity of the paddle stirrer was adjusted to
ensure continuous gentle agitation of tissue preparations but damage to the slices
reduced experimental lifetime to 8-10 hours (Cox et al., 1983; Bachelard et al.,
1985, 1988).
The optimization of the culture system described here will expand the range of
applications in the neuroscience field, e.g., in mimicking pathologic conditions
associated with neurological diseases.
One major drawback of stirred tanks for animal cell growth is the fluid shear stress,
which is most critical when microcarriers are required for cell attachment, as is the
case for primary brain cells such as astrocytes. The most relevant parameters to
optimize in these culture systems are related to the microcarrier characteristics
(type, concentration, and inoculation procedures) and the conditions that lead to
an efficient oxygen supply to the cells under the minimum shear stress (agitation
and oxygenation rate) (Croughan and Wang, 1989). These variables were evaluated
and optimized in this work that also describes the first attempt of culturing primary
brain cell using fully environmentally controlled bioreactors.
EXPERIMENTAL PROCEDURES
Materials
Dulbecco's modified Eagle medium (DMEM), foetal bovine serum (FBS), penicillin-
streptomycin, phosphate-buffered saline (PBS), and trypsin-EDTA were purchased
from Invitrogen (Glasgow, UK). [U-13C]Glucose was purchased from Isomed (Madrid,
Spain). Culture flasks were obtained from Nunc (Roskilde, Denmark). Nonporous
microcarriers, Cytodex 2 (dextran matrix with a surface layer of positive charges)
and Cytodex 3 (dextran matrix with a collagen layer coupled to the surface), were
purchased from GE Healthcare (Amersham Biosciences, Uppsala, Sweden). Other
Chapter | 5
112
chemicals used were of the purest grade available from regular commercial
sources.
Cell Culture (Monolayers)
Primary cultures of astrocytes were prepared from 1-2-day-old rat brains as
described previously (Richter-Landsberg and Besser, 1994). Briefly, cerebral
hemispheres were carefully freed of the meninges, washed in ice-cold PBS, and
mechanically disrupted. Single-cell suspensions were plated in T-flasks
(3 hemispheres/175 cm2) in DMEM supplemented with 10% FBS, penicillin-
streptomycin (100 U/mL), and glucose (to obtain a final concentration of 10 mM).
Cells were kept in a humidified atmosphere of 7% CO2 in air at 37°C. After 8 days,
the phase dark cells growing on the astrocytic cell layer were separated by vigorous
shaking and removed as described previously (McCarthy and Vellis, 1980). The
remaining astrocytes were detached by mild trypsinisation using trypsin/EDTA
(0.25% wt/vol) and subcultured in T-flasks for another 3 weeks. Growth medium was
changed twice a week.
Experiments in Stirred Conditions
Spinner Vessels and Bioreactor
Initial cell culture experiments were carried out in 125 mL spinner flasks (maximum
culture volume) from Wheaton (Techne, USA). As Spinner flasks do not allow pH
control, they have to be placed inside an incubator at 7% CO2 in air and 37°C, with
aeration taking place in the gas/liquid interface. In this work, these vessels were
used to optimize critical parameters for cell culture in stirred conditions, namely:
microcarrier type and concentration, agitation rate, cell inoculum concentration,
and culture operational mode (batch vs. fed-batch vs. re-feed).
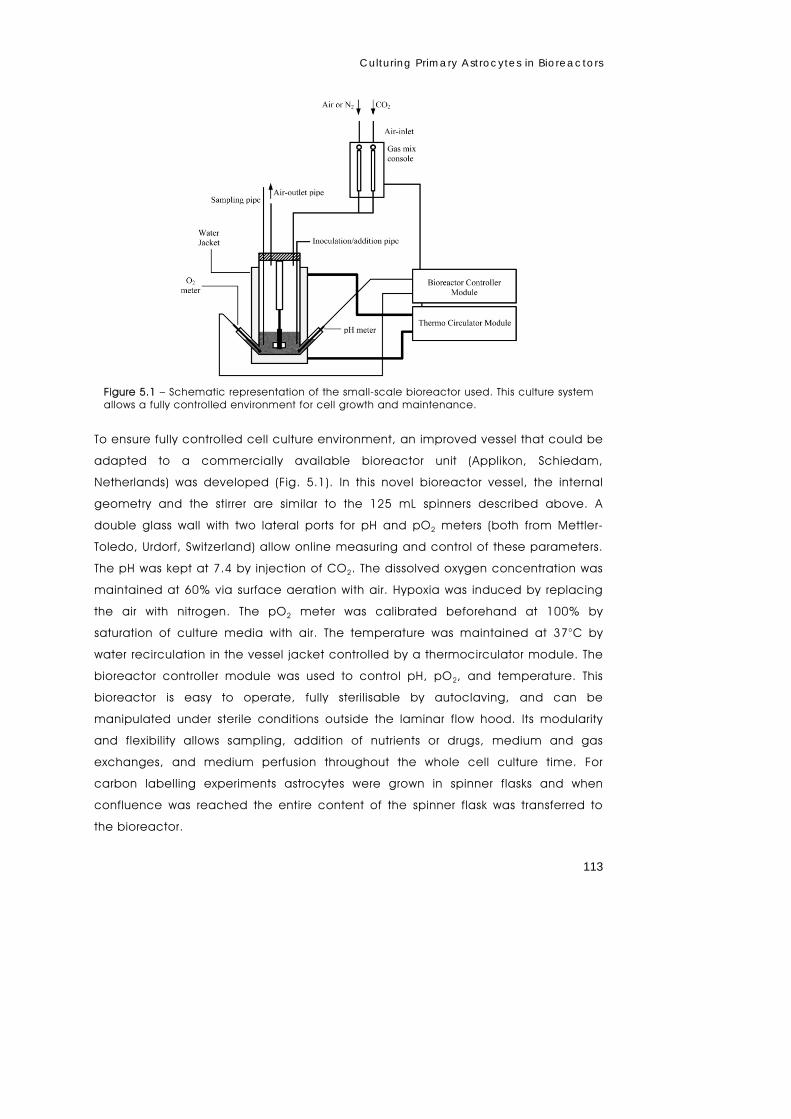
Culturing Primary Astrocytes in Bioreactors
113
To ensure fully controlled cell culture environment, an improved vessel that could be
adapted to a commercially available bioreactor unit (Applikon, Schiedam,
Netherlands) was developed (Fig. 5.1). In this novel bioreactor vessel, the internal
geometry and the stirrer are similar to the 125 mL spinners described above. A
double glass wall with two lateral ports for pH and pO2 meters (both from Mettler-
Toledo, Urdorf, Switzerland) allow online measuring and control of these parameters.
The pH was kept at 7.4 by injection of CO2. The dissolved oxygen concentration was
maintained at 60% via surface aeration with air. Hypoxia was induced by replacing
the air with nitrogen. The pO2 meter was calibrated beforehand at 100% by
saturation of culture media with air. The temperature was maintained at 37°C by
water recirculation in the vessel jacket controlled by a thermocirculator module. The
bioreactor controller module was used to control pH, pO2, and temperature. This
bioreactor is easy to operate, fully sterilisable by autoclaving, and can be
manipulated under sterile conditions outside the laminar flow hood. Its modularity
and flexibility allows sampling, addition of nutrients or drugs, medium and gas
exchanges, and medium perfusion throughout the whole cell culture time. For
carbon labelling experiments astrocytes were grown in spinner flasks and when
confluence was reached the entire content of the spinner flask was transferred to
the bioreactor.
Figure 5.1 – Schematic representation of the small-scale bioreactor used. This culture system allows a fully controlled environment for cell growth and maintenance.
Chapter | 5
114
Cell Culture in Microcarriers
Microcarriers are used widely to grow anchorage-dependent cell lines in stirred
conditions. The effect of microcarrier type and concentration in the culture of
primary astrocytes was assessed using concentrations of 3 g/L (dry weight) for
Cytodex 2 and 3, and 6 g/L for Cytodex 3. The microcarriers were prepared and
sterilized according to the manufacturer's recommendations. Cell inocula were
obtained from 3-week-old monolayer cultures of primary astrocytes. Cells were
harvested by trypsinisation, pelleted by centrifugation, ressuspended in 5 mL culture
medium, and immediately immobilized in the carriers. For this purpose, the cells
and beads were mixed gently for approximately 3 min; afterward, 20 mL of culture
medium was added. Cells were allowed to attach for 3 hours without stirring. During
that period, to obtain an even more homogeneous distribution of the cells in the
beads, the vessel was agitated gently for 1 min every 30 min. After this procedure,
more than 90% of the cells were attached to the microcarriers. The culture volume
was then adjusted to 60% of the vessel capacity by addition of culture medium,
and was stirred continuously at the lowest speed that kept the beads suspended
(approximately 40 rpm). After 24 hours, culture medium was added to obtain the
final culture volume (125 mL) and agitation was increased to the experimental
conditions, either 60 or 100 rpm. As mentioned above, the effect upon cell growth
of the culture operational mode and different strategies (batch vs. fed-batch vs. re-
feed) was tested. For the re-feed mode experiments, replacement of the culture
medium was done easily by stopping agitation and removing/re-feeding medium
immediately after the quick sedimentation of the carriers containing the cells.
Sampling
Samples containing microcarriers were taken on a daily basis. Cells growing on the
microcarrier were visualized using an Olympus inverted microscope with phase
contrast (Tokyo, Japan). Total cell number in Cytodex microcarriers was determined
by counting cell nuclei using a Fuchs-Rosenthal haemocytometer after digestion
with 0.1 M citric acid/1% Triton X-100 (wt/wt)/0.1% crystal violet (wt/vol) (Alves et al.,
1996b). Glucose and lactate concentrations in the culture supernatant were
analyzed using a YSI 7100 Multiparameter Bioanalytical System (Dayton, OH, USA).
Culturing Primary Astrocytes in Bioreactors
115
For NMR analysis a 30 mL sample (with microcarriers) was taken from the bioreactor
after 8 hour of incubation (with labelled substrate) and the remaining volume
collected 16 hours later. For both samples the microcarriers were allowed to settle
for 1 or 2 min and the medium separated from the microcarriers. The medium was
immediately transferred into a tube with 1 volume of ethanol at 0ºC to stop all
reactions and precipitate the protein and the microcarriers were washed with cold
NaCl (9 g/L). The medium/ethanol mixture was centrifuged at 10000 g for 30 min at
4ºC and the supernatant lyophilized to generate the extracellular sample. The cells
in the microcarriers were extracted with ice-cold perchloric acid (5 M). After
extraction the intracellular content was centrifuged (10000 g for 30 min at 4ºC). The
pellets were stored for protein analysis and the supernatants were neutralized and
centrifuged and the resulting supernatant was lyophilized. For NMR spectroscopy
analysis, the residues of lyophilized media and cell extracts were dissolved in D2O.
13C NMR Spectroscopy
13C-NMR spectra of lyophilized culture medium samples and cellular extracts
(pH 7.2) were acquired with 40 k data points using a 60° flip angle and 31 kHz
spectral width. Proton decoupling was applied during the acquisition using the
WALTZ sequence. The total recycle delay was 10.7 sec. For the extracellular
(medium) and intracellular (cellular extracts) samples 1,024 and 4,096 transients
were acquired, respectively. Spectra were recorded at a temperature of 300 K.
RESULTS
Effect of Microcarrier Type and Cell Inoculum
Cytodex 2 and Cytodex 3 were tested for their ability to support the growth of
primary rat astrocytes in spinner vessels. Two cell inocula sizes were tested: 18 and
36 cells per microcarrier, corresponding to an initial cell concentration of
approximately 0.15 and 0.3 × 10⁶ cells/ mL, respectively, in the culture vessel. These
values were chosen based on the ratio of cell per cm2 usually recommended for the
monolayer cultures in dishes and T-flasks. In these experiments, the microcarrier
concentration was 3 g/L, the agitation rate was 60 rpm, and no addition or
replacement was done to the culture medium, i.e., the spinners were operated in
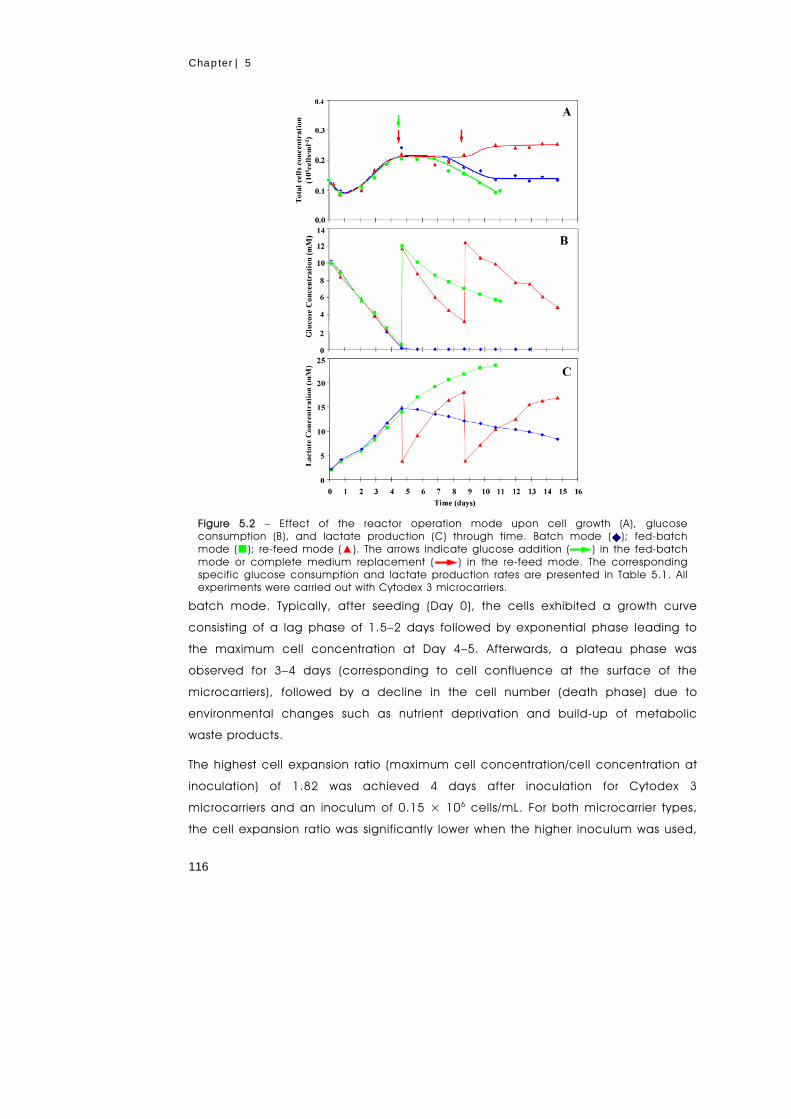
Chapter | 5
116
batch mode. Typically, after seeding (Day 0), the cells exhibited a growth curve
consisting of a lag phase of 1.5–2 days followed by exponential phase leading to
the maximum cell concentration at Day 4–5. Afterwards, a plateau phase was
observed for 3–4 days (corresponding to cell confluence at the surface of the
microcarriers), followed by a decline in the cell number (death phase) due to
environmental changes such as nutrient deprivation and build-up of metabolic
waste products.
The highest cell expansion ratio (maximum cell concentration/cell concentration at
inoculation) of 1.82 was achieved 4 days after inoculation for Cytodex 3
microcarriers and an inoculum of 0.15 × 10⁶ cells/mL. For both microcarrier types,
the cell expansion ratio was significantly lower when the higher inoculum was used,
Figure 5.2 – Effect of the reactor operation mode upon cell growth (A), glucose consumption (B), and lactate production (C) through time. Batch mode ( ); fed-batch mode (); re-feed mode (▲). The arrows indicate glucose addition ( ) in the fed-batch mode or complete medium replacement ( ) in the re-feed mode. The corresponding specific glucose consumption and lactate production rates are presented in Table 5.1. All experiments were carried out with Cytodex 3 microcarriers.
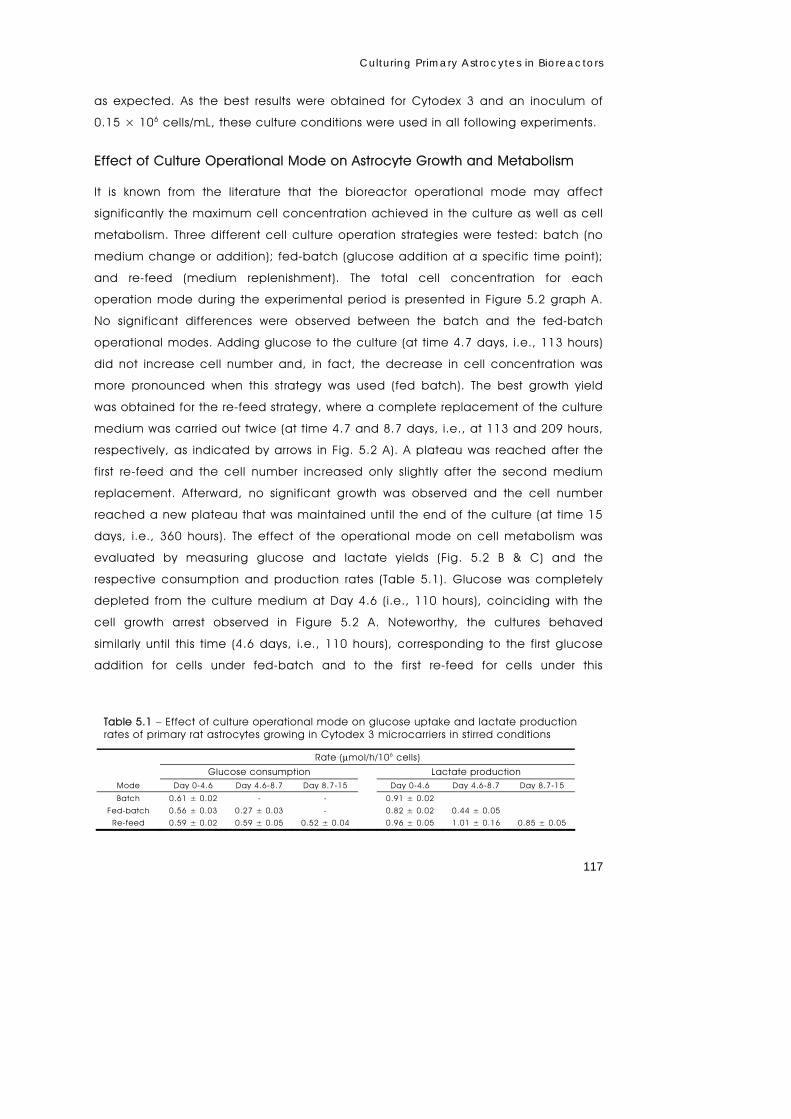
Culturing Primary Astrocytes in Bioreactors
117
as expected. As the best results were obtained for Cytodex 3 and an inoculum of
0.15 × 10⁶ cells/mL, these culture conditions were used in all following experiments.
Effect of Culture Operational Mode on Astrocyte Growth and Metabolism
It is known from the literature that the bioreactor operational mode may affect
significantly the maximum cell concentration achieved in the culture as well as cell
metabolism. Three different cell culture operation strategies were tested: batch (no
medium change or addition); fed-batch (glucose addition at a specific time point);
and re-feed (medium replenishment). The total cell concentration for each
operation mode during the experimental period is presented in Figure 5.2 graph A.
No significant differences were observed between the batch and the fed-batch
operational modes. Adding glucose to the culture (at time 4.7 days, i.e., 113 hours)
did not increase cell number and, in fact, the decrease in cell concentration was
more pronounced when this strategy was used (fed batch). The best growth yield
was obtained for the re-feed strategy, where a complete replacement of the culture
medium was carried out twice (at time 4.7 and 8.7 days, i.e., at 113 and 209 hours,
respectively, as indicated by arrows in Fig. 5.2 A). A plateau was reached after the
first re-feed and the cell number increased only slightly after the second medium
replacement. Afterward, no significant growth was observed and the cell number
reached a new plateau that was maintained until the end of the culture (at time 15
days, i.e., 360 hours). The effect of the operational mode on cell metabolism was
evaluated by measuring glucose and lactate yields (Fig. 5.2 B & C) and the
respective consumption and production rates (Table 5.1). Glucose was completely
depleted from the culture medium at Day 4.6 (i.e., 110 hours), coinciding with the
cell growth arrest observed in Figure 5.2 A. Noteworthy, the cultures behaved
similarly until this time (4.6 days, i.e., 110 hours), corresponding to the first glucose
addition for cells under fed-batch and to the first re-feed for cells under this
Table 5.1 – Effect of culture operational mode on glucose uptake and lactate production rates of primary rat astrocytes growing in Cytodex 3 microcarriers in stirred conditions
Rate (μmol/h/106 cells)
Glucose consumption Lactate production Mode Day 0-4.6 Day 4.6-8.7 Day 8.7-15 Day 0-4.6 Day 4.6-8.7 Day 8.7-15
Batch 0.61 ± 0.02 - - 0.91 ± 0.02
Fed-batch 0.56 ± 0.03 0.27 ± 0.03 - 0.82 ± 0.02 0.44 ± 0.05
Re-feed 0.59 ± 0.02 0.59 ± 0.05 0.52 ± 0.04 0.96 ± 0.05 1.01 ± 0.16 0.85 ± 0.05
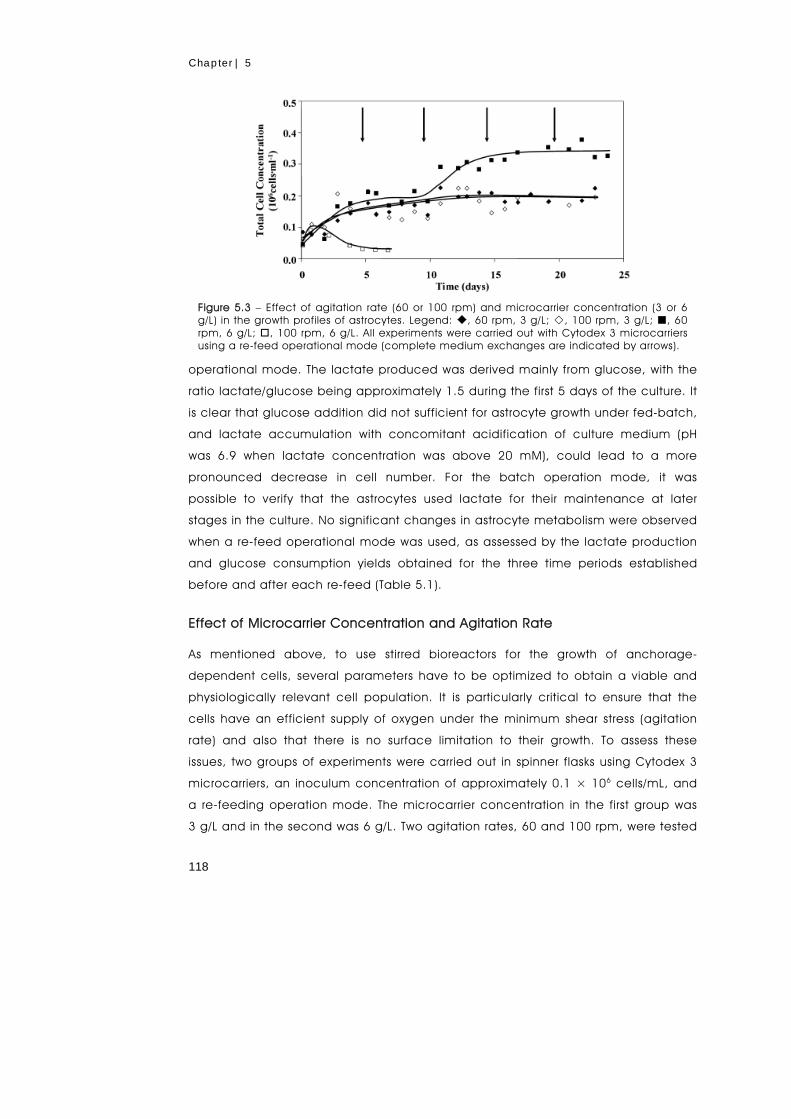
Chapter | 5
118
operational mode. The lactate produced was derived mainly from glucose, with the
ratio lactate/glucose being approximately 1.5 during the first 5 days of the culture. It
is clear that glucose addition did not sufficient for astrocyte growth under fed-batch,
and lactate accumulation with concomitant acidification of culture medium (pH
was 6.9 when lactate concentration was above 20 mM), could lead to a more
pronounced decrease in cell number. For the batch operation mode, it was
possible to verify that the astrocytes used lactate for their maintenance at later
stages in the culture. No significant changes in astrocyte metabolism were observed
when a re-feed operational mode was used, as assessed by the lactate production
and glucose consumption yields obtained for the three time periods established
before and after each re-feed (Table 5.1).
Effect of Microcarrier Concentration and Agitation Rate
As mentioned above, to use stirred bioreactors for the growth of anchorage-
dependent cells, several parameters have to be optimized to obtain a viable and
physiologically relevant cell population. It is particularly critical to ensure that the
cells have an efficient supply of oxygen under the minimum shear stress (agitation
rate) and also that there is no surface limitation to their growth. To assess these
issues, two groups of experiments were carried out in spinner flasks using Cytodex 3
microcarriers, an inoculum concentration of approximately 0.1 × 10⁶ cells/mL, and
a re-feeding operation mode. The microcarrier concentration in the first group was
3 g/L and in the second was 6 g/L. Two agitation rates, 60 and 100 rpm, were tested
Figure 5.3 – Effect of agitation rate (60 or 100 rpm) and microcarrier concentration (3 or 6 g/L) in the growth profiles of astrocytes. Legend: , 60 rpm, 3 g/L; , 100 rpm, 3 g/L; , 60 rpm, 6 g/L; , 100 rpm, 6 g/L. All experiments were carried out with Cytodex 3 microcarriers using a re-feed operational mode (complete medium exchanges are indicated by arrows).
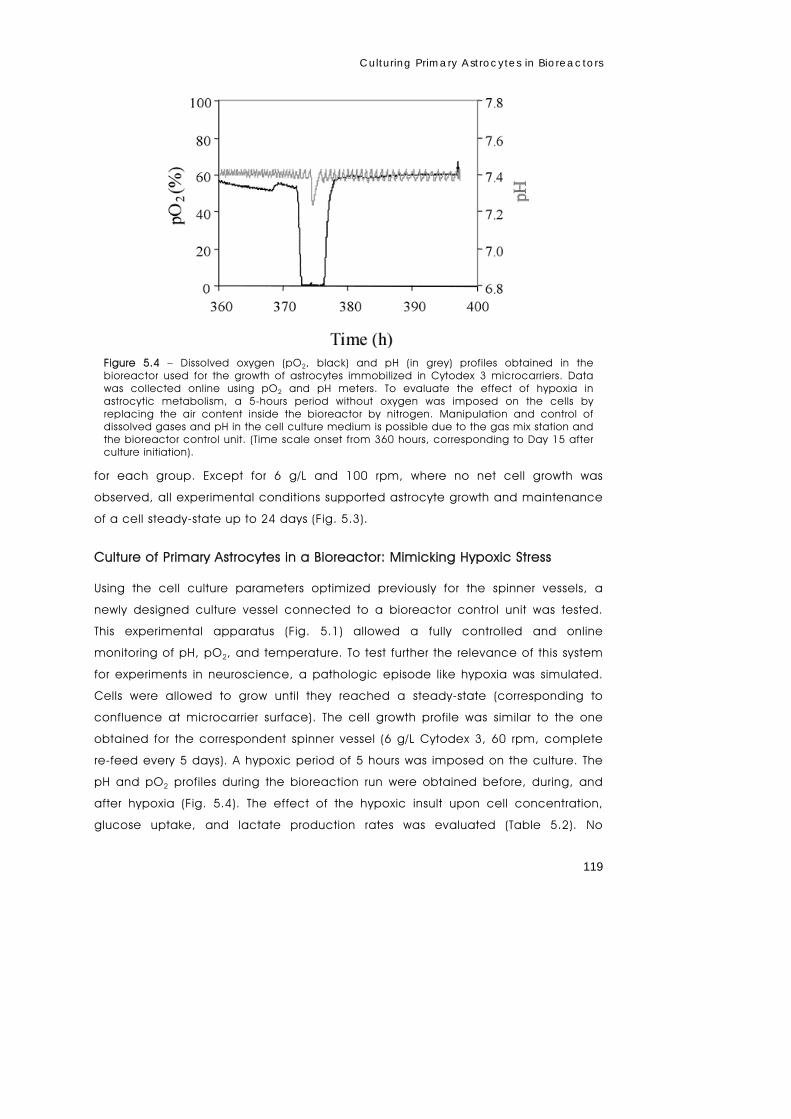
Culturing Primary Astrocytes in Bioreactors
119
for each group. Except for 6 g/L and 100 rpm, where no net cell growth was
observed, all experimental conditions supported astrocyte growth and maintenance
of a cell steady-state up to 24 days (Fig. 5.3).
Culture of Primary Astrocytes in a Bioreactor: Mimicking Hypoxic Stress
Using the cell culture parameters optimized previously for the spinner vessels, a
newly designed culture vessel connected to a bioreactor control unit was tested.
This experimental apparatus (Fig. 5.1) allowed a fully controlled and online
monitoring of pH, pO2, and temperature. To test further the relevance of this system
for experiments in neuroscience, a pathologic episode like hypoxia was simulated.
Cells were allowed to grow until they reached a steady-state (corresponding to
confluence at microcarrier surface). The cell growth profile was similar to the one
obtained for the correspondent spinner vessel (6 g/L Cytodex 3, 60 rpm, complete
re-feed every 5 days). A hypoxic period of 5 hours was imposed on the culture. The
pH and pO2 profiles during the bioreaction run were obtained before, during, and
after hypoxia (Fig. 5.4). The effect of the hypoxic insult upon cell concentration,
glucose uptake, and lactate production rates was evaluated (Table 5.2). No
Figure 5.4 – Dissolved oxygen (pO2, black) and pH (in grey) profiles obtained in the bioreactor used for the growth of astrocytes immobilized in Cytodex 3 microcarriers. Data was collected online using pO2 and pH meters. To evaluate the effect of hypoxia in astrocytic metabolism, a 5-hours period without oxygen was imposed on the cells by replacing the air content inside the bioreactor by nitrogen. Manipulation and control of dissolved gases and pH in the cell culture medium is possible due to the gas mix station and the bioreactor control unit. (Time scale onset from 360 hours, corresponding to Day 15 after culture initiation).
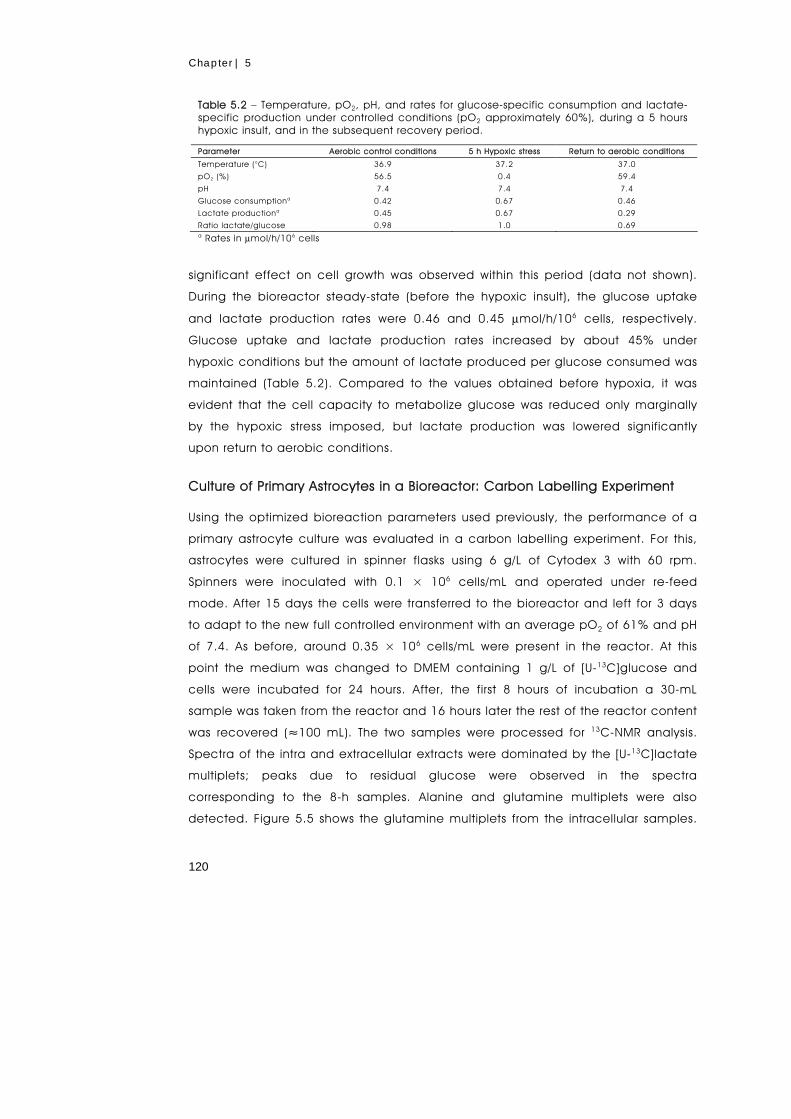
Chapter | 5
120
significant effect on cell growth was observed within this period (data not shown).
During the bioreactor steady-state (before the hypoxic insult), the glucose uptake
and lactate production rates were 0.46 and 0.45 μmol/h/106 cells, respectively.
Glucose uptake and lactate production rates increased by about 45% under
hypoxic conditions but the amount of lactate produced per glucose consumed was
maintained (Table 5.2). Compared to the values obtained before hypoxia, it was
evident that the cell capacity to metabolize glucose was reduced only marginally
by the hypoxic stress imposed, but lactate production was lowered significantly
upon return to aerobic conditions.
Culture of Primary Astrocytes in a Bioreactor: Carbon Labelling Experiment
Using the optimized bioreaction parameters used previously, the performance of a
primary astrocyte culture was evaluated in a carbon labelling experiment. For this,
astrocytes were cultured in spinner flasks using 6 g/L of Cytodex 3 with 60 rpm.
Spinners were inoculated with 0.1 × 10⁶ cells/mL and operated under re-feed
mode. After 15 days the cells were transferred to the bioreactor and left for 3 days
to adapt to the new full controlled environment with an average pO2 of 61% and pH
of 7.4. As before, around 0.35 × 10⁶ cells/mL were present in the reactor. At this
point the medium was changed to DMEM containing 1 g/L of [U-13C]glucose and
cells were incubated for 24 hours. After, the first 8 hours of incubation a 30-mL
sample was taken from the reactor and 16 hours later the rest of the reactor content
was recovered (≈100 mL). The two samples were processed for 13C-NMR analysis.
Spectra of the intra and extracellular extracts were dominated by the [U-13C]lactate
multiplets; peaks due to residual glucose were observed in the spectra
corresponding to the 8-h samples. Alanine and glutamine multiplets were also
detected. Figure 5.5 shows the glutamine multiplets from the intracellular samples.
Table 5.2 – Temperature, pO2, pH, and rates for glucose-specific consumption and lactate-specific production under controlled conditions (pO2 approximately 60%), during a 5 hours hypoxic insult, and in the subsequent recovery period.
Parameter Aerobic control conditions 5 h Hypoxic stress Return to aerobic conditions
Temperature (°C) 36.9 37.2 37.0
pO2 (%) 56.5 0.4 59.4
pH 7.4 7.4 7.4
Glucose consumptiona 0.42 0.67 0.46
Lactate productiona 0.45 0.67 0.29
Ratio lactate/glucose 0.98 1.0 0.69 a Rates in μmol/h/106 cells
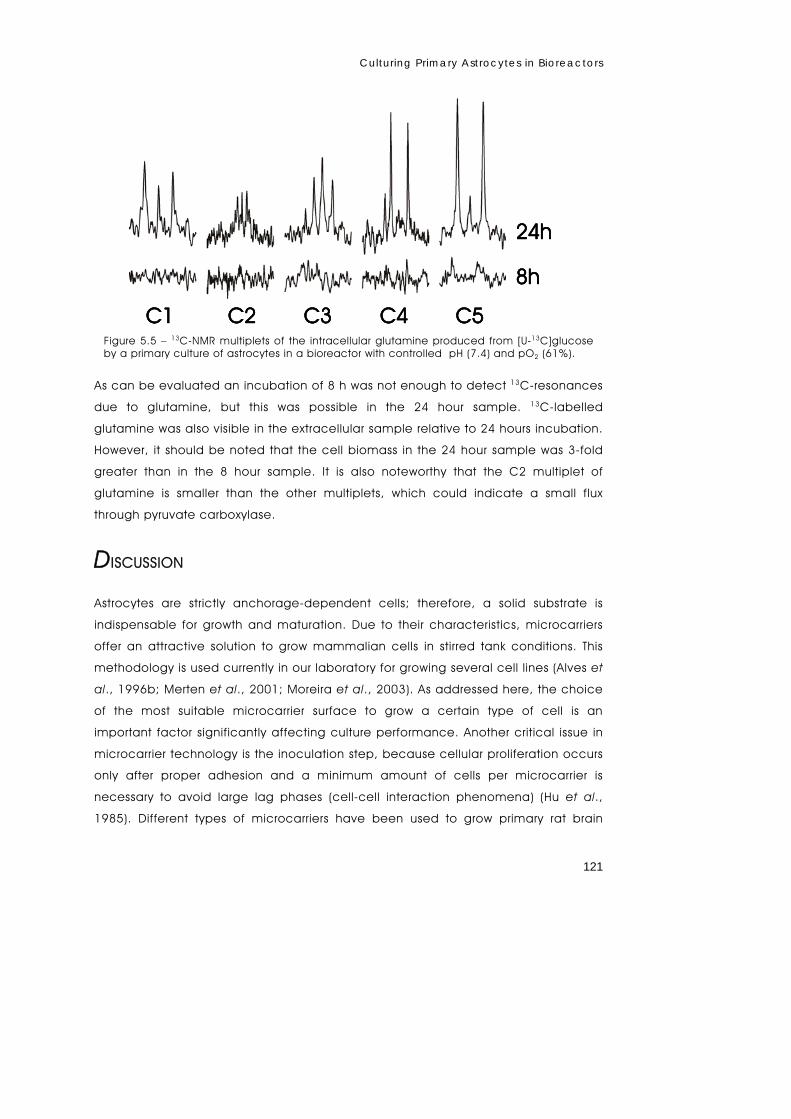
Culturing Primary Astrocytes in Bioreactors
121
As can be evaluated an incubation of 8 h was not enough to detect 13C-resonances
due to glutamine, but this was possible in the 24 hour sample. 13C-labelled
glutamine was also visible in the extracellular sample relative to 24 hours incubation.
However, it should be noted that the cell biomass in the 24 hour sample was 3-fold
greater than in the 8 hour sample. It is also noteworthy that the C2 multiplet of
glutamine is smaller than the other multiplets, which could indicate a small flux
through pyruvate carboxylase.
DISCUSSION
Astrocytes are strictly anchorage-dependent cells; therefore, a solid substrate is
indispensable for growth and maturation. Due to their characteristics, microcarriers
offer an attractive solution to grow mammalian cells in stirred tank conditions. This
methodology is used currently in our laboratory for growing several cell lines (Alves et
al., 1996b; Merten et al., 2001; Moreira et al., 2003). As addressed here, the choice
of the most suitable microcarrier surface to grow a certain type of cell is an
important factor significantly affecting culture performance. Another critical issue in
microcarrier technology is the inoculation step, because cellular proliferation occurs
only after proper adhesion and a minimum amount of cells per microcarrier is
necessary to avoid large lag phases (cell-cell interaction phenomena) (Hu et al.,
1985). Different types of microcarriers have been used to grow primary rat brain
C1 C2 C3 C4 C5
24h
8h
C1 C2 C3 C4 C5
24h
8h
Figure 5.5 – 13C-NMR multiplets of the intracellular glutamine produced from [U-13C]glucose by a primary culture of astrocytes in a bioreactor with controlled pH (7.4) and pO2 (61%).

Chapter | 5
122
astrocytes (Westergaard et al., 1991; Sonnewald et al., 1992; Alves et al., 1997).
These studies were carried out in static conditions, i.e., microcarriers were either
placed on top of a confluent astrocytic monolayer growing in a culture dish, or
inoculated with cells and kept in T-flasks. In the present study, Cytodex 3, a
nonporous microcarrier made up of a dextran matrix with a collagen layer at the
surface, proved a suitable matrix for the growth of primary rat astrocytes under
stirred conditions (Fig. 5.2 and 5.3). The culture operation mode strongly influenced
the growth curve profiles (Fig. 5.2 A). Growth was arrested under batch conditions
when glucose was completely depleted from the culture medium (4.6 days, i.e.,
110 hours post-inoculation). Additionally, the previously reported astrocytic ability to
switch metabolism and use substrates other than glucose (e.g., lactate) was
confirmed in our culture conditions (McKenna et al., 1993; Tildon et al., 1993; Alves
et al., 1995). Glucose addition per se did not improve the cell yields under fed-
batch operation. In fact, lactate accumulation and concomitant medium
acidification affected the capacity of cells to metabolize glucose (decrease of
approximately 52%) and changed the flux through glycolysis (lactate/glucose
increased by 0.17). Interestingly, the carbon flux from glucose to lactate in the
bioreactor was lower than what was obtained for spinner vessels running under
similar conditions (Table 5.1. and 5.2.). This suggests that due to a higher oxygen
supply there is a more efficient use of glucose and, therefore, an increase in the flux
through the tricarboxylic acid cycle.
Complete medium replacement (re-feed mode) permitted the supply of the primary
carbon sources and the removal of waste products (possible inhibitors of cell
metabolism), making it possible to maintain the cultures under steady state for up to
25 days. Astrocyte growth was limited by microcarrier surface availability when 3 g
Cytodex/L was used, as indicated by the increase in the cell yield obtained for 6 g
Citodex/L (60 rpm; Fig. 5.3). Lower cell concentrations were obtained for 6 g/L and
100 rpm, due to an increase in the number of collisions between supports, a
concomitant increase in the shear stress, and cell death already reported for other
mammalian cell systems (Cherry and Papoutsakis, 1988). Overall, our data show that
the optimal conditions for growing rat astrocytes under stirred tank operation in the
type of vessels used are: 6 g/L Cytodex 3 with an inoculum of 0.10-0.15×10⁶
cells/mL in vessels operated at 60 rpm with a re-feeding operational mode

Culturing Primary Astrocytes in Bioreactors
123
(complete medium replacement every 5 days). The maximum cell concentration
achieved, 0.3 ×10⁶ cells/mL, corresponds to a cell expansion ratio approaching 3.
Brain hypoxia can occur in several pathologies, such as stroke and cardiac arrest
episodes, and many studies have contributed to our knowledge about the
consequences of hypoxia in brain metabolism (Cox et al., 1983; Marrif and Juurlink,
1999). Nevertheless, to characterize precisely the metabolic disturbances during a
complete exclusion of O2, it is imperative to develop experimental conditions
ensuring that no oxygen is available to the cells whereas all other nutrients remain
present. Such complete control and monitoring of culture environmental parameters
is shown here to be experimentally feasible for small-scale cultures.
As expected, during hypoxia there was an increase in the specific rates of glucose
uptake and lactate production (by approximately 50%) but the lactate-to-glucose
ratio was not affected significantly, possibly because glucose can also be
channelled to other metabolic pathways. Indeed, previous studies have reported
that under hypoxic conditions, approximately 30% of glucose consumed can be
metabolized to products other than lactate (Alves et al., 2000). Astrocytes can
upregulate their capacity to metabolize glucose (Marrif and Juurlink, 1999) and are
able to downregulate their ATP requirement (Swanson et al., 1997) under hypoxic
stress conditions. We have observed previously that astrocytes have the ability to
maintain their energetic status during hypoxia (up to 2 hours) at the expense of
increased glucose utilization under anaerobic conditions (Alves et al., 2000). Other
evidence of the metabolic plasticity of astrocytes is observable during the recovery
period: their capacity to metabolize glucose was restored but the channelling to
lactate decreased by approximately 30%. Swanson et al. (1995, 1997) reported that
survival and function of astrocytes became compromised if acidosis also occurred
during hypoxic episodes. During our hypoxia experiment under complete
environment control, a small drop in pH (approximately 0.1) was detected and
rapidly returned to normal by enhancement of CO2 content in the bioreactor. Our
system thus permits dissociating the effect of lactate accumulation from the pH
decrease effect.
Analysis of the 13C-NMR spectra revealed that 8 hour incubations and reactor
samples of 30 mL (with 6 g/L of microcarriers) were too short and too small to be
analyzed by this technique, given that in both intra and extracellular samples only
Chapter | 5
124
lactate and glucose multiplets were detected. When the incubations were extended
to 24 hours, it became possible to observe glutamine both intra and extracellularly.
However, the low 13C enrichment of glutamine did not enable metabolic flux
analysis. At least there may be two reasons for this low sensitivity: the recovery of the
intracellular content from the microcarriers is low and/or the process of removing the
microcarriers results in loss of the intracellular content, or the metabolism of
astrocytes in the reactor is such that results in a low enrichment of glutamine. These
experiments were done in DMEM supplemented with 4 mM glutamine; perhaps this
glutamine concentration is too high, favouring glutamine consumption rather than
glutamine release. Usually even under low rates of glutamine consumption it is
possible to observe release of labelled glutamine, due to the reversibility of the
reactions involved. Under the fully controlled bioreactor environment the astrocytes
exhibit a slower and less wasteful metabolism (Tables 5.1 and 5.2), which suggests
the need for medium manipulation with the goal to increase channelling of 13C to
the TCA cycle, and ultimately enable metabolic flux analysis. The changes may
involve longer incubations and/or higher concentration of labelled glucose and
lower concentration of glutamine in order to favour glutamine release and decrease
anaplerosis of 12C metabolites.
The most important conclusion from this work is that primary astrocytes can be
grown in stirred tank bioreactors under a fully controlled environment. These systems
are versatile, permitting experiments to run for long periods to investigate age-
dependent aspects of cell metabolism. It is also possible to carry out studies using
different cell types (co-cultures) in the same environment, and to manipulate the
relative amounts of neurons and astrocytes, change carbon sources, mimic
pathologies, and evaluate metabolism during imposed stress and during the
recovery period. Ongoing efforts are directed to culture cerebellar granule cells and
cortical neurons under stirred conditions.
ACKNOWLEDGEMENTS AND WORK CONTRIBUTIONS
I am grateful to Miguel Monteiro, ITQB, Oeiras for the carrying out most of the
experimental work and to Sónia Sá Santos, ITQB, Oeiras for writing the manuscript in
the short time available in order to submit it to the Journal of Neuroscience
Research.
Culturing Primary Astrocytes in Bioreactors
125
REFERENCES
Alves P.M., Carrondo M.J.T., Santos H. (1997). Immobilization of primary brain cells in
porous microcarriers for on-line NMR spectroscopy. In: Carrondo MJC , Griffiths
B , Moreira JLP , editors. Animal cell technology. Dordrecht: Kluwer Academic
Publishers. p 91-98.
Alves P.M., Flögel U., Brand A., Leibfritz D., Carrondo M.J.T., Santos H., Sonnewald U.
(1996a). Immobilization of primary astrocytes and neurons for on-line
monitoring of biochemical processes by NMR. Dev. Neurosci. 18, 478-483.
Alves P.M., Fonseca L.L., Peixoto C.C., Almeida A.C., Carrondo M.J.T., Santos H.
(2000). NMR studies on energy metabolism of immobilized primary neurons
and astrocytes during hypoxia, ischemia and hypoglycemia. NMR Biomed.
13, 438-448.
Alves P.M., Mckenna M.C., Sonnewald U. (1995). Lactate metabolism in mouse brain
astrocytes studied by [13C]NMR spectroscopy. Neuroreport. 6, 2201-2204.
Alves P.M., Moreira J.L., Rodrigues J.M., Aunins J.G., Carrondo M.J.T. (1996b). Two-
dimensional versus three-dimensional culture systems: effects on growth and
productivity of BHK cells. Biotechnol. Bioeng. 52, 429-432.
Bachelard H.S., Badar-Goffer R.S., Brooks K.J., Dolin S.J., Morris P.G. (1988).
Measurement of free intracellular calcium in the brain by 19F-nuclear
magnetic resonance spectroscopy. J. Neurochem. 51, 1311-1313.
Bachelard H.S., Cox D.W.G., Feeney J., Morris P.G. (1985). 31P nuclear-magnetic-
resonance studies on superfused cerebral tissues. Biochem. Soc. Trans. 13,
835-839.
Cherry R.S., Papoutsakis E.T. (1988). Physical mechanisms of cell damage in
microcarrier cell culture bioreactors. Biotechnol. Bioeng. 32, 1001-1014.
Cox D.W., Morris P.G., Feeney J., Bachelard H.S. (1983). 31P-n.m.r. studies on
cerebral energy metabolism under conditions of hypoglycaemia and hypoxia
in vitro. Biochem. J. 212, 365-370.
Croughan M.S., Wang D.I. (1989). Growth and death in overagitated microcarrier
cell cultures. Biotechnol. Bioeng. 33, 731-744.
Chapter | 5
126
Guyton A.C., Hall J.E. (1996). Textbook of medical physiology. Philadelphia: W.B.
Saunders Company. 1014 p.
Hansson E., Thorlin T. (1999). Brain primary cultures and vibrodissociated cells as
tools for the study of astroglial properties and functions. Dev. Neurosci. 21, 1-
11.
Hu W.S., Meier J., Wang D.I.C. (1985). A mechanistic analysis of the inoculum
requirement for the cultivation of mammalian cells on microcarriers.
Biotechnol. Bioeng. 27, 585-595.
Marrif H., Juurlink B.H.J. (1999). Astrocytes respond to hypoxia by increasing glycolitic
capacity. J. Neurosci. Res. 57, 255-260.
Masters J.R.W. (2000). Animal cell culture. New York: Oxford University Press. 315 p.
McCarthy H.D., Vellis J.D. (1980). Preparation of separate astroglial and
oligodendroglial cultures from rat cerebral tissue. J. Cell Biol. 85, 890-902.
McKenna M.C., Tildon J.T., Stevenson J.H., Boatright R., Huang S. (1993). Regulation
of energy metabolism in synaptic terminals and cultured rat brain astrocytes:
differences revealed using aminooxyacetate. Dev. Neurosci. 15, 320-329.
Merten O.W., Cruz P.E., Rochette C., Geny-Fiamma C., Bouquet C., Goncalves D.,
Danos O., Carrondo M.J.T. (2001). Comparison of different bioreactor systems
for the production of high titer retroviral vectors. Biotechnol. Prog. 17, 326-
335.
Moreira J.L., Miranda P.M., Alves P.M., Marcelino I., Carrondo M. (2003). Culture
methods for mass production of ruminant endothelial cells. In: Saha BC ,
editor. Fermentation biotechnology. Washington: American Chemical Society.
p 124-141.
Richter-Landsberg C., Besser A. (1994). Effects of organotins on rat brain astrocytes
in culture. J. Neurochem. 63, 2202-2209.
Sonnewald U., Petersen S.B., Krane J., Westergaard N., Schousboe A. (1992). 1H NMR
study of cortex neurons and cerebellar granule cells on microcarriers and their
PCA extracts: lactate production under hypoxia. Magn. Reson. Med. 23, 166-
171.
Swanson R.A., Farrel K., Simon R.P. (1995). Acidosis causes failure of astrocyte
glutamate uptake during hypoxia. J. Cereb. Blood Flow Metab. 15, 417-424.
Culturing Primary Astrocytes in Bioreactors
127
Swanson R.A., Farrel K., Stein B.A. (1997). Astrocyte energetics, function, and death
under conditions of incomplete ischemia: a mechanism of glial death in the
penumbra. Glia 142, 142-153.
Tildon J.T., McKenna M.C., Stevenson J., Couto R. (1993). Transport of L-lactate by
cultured rat brain astrocytes. Neurochem. Res. 18, 177-184.
van Wezel A.L. (1967). Growth of cell-strains and primary cells on microcarriers in
homogeneous culture. Nature 216, 64-65.
Westergaard N., Sonnewald U., Petersen S.B., Schousboe A. (1991). Characterization
of microcarrier cultures of neurons and astrocytes from cerebral cortex and
cerebellum. Neurochem. Res. 16, 919-923.

Chapter | 5
128

CHAPTER 6
General Conclusions
Chapter | 6
130
Chapter | 6 | Contents
131, General Conclusions
131, Effects of Ethanol on Primary Astrocytes Cultures
133, Astrocytes Under a Steady Supply of Glutamate
134, Lactate Recycling in Astrocytes and Neurons
136, Culturing Primary Astrocytes in Bioreactors
137, Isotopomeric Analysis by 13C-NMR
General Conclusions
131
GENERAL CONCLUSIONS
The human brain is the product of around 600 million years of evolution that started
with the appearance of the first animals and it is by far the most complex structure
in the known universe. The vertebrates’ brain is composed of several different cell
types, which perform the different functions required. The two most abundant cell
types are neurons, which are the brain function unit, and glial cells, which are
responsible for a myriad of housekeeping, homeostatic and structural functions.
Glial metabolism is so far interconnected with the neuronal metabolism, so that is
difficult to state where one finishes and the other starts. Trafficking between the two
compartment include metabolites of almost all metabolic pathways (glycolysis, TCA,
amino acids, ketone bodies, etc) and also ions. There are several model systems to
study brain metabolism and of these, primary cultures of brain cells is the most
plastic technique which allows studying each cell type individually.
Effects of Ethanol on Primary Astrocytes Cultures
Ethanol effects on primary cultures of astrocytes were concentration and time
dependent. Incubation of 24 hours with up to 40 mM of ethanol had no effects on
either the glucose consumption or lactate production rates, lactate to glucose ratio,
ATP or PCr levels, intracellular pH, protein content or protein to DNA ratio.
Incubations with 80 mM ethanol for up to 24 hours altered the consumption and the
production of a few amino acids, which may be related with the glutathione
metabolism and reduced slightly the flux ratio between pyruvate dehydrogenase
and pyruvate carboxylase. For longer periods of time ethanol lead to a time-
dependent decrease of the energetic status. On another hand, 160 mM of ethanol,
during 36 hour incubations, increased the glycolytic flux and decreased the flux
ratio between pyruvate dehydrogenase and pyruvate carboxylase. No ethanol
catabolism was ever detected.
From our studies we conclude that ethanol is not a good agent to be used as a
stress inducer in a metabolic stress response study, due to physiological and
experimental reasons. From the physiological point of view, the concentrations
Chapter | 6
132
required to observe a measurable difference in the metabolic profile of a culture of
astrocytes were too high considering that, for example, under the Portuguese law a
person can not drive with more than 10 mM of blood alcohol and if caught with
more than 23 mM, the act is considered a crime! However, recently a new record
concentration of ethanol was measured in a Portuguese motorcycle driver – 160
mM, which show that the concentrations used in this work (up to 180 mM of ethanol),
although high, are still within the physiological range. Nevertheless, practical
reasons also preclude the use of ethanol. Ethanol evaporates very easily from the
culture medium and it was necessary to develop a system (described in the
experimental procedures of chapter III) to avoid this in the culture plates. In the in
vivo NMR experiments, the ethanol concentration had to be monitored and
corrected whenever more than 10% evaporated. This was due to the fact that in this
experimental setup the circulating medium is continuously gassed with O2. Neither
of these solutions would be practical in a reactor system.
The isotopomers of glucose used in this chapter were selected also for the
evaluation of their potential for the determination of metabolic fluxes. This was done
in order to explore other labelling strategies potentially more informative than the
usual [1-13C]glucose. In that regard the usage of [U-13C6]glucose and of
[2-13C]glucose yielded good results, the first being a good substrate for the study of
the labelling patterns that arise from the TCA cycle, and the second, convenient for
the study of the pentose phosphate pathway. It remained to be checked, however,
the possibility of using a mixture of both to perform flux analysis. This would have to
be simulated (in silico) first in order to study its applicability and information gain,
taking into account also the NMR sensitivity and dynamic range due to the spectra
of the resulting labelled products. These carbon labelled experiments also showed
that a process was required to determine the areas of partially-overlapping peaks in
13C NMR spectra. This led to the development of the program described in Appendix
I.

General Conclusions
133
Astrocytes Under a Steady Supply of Glutamate
Glutamate is a key metabolite in astrocytic and brain metabolism, which is taken up
very rapidly by astrocytes. This kinetic is not compatible with the conditions required
to perform metabolic flux analysis in bioreactor. As can be seen in chapter 5 the
best enrichments were obtained after 24 hours of incubation with carbon-13
labelled glucose. However, when glutamate is supplied to a culture of astrocytes in
concentrations up to 500 μM in normal culturing conditions (cell numbers/Volume of
incubation medium), it is consumed within a few hours. This meant that in order to
do flux analysis either the concentration of glutamate had to be higher or a larger
volume of incubation medium had to be used. Nevertheless, these solutions would
only extend temporally the presence of glutamate in the culture medium. Since this
amino acid is continuously taken up, the concentration would not remain constant.
In order to achieve this goal, a fixed concentration of glutamate through long
periods, a different method was developed. By adding glutaminase to the
incubation medium of a culture of astrocytes, it became possible to impose a
steady supply of glutamate at the expense of glutamine. Since the astrocytes
transform the transported glutamate into glutamine and release this amino acid, the
glutaminase is actually closing the glutamate-glutamine cycle. Our results (chapter
3) show that astrocytes that have never been exposed to glutaminase (and
glutamate) accumulate glutamate (initially) when exposed to glutamate supplies
higher than 10 nmol/min/mg of protein. Above this threshold cultured astrocytes
accumulate glutamate to a maximum which is proportional to the glutamate supply
rate. These results show that the intensity of the applied stress may be tailored to the
desired level by changing the amount of glutaminase. Also, this methodology allows
targeted studies of either the adaptation to higher supplies of glutamate or of the
metabolism of adapted cells. In the present study we opted for the analysis of the
adaptation, as it allowed us to clarify different results obtained with either astrocytic
cultures or by in vivo cerebral flux analysis. On the other hand, in order to use this
methodology to study the effects of glutamate on the metabolic fluxes of
astrocytes, the use of adapted cells would be better. Once adapted the cells are
still in the presence of glutaminase, but since they are now capable of enduring
Chapter | 6
134
that stress, it is possible to study the metabolism under steady state conditions. Also,
at this stage the concentration of glutamate besides being more or less constant, it
is dependent of the quantity of glutaminase present. These are ideal conditions to
be used in a flux-determination study, since in this way a metabolic steady-state is
reached making it possible to perform the studies during the time required to
achieve a 13C-enrichment and allow obtaining good quality 13C NMR spectra. Also
the metabolic analysis will be simpler due to the fact that steady-state conditions
apply, instead of transient conditions.
Lactate Recycling in Astrocytes and Neurons
Lactate has been in the centre of debate concerning brain energy metabolism.
Some evidence support the view that astrocytes are responsible for the
metabolisation of glucose to lactate, which may then be exported to the neurons
where it is fully oxidised. Our data, obtained with primary cultures of astrocytes,
support this hypothesis, but also show that once glucose is exhausted, astrocytes
can revert to the use of lactate to meet their energetic demand. Thus, showing the
astrocytic capacity to, both, produce and consume lactate. Labelling the medium
with 50% 2H2O allowed observing the recycling of lactate between the extracellular
pool and the intracellular pool of pyruvate. In order to characterize the kinetic
process associated with the lactate recycling, three different models were tried, i)
where all reactions were assumed to have first-order kinetics, ii) similar to the first but
where the uptake of lactate was assumed to follow a Michaelian kinetics and, iiI)
where all reactions were modelled as having Michaelian kinetics. Of these three
attempts only the first gave good fittings to the data. The second type did not
generated good fits and the third had too many degrees of freedom for the
experimental data available. Although simple, the first-order kinetic model allowed
obtaining the first-order rate-constants for each reaction and to study the
dependence of these rate-constants with the extracellular concentration of lactate.
However, to do so, the intracellular concentrations of lactate and pyruvate, as well
as their time-dependent variations had to be assumed as known. The concentrations
were obtained from best-fits to the model and used because they were within the
normal physiological range and, with a lactate to pyruvate ratio of 10:1. On the
General Conclusions
135
other hand, the time-dependent variations of these concentrations were in fact
unknown, but in order to get consistent results these concentrations were not
allowed to increase above the initial values. Although false, this assumption
affected only the rate-constant of release of lactate (k2) and may have minor
effects on the rate-constants of uptake of lactate (k1) and of lactate oxidation (k3).
Most probably, the concentration of intracellular lactate increases very rapidly until
it reaches an equilibrium concentration, which depends among other things, on the
extracellular concentration of lactate and on the intra and extracellular pHs. As a
consequence of the assumption made, the values of the rate-constant of release of
lactate (k2) showed to be dependent on the extracellular concentration of lactate,
which most probably is an artefact generated by this assumption. In reality, the
property dependent on the extracellular concentration of lactate should be the
intracellular concentration. However, because this was assumed not to happen, the
dependence was shifted to the rate-constant. In our opinion this assumption is the
major drawback of the model used and thus of the analysis, but this only affects the
absolute values, which allows the determination of the correct ratios between the
rate-constants (relative values). These results also show the amount and the kind of
data that can be obtained by labelling the medium water, thus revealing that this
technique may have future applications in metabolic flux determinations.
Furthermore, the results obtained for the ratio between the fluxes through the lactate
transport and lactate oxidation as well as the ratio between pyruvate consumption
and pyruvate reduction may prove useful in the full determination of the metabolic
fluxes in astrocytes. Similarly, the differences in these ratios between astrocytes and
neurons may improve future metabolic models of the brain. In astrocytes the
transport of glutamine, in opposition to the neuronal, is bidirectional and, thus may
be of interest to use this technique to study it. Also, given that these studies were
performed in buffer to minimize interferences from other metabolic pathways, future
work will be done in normal medium and in the presence of glucose, which has
been shown to affect lactate recycling.

Chapter | 6
136
Culturing Primary Astrocytes in Bioreactors
Large amounts of biomass are necessary to perform metabolic flux analysis. If the
cells are cultured in static conditions, like plates, each study will require several
plates, because these have low amounts of cells and they do not allow sampling
fractions of the cultured biomass. On the other hand, bioreactors are culturing
devices that allow cells to be grown in three dimensions, which permit a large
increase in cell yield. Also, because cells are no longer attached to a fixed surface
it becomes possible to sample part of the biomass without having to harvest the full
content of the bioreactor. Additionally, bioreactors allow cultures to be run in
continuous mode, and are easily fitted with sensors that allow to monitor and control
the culture environment. For these reasons a bioreactor system was developed;
however, because astrocytes are anchorage-dependent cells, microcarriers had to
be used in order to supply these cells with a growth surface. With the optimized
culturing process described in this chapter it is now possible to grow and maintain
astrocytes in a bioreactor. However, the conditions required to perform carbon
labelling experiments still need to be improved, mainly, because in order to
determine the fluxes associated with the TCA cycle, the α-ketoglutarate pool has to
be satisfactorily followed by 13C NMR. In most cells glutamate is chosen because of
its large intracellular pool and fast exchange with α-ketoglutarate. However,
astrocytes possess a very active glutamine synthetase which converts most of the
glutamate into glutamine, thus making this amino acid the metabolite of choice.
Under the conditions tried in this chapter the glutamine signal was too low, perhaps
due to a low recovery (i.e. immobilized cells in microcarriers may be difficult to
break), incomplete extraction or the α-ketoglutarate pool being diluted by the
extracellular (unlabelled) glutamine present in the medium. As explained in the
Introduction, the astrocytic glutamine transport is bidirectional, meaning that intra
and extracellular glutamine are always in an equilibrium dependent on the pH and
sodium transmembranar gradients. Given the high concentration of glutamine in
DMEM (3-4 mM), it is possible that labelled glutamine is just being diluted. Moreover,
as shown in this chapter, under the bioreactor conditions astrocytes show a lower
lactate to glucose ratio, which may be evidence of a different flux distribution that
General Conclusions
137
results in a lower percentage of labelling in TCA intermediates. In any case a lower
glutamine concentration may favour glutamine release and, thus allow a better
measurement of the labelling profile of this amino acid.
Isotopomeric Analysis by 13C-NMR
13C NMR is a powerful technique, which is still growing and evolving today. However
spectra analysis is still a major drawback, requiring in most cases specialized
training and long hours of peak identification and peak limits recognition. Programs
like the one described in this chapter aim at reducing the time and work required to
process NMR spectra. Apart from the possible applications mentioned throughout
this chapter, this program was also useful for the analysis of in vivo 13C NMR spectra.
In opposition to 13C NMR analysis of extracts, in vivo 13C NMR experiments result in
the acquisition of several hundred spectra. Also, due to the in vivo nature of these
experiments, pH fluctuations result in small but important peak shifts. When peaks
appear isolated from each other these shifts do not represent a problem if one
requires to measure the areas of two semi-superimposed peaks then these shifts
introduce significant errors. On another hand the usage of the program described
here, not only allows to quantify these peaks with much less error but also allows this
determination to take place in a fully automatic fashion, quantifying hundreds of
spectra with minimum user intervention. For example, in our lab this program has
been used to quantify intra and extracellular lactate in in vivo 13C NMR spectra of
lactic acid bacteria, where, due to the different intra and extracellular pHs, the C3
resonance of lactate appears split in two peaks (with half-heights of 0.014 and
0.041 ppm) separated by only 0.087 ppm.

Chapter | 6
138
Appendix 1
Isotopomeric Analysis by 13C-NMR

Appendix | 1
140
Appendix | 1 | Contents
141, Abstract
142, Introduction 13C-NMR Spectroscopy 13C-13C Homonuclear Couplings 13C Heteronuclear Couplings Multiplet Quantif ication
146, The Software Tools The Splicing Program The Main Program The IntNMRPar Subroutine The Multiplet Simulating Subroutines The NMR Peak Lineshape Modelling 13C NMR Fine-structures Processing 13C NMR Spectra Practical Example of the Software Tools
154, Discussion
156, References
Isotopomeric Analysis by 13C-NMR
141
ABSTRACT
Carbon-13 labelling experiments coupled to 13C-NMR techniques are a valuable
tool in metabolic flux analysis. In contrast to other techniques, 13C-NMR allows the
collection of quantitative as well as positional information of the 13C label within
molecules. These important features allow the characterization of metabolic
networks that cannot be approached by any other means. This is accomplished by
taking advantage of the 13C homo- and heteronuclear scalar coupling. These
multiple couplings result in the splitting of the original 13C resonance into a large
number of peaks, which makes the analysis of the 13C-NMR spectra difficult and
requires the use of computer assistance. 13C multiplets are described as the sum of
fine-structures (doublets, triplets, quartets, etc). Furthermore, each fine-structure is
represented by a sum of positional constrained Pearson type VII functions. This
approach provides a means to identify the fine-structures within the multiplets. The
use of these simulating routines combined with a least-square fitting procedure
enabled the quantification of the areas of these fine-structures in a semi-automatic
fashion. This type of program may one day become fully automated, which would
greatly increase the informational output of the 13C-NMR techniques.
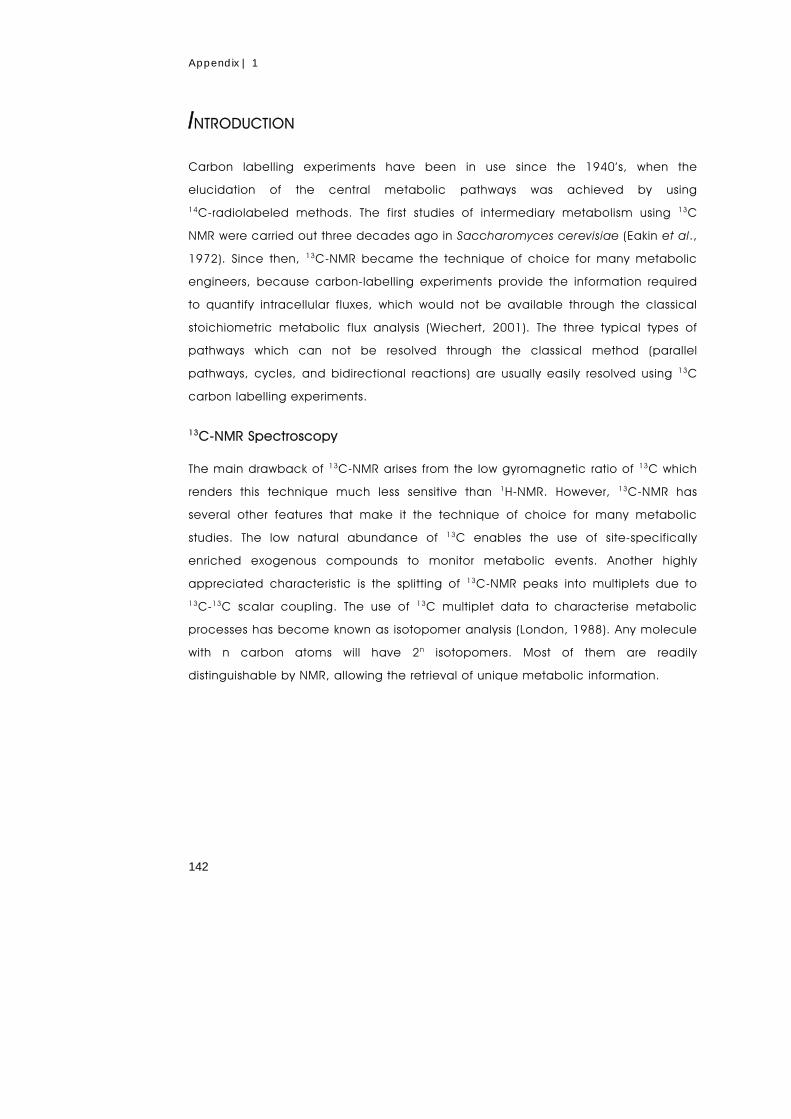
Appendix | 1
142
INTRODUCTION
Carbon labelling experiments have been in use since the 1940’s, when the
elucidation of the central metabolic pathways was achieved by using
14C-radiolabeled methods. The first studies of intermediary metabolism using 13C
NMR were carried out three decades ago in Saccharomyces cerevisiae (Eakin et al.,
1972). Since then, 13C-NMR became the technique of choice for many metabolic
engineers, because carbon-labelling experiments provide the information required
to quantify intracellular fluxes, which would not be available through the classical
stoichiometric metabolic flux analysis (Wiechert, 2001). The three typical types of
pathways which can not be resolved through the classical method (parallel
pathways, cycles, and bidirectional reactions) are usually easily resolved using 13C
carbon labelling experiments.
13C-NMR Spectroscopy
The main drawback of 13C-NMR arises from the low gyromagnetic ratio of 13C which
renders this technique much less sensitive than 1H-NMR. However, 13C-NMR has
several other features that make it the technique of choice for many metabolic
studies. The low natural abundance of 13C enables the use of site-specifically
enriched exogenous compounds to monitor metabolic events. Another highly
appreciated characteristic is the splitting of 13C-NMR peaks into multiplets due to
13C-13C scalar coupling. The use of 13C multiplet data to characterise metabolic
processes has become known as isotopomer analysis (London, 1988). Any molecule
with n carbon atoms will have 2n isotopomers. Most of them are readily
distinguishable by NMR, allowing the retrieval of unique metabolic information.

Isotopomeric Analysis by 13C-NMR
143
13C-13C Homonuclear Couplings
Homonuclear couplings usually arise from the use of multiple labelled or uniformly
labelled substrates, but can also appear from single labelled substrates. 13C
homonuclear scalar couplings lead to the splitting of the original singlet into a
multiplet of 2n fine-structures with 3n peaks (Fig 2.1), where n is the number of 13C
nuclei coupled to the observed nucleus. Whenever a 13C is directly connected to
the observed carbon (i.e. one-bond coupling) the singlet (first fine-structure in Fig
2.1) is split into a doublet (second and third fine-structures in Fig 2.1). This coupling is
characterized by the coupling constant J, which value is the frequency difference
between the two peaks and results from the interaction of the two nuclei involved. If
another 13C is present then the doublet is split into a degenerate quartet or a
doublet of doublets (fourth fine-structure in Fig 2.1). Given that the coupling
constant depends on the chemical properties of the carbons involved, two
chemically different pairs of 13C will show different coupling constants. In some
cases it is also possible to detect long range coupling (two- or three-bond
couplings), which will cause further splitting of the existing multiplet (fifth to eighth
Observed carbon
+
Observed carbon
+
Figure 2.1 – Scheme of the multiplets arising from the 13C-13C scalar couplings in a 4-carbon molecule. In the bottom, shown as the sum of the 8 (23) fine-structures, it is represented the resulting 13C-NMR multiplet due to the observed carbon. In the resulting multiplet, peaks arising from 1-bond couplings are represented by tall peaks, whereas peaks arising from long-range couplings are shorter. 13C nuclei are represented by black circles; 12C nuclei (non-enriched positions) are represented by open circles; the observed carbon in highlighted in red.
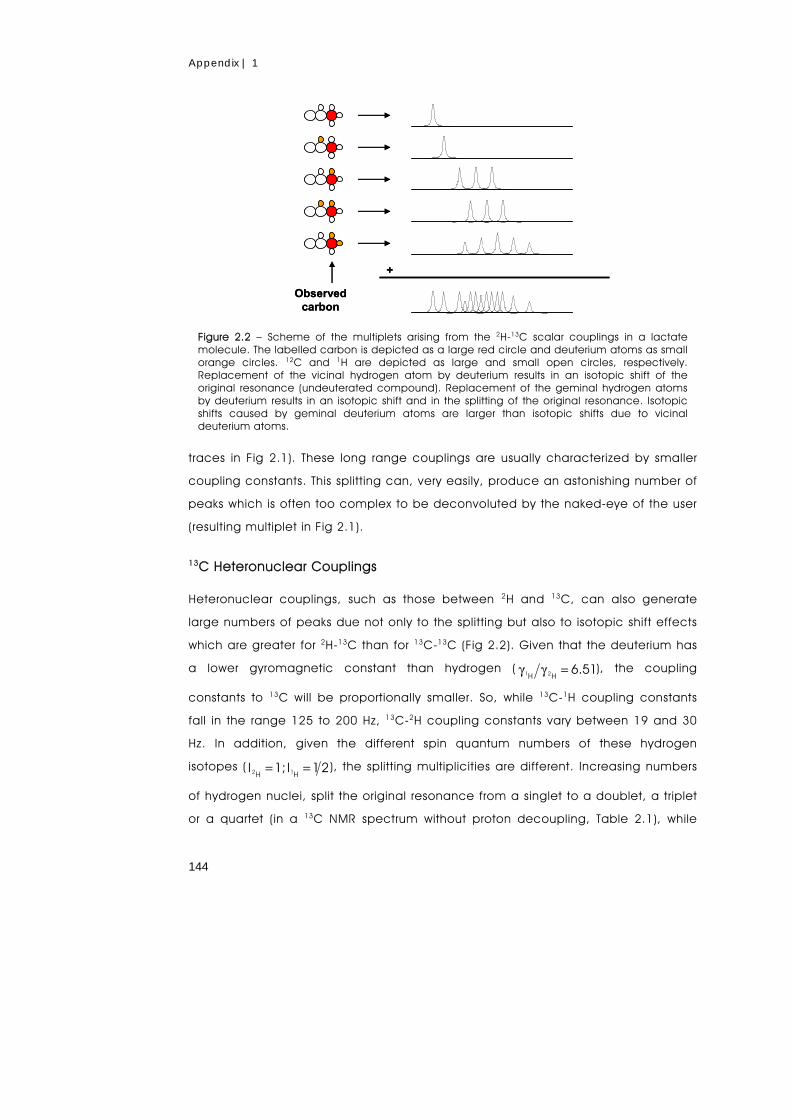
Appendix | 1
144
traces in Fig 2.1). These long range couplings are usually characterized by smaller
coupling constants. This splitting can, very easily, produce an astonishing number of
peaks which is often too complex to be deconvoluted by the naked-eye of the user
(resulting multiplet in Fig 2.1).
13C Heteronuclear Couplings
Heteronuclear couplings, such as those between 2H and 13C, can also generate
large numbers of peaks due not only to the splitting but also to isotopic shift effects
which are greater for 2H-13C than for 13C-13C (Fig 2.2). Given that the deuterium has
a lower gyromagnetic constant than hydrogen ( 6.51HH 21 =γγ ), the coupling
constants to 13C will be proportionally smaller. So, while 13C-1H coupling constants
fall in the range 125 to 200 Hz, 13C-2H coupling constants vary between 19 and 30
Hz. In addition, given the different spin quantum numbers of these hydrogen
isotopes ( 21I 1;IHH 12 == ), the splitting multiplicities are different. Increasing numbers
of hydrogen nuclei, split the original resonance from a singlet to a doublet, a triplet
or a quartet (in a 13C NMR spectrum without proton decoupling, Table 2.1), while
Observed carbon
+
Observed carbon
+
Figure 2.2 – Scheme of the multiplets arising from the 2H-13C scalar couplings in a lactate molecule. The labelled carbon is depicted as a large red circle and deuterium atoms as small orange circles. 12C and 1H are depicted as large and small open circles, respectively. Replacement of the vicinal hydrogen atom by deuterium results in an isotopic shift of the original resonance (undeuterated compound). Replacement of the geminal hydrogen atoms by deuterium results in an isotopic shift and in the splitting of the original resonance. Isotopic shifts caused by geminal deuterium atoms are larger than isotopic shifts due to vicinal deuterium atoms.
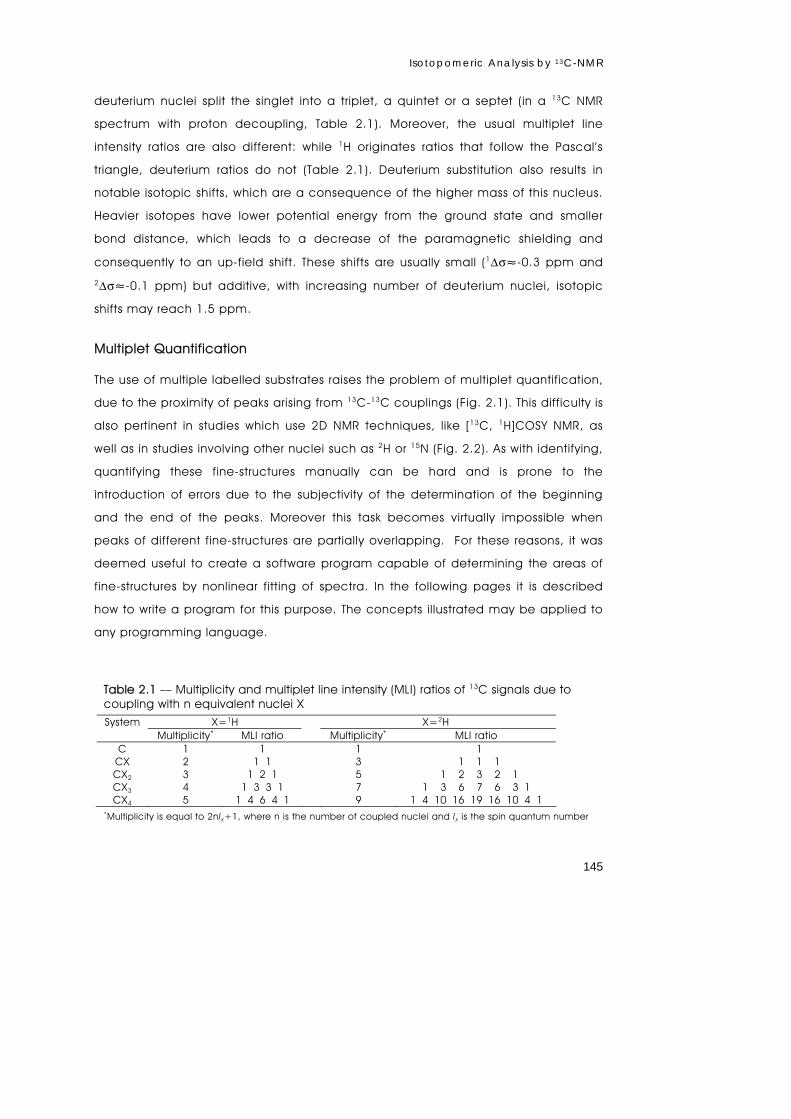
Isotopomeric Analysis by 13C-NMR
145
deuterium nuclei split the singlet into a triplet, a quintet or a septet (in a 13C NMR
spectrum with proton decoupling, Table 2.1). Moreover, the usual multiplet line
intensity ratios are also different: while 1H originates ratios that follow the Pascal’s
triangle, deuterium ratios do not (Table 2.1). Deuterium substitution also results in
notable isotopic shifts, which are a consequence of the higher mass of this nucleus.
Heavier isotopes have lower potential energy from the ground state and smaller
bond distance, which leads to a decrease of the paramagnetic shielding and
consequently to an up-field shift. These shifts are usually small (1Δσ≈-0.3 ppm and
2Δσ≈-0.1 ppm) but additive, with increasing number of deuterium nuclei, isotopic
shifts may reach 1.5 ppm.
Multiplet Quantification
The use of multiple labelled substrates raises the problem of multiplet quantification,
due to the proximity of peaks arising from 13C-13C couplings (Fig. 2.1). This difficulty is
also pertinent in studies which use 2D NMR techniques, like [13C, 1H]COSY NMR, as
well as in studies involving other nuclei such as 2H or 15N (Fig. 2.2). As with identifying,
quantifying these fine-structures manually can be hard and is prone to the
introduction of errors due to the subjectivity of the determination of the beginning
and the end of the peaks. Moreover this task becomes virtually impossible when
peaks of different fine-structures are partially overlapping. For these reasons, it was
deemed useful to create a software program capable of determining the areas of
fine-structures by nonlinear fitting of spectra. In the following pages it is described
how to write a program for this purpose. The concepts illustrated may be applied to
any programming language.
Table 2.1 –– Multiplicity and multiplet line intensity (MLI) ratios of 13C signals due to coupling with n equivalent nuclei X System X=1H X=2H
Multiplicity* MLI ratio Multiplicity* MLI ratio C 1 1 1 1
CX 2 1 1 3 1 1 1 CX2 3 1 2 1 5 1 2 3 2 1 CX3 4 1 3 3 1 7 1 3 6 7 6 3 1 CX4 5 1 4 6 4 1 9 1 4 10 16 19 16 10 4 1
*Multiplicity is equal to 2nIX+1, where n is the number of coupled nuclei and IX is the spin quantum number
Appendix | 1
146
THE SOFTWARE TOOLS
To quantify the fine-structures of the multiplets in 13C NMR spectra several steps must
be accomplished. In order to keep the routines simple these steps were divided in
separate routines. Subroutine overview:
• The splicing program, Breack13cnmr. 13C NMR spectra have a great number
of peaks. Instead of trying to quantify all of them in one go, it is simpler to
break up each spectrum in a collection of multiplets.
• The main program, IntNMR. This routine will deal with the parameters required
to simulate the multiplets and perform the nonlinear regression analysis. This
program will use several subroutines.
• The subroutine IntNMRPar. Which calculates the first estimative of the
parameters required to simulate and fit a given multiplet.
• The multiplet simulating subroutines, Bs, Bsd, Bsdd, Bsddq. These routines
simulate the multiplets and can be changed easily in order to simulate any
other kind of multiplets.
• The NMR peak simulating subfunctions, Lorentz, Gauss, Pearson7. In order
to simulate multiplets, as a sum of peaks, the NMR peaks must also be
adjusted to a function.
The Splicing Program
13C NMR spectra have a relatively large chemical shift range (≈220 ppm) and peaks
have a small half-height width (<0.1 ppm). In each sample, several different
molecules may be present and each of these molecules will generate as many
peaks as the number of carbons of which each molecule is constituted. Moreover,
each peak of a given carbon may be split into a multiplet. For this reason the
nonlinear fit of a complete NMR spectrum is an almost impossible task, and so, it is
easier to fit individual multiplets, with the exception of some which are partially
overlapped. In this case the two multiplets are fitted together. In order to
accomplish this task a program must be created that breaks up the original
spectrum into the different multiplets.
Given that the tools described here are intended to be used in a semi-automatic
fashion, it is helpful to maintain an organization of the spectra. For this reason it’s
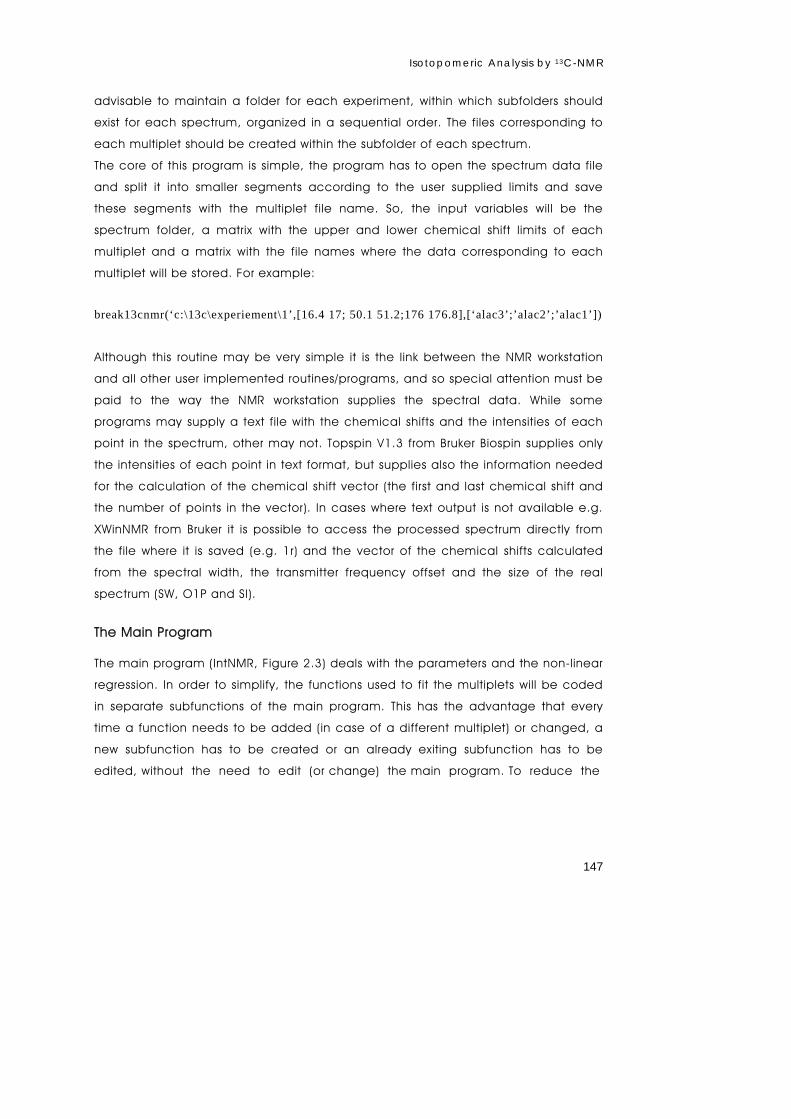
Isotopomeric Analysis by 13C-NMR
147
advisable to maintain a folder for each experiment, within which subfolders should
exist for each spectrum, organized in a sequential order. The files corresponding to
each multiplet should be created within the subfolder of each spectrum.
The core of this program is simple, the program has to open the spectrum data file
and split it into smaller segments according to the user supplied limits and save
these segments with the multiplet file name. So, the input variables will be the
spectrum folder, a matrix with the upper and lower chemical shift limits of each
multiplet and a matrix with the file names where the data corresponding to each
multiplet will be stored. For example:
break13cnmr(‘c:\13c\experiement\1’,[16.4 17; 50.1 51.2;176 176.8],[‘alac3’;’alac2’;’alac1’])
Although this routine may be very simple it is the link between the NMR workstation
and all other user implemented routines/programs, and so special attention must be
paid to the way the NMR workstation supplies the spectral data. While some
programs may supply a text file with the chemical shifts and the intensities of each
point in the spectrum, other may not. Topspin V1.3 from Bruker Biospin supplies only
the intensities of each point in text format, but supplies also the information needed
for the calculation of the chemical shift vector (the first and last chemical shift and
the number of points in the vector). In cases where text output is not available e.g.
XWinNMR from Bruker it is possible to access the processed spectrum directly from
the file where it is saved (e.g. 1r) and the vector of the chemical shifts calculated
from the spectral width, the transmitter frequency offset and the size of the real
spectrum (SW, O1P and SI).
The Main Program
The main program (IntNMR, Figure 2.3) deals with the parameters and the non-linear
regression. In order to simplify, the functions used to fit the multiplets will be coded
in separate subfunctions of the main program. This has the advantage that every
time a function needs to be added (in case of a different multiplet) or changed, a
new subfunction has to be created or an already exiting subfunction has to be
edited, without the need to edit (or change) the main program. To reduce the
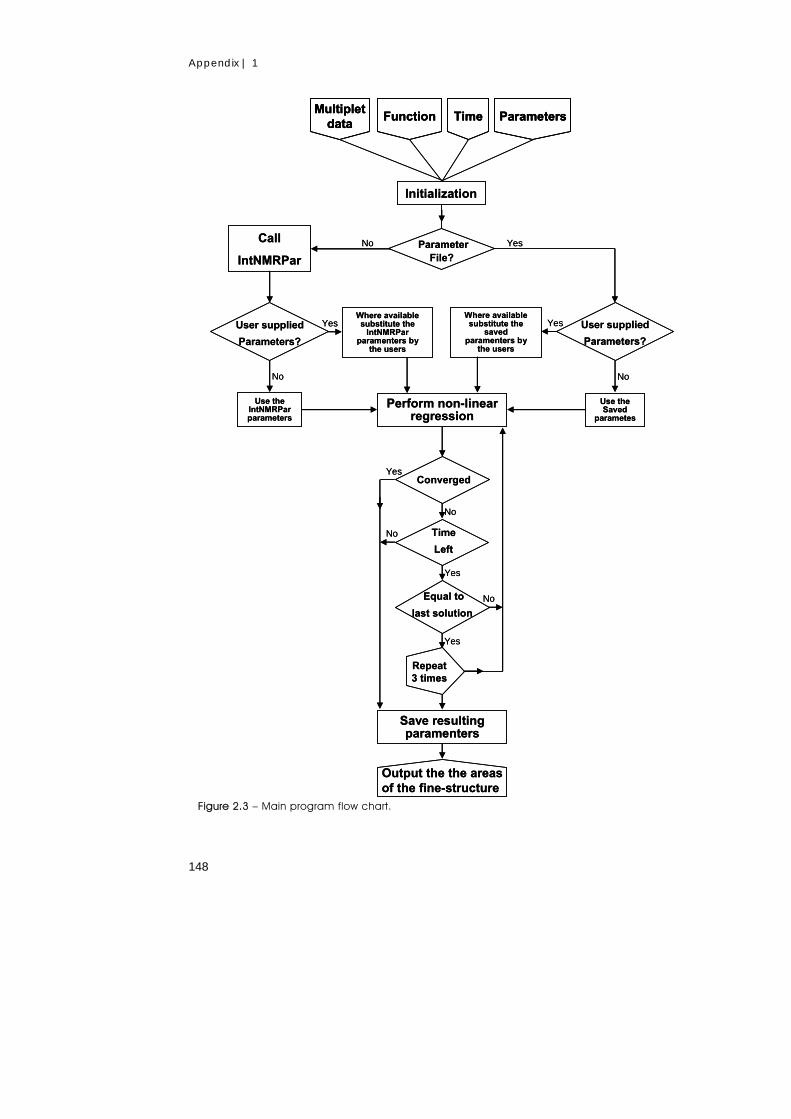
Appendix | 1
148
Multipletdata
Function Time Parameters
Initialization
ParameterFile?
YesNoCall
IntNMRPar
User supplied
Parameters?
Where available substitute the
IntNMRPar paramenters by
the users
Yes
No
Use theIntNMRParparameters
User supplied
Parameters?
YesWhere available substitute the
saved paramenters by
the users
No
Use theSaved
parametes
Perform non-linear regression
ConvergedYes
No
Equal to
last solution
Yes
No
Time
Left
No
Yes
Repeat3 times
Save resultingparamenters
Output the the areasof the fine-structure
Multipletdata
Function Time ParametersMultiplet
dataFunction Time Parameters
Initialization
ParameterFile?
YesNoCall
IntNMRPar
User supplied
Parameters?
Where available substitute the
IntNMRPar paramenters by
the users
Yes
No
Use theIntNMRParparameters
User supplied
Parameters?
YesWhere available substitute the
saved paramenters by
the users
No
Use theSaved
parametes
Perform non-linear regression
ConvergedYes
No
Equal to
last solution
Yes
No
Time
Left
No
Yes
Repeat3 times
Save resultingparamenters
Output the the areasof the fine-structure
Figure 2.3 – Main program flow chart.

Isotopomeric Analysis by 13C-NMR
149
amount of parameters supplied by the user (keeping in mind that some regressions
can have 20 or more parameters) a system was developed to automate this task as
much as possible, which also allows the user to change only one parameter of the
regression without having to re-supply all of them. As is depicted in Figure 2.3, after
initialization the program checks if a parameter file exists. If this is the case, the
program reads these parameters and merges them with the user supplied
parameters. The resulting vector of parameters is a chimera of both parameter sets
where the user-supplied ones have priority over the others. If a parameter file is not
present the parameter vector creating subroutine (IntNMRPar) is called, and again if
there are any user-supplied parameters then these take precedence over
parameters supplied by the IntNMRPar subroutine. Once the parameter vector is
determined the program uses a least-square method to improve the parameters
supplied in order to minimize the differences between the experimental multiplet
and the multiplet generated by the multiplet simulating subroutine. When a solution
is found the parameters are then used to calculate the areas of the fine-structures in
the simulated multiplet that best-fitted the experimental multiplet.
The IntNMRPar Subroutine
The objective of this routine is to generate the vector of parameters (base on the
experimental multiplet and simulating routine) for the first time a multiplet is fitted.
This routine is required to increase the level of automatization of the entire program,
as this allows the user to just list what multiplets should be integrated and state what
kind of multiplets they are (singlets, doublets, and so on), and the program will
perform all the required calculations and present the areas as the final output.
Given the level of automatization required this routine may be very simple or
extremely complex. A simple way of generating an initial vector of parameters is to
supply the usual parameters for a given multiplet (peaks half-width, coupling
constants, isotopic shifts) and calculate the chemical shift and the height of the
highest peak. However this type of solution only works if the singlet is the highest
peak in the multiplet, in any other case this first guess of the parameters would be
completely off. Another way of calculating an initial vector of parameters, which is a
lot less error prone is for example, in the case of a multiplet constituted by a singlet
and a doublet, to determined, from the experimental multiplet data, the chemical
shifts and the heights of the 3 highest peaks. The middle peak may be assumed to
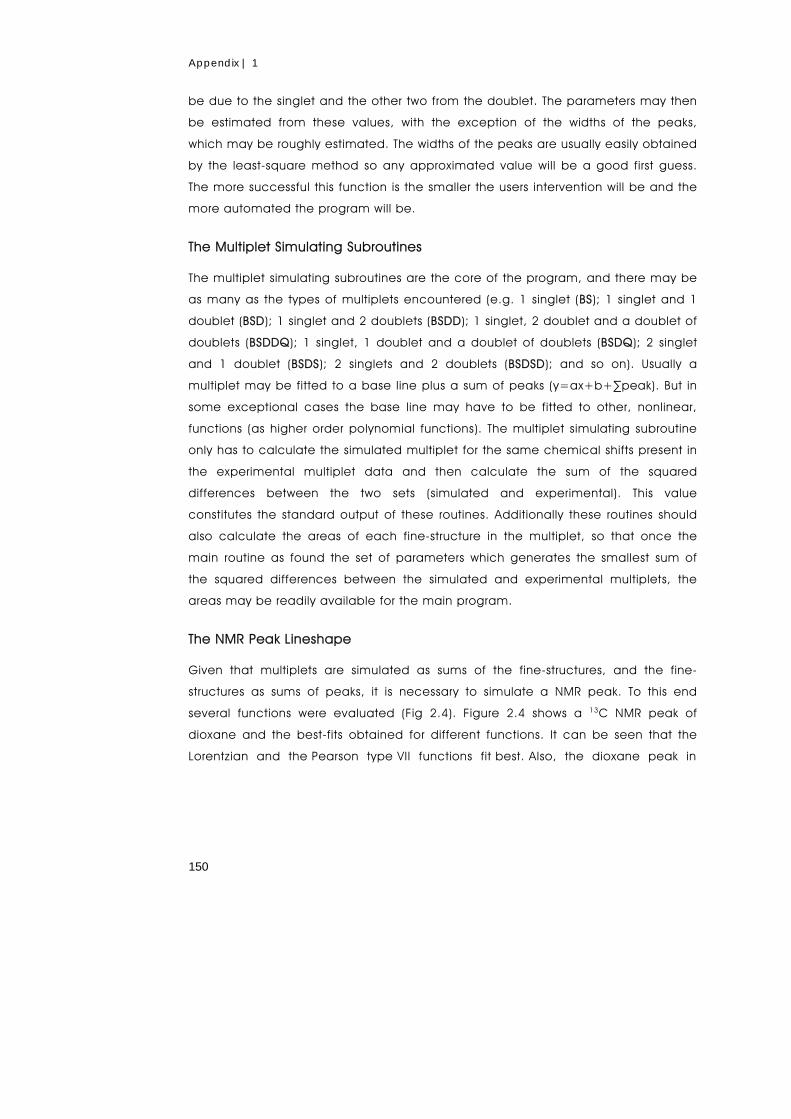
Appendix | 1
150
be due to the singlet and the other two from the doublet. The parameters may then
be estimated from these values, with the exception of the widths of the peaks,
which may be roughly estimated. The widths of the peaks are usually easily obtained
by the least-square method so any approximated value will be a good first guess.
The more successful this function is the smaller the users intervention will be and the
more automated the program will be.
The Multiplet Simulating Subroutines
The multiplet simulating subroutines are the core of the program, and there may be
as many as the types of multiplets encountered (e.g. 1 singlet (BS); 1 singlet and 1
doublet (BSD); 1 singlet and 2 doublets (BSDD); 1 singlet, 2 doublet and a doublet of
doublets (BSDDQ); 1 singlet, 1 doublet and a doublet of doublets (BSDQ); 2 singlet
and 1 doublet (BSDS); 2 singlets and 2 doublets (BSDSD); and so on). Usually a
multiplet may be fitted to a base line plus a sum of peaks (y=ax+b+∑peak). But in
some exceptional cases the base line may have to be fitted to other, nonlinear,
functions (as higher order polynomial functions). The multiplet simulating subroutine
only has to calculate the simulated multiplet for the same chemical shifts present in
the experimental multiplet data and then calculate the sum of the squared
differences between the two sets (simulated and experimental). This value
constitutes the standard output of these routines. Additionally these routines should
also calculate the areas of each fine-structure in the multiplet, so that once the
main routine as found the set of parameters which generates the smallest sum of
the squared differences between the simulated and experimental multiplets, the
areas may be readily available for the main program.
The NMR Peak Lineshape
Given that multiplets are simulated as sums of the fine-structures, and the fine-
structures as sums of peaks, it is necessary to simulate a NMR peak. To this end
several functions were evaluated (Fig 2.4). Figure 2.4 shows a 13C NMR peak of
dioxane and the best-fits obtained for different functions. It can be seen that the
Lorentzian and the Pearson type VII functions fit best. Also, the dioxane peak in

Isotopomeric Analysis by 13C-NMR
151
p
wcx
p
hy
+
−⋅
=
11 2 (Eq. 2.1)
66.7 66.8 66.9 67 67.1 67.2 67.3
66.7 66.8 66.9 67 67.1 67.2 67.3
Figure 2.4 – Plot of the different functions used to fit the NMR peak. In the upper panel is shown the experimental data for a 13C NMR peak of dioxane (in black) and the best-fits obtained for a Gaussian function (in blue), a Lorentzian function (in green) and a Pearson type VII function (in red). In the bottom panel are shown the differences between the experimental peak and the corresponding best-fits (amplified 7 times). It is easily seen that the Lorentzain and the Pearson type VII functions are better suited to model a NMR peak than the Gaussian function.
Appendix | 1
152
Figure 2.4 was obtained under good shimming conditions, which results in an almost
pure Lorentzian peak. However, when shimming is not good, peaks tend to have a
Lorentzian appearance with an increasing Gaussian component. Given that 1D NMR
peaks do not have either pure Gaussian nor Lorentzian lineshapes (Marshall et al.,
2000), the Pearson type VII function (Eq. 2.1) was chosen to model the NMR peak
lineshape, due to its ability model both functions. When p=1, equation 2.1
becomes a Lorentzian function and when p tends to infinite the Pearson type VII
lineshape assumes a Gaussian shape.
Modelling 13C NMR Fine-structures
13C NMR fine-structures arise from 13C scalar couplings and usually are composed of
several peaks. These fine-structures can be modelled by a simple sum of peaks.
However, this approach would mean that for a fine-structure of n peaks one would
need 4n parameters i.e. one height (h), center (c), width (w) and parameter p per
peak, which would lead to an excessive number of parameters. On the other hand,
the peaks in an NMR fine-structure are not just scattered but are constrained and
are all identical. These rules allow us to create functions that model these fine-
structures using a smaller number of parameters. In Figure 2.4 are summarized the
different effects which have been included in the models of the fine-structures.
Each homonuclear scalar coupling splits the resonances of a fine-structure into 2
peaks which distances from the center of the resonance J Hz. The coupling constant
in 13C homonuclear coupling is usually between 30 and 60 Hz. Although the 13C has
a small isotopic effect other nuclei like 2H or 15N have stronger effects, and these
Observed carbon
-J J
TS
Observed carbon
-J J
TS
Figure 2.4 – The multiplet structure. Peaks in a fine-structure are separated from each other by the coupling constants (in a doublet each peak J Hz from the center of the fine-structure). Due to the isotopic effect the center of each fine-structure may be shifted from the center of the singlet (T). The height of the peaks might not be exactly the same due to other effects (as the strong coupling effect).
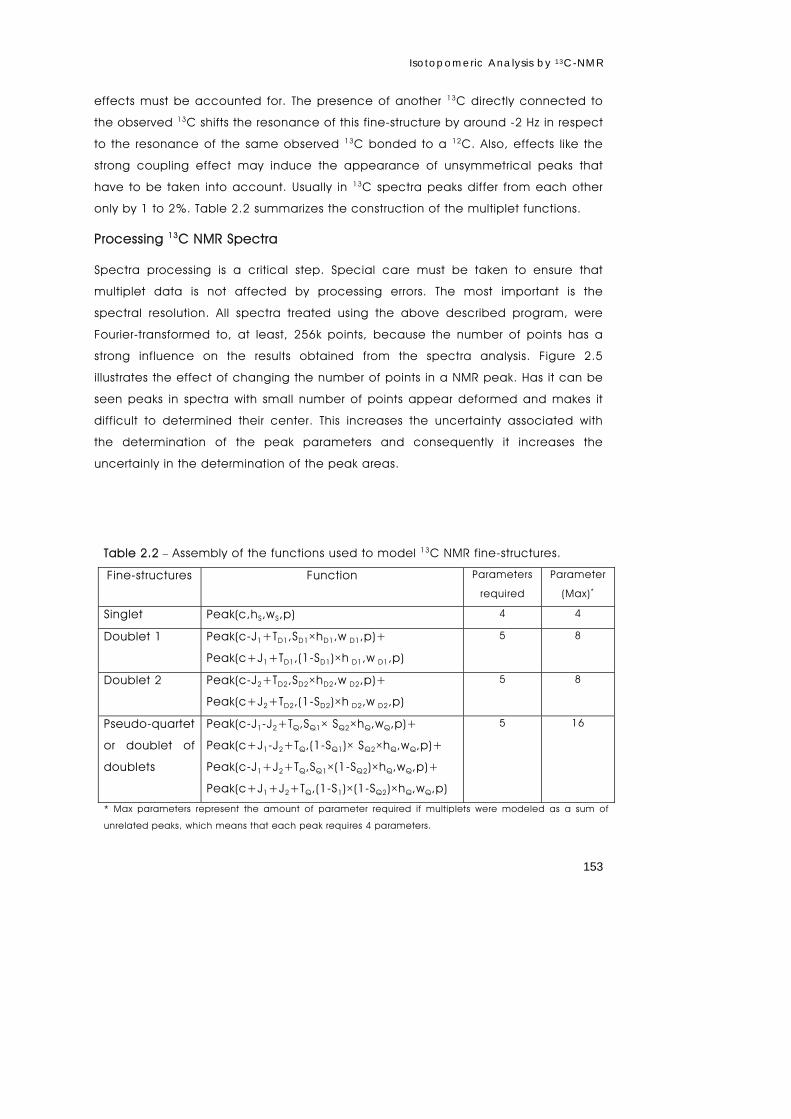
Isotopomeric Analysis by 13C-NMR
153
effects must be accounted for. The presence of another 13C directly connected to
the observed 13C shifts the resonance of this fine-structure by around -2 Hz in respect
to the resonance of the same observed 13C bonded to a 12C. Also, effects like the
strong coupling effect may induce the appearance of unsymmetrical peaks that
have to be taken into account. Usually in 13C spectra peaks differ from each other
only by 1 to 2%. Table 2.2 summarizes the construction of the multiplet functions.
Processing 13C NMR Spectra
Spectra processing is a critical step. Special care must be taken to ensure that
multiplet data is not affected by processing errors. The most important is the
spectral resolution. All spectra treated using the above described program, were
Fourier-transformed to, at least, 256k points, because the number of points has a
strong influence on the results obtained from the spectra analysis. Figure 2.5
illustrates the effect of changing the number of points in a NMR peak. Has it can be
seen peaks in spectra with small number of points appear deformed and makes it
difficult to determined their center. This increases the uncertainty associated with
the determination of the peak parameters and consequently it increases the
uncertainly in the determination of the peak areas.
Table 2.2 – Assembly of the functions used to model 13C NMR fine-structures.
Fine-structures Function Parameters
required
Parameter
(Max)*
Singlet Peak(c,hS,wS,p) 4 4
Doublet 1 Peak(c-J1+TD1,SD1×hD1,w D1,p)+
Peak(c+J1+TD1,(1-SD1)×h D1,w D1,p)
5 8
Doublet 2 Peak(c-J2+TD2,SD2×hD2,w D2,p)+
Peak(c+J2+TD2,(1-SD2)×h D2,w D2,p)
5 8
Pseudo-quartet
or doublet of
doublets
Peak(c-J1-J2+TQ,SQ1× SQ2×hQ,wQ,p)+
Peak(c+J1-J2+TQ,(1-SQ1)× SQ2×hQ,wQ,p)+
Peak(c-J1+J2+TQ,SQ1×(1-SQ2)×hQ,wQ,p)+
Peak(c+J1+J2+TQ,(1-S1)×(1-SQ2)×hQ,wQ,p)
5 16
* Max parameters represent the amount of parameter required if multiplets were modeled as a sum of
unrelated peaks, which means that each peak requires 4 parameters.
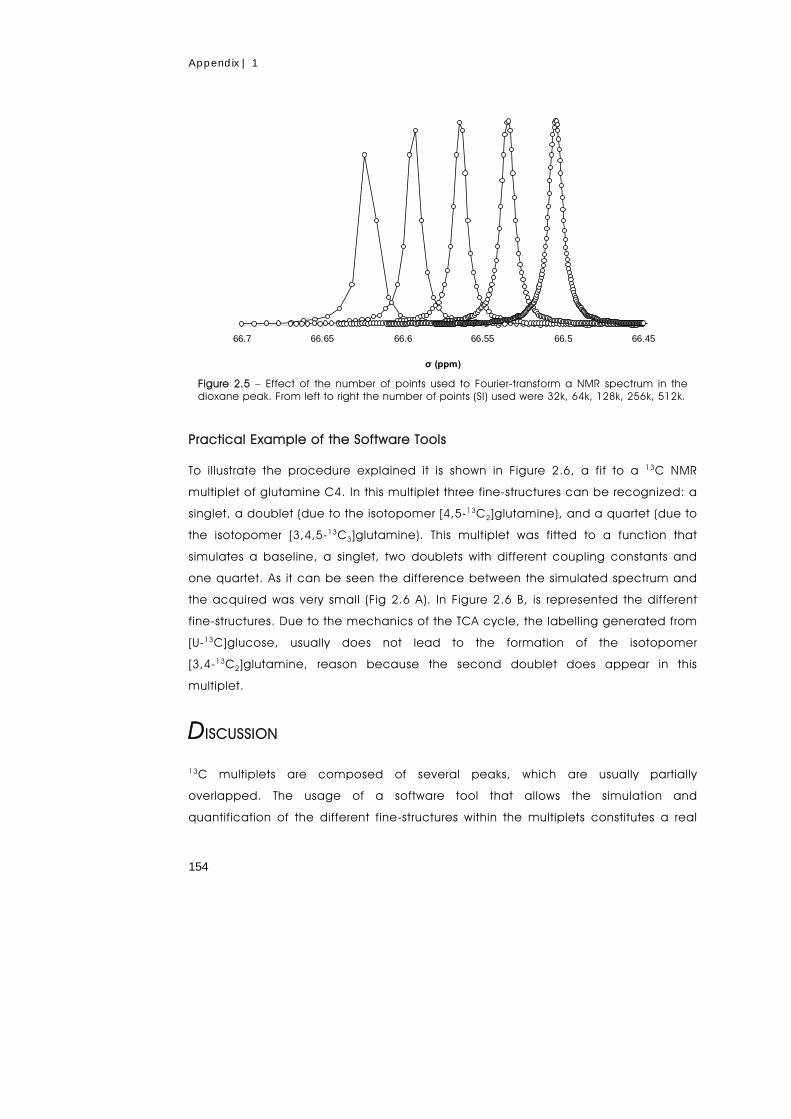
Appendix | 1
154
Practical Example of the Software Tools
To illustrate the procedure explained it is shown in Figure 2.6, a fit to a 13C NMR
multiplet of glutamine C4. In this multiplet three fine-structures can be recognized: a
singlet, a doublet (due to the isotopomer [4,5-13C2]glutamine), and a quartet (due to
the isotopomer [3,4,5-13C3]glutamine). This multiplet was fitted to a function that
simulates a baseline, a singlet, two doublets with different coupling constants and
one quartet. As it can be seen the difference between the simulated spectrum and
the acquired was very small (Fig 2.6 A). In Figure 2.6 B, is represented the different
fine-structures. Due to the mechanics of the TCA cycle, the labelling generated from
[U-13C]glucose, usually does not lead to the formation of the isotopomer
[3,4-13C2]glutamine, reason because the second doublet does appear in this
multiplet.
DISCUSSION
13C multiplets are composed of several peaks, which are usually partially
overlapped. The usage of a software tool that allows the simulation and
quantification of the different fine-structures within the multiplets constitutes a real
66.4566.566.5566.666.6566.7
σ (ppm)
Figure 2.5 – Effect of the number of points used to Fourier-transform a NMR spectrum in the dioxane peak. From left to right the number of points (SI) used were 32k, 64k, 128k, 256k, 512k.
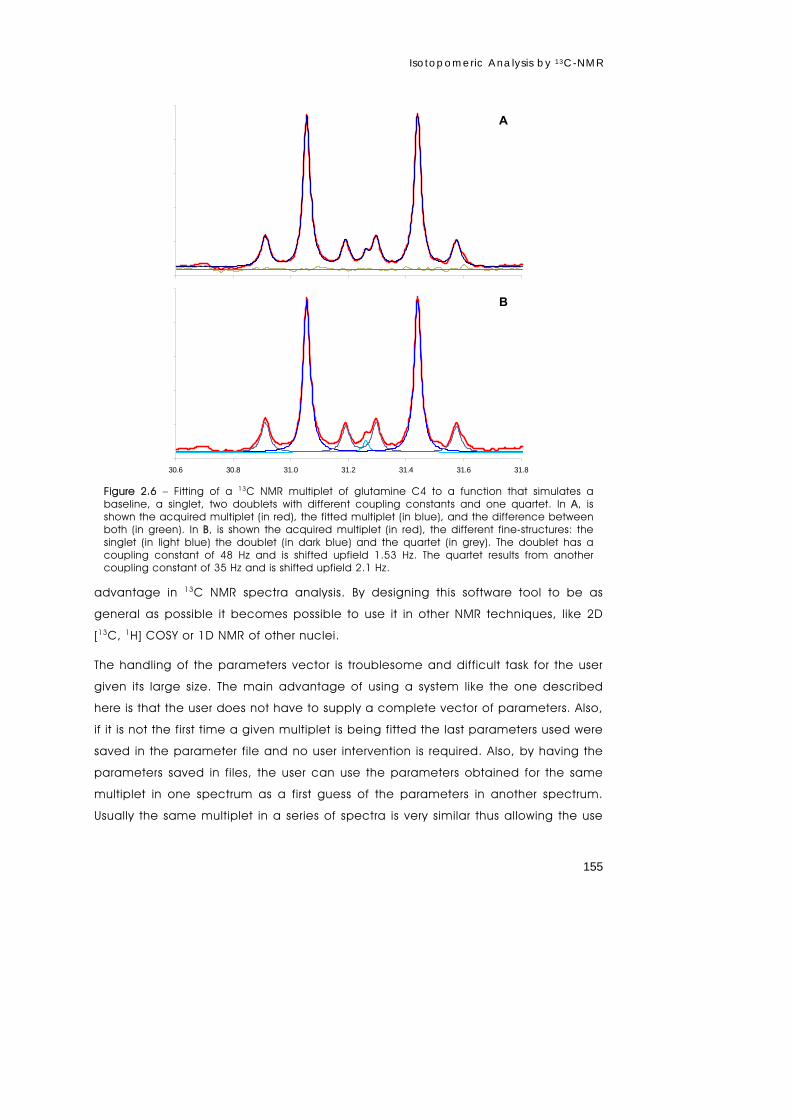
Isotopomeric Analysis by 13C-NMR
155
advantage in 13C NMR spectra analysis. By designing this software tool to be as
general as possible it becomes possible to use it in other NMR techniques, like 2D
[13C, 1H] COSY or 1D NMR of other nuclei.
The handling of the parameters vector is troublesome and difficult task for the user
given its large size. The main advantage of using a system like the one described
here is that the user does not have to supply a complete vector of parameters. Also,
if it is not the first time a given multiplet is being fitted the last parameters used were
saved in the parameter file and no user intervention is required. Also, by having the
parameters saved in files, the user can use the parameters obtained for the same
multiplet in one spectrum as a first guess of the parameters in another spectrum.
Usually the same multiplet in a series of spectra is very similar thus allowing the use
30.6 30.8 31.0 31.2 31.4 31.6 31.8
30.6 30.8 31.0 31.2 31.4 31.6 31.8
A
B30.6 30.8 31.0 31.2 31.4 31.6 31.8
30.6 30.8 31.0 31.2 31.4 31.6 31.8
A
B
Figure 2.6 – Fitting of a 13C NMR multiplet of glutamine C4 to a function that simulates a baseline, a singlet, two doublets with different coupling constants and one quartet. In A, is shown the acquired multiplet (in red), the fitted multiplet (in blue), and the difference between both (in green). In B, is shown the acquired multiplet (in red), the different fine-structures: the singlet (in light blue) the doublet (in dark blue) and the quartet (in grey). The doublet has a coupling constant of 48 Hz and is shifted upfield 1.53 Hz. The quartet results from another coupling constant of 35 Hz and is shifted upfield 2.1 Hz.
Appendix | 1
156
of the parameters of one in the next. Whenever a parameter file is not present, the
IntNMRPar sub-function is called. In this function the user can store the usual first
guess parameters for a given function. However, for the simpler functions (like the
function used to fit a multiplet constituted by a baseline and a singlet or even by a
baseline a singlet and a doublet) a small amount of code can be created that
analyses the experimental multiplet and, accordingly with the function being used
by the user, calculates, based on the local maxima found in the multiplet data, a
very good initial guess of the parameters. In every case, the user supplied
parameters, if supplied, are always used, instead of the calculated.
The lineshapes of 1D NMR peaks are not purely Gaussian or Lorentzian (Marshall et
al., 2000). The function that best describes a NMR resonance is the Voigtian
lineshape. However, this function can not be expressed analytically, which makes it
very difficult to work with, and even more difficult to integrate, which is the final
objective of fitting the NMR peaks. However, there are several ways to avoid using
this function and some includes using the sum or the product of a Gaussian and a
Lorentzian functions (Stephenson and Binsch, 1980; Conny and Powell, 2000).
Another way of approximating a Voigtian lineshape is using the Pearson type VII
function (Subhash and Mohanan, 1997; van Winden et al., 2001). The Pearson type
VII function was chosen due to its ability to approximate both Gaussian and
Lorentzian functions easily and with a small number of parameters, and in contrast
with Voigtian function, it is analytically determined and is readily integrated. The use
of this function together with the rationalization of the parameter usage to simulate
the 13C NMR fine-structures made possible the quantification of the 13C NMR
multiplets in a simple and fast way.
Further improvements to this program may include the addition of a graphical user
interface (GUI) and the inclusion of an error estimation sub-function, which will allow
estimating the errors of the determined areas, as well as, their co-variances.
REFERENCES
Conny J. M., Powell C. J. (2000) Standard test data for estimating peak parameter
errors in x-ray photoelectron spectroscopy III. Errors with different curve-fitting
approaches. Surf. Interface Anal. 29, 856-872.
Isotopomeric Analysis by 13C-NMR
157
Eakin R. T., Morgan L. O., Gregg C. T., Matwiyoff N. A. (1972) Carbon-13 nuclear
magnetic resonance spectroscopy of living cells and their metabolism of a
specifically labeled 13C substrate. FEBS Lett. 28, 259-264.
London R. E. (1988) C-13 labeling in studies of metabolic-regulation. Prog. NMR
Spectroscopy 20, 337-383.
Marshall I., Bruce S. D., Higinbotham J., MacLullich A., Wardlaw J. M., Ferguson K. J.,
Seckl J. (2000) Choice of spectroscopic lineshape model affects metabolite
peak areas and area ratios. Magn. Reson. Med. 44, 646-649.
Stephenson D. S., Binsch G. (1980) Automated analysis of high-resolution NMR
spectra I. Principles and computational strategy. J. Magn. Reson. 37, 395-
407.
Subhash N., Mohanan C. N. (1997) Curve-fit analysis of chlorophyll fluorescence
spectra: Application to nutrient stress detection in sunflower. Remote Sens.
Environ. 60, 347-356.
van Winden W., Schipper D., Verheijen P., Heijnen J. (2001) Innovations in generation
and analysis of 2D [13C,1H] COSY NMR spectra for metabolic flux analysis
purposes. Metab. Eng. 3, 322-343.
Wiechert W. (2001) 13C metabolic flux analysis. Metab. Eng. 3, 195-206.

Appendix | 1
158