astrocytes in the central amygdala and
TRANSCRIPT

Page 1/37
Three-dimensional morphometric analysis revealstime-dependent structural changes in microglia andastrocytes in the central amygdala andhypothalamic paraventricular nucleus of heartfailure ratsFerdinand Althammer
Georgia State UniversityHildebrando Candido Ferreira-Neto
Georgia State UniversityMyurajan Rubaharan
Georgia State UniversityRanjan Kumer Roy
Georgia State UniversityJavier E Stern ( [email protected] )
Georgia State University
Research
Keywords: hypothalamus, amygdala, microglia, astrocytes, A1, behavior, cytokines, heart failure,neuroin�ammation, autonomic
Posted Date: January 28th, 2020
DOI: https://doi.org/10.21203/rs.2.22086/v1
License: This work is licensed under a Creative Commons Attribution 4.0 International License. Read Full License
Page 2/37
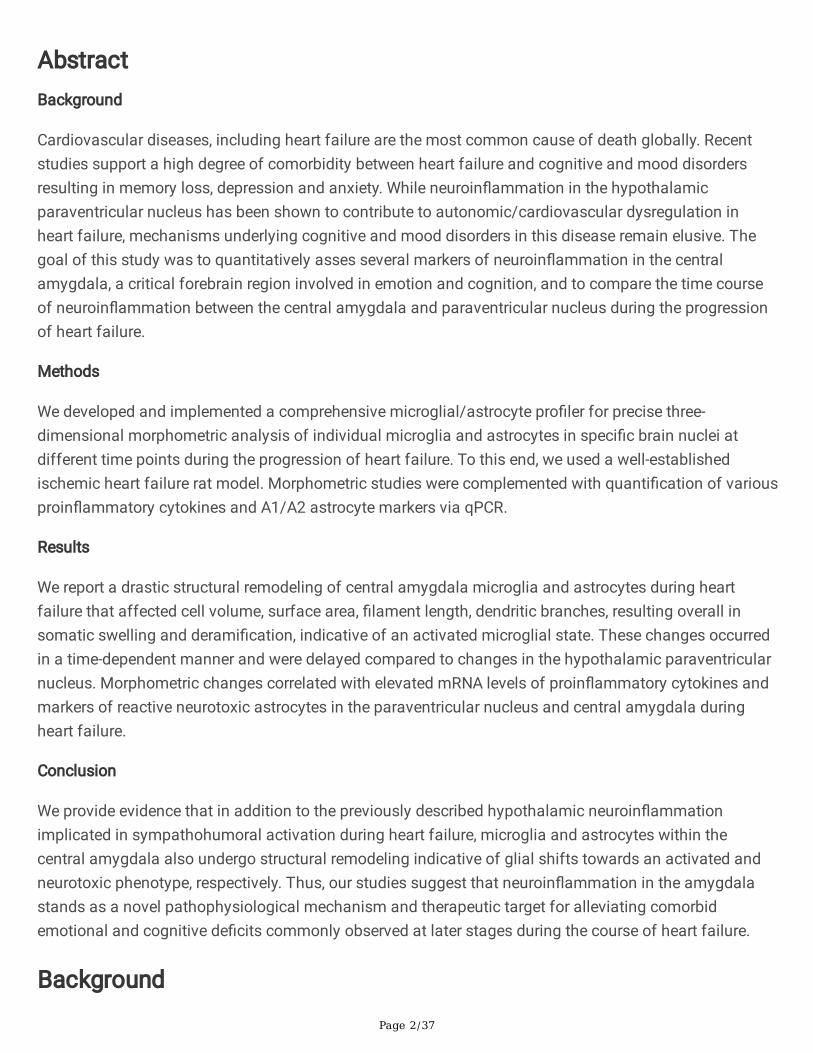
AbstractBackground
Cardiovascular diseases, including heart failure are the most common cause of death globally. Recentstudies support a high degree of comorbidity between heart failure and cognitive and mood disordersresulting in memory loss, depression and anxiety. While neuroin�ammation in the hypothalamicparaventricular nucleus has been shown to contribute to autonomic/cardiovascular dysregulation inheart failure, mechanisms underlying cognitive and mood disorders in this disease remain elusive. Thegoal of this study was to quantitatively asses several markers of neuroin�ammation in the centralamygdala, a critical forebrain region involved in emotion and cognition, and to compare the time courseof neuroin�ammation between the central amygdala and paraventricular nucleus during the progressionof heart failure.
Methods
We developed and implemented a comprehensive microglial/astrocyte pro�ler for precise three-dimensional morphometric analysis of individual microglia and astrocytes in speci�c brain nuclei atdifferent time points during the progression of heart failure. To this end, we used a well-establishedischemic heart failure rat model. Morphometric studies were complemented with quanti�cation of variousproin�ammatory cytokines and A1/A2 astrocyte markers via qPCR.
Results
We report a drastic structural remodeling of central amygdala microglia and astrocytes during heartfailure that affected cell volume, surface area, �lament length, dendritic branches, resulting overall insomatic swelling and derami�cation, indicative of an activated microglial state. These changes occurredin a time-dependent manner and were delayed compared to changes in the hypothalamic paraventricularnucleus. Morphometric changes correlated with elevated mRNA levels of proin�ammatory cytokines andmarkers of reactive neurotoxic astrocytes in the paraventricular nucleus and central amygdala duringheart failure.
Conclusion
We provide evidence that in addition to the previously described hypothalamic neuroin�ammationimplicated in sympathohumoral activation during heart failure, microglia and astrocytes within thecentral amygdala also undergo structural remodeling indicative of glial shifts towards an activated andneurotoxic phenotype, respectively. Thus, our studies suggest that neuroin�ammation in the amygdalastands as a novel pathophysiological mechanism and therapeutic target for alleviating comorbidemotional and cognitive de�cits commonly observed at later stages during the course of heart failure.
Background

Page 3/37
Cardiovascular diseases (CVDs) are the major cause of death globally, with 17.9 million people dyingfrom CVDs in 2016, thereby representing 31% of all global deaths (World Health Organization, 2017). Thevast majority of CVD-related deaths (85%) can be attributed to stroke and heart failure (HF) with theiraccompanying detrimental effects on the human body, albeit there might be substantial geographicdifferences in survivability rates (1). A growing body of clinical studies suggests a high degree ofcomorbidity between CVDs and cognitive impairments and emotional distress (2-4), In fact, 20-40% of allHF patients develop major depression and display anxiety levels signi�cantly higher than the healthypopulation (2, 3, 5, 6), which usually appear later than the cardiovascular and autonomic-relatedsymptoms (7). However, the precise underlying neuronal substrates and mechanisms leading to mooddisorders and cognitive impairments after HF remain largely unknown. Using the rodent left coronaryligation HF model, studies demonstrated that HF mice and rats exhibited behavioral changes includingincreased anxiety, depression, social impairments and anhedonia (8-10).
The paraventricular nucleus of the hypothalamus (PVN) is a key structure for the regulation ofsympathetic out�ow and cardiovascular control (11-14), playing thus a major role in bodily homeostasisand neuroendocrine control (15-17). These actions are mediated via direct innervation of sympathetic-related brainstem and spinal cord neurons (11-14). There is also compelling evidence supporting a criticalrole for the PVN in the onset and maintenance of sympathohumoral activation during HF (18-22).Importantly, neuroin�ammation (NI) within the PVN has been described as a hallmark pathophysiologicalmechanism contributing to increased sympathetic out�ow during this disease (23-26). The PVN is alsorecognized as an important center in emotional regulation and harbors a variety of cells producingdifferent neuropeptides (27-29). In line with this, the PVN directly communicates with the lateralsubdivision (CeL) of the Central Amygdala (CeA), which plays an important role in depression (30, 31),fear and anxiety (32-34). Oxytocin(OT)-synthesizing neurons in the PVN project long-range axonalterminals to the CeL, where the local release of OT directly regulates anxiety levels (35, 36), fear memoriesand fear extinction (37, 38). Moreover, a recent study highlighted the pivotal role of OT signaling in theCeA in mouse models of depression (39). While NI in HF rats has been previously described (25, 26), verylittle is known about HF-induced NI in other brain areas, such as the CeA, and the respective temporalrelation to the onset of NI in the PVN.
NI is predominantly mediated by microglia, the immune cells that take up residence in the brainparenchyma (40, 41). While classical markers such as increased microglial density, increased expressionof ionized calcium-binding adapter molecule 1 (IBA1) and various cytokines are widely used to assess NI,they fall short of addressing detailed microglial morphology changes during this pathological process.This is critical because diverse microglial morphometric features are not only associated to diversemicroglial functions (42, 43) , but more importantly, they have been recently associated to differentstages in the spatio-temporal progression of the NI process (44). In this sense, classical two-dimensionalmaximum projection analysis cannot be used to assess microglial cellular or somatic volume. In light ofthese recent �ndings, it becomes clear that detailed 3D analysis or microglia cell morphology is ofparamount importance, especially considering microglial heterogeneity and brain region-speci�cdifferences in size, density or activation stages (45). Such detailed analysis and quanti�cation of

Page 4/37
microglial morphometry in the PVN and CeA under control and disease conditions, such as HF has, to thebest of our knowledge, not been performed yet. Given that NI involves an intricate interplay betweenmicroglia and astrocytes (46-48), we were also interested to determine whether HF would alter astrocytefunction and morphology as well.
To this end, we created a comprehensive glial morphometric pro�ler and used a novel approach toperform a detailed quantitative analysis of microglial and astrocyte morphology in the PVN and CeA ofHF rats in a time-dependent manner 8, 14 and 16 weeks (abbreviated as 8w, 14w and 16w) after the onsetof the disease. Moreover, we correlated these morphological parameters with the assessment of variousclassical markers for NI via qPCR (IBA1, GFAP, TNF-a, IL-1b and IL-6) as well as markers for astrocyte A1(neurotoxic) and A2 neuroprotective phenotypes (Serping1, C3, Sphk1 and Tm4sf1) (48-51). Our resultshighlight for the �rst time that in addition to the PVN, HF also induces a robust microglial/astrocyte cellremodeling and activation as well as increased cytokine levels in the CeA, a critical forebrain regioninvolved in emotion and cognition. NI-related changes in the CeA occurred with a delayed time coursecompared to those in the PVN, and could potentially contribute to cognitive impairment and mooddisorders observed at later stages of the disease in HF patients.
Materials And MethodsAll performed experiments were approved by the Georgia State University Institutional Animal Care andUse Committee (IACUC) and carried out in agreement with the IACUC guidelines. At all time, animals hadad libitum access to food and water and all efforts were made to minimize suffering and the numbers ofanimals used for this study.
Animals
We used male Wistar rats (5 weeks old at surgery, 180-200g, Envigo) for all experiments (total n=44,immunohistochemistry and IMARIS analysis: 28; qPCR: 18). Rats were housed in cages (2 per cage)under constant temperature (22 ± 2°C) and humidity (55 ± 5%) on a 12-h light cycle (lights on: 08:00-20:00).
Heart failure surgery and Echocardiography
HF was induced by coronary artery ligation as previously described (21). In brief, animals wereanaesthetized using 4% iso�urane and intubated for mechanical ventilation. To exteriorize the heart, weperformed a left thoracotomy. The ligation was performed on the main diagonal branch of the leftanterior descending coronary artery. Animals received buprenorphine SR-LAB (0.5 mg/kg, S.C.; ZooPharm,Windsor, CO, USA) before the surgical procedure to minimize postsurgical pain. Sham animals underwentthe same procedure except the occlusion of the left coronary artery. Five weeks after the surgery weperformed transthoracic echocardiography (Vevo 3100 systems; Visual Sonics, Toronto, ON; Canada)under light iso�urane (2-3%) anesthesia. We obtained the left ventricle internal diameter and the leftdiameter of the ventricle posterior and anterior walls in the short-axis motion imaging mode to calculate

Page 5/37
the ejection fraction (EF). Animals with an EF <50% were considered as HF. The average EFs were 79.13 ±1.57% (sham, n=21) and 32.48 ± 2.01% (HF, n=21). Animals were used 8, 14 or 16 weeks after the HFsurgery and allocated to the respective groups as indicated in the individual experiments. In addition, weused an additional naive control group, which comprised rats that did not undergo any surgicalprocedure.
Immunohistochemistry
Following pentobarbital-induced anesthesia (Euthasol, Virbac, ANADA #200-071, Fort Worth, TX, USA, 0.5mL, i.p.), rats were �rst perfused at a speed of 20mL/min with 0.01M PBS (200mL, 4°C) through the leftventricle followed by 4% PFA (in 0.3M PBS, 200mL, 4°C), while the right atrium was opened with anincision. Brains were post-�xated for 24 hours in 4% PFA at 4°C and transferred into a 30% sucrosesolution (in 0.01M PBS) at 4°C for 3-4 days. For immunohistochemistry, 40 µm slices were cut using aLeica Cryostat (CM3050 S) and brain slices were kept in 0.01M PBS at 4°C until used for staining. Brainslices containing the PVN (A/P, Bregma: -1.1mm to -1.6mm) and the CeA (A/P, Bregma: -2.0 mm to -2.8mm) were blocked with 5% Normal Horse Serum in 0.01M PBS for 1h at room temperature. To identifythe PVN and CeA topographically, we used the supraoptic nucleus and fornix, as well as the optic tractand commissural stria terminalis as landmarks, respectively. After a 15-min washing in 0.01M PBS, brainslices were incubated for 24h in 0.01M PBS, 0.1% Triton-X, 0.04% NaN3 containing 1:1000 of anti-IBA1(polyclonal rabbit, Wako, 019-19741, Lot: CAK1997), 1:1000 anti-glutamine synthetase (monoclonalmouse, Merck Milipore, MAB 302, clone GS-6) or anti-GFAP (goat polyclonal, abcam, ab53554) at roomtemperature. Following 15-min washing in 0.01M PBS, sections were incubated in 0.01M PBS, 0.1%Triton-X, 0.04% NaN3 with 1:500 Alexa Fluor 488/594-conjugated donkey anti-rabbit/goat/mouse(Jackson ImmunoResearch, 711-585-152, 705-585-147, 715-545-151) for 4 hours at RT. Brain slices werewashed again for 15 mins in 0.01M PBS and mounted using antifade mounting medium (Vectashield H-1500).
Confocal microscopy and 3D IMARIS analysis
For the 3D reconstruction of microglia, we took Z-stack images (50 µm depth, 1µm steps, 40xmagni�cation) of PVN, CeA (lateral and medial subdivision of the CeA, but not the capsular subdivision)and somatosensory cortex 1 barrel �eld (S1BF) using a Zeiss LSM 780 confocal microscope (1024x1024pixel, 16-bit depth, pixel size 0.63-micron, zoom 0.7). Raw czi �les were used for further analysis usingIMARIS software (Version 9.31, Oxford Instruments). First, IMARIS was used to reconstruct the microglialsurface using the following custom settings: surfaces Detail 0.700 µm (smooth); thresholdingBackground subtraction (Local Contrast), diameter of largest Sphere, which �ts into the object: 2.00;Color: base, diffusion transparency: 65%. After surface reconstruction, we used the �lter function toremove unspeci�c background signals: Filter: Volume max – 400 µm3. All microglia with incompletesomata (cut by either the x, y or z plane) were manually removed and not included in further analysis. Inaddition, reconstructed entities that were clearly not microglia (i.e. �laments without soma) were alsomanually removed. Fused microglia that were falsely recognized as one entity by the software were
Page 6/37
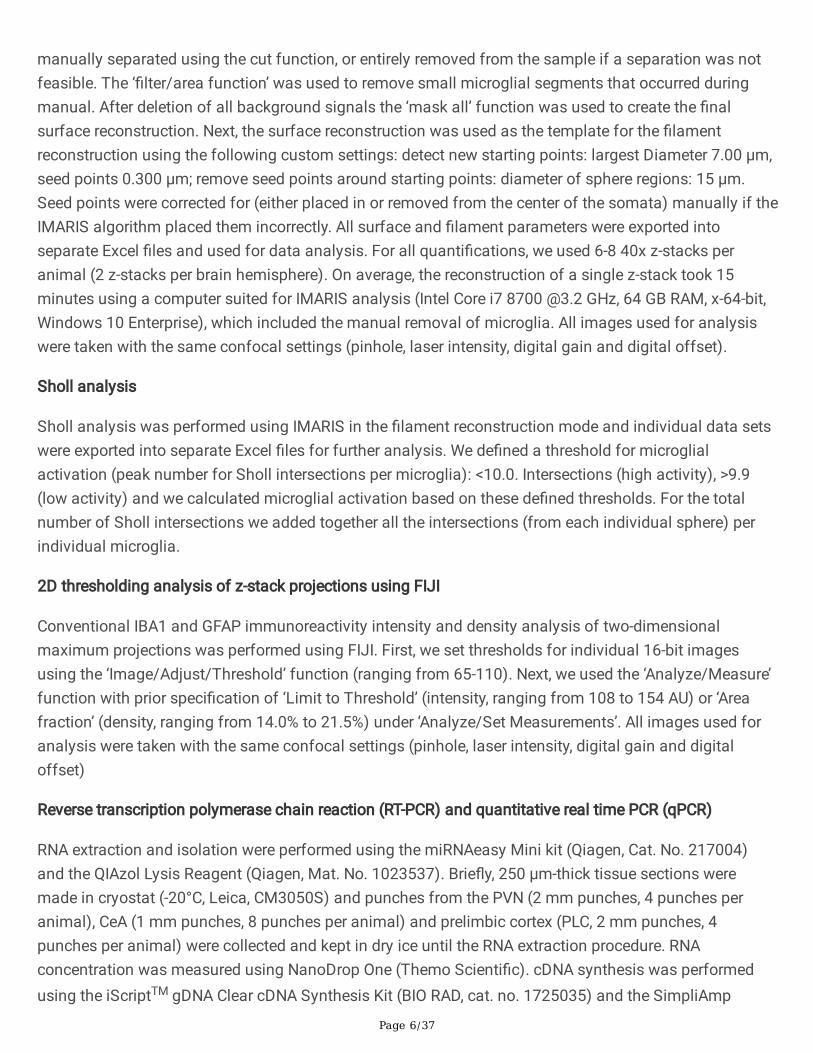
manually separated using the cut function, or entirely removed from the sample if a separation was notfeasible. The ‘�lter/area function’ was used to remove small microglial segments that occurred duringmanual. After deletion of all background signals the ‘mask all’ function was used to create the �nalsurface reconstruction. Next, the surface reconstruction was used as the template for the �lamentreconstruction using the following custom settings: detect new starting points: largest Diameter 7.00 µm,seed points 0.300 µm; remove seed points around starting points: diameter of sphere regions: 15 µm.Seed points were corrected for (either placed in or removed from the center of the somata) manually if theIMARIS algorithm placed them incorrectly. All surface and �lament parameters were exported intoseparate Excel �les and used for data analysis. For all quanti�cations, we used 6-8 40x z-stacks peranimal (2 z-stacks per brain hemisphere). On average, the reconstruction of a single z-stack took 15minutes using a computer suited for IMARIS analysis (Intel Core i7 8700 @3.2 GHz, 64 GB RAM, x-64-bit,Windows 10 Enterprise), which included the manual removal of microglia. All images used for analysiswere taken with the same confocal settings (pinhole, laser intensity, digital gain and digital offset).
Sholl analysis
Sholl analysis was performed using IMARIS in the �lament reconstruction mode and individual data setswere exported into separate Excel �les for further analysis. We de�ned a threshold for microglialactivation (peak number for Sholl intersections per microglia): <10.0. Intersections (high activity), >9.9(low activity) and we calculated microglial activation based on these de�ned thresholds. For the totalnumber of Sholl intersections we added together all the intersections (from each individual sphere) perindividual microglia.
2D thresholding analysis of z-stack projections using FIJI
Conventional IBA1 and GFAP immunoreactivity intensity and density analysis of two-dimensionalmaximum projections was performed using FIJI. First, we set thresholds for individual 16-bit imagesusing the ‘Image/Adjust/Threshold’ function (ranging from 65-110). Next, we used the ‘Analyze/Measure’function with prior speci�cation of ‘Limit to Threshold’ (intensity, ranging from 108 to 154 AU) or ‘Areafraction’ (density, ranging from 14.0% to 21.5%) under ‘Analyze/Set Measurements’. All images used foranalysis were taken with the same confocal settings (pinhole, laser intensity, digital gain and digitaloffset)
Reverse transcription polymerase chain reaction (RT-PCR) and quantitative real time PCR (qPCR)
RNA extraction and isolation were performed using the miRNAeasy Mini kit (Qiagen, Cat. No. 217004)and the QIAzol Lysis Reagent (Qiagen, Mat. No. 1023537). Brie�y, 250 µm-thick tissue sections weremade in cryostat (-20°C, Leica, CM3050S) and punches from the PVN (2 mm punches, 4 punches peranimal), CeA (1 mm punches, 8 punches per animal) and prelimbic cortex (PLC, 2 mm punches, 4punches per animal) were collected and kept in dry ice until the RNA extraction procedure. RNAconcentration was measured using NanoDrop One (Themo Scienti�c). cDNA synthesis was performedusing the iScriptTM gDNA Clear cDNA Synthesis Kit (BIO RAD, cat. no. 1725035) and the SimpliAmp

Page 7/37
Thermal Cycler (applied biosystems, Thermo Fisher Scienti�c) following the manufacturer’s protocol.qPCR was conducted using the following 10x QuantiTect primers (diluted in 1.1 mL TE ph 8.0) purchasedfrom Qiagen: IBA1 (QT01591751), GFAP, IL-1b (QT00181657), IL-6 (QT00182896), Serping1(QT01607326), C3 (QT00187159), Tm4sf1 (QT01588034), Sphk1 (QT00182035), TNF-a (QT00182896)and b-Actin (QT00193473, used as the reference gene). All individual qPCR reactions (brain region, primerand condition) were triplicated.
Statistical analysis
All statistical analyses were performed using GraphPad Prism 8 (GraphPad Software, California, USA).The signi�cance of differences was determined using Student’s t test or two-way ANOVA for two-groupcomparisons followed by Tukey post-hoc test, as indicated throughout the text. Results are expressed asmean ± standard error of the mean (SEM). If not mentioned otherwise, statistical comparisons wereperformed between HF groups and their respective sham groups. Results were considered statisticallysigni�cant if p < 0.05 and are presented as * for p < 0.05, ** for p < 0.01 and *** for p<0.0001 in therespective Figures.
ResultsDevelopment and validation of a comprehensive microglia pro�ler to obtain an in-depth 3D morphometricanalysis of various cellular parameters
Classic assessment of NI relies on the measurement of cytokine levels, as well as 2D-morphologicalanalysis, which only provides very limited information about IBA1 immunoreactivity intensity and cellulardensity. Since microglia operate in a three-dimensional space it becomes clear that important informationabout intricate microglial cell remodeling gets lost, because of the dimensional restriction imposed by 2Dimaging. In fact, when we performed a conventional 2D analysis of IBA immunoreactivity we found nosigni�cant differences in microglial density between sham and HF rats in both the PVN (40x z-stack,sham 14w: 29.1 ± 3 cells vs HF 14w: 30.4 ± 3 cells, n.s., n=4) and the CeA (40x z-stack, sham 14w: 28.6 ±3 cells vs. HF 14w: 29.5 ± 2 cells, n.s., n=4) (Fig. 1c, d).
We then used a novel approach we developed using IMARIS to perform 3D reconstruction of microgliaand astrocytes, allowing us to assess surface area, cell volume, �lament length, dendritic branches andmorphometric complexity (Fig. 2a). In brief, we took 50µm z-stack confocal images (16-bit, 1 µm steps,40x objective) of brain slices stained with IBA1 and exported czi �les for further analysis in IMARIS. Theraw image was used to reconstruct surface and �laments of individually recognized microglia cells (Fig.2b). Incompletely stained microglia were not included into our analysis (detailed description of IMARIS-based analysis can be found in ‘Material and Methods’). This method allows an unbiased highthroughput analysis of various cellular features and is a universally applicable tool for morphometricanalysis of different cell types under various conditions. To assess whether the sham surgery itselfresulted in microglia morphometric alterations over time, we perfused naïve (20 weeks old, n=2) andsham rats (8-, 14- and 16-weeks post-surgery, n=4/group). We stained brain sections containing the PVN

Page 8/37
and the CeA with IBA1 and analyzed microglial pro�les using IMARIS. We did not observe any signi�cantchanges in the PVN or CeA of sham rats in any of these parameters either when compared to naive rats(20w), or as a function of time after the surgical procedure (8w, 14w or 16w, Fig. 3a-d). Therefore, wedecided to pool together the three sham groups for further analysis.
HF-induced a time-dependent NI and morphometric microglial changes in the PVN that are alreadyevident at 8 weeks post-surgery
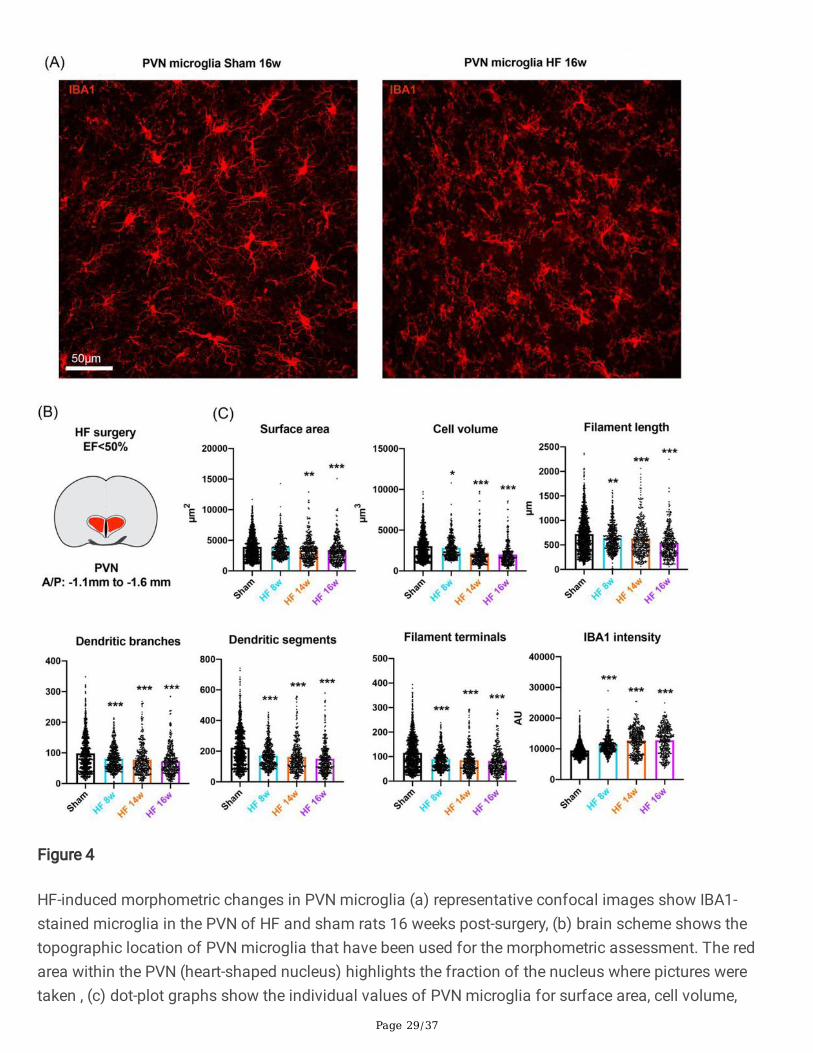
To study potential HF-induced in�ammatory responses in the PVN and CeA over time, we perfused shamand HF rats at 8, 14 and 16 weeks after the surgery (n=4/group) and assessed microglial surface area,cell volume, �lament length, dendritic branches, dendritic segments, �lament terminals and IBA1 density.Representative confocal images of PVN microglia of sham and HF rats 16-weeks post-surgery are shownin Fig. 4a. As depicted in Fig. 4b and c, we found signi�cant morphometric microglial changes already at8 weeks post-surgery, which progressed as a function of time. We found a progressive decrease inmicroglial surface area (0.9%, n.s., 12.3%, p=0.0001 and 17.1%, p<0.0001 at 8, 14, and 16 weeks,respectively, one-way ANOVA, F=15.87, p<0.0001); a progressive decrease in microglial cell volume (7.0%,p=0.0475, 27.5%, p<0.0001 and 34.0%, p<0.0001 at 8, 14, and 16 weeks, respectively, one-way ANOVA,F=61.99, p<0.0001); a decrease in �lament length (10.6%, p=0.0002, 12.5%, p<0.0001 and 26.1%,p<0.0001 at 8, 14, and 16 weeks, respectively, one-way ANOVA, F=32.42, p<0.0001); a progressivereduction in the number of dendritic branches (17.8%, p<0.0001, 21.0%, p<0.0001 and 26.6%, p<0.0001 at8, 14, and 16 weeks, respectively, one-way ANOVA, F=30.06, p<0.0001); a progressive reduction in thenumber of dendritic segments (24.2%, p<0.0001, 26.8%, p<0.0001 and 32.2%, p<0.0001 at 8, 14, and 16weeks, respectively, one-way ANOVA, F=58.72, p<0.0001); a reduction in the number of �lament terminals(22.3%, p<0.0001, 26.0%, p<0.0001 and 28.1%, p<0.0001 at 8, 14, and 16 weeks, respectively, one-wayANOVA, F=49.5, p<0.0001) and a progressive increase in IBA1 intensity (17.4%, p<0.0001, 34.4%,p<0.0001 and 34.6%, p<0.0001 at 8, 14, and 16 weeks, respectively, one-way ANOVA, F=160.7, p<0.0001.These �ndings indicate that HF-induced NI in the PVN is evident as early as 8 weeks after the myocardialinfarction (MI).
Next, to rule out that HF-induced NI was a rather diffuse in�ammatory phenomenon affecting the wholebrain, we chose the primary somatosensory cortex (barrel �eld, S1BF, Fig. 5a, b) as a functionally-unrelated control region and analyzed IBA1-labeled microglia in this structure. We did not observe anysigni�cant microglial changes within this region, suggesting that, at least at this stage of HF-induced NI,cortical brain areas might not be affected.
HF-induced delayed NI and morphometric microglial changes in the CeA
Representative confocal images of CeA microglia of sham and HF rats 16-weeks post-surgery are shownin Fig. 6a. In stark contrast to the PVN, except for a slight decrease in �lament length, we did not detectany signi�cant changes in microglia morphology 8 weeks after surgery, indicating that HF-induced NIdoes not affect the CeA at this point in time. However, some changes in microglial morphometricparameters emerged at 14 weeks, which continued to progress at week 16. We found a decrease in

Page 9/37
microglial surface area (2.4%, n.s. and 15.6%, p=0.001 at 14 and 16 weeks, respectively, one-way ANOVA,F=5.291, p=0.0012); an initial increase by 21.4%, p<0.0001 followed by a later decrease by 12.7%,p=0.0152 in microglial cell volume at 14 and 16 weeks, respectively, one-way ANOVA, F=15.65, p<0.0001;a progressive decrease in �lament length (12.0%, p=0.001, 10.2%, p=0.0299 and 28.3%, p<0.0001 at 8, 14and 16 weeks, respectively, one-way ANOVA, F=19.87, p<0.0001); a progressive reduction in the number ofdendritic branches (10.0%, p=0.0368 and 15.1%, p=0.0033 at 14 and 16 weeks, respectively, one-wayANOVA, F=6.8884, p=0.0001); a reduction in the number of dendritic segments (12.1%, p=0.0057 and18.5%, p=0.0001 at 14 and 16 weeks, respectively, one-way ANOVA, F=8.975, p<0.0001); a progressivereduction in the number of �lament terminals (15.3%, p=0.0002 and 21.0%, p<0.0001 at 14 and 16 weeks,respectively, one-way ANOVA, F=10.78, p<0.0001) and a progressive increase in IBA1 intensity (11.1%,p<0.0001 and 25.5%, p<0.001 at 14 and 16 weeks, respectively, one-way ANOVA, F=41.15, p<0.0001, Fig.6b, c). It is important to note that while we observed an initial increase of microglial cell volume at 14weeks-post surgery in CeA, at 16 weeks post-surgery the cell volume was drastically decreased comparedto the sham group. These �ndings suggest that during HF, microglia undergo cellular/somatic swellingprior to the retraction of processes and decrease in cellular volume. Taken together, these results indicatethat CeA microglia undergo drastic HF-induced morphometric changes, albeit with a delayed time coursecompared to PVN microglia. The complete overview of all individual values from all groups can be foundin Table 1.
HF-induced NI involves microglial derami�cation and somatic swelling in both PVN and CeA
As stated above, activated microglia have been demonstrated to undergo derami�cation, a process wheremicroglia retract their processes, lose dendritic complexity and release in�ammatory cytokines (42, 52).Thus, to further investigate microglial cell morphometric changes during HF in the PVN and CeA, weperformed a Sholl analysis of individually 3D-reconstructed microglial cells in each experimental group.To this end, we superimposed spheres of increasing radius (1 µm increase in radius per step, Fig. 7a)starting at the center of the soma, and measured the number of process intersections that each sphereencountered. We found that in the PVN (Fig. 7b) microglia displayed a signi�cant loss of complexity(indicated by a signi�cantly reduced average number of total Sholl intersections) that occurred in a time-dependent manner (Fig. 7b, 11.1%, p=0.0142, 17.1%, p<0.0001 and 30.8%, p<0.0001 at 8, 14, and 16weeks, respectively, one-way ANOVA, F = 32.07, p<0.0001), with changes being already detectable 8weeks post-surgery, and becoming progressively more derami�ed at 14- and 16-weeks post-surgery. In theCeA (Fig. 7c), we did not observe such changes at 8- or 14-weeks post-surgery. However, 16-weeks post-surgery, microglia in the CeA displayed signi�cant derami�cation (sham: 641.3 ± 34 vs. HF 16w: 534.7 ±25, p=0.0002, one-way ANOVA, F=8.366, p<0.0001). A recent two-dimensional high throughput study onmicroglia suggested that detailed morphometric analyses of microglia might be more informative andyielded valuable information leading the authors to coin the terms ‘low and high-activity’ microglia (53).In accordance with this newly proposed terminology, we classi�ed the different stages of microglia into‘low and high’ activity microglia. To quantify the degree of overall microglia activation, we �rst determinedthe peak number of Sholl intersections (i.e., the highest numeric value of a sphere intersecting with amicroglial process) per individual microglial cell, which in our entire sampled microglia cell population

Page 10/37
ranged from 0 to 64 (the higher the number, the more rami�ed the microglial structure). Using a semi-arbitrary and conservative threshold of <10 to categorize a microglial cell as active, we found 32.5%highly active microglia in the PVN (Fig. 7d) and 30.9% in the CeA (Fig.7e) of sham rats 14 weeks post-surgery In the HF rats, we found a signi�cant increase in the number of high activity microglia 8 weekspost-surgery in the PVN (HF 14w: 41.4% vs. sham: 32.5%, p=0.0125, one-way ANOVA, F=25.70, p<0.0001),but not the CeA (31.78%, n.s.). However, 14 weeks post-surgery we found a signi�cant increase in thenumber of activated microglia in the CeA (38.18%, p=0.0201, one-way ANOVA, F=12.12, p<0.0001), whilethe number of activated microglia in the PVN had further increased (55.9%, p=0.001). In the CeA, thepercentage of high activity microglia had further increased 16 weeks post-surgery (HF 16w: 44.0%,p=0.0163), which was not the case for the PVN (60.25%, n.s.).
Finally, we analyzed the Sholl distribution curves for sham and HF in the PVN and the CeA at 16-weekspost-surgery and also compared microglia between PVN and CeA in sham animals (Fig. 7f-h). We foundsigni�cant differences for both the PVN (two-way ANOVA, group: F (1, 62)=92.09, p<0.0001, Fig. 7f) andthe CeA (two-way ANOVA, group: F (1, 62)=86.93, p<0.0001, Fig. 7g). In the PVN the mean peak number ofSholl intersections was reached at 21 µm distance from the soma for both HF and sham animals, and themean number of intersections at the peak was signi�cantly different between those groups (sham: 18.5± 1.2 intersections vs. HF 16w: 10.2 ± 0.9 intersections, p<0.0001). In the CeA, this peak was reached at22 µm for the sham group and 21 µm for the HF group and was also signi�cantly differed between thetwo groups (sham: 21.9 ± 1.6 intersections vs. HF 16w: 13.9 ± 1.3 intersections, p<0.0001). Interestingly,under control conditions microglial cells in the CeA were signi�cantly more complex than in the PVN (two-way ANOVA, group: F (1, 62)=77.29, p<0.0001, Fig. 7h), highlighting the morphological heterogeneityamong microglia within different brain regions. These �ndings suggest that microglia in both PVN andCeA undergo drastic morphometric changes and derami�cation during HF.
A recent study highlighted that in addition to derami�cation, active microglia display somatic swelling(53), a process thought to coincide with the release of pro-in�ammatory cytokines, especially inneurodegeneration (54). Thus, to investigate whether HF-induced NI resulted in somatic microgliaswelling, we used our 3D pro�ler to calculate the somatic volume of individual microglial cells. We foundthat the average microglial soma volume of sham rats 14 weeks post-surgery was 554.3 ± 21 µm3 for thePVN and 529.0 ± 41 µm3 for the CeA (Fig. 8a-c). We found a time-dependent increase in somatic volumeof PVN microglia: 28.2%, p=0.0008 and 43.1%, p<0.0001 at 14 and 16 weeks, respectively, compared tothe respective sham group, one-way ANOVA, F=14.97, p<0.0001. In the CeA, we found even more drastictime-dependent increases in somatic volume: 41.3%, p<0.0001 and 51.2%, p<0.0001 at 14 and 16 weeks,respectively, compared to the respective sham group, one-way ANOVA, F=17.95, p<0.0001. We nextsought to investigate whether somatic swelling and microglial derami�cation were correlated processesor whether they occurred independently in separate microglial subpopulations. Therefore, we correlatedsoma volume and the total number of Sholl intersections for each microglial cell (Fig. 8d-g). We foundthat both in sham and HF rats, somatic swelling and derami�cation were highly correlated processes andthis held true for both PVN and CeA (p<0.0001 for all cases). Interestingly, we observed apparent

Page 11/37
decreases in the slope of the best-�t non-linear regression line (Fig. 8d-g, red lines) between sham and HFrats in both brain regions, which might be indicative of the less polarized (i.e., more homogenous)microglial cell population spectrum in HF rats, resulting from the shift towards a highly active microglialstage. It is important to note that although we found CeA microglia to have a smaller average somatathan PVN microglia in sham rats, they surpassed PVN microglia in soma volume at 14 weeks post-surgery. This �nding suggests that although somatic swelling and derami�cation are correlatedphenomena, somatic swelling might be initiated earlier and could potentially explain the initial increase intotal cell volume in CeA microglia at this time (Fig. 6b, cell volume, HF 14w).
HF induces a morphological A1 astrocyte phenotype in both PVN and CeA
During injury and disease, microglia and astrocytes display intricate interactions that may lead either toneuronal survival or neuronal loss. A recent study showed that activated microglia induce a neurotoxic‘A1’ subtype of astrocytes, secreting a currently unknown neurotoxin that results in neuronal cell death(48). A1 astrocytes can be discriminated from the neuroprotective A2 astrocytes not only by theupregulation of genetic markers (47-49, 55), but also by distinct morphological changes, which appear tobe similar to those of microglia during NI (56). While retraction of astrocytic processes, hypertrophy andgliosis has been described for astrocytes under various conditions (57), no study – to the best of ourknowledge – comprehensively addressed alterations in astrocyte morphology during chronic NI using athree-dimensional reconstruction pro�ler. Given that NI-induced changes in astrocytes seem to generallyfollow those observed in microglia (47, 48), we chose to investigate astrocytic changes at 14 weeks post-surgery.
To investigate whether HF-induced NI would result in the induction of the A1 astrocytic phenotype, we �rstperformed conventional 2D z-stack analysis of glial �brillary acidic protein (GFAP) immunoreactivity inFIJI, but found no differences in either GFAP signal intensity or density (Fig. 9a, b). Next, we performed 3DIMARIS analysis of astrocytes (Fig. 9c) that were immunohistochemically identi�ed by their expression ofboth GFAP and glutamine synthetase (GluSyn) (Fig. 9d, g). We speci�cally chose a combination of thesetwo markers because they allowed us to perform a detailed analysis of astrocytic somata and processes,given that GFAP stains mostly processes, but not the soma, while GluSyn predominantly stains theastrocyte soma, but not processes (see Fig. 9l). In HF rats, we found drastic morphological changes inboth PVN and CeA astrocytes 14 weeks post-surgery (n=4 rats/group) that included a decrease in surfacearea (17.2%, p=0.0009 and 19.1%, p=0.0014, for PVN and CeA, respectively), cell volume (24.4%,p=0.0003 and 23.2%, p=0.0004, for PVN and CeA, respectively), �lament length (19.4%, p=0.0009 and24.6%, p=0.0001, for PVN and CeA, respectively) and an increase in soma volume (30.8%, p<0.0001 and18.8%, p=0.01, for PVN and CeA, respectively, Fig. 9e, h). In addition, the Sholl distribution analysisrevealed signi�cant changes in astrocyte complexity 14-weeks post-surgery for both the PVN (two-wayANOVA, group: F (1, 81)=76.37, p<0.0001, Fig. 9f) and CeA (two-way ANOVA, group: F (1, 62)=71.26,p<0.0001, Fig. 9i). Furthermore, we found astrocytes in both the PVN and the CeA of HF rats displayed asigni�cant loss of process complexity, as shown by a signi�cant decrease in the total number of Shollintersections per astrocyte both in the PVN (18.0%) and the CeA (27.8%, p<0.0001 in both cases, Fig. 9j,

Page 12/37
k). Fig. 9l shows an isolated PVN astrocyte of a HF rat and subsequent surface reconstruction viaIMARIS.
HF induces expression of genes associated with neuroin�ammation and A1 astrocyte phenotype in bothPVN and CeA
To determine whether the microglial/astrocyte morphometric changes observed in HF rats alsocorresponded with a genetic pro�le associated to NI and/or a shift to an A1 astrocyte phenotype, weperformed qPCR of mRNA transcripts of various genes classically associated to NI, as well as several A2and A1 astrocyte-related genes. We analyzed mRNA levels of IBA1 and GFAP, cytokines (TNF-a, IL-1b andIL-6), A1 astrocyte markers (Serping1 and C3) and A2 astrocyte markers (Tm4sf1 and Sphk1) inmicropunches obtained from the PVN and CeA of sham and HF rats at the same time points (8w and14w) at which the morphometric studies were performed.
In the PVN, we found signi�cant changes in tested genes already at 8 weeks post-surgery (n=5 per group,pooled): an increase in IBA1 (1.344-fold, p=0.0006), cytokines (IL-1b: 3.51-fold, p=0.0163; IL-6: 1.522-fold,p=0.0067 and TNF-a: 3.117-fold, p=0.0016) and A1 astrocyte markers (Serping1: 2.767-fold, p=0.017 andC3: 1.127-fold, p=0.0323) as well as a signi�cant decrease in GFAP (-1.583-fold, p=0.0006) and A2astrocyte markers (Tm4sf1: -1.373-fold, p=0.0005 and Sphk1: -1.17-fold, p=0.0005, Fig. 10a). When weanalyzed the genes again 14 weeks post-surgery (Fig. 10b) (n=4/group, pooled), the qPCR of PVN tissueyielded comparable results: IBA1: 1.683-fold, p=0.0089; GFAP: -1.563, p=0.0006; IL-1b: 3.533-fold,p=0.0134; IL-6: 1.62-fold, p=0.0045; TNF-a: 2.433-fold, p=0.0344; Serping1: 4.2-fold, p=0.0042; C3: 1.387-fold, p=0.0237; Tm4sf1: -1.897, p<0.0001, Sphk1: -1.333, p=0.0012).
In the CeA we found only GFAP (-1.249-fold, p=0.0004), IL-1b (2.383-fold, p=0.0291) and TNF-a (2.367-fold, p=0.004) to be signi�cantly altered 8 weeks post-surgery (Fig. 10c). However, 14 weeks post-surgery(Fig. 10d) we found signi�cant differences in all tested genes, which were comparable to those observedin the PVN: IBA1 (1.433-fold, p=0.0039), GFAP (-1.323-fold, p=0.0002), IL-1b (2.893-fold, p=0.0066), IL-6(1.757-fold, p=0.0035), TNF-a (2.72-fold, p<0.0001), Serping1 (5.033-fold, p=0.0009), C3 (1.243-fold,p=0.0404), Tm4sf1 (-1.738-fold, p=0.0004) and Sphk1 (-1.57-fold, p=0.0009). We did not observesigni�cant changes either at 8 weeks or 14 weeks post-surgery in the prelimbic cortex (PLC, Fig. 10e, f),suggesting that cortical areas might not be affected by HF-induced NI at this point in time.
DiscussionHeart failure-induced NI and its physiological and behavioral correlates
CVDs including stroke and HF are the leading cause of deaths worldwide, and affected individuals sufferfrom severe physiological and psychological impairments (1). While compounds like angiotensinconverting enzyme inhibitors, angiotensin receptor blockers, mineralocorticoid receptor antagonists or b-blockers have been successfully used to treat the physiological symptoms of HF patients with reduced EF(58), little to no treatment is available for HF-induced mood and anxiety disorders. In fact, recent studies

Page 13/37
suggest that the classical use of selective serotonin reuptake inhibitors (SSRIs) may not be an e�cientway to relieve depression symptoms in HF patients (59, 60). Importantly, NI and oxidative stress in thePVN and the rostro-lateral medulla have been reported in rats with HF and neurogenic hypertension (25,61, 62). It is well-established that in�ammation and activation of the renin-angiotensin system (RAS)drastically increases sympathetic drive, thereby creating a vicious circle with debilitating effects onaffected individuals (63). Moreover, intracerebroventricular infusions of minocycline, an anti-in�ammatory antibiotic that inhibits microglia cell activation, resulted in signi�cant attenuation of meanarterial pressure and cardiac hypertrophy (61). These changes were accompanied by a reduction in thetotal number of activated microglia as well as reduced mRNA levels for IL-1b, IL-6 and TNF-a (61). Takentogether, these previous studies pinpoint NI, particularly microglial cell activation within the PVN, as a keyunderlying pathophysiological mechanism contributing to the sympathohumoral and cardiovascularcomplications associated with HF (23-26). Given that the PVN is a key regulatory structure involved inthe integration of behavioral, cardiovascular and neuroendocrine homeostatic responses (64-66), and isrichly interconnected with a plethora of brain regions (32, 67-69), including the amygdala, it is reasonableto speculate that NI could also contribute to mood and anxiety disorders associated to HF. In fact, PVN-amygdala connectivity is well-established (32, 67-69) and the release of various PVN-synthesizedneuropeptides within the amygdala has been shown to directly modulate aggression, fear and depression(37, 38, 70). However, to the best of our knowledge, no previous study demonstrated that HF-induced NIwithin the CeA results in a drastic shift from a low to a high activity state of the microglial cell population.
Microglia cell activation in the paraventricular nucleus and central amygdala in heart failure rats
Microglia, the resident immune cells of the brain parenchyma are among the �rst responding cells duringinjury, cell death or unwanted intruders that might access the brain due to a compromised blood-brain-barrier (40, 42, 43, 52, 71). Microglia represent a major component in the immune response andparticipate in the neuroin�ammatory response largely via the release pro-in�ammatory cytokines (42, 52).During NI, microglia undergo an astonishing morphological transition from a highly rami�ed to aderami�ed state, retracting their �ne processes and experiencing an overall reduction in cell volume (42,43, 72). Although it seems evident that a comprehensive knowledge of microglial derami�cation is ofparamount importance, very little is known about the precise series of events that ultimately lead toderami�cation, highlighting the need for tools that allow a detailed morphometric analysis of microglialremodeling. While other laboratories employed comparable approaches for the reconstruction ofmicroglia under various conditions using different software (73-75), these approaches are very time-consuming (80 minutes or more per z-stack), and could result in in over- and/or undersampling giventhat fused (microglia recognized as one entity by the software) or cut microglia (somata or processes cutby either the x,y or z axis) are included in the analysis. These limitations are largely overcome by our glialpro�ler based on the IMARIS software which allows for an unbiased, rapid, and fully automatedreconstruction and morphometric analysis of individually identi�ed microglial cell. Moreover, our pro�leridenti�es and either separates or eliminates incomplete or fused microglial pro�les. While this is not the�rst study to implement IMARIS analysis for three-dimensional reconstruction of microglia (76, 77), ourin-depth analysis of activated microglia and their morphometric transition from low an activity to a high

Page 14/37
activity state in the context of the progression of a disease model represents, to the best of ourknowledge, an unprecedented approach. To speci�cally probe for HF-induced NI, we stained brain sliceswith IBA1 and used our newly developed 3D pro�ler as a comprehensive tool for the assessment ofmicroglial structural remodeling in a well-established experimental model of HF. Morphometric analysisof microglia is superior to classical IHC-based quanti�cation, as it not only provides information aboutoverall microglia-related immunoreactivity density and intensity, but also provides insights into a varietyof speci�c morphological changes within individually identi�ed microglial cell, such as somatic swellingand process remodeling (53). With our 3D pro�ler, we were able to detect drastic time-dependentmicroglia morphological changes in HF rats including �lament shortening, derami�cation and somaticswelling in both PVN and CeA. These changes are widely accepted as indicators of microglial cellactivation (42, 43, 52, 53, 73). Importantly, a conventional 2D analysis of IBA1-stained microglia failed to�nd signi�cant differences in microglia morphology further supporting the higher sensitivity andprecision of this novel approach. We found that both in PVN and CeA, microglial cell remodelingworsened over time (Figs. 4, 6), which is highlighted in part by a progressive increase in the number ofactivated microglia (Fig. 7) and a shift of the microglial population towards a highly derami�ed microglialphenotype. Although the retraction of microglial processes and somatic swelling were highly correlated(Fig. 8), we found an initial increase in total cell volume in the CeA (14w, Fig. 6) suggesting that somaticswelling might precede the derami�cation. Our data also suggest that HF-induced microglial cell changeswere not representative of a diffused NI phenomenon globally affecting the brain, given that non-relatedregions, such as S1BF and the PLC (Fig. 5, 10) were not affected, at least at this time point of the disease.Finally, it is important to note that we found signi�cant differences in cell volume, surface area and IBA1intensity when we compared microglial cells between the PVN and the CeA in sham rats (Fig. 7). Theseresults are in line with previous studies performed both in rodents and humans supporting a high degreeof variability of microglial phenotypes that might depend on age, brain region and pathophysiologicalcondition (43, 78, 79).
Region-speci�c differences and time-dependency of heart failure-induced neuroin�ammation
We found that microglial cell remodeling in the PVN is present already at 8w post-surgery, while microglialchanges in the CeA started to unfold around the 14-week mark. While our study demonstrated for the �rstHF-induced microglial cell remodeling in the CeA, a major �nding was that these changes occurred in adelayed manner compared to the PVN. These time-dependent microglial structural changes wereconsistent, and correlated as well with qPCR analysis of pro-in�ammatory markers, such as TNF-a, IL-1band IL-6, which in the PVN were already drastically elevated at 8w, while in the CeA most markers becamesigni�cantly elevated at 14w post-surgery. These results further support the previously establishedrelationship between microglial cell morphological changes with the release of proin�ammatorycytokines (42, 43).
As stated above, a large body of evidence supports a key role for the PVN in the onset and maintenanceof cardiovascular dysregulation in HF (11, 18-22). Thus, the time-dependent differences in microglial cellactivation and pro-in�ammatory markers between the PVN and the amygdala are in line with the fact

Page 15/37
sympathohumoral and cardiovascular manifestations in HF precede the mood and cognitive de�citsassociated with this disease (58, 80, 81). HF-induced cognitive impairments in both rats and mice havebeen extensively studied (82, 83) and while it is well established that the PVN is a main neuronalsubstrate contributing to mood regulation, our studies provide an indirect evidence that NI within theamygdala may constitute a neuronal substrate contributing to HF-induced mood de�cits. A recent studyshowed that the microglia inhibitor minocycline improved depression-like behavior in HF rats (84).However, the authors performed oral delivery of minocycline so that the precise site of action within thebrain underlying the improvement of the depression-like behavior could not to be determined. Moreover,anti-in�ammatory compounds showed good clinical e�cacies in attenuating levels of TNF-a and IL-1band improving disease outcome of various neuropathologies, psychiatric disorders, including Alzheimer’sdisease (85-87). Still, further studies are clearly necessary to demonstrate that NI within the CeAcontributes to HF-induced depression-like behavioral changes. The mechanisms underlying the timecourse differences between the HF-induced NI in PVN and CeA could be manifold and not mutuallyexclusive. Based on the tightly coupled interaction between the PVN and the amygdala (32, 67-69), NI inthe amygdala could be triggered by the exaggerated neuronal activity in the PVN reported in HF (21, 22,88, 89). This is in line with previous studies showing that aberrant neuronal activity could result in therelease of damage-associated molecules, leading to microglia activation (90, 91). Recent studies alsosupport the ability of in�ammatory cytokines to diffuse in the extracellular space (92-94). Thus, the delayfor NI onset in the amygdala could be due to the slow lateral diffusion of cytokines initially originating inthe PVN. Finally, the delay may also be due to differential responsiveness of PVN and amygdalamicroglial cell populations to the same noxious stimulus (i.e. HF-associated hypoxia) and/or differencesin blood-brain-barrier integrity, between the PVN and CeA during disease states, which could result inregion-speci�c permeability differences, as we recently showed to be the case during hypertension (95).Clearly, future studies are warranted to address the precise mechanisms underlying the differential andregion-speci�c time course of microglia cell activation during HF.
Morphological changes in PVN and CeA astrocytes and shift towards A1 phenotype
The intricate interaction between microglia and astrocytes during NI is well-established (56, 96, 97).Microglial cells release various pro-in�ammatory molecules upon injury (98) or as a result of the generalimmune response (99), which in turn triggers speci�c astrocytic responses. Astrocytes can releaseorosomucoid-2 to inhibit microglial activation, block the chemokine receptor type 5 of the microglialmembrane, downregulate the in�ammatory response or further promote neuroin�ammation andneurodegeneration (97). This bidirectional interaction allows an e�cient and tailored response to variouspotentially harmful threats that the brain might be exposed to. Recent studies suggested theclassi�cation of astrocytes into two categories: A1 (pro-in�ammatory, neurotoxic) and A2 (anti-in�ammatory, neuroprotective) astrocytes (47-49). During the transition from the A2 to A1 phenotype,astrocytes are thought to undergo morphometric changes comparable to those observed in microglia.Based on this, we applied a 3D morphometric analysis in analogy to our microglial analysis to the studyof astrocytes in the PVN and CeA of HF rats. Similar to what we found with microglial cells, while aconventional 2D analysis of GFAP immunoreactivity failed to demonstrate any changes in PVN

Page 16/37
astrocytes of HF rats, our results with the 3D pro�ler demonstrated signi�cant morphological changes inboth PVN and CeA astrocytes during HF. Importantly, these morphometric changes were accompanied bythe upregulation of A1-speci�c (Serping1, C3) and downregulation of A2-speci�c (Tm4sf1 and Sphk1)astrocyte markers. Taken together, these results indicate that HF promotes a shift in astrocyte phenotypefrom A2 to A1 both in the PVN and CeA, contributing thus along microglial cells to the overall NI state inthis disease. It is important to note that while we analyzed changes in astrocyte morphology only at 14weeks post-surgery, the time differences in the A1/A2 mRNA markers also support a time-dependentdifference between PVN and CeA in astrocyte changes that coincides with the time course of microgliachanges. Interestingly, we found a signi�cantly decreased GFAP mRNA levels in HF rats of both PVN andCeA. While these �ndings might seem contrary to the general notion that GFAP protein levels areincreased in A1 astrocytes, recent studies suggest that GFAP might not be the best marker for astrocytereactivity (47) and highlight that the relationship between reactive astrocytes and GFAP levels might havebeen oversimpli�ed (100). Taken together, our �ndings suggest that HF-induced NI not only alters themicroglial environment in affected brain regions, but rather has far-reaching consequences affectingastrocytes and potentially even neurons due to astrocyte-induced neurotoxicity (47, 48). Additionalstudies are needed to determine whether the HF-induced A1 astrocyte phenotype in the CeA becomesneurotoxic and if so, what subpopulation of CeA neurons might be affected
ConclusionIn summary, in the present study we implemented a novel and improved morphometric imaging approachto assess precise microglial and astrocyte structural remodeling in different brain regions during theprogression of heart failure. We provide evidence that in addition to the previously described NI observedin the hypothalamic PVN, known to be implicated in sympathohumoral activation during this disease,microglia and astrocytes within the central amygdala (CeA) also undergo drastic structural remodeling.These structural changes are indicative of glial shift towards an activated and neurotoxic phenotyperespectively, a �nding supported also by an increased expression of pro-in�ammatory cytokines.Importantly, our results show that NI in the CeA manifested with a delayed time course with respect to thePVN. Taken together, our studies support the idea that NI in the amygdala may contribute to emotionaland cognitive de�cits commonly observed at later stages during the course of HF, standing thus as apotential novel target for alleviating comorbid mood disorders in this prevalent disease (2, 4, 101).
AbbreviationsC3 – Complement component 3, CeA – Central amygdala, CeL – Lateral subdivision of the centralamygdala, CVDs – Cardiovascular diseases, GFAP – Glial �brillary acidic protein, GluSyn – GlutamineSynthetase, HF – heart failure, IL – Interleukin, MI – Myocardial infarction, NI – Neuroin�ammation, OT –Oxytocin, PLC – Prelimbic cortex, Serping1 – C1-inhibitor gene, Sphk1 – Sphingosine kinase 1, SSRIs –Selective serotonin reuptake inhibitors, Tm4sf1 – Transmembrane 4 L6 family member 1, TNF-a - Tumornecrosis factor a.

Page 17/37
DeclarationsAcknowledgements
We thank Atit Patel and Dr. Daniel Cox for their assistance with the qPCR. We also thank Dr. Anne Murphyfor kindly providing the GFAP antibody.
Authors’ contributions
FA performed immunohistochemistry, IMARIS reconstruction, analyzed the data and wrote themanuscript; FA and HCFN performed qPCR; HCFN and RKR performed the coronary artery ligation surgeryand echocardiographic assessment of EF; MR developed the IMARIS microglial pro�ler; JES supervisedthe experiments, designed the study and edited the manuscript. All authors critically reviewed themanuscript and approved the �nal version for publication.
Funding
This work was supported by DFG Postdoc Fellowship AL 2466/1-1 to FA; National Heart, Lung, and BloodInstitute Grant NIH HL090948, and funding provided by the Center for Neuroin�ammation andCardiometabolic Diseases (CNCD).
Availability of data and materials
The datasets used and/or analyzed in the current study are available from the corresponding author uponreasonable request.
Ethics approval and consent to participate
All experiments were performed following the approval of the Ethics Committee for Animal Experimentsat Georgia State University (IACUC protocol # A18003). All efforts were made to minimize the suffering ofthe animals and reduce their total number.
Consent for publication
Not applicable.
Competing interests
The author declare that they have no competing interests.
References1. Group WCRCW. World Health Organization cardiovascular disease risk charts: revised models to
estimate risk in 21 global regions. Lancet Glob Health. 2019;7(10):e1332-e45.

Page 18/37
2. Mbakwem A, Aina F, Amadi C. Expert Opinion-Depression in Patients with Heart Failure: Is EnoughBeing Done? Card Fail Rev. 2016;2(2):110-2.
3. Parissis JT, Fountoulaki K, Paraskevaidis I, Kremastinos D. Depression in chronic heart failure: novelpathophysiological mechanisms and therapeutic approaches. Expert Opin Investig Drugs.2005;14(5):567-77.
4. Rustad JK, Stern TA, Hebert KA, Musselman DL. Diagnosis and treatment of depression in patientswith congestive heart failure: a review of the literature. Prim Care Companion CNS Disord.2013;15(4).
5. Konstam V, Moser DK, De Jong MJ. Depression and anxiety in heart failure. J Card Fail.2005;11(6):455-63.
�. Rutledge T, Reis VA, Linke SE, Greenberg BH, Mills PJ. Depression in heart failure a meta-analyticreview of prevalence, intervention effects, and associations with clinical outcomes. J Am CollCardiol. 2006;48(8):1527-37.
7. Hammond CA, Blades NJ, Chaudhry SI, Dodson JA, Longstreth WT, Jr., Heckbert SR, et al. Long-TermCognitive Decline After Newly Diagnosed Heart Failure: Longitudinal Analysis in the CHS(Cardiovascular Health Study). Circ Heart Fail. 2018;11(3):e004476.
�. Frey A, Popp S, Post A, Langer S, Lehmann M, Hofmann U, et al. Experimental heart failure causesdepression-like behavior together with differential regulation of in�ammatory and structural genes inthe brain. Front Behav Neurosci. 2014;8:376.
9. Prickaerts J, Raaijmakers W, Blokland A. Effects of myocardial infarction and captopril therapy onanxiety-related behaviors in the rat. Physiol Behav. 1996;60(1):43-50.
10. Schoemaker RG, Smits JF. Behavioral changes following chronic myocardial infarction in rats.Physiol Behav. 1994;56(3):585-9.
11. Benarroch EE. Paraventricular nucleus, stress response, and cardiovascular disease. Clin Auton Res.2005;15(4):254-63.
12. Coote JH, Yang Z, Pyner S, Deering J. Control of sympathetic out�ows by the hypothalamicparaventricular nucleus. Clin Exp Pharmacol Physiol. 1998;25(6):461-3.
13. Kannan H, Yamashita H. Electrophysiological study of paraventricular nucleus neurons projecting tothe dorsomedial medulla and their response to baroreceptor stimulation in rats. Brain Res.1983;279(1-2):31-40.
14. Ranson RN, Motawei K, Pyner S, Coote JH. The paraventricular nucleus of the hypothalamus sendsefferents to the spinal cord of the rat that closely appose sympathetic preganglionic neuronesprojecting to the stellate ganglion. Exp Brain Res. 1998;120(2):164-72.
15. Althammer F, Grinevich V. Diversity of oxytocin neurons: beyond magno- and parvocellular cell types?J Neuroendocrinol. 2017.
1�. Stern JE. Neuroendocrine-autonomic integration in the paraventricular nucleus: novel roles fordendritically released neuropeptides. J Neuroendocrinol. 2015;27(6):487-97.

Page 19/37
17. Atasoy D, Betley JN, Su HH, Sternson SM. Deconstruction of a neural circuit for hunger. Nature.2012;488(7410):172-7.
1�. Patel KP. Role of paraventricular nucleus in mediating sympathetic out�ow in heart failure. Heart FailRev. 2000;5(1):73-86.
19. Pyner S. The paraventricular nucleus and heart failure. Exp Physiol. 2014;99(2):332-9.
20. Ramchandra R, Hood SG, Frithiof R, McKinley MJ, May CN. The role of the paraventricular nucleus ofthe hypothalamus in the regulation of cardiac and renal sympathetic nerve activity in consciousnormal and heart failure sheep. J Physiol. 2013;591(1):93-107.
21. Biancardi VC, Son SJ, Sonner PM, Zheng H, Patel KP, Stern JE. Contribution of central nervoussystem endothelial nitric oxide synthase to neurohumoral activation in heart failure rats.Hypertension. 2011;58(3):454-63.
22. Potapenko ES, Biancardi VC, Florschutz RM, Ryu PD, Stern JE. Inhibitory-excitatory synaptic balanceis shifted toward increased excitation in magnocellular neurosecretory cells of heart failure rats. JNeurophysiol. 2011;106(3):1545-57.
23. Najjar F, Ahmad M, Lagace D, Leenen FHH. Sex differences in depression-like behavior andneuroin�ammation in rats post-MI: role of estrogens. Am J Physiol Heart Circ Physiol.2018;315(5):H1159-H73.
24. Najjar F, Ahmad M, Lagace D, Leenen FHH. Role of Myocardial Infarction-Induced Neuroin�ammationfor Depression-Like Behavior and Heart Failure in Ovariectomized Female Rats. Neuroscience.2019;415:201-14.
25. Kang YM, Ma Y, Elks C, Zheng JP, Yang ZM, Francis J. Cross-talk between cytokines and renin-angiotensin in hypothalamic paraventricular nucleus in heart failure: role of nuclear factor-kappaB.Cardiovasc Res. 2008;79(4):671-8.
2�. Yu Y, Wei SG, Weiss RM, Felder RB. Angiotensin II Type 1a Receptors in the Subfornical OrganModulate Neuroin�ammation in the Hypothalamic Paraventricular Nucleus in Heart Failure Rats.Neuroscience. 2018;381:46-58.
27. Wotjak CT, Kubota M, Liebsch G, Montkowski A, Holsboer F, Neumann I, et al. Release of vasopressinwithin the rat paraventricular nucleus in response to emotional stress: a novel mechanism ofregulating adrenocorticotropic hormone secretion? J Neurosci. 1996;16(23):7725-32.
2�. Herman JP, Tasker JG. Paraventricular Hypothalamic Mechanisms of Chronic Stress Adaptation.Front Endocrinol (Lausanne). 2016;7:137.
29. Myers B, McKlveen JM, Herman JP. Glucocorticoid actions on synapses, circuits, and behavior:implications for the energetics of stress. Front Neuroendocrinol. 2014;35(2):180-96.
30. Townsend JD, Eberhart NK, Bookheimer SY, Eisenberger NI, Foland-Ross LC, Cook IA, et al. fMRIactivation in the amygdala and the orbitofrontal cortex in unmedicated subjects with majordepressive disorder. Psychiatry Res. 2010;183(3):209-17.
31. Young KD, Siegle GJ, Zotev V, Phillips R, Misaki M, Yuan H, et al. Randomized Clinical Trial of Real-Time fMRI Amygdala Neurofeedback for Major Depressive Disorder: Effects on Symptoms and

Page 20/37
Autobiographical Memory Recall. Am J Psychiatry. 2017;174(8):748-55.
32. LeDoux J. The amygdala. Curr Biol. 2007;17(20):R868-74.
33. LeDoux J. The emotional brain, fear, and the amygdala. Cell Mol Neurobiol. 2003;23(4-5):727-38.
34. LeDoux JE. Emotion circuits in the brain. Annu Rev Neurosci. 2000;23:155-84.
35. Sobota R, Mihara T, Forrest A, Featherstone RE, Siegel SJ. Oxytocin reduces amygdala activity,increases social interactions, and reduces anxiety-like behavior irrespective of NMDAR antagonism.Behav Neurosci. 2015;129(4):389-98.
3�. Labuschagne I, Phan KL, Wood A, Angstadt M, Chua P, Heinrichs M, et al. Oxytocin attenuatesamygdala reactivity to fear in generalized social anxiety disorder. Neuropsychopharmacology.2010;35(12):2403-13.
37. Hasan MT, Althammer F, Silva da Gouveia M, Goyon S, Eliava M, Lefevre A, et al. A Fear MemoryEngram and Its Plasticity in the Hypothalamic Oxytocin System. Neuron. 2019;103(1):133-46 e8.
3�. Knobloch HS, Charlet A, Hoffmann LC, Eliava M, Khrulev S, Cetin AH, et al. Evoked axonal oxytocinrelease in the central amygdala attenuates fear response. Neuron. 2012;73(3):553-66.
39. Han RT, Kim YB, Park EH, Kim JY, Ryu C, Kim HY, et al. Long-Term Isolation Elicits Depression andAnxiety-Related Behaviors by Reducing Oxytocin-Induced GABAergic Transmission in CentralAmygdala. Front Mol Neurosci. 2018;11:246.
40. Nimmerjahn A, Kirchhoff F, Helmchen F. Resting microglial cells are highly dynamic surveillants ofbrain parenchyma in vivo. Science. 2005;308(5726):1314-8.
41. Raivich G. Like cops on the beat: the active role of resting microglia. Trends Neurosci.2005;28(11):571-3.
42. Prinz M, Jung S, Priller J. Microglia Biology: One Century of Evolving Concepts. Cell.2019;179(2):292-311.
43. Prinz M, Priller J. Microglia and brain macrophages in the molecular age: from origin toneuropsychiatric disease. Nat Rev Neurosci. 2014;15(5):300-12.
44. Morrison HW, Filosa JA. A quantitative spatiotemporal analysis of microglia morphology duringischemic stroke and reperfusion. J Neuroin�ammation. 2013;10:4.
45. Stratoulias V, Venero JL, Tremblay ME, Joseph B. Microglial subtypes: diversity within the microglialcommunity. EMBO J. 2019;38(17):e101997.
4�. Colombo E, Farina C. Astrocytes: Key Regulators of Neuroin�ammation. Trends Immunol.2016;37(9):608-20.
47. Liddelow SA, Barres BA. Reactive Astrocytes: Production, Function, and Therapeutic Potential.Immunity. 2017;46(6):957-67.
4�. Liddelow SA, Guttenplan KA, Clarke LE, Bennett FC, Bohlen CJ, Schirmer L, et al. Neurotoxic reactiveastrocytes are induced by activated microglia. Nature. 2017;541(7638):481-7.
49. Clarke LE, Liddelow SA, Chakraborty C, Munch AE, Heiman M, Barres BA. Normal aging induces A1-like astrocyte reactivity. Proc Natl Acad Sci U S A. 2018;115(8):E1896-E905.

Page 21/37
50. Tassoni A, Farkhondeh V, Itoh Y, Itoh N, Sofroniew MV, Voskuhl RR. The astrocyte transcriptome inEAE optic neuritis shows complement activation and reveals a sex difference in astrocytic C3expression. Sci Rep. 2019;9(1):10010.
51. Zamanian JL, Xu L, Foo LC, Nouri N, Zhou L, Giffard RG, et al. Genomic analysis of reactiveastrogliosis. J Neurosci. 2012;32(18):6391-410.
52. Butovsky O, Weiner HL. Microglial signatures and their role in health and disease. Nat Rev Neurosci.2018;19(10):622-35.
53. Davis BM, Salinas-Navarro M, Cordeiro MF, Moons L, De Groef L. Characterizing microglia activation:a spatial statistics approach to maximize information extraction. Sci Rep. 2017;7(1):1576.
54. Hickman S, Izzy S, Sen P, Morsett L, El Khoury J. Microglia in neurodegeneration. Nat Neurosci.2018;21(10):1359-69.
55. Neal M, Luo J, Harischandra DS, Gordon R, Sarkar S, Jin H, et al. Prokineticin-2 promotes chemotaxisand alternative A2 reactivity of astrocytes. Glia. 2018;66(10):2137-57.
5�. Burda JE, Sofroniew MV. Seducing astrocytes to the dark side. Cell Res. 2017;27(6):726-7.
57. Li T, Chen X, Zhang C, Zhang Y, Yao W. An update on reactive astrocytes in chronic pain. JNeuroin�ammation. 2019;16(1):140.
5�. Metra M, Teerlink JR. Heart failure. Lancet. 2017;390(10106):1981-95.
59. Rajeswaran T, Plymen CM, Doherty AM. The effect of antidepressant medications in themanagement of heart failure on outcomes: mortality, cardiovascular function and depression - asystematic review. Int J Psychiatry Clin Pract. 2018;22(3):164-9.
�0. Ricco J, Benson J, Prasad S. PURLs: SSRIs for depression/heart failure patients? Not so fast. J FamPract. 2017;66(9):564-7.
�1. Shi P, Diez-Freire C, Jun JY, Qi Y, Katovich MJ, Li Q, et al. Brain microglial cytokines in neurogenichypertension. Hypertension. 2010;56(2):297-303.
�2. Wu KL, Chan SH, Chan JY. Neuroin�ammation and oxidative stress in rostral ventrolateral medullacontribute to neurogenic hypertension induced by systemic in�ammation. J Neuroin�ammation.2012;9:212.
�3. Diaz HS, Toledo C, Andrade DC, Marcus NJ, Rio RD. Neuroin�ammation in heart failure: NEW insightsfor an old disease. J Physiol. 2019.
�4. Swanson LW, Kuypers HG. The paraventricular nucleus of the hypothalamus: cytoarchitectonicsubdivisions and organization of projections to the pituitary, dorsal vagal complex, and spinal cordas demonstrated by retrograde �uorescence double-labeling methods. J Comp Neurol.1980;194(3):555-70.
�5. Swanson LW, Sawchenko PE. Paraventricular nucleus: a site for the integration of neuroendocrineand autonomic mechanisms. Neuroendocrinology. 1980;31(6):410-7.
��. Guyenet PG. The sympathetic control of blood pressure. Nat Rev Neurosci. 2006;7(5):335-46.

Page 22/37
�7. Kim TK, Han PL. Functional Connectivity of Basolateral Amygdala Neurons Carrying OrexinReceptors and Melanin-concentrating Hormone Receptors in Regulating Sociability and Mood-relatedBehaviors. Exp Neurobiol. 2016;25(6):307-17.
��. Pittman QJ, Blume HW, Renaud LP. Connections of the hypothalamic paraventricular nucleus withthe neurohypophysis, median eminence, amygdala, lateral septum and midbrain periaqueductalgray: an electrophysiological study in the rat. Brain Res. 1981;215(1-2):15-28.
�9. Huber D, Veinante P, Stoop R. Vasopressin and oxytocin excite distinct neuronal populations in thecentral amygdala. Science. 2005;308(5719):245-8.
70. Bosch OJ, Neumann ID. Both oxytocin and vasopressin are mediators of maternal care andaggression in rodents: from central release to sites of action. Horm Behav. 2012;61(3):293-303.
71. Thurgur H, Pinteaux E. Microglia in the Neurovascular Unit: Blood-Brain Barrier-microglia InteractionsAfter Central Nervous System Disorders. Neuroscience. 2019;405:55-67.
72. Lannes N, Eppler E, Etemad S, Yotovski P, Filgueira L. Microglia at center stage: a comprehensivereview about the versatile and unique residential macrophages of the central nervous system.Oncotarget. 2017;8(69):114393-413.
73. Heindl S, Gesierich B, Benakis C, Llovera G, Duering M, Liesz A. Automated Morphological Analysis ofMicroglia After Stroke. Front Cell Neurosci. 2018;12:106.
74. Xu H, Gelyana E, Rajsombath M, Yang T, Li S, Selkoe D. Environmental Enrichment Potently PreventsMicroglia-Mediated Neuroin�ammation by Human Amyloid beta-Protein Oligomers. J Neurosci.2016;36(35):9041-56.
75. Karperien A, Ahammer H, Jelinek HF. Quantitating the subtleties of microglial morphology withfractal analysis. Front Cell Neurosci. 2013;7:3.
7�. Erny D, Hrabe de Angelis AL, Jaitin D, Wieghofer P, Staszewski O, David E, et al. Host microbiotaconstantly control maturation and function of microglia in the CNS. Nat Neurosci. 2015;18(7):965-77.
77. VanRyzin JW, Marquardt AE, Argue KJ, Vecchiarelli HA, Ashton SE, Arambula SE, et al. MicroglialPhagocytosis of Newborn Cells Is Induced by Endocannabinoids and Sculpts Sex Differences inJuvenile Rat Social Play. Neuron. 2019;102(2):435-49 e6.
7�. Dubbelaar ML, Kracht L, Eggen BJL, Boddeke E. The Kaleidoscope of Microglial Phenotypes. FrontImmunol. 2018;9:1753.
79. Bottcher C, Schlickeiser S, Sneeboer MAM, Kunkel D, Knop A, Paza E, et al. Human microglia regionalheterogeneity and phenotypes determined by multiplexed single-cell mass cytometry. Nat Neurosci.2019;22(1):78-90.
�0. Leto L, Feola M. Cognitive impairment in heart failure patients. J Geriatr Cardiol. 2014;11(4):316-28.
�1. Celutkiene J, Vaitkevicius A, Jakstiene S, Jatuzis D. Expert Opinion-Cognitive Decline in Heart Failure:More Attention is Needed. Card Fail Rev. 2016;2(2):106-9.

Page 23/37
�2. Toledo C, Lucero C, Andrade DC, Diaz HS, Schwarz KG, Pereyra KV, et al. Cognitive impairment inheart failure is associated with altered Wnt signaling in the hippocampus. Aging (Albany NY).2019;11(16):5924-42.
�3. Hay M, Vanderah TW, Samareh-Jahani F, Constantopoulos E, Uprety AR, Barnes CA, et al. Cognitiveimpairment in heart failure: A protective role for angiotensin-(1-7). Behav Neurosci. 2017;131(1):99-114.
�4. Wang HW, Ahmad M, Jadayel R, Najjar F, Lagace D, Leenen FHH. Inhibition of in�ammation byminocycline improves heart failure and depression-like behaviour in rats after myocardial infarction.PLoS One. 2019;14(6):e0217437.
�5. Lurie DI. An Integrative Approach to Neuroin�ammation in Psychiatric disorders and NeuropathicPain. J Exp Neurosci. 2018;12:1179069518793639.
��. Shal B, Ding W, Ali H, Kim YS, Khan S. Anti-neuroin�ammatory Potential of Natural Products inAttenuation of Alzheimer's Disease. Front Pharmacol. 2018;9:548.
�7. Gupta N, Shyamasundar S, Patnala R, Karthikeyan A, Arumugam TV, Ling EA, et al. Recent progressin therapeutic strategies for microglia-mediated neuroin�ammation in neuropathologies. Expert OpinTher Targets. 2018;22(9):765-81.
��. Roy RK, Augustine RA, Brown CH, Schwenke DO. Activation of oxytocin neurons in the paraventricularnucleus drives cardiac sympathetic nerve activation following myocardial infarction in rats. CommunBiol. 2018;1:160.
�9. Zheng H, Li YF, Wang W, Patel KP. Enhanced angiotensin-mediated excitation of renal sympatheticnerve activity within the paraventricular nucleus of anesthetized rats with heart failure. Am J PhysiolRegul Integr Comp Physiol. 2009;297(5):R1364-74.
90. Wohleb ES. Neuron-Microglia Interactions in Mental Health Disorders: "For Better, and For Worse".Front Immunol. 2016;7:544.
91. Nair A, Bonneau RH. Stress-induced elevation of glucocorticoids increases microglia proliferationthrough NMDA receptor activation. J Neuroimmunol. 2006;171(1-2):72-85.
92. Tchelingerian JL, Quinonero J, Booss J, Jacque C. Localization of TNF alpha and IL-1 alphaimmunoreactivities in striatal neurons after surgical injury to the hippocampus. Neuron.1993;10(2):213-24.
93. Vitkovic L, Konsman JP, Bockaert J, Dantzer R, Homburger V, Jacque C. Cytokine signals propagatethrough the brain. Mol Psychiatry. 2000;5(6):604-15.
94. Stojkovic T, Colin C, Le Saux F, Jacque C. Speci�c pattern of nitric oxide synthase expression in glialcells after hippocampal injury. Glia. 1998;22(4):329-37.
95. Biancardi VC, Stern JE. Compromised blood-brain barrier permeability: novel mechanism by whichcirculating angiotensin II signals to sympathoexcitatory centres during hypertension. J Physiol.2016;594(6):1591-600.
9�. Sofroniew MV. Astrocyte barriers to neurotoxic in�ammation. Nat Rev Neurosci. 2015;16(5):249-63.

Page 24/37
97. Jha MK, Jo M, Kim JH, Suk K. Microglia-Astrocyte Crosstalk: An Intimate Molecular Conversation.Neuroscientist. 2019;25(3):227-40.
9�. Bellver-Landete V, Bretheau F, Mailhot B, Vallieres N, Lessard M, Janelle ME, et al. Microglia are anessential component of the neuroprotective scar that forms after spinal cord injury. Nat Commun.2019;10(1):518.
99. Rivest S. Regulation of innate immune responses in the brain. Nat Rev Immunol. 2009;9(6):429-39.
100. Adams KL, Gallo V. The diversity and disparity of the glial scar. Nat Neurosci. 2018;21(1):9-15.
101. Celano CM, Daunis DJ, Lokko HN, Campbell KA, Huffman JC. Anxiety Disorders and CardiovascularDisease. Curr Psychiatry Rep. 2016;18(11):101.
TablesTable 1: Summary of microglial morphometric parameters of sham and HF rats for the PVN and CeATable shows individual values (mean ± SEM) of all analyzed microglial parameters, N = number ofanalyzed microglia, n= number of animals per group, CeA = central amygdala, PVN = paraventricularnucleus, S1BF = somatosensory cortex barrel �eld 1.

Page 25/37
Brain region Group
Cellvolume(µm3)
Surfacearea(µm2)
Filamentlength(µm)
Dendriticbranches
Dendriticsegments
Filamentterminals
IBA1intensity
(AU)
PVN
Sham 8wN=381
n=4
3157 ± 112
4048 ± 99
745 ± 21
104 ± 3
219 ± 7
116 ± 4
9449 ± 123
Sham 14wN=365
n=4
3098 ± 119
4100 ± 107
736 ± 18
102 ± 4
224 ± 8
118 ± 6
9385 ± 135
Sham 16wN=389
n=4
3181 ± 122
4068 ± 81
761 ± 25
100 ± 5
216 ± 7
117 ± 6
9522 ± 139
HF 8wN=378
n=4
2838 ± 58
3868 ± 75
642 ± 12
82 ± 2
171 ± 5
90 ± 3
11138 ± 118
HF 14wN=407
n=4
2212 ± 74
3424 ± 64
629 ± 35
78 ± 2
163 ± 7
85 ± 3
12764 ± 202
HF 16wN=399
n=4
2012 ± 69
3233 ± 59
524 ± 39
72 ± 3
150 ± 5
83 ± 4
12783 ± 231
CeA
Sham 8wN=377
n=4
3588 ± 137
4885 ± 119
841 ± 28
109 ± 6
219 ± 7
114 ± 3
10134 ± 137
Sham 14wN=339
n=4
3644 ± 122
4966 ± 131
865 ± 31
102 ± 2
214 ± 5
116 ± 4
10073 ± 144
Sham 16wN=354
n=4
3691 ± 123
4904 ± 127
833 ± 24
104 ± 5
216 ± 7
114 ± 3
10285 ± 180
HF 8wN=363
n=4
3634 ± 119
4700 ± 124
765 ± 29
106 ± 4
222 ± 7
112 ± 3
10344 ± 176
HF 14wN=355
n=4
4418 ± 187
4964 ± 144
781 ± 28
92 ± 4
192 ± 8
100 ± 3
11314 ± 277
HF 16wN=332
n=4
3180 ± 115
4395 ± 163
623 ± 24
89 ± 3
179 ± 6
94 ± 4
12779 ± 357
S1BF
Sham 14wN=139
n=4
4577 ± 138
6008 ± 234
967 ± 31
125 ± 5
261 ± 8
135 ± 7
10539 ± 183
HF 14wN=162
n=4
4257 ± 130
5664 ± 224
957 ± 31
126 ± 4
264 ± 8
138 ± 8
10647 ± 171
Figures

Page 26/37
Figure 1
Heart failure does not alter microglial cell density in the PVN or CeA (a) Representative image showing theechocardiographic assessment left ventricular cardiac function in a sham and HF rats. (b) timetabledepicting morphometric assessments and qPCR at 8-, 14- and 16- weeks post-surgery, (c, d)Representative confocal images showing IBA1-labeled microglia (red) in the PVN and CeA. Bar graphsshow quanti�cation of microglial density within the PVN and CeA in sham and HF rats 14 weeks post-surgery. 3V: third ventricle, AW: anterior wall, CeC: central amygdala capsular division, CeL: centralamygdala lateral division, CeM: central amygdala medial division, cst: commissural stria terminalis, LVID,d and LVID, s: left ventricle internal dimensions in diastole and systole, PVN: paraventricular nucleus, PW:posterior wall.

Page 27/37
Figure 2
Three-dimensional reconstruction of microglia surface and �laments using IMARIS (a) schematicdepiction of the sequential steps used for the 3D morphometric reconstruction and assessment ofmicroglia (IBA1, green), (b) confocal images show the step-by-step process for three-dimensionalreconstruction of a single microglia (IBA1, red). For image processing, colors were changed from red togreen in IMARIS for better visibility and increased precision during manual editing of reconstructedmicroglia. Note the merging of red (raw �uorescence) and green (surface reconstruction) channels in thetop panel.

Page 28/37
Figure 3
Sham surgery per se does not alter the morphology of PVN or CeA microglia (a) brain scheme shows thetopographic location of PVN microglia that have been used for the morphometric assessment. The redarea within the PVN (heart-shaped nucleus) highlights the fraction of the nucleus where pictures weretaken, (b) dot-plot graphs show the individual values of PVN microglia for surface area, cell volume,�lament length and IBA 1 intensity for the non-surgery control (N=357 from 4 rats), and sham rats at 8, 14and 16 weeks post-surgery (n=381 from 4 rats, n= 365 from 4 rats and n=389 from 4 rats, respectively),(c)brain scheme shows the topographic location of CeA microglia that have been used for the morphometricassessment. The red area within the CeA highlights the divisions where pictures were taken, (d) dot-plotgraphs show the individual values of CeA microglia for surface area, cell volume, �lament length and IBA1 intensity for the non-surgery control (N=297 from 4 rats), and sham rats at 8, 14 and 16 weeks post-surgery (N=377 from 4 rats, N=339 from 4 rats and N=354 from 4 rats, respectively).
Page 29/37
Figure 4
HF-induced morphometric changes in PVN microglia (a) representative confocal images show IBA1-stained microglia in the PVN of HF and sham rats 16 weeks post-surgery, (b) brain scheme shows thetopographic location of PVN microglia that have been used for the morphometric assessment. The redarea within the PVN (heart-shaped nucleus) highlights the fraction of the nucleus where pictures weretaken , (c) dot-plot graphs show the individual values of PVN microglia for surface area, cell volume,

Page 30/37
�lament length, dendritic branches, dendritic segments, �lament terminals and IBA 1 intensity for shamrats (N=1135 from 12 rats, pooled) and HF rats at 8, 14 and 16 weeks post-surgery (N=378 from 4 rats,N=407 from 4 rats and N=399 from 4 rats, respectively). *p<0.05, **p<0.01 and ***p<0.0001 vs. respectivesham, one-way ANOVA followed by Tukey post-hoc test.
Figure 5
HF does not induce morphometric changes in somatosensory cortex 1 barrel �eld microglia (a) brainscheme shows the topographic location of S1BF microglia that have been used for the morphometricassessment. The red area highlights the S1BF, (b) dot-plot graphs show the individual values of S1BFmicroglia for surface area, cell volume, �lament length, dendritic branches, dendritic segments, �lamentterminals and IBA 1 intensity for sham rats (n=4) and HF rats (n= 4).

Page 31/37
Figure 6
HF-induced morphometric changes in CeA microglia (a) representative confocal images show IBA1-stained microglia in the PVN of HF and sham rats 16 weeks post-surgery, (b) brain scheme shows thetopographic location of CeA microglia that have been used for the morphometric assessment. The reddotted line highlights the CeA, (c) dot-plot graphs show the individual values of CeA microglia for surfacearea, cell volume, �lament length, dendritic branches, dendritic segments, �lament terminals and IBA 1

Page 32/37
intensity for sham rats (N=1070 from 12 rats, pooled) and HF rats at 8, 14 and 16 weeks post-surgery(N=363 from 4 rats, N=355 from 4 rats and N= 332 from 4 rats, respectively). *p<0.05, **p<0.01 and***p<0.0001 vs respective sham, one-way ANOVA followed by Tukey post-hoc test.
Figure 7
HF induced derami�cation and increased the proportion of activated microglia in the PVN and CeA (a)scheme depicts the HF-induced transition from low activity (rami�ed) to high activity (derami�ed)microglia. Red circles depict superimposed spheres centered around microglia somata used for Shollanalysis, (b, c) bar graphs show the mean number of total of Sholl intersections for PVN and CeAmicroglia in sham rats (n=12, pooled) and HF rats at 8, 14 and 16 weeks post-surgery (n=4/group), (d, e)bar graphs show the mean proportion of activated microglia in the PVN and CeA in sham rats (n=12,pooled) and HF rats at 8, 14 and 16 weeks post-surgery (n=4/group), (f-g) mean distribution plots of the

Page 33/37
number of Sholl intersections as a function of the distance from the microglial soma for sham and HFrats 16 weeks post-surgery (n=4/group), (h) distribution plot comparing Sholl intersections as a functionof the distance from the microglial soma for PVN and CeA microglia (n=12/group, pooled). *p<0.05,**p<0.01 and ***p<0.0001 vs. respective sham, two-way ANOVA or one-way ANOVA followed by Tukeypost-hoc test.
Figure 8

Page 34/37
HF-induced somatic swelling of PVN and CeA microglia is correlated with microglial derami�cation (a)confocal images show a representative example of HF-induced microglial swelling, (b, c) bar graphsshow the mean microglia somata volume in the PVN and CeA in sham rats (n=12, pooled) and HF rats at8, 14 and 16 weeks post-surgery (n=4/group), (d-g) plots showing the total number of Sholl intersectionsas a function of soma volume for individual microglial cells in the PVN of sham (d) and HF (e) rats and inthe CeA of sham (f) and HF (g) rats. Red lines represent best-�t lines assuming a non-linear relationshipbetween the total number of Sholl intersections and soma volume. **p<0.01 and ***p<0.0001 vsrespective sham, one-way ANOVA followed by Tukey post-hoc test or Pearson correlation.

Page 35/37
Figure 9
HF-induced morphometric changes in PVN and CeA astrocytes (a) representative confocal images showGFAP-labeled (red) PVN astrocytes in sham and HF rats, (b) bar graphs depict the mean GFAPimmunoreactivity intensity (left panel) and density (right panel) obtained from a 2D z-stack analysis(Methods) in sham (n=12, pooled) and HF rats (n=4), (c) schematic depiction of sequential steps used forthe 3D morphometric reconstruction and assessment of astrocytic processes using IMARIS (GFAP, red),

Page 36/37
(d) representative confocal image showing PVN astrocytes in a sham rat stained with GFAP (red) andGluSyn (green), (e) dot-plot graphs show the individual values of PVN microglia for surface area, cellvolume, �lament length and IBA1 intensity in sham (n=4) and HF rats 14 weeks post-surgery (n=4), (f) bargraph shows the mean number of total sholl intersections in PVN astrocytes in sham (n=4) and HF rats14 weeks post-surgery (n=4), (g) representative confocal image showing CeA astrocytes stained withGFAP (red) and GluSyn (green) in a sham rat, (h) dot-plot graph show the individual values of CeAmicroglia for surface area, cell volume, �lament length and IBA1 intensity in sham (n=4) and HF rats 14weeks post-surgery (n=4) (i) bar graph shows the mean number of total Sholl intersections in CeAastrocytes in sham (n= 4) and HF rats 14 weeks post-surgery (n=4), (j, k) mean distribution plots of thenumber of Sholl intersections as a function of the distance from the microglial soma for sham and HFrats 14 weeks post-surgery (n=4/group), (l) confocal images show a single PVN astrocyte from a shamanimal before and after surface reconstruction with IMARIS. *p<0.05, **p<0.01 and ***p<0.0001 vs.respective sham, Student’s-t test or two-way ANOVA.
Figure 10
HF-induced changes in NI-associated microglia and astrocyte marker mRNA levels (a-f) bar graphs showthe mean fold change in mRNA transcript levels in HF rats compared to sham rats in the PVN (a, b), theCeA (c, d) and the PLC (e, f). All graphs depict the fold changes of mRNA levels in HF group compared totheir respective shams. Green bars: cytokines, red bars: a1 astrocyte markers, blue bars: a2 astrocyte

Page 37/37
markers. *p<0.05, **p<0.01 and ***p<0.0001 vs. respective controls, one sample t-test, theoreticalmean=1.