metabolic analysis profile (urine) - gdx.net · metabolic analysis profile interpretation...
TRANSCRIPT
Patient: SAMPLEPATIENT
DOB: Sex: MRN:
MAP04 RMS 1416 Rev 3
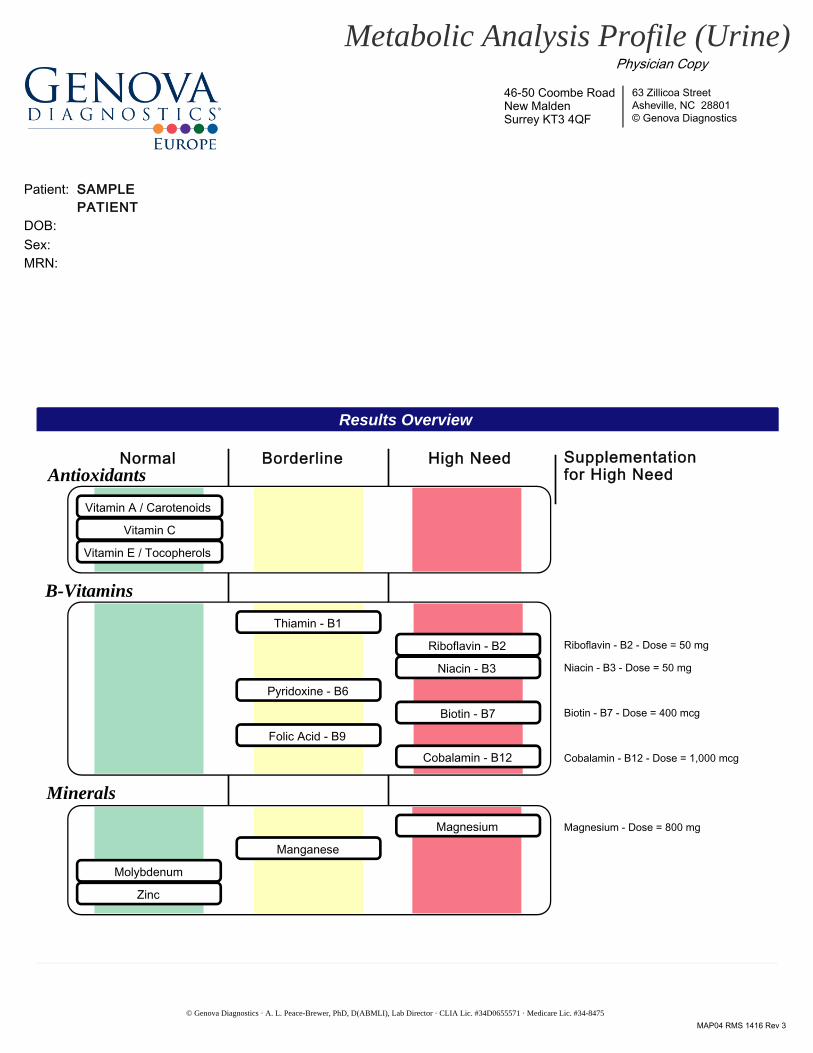
Results Overview
© Genova Diagnostics · A. L. Peace-Brewer, PhD, D(ABMLI), Lab Director · CLIA Lic. #34D0655571 · Medicare Lic. #34-8475
Metabolic Analysis Profile (Urine)
Normal Borderline High Need
Vitamin A / Carotenoids
Vitamin C
Vitamin E / Tocopherols
Thiamin - B1
Riboflavin - B2
Niacin - B3
Pyridoxine - B6
Biotin - B7
Folic Acid - B9
Cobalamin - B12
Riboflavin - B2 - Dose = 50 mg
Niacin - B3 - Dose = 50 mg
Cobalamin - B12 - Dose = 1,000 mcg
Biotin - B7 - Dose = 400 mcg
Magnesium - Dose = 800 mg
Antioxidants
B-Vitamins
Minerals
Supplementation for High Need
Manganese
Magnesium
Molybdenum
Zinc
46-50 Coombe RoadNew MaldenSurrey KT3 4QF
Physician Copy
© Genova Diagnostics · A. L. Peace-Brewer, PhD, D(ABMLI), Lab Director · CLIA Lic. #34D0655571 · Medicare Lic. #34-8475
Page 2Patient: SAMPLE PATIENT ID:
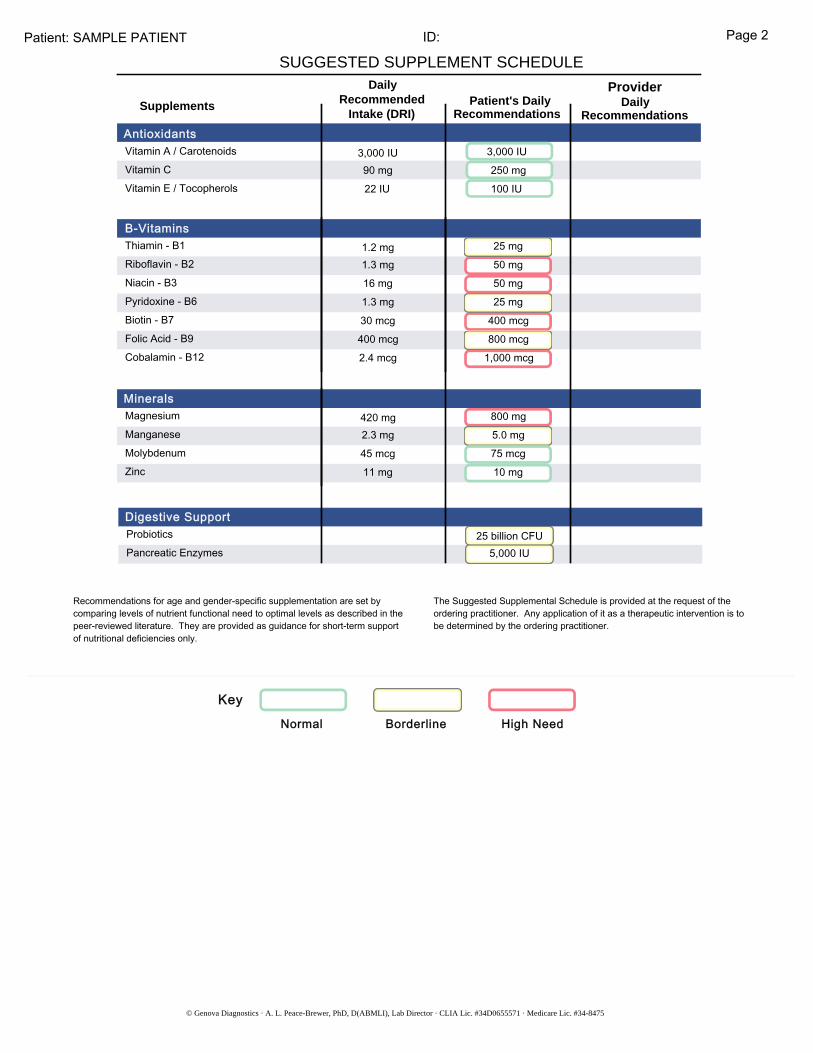
SUGGESTED SUPPLEMENT SCHEDULEDaily
RecommendedIntake (DRI) RecommendationsRecommendations
Patient's Daily DailyProvider
Antioxidants
B-Vitamins
Digestive Support
Supplements
Key
Normal Borderline High Need
B-Vitamins1.2 mg1.3 mg16 mg1.3 mg30 mcg
2.4 mcg 1,000 mcg
400 mcg25 mg50 mg50 mg25 mg
400 mcg 800 mcg
Thiamin - B1Riboflavin - B2Niacin - B3Pyridoxine - B6Biotin - B7Folic Acid - B9Cobalamin - B12
Minerals 420 mg2.3 mg45 mcg11 mg
5.0 mg75 mcg10 mg
800 mgMagnesiumManganeseMolybdenumZinc
Antioxidants Vitamin A / CarotenoidsVitamin CVitamin E / Tocopherols
3,000 IU90 mg22 IU
3,000 IU250 mg100 IU
25 billion CFU5,000 IU
ProbioticsPancreatic Enzymes
Digestive Support
Recommendations for age and gender-specific supplementation are set by comparing levels of nutrient functional need to optimal levels as described in the peer-reviewed literature. They are provided as guidance for short-term support of nutritional deficiencies only.
The Suggested Supplemental Schedule is provided at the request of the ordering practitioner. Any application of it as a therapeutic intervention is to be determined by the ordering practitioner.
ID:
Metabolic Analysis Profile Interpretation At-A-Glance
Page 3Patient: SAMPLE PATIENT
© Genova Diagnostics · A. L. Peace-Brewer, PhD, D(ABMLI), Lab Director · CLIA Lic. #34D0655571 · Medicare Lic. #34-8475
Key
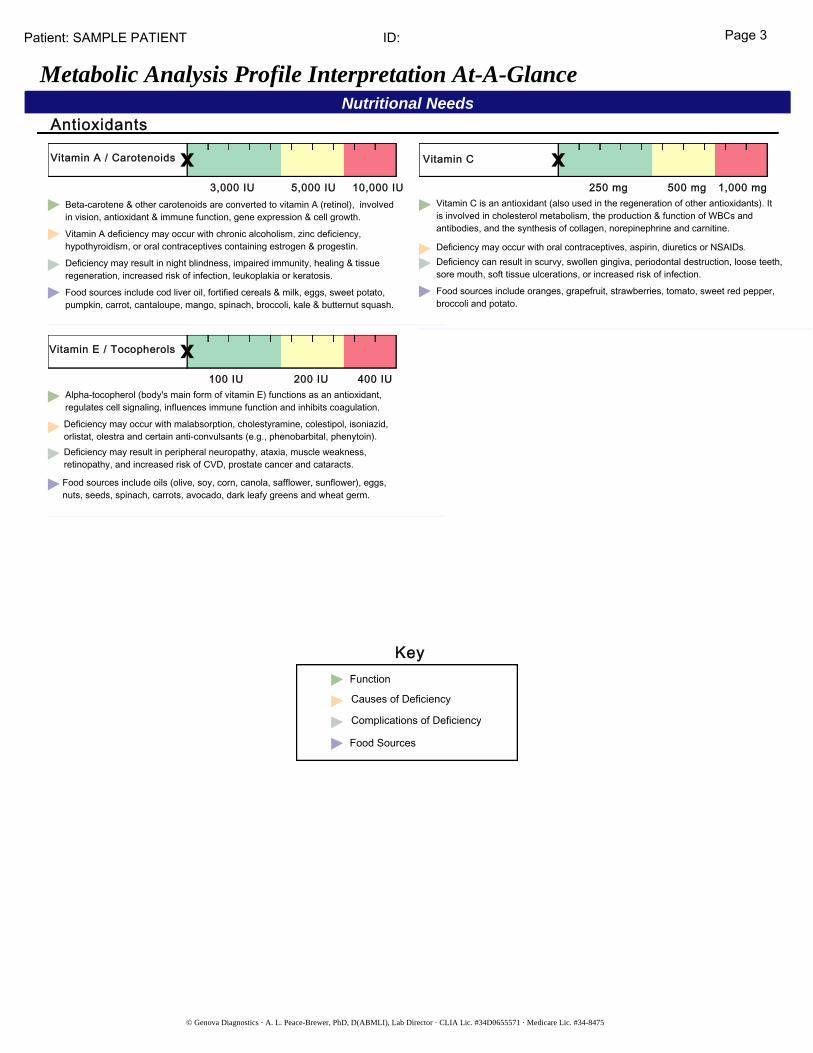
Nutritional NeedsAntioxidants
Vitamin C is an antioxidant (also used in the regeneration of other antioxidants). It is involved in cholesterol metabolism, the production & function of WBCs and antibodies, and the synthesis of collagen, norepinephrine and carnitine.
Deficiency may occur with oral contraceptives, aspirin, diuretics or NSAIDs.Deficiency can result in scurvy, swollen gingiva, periodontal destruction, loose teeth, sore mouth, soft tissue ulcerations, or increased risk of infection.
Food sources include oranges, grapefruit, strawberries, tomato, sweet red pepper, broccoli and potato.
250 mg 500 mg 1,000 mg
Vitamin C
3,000 IU 5,000 IU 10,000 IU
Vitamin A / Carotenoids
Food sources include cod liver oil, fortified cereals & milk, eggs, sweet potato, pumpkin, carrot, cantaloupe, mango, spinach, broccoli, kale & butternut squash.
Deficiency may result in night blindness, impaired immunity, healing & tissue regeneration, increased risk of infection, leukoplakia or keratosis.
Vitamin A deficiency may occur with chronic alcoholism, zinc deficiency, hypothyroidism, or oral contraceptives containing estrogen & progestin.
Beta-carotene & other carotenoids are converted to vitamin A (retinol), involved in vision, antioxidant & immune function, gene expression & cell growth.
100 IU 200 IU 400 IU
Vitamin E / Tocopherols
Food sources include oils (olive, soy, corn, canola, safflower, sunflower), eggs, nuts, seeds, spinach, carrots, avocado, dark leafy greens and wheat germ.
Deficiency may result in peripheral neuropathy, ataxia, muscle weakness, retinopathy, and increased risk of CVD, prostate cancer and cataracts.
Deficiency may occur with malabsorption, cholestyramine, colestipol, isoniazid, orlistat, olestra and certain anti-convulsants (e.g., phenobarbital, phenytoin).
Alpha-tocopherol (body's main form of vitamin E) functions as an antioxidant, regulates cell signaling, influences immune function and inhibits coagulation.
Function
Causes of Deficiency
Complications of Deficiency
Food Sources
ID: Page 4Patient: SAMPLE PATIENT
© Genova Diagnostics · A. L. Peace-Brewer, PhD, D(ABMLI), Lab Director · CLIA Lic. #34D0655571 · Medicare Lic. #34-8475
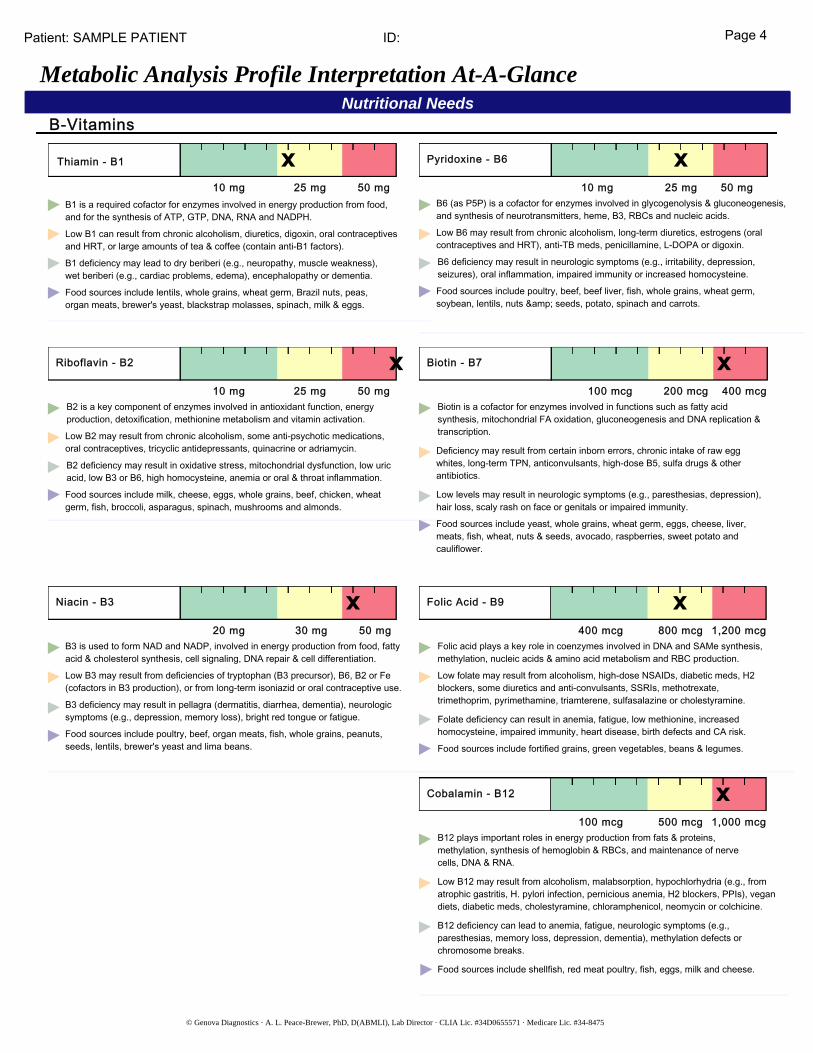
Nutritional NeedsB-Vitamins
Metabolic Analysis Profile Interpretation At-A-Glance
Thiamin - B1
10 mg 25 mg 50 mg
Food sources include lentils, whole grains, wheat germ, Brazil nuts, peas, organ meats, brewer's yeast, blackstrap molasses, spinach, milk & eggs.
B1 deficiency may lead to dry beriberi (e.g., neuropathy, muscle weakness), wet beriberi (e.g., cardiac problems, edema), encephalopathy or dementia.
Low B1 can result from chronic alcoholism, diuretics, digoxin, oral contraceptives and HRT, or large amounts of tea & coffee (contain anti-B1 factors).
B1 is a required cofactor for enzymes involved in energy production from food, and for the synthesis of ATP, GTP, DNA, RNA and NADPH.
Pyridoxine - B6
10 mg 25 mg 50 mg
Food sources include poultry, beef, beef liver, fish, whole grains, wheat germ, soybean, lentils, nuts & seeds, potato, spinach and carrots.
B6 deficiency may result in neurologic symptoms (e.g., irritability, depression, seizures), oral inflammation, impaired immunity or increased homocysteine.
Low B6 may result from chronic alcoholism, long-term diuretics, estrogens (oral contraceptives and HRT), anti-TB meds, penicillamine, L-DOPA or digoxin.
B6 (as P5P) is a cofactor for enzymes involved in glycogenolysis & gluconeogenesis, and synthesis of neurotransmitters, heme, B3, RBCs and nucleic acids.
Riboflavin - B2
10 mg 25 mg 50 mg
Food sources include milk, cheese, eggs, whole grains, beef, chicken, wheat germ, fish, broccoli, asparagus, spinach, mushrooms and almonds.
B2 deficiency may result in oxidative stress, mitochondrial dysfunction, low uric acid, low B3 or B6, high homocysteine, anemia or oral & throat inflammation.
Low B2 may result from chronic alcoholism, some anti-psychotic medications, oral contraceptives, tricyclic antidepressants, quinacrine or adriamycin.
B2 is a key component of enzymes involved in antioxidant function, energy production, detoxification, methionine metabolism and vitamin activation.
Biotin - B7
100 mcg 200 mcg 400 mcg
Food sources include yeast, whole grains, wheat germ, eggs, cheese, liver, meats, fish, wheat, nuts & seeds, avocado, raspberries, sweet potato and cauliflower.
Low levels may result in neurologic symptoms (e.g., paresthesias, depression), hair loss, scaly rash on face or genitals or impaired immunity.
Deficiency may result from certain inborn errors, chronic intake of raw egg whites, long-term TPN, anticonvulsants, high-dose B5, sulfa drugs & other antibiotics.
Biotin is a cofactor for enzymes involved in functions such as fatty acid synthesis, mitochondrial FA oxidation, gluconeogenesis and DNA replication & transcription.
Niacin - B3
20 mg 30 mg 50 mg
Food sources include poultry, beef, organ meats, fish, whole grains, peanuts, seeds, lentils, brewer's yeast and lima beans.
B3 deficiency may result in pellagra (dermatitis, diarrhea, dementia), neurologic symptoms (e.g., depression, memory loss), bright red tongue or fatigue.
Low B3 may result from deficiencies of tryptophan (B3 precursor), B6, B2 or Fe (cofactors in B3 production), or from long-term isoniazid or oral contraceptive use.
B3 is used to form NAD and NADP, involved in energy production from food, fatty acid & cholesterol synthesis, cell signaling, DNA repair & cell differentiation.
Folic Acid - B9
400 mcg 1,200 mcg800 mcg
Food sources include fortified grains, green vegetables, beans & legumes.
Folate deficiency can result in anemia, fatigue, low methionine, increased homocysteine, impaired immunity, heart disease, birth defects and CA risk.
Low folate may result from alcoholism, high-dose NSAIDs, diabetic meds, H2 blockers, some diuretics and anti-convulsants, SSRIs, methotrexate, trimethoprim, pyrimethamine, triamterene, sulfasalazine or cholestyramine.
Folic acid plays a key role in coenzymes involved in DNA and SAMe synthesis, methylation, nucleic acids & amino acid metabolism and RBC production.
Cobalamin - B12
100 mcg 500 mcg 1,000 mcg
Food sources include shellfish, red meat poultry, fish, eggs, milk and cheese.
B12 deficiency can lead to anemia, fatigue, neurologic symptoms (e.g., paresthesias, memory loss, depression, dementia), methylation defects or chromosome breaks.
Low B12 may result from alcoholism, malabsorption, hypochlorhydria (e.g., from atrophic gastritis, H. pylori infection, pernicious anemia, H2 blockers, PPIs), vegan diets, diabetic meds, cholestyramine, chloramphenicol, neomycin or colchicine.
B12 plays important roles in energy production from fats & proteins, methylation, synthesis of hemoglobin & RBCs, and maintenance of nerve cells, DNA & RNA.
ID: Page 5Patient: SAMPLE PATIENT
© Genova Diagnostics · A. L. Peace-Brewer, PhD, D(ABMLI), Lab Director · CLIA Lic. #34D0655571 · Medicare Lic. #34-8475
Nutritional NeedsMinerals
Digestive Support
Metabolic Analysis Profile Interpretation At-A-Glance
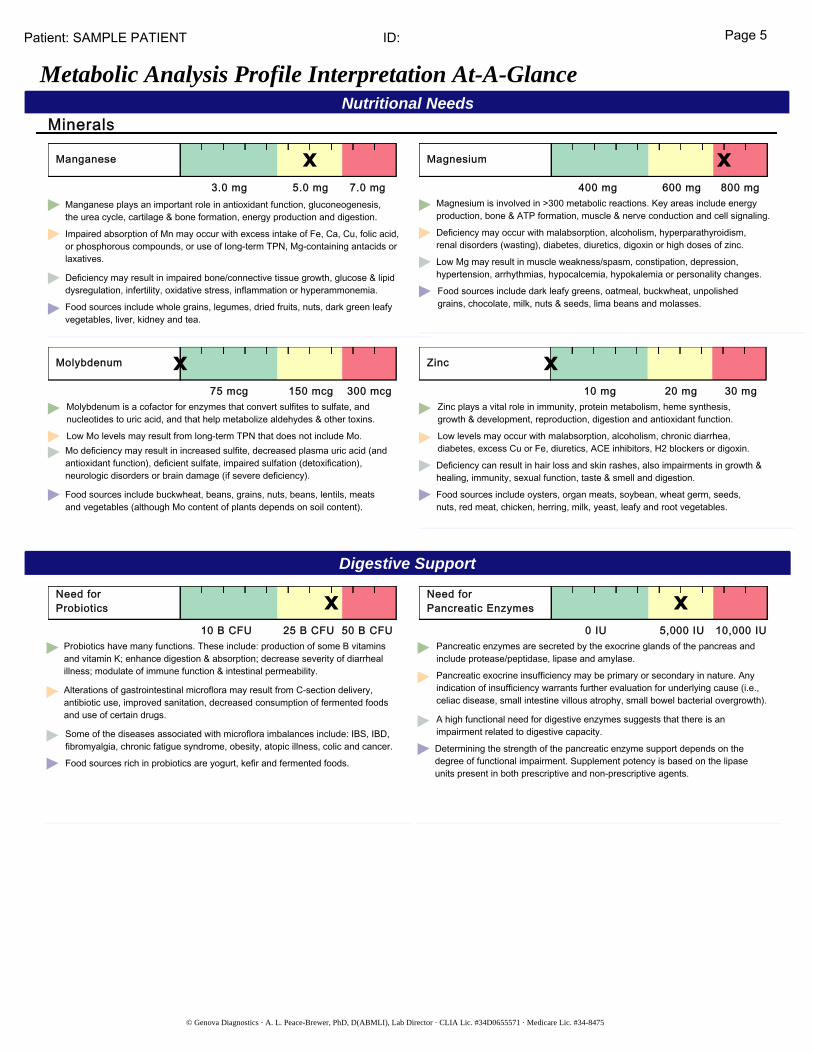
Manganese
3.0 mg 5.0 mg 7.0 mg
Food sources include whole grains, legumes, dried fruits, nuts, dark green leafy vegetables, liver, kidney and tea.
Deficiency may result in impaired bone/connective tissue growth, glucose & lipid dysregulation, infertility, oxidative stress, inflammation or hyperammonemia.
Impaired absorption of Mn may occur with excess intake of Fe, Ca, Cu, folic acid, or phosphorous compounds, or use of long-term TPN, Mg-containing antacids or laxatives.
Manganese plays an important role in antioxidant function, gluconeogenesis, the urea cycle, cartilage & bone formation, energy production and digestion.
Magnesium
400 mg 600 mg 800 mg
Food sources include dark leafy greens, oatmeal, buckwheat, unpolished grains, chocolate, milk, nuts & seeds, lima beans and molasses.
Low Mg may result in muscle weakness/spasm, constipation, depression, hypertension, arrhythmias, hypocalcemia, hypokalemia or personality changes.
Deficiency may occur with malabsorption, alcoholism, hyperparathyroidism, renal disorders (wasting), diabetes, diuretics, digoxin or high doses of zinc.
Magnesium is involved in >300 metabolic reactions. Key areas include energy production, bone & ATP formation, muscle & nerve conduction and cell signaling.
Molybdenum
75 mcg 150 mcg 300 mcg
Food sources include buckwheat, beans, grains, nuts, beans, lentils, meats and vegetables (although Mo content of plants depends on soil content).
Mo deficiency may result in increased sulfite, decreased plasma uric acid (and antioxidant function), deficient sulfate, impaired sulfation (detoxification), neurologic disorders or brain damage (if severe deficiency).
Low Mo levels may result from long-term TPN that does not include Mo.
Molybdenum is a cofactor for enzymes that convert sulfites to sulfate, and nucleotides to uric acid, and that help metabolize aldehydes & other toxins.
Zinc
10 mg 20 mg 30 mg
Food sources include oysters, organ meats, soybean, wheat germ, seeds, nuts, red meat, chicken, herring, milk, yeast, leafy and root vegetables.
Deficiency can result in hair loss and skin rashes, also impairments in growth & healing, immunity, sexual function, taste & smell and digestion.
Low levels may occur with malabsorption, alcoholism, chronic diarrhea, diabetes, excess Cu or Fe, diuretics, ACE inhibitors, H2 blockers or digoxin.
Zinc plays a vital role in immunity, protein metabolism, heme synthesis, growth & development, reproduction, digestion and antioxidant function.
Need for Probiotics
10 B CFU 25 B CFU 50 B CFU
Food sources rich in probiotics are yogurt, kefir and fermented foods.
Some of the diseases associated with microflora imbalances include: IBS, IBD, fibromyalgia, chronic fatigue syndrome, obesity, atopic illness, colic and cancer.
Alterations of gastrointestinal microflora may result from C-section delivery, antibiotic use, improved sanitation, decreased consumption of fermented foods and use of certain drugs.
Probiotics have many functions. These include: production of some B vitamins and vitamin K; enhance digestion & absorption; decrease severity of diarrheal illness; modulate of immune function & intestinal permeability.
Need forPancreatic Enzymes
0 IU 5,000 IU 10,000 IU
Determining the strength of the pancreatic enzyme support depends on the degree of functional impairment. Supplement potency is based on the lipase units present in both prescriptive and non-prescriptive agents.
A high functional need for digestive enzymes suggests that there is an impairment related to digestive capacity.
Pancreatic exocrine insufficiency may be primary or secondary in nature. Any indication of insufficiency warrants further evaluation for underlying cause (i.e., celiac disease, small intestine villous atrophy, small bowel bacterial overgrowth).
Pancreatic enzymes are secreted by the exocrine glands of the pancreas and include protease/peptidase, lipase and amylase.
ID: Page 6Patient: SAMPLE PATIENT
© Genova Diagnostics · A. L. Peace-Brewer, PhD, D(ABMLI), Lab Director · CLIA Lic. #34D0655571 · Medicare Lic. #34-8475
Functional Imbalances
Metabolic Analysis Profile Interpretation At-A-Glance
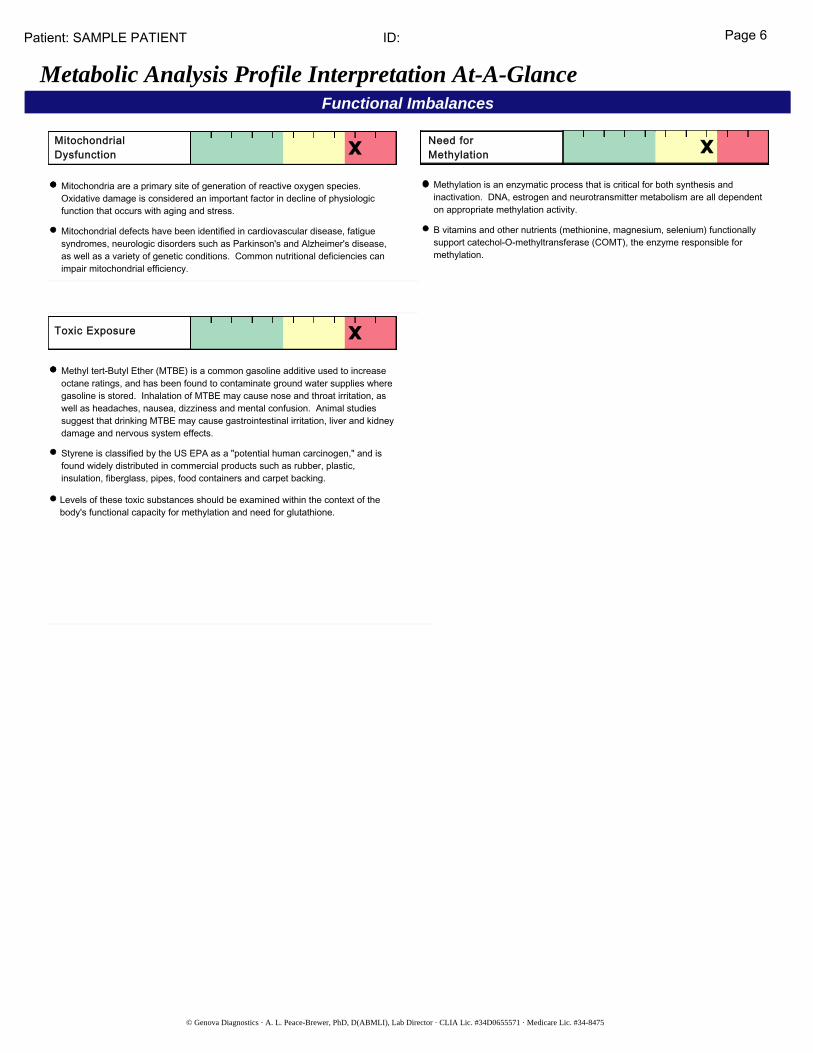
MitochondrialDysfunction
Mitochondria are a primary site of generation of reactive oxygen species. Oxidative damage is considered an important factor in decline of physiologic function that occurs with aging and stress.
Mitochondrial defects have been identified in cardiovascular disease, fatigue syndromes, neurologic disorders such as Parkinson's and Alzheimer's disease, as well as a variety of genetic conditions. Common nutritional deficiencies can impair mitochondrial efficiency.
Need forMethylation
Methylation is an enzymatic process that is critical for both synthesis and inactivation. DNA, estrogen and neurotransmitter metabolism are all dependent on appropriate methylation activity.
B vitamins and other nutrients (methionine, magnesium, selenium) functionally support catechol-O-methyltransferase (COMT), the enzyme responsible for methylation.
Toxic Exposure
Methyl tert-Butyl Ether (MTBE) is a common gasoline additive used to increase octane ratings, and has been found to contaminate ground water supplies where gasoline is stored. Inhalation of MTBE may cause nose and throat irritation, as well as headaches, nausea, dizziness and mental confusion. Animal studies suggest that drinking MTBE may cause gastrointestinal irritation, liver and kidney damage and nervous system effects.
Styrene is classified by the US EPA as a "potential human carcinogen," and is found widely distributed in commercial products such as rubber, plastic, insulation, fiberglass, pipes, food containers and carpet backing.
Levels of these toxic substances should be examined within the context of the body's functional capacity for methylation and need for glutathione.
ID: Page 7Patient: SAMPLE PATIENT
© Genova Diagnostics · A. L. Peace-Brewer, PhD, D(ABMLI), Lab Director · CLIA Lic. #34D0655571 · Medicare Lic. #34-8475
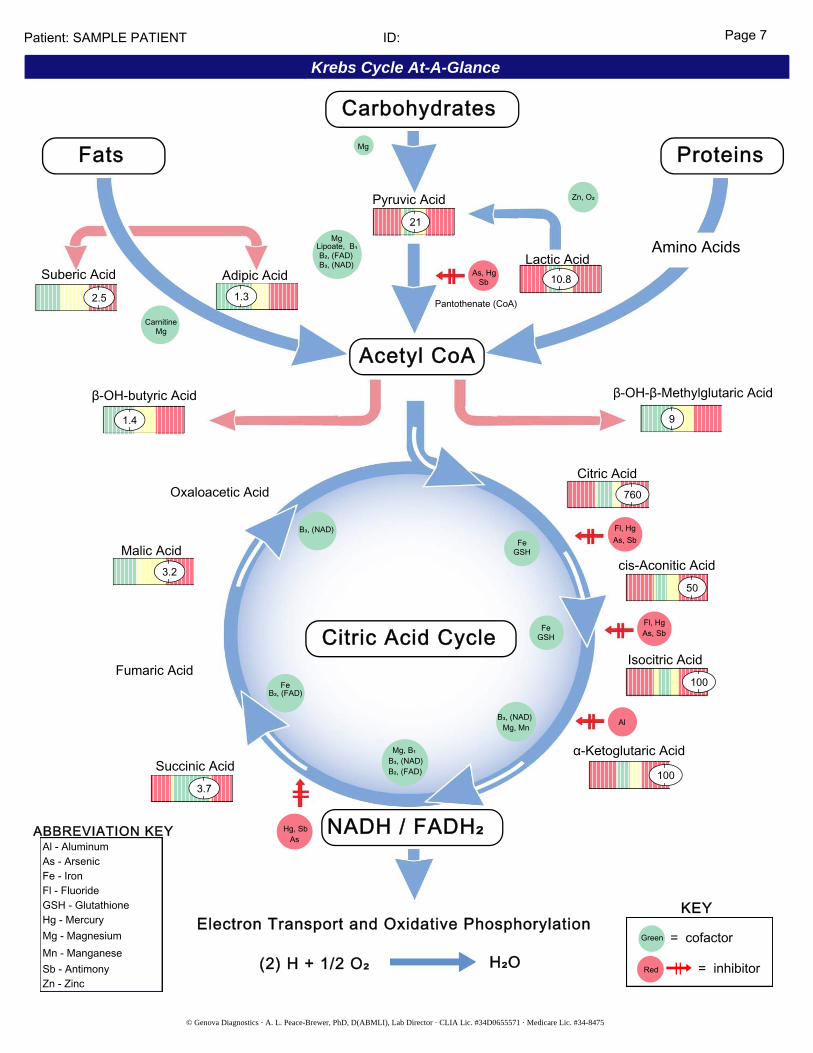
Krebs Cycle At-A-Glance
Citric Acid Cycle
NADH / FADH 2
Al
Fl, HgAs, Sb
CarnitineMg
B₃, (NAD)B₂, (FAD)
Lipoate, B₁Mg
Mg
Zn, O₂
Citric Acid Cycle
NADH / FADH 2
Al
Fl, HgAs, Sb
CarnitineMg
B₃, (NAD)B₂, (FAD)
Lipoate, B₁Mg
Mg
Zn, O₂
Citric Acid Cycle
NADH / FADH 2
Al
Fl, HgAs, Sb
CarnitineMg
B₃, (NAD)B₂, (FAD)
Lipoate, B₁Mg
Mg
Zn, O₂
Citric Acid Cycle
Al
Fl, HgAs, Sb
CarnitineMg
B₃, (NAD)B₂, (FAD)
Lipoate, B₁Mg
Mg
Zn, O₂
As, HgSb
Pantothenate (CoA)
Pyruvic Acid21
Adipic Acid1.3
1.4 9
Oxaloacetic Acid
B₃, (NAD)
GSHFe
Malic Acid3.2
Fumaric AcidB₂, (FAD)
Fe
Succinic Acid3.7
AsHg, Sb
B₂, (FAD)B₃, (NAD)Mg, B₁
Mg, MnB₃, (NAD)
GSHFe
Citric Acid760
As, SbFl, Hg
cis-Aconitic Acid50
Isocitric Acid100
100
Lactic Acid10.8
Fats Proteins
Carbohydrates
Acetyl CoA
Red
Green
= inhibitor
= cofactor
KEY
Amino Acids
Electron Transport and Oxidative Phosphorylation
β-OH-β-Methylglutaric Acidβ-OH-butyric Acid
α-Ketoglutaric Acid
ABBREVIATION KEY
As - ArsenicAl - Aluminum
Zn - ZincSb - AntimonyMn - ManganeseMg - MagnesiumHg - MercuryGSH - GlutathioneFl - FluorideFe - Iron
Suberic Acid2.5
NADH / FADH₂
(2) H + 1/2 O₂ H₂O
ID: Page 8
© Genova Diagnostics · A. L. Peace-Brewer, PhD, D(ABMLI), Lab Director · CLIA Lic. #34D0655571 · Medicare Lic. #34-8475
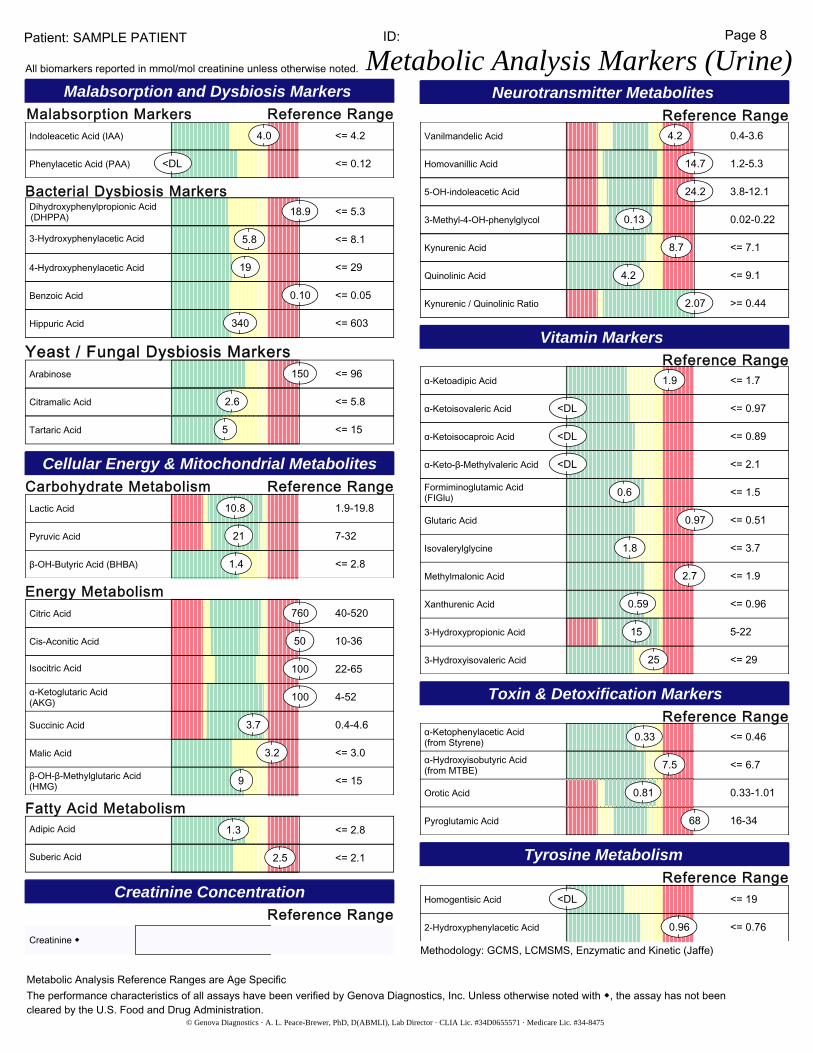
Malabsorption and Dysbiosis Markers
Cellular Energy & Mitochondrial Metabolites
Creatinine Concentration
Neurotransmitter Metabolites
Vitamin Markers
Toxin & Detoxification Markers
<= 4.24.0Indoleacetic Acid (IAA)
<= 0.12<DLPhenylacetic Acid (PAA)
<= 5.318.9Dihydroxyphenylpropionic Acid(DHPPA)
Malabsorption Markers
Carbohydrate Metabolism
Creatinine ◆
Reference Range
Reference Range
Reference Range
Reference Range
Bacterial Dysbiosis Markers
Yeast / Fungal Dysbiosis Markers
Patient: SAMPLE PATIENT
All biomarkers reported in mmol/mol creatinine unless otherwise noted. Metabolic Analysis Markers (Urine)
<= 8.15.83-Hydroxyphenylacetic Acid
<= 29194-Hydroxyphenylacetic Acid
<= 0.050.10Benzoic Acid
<= 603340Hippuric Acid
<= 96150Arabinose
<= 5.82.6Citramalic Acid
<= 155Tartaric Acid
1.9-19.810.8Lactic Acid
7-3221Pyruvic Acid
<= 2.81.4β-OH-Butyric Acid (BHBA)
Energy Metabolism40-520760Citric Acid
10-3650Cis-Aconitic Acid
22-65100Isocitric Acid
4-52100α-Ketoglutaric Acid(AKG)
0.4-4.63.7Succinic Acid
<= 3.03.2Malic Acid
<= 159β-OH-β-Methylglutaric Acid(HMG)
Fatty Acid Metabolism<= 2.81.3Adipic Acid
<= 2.12.5Suberic Acid
0.4-3.64.2Vanilmandelic Acid
1.2-5.314.7Homovanillic Acid
3.8-12.124.25-OH-indoleacetic Acid
0.02-0.220.133-Methyl-4-OH-phenylglycol
<= 7.18.7Kynurenic Acid
<= 9.14.2Quinolinic Acid
>= 0.442.07Kynurenic / Quinolinic Ratio
<= 1.71.9α-Ketoadipic Acid
Reference Range
<= 0.97<DLα-Ketoisovaleric Acid
<= 0.89<DLα-Ketoisocaproic Acid
<= 2.1<DLα-Keto-β-Methylvaleric Acid
<= 0.510.97Glutaric Acid
<= 1.50.6Formiminoglutamic Acid(FIGlu)
<= 3.71.8Isovalerylglycine
<= 1.92.7Methylmalonic Acid
<= 0.960.59Xanthurenic Acid
5-22153-Hydroxypropionic Acid
<= 29253-Hydroxyisovaleric Acid
0.33-1.010.81Orotic Acid
Reference Range<= 0.460.33α-Ketophenylacetic Acid
(from Styrene)
<= 6.77.5α-Hydroxyisobutyric Acid(from MTBE)
16-3468Pyroglutamic Acid
Tyrosine Metabolism
Reference Range<= 19<DLHomogentisic Acid
<= 0.760.962-Hydroxyphenylacetic Acid
Metabolic Analysis Reference Ranges are Age SpecificThe performance characteristics of all assays have been verified by Genova Diagnostics, Inc. Unless otherwise noted with ◆, the assay has not been cleared by the U.S. Food and Drug Administration.
Methodology: GCMS, LCMSMS, Enzymatic and Kinetic (Jaffe)