mercosur and agricultural marketsafcerc.tamu.edu/publications/publication-pdfs/im 02 96...
TRANSCRIPT
MERCOSUR AND AGRICULTURAL MARKETS
Rita T. Vieira and Gary W. Williams*
TAMRC International MarketResearch Report No. IM-2-96
August 1996
* Dr. Vieira is a researcher with EMBRAPA (Empresa Brasileira de Pesquisa Agropecuaria) inthe Brazilian Ministry of Agriculture and Agrarian Reform and a post-doctoral student in theDepartment of Agricultural Economics, Texas A&M University. Dr. Williams is Professor andTAMRC Director, Department of Agricultural Economics, Texas A&M University, CollegeStation, Texas 77843-2124.
MERCOSUR AND AGRICULTURAL MARKETS
Texas Agricultural Market Research Center (TAMRC) International Market Research Report No.IM-2-96, August 1996 by Rita T. Vieira and Gary W. Williams.
ABSTRACT: With a Gross Domestic product (GDP) of US$750 billion, a population of about 200million consumers, and 11.8 million square kilometers of area, MERCOSUR (Common Market ofthe South) is the most important regional integration plan of Latin America. Signed on March 26,1991 by the four South American countries of Argentina, Brazil, Paraguay, and Uruguay, the Treatyof Asunción established a process of transition for the creation of a common market among thesignatory countries by January 1, 1995. This paper provides an overview of the origin andcharacteristics of MERCOSUR and the implications of MERCOSUR for agricultural markets.
The Texas Agricultural Market Research Center (TAMRC) has been providing timely, unique,and professional research on a wide range of issues relating to agricultural markets andcommodities of importance to Texas and the nation for more than twenty-five years. TAMRC isa market research service of the Texas Agricultural Experiment Station and the Texas AgriculturalExtension Service. The main TAMRC objective is to conduct research leading to expanded andmore efficient markets for Texas and U.S. agricultural products. Major TAMRC research divisionsinclude International Market Research, Consumer and Product Market Research, CommodityMarket Research, and Contemporary Market Issues Research.
MERCOSUR AND AGRICULTURAL MARKETS
EXECUTIVE SUMMARY
With a Gross Domestic product (GDP) of US$750 billion, a population of about 200 millionconsumers, and 11.8 million square kilometers of area, MERCOSUR (Common Market of theSouth) is the most important regional integration plan of Latin America. Signed on March 26, 1991by the four South American countries of Argentina, Brazil, Paraguay, and Uruguay, the Treaty ofAsunción established a process of transition for the creation of a common market among thesignatory countries by January 1, 1995. Despite an overly ambitious goal to establish a commonmarket by 1995, the integration process has met with some success.
MERCOSUR is not Latin America's first attempt at regional integration. The most well-knownprevious attempts at were the Latin American Free Trade Association (ALALC) and the LatinAmerican Development and Integration Association (ALADI). Established in 1960, ALALCattempted to create a free trade area among Argentina, Brazil, Chile, Paraguay, Peru, Uruguay,Mexico. Colombia, Ecuador, Venezuela, and Bolivia joined in later years. Despite good intentions,however, the participating ALALC countries failed to agree on important issues.
The MERCOSUR integration process has ALADI as its basis. In 1988, Brazil and Argentina signedthe Integration, Cooperation, and Development Treaty with the objective of establishing a commonmarket in ten years. In July 1990, the two countries signed the Buenos Aires Act which drasticallymoved up the schedule to establish a common market to four and a half years with a target date ofDecember 1994. A month later, both Uruguay and Paraguay joined the proposed integrationscheme. On March 26, 1991, the foreign ministers of Argentina, Brazil, Paraguay, and Uruguaysigned the Treaty of Asunción, formally establishing MERCOSUR.
The main objective of the Treaty of Asunción was the establishment of a Common Market whichwas to be characterized by: (1) free circulation of goods, services, and factors of production amongmember countries, (2) common external tariffs among member countries, and (3) macroeconomicpolicy coordination among member countries. In June 1992, the MERCOSUR countries agreed ona process for achieving the objectives of the Treaty of Asunción by January 1995.
The schedule of internal tariff reductions under the Treaty is progressively linear and automatic.Tariff reductions began immediately with the signing of the Treaty. The objective was to attain azero average tariff on imports from member countries into Argentina and Brazil by the end ofDecember 1994 with tariff cuts to occur on January 1 and July 1 of each year. Uruguay andParaguay were given an additional year. The Treaty of Asunción also allowed member countriesto exempt a number of products from tariff reduction. The number of exempted products was to begradually reduced, however, with the objective of eliminating all such exemptions by December1994 for Argentina and Brazil and a year later for Paraguay and Uruguay.
iii
As of January 1, 1995, however, only the first stage of integration (preferential internal tariffs) hadbeen clearly achieved. Although the goal of establishing a common market by 1995 was notreached, significant progress in trade among the MERCOSUR member countries has occurred. Infact, by 1995, after a four-year transitory period, MERCOSUR functions as an imperfect customsunion with more than 85% of the goods produced in non-member countries being subject to acommon tariff that ranges from zero to 20%.
The commercial success of MERCOSUR has exceeded the most optimistic predictions for the early1990s. MERCOSUR has achieved international recognition as the third largest trading block in theworld after the European Union and NAFTA. The trade volume among MERCOSUR membercountries has practically tripled over the last five years. The integration between Argentina andBrazil has laid important groundwork for further market integration in South America. In 1994,trade between Brazil and Argentina exceeded US$7 billion, a record for trade between two countriesin Southern America. Argentina has become Brazil’s second largest export market.
The goal of economic integration is to increase the level of economic development in allparticipating countries. Economic integration, however, is also painful, forcing a restructuring ofeach participating country's economic activities. Fierce competition among various segments of theagricultural sectors of MERCOSUR member countries has impacted the direction and pattern ofeconomic development and trade among the four countries. Agricultural products and agriculturalindustries in which Brazil was once considered less competitive in comparison to the highlyspecialized sectors in Argentina are now experiencing a considerable increase in exports. Brazil hasexhibited major advances in the processed food sector while Argentina has distinguished itself inthe production of primary agricultural goods. Brazil has become an importer of grains givingArgentina, Uruguay, and Paraguay preferential access to its large market.
Economic integration has been a slow process for the MERCOSUR countries. If MERCOSUR isever to become a true common market, a number of important - and politically difficult - challengesremain, including the elimination of all remaining tariff and non-tariff trade barriers, the grantingof free movement to productive factors among member countries, the harmonization ofmacroeconomic policies, and the coordination of national legislation. The difficulties in achievingeconomic coordination and harmonization among MERCOSUR members are exacerbated by thedifferences in the political systems of the four member countries.
Despite the challenges faced by the governments involved in the economic integration of the region,MERCOSUR has strengthened the relationship of member countries with world markets. The U.S.,for example, has increased its trade with MERCOSUR countries. Without question, theMERCOSUR experience has demonstrated that economic development and stabilization within amajor Latin American region is possible through free trade and economic cooperation amongcountries.
iv
TABLE OF CONTENTS
Page
ABSTRACT . . . . . . . . . . . . . . . . . . . . . . . . . . . . . . . . . . . . . . . . . . . . . . . . . . . . . . . . . . . . . . . . . . i
EXECUTIVE SUMMARY . . . . . . . . . . . . . . . . . . . . . . . . . . . . . . . . . . . . . . . . . . . . . . . . . . . . . ii
An Historical Overview of Regional Integration in Latin America . . . . . . . . . . . . . . . . . . . . . . . 1
The Treaty of Asunción . . . . . . . . . . . . . . . . . . . . . . . . . . . . . . . . . . . . . . . . . . . . . . . . . . . . . . . . . 3
Implementation of the Treaty of Asunción . . . . . . . . . . . . . . . . . . . . . . . . . . . . . . . . . . . . . . . . . . 4
The Trade Effects of MERCOSUR . . . . . . . . . . . . . . . . . . . . . . . . . . . . . . . . . . . . . . . . . . . . . . . . 5General Trade Effects . . . . . . . . . . . . . . . . . . . . . . . . . . . . . . . . . . . . . . . . . . . . . . . . . . . . 5Effects on World Agricultural Trade . . . . . . . . . . . . . . . . . . . . . . . . . . . . . . . . . . . . . . . . . 6Effects on U.S- MERCOSUR Trade . . . . . . . . . . . . . . . . . . . . . . . . . . . . . . . . . . . . . . . . . 6Effects on MERCOSUR Grain Markets . . . . . . . . . . . . . . . . . . . . . . . . . . . . . . . . . . . . . . 7
Conclusions . . . . . . . . . . . . . . . . . . . . . . . . . . . . . . . . . . . . . . . . . . . . . . . . . . . . . . . . . . . . . . . . . . 8
References . . . . . . . . . . . . . . . . . . . . . . . . . . . . . . . . . . . . . . . . . . . . . . . . . . . . . . . . . . . . . . . . . . 11
LIST OF TABLES
Table 1: Brazil: Trade with MERCOSUR Countries, 1990-1994 . . . . . . . . . . . . . . . . . . . . . 13Table 2: Brazil: Trade Balance with MERCOSUR Countries, 1990-1993 . . . . . . . . . . . . . . 13Table 3: Brazil: Trade with Argentina by Selected Sectors, 1991-1994 . . . . . . . . . . . . . . . . 14Table 4: MERCOSUR: Agricultural Trade Balance by Country and
Product Category, 1993 . . . . . . . . . . . . . . . . . . . . . . . . . . . . . . . . . . . . . . . . . . . . . . . 15Table 5: MERCOSUR: Destination of Agricultural Exports by Country, 1993 . . . . . . . . . . 16Table 6: MERCOSUR: Trade with the U.S. by Country, 1992-1994 . . . . . . . . . . . . . . . . . . . 16Table 7: U.S.: Main Agricultural Products Imported from MERCOSUR by
Country, 1992-1994 . . . . . . . . . . . . . . . . . . . . . . . . . . . . . . . . . . . . . . . . . . . . . . . . . . 17Table 8: U.S.: Main Agricultural Products Exported to MERCOSUR
by Country, 1992-1994 . . . . . . . . . . . . . . . . . . . . . . . . . . . . . . . . . . . . . . . . . . . . . . . 18Table 9: Brazil: Grain Exports from U.S., 1985-1994 . . . . . . . . . . . . . . . . . . . . . . . . . . . . . . 19Table 10: MERCOSUR: Soybean, Rice, Wheat, Corn Area Harvested, 1985-1994 . . . . . . . . 20Table 11: MERCOSUR and the U.S.: Average Yield, 1994 . . . . . . . . . . . . . . . . . . . . . . . . . . 21
1
MERCOSUR AND AGRICULTURAL MARKETS
With a Gross Domestic product (GDP) of US$750 billion, a population of about 200 millionconsumers, and 11.8 million square kilometers of area, MERCOSUR (Common Market of theSouth) is the most important regional integration plan of Latin America. Signed on March 26, 1991by the four South American countries of Argentina, Brazil, Paraguay, and Uruguay, the Treaty ofAsunción established a process of transition for the creation of a common market among thesignatory countries by January 1, 1995. Despite an overly ambitious goal to establish a commonmarket by 1995, the integration process has met with some success.
This paper provides an overview of the origin and characteristics of MERCOSUR and theimplications of MERCOSUR for agricultural markets. Following an historical overview of regionalintegration in Latin America, the provisions of the original Treaty of Asunción that establishedMERCOSUR is discussed which is followed by an assessment of the outcome of the attempt toimplement the agreement. The paper then assesses the trade effects of MERCOSUR with emphasison interregional trade among the MERCOSUR countries, world agricultural trade, and U.S.-MERCOSUR trade. The paper ends with some concluding comments.
An Historical Overview of Regional Integration in Latin America
MERCOSUR is not Latin America's first attempt at regional integration. Although the most well-known previous Latin American attempts at regional integration were the Latin American FreeTrade Association (ALALC) and the Latin American Development and Integration Association(ALADI), they derived from earlier attempts at integration such as the Economic Commission forLatin America and the Caribbean (CEPAL) in 1948.
The Treaty of Montevideo (Uruguay) created ALALC in 1960 with an objective of establishinga free trade area among Argentina, Brazil, Chile, Paraguay, Peru, Uruguay, and Mexico. Colombiaand Ecuador joined ALALC in 1961, followed by Venezuela in 1966 and Bolivia in 1967. Theoriginal goal of ALALC to establish a common market by 1972 (12 years) was revised by theCaracas protocol to December 31, 1980. ALALC intended to eliminate all forms of protectionismand, thus, to promote multilateral trade.
Despite good intentions, however, the participating ALALC countries failed to agree on importantissues. At the same time, little flexibility in the treaty, a lack a commitment from the private sector,and political problems in almost all of Latin America increased conflicts and reduced progresstoward integration. Differences in economic policy and philosophy among governments also provedproblematic. Some of the participating countries, such as Argentina, Brazil, and Mexico, wereconsidered strictly "mercantilist" and outward-looking in their economic policies. Others such as
2
Bolivia, Chile, Colombia, Ecuador, and Peru were considered to be "developmentists" and inward-looking in their economic policies.
Consequently, the governments of Bolivia, Chile, Columbia, Ecuador, and Peru broke away fromALALC in May 1969 and signed the Cartagena Agreement creating the Andean Pact.Unfortunately, the pact did not live up to expectations. Little economic integration ever occurredamong the member countries.
In 1975, all countries of Latin America approved the formation of the Latin America EconomicSystem (SELA), a regional organization intended to provide for consultation, coordination,cooperation, and the mutual promotion of social objectives among the member countries.
The petroleum crisis of the late 1970s which generated a deep recession in Latin American countriesproved to be a major obstacle to regional integration in the region through the various tradeagreements that had been negotiated. After several attempts, a new treaty was signed in 1980 byArgentina, Brazil, Chile, Colombia, Ecuador, Mexico, Paraguay, Peru, and Venezuela which endedALALC and created the Latin American Development and Integration Association (ALADI). Themain objective of ALADI was a more realistic approach to the process of integration throughstimulating bilateral agreements among member countries instead of attempting to create one largearea of free trade among all member countries.
ALADI continues to be a forum for the discussion of integration. The ALADI system of regionalcustom preference has facilitated regional and international trade. In fact, the MERCOSURintegration process has ALADI as its basis. The main factor which stimulated the creation ofMERCOSUR, however, was the relationship between Brazil and Argentina. In 1985, the IguacuDeclaration created a Commission to study and discuss the economic integration of those twocountries, both of which had professed a desire to accelerate the process of bilateral integration. In1986, Brazil and Argentina signed the Economic Cooperation and Integration Program (PICE), aformal program for economic and political cooperation. The goal of PICE was to expand anddiversify bilateral trade between the two countries on a sector-by-sector basis. This program aimedat achieving a common market based on the principles of “gradualness,” “flexibility,” and“equilibrium.” The intention was to move progressively toward greater entrepreneurial activityallowing new competitive conditions and supporting legislation. During this phase, the twocountries signed protocols with respect to biotechnology, capital goods, nuclear cooperation, andthe wheat, steel, and automotive industries.
In 1988, Brazil and Argentina signed the Integration, Cooperation, and Development Treaty withthe objective of establishing a common market in ten years. In July 1990, the two countries signedthe Buenos Aires Act which drastically moved up the schedule to establish a common market to fourand a half years with a target date of December 1994. A month later (August 1990), both Uruguayand Paraguay joined the proposed integration scheme. On March 26, 1991, the foreign ministersof Argentina, Brazil, Paraguay, and Uruguay signed the Treaty of Asunción, formally establishingMERCOSUR.
3
The Treaty of Asunción
The main objective of the Treaty of Asunción was the establishment of a Common Market whichwas to be characterized by: (1) free circulation of goods, services, and factors of production amongmember countries, (2) common external tariffs among member countries, and (3) macroeconomicpolicy coordination among member countries. The Treaty created the Common Market Council(CMC) and the Common Market Group (CMG) to administer and implement the Treaty. The CMCis the highest authoritative body of MERCOSUR, consisting of a minister of economics and aminister of foreign relations from each member country. This council was given the authority toestablish general policy and guidelines for the transitional period of 1991 to 1995.
The CMG, on the other hand, assists the CMC in the technical aspects of negotiation processes. TheCMG is responsible for the executive functions of MERCOSUR and consists of four permanent andfour alternating representatives from the ministry of foreign relations, the ministry of economics,and the Central Bank in each member country. The activities of the CMG are coordinated by theministries of foreign affairs of the four countries. In June 1992, the CMG met in Las Lenas,Argentina, an important market for the integration process, to establish a process for achieving theobjectives of the Treaty of Asunción by the agreed upon date of January 1995.
The Treaty of Asunción created 10 subgroups under the responsibility of the CMG which was laterexpanded to 11 subgroups: (1) international trade, (2) customs issues, (3) technical measures, (4)monetary and fiscal policies, (5) land transportation, (6) maritime transportation, (7) industry andtechnology policy, (8) agricultural policy, (9) energy policy, (10) macroeconomic policy, (11) laborrelations, employment and social security.
The schedule of tariff reductions under the Treaty is progressively linear and automatic. Tariffreductions began immediately with the signing of the Treaty. The objective was to attain a zeroaverage tariff on imports from member countries into Argentina and Brazil by the end of December1994 with tariff cuts to occur on January 1 and July 1 of each year. Uruguay and Paraguay weregiven an additional year. The biannual tariff reduction schedule for Brazil and Argentina,respectively, was as follows: (1) 1991: 40% and 47%, (2) 1992: 54% and 61%, (3) 1993: 68% and75%, (4) 1994: 82% and 89%, and (5) 1995: 100%.
The Treaty of Asunción also allowed member countries to exempt a number of products from tariffreduction. The number of exempted products was to be gradually reduced, however, with theobjective of eliminating all such exemptions for Argentina and Brazil by December 1994. Again,Paraguay and Uruguay were given an additional year to eliminate exemptions for all products.Brazil originally exempted 324 products from the required tariff reductions while Argentina,Paraguay, and Uruguay exempted 394, 439, and 960 products, respectively. The number of itemsexempted from the tariff reductions by Argentina and Brazil was to be cut initially by 20% and thenby 20% at the end of each year from 1991 through 1994. In the case of Paraguay and Uruguay, theoriginal cut in exempted items was to be only 10%, followed by another 10% cut at the end of 1991with cuts of 20% at the end of each subsequent year through 1995.
4
The Treaty also established other important rules for the transition period, including provisionalrules of origin, a system of resolving conflicts, and a system of safeguards. The “accession” clauseof the Treaty allows members of ALADI to petition for membership after five years from theinitiation of MERCOSUR. However, countries that participated in the negotiations of a previoussub-regional or extra-regional integration scheme will be able to petition for membership prior tothe stipulated time frame.
Implementation of the Treaty of Asunción
Integration toward a common market, as is the goal of MERCOSUR, is usually a sequential processthat can be seen as occurring in four stages among member countries: (1) preferential internal tariffs,(2) free trade, (3) customs union, and (4) common market. In the first stage, participating countriescharge lower tariffs on imports from member countries. The preference accorded imports ofmember countries, however, involves lower, but not necessarily zero tariffs and does not necessarilyextend to 100% of all products. A free trade area is the second stage of economic integration andinvolves complete elimination of all tariffs and other trade barriers on all goods and services amongmember countries. Each country, however, retains its own external trade barriers with membercountries. The third stage of economic integration is a customs union which is a free trade area withharmonized external trade barriers by all member countries. In the fourth stage, a common marketis achieved when a customs union allows free movement of labor and capital among membercountries.
As of January 1, 1995, the target date for complete implementation of a common market among thefour member countries, only the first stage of integration (preferential internal tariffs) had beenclearly achieved. By that date, a free trade area between Brazil and Argentina extended to 99% ofall but the exempted products. Harmonization of external tariffs has also proved more difficult thanexpected. A common external tariff varying from 0% to 20% on more than 85% of all products(approximately 8,500 items) traded by the four countries with non-member countries was ultimatelynegotiated. A number of products was also exempted from the common external tariff requirement.Argentina, Brazil, and Uruguay will maintain a maximum of 300 items on their respective commonexternal tariff exemption lists through January 1, 2001, including capital goods as well asinformation and telecommunication products. Paraguay, however, received more favorable treatmentand was allowed to maintain 399 items on its exemption list.
Also, given the differences in the industrial structures of the four countries, the levels of externaltariffs required to be adopted by the MERCOSUR countries also differed. The differences werelarger in the areas of capital goods and telecommunications. Argentina, Paraguay and Uruguayaccepted the common external tariff level proposed by Brazil for capital goods (14%) andtelecommunications (16%) for implementation in the years 2001 and 2006, respectively.
The Trade Effects of MERCOSUR
5
The integration goals of the Treaty of Asunción were clearly ambitious. Because MERCOSUR hasnot yet reached common market status as called for in the Treaty, a revised schedule of transitionwill likely be established and the period of transition extended. Although the Treaty objectives havenot yet been completely achieved, a significant degree of economic integration has been achievedwhich has had an impact on the internal and external trade of MERCOSUR countries.
General Trade Effects
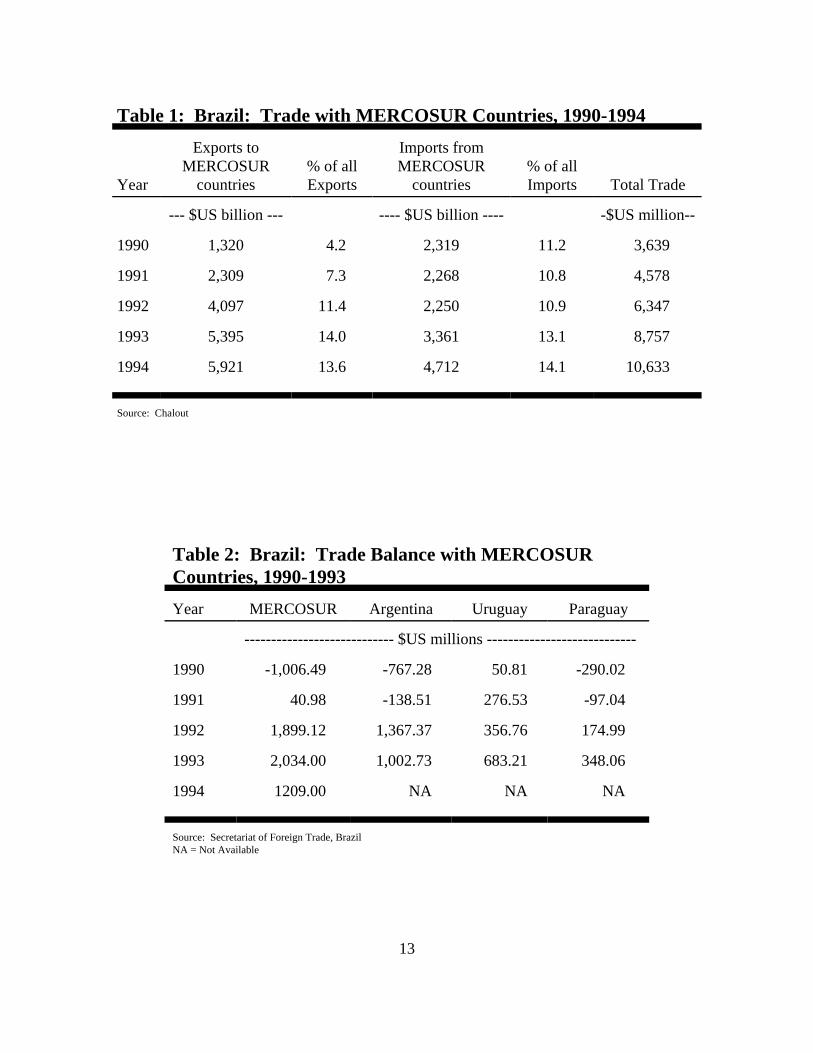
The pre-MERCOSUR (1990) total trade (exports plus imports) of Brazil with other MERCOSURcountries amounted to US$3.64 billion (Table 1). By 1994, the total trade of Brazil with thosecountries jumped by 192% to US$10.63 billion. The share of Brazilian exports destined forMERCOSUR countries increased from 4.2% in 1990 to 13.6% in 1994. The share of Brazilianimports originating from MERCOSUR countries increased from 11.2% to 14.1% over the sameperiod. Brazilian exports to MERCOSUR countries increased by 348.6% while imports increasedby only 103.2% over that period. Consequently, the Brazilian trade balance with MERCOSURcountries switched from a deficit of over US$1.0 billion to about US$2.1 billion in 1993 and aboutUS$1.2 billion in 1994 (Table 2).
Most of the change in Brazilian trade with MERCOSUR countries has come from increased trade,particularly exports, with Argentina. During the MERCOSUR transition period, Argentina becamethe second biggest market for Brazilian exports, accounting for 10% of Brazilian exports in 1994.The U.S. takes 20% of Brazilian exports and continues to be the largest importer of Brazilianproducts (Chalout, 1995).
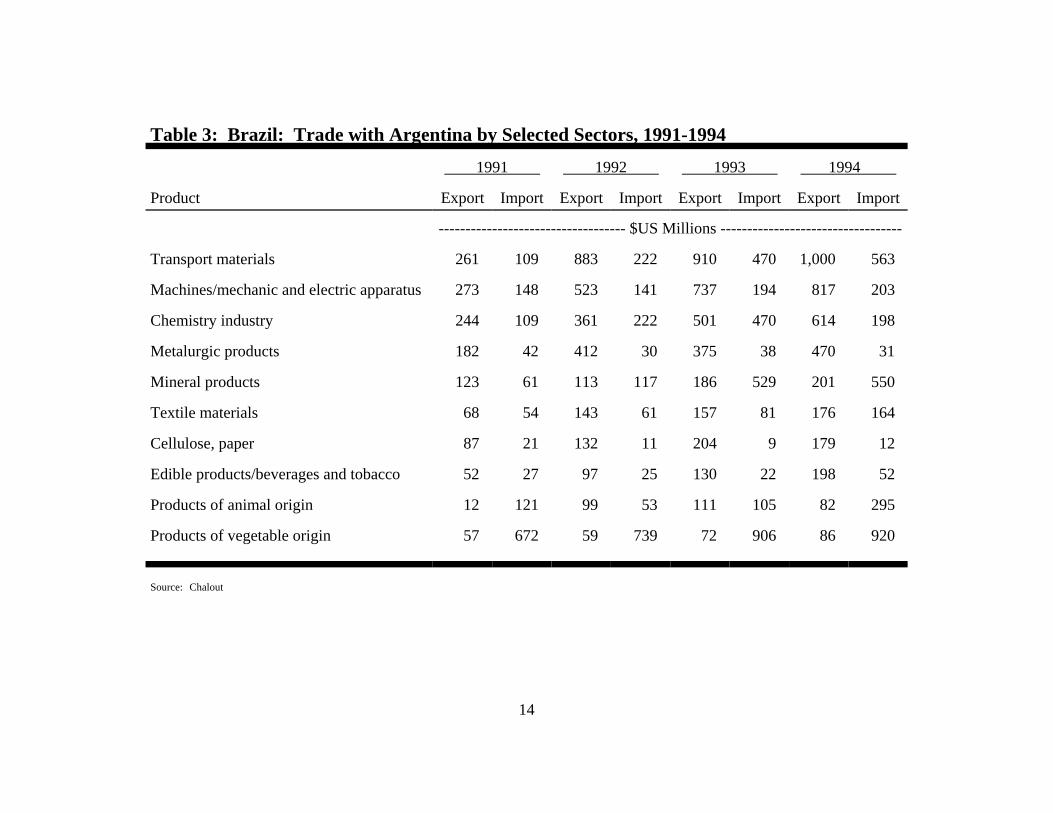
The products exported by Brazil to MERCOSUR countries are highly diversified and are primarilyvalue-added products such as automotive goods, capital goods, and chemical industry products. Ingeneral, production and trade between the two largest of the MERCOSUR countries have been quitecomplementary. Argentina has tended to export agricultural products and minerals to Brazil whileBrazil has tended to export industrial, non-agricultural products to Argentina (Table 3). Brazilianexports of animal- and vegetable-origin products to Argentina were only US$82 million and US$86million, respectively, in 1994 while imports of such products by Brazil from Argentina were muchhigher at US$295 million and US$920 million, respectively.
According to Chalout and Souto, about 60% of the value of Brazilian imports is wheat. Jank (1992)indicates that the markets for some Brazilian agricultural products have been particularly affectedby the formation of MERCOSUR, including those for wheat, corn, rice, barley, powdered milk,cheese, grapes, peaches, pears, plums, garlic, potatoes, onions, beef, leather, soybeans, andsunflower seeds and products.
MERCOSUR has had an impact on the agricultural markets of the other member countries, as well.For example, Paolino finds that the price of chicken in Argentina fell due to the importation ofBrazilian poultry products while the Brazilian chicken industry has experienced a price increase.Paolino also forecasts that the Argentine citrus sector will increase exports of fresh products and thatthe dairy industry in Paraguay will need to become more efficient to remain economically
6
competitive. Brazil is increasing its research efforts in order to increase its competitiveness incotton. Relative to Brazil and Paraguay, Uruguay is becoming more competitive in the wheatmarket. Part of the increased competitiveness is due to better cultivation methods.
Effects on World Agricultural Trade
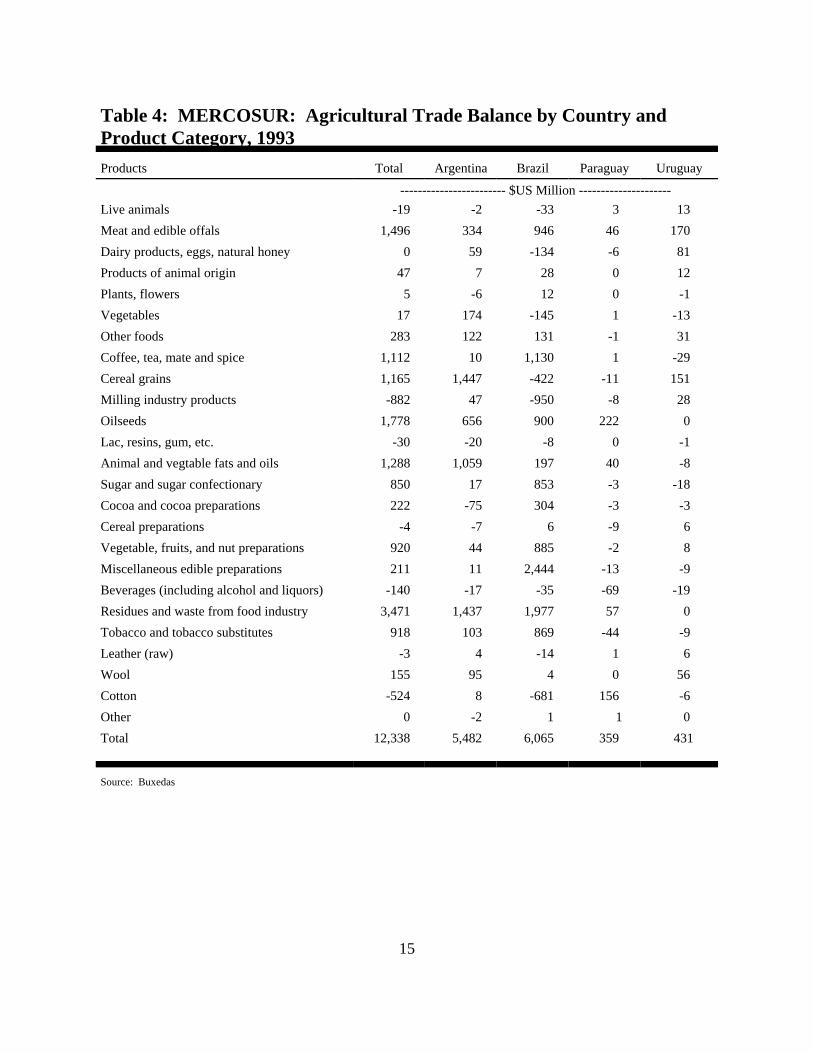
MERCOSUR member countries are net exporters of agricultural products to the world market. In1993, MERCOSUR countries jointly exported US$17.0 billion and imported US$4.7 billion ofagricultural products for a trade balance of US$12.3 billion (Table 4). The MERCOSUR tradebalance was positive for meat, coffee, tea, mate and spices, cereal grains, oilseeds, sugar, vegetables,fruits and nuts, animal and vegetable oils, sugar, cocoa, tobacco, and food industry residue used foranimal feeds. On the other hand, the MERCOSUR trade balance is negative for live animals, millingindustry products (e.g., wheat flour), resins and gums, cereal preparations, beverages, and cotton.
While the agricultural exports of Argentina and Paraguay tend to be concentrated in a relatively fewproduct groups, Brazilian exports tend to be more diversified. For Argentina, Brazil, and Paraguay,oilseed and oilseed product exports (soybeans, sunflower seeds, vegetable oils, and proteinconcentrates) are quite profitable. Major Paraguayan agricultural exports are soybeans and soybeanproducts and cotton products. Beef is the most important export for Uruguay and the third mostimportant export for other countries. Cereal grains (wheat, rice, etc.) are the most importantagricultural products imported by Argentina and the second most important for Uruguay. Coffeeexports are only important for Brazil. Also, exports of other products such as orange juice, tobacco,and sugar are also important to Brazil. Cotton has been a traditionally important export for Paraguay(Buxedas,1995).
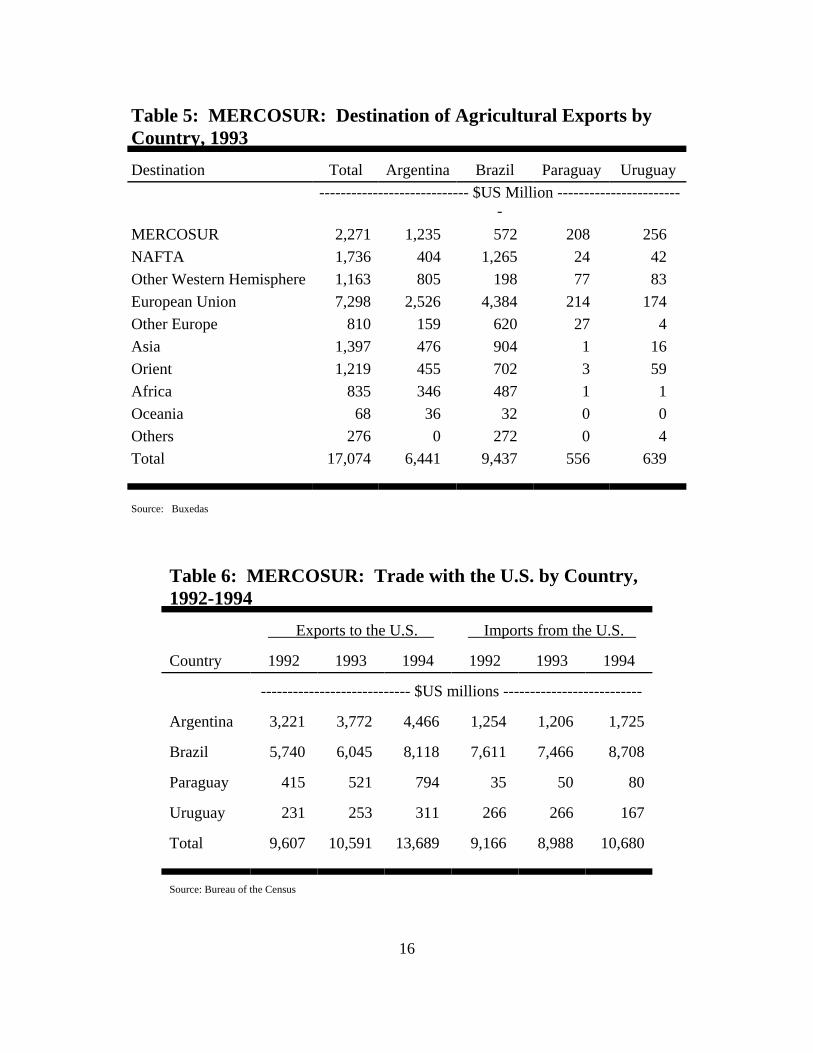
The agricultural exports of MERCOSUR countries are mainly destined for the Atlantic coastmarkets of Europe and the Western Hemisphere (Table 5). Exports to markets in the Pacific are ata competitive disadvantage compared to those of large agricultural countries like the U.S., Australia,and New Zealand which are geographically better able to benefit from such exports and which havea greater knowledge and experience level in those markets (Buxedas,1995). The European Unionis the largest importer of MERCOSUR agricultural exports, accounting for 42% of all MERCOSURagricultural exports.
Effects on U.S- MERCOSUR Trade
Trade between the U.S. and MERCOSUR countries (exports plus imports) amounted to aboutUS$25 billion in 1994 (Table 6). Brazil accounted for 59% of MERCOSUR exports to the U.S. and81% of MERCOSUR imports from the U.S. Trade between the U.S. and MERCOSUR has alsoincreased in recent years. MERCOSUR exports to the U.S. increased by 42% between 1992 and1994 while MERCOSUR imports from the U.S. increased by 16.5% over the same period.
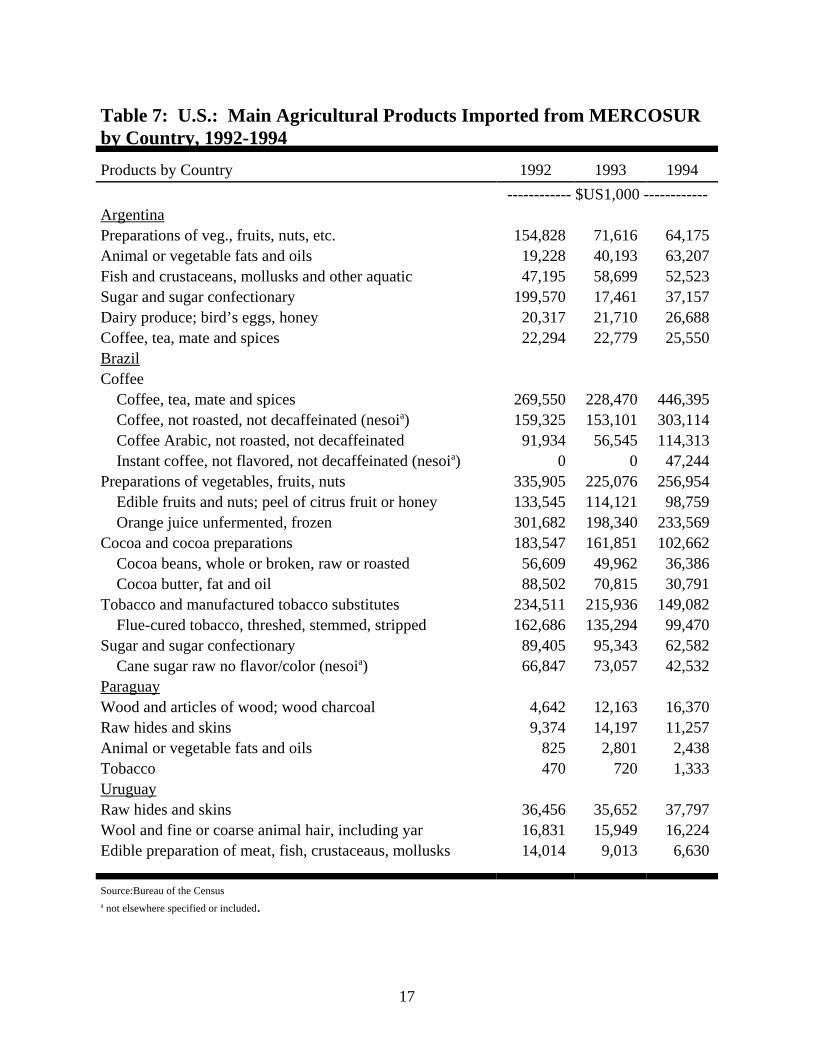
Major U.S. agricultural imports from Argentina include sugar and preparations of vegetables, fruits,and nuts (Table 7). From Brazil, U.S. agricultural imports include orange juice, coffee, tobacco, andcocoa. The major U.S. agricultural import from both Paraguay and Uruguay is raw cattle hides and
7
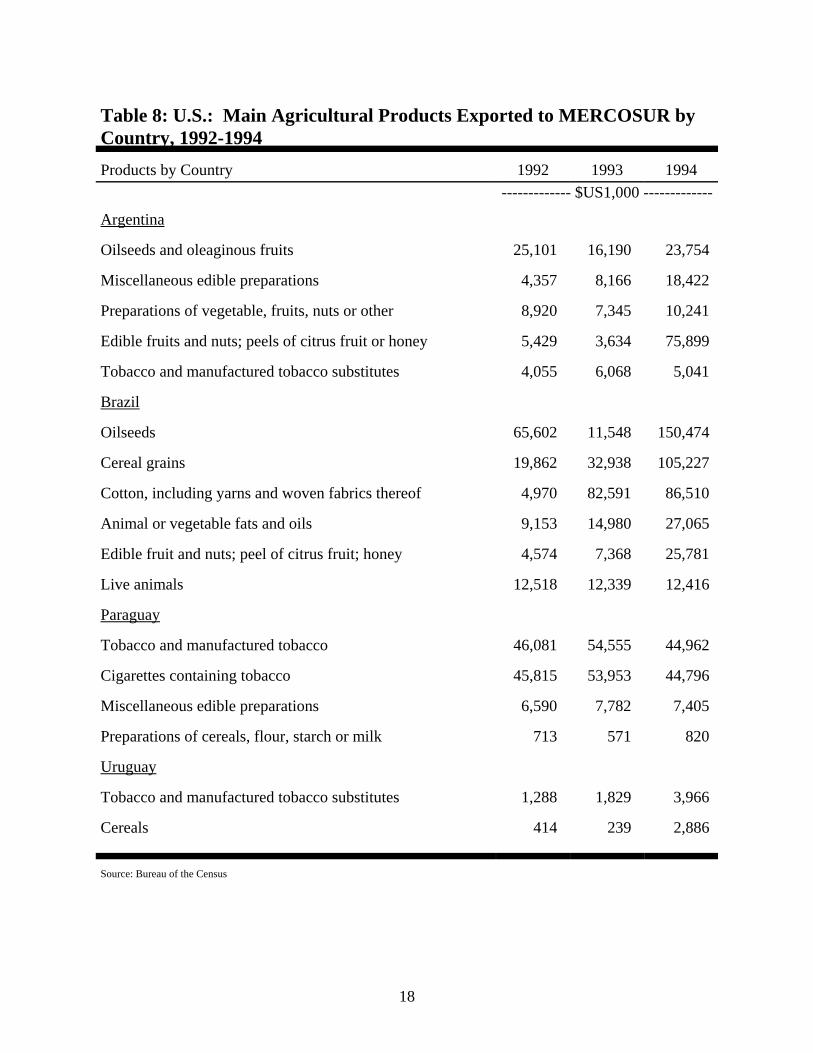
skins. The main U.S. exports to Argentina include fruits, nuts, and oilseeds (Table 8). To Brazil,the U.S. exports primarily oilseeds, cereal grains, and cotton. Primary U.S. exports to both Paraguayand Uruguay include tobacco and tobacco products.
Effects on MERCOSUR Grain Markets
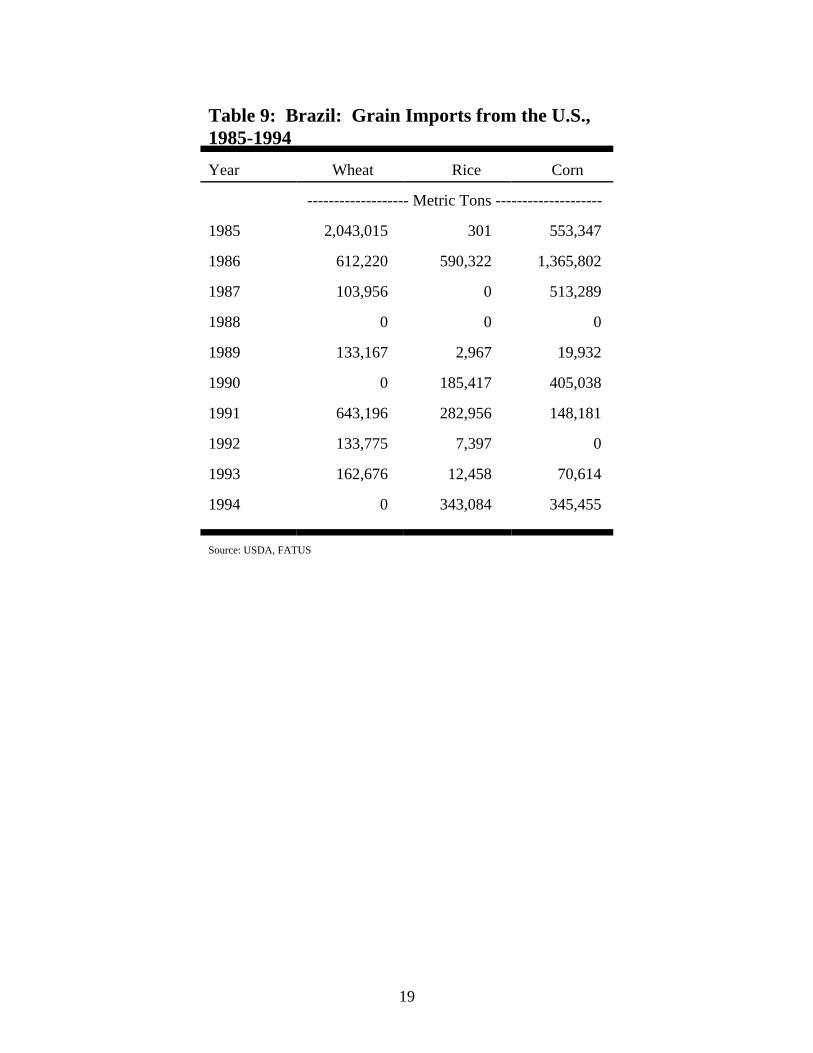
Economic integration among the MERCOSUR countries has had a significant impact on grainmarkets in member countries. Internal import tariffs on grain were reduced to 0% over the last fiveyears. Also, Argentina, Paraguay, and Uruguay have gained preferential access to the largeBrazilian wheat, corn, and rice import markets. As a consequence, Brazilian imports of wheat, rice,and corn from MERCOSUR countries have increased.
Before 1985, MERCOSUR countries accounted for 10% to 30% of the total grain imported byBrazil. By the early 1990s, these countries accounted for about 60% of Brazilian grain imports(Jank, 1994). Brazil imported about 4.8 mmt (million metric tons) of wheat, 1 mmt of rice, and 0.5mmt of corn from its MERCOSUR neighbors. Argentina is now the most important source ofimported wheat for Brazil, displacing imports from the U.S. (Table 9).
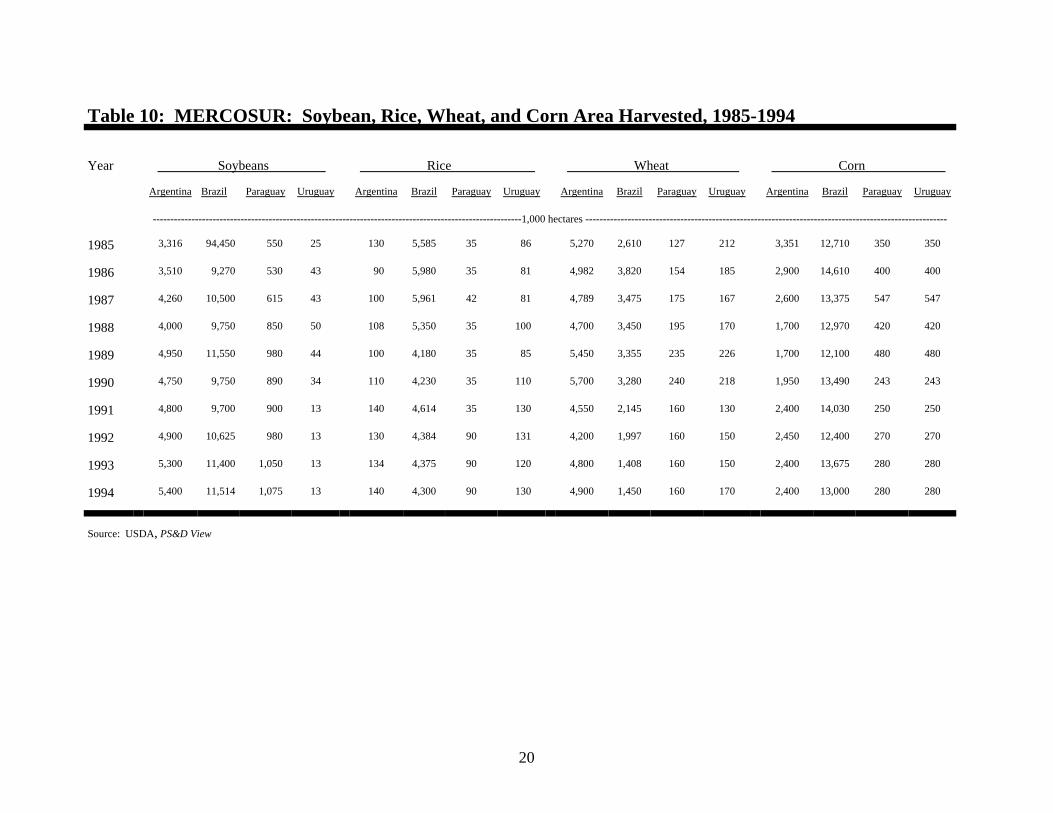
The area planted to soybeans increased 22%, 63%, and 95% in Brazil, Argentina, and Paraguay,respectively, from 1985 to 1994 (Table 10). Argentina, Uruguay, and Paraguay have all experiencedan increase in rice area over the same period.
In Brazil, a rapid 1.86% annual rate of population growth has out paced the growth of grainproduction necessitating increased grain imports (Jank, 1994). According to Jank, about 7,700births occur in Brazil each day. The Brazilian grain production crisis became even more severe in1994/95 when production reached only about 80 mmt. The forecast for 1995/96 is even lower grainproduction at only 75 mmt.
According to CONAB (Companhia Nacional de Abastecimento), the Brazilian wheat area harvestedin 1994-95 decreased 29% compared to a year earlier. Wheat consumption hit 8.5 mmt in 1994-95while production reached only 2 mmt compared to 6 mmt in 1987. The 6 mmt of wheat importedby Brazil in 1994-95 came from Argentina (4.3 mmt), Canada (1.05 mmt), Uruguay (0.36 mmt), andParaguay (0.10 mmt).
Brazilian soybean area is also expected to decline by about 10.7% in 1995-96 to 22 mmt comparedto 25.93 mmt a year earlier. Rice area in Brazil is also expected to decline by about 8.4% in 1995-96. The Brazilian price of rice was 31% lower in 1995 than the five-year average of 1990 to 1994.The corn recently exported by Argentina to the Brazilian northeast region was more pricecompetitive than corn from the Brazilian central west region. Brazilian corn area is expected todecline by 7.9% in 1995-96.
Although Brazil is still the largest producer of soybeans, corn, and rice among MERCOSURcountries, Argentina is the largest producer of wheat and second largest producer of soybeans, corn,and rice. For many products, the cost of production in Argentina is lower than in Brazil because of
8
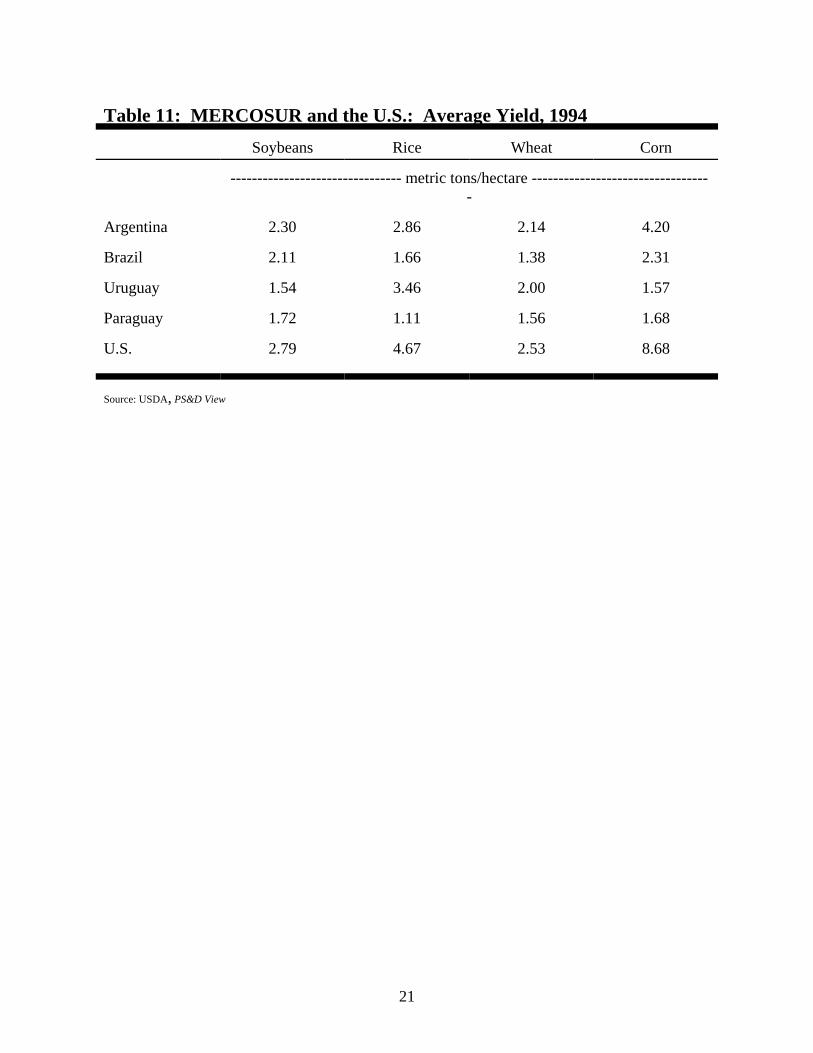
the highly fertile land and good climatic conditions in the Pampas region. Argentine productioncosts are US$136/ton for soybeans, US$179/ton for rice, US$103/ton for wheat, and US$86/ton toUS$109/ton for corn. In comparison, Brazilian costs are US$175/ton for soybeans, US$151/ton forrice, US$215/ton for wheat, and US$150/ton to US$166/ton for corn (Stulp,1992). Also, Braziliancorn yields are almost half those of Argentina and one third of those in the U.S. (Table 11).
Argentine agricultural production is concentrated in the Pampas region which makes up 18.7% ofthe land area but accounts for 90% of the country’s cereal and oilseed production, 70% of the meatproduction, and 88% of the milk production. A recent study concludes that despite realcompetitiveness and the natural fertility of Argentine soils, opportunities for increased productionin Argentina are limited (Wedmann). The study suggests that Argentine agricultural production ishighly unresponsive to price changes and that future production increases will depend on the rateof new technology adoption to improve yields and hold down costs of production. Waterdeficiencies and higher production costs limit the opportunities for the expansion of production tonon-traditional areas in Argentina. In the case of soybeans, for example, the expansion of the areaunder soybean production has displaced wheat production. Soybeans also compete with corn andlivestock for the use of the Pampas land.
Conclusions
Although the goal of establishing a common market by 1995 was not reached, significant progressin trade among the MERCOSUR member countries has occurred. In fact, by 1995, after havingcompleted a four-year transition period, MERCOSUR functions as an imperfect customs union withmore than 85% of the goods produced in non-member countries being subject to a common tariffthat ranges from zero to 20%.
The commercial success of MERCOSUR has exceeded the most optimistic predictions for the early1990s. MERCOSUR has achieved international recognition as the third largest trading block in theworld after the European Union and NAFTA. The trade volume among MERCOSUR membercountries has practically tripled over the last five years. The integration between Argentina andBrazil has laid important groundwork for further market integration in that part of South America.In 1994, trade between Brazil and Argentina exceeded US$7 billion, a record for trade between twocountries in South America. Argentina has become Brazil’s second largest export market.
The goal of economic integration is to increase the level of economic development in allparticipating countries. Economic integration, however, is also painful, forcing a restructuring ofeach participating country's economic activities. When a country accedes to the market demandsof a free trade association, the country also accepts trade regulations that are often quite differentfrom those that have traditionally governed the country’s trade. In turn, the new trading regimeforces new standards of competition. Although the economy of a given participating country willlikely benefit, only those sectors with a comparative advantage will benefit in comparison with thesame sectors in the other participating countries. Those sectors that find themselves at acomparative disadvantage will suffer declines in productive activity. Those negatively affected by
9
the resulting short-run adjustments in the patterns of production and trade among participatingcountries often require some intervention to ease the pains of adjustment.
Although MERCOSUR is an effort to establish a cooperative and complementary economic region,most agricultural products of member countries have encountered fierce competition withinMERCOSUR markets. Agricultural products and agricultural industries in which Brazil was onceconsidered less competitive in comparison to the highly specialized sectors in Argentina are nowexperiencing a considerable increase in exports. Brazil has experienced growth in animal and cropproducts and has exhibited major advances in the processed food sector . On the other hand,Argentina has distinguished itself in the production and export of primary agricultural goods.Changes in the net agricultural trade flows between Brazil and Argentina have definitely benefitedArgentina. In the case of grains, Brazil has become an importer giving Argentina, Uruguay andParaguay preferential access to its large market. A traditional importer of barley and wheat, Brazilhas also become an importer of rice and corn. The Brazilian regions most affected by the importsof grain are Rio Grande do Sul and Paraná, the major grain producing regions in Brazil.
The increasing economic integration of Argentina, Brazil, Paraguay, and Uruguay throughMERCOSUR does not resolve all trade problems among those four Latin American countries.Economic integration has been a slow process. If MERCOSUR is ever to become a true commonmarket, a number of important - and politically difficult - challenges remain, including theelimination of all remaining tariff and non-tariff trade barriers, the granting of free movement toproductive factors among member countries, the harmonization of macroeconomic policies, and thecoordination of national legislation. The difficulties in economic coordination and harmonizationamong MERCOSUR members are exacerbated by the differences in the political systems amongmember countries.
Despite the challenges faced by the governments involved in the economic integration of the region,MERCOSUR has strengthened the relationship of member countries with world markets. The U.S.,for example, has increased its trade with MERCOSUR countries.
Without question, the MERCOSUR experience has demonstrated that economic development andstabilization within a Latin American region can be achieved through free trade and economiccooperation among countries. Pressures are mounting to expand MERCOSUR to other countriesin Latin America. On June 25, 1996, Chile signed a free trade agreement with MERCOSUR. Chiledid not join the customs union because its average external tariff of 11% is lower than that ofMERCOSUR. Bolivia and Peru are pushing for a free trade area in South America. The objectivewould be to establish the Association of South American Free Trade (ALCSA) by the year 2005.
The likelihood of the success of ALCSA depends above all on the continued progress ofMERCOSUR. The key to this progress is the continued economic growth of Brazil. With apopulation of 150 million and a GDP of nearly US$500 billion, the Brazilian economy is a heavilyweighted factor in the success and growth of both MERCOSUR and South America. As well,MERCOSUR will be critical in establishing a Western Hemispheric free trade area by the year 2005as agreed to in the Summit of the Americas in December of 1994.
10
With a united market, South American countries would be able to better control relations with NorthAmerica. Although NAFTA and MERCOSUR are similar in some respects, MERCOSUR is moreambitious with its long term plans for developing truly integrated economies of the membercountries. The ultimate accomplishment of both NAFTA and MERCOSUR may be not onlyincreased trade but also greater economic, political, social, and cultural integration among allcountries of the Western Hemisphere.
11
References
Amorin, A.B.N., "O Mercosul e a Integração Latino Americana" Boletim de Integração Latino-Americana 14:62-65, July/September 1994.
Banco do Brasil, Ensaio do Comercio Exterior 10:24-25, January/February 1995.
Buxedas, M., "La Ronda Uruguay y el Comercio de Productos Agropecuarios del MERCOSUR,"presented at the session “Questões Agroalimentares e Integração Regional e Sub-Regionaldepois da Rodada Uruguay do GATT” of the International Conference União Europeia,Mercosul e NAFTA: Confronto de Experiencias, Rio de Janeiro, Brazil, May 1995.
Chalout, Y., "Mercosul: Política Agrícola do Estado e Inciativa Privada," presented at 8thInternational Rural Sociological Congress, Pennsylvania State University, August 1992.
Chalout, Y. and Souto, C.S. "Relações Estado, Mercosul e Agroindustria," in Relume-Dumare, ed.A Politica da Tecnologia Agricola, Rio de Janeiro, Brazil (in press).
Companhia Nacional de Abastecimento (CONAB), Previsaõ e Acompanhamento de Safras, vol 20,no. 1, Brasilia, Brazil, October 1995.
Godoy, D.L., “O Mercado Comun do Sul na otica empresarial," Boletim de Integração Latino-Americana 14:62-65, July-September 1994.
Henz, R., "Situaçao das Negociacões Agricolas no Mercosul," Revista de Politica Agricola 3:29-34,July/August/September 1994.
Jank, M.S., "A Importancia do Setor Agroindustrial na Integração do Cone Sul: as cadeiassensiveis,” Working Paper, Instituto de Estudos Avançados, Universidade do São Paulo,September 1992.
Jank, M.S., "O Brasil e o Comercio Mundial de Grãos,” in M.H. Fagundes, ed., Politicas Agricolase o Comercio Mundial, IPEA, Estudos de Politica Agricola No. 23, Brasilia, Brazil, pp. 381-430, 1994.
Junqueira, P.C., “Considerações Sobre a Implantação do Mercosul na area agricola,” WorkingPaper, Instituto de Estudos Avançados, Universidade do São Paulo, 1992.
Manzetti, L., “The Political Economy of MERCOSUR,” Journal of Interamerican Studies andWorld Affairs 35:101-140, 1993.
Marques, R.L.R., "O Mercosul Real," Boletim de Integração Latino-Americana 14:12-15,July/September 1994.
12
Paolino, C., "MERCOSUR: Políticas Agrícolas e Integración Agropecuaria - Resumen do los OchoEstudios de Casos," Documento No. 2, Organizacion de Las Naciones Unidas para laAgricultura y la Alimentación, Montivideo, Uruguay, July 1995.
Stulp, V.J., “Tecnologia, Custos e Competitividade no Mercosul: Caso do trigo, soja, milhoe arroz,”Working Paper, Instituto de Estudos Avançados, Universidade do São Paulo, 1992.
U.S. Department of Agriculture (USDA), “Foreign Agricultural Trade of the United States(FATUS),” Calendar Year Suplement, Economic Research Service, Washington, D.C.,various issues.
U.S. Department of Agriculture (USDA), PS&D View, Economic Research Service, Washington,D.C., 1994
U.S. Department of Commerce (USDOC), National Trade Data Bank, Washington, D.C.,1991-1994.
Weydmann, C.L. “MERCOSUL: Um enfoque geral e de longo-prazo usando o modelo de oferta decusto crescente,” presented at Congresso Brasileiro de Economia e Sociologia Rural,Curitiba, Brazil, 1995.
13
Table 1: Brazil: Trade with MERCOSUR Countries, 1990-1994
Year
Exports toMERCOSUR
countries% of allExports
Imports fromMERCOSUR
countries% of allImports Total Trade
--- $US billion --- ---- $US billion ---- -$US million--
1990 1,320 4.2 2,319 11.2 3,639
1991 2,309 7.3 2,268 10.8 4,578
1992 4,097 11.4 2,250 10.9 6,347
1993 5,395 14.0 3,361 13.1 8,757
1994 5,921 13.6 4,712 14.1 10,633
Source: Chalout
Table 2: Brazil: Trade Balance with MERCOSURCountries, 1990-1993Year MERCOSUR Argentina Uruguay Paraguay
---------------------------- $US millions ----------------------------
1990 -1,006.49 -767.28 50.81 -290.02
1991 40.98 -138.51 276.53 -97.04
1992 1,899.12 1,367.37 356.76 174.99
1993 2,034.00 1,002.73 683.21 348.06
1994 1209.00 NA NA NA
Source: Secretariat of Foreign Trade, BrazilNA = Not Available
14
Table 3: Brazil: Trade with Argentina by Selected Sectors, 1991-1994
1991 1992 1993 1994
Product Export Import Export Import Export Import Export Import
----------------------------------- $US Millions ----------------------------------
Transport materials 261 109 883 222 910 470 1,000 563
Machines/mechanic and electric apparatus 273 148 523 141 737 194 817 203
Chemistry industry 244 109 361 222 501 470 614 198
Metalurgic products 182 42 412 30 375 38 470 31
Mineral products 123 61 113 117 186 529 201 550
Textile materials 68 54 143 61 157 81 176 164
Cellulose, paper 87 21 132 11 204 9 179 12
Edible products/beverages and tobacco 52 27 97 25 130 22 198 52
Products of animal origin 12 121 99 53 111 105 82 295
Products of vegetable origin 57 672 59 739 72 906 86 920
Source: Chalout
15
Table 4: MERCOSUR: Agricultural Trade Balance by Country andProduct Category, 1993Products Total Argentina Brazil Paraguay Uruguay
------------------------ $US Million ---------------------Live animals -19 -2 -33 3 13 Meat and edible offals 1,496 334 946 46 170 Dairy products, eggs, natural honey 0 59 -134 -6 81 Products of animal origin 47 7 28 0 12 Plants, flowers 5 -6 12 0 -1 Vegetables 17 174 -145 1 -13 Other foods 283 122 131 -1 31 Coffee, tea, mate and spice 1,112 10 1,130 1 -29 Cereal grains 1,165 1,447 -422 -11 151 Milling industry products -882 47 -950 -8 28 Oilseeds 1,778 656 900 222 0 Lac, resins, gum, etc. -30 -20 -8 0 -1 Animal and vegtable fats and oils 1,288 1,059 197 40 -8 Sugar and sugar confectionary 850 17 853 -3 -18 Cocoa and cocoa preparations 222 -75 304 -3 -3 Cereal preparations -4 -7 6 -9 6 Vegetable, fruits, and nut preparations 920 44 885 -2 8 Miscellaneous edible preparations 211 11 2,444 -13 -9 Beverages (including alcohol and liquors) -140 -17 -35 -69 -19 Residues and waste from food industry 3,471 1,437 1,977 57 0 Tobacco and tobacco substitutes 918 103 869 -44 -9 Leather (raw) -3 4 -14 1 6 Wool 155 95 4 0 56 Cotton -524 8 -681 156 -6 Other 0 -2 1 1 0 Total 12,338 5,482 6,065 359 431
Source: Buxedas
16
Table 5: MERCOSUR: Destination of Agricultural Exports byCountry, 1993 Destination Total Argentina Brazil Paraguay Uruguay
---------------------------- $US Million ------------------------
MERCOSUR 2,271 1,235 572 208 256 NAFTA 1,736 404 1,265 24 42 Other Western Hemisphere 1,163 805 198 77 83 European Union 7,298 2,526 4,384 214 174 Other Europe 810 159 620 27 4 Asia 1,397 476 904 1 16 Orient 1,219 455 702 3 59 Africa 835 346 487 1 1 Oceania 68 36 32 0 0 Others 276 0 272 0 4 Total 17,074 6,441 9,437 556 639
Source: Buxedas
Table 6: MERCOSUR: Trade with the U.S. by Country,1992-1994
Exports to the U.S. Imports from the U.S.
Country 1992 1993 1994 1992 1993 1994
---------------------------- $US millions --------------------------
Argentina 3,221 3,772 4,466 1,254 1,206 1,725
Brazil 5,740 6,045 8,118 7,611 7,466 8,708
Paraguay 415 521 794 35 50 80
Uruguay 231 253 311 266 266 167
Total 9,607 10,591 13,689 9,166 8,988 10,680
Source: Bureau of the Census
17
Table 7: U.S.: Main Agricultural Products Imported from MERCOSURby Country, 1992-1994Products by Country 1992 1993 1994
------------ $US1,000 ------------ArgentinaPreparations of veg., fruits, nuts, etc. 154,828 71,616 64,175 Animal or vegetable fats and oils 19,228 40,193 63,207 Fish and crustaceans, mollusks and other aquatic 47,195 58,699 52,523 Sugar and sugar confectionary 199,570 17,461 37,157 Dairy produce; bird’s eggs, honey 20,317 21,710 26,688 Coffee, tea, mate and spices 22,294 22,779 25,550 BrazilCoffee Coffee, tea, mate and spices 269,550 228,470 446,395 Coffee, not roasted, not decaffeinated (nesoia) 159,325 153,101 303,114 Coffee Arabic, not roasted, not decaffeinated 91,934 56,545 114,313 Instant coffee, not flavored, not decaffeinated (nesoia) 0 0 47,244 Preparations of vegetables, fruits, nuts 335,905 225,076 256,954 Edible fruits and nuts; peel of citrus fruit or honey 133,545 114,121 98,759 Orange juice unfermented, frozen 301,682 198,340 233,569 Cocoa and cocoa preparations 183,547 161,851 102,662 Cocoa beans, whole or broken, raw or roasted 56,609 49,962 36,386 Cocoa butter, fat and oil 88,502 70,815 30,791 Tobacco and manufactured tobacco substitutes 234,511 215,936 149,082 Flue-cured tobacco, threshed, stemmed, stripped 162,686 135,294 99,470 Sugar and sugar confectionary 89,405 95,343 62,582 Cane sugar raw no flavor/color (nesoia) 66,847 73,057 42,532 ParaguayWood and articles of wood; wood charcoal 4,642 12,163 16,370 Raw hides and skins 9,374 14,197 11,257 Animal or vegetable fats and oils 825 2,801 2,438 Tobacco 470 720 1,333 UruguayRaw hides and skins 36,456 35,652 37,797 Wool and fine or coarse animal hair, including yar 16,831 15,949 16,224 Edible preparation of meat, fish, crustaceaus, mollusks 14,014 9,013 6,630
Source:Bureau of the Censusa not elsewhere specified or included.
18
Table 8: U.S.: Main Agricultural Products Exported to MERCOSUR byCountry, 1992-1994Products by Country 1992 1993 1994
------------- $US1,000 -------------
Argentina
Oilseeds and oleaginous fruits 25,101 16,190 23,754
Miscellaneous edible preparations 4,357 8,166 18,422
Preparations of vegetable, fruits, nuts or other 8,920 7,345 10,241
Edible fruits and nuts; peels of citrus fruit or honey 5,429 3,634 75,899
Tobacco and manufactured tobacco substitutes 4,055 6,068 5,041
Brazil
Oilseeds 65,602 11,548 150,474
Cereal grains 19,862 32,938 105,227
Cotton, including yarns and woven fabrics thereof 4,970 82,591 86,510
Animal or vegetable fats and oils 9,153 14,980 27,065
Edible fruit and nuts; peel of citrus fruit; honey 4,574 7,368 25,781
Live animals 12,518 12,339 12,416
Paraguay
Tobacco and manufactured tobacco 46,081 54,555 44,962
Cigarettes containing tobacco 45,815 53,953 44,796
Miscellaneous edible preparations 6,590 7,782 7,405
Preparations of cereals, flour, starch or milk 713 571 820
Uruguay
Tobacco and manufactured tobacco substitutes 1,288 1,829 3,966
Cereals 414 239 2,886
Source: Bureau of the Census
19
Table 9: Brazil: Grain Imports from the U.S.,1985-1994Year Wheat Rice Corn
------------------- Metric Tons --------------------
1985 2,043,015 301 553,347
1986 612,220 590,322 1,365,802
1987 103,956 0 513,289
1988 0 0 0
1989 133,167 2,967 19,932
1990 0 185,417 405,038
1991 643,196 282,956 148,181
1992 133,775 7,397 0
1993 162,676 12,458 70,614
1994 0 343,084 345,455
Source: USDA, FATUS
20
Table 10: MERCOSUR: Soybean, Rice, Wheat, and Corn Area Harvested, 1985-1994
Year Soybeans Rice Wheat Corn
Argentina Brazil Paraguay Uruguay Argentina Brazil Paraguay Uruguay Argentina Brazil Paraguay Uruguay Argentina Brazil Paraguay Uruguay
---------------------------------------------------------------------------------------------------------1,000 hectares -------------------------------------------------------------------------------------------------------
1985 3,316 94,450 550 25 130 5,585 35 86 5,270 2,610 127 212 3,351 12,710 350 350
1986 3,510 9,270 530 43 90 5,980 35 81 4,982 3,820 154 185 2,900 14,610 400 400
1987 4,260 10,500 615 43 100 5,961 42 81 4,789 3,475 175 167 2,600 13,375 547 547
1988 4,000 9,750 850 50 108 5,350 35 100 4,700 3,450 195 170 1,700 12,970 420 420
1989 4,950 11,550 980 44 100 4,180 35 85 5,450 3,355 235 226 1,700 12,100 480 480
1990 4,750 9,750 890 34 110 4,230 35 110 5,700 3,280 240 218 1,950 13,490 243 243
1991 4,800 9,700 900 13 140 4,614 35 130 4,550 2,145 160 130 2,400 14,030 250 250
1992 4,900 10,625 980 13 130 4,384 90 131 4,200 1,997 160 150 2,450 12,400 270 270
1993 5,300 11,400 1,050 13 134 4,375 90 120 4,800 1,408 160 150 2,400 13,675 280 280
1994 5,400 11,514 1,075 13 140 4,300 90 130 4,900 1,450 160 170 2,400 13,000 280 280
Source: USDA, PS&D View
21
Table 11: MERCOSUR and the U.S.: Average Yield, 1994Soybeans Rice Wheat Corn
-------------------------------- metric tons/hectare ----------------------------------
Argentina 2.30 2.86 2.14 4.20
Brazil 2.11 1.66 1.38 2.31
Uruguay 1.54 3.46 2.00 1.57
Paraguay 1.72 1.11 1.56 1.68
U.S. 2.79 4.67 2.53 8.68
Source: USDA, PS&D View