membrane as air diffuser and solid/liquid...
TRANSCRIPT

i
MEMBRANE AS AIR DIFFUSER AND SOLID/LIQUID SEPARATOR IN A BIOREACTOR FOR DOMESTIC WASTEWATER TREATMENT
by
Kathiravelu Parameshwaran
A thesis submitted in partial fulfilment of the requirements for degree of Master of Engineering. Examination committee Dr. C. Visvanathan (Chairperson) Dr.-Ing. Heinz Eckhardt Dr. Sompol Boonthanon Nationality Sri Lankan Previous Degree B.Sc.Eng. (Civil Engineering) University of Peradeniya Peradeniya, Sri Lanka Scholarship Donor Swedish International Development Cooperation
Agency (Sida)
Asian Institute of Technology School of Environment, Resources and Development
Bangkok, Thailand August 1997
ii
Acknowledgement
The author first wish to express his profound gratitude and sincerest appreciation to his advisor Dr. C. Visvanathan for his persistent guidance, invaluable suggestions, encouragement and friendly discussions all of which enable the author to accomplish this study.
Author also wish to thank specially his examination committee consisting of Dr.-Ing.
Heinz Eckhardt and Dr.Sompol Boonthanon for their time and valuable comments. Thanks also extended to Prof. Roger Ben Aim of INSA, Toulouse, France for his valuable assistance during the initial part of this study.
Sincere appreciation is extended to Swedish International Development Cooperation
Agency (Sida) for their financial support for the graduate study and the additional research grant for this study. Sincere gratitude extended to Memtec Ltd, Australia specially to Mr. Robert T. Wale, Dr. Paul Khoo and Mr. Warren Johnson for the equipment support and the valuable technical information during this study.
The assistance and cooperation extended by the staffs of the Environmental
Engineering Program is greatly acknowledged. Thanks also extended to his classmates specially the thesis group of Dr. C. Visvanathatn, who have helped in one way or another. Sincere appreciation goes to all his friends who make the life in AIT enjoyable and memorable. Special words to his wife, for her enduring love and assistance and to his son who missed a lot of love and care. Finally the author dedicate this small piece of work to his beloved father, mother and sister, whose unceasing support, encouragement and scarifies make him success in his every efforts.

iii
Abstract
The possibility of using microfiltration hollow fiber membrane modules as air diffusers and solid/liquid separator in an alternative cycle for activated sludge process treating domestic wastewater was studied. The activated sludge system consist of anoxic and oxic zone for better nitrogen removal. Two hollow fiber microfiltration modules with the pore size of 0.2 µm were immersed in a 80 L oxic tank (MBR) to effect the direct solid/liquid separation. Filtration and high pressure air backwashing were employed in an alternative cycle to have improved flux rate. Back washing of membrane with air in turn aerate the activated sludge in the reactor. By doing so, distinct advantages of declogging of membranes as well as aerating reactor contents were achieved simultaneously. In a short term experimental runs, it was found membrane modules are better air diffusers than stone air diffusers. It was also found that the increased back wash air pressure lead to an improved flux rate. In long term experiments, efficiency of membrane coupled bioreactor system at different hydraulic retention times (HRT) of 15, 10, 6 and 3 hours were studied. Wastewater was fed to the anoxic tank which in turn pass into the MBR. Content of the MBR was recycled to anoxic tank to effect denitrification. The average MLSS concentration in the system was varying between 12,000 to 14,000 mg/L and the sludge age in the MBR was maintained at 50 days through out the study. Though the desired HRT could be maintained at 15, 10 and 6 h with a moderate transmembrane pressure only (< 42 kPa) it was not possible in the case of 3 h. After two weeks operation in later case, stable HRT of 8.5 h at 96 kPa transmembrane pressure, could be obtained. Irrespective of the operating conditions, in all experiments COD, BOD, TKN and total nitrogen removal of more than 95, 98, 95 and 80 % respectively were achieved. This study establishes that using hollow fiber membrane capable of air backwashing to solid/liquid separation will lead to a situation of aeration of mixed liquor and declogging of membrane modules simultaneously, so conventional aerators can be eliminated. By using anoxic/oxic system efficient total nitrogen removal also can be achieved.

iv
Table of Contents
Chapter No I
II
Title Title page Acknowledgement Abstract Table of Contents List of Tables List of Figures List of Abbreviations Introduction 1.1 Rationale 1.2 Objectives of the Study 1.3 Scope of the Study Literature Review 2.1 Characteristics of the Domestic Wastewater 2.2 An Overview of Biological Wastewater treatment 2.2.1 Fundamentals of Activated Sludge Process 2.2.2 Fundamentals of Anaerobic Process 2.3 Biological Nutrient Removal 2.3.1 Nitrification 2.3.2 Denitrification 2.3.3 Phosphorus Removal from Wastewater 2.4 Fundamentals of Membrane Filtration 2.5 Microfiltration 2.6 Features of Membrane Application in Biological Wastewater Treatment 2.7 Membrane Technique for Wastewater Treatment 2.8 Application of Membrane Bioreactors in Aerobic Wastewater Treatment 2.8.1 Bioreactors with Membrane in External Circuit 2.8.2 Bioreactors with Submerged Membranes 2.8.3 Plunging Liquid Jet Bioreactor Coupled with Membrane Separation 2.8.4 Membrane as a Air Diffusers and Clarifiers 2.9 Application of Membrane Bioreactors in Anaerobic Wastewater Treatment 2.9.1 Treatment of Domestic Wastewater in Membrane Coupled Anaerobic Process 2.9.2 Treatment of Industrial Wastewater in Membrane Coupled Anaerobic Process
Page
i ii iii iv vii viii x
1 1 3 3
4 4 4 6 6 7 7 10 11 11 12
14 15
19 20 21
27 27
30
31
32

v
III
IV
V
2.9.3 Fouling Characteristics between Inorganic and Organic membrane 2.10 Clogging Mechanisms in Microfiltration 2.11 Declogging Techniques 2.12 Fundamentals of Gas Transfer 2.13 Application of Gas Diffusion Through Membrane Methodology 3.1 Membrane Modules Used in the Experiments 3.2 Measurement of Initial Membrane Resistance 3.3 Measurement of Gas Transfer Efficiency of Aeration Units 3.4 Operating Backwash Air Pressure 3.4.1 Experimental Setup 3.4.2 Process Description 3.5 Long Term Experiments on Membrane Bioreactor 3.5.1 Experimental Setup 3.5.2 Process Description 3.5.3 Monitoring of the MBR and Analytical Methods 3.5.4 Membrane Cleaning Results and Discussion 4.1 Initial Membrane Resistance 4.2 Gas Transfer Efficiency 4.3 Backwash Air Pressure 4.4 Long Term Experiments 4.4.1 Hydraulic Retention Time 4.4.2 Transmembrane Pressure 4.4.3 Permeate Flux 4.4.4 Mode of Operation 4.4.5 Dissolved Oxygen 4.4.6 pH 4.4.7 Colour and Turbidity 4.4.8 Removal of Organic Matter 4.4.9 Concentration of Reactor Contents 4.4.10 Loading Rates 4.4.11 Removal of Nitrogen Compounds 4.4.12 Phosphate Removal 4.4.13 Pathogenic Micro-organism Removal 4.4.14 Sludge Characteristics 4.4.15 Dynamic Population of Micro-organisms in the Reactor 4.5 Membrane Cleaning Conclusions and Recommendations 5.1 Conclusions 5.2 Recommendations
39 39 42 43 45
47 47 48 50 52 52 52 52 52 55 55 56
58 58 59 59 66 66 67 68 70 70 72 72 74 74 78 78 82 85 85
86 87
93 93 94

vi
References Appendix A Appendix B Appendix C Appendix D Appendix E
96
102
104
107
111
126

vii
List of Tables
Table No Title
Page
2.1 2.2
2.3
2.4
2.5
2.6 2.7
2.8 3.1 3.2 3.3 4.1
4.2 4.3 4.4 4.5 4.6
Typical Composition of Untreated Domestic Wastewater Comparison of Operating Data for Conventional, Extended Aeration AS and AS/UF Treatment Processes Operation Conditions and Performance Results of Membrane Coupled Aerobic Bioreactors with Membrane in External Circuit Operation Conditions and Performance Results of Membrane Coupled Aerobic Bioreactors with Submerged membranes Mean Operation Criteria of ADUF Plants Treating Various Industrial Effluents Specific Cost Summary of a Full-scale ADUF Plant Operation Conditions and Performance Results of Membrane Coupled Anaerobic Bioreactors Comparison of Resistance between Inorganic and Organic Membranes Properties of a Membrane Module Characteristics of the Feed Wastewater Sampling Points and Analytical Methods for Parameter Analysis Initial Membrane Resistance and Normal Flux for the Membrane Modules Mixed Liquor Recycle Ratio at Different HRT Stabilized Transmembrane Pressure for Different HRT Total Phosphate Mass Balance Indicator Organism Content in Influent and Effluent Characteristics of Waste Sludge from MBR and Conventional Activated Sludge Process
5
19
22
26
35
36 41
42 48 56
57 58 66 67 84 85 86

viii
List of Figures
Fig. No
Title Page
2.1
2.2 2.3 2.4 2.5 2.6 2.7
2.8 2.9 2.10 2.11 2.12 2.13
2.14
2.15 2.16 2.17
2.18
2.19 2.20 2.21 3.1 3.2
3.3 3.4 3.5 3.6 3.7 4.1 4.2
4.3 4.4 4.5 4.6
Effect of Organic Loading on BOD Removal and Sludge Settling Properties of Domestic Sewage Schematic of the Anaerobic Process Ranges of Various Separation Processes A Module with Hollow Fiber Membranes Dead-end Filtration and Cross-flow Filtration Membrane Applications in Wastewater Treatment Trends in Membrane Application for Solid/Liquid Separation in Wastewater Treatment Schematic of Pilot-Scale Membrane Bioreactor Household Type Hollow Fiber Membrane Separation Bioreactor Schematic Diagram of the Plunging liquid Jet Bioreactor Schematic of Ceramic Membrane Based Bioreactor Experimental Set-up for Septic Tank Effluent Treatment Diagram of Pilot-Scale ADUF Process Applied for the Anaerobic Treatment Anaerobic Membrane Bioreactor to Treat High Strength Industrial Wastewater Time Course of Membrane Permeate Flux Behavior of Methanogenic Activity from Cellulose along Cultivation Time Flow Scheme of a Membrane Coupled Anaerobic Treatment System for Municipal Wastewater Flow Scheme of a Membrane Coupled Anaerobic Treatment System for Wheat Starch Wastewater Module Backflushing with Gas Effect of Gas Backflushing During Wine Filtration Schematic of Two-Film Theory of Gas Transfer Membrane Module Schematic Representation of Filtration and Air Backwashing in a Hollow Fiber Experimental Setup of Membrane Resistance Measurement Experimental Setup for Gas Transfer Efficiency Measurement Experimental Setup to Find Out the Optimum Air Backwash Pressure Experimental Setup Schematic Diagram of the Experimental Setup for Long Term Experiments Variation of Permeate Flux of Clean Water with Transmembrane Pressure Variation of Dissolved Oxygen Concentration with Time for Stone Air Diffuser Cs-Ct with Time for Stone Air Diffuser Cs-Ct with Time for Membrane Air Diffuser Module I
6 7 13 14 15 16
18 24 25 27 28 32
34
36 38 38
40
40 42 43 44 47
48 49 51 53 53 54 60
60 61 61 62 62

ix
4.7 4.8 4.9 4.10 4.11 4.12 4.13 4.14 4.15 4.16 4.17 4.18 4.19 4.20 4.21 4.22 4.23 4.24 4.25 4.26 4.27 4.28 4.29 4.30 4.31 4.32
Cs-Ct with Time for Membrane Air Diffuser Module II Gas Transfer Coefficient (KLa) in Pure Water at 20oC Variation of Flux with Time for Different Back Flushing Air Pressure Variation of Permeate Flux with Time for Long-run Variation of Transmembrane Pressure with Time Variation of Permeate Flux with Time Flux Variation with Time for One Operating Cycle Variation of HRT at Different Operation Modes Dissolved Oxygen Concentration in Anoxic and Aeration Tank pH Variation in Anoxic Tank and MBR Color and Turbidity Variation in Effluent with Time COD Removal with Time Variation of BOD Concentration and F/M ratio with Time Variation of Solid Concentration with Time in MBR and Anoxic Tank Variation of TKN with Time Variation of NO3-N with Time Variation of Total Nitrogen with Time Schematic Diagram of Nitrogen Mass Balance Nitrogen Mass Balance Variation of Total Phosphate with Time Biological Flocs During Run I Biological Flocs During Run II Biological Flocs During Run III Biological Flocs During Run IV Free Swimming Ciliates Rotifers Membrane Resistance after Membrane Cleaning - Module I Membrane Resistance after Membrane Cleaning - Module II
63 65 69 69 71 71 73 73 75 75 76 76 80 80 81 81 83 83 88 88 89 89 90 90 91 91

x
List of Abbreviations
AS - Activated Sludge ASP - Activated Sludge Process BOD - Biochemical Oxygen Demand COD - Chemical Oxygen Demand CST - Capillary suction time DO - Dissolved Oxygen EA - Extended aeration ECP - Extracellular Polymers Eff. - Effluent F/M - Food / Microorganism ratio HRT - Hydraulic retention time Inf. - Influent J - Permeate flux KLa - Overall gas transfer coefficientµ MBR - Membrane bioreactor MF - Microfiltration MLSS - Mixed liquor suspended solids MLVSS - Mixed liquor volatile suspended solids NF - Nanofiltration NH3-N - Ammonia nitrogen NO2-N - Nitrite nitrogen NO3-N - Nitrate nitrogen NTU - Naphelometric turbidity unit Rd - Membrane resistance due to the deposition of solids Rm - Apparent membrane resistance Rmo - Initial membrane resistance RO - Reverse osmosis SRT - Solids retention time SS - Suspended solids TKN - Total kjedahl nitrogen T-N - Total nitrogen TP - Total phosphate TS - Total solids TVS - Total volatile solids UF - Ultrafiltration VSS - Volatile suspended solids µ - Dynamic viscosity 15:15 - 15 minutes of filtration then 15 minutes of air diffusion

1
CHAPTER I
Introduction
1.1 Rationale
Scarcity of water for human needs in the urban centres leads to the reuse of wastewater from residential areas for secondary purposes such as toilet flushing, lawn watering, etc., after a suitable treatment. In addition, increasingly stringent standards to satisfy the constrains of receiving streams, also requires a high level of treatment efficiency.
Thus in both cases, maximum removal of colloids and suspended solids appears to be a necessary step. In this context, conventional activated sludge process which consist of an aeration tank for the biological reduction of organic matters followed by a sedimentation tank for solid/liquid separation, cannot offer such level of high treatment efficiency due to its dependence on the settleability of solids produced during the biological degradation. This requires tertiary treatment. In such situation membranes offer the possibility of simultaneous clarification and disinfection without the risk of organo-halogenated compound formation (Ben Aim et al., 1993).
The potential membrane separation processes which could be used in wastewater treatment includes Reverse Osmosis (RO), Nanofiltration (NF), Ultrafiltration (UF) and Microfiltration (MF). Among the above process RO and NF can only be used to extract ultra pure water from the wastewater and lead to a disposal problem of concentrated waste. Therefore the use of microfiltration and ultrafiltration for solid/liquid separation instead of secondary sedimentation in biological wastewater treatment was extensively studied. Membranes were combined with biological wastewater treatment was reported as early as in 1969 by Smith et al. An ultrafiltration membrane was used for the separation of activated sludge from the final effluent with recycle of biomass to the aeration tank. The main advantages of the membrane coupled bioreactors are:
• Membranes in the ultra- or microfiltration range can prevent the loss of biological solids and high-molecular weight solutes from the bioreactor lead to high concentration of biomass in the reactor, so high rate organic matter degradation and organic matter and solid free high quality effluent.
• As a result of membrane separation, sludge retention time (SRT) is independent of
hydraulic retention time (HRT). • Use of membrane separation lead to a situation where settleability of sludge (hindered
settling and sludge bulking limitations) is no longer a consideration for better operation of the biological process.
• In addition the possibility of maintaining a low food to micro-organisms (F/M) ratio in the aeration tank as a consequence of high MLSS concentration, result in minimum sludge wastage.
2
• Maintaining the micro-organisms specially for slow growing ones at high
concentration in the reactor will reduce the plant size because of its capability to accept a higher volumetric loading rate.
• Since no pathogenic micro-organisms can escape through membranes, disinfection of
wastewater is ecologically sound.
However, concentration polarisation and fouling of membranes are problems inherent to high performance of this process. Reducing the boundary layer thickness can overcome the above problems. Minimisation of the boundary-layer thickness, can usually be achieved by maintaining a high velocity of the feed fluid across the membrane surface and recirculating the concentrate to the reactor (cross-flow filtration). However, cross-flow filtration is not yet an applicable alternative to conventional wastewater treatment; energy expenses are high because relatively large cross flow velocity in addition to the transmembrane pressure has to be maintained. Further the costs for aeration increases due to higher sludge concentration in the reactor (Muller et al., 1995).
To over come the high energy cost, Yamamoto et al. (1989) investigated the
possibility of submerging the hollow fibre membrane in the aeration tank, so solid free effluent can be withdrawn from the reactor. Considering the process performance, direct membrane separation in the aeration tank with continuous suction operation caused severe clogging of the membrane module whenever transmembrane pressure is increased. Using intermittent suction operation enabled a stable flux to be maintained for suitable, particular consideration.
Chiemchaisri (1990) studied a cyclic operation with jet aeration to reduce the membrane clogging. It was concluded that the jet aeration could be used to prolong the operation life of the membrane in the bioreactor but clogging was an unavoidable factor in long term operation.
Maythanukhraw (1995) studied the possibility of the application of air back flushing
technique for hollow fiber microfiltration module. It was concluded that the cyclic operation of filtration and air backflushing can give an improved permeate volume. It was also found that the carbonaceous and TKN removal was more than 90%. However due to the complete retention of sludge, inorganic matter in the reactor tend to increase in a long term run.
Pliankarom (1996) further studied the possibility of using air backwashing technique
for hollow fiber microfiltration. In this study daily sludge draining was carried out to overcome the inorganic matter accumulation in the reactor. In this study 26, 18 and 10.5 hours of hydraulic retention time were considered. According to this study, increase in MLSS concentration in aeration tank lead to increase in filtration pressure. It was also reported the system produced more than 90% COD and TKN removal.
However potential for complete nitrogen removal by enhancement of complete
denitrification yet to be investigated. For better understanding of the process stability, it

3
necessary to study the microbiological population in the treatment plant. It is also necessary to make cost analysis in terms of surface area required and energy input compare to the conventional systems. In this study it is intended to further investigate the performance of air backwashing technique in membrane bioreactor. The study will centred on the reduced HRT operation, complete nitrogen removal by enhanced denitrification and identifying the sludge characteristics. 1.2 Objectives of the Study 1. To investigate the possibility of using hollow fiber microfiltration membrane for effluent
filtration and as air diffuser in alternative cycle and compare air diffusion efficiency of membrane system with that of conventional air diffusers.
2. To identify the optimum operating conditions. 3. To study the treatment efficiency in terms of organic, nitrogen, phosphorus and
pathogenic organism removal and operational stability of the membrane bioreactor. 4. To identify the characteristics of the MBR waste sludge. 5. To study the microbial population in the reactor. 1.3 Scope of the Study 1. The study was carried out in bench scale. 2. Polyethylene hollow fiber microfiltration membrane having air backwashing capabilities
manufactured by MEMTEC was used. 3. Only 0.2 µm pore size membrane was used through out the study. 4. AIT wastewater concentrated with septage to achieve typical domestic wastewater
characteristics was used as substrate feed. 5. Treatment efficiency was evaluated by monitoring COD, BOD, turbidity, color, TKN,
NO 3− -N, NO 2
− -N and total phosphate in influent and effluent. In addition, the reactor performance was also monitored with permeate flux, transmembrane pressure, and the parameters such as MLSS and MLVSS concentration, pH, temperature and viscosity of mixed liquor in the reactor.

4
CHAPTER II
Literature Review
2.1 Characteristics of the Domestic Wastewater Domestic Wastewater is essentially the water supply of the community after it has been fouled by a variety of uses. From the standpoint of sources of generation, Domestic wastewater may be defined as a combination of the liquid- or water-carried wastes removed from residences, institutions, and commercial and industrial establishments. If untreated wastewater is allowed to accumulate, the decomposition of the organic materials it contains can lead to the production of large quantities of malodorous gases. In addition, untreated wastewater usually contains numerous pathogenic, or disease-causing, micro-organisms that dwell in the human intestinal tract or that may be present in certain industrial waste. Wastewater also contains nutrients, which can stimulate the growth of aquatic plants, and it may contain toxic compounds. For these reasons, the immediate and nuisance-free removal of wastewater from its sources of generation, followed by treatment and disposal, is not only desirable but also necessary in an industrialised society. In almost all cases the domestic wastewater treatment is achieved by biological means, and for the proper design and operation of such treatment systems, knowing the characteristics of the wastewater to be treated is essential. Typical characteristics of the domestic wastewater are given in Table 2.1. 2.2 An Overview of Biological Wastewater Treatment Biological processes are used to convert the finely devided and dissolved organic matter into flocculant settleable biological and inorganic solids that can be removed in subsequent solid liquid separation stage mainly by gravity sedimentation. Biological conversion can be achieved either in presence or absence of oxygen accordingly the processes are known as aerobic or anaerobic. Though in both of these cases, suspended growth as well as attached growth process are used for biological degradation, the subsequent discussion will be centered on suspended growth process on which this study will focus. 2.2.1 Fundamentals of Activated Sludge Process The activated sludge process make use of the suspended biomass to systematically stabilize the organic components of a wastewater in presence of oxygen. The activated sludge process has been used extensively for wastewater treatment in its original form as well as in many modified forms. The aerobic condition is achieved by the use of diffused or mechanical aeration, which also serves to maintain the mixture called “mixed liquor” in completely mixed

5
regime. After a specific period of time, the conversion of organic wastes to the more stabilized substances take place and provide the desired quality of effluent.
Table. 2.1 Typical Composition of Untreated Domestic Wastewater
Contaminants Unit Concentration Weak Medium Strong
Total Solids (TS) Total Dissolved Solids (TDS) Suspended Solids (SS) Volatile Suspended Solids (VSS) Settleable solids Biochemical Oxygen Demand (BOD5) Chemical Oxygen Demand (COD) Total Nitrogen (as N) Organic Nitrogen Free ammonia Nitrites Nitrates Phosphorus (total as P) Total coliform
mg/L mg/L mg/L mg/L mL/L mg/L mg/L mg/L mg/L mg/L mg/L mg/L mg/L
No/100 mL
350 250 100 80 5
110 250 20 8 12 0 0 4
106-107
720 500 220 165 10 220 500 40 15 25 0 0 8
107-108
1200 850 350 275 20 400 1000 85 35 50 0 0 15
107-109 (Source: Tchobanoglous, 1991)
Extended aeration is similar to the conventional activated sludge process with the exception, the operation is in endogenous respiration of growth curve. The process operations prefer the low organic loading, long aeration time and low F/M ratios (Fig. 2.1). Due to the stated operating conditions, the sludge problems can be overcome in view of small amount of waste sludge produced which need to be carried, and good sludge characteristic for dewatering unit. In the reactor, the biochemical conversion take place in general accordance with the stochiometry shown in Eqs 2.1 and 2.2 (Tchobanoglous, 1991). Oxidation and synthesis:
COHNS O Nutrients C H NO CO NHOther End
oductsorganic matter
Bacteria+ + ⎯ →⎯⎯⎯⎯ + + +2 5 7 2 2 3 Prnew bacterial cells
Eq. 2.1

6
Endogenous respiration:
C H NO O CO H O NH EnergyBacteria5 7 2 2 2 2 35 5 2+ ⎯ →⎯⎯⎯ + + + Eq. 2.2
Fig. 2.1 Effect of Organic Loading on BOD Removal and Sludge Settling Properties of
Domestic Sewage (Source: Smith et al., 1969) 2.2.2 Fundamentals of Anaerobic Process The anaerobic process convert organic materials into methane and carbon dioxide in the absence of oxygen. A general strategy of methane formation from complex organic materials is illustrated in Fig.2.2. The first step of the anaerobic process involves the energy-mediated transformation (hydrolysis) of higher molecular-mass compounds (liquids, polysaccharides, Protein etc.) into simple compounds (fatty acid, monosaccharides, amino acids, etc.) suitable for use as a source of energy and cell carbon. In the next step bacterial conversion of the compound resulting from the first step into identifiable lower molecular mass intermediate compounds (acetate, H2, CO2, etc.). In the third step known as

7
methanogenesis the intermediate compounds are converted into simpler end products mainly carbon dioxide and methane. A major difficulty in the anaerobic wastewater treatment process is the retention of a sufficient quantity of active biomass in the reactor. The bacteria in anaerobic system have a slower net growth rate than those in aerobic system thus making anaerobic system requiring longer minimum solids retention time.
Hydrolysis
Acidogenesis
Methenogenesis
Complex Organics
Intermediates Propionate
H2Acetate
CH4
20% 5%
60% 15%
35% 10% 13%17%
15%
72% 28%
100%
Fig. 2.2 Schematic of the Anaerobic Process 2.3 Biological Nutrient Removal 2.3.1 Nitrification Nitrification is the process where nitrogen entering the biological treatment plant mainly in the form of organic and ammonia nitrogen will be converted into nitrate and nitrite if suitable environmental conditions exists. The organic nitrogen will be converted to ammonia through biological deamination. The ammonia will be in solution as NH4
+ and NH3 depending on pH (Anthonisen et al., 1976). With the growth of nitrifying bacteria, the ammonia is converted to nitrite and then to nitrate. Ammonia oxidation is carried out principally by organisms of the genera Nitrosomonas (N. europaea and N. monocella) and Nitrosococcus. Nitrite oxidation is effected principally by organisms of the genera Nitrobacter (N. agilis and N. winogradskyi) and Nitrosocystis. It is convenient to refer to the organisms responsible for converting ammonia to nitrite as nitrosomonas and those that convert nitrite to nitrate as nitrobacters though other genera of nitrifying organisms may be involved. The equations involved are:
NH O NO H H O EnergyNitrosomonas4 2 2 215 2+ − ++ ⎯ →⎯⎯⎯⎯⎯ + + +. Eq. 2.3
NO O NO EnergyNtrobactor2 2 30 5− −+ ⎯ →⎯⎯⎯⎯ +. Eq. 2.4

8
The energy released in these reactions is used for the assimilation of cell carbon from carbon dioxide or carbonate, and for cell maintenance. Alkalinity is destroyed in the overall reaction. Both Nitrosomonas and Nitrobacter are chemoautotrophic and obligate aerobes. Thus, they require no organic growth factors and are capable of growing in completely inorganic media using carbon dioxide as the sole source of carbon. The inorganic energy sources for the two species are NH3 and NO2
- respectively (Gaudy and Gaudy, 1981). The growth of the nitrifiers is very slow compared with that of the COD consuming heterotrophs. Also, the cell yield per unit of energy substrate oxidised is low. The stoichiometry of the growth for the two genera of nitrifiers can be represented as:
55 5 76 54 109 524 2 2 5 7 2 2 2NH CO O C H O N NO H H ONitrosomonas
+ + → + + ++ Eq 2.5
400 5 195 2 4002 2 2 4 2 5 7 2 3NO CO O NH H O C H O N NO H+ + + + → + + +
Nitrobacter Eq 2.6
The reaction for nitrifier synthesis and oxidation can be obtained by combining the equations Eqs. 2.5 and 2.6: NH O HCO C H NO H O NO H CO+ − −+ + → + + +183 198 0 021 1041 0 98 1882 3 5 7 2 2 3 2 3. . . . . . Eq. 2.7
From the above equation, the following factors can be emphasised:
• The cell yield per unit of ammonia nitrogen oxidised is very low. • A large amount of oxygen is required for nitrification - about 4.3g O2 per g NH4
+-N oxidised.
• pH drop occurs during nitrification, hence the system must be buffered against H+ ions - about 7g alkalinity per g NH4
+-N oxidised. In many situation nitrifiers are very environmental sensitive, so nitrification rate can be enhanced by maintaining proper environmental conditions. The factors affecting the nitrification are described bellow. Temperature Nitrification rate is more temperature sensitive than the rates for organic removal. The optimal temperature has usually been reported to lie in the range 28oC - 36oC, with an overall range of approximately 4 - 50oC (Painter, 1970; Sharma and Ahlert, 1977; Brønd and Sund, 1994). Randall and Buth (1984) have shown that temperature changes have a greater effect on nitrate formation than on nitrite formation leading to a nitrite build-up. The temperature sensitivity of nitrifiers decreases with increasing SRT (Sutton et al., 1975).
9
pH pH plays an important role in the activity of nitrifying organisms. Most researchers have found the range of 7.5 - 8.5 as the most suitable for nitrification (Wild et al., 1971; Kholdebarin and Oertli, 1977; Painter and Loveless, 1983; Groeneweg et al., 1994). Some researchers have shown a slightly lower pH range (Wong-Chong and Loehr, 1975; Brønd and Sund, 1994). Thus, nitrifying organisms favour a slightly alkaline environment. But, a pH value of 6.0 has been shown to inhibit nitrification. SRT SRT has a direct bearing on the activity of the nitrifiers. The nitrifying bacteria have a very low specific growth rate necessitating a longer SRT. An SRT of 8 - 12 days is generally required for nitrification under normal conditions (temperature 30oC, DO > 2 mg/l). The low cell yield and growth rate are responsible for the above. If factors such as low temperatures, non-optimum pH conditions or toxicity inhibit nitrifier growth, the SRT necessary to maintain nitrification will increase. In fact at 6oC, no nitrification was reported to take place even at an SRT of 24 days (Randall and Buth, 1984). DO
As discussed earlier the DO is an absolute requirement for the growth of both Nitrosomonas and Nitrobacter. Wild et al., (1971) have found that there is no inhibition to nitrification at DO > 1 mg/l. However, Stenstrom (1980) has shown that there is no clearly defined DO concentration for optimum nitrification. At higher mean cell resident time, nitrification can be achieved at DO concentration in the range of 0.5 - 1.0 mg/l. In fact, nitrification was shown to occur even at a DO level of 0.3 mg/l (Stenstrom and Poduska, 1980). The nitrifiers do not exhibit any inhibition at high DO concentrations; Do levels up to 60 mg/l produced no effect, in studies using pure oxygen in a nitrifying filter (Haug and McCarty, 1972). Organic Loading Nitrification has been shown to proceed favourably when the organic carbon source is low. Organic carbon controls the population dynamics of the heterotrophic bacteria. An increase in organic carbon results in an unfavourable balance of heterotrophic and autotrophic (nitrifiers) organisms in the system (Beckman et al., 1972; Sharma and Ahlert, 1977). Inhibitory Compounds
Nitrifying bacteria are very sensitive to inhibitory compounds, Nitrosomonas species generally being more susceptible than Nitrobacter. The factors that affect the degree of inhibition by any given inhibitor are:
• presence of micro-organisms other than nitrifiers;

10
• concentration of the inhibitor; • concentration of the nitrifiers; • pattern and duration of exposure to the inhibitor; • mixing regime in which exposure occurs; and • presence of other inhibitors.
Inhibition can occur by interference either with the general metabolism of the cell or with the primary oxidation reaction. Inhibitors of the first type would not necessarily show up on short term experiments, whereas those of the second type would (Painter, 1970). 2.3.2 Denitrification Denitrification is a biochemical reaction which involves the reduction of nitrate or nitrite present in water to gaseous nitrogen compounds such as nitrogen gas, nitrous and nitric oxides and is carried out by facultative heterotrophic bacteria under anoxic conditions. There are also certain autotrophic bacteria that denitrify using an inorganic energy source. The principal genera are Pseudomonas, Micrococcus, Achromabacter and Bacillus, which were reported as abundant in sewage. Denitrification offers a mechanism of not only removing nitrogen in a non-polluting form, but also oxidizing organic matters in the process. Thus the oxygen which has been supplied in nitrification can, in principle, be effectively recovered and reused in denitrification. Nitrate readily replaces oxygen as electron acceptor because the pathway for the transfer of electrons from the organic substrate to the final electron acceptor is similar, but the presence of dissolved oxygen acts as a strong inhibitor on denitrification as it prevents the formation of the enzyme necessary for the final electron transfer to nitrate. There are four conditions that are necessary for denitrification (Tchobanoglous, 1991)
• presence of nitrate; • absence of dissolved oxygen; • bacterial mass that can accept nitrate and oxygen as electron acceptor; and • presence of a suitable electron donor (energy source).
Factors affecting denitrification are described below: DO The influence of oxygen on denitrification is important and controls the process by (a) oxygen competing with nitrate for electron donors and (b) oxygen inhibiting the synthesis of enzymes catalysing denitrification. However apparent simultaneous nitrification and denitrification in a well agitated sludge at low DO concentration have been observed (Matsche, 1977). Wuhrmann and Meschner (1965) reported that the effect of oxygen as inhibitor in denitrification occurred at high pH conditions. Whereas, at low pH values (5.5-6.0) oxygen do not effect on the rate of denitrification.

11
pH pH is important because there is an optimum pH for growth and enzyme activities of denitrifying bacteria and also as nitrate is reduced to nitrogen, the pH increases. The optimal pH varies with the type of organisms but in general a neutral or slightly alkaline pH is favored. Normally it lies between 7.0 and 8.2. There seems to be a relationship between the value of pH and the end product of denitrification. Significantly higher nitrous oxide was produced at pH of 6.5 than at pH of 7.5, but not vary great at pH between 7.5 and 8.5. As the pH of sewage is normally between 7 and 8, the denitrification rate will be optimal and produce nitrogen gas as the end product of the reaction. Temperature Temperature is also a significant controlling factor. At low temperature, denitrification decreases markedly but is measurable between 0 and 5oC. A synergistic effect of temperature and oxygen upon denitrification can be noted: at a high temperature oxygen solubility is less thus increasing the biological rate process, and vice versa. Generally, a doubling of denitrification rate is possible with every 10oC increase in temperature (Gauntett and Craft, 1979). 2.3.3 Phosphorus Removal from Wastewater The basic mechanisms is, to create the alternative conditions of anaerobic and aerobic or oxic stages. Under the anaerobic conditions the growth of particular strains of bacteria such as Acinobacter is selected. Energy uptake under these condition is gained by hydrolysis of polyphosphates stored in the cells. The hydrolyzed polyphosphates are then released out from the cell into the liquid as Orthophosphates. During the aerobic stage the soluble phosphorus is taken up and stored as polyphosphate in order to produce energy for their cells. The unit processes of biological phosphorus removal can be applied in different ways. Some of the processes include the anaerobic stage within the existing activated sludge process. This is called “ water-line phosphorus removal process”. Other processes, particularly for PhoStrip, create an anaerobic stage outside the existing activated sludge plant where some part of recycled activated sludge is stripped of its phosphorus and then returned to the aerobic activated sludge plant to take up more phosphorus. This is called the “sludge-line phosphorus removal process” (Cooper and Thomas, 1994). 2.4 Fundamentals of Membrane Filtration Membranes are thin films of synthetic organic or inorganic materials, which can bring about a very selective separation between a fluid and its components. The fluid may be a gas

12
or a liquid. Membranes can be caste in various shapes: flat sheets, tubes of various sizes (the smaller ones being called “capillary”) and hollow fibers with an inside diameter below a tenth of a millimeter. Generally speaking, the inorganic membranes are more resistant to pressure and chemicals, particularly to disinfectants such as chlorine, but more cumbersome and expensive. Organic membranes on the other hand are more flexible and can be put into compact modules with very high surface area. Membranes are classified according to the size of the particles being separated. Fig 2.3 indicates the different methods of separation which are used and shows the position of the main membrane treatment categories. Reverse Osmosis (RO) and Nanofiltration (NF) separate ions through diffusivity, Ultrafiltration (UF) and Microfiltration (MF) separate molecules and particles. The surface of UF and MF membranes are thus covered with pores which bring about the specific separation. Membranes are assembled in a case, called module which includes several square meters of them. Schematic of a module with hollow fibers is shown in Fig. 2.4. The manufacturing problems of the modules include, in particular, the arrangement of the membrane within the shell and the sealing at both ends (Kim, 1991). Having a membrane in the form of a hollow fiber has several advantages. First, a high surface to volume ratio can be obtained by assembling the hollow fibers in a compact bundle or cartridge. In addition, the hollow fiber wall is a membrane from which eliminates the need for support against reverse osmotic pressure. The ability of a cylinder to withstand pressure is related to the ratio of the internal radius to the external radius. By reducing the overall size of the hollow fiber, its wall can become very thin without sacrificing its ability to withstand pressures. A still further advantage may be in the cost of the membrane surface. Mahon et al. (1970) as sited by Kim (1991) indicated that membrane area can be generated in hollow fibers at a very low cost. A big advantage with the hollow fibers is its back-flushing capacity. This is possible because the fibers are self-supporting. This vastly improves its cleanability. 2.5 Microfiltration Microfiltration is an important separation process as the permeate flux is higher than other membrane processes and the permeate quality is much better than the conventional separation process like sedimentation, centrifugation, filtration, flotation, etc. Further, most of the pollutants present in wastewater have particle size ranging from 0.05 µm to 10 µm and can be removed by MF as they fall within the range of the microfiltration limit. Since the pore diameter of MF membrane is higher than other membranes (RO, NF and UF), colloids can enter the pores and the chance of internal clogging is high. This problem can be overcome by selecting with appropriate pore size and by using some pretreatment techniques. A slightly lager pore diameter enables backwashing of MF membranes relatively easy. Although internal clogging is observed as a drawback in MF systems, because of its

13

14
higher flux rate, easy washing facilities, flexibility and economy, the application and development rate of microfiltration has quickly progressed during the last decade. (Vigneswaran et al., 1991).
Fig. 2.4 A Module with Hollow Fiber Membranes ( Source: Rautenbach and Albrecht, 1989)
In conventional filtration, the flow is perpendicular to the filter surface. During the filtration process most of the solid particles are retained on the filter surface. These retained particles also contribute to the filtration process by retaining the other solid particles in the subsequent filtration process. This phenomenon is known as dead end filtration. Since membrane itself a good separator, the contribution by the settled particles has no use. Instead it is a hindrance for the filtration process. To overcome this, the flow is maintained along the membrane surface instead of perpendicular direction and this technique is known as cross-flow filtration. The shearing force created along the surface of the membrane, will wash of most of the retained particles and keep the membrane surface relatively clean and lead to situation of steady flux. A comparison in terms of flux and filter cake thickness on the membrane surface with time for dead end and cross flow filtration is shown in Fig. 2.5. 2.6 Features of the Membrane Application in Biological Wastewater Treatment Membranes were combined with biological wastewater treatment was reported as early as in 1969 by Smith et al. An ultrafiltration membrane was used for the separation of activated sludge from the final effluent with recycle of biomass to the aeration tank. The combination of the two technologies has since led to the development of three generic membrane processes in biological treatment (Brindle and Stephenson, 1996) as depicted in Fig. 2.6. Solid-liquid membrane separation bioreactors employ ultra- or microfiltration modules for the retention of biomass for recycle to the bioreactor (Fig. 2.6a). Gas-permeable membranes are used to provide bubbleless oxygen mass transfer to degradative bacteria present in the bioreactor (Fig.

15
2.6b). Additionally, in certain cases the membrane can act as support for biofilm development, with direct oxygen transfer through the membrane wall in one direction and nutrient diffusion from the bulk liquid phases into the biofilm in the other direction. An extractive membrane process has been devised for the transfer of degradable organic pollutants from hostile industrial wastewater, via nonporous silicone membrane, to a nutrient medium for subsequent biodegradation (Fig. 2.6c). These three membrane process are not mutually exclusive and, if necessary, could be coupled together into one bioreactor. However most of the researches in wastewater treatment were centered on solid/liquid separation bioreactors.
Fig. 2.5 Dead-end Filtration and Crossflow Filtration
2.7 Membrane Techniques for Wastewater Treatment Membrane in the ultra- or microfiltration range can prevent the escape of biological solids and higher molecular weight solutes with treated effluent. Developments in membrane separation technology in biological wastewater treatment are schematically shown in Fig. 2.7. Whenever high quality solid free effluent needed, conventional approach is using sand filtration (some time followed by activated carbon filtration). As a first step, these sand filters were replaced with ultrafiltration/microfiltration which ensures almost bacterial and viral free

16
effluent in addition to colloids and solid removal (Pouet et al., 1994; Langlais et al., 1992; Kolega et al., 1991). The next development was replacing the secondary sedimentation tank with crossflow membrane filtration in which retrained microbial solids are returned to the aeration tank to enhance microbial degradation. However higher energy cost to maintain the cross flow velocity lead to the next development of submerging membranes in the reactor itself and withdrawing the treated water through membranes (Yamamoto et al., 1989; Talat, 1988). Invention of air backwashing technique for membrane declogging will find the new development of using membrane itself as a clarifier as well as air diffuser.
SuspendedSolids
Bioreactor
Membranefilter
Bio
mas
sre
cycl
e
PermeateInfluent
(a)
Rec
ycle
Oxygen
Effluent(organic pollutants
extracted)
Influent(containg organic
pollutants)
Extra
ctiv
e m
embr
ane
Biomedium
Nut
rient
s
Suspendedsolids
bioreactor
(c)
Effluent
(b)
Influent
Hollow fibermembrane
Bubblelessoxygen transfer
Air
Fig. 2.6 Membrane Applications in Wastewater Treatment
In the first stage development, use of membrane is solely for the purpose of getting extremely good quality effluent and in the subsequent development, microbial solids are retained in the aeration tank in high concentration by membrane separation. Even though most of the research are centered on later developments, the first development still has its own way where preference is to get a high quality effluent without modifying the existing treatment facilities. According to Visvanathan (1996) there are some distinct advantages gained through combined membrane bioreactors. They are :
• Since suspended solid are totally eliminated through membrane separation, the settleability of the sludge, which is the problem in conventional activated sludge, has absolutely no effect on the quality of the treated effluent.
• A very long solid retention time (SRT) can be maintained resulting in complete retention of slowly growing microorganisms, such as nitrifying bacteria, in the system.
• The overall activity level can be raised, since it is possible to maintain high concentration in bioreactors while keeping the microorganisms dispersed as long as possible and as a result reactor volume will be less.
• High concentrations create a favorable environment for “endogenous” denitrification, thereby ensuring the efficient removal of nitrogen.

17
• Treatment efficiency is also improved by preventing leakage of undecomposed polymer substances.
• Removal of bacteria and viruses can be expected. • Maintaining low F/M ratio will produce less excess sludge to be handled and
treated.
From the viewpoint of membranes separation, the possible advantage gained by combining with biological treatment include:
• Dissolved organic substance with low molecular weights, which cannot be eliminated by membranes separation alone, can be taken up, broken down and gasified by microorganisms or converted into polymers as constituents of bacteria cells, thereby raising the quality of treated water.
• Polymer substances retained by means of membranes can be broken down if they are biodegradable, which means that there will be no endless accumulation of substances within the treatment process.
Moreover, in areas of acute water shortage, high quality permeate may be re-used as a secondary water source. First introduced in 1978, the extensive use of membrane separation activated sludge process for reuses of wastewater in Japanese buildings was reported by Aya (1994). However, with the exception of wastewater reuses, membrane separation activated sludge process has not been widely used due to following reasons:
• high capital and operating cost; • current regulatory standards can be achieved by conventional treatment process; • limited experience in use of membranes in these application areas; and • difficulties in disposing of chemical waste from membrane cleaning.
Membrane will only find wide spread application in the wastewater industry if they can achieve the required regulatory standards, or better, at the same cost or cheaper than present processes. Some technical factors affecting the performance of membrane bioreactor process are discussed briefly here. Effect of sludge concentration: Higher Mixed Liquor Suspended Solids (MLSS) concentrations can be maintained in the aeration tank: 15,000-20,000 mg/L level as opposed to the more common 3,000-5,000 mg/L level. Table 2.2 summarizes a comparison of process criteria for AS/UF, conventional AS and extended aeration (EA). However, when sludge concentration exceeds a certain limit, the permeation flux rapidly declines due to a dramatic rise

18
Filtr
atio
nPretreatment
(a) Conventional Treatment
Pretreatment MembraneFiltration
(b) Membrane Filtration in Place of Conventional Filtration
Pretreatment
(c) Membrane Separation in Place of Secondary Sedimentation
Pretreatment
Air
Pretreatment
Air
(d) Membrane Submerged into the Reactor to Withdraw Effluent
(e) Membrane as Solid/Liquid Separator and Air Diffuser
Fig. 2.7 Trends in Membrane Application for Solid/Liquid Separation in Wastewater
Treatment

19
in the viscosity of the sludge mixture. Yamamoto et al. (1989) and Talat (1988) found that when the initial pressure difference was the same, the flux decreased at high MLSS. The limit for the filtration of activated sludge mixture is 30,000-40,000 mg/L. Table 2.2 Comparison of Operating Data for Conventional, Extended Aeration AS
and AS/UF Treatment Processes Processes
Parameter AS/UF Conventional AS
Extended Aeration AS
System reactor volume (L) 2,663 3,423 13,694 Influent BOD (mg/L) 250 250 250 System MLSS (mg/L) 10,000 2,500 3,500 Organic Loading Rate (kg BOD/kg MLSS.d)
0.12 0.2-0.7 0.1-0.15
Volumetric Loading Rate (kg BOD/m3.d) 1.35 0.59 0.27 Reactor Dissolved Oxygen (mg/L) 1.5 1.5 1.5 Sludge Retention Time (d) Infinite 2-10 11 Re-circulation ratio (%) 240 25 50-100 Hydraulic Retention Time (h) 5 6 12-24
(Source: Smith et al., 1969) Effect of transmemberane pressure: An increase in pressure sometime causes a decline in the permeation flux, and it is possible that the compaction of the cake layer is a key factor here. Yamamto et al. (1989) found that the flux considerably decreased even at low MLSS of 5200 mg/L, when the initial pressure difference was as high as 80 kPa. So one of the key factor for stable operation of the process is low transmembrane pressure applied. Effect of membrane pore size: Membrane of different pore sizes in the microfiltration range of 0.1, 0.2, and 0.45 µm were investigated by Talat (1988). They showed similar performance in terms of removal efficiency. Moreover, 0.45 µm membranes could be operated at a much lower suction pressure to achieve the same flux. Since filtration is dominated by the cake layer on the surface of the membrane, control of the cake layer plays an important role in the reduction of fouling. Improving the scouring effect by increasing cross-flow velocity is a well-known approach, but this method has drawback of increasing energy consumption. It is also important to reduce compaction of the cake layer. Low-pressure filtration and intermittent filtration appear to offer an effective means of achieving this. 2.8 Application of Membrane Bioreactors in Aerobic Wastewater Treatment Nearly for four decades many researchers studied the various aspects of the membrane coupled bioreactors. To the author’s knowledge till Talat (1988) first introduced the

20
submerged membranes in the aeration tank for solid/liquid separation, all the earlier researchers and even, number of later researches concentrated on crossflow membrane filtration in external circuit. Further, earlier studies (e.g. Smith et al., 1969) indicates most of these external membrane circuit studies started with ultrafiltration membranes and nowadays trend change toward microfiltration though there are studies still with ultrafilters (e.g. Muller et al., 1996; Chaize and Huyard, 1991). 2.8.1 Bioreactors with Membrane in External Circuit A pilot plant with completely mixed biological reactor (4.5 L) connected to an ultrafltration module was operated to treat domestic wastewater by Chaize and Huyard (1991). For the reactor air was supplied at the rate of 80 L/h and mixer was operated at 800 -1200 rpm. Ultrafiltration membrane (molecular weight cut off 50,000 Dalton) was operated with 1.5 m/s cross flow velocity and 1-2 bar transmembrane pressure. The concentrate from the module was returned to reactor.
Experiments were carried out in two runs. First run was carried out for 160 days with the HRT of 8 h and SRT of 100 days. After 25 days of operation biomass concentration reached a steady state with MLSS concentration varying between 8,000 and 10,000 mg/L. The effluent COD was reported to be less than 30 mg/L while the influent COD was in the range of 250 to 550 mg/L. The effluent TKN was less then 10 mg/L while the influent TKN was in the range of 65 to 150 mg/L. This nitrification phenomenon was observed 14 days after the start up. During the operation period F/M ratio was varying between 0.06 and 0.1 kg COD/kg MLSS.d. For the second run HRT was varied as 8, 4, 2 and 2 h with corresponding SRT of 100, 100, 50 and 100 days in order to study the steady state of biomass concentration at different operating conditions. Total days of operation was 200 days. In this case biomass concentration increased slowly until 30 days and membrane permeability has decreased. Changes in operating conditions (HRT and SRT) had no effect regard to carbonaceous removal. However at the beginning, TOC accumulated in the bioreactor. With the increase of biomass concentration this TOC has decreased but accumulation of TOC again increased when HRT was changed. This could be due to the accumulation of either the bacterial products or the raw water components. With different operating conditions, this phenomenon was observed by several other researchers. Though the changes in operating condition disturbed the removal of nitrogen compounds, after an adaptation time, the removal was maximum for each HRT studied. A mathematical modelling for design and operation of biological wastewater treatment was used to evaluate the performance of the membrane bioreactor. The predicted effluent COD of 2 mg/L is slightly lower than experimental value (< 30 mg/L) whereas predicted TKN effluent concentration was very close to the experimental value. The major disagreement between modelling and experimental approach is on biomass concentration. The model used was valid with results from typical activated sludge plant, does not incorporate maintenance

21
phenomena, important for processes with a low F/M ratio. Based on the maintenance concept which was validated for membrane bioreactor application, the steady state biomass concentration is given by an equation. This approach was applied to the experimental results but a maintenance coefficient cannot be estimated due to the dispersion of values. This can be explained by the high concentration of suspended solids in raw water, which is not considered in the equation. With a SRT of 100 days and HRT of 2 h, a good effluent quality is obtained. In order to better understand the biological reaction involved in this process, it is necessary to further develop the maintenance concept and its application to conventional wastewater treatment prediction models. Operation conditions and performance results for membrane coupled bioreactors with membrane in external circuit studied by many other researchers are presented in Table 2.3 2.8.2 Bioreactors with Submerged Membranes Talat (1988) investigated hollow fiber microfiltration for solid-liquid separation from the aeration tank of an activated sludge process. The variation of three parameters of pore size (0.1, 0.2 and 0.45µm), MLSS in the reactor (5,000, 10,000 and 20,000 mg/L) and suction pressure (1.36, 2.72, and 7.5 m head of water) were conducted during a short term experiment in order to find out the suitable mode of operation for long term experiment. The short term result shown that at 10:10 intermittent operation provided the best condition for the stable flux. In long term experiments, membrane modules were regulated at constant flux of 1.5, 2.5 and 3.5 L/m2.h and the corresponding increase in suction pressure was recorded. Volumetric organic loading of 3 kg COD/m3.d shown critical condition toward the separation process. However, loading of 2 kg COD/m3.d appeared to provide most suitable condition, since the COD removal efficiency was upto 95-97%. Nitrification and denitrification was achieved at 100% and 30-40% respectively. Under similar operating conditions, the removal efficiency were independent of the membrane pore size. The 0.45 µm membranes which operated at lower suction pressure than the 0.1 µm membrane under similar operating conditions can provide the highest flux of 3.5 L/m2.h (0.084 m3/m2.d) and similar in clogging characteristic to others. Low value of Y, kd and F/M ratio showed very small sludge production. The 100% removal of fecal coliform can be achieved by using 0.1 and 0.45µm membrane filters.
Series of laboratory scale experiments were carried out by Yamamoto et al. (1989) to find out the feasibility of direct membrane separation in an activated sludge aeration tank. The study was carried out with 0.1 µm pore size hollow fiber membranes. Short term experiments in substrate free water revealed high suction pressure lead to rapid reduction in flux. During the long term experiments, continuos suction caused severe clogging of membrane module with an increasing pressure difference till 100 kPa. The stable flux was observed for 120 days

22
at

23

24
volumetric loading of 1.5 kg COD/m3.d using intermittent suction at a low pressure of 13 kPa. COD removal of more than 90% is reported despite the intermittent aeration. However nitrate removal was considerably varied above 80 % and denitrification efficiency was in between 20 and 60 %. Intermittent aeration did not change the denitrification efficiency indicates the dissolved oxygen could not be depleted in a such shorter non aeration time. From the analysis of supernatant of the reactor water and effluent shows membrane act as a barrier to remove certain amount of dissolved and colloidal COD. During the steady state F/M ratio was 0.1 d-1 and the critical organic loading was estimated as 3 to 4 kg COD/m3.d to maintain both stable flux and aerobic condition. Absence of recirculation pump lead to a very low power consumption of 0.007 kWh/m3. Chiemchaisri (1990) investigated an activated sludge process operation using 0.1µm hollow fiber membrane modules for solid liquid separation. This study was conducted to treat low strength wastewater from AIT domestic wastewater. Comparison of the membrane bioreactor under different operating conditions, such as non-aerated and aerated, with different initial hydraulic retention time (HRT) of 1, 3 and 6 hours which provided corresponding permeate flux of 4.17, 1.38 and 0.7 L/m2.h was studied. The process was operated at 10:10 intermittent time. From the experiment, it can be seen that the non-aerated bioreactor has an advantage over the aerated condition at an initial HRT of 3 and 6 hours, since lower energy consumption was required while giving similar effluent quality and process stability. However, at lower HRT of 1 hour (or higher permeate flux, 4.17 L/m2.h) aeration is required in order to prevent membrane clogging. This highest flux of 4.17 L/m2.h seem to be a critical value since creating severe clogging condition. At lower flux, no clogging was observed under non-aerated and aerated conditions. The quality of permeate in term of COD was independent of the low volumetric organic loading at the range of 0.2-2 kg COD/m3.d. Because of the long solid retention time (SRT), the process was stable and steady, COD removal efficiency was similar in every experimental conditions. The performance of 0.03 µm pore size with 9 m2 surface area of hollow fiber membrane was also investigated in pilot-scale unit. Two hollow fiber membrane modules were immersed in an aeration tank which fed diurnally with AIT domestic wastewater. The suction pump was used at 10:10 minute intermittent operation to extract the permeate through the membrane. The pilot scale experimental set up is shown in Fig. 2.8. For jet aeration, the effect of jet aeration period (0.5 and 1 h) and jet aeration pattern 15 minutes for two times a day and 30 minutes for once a day was investigated. The jet aeration flow rate used was 20 L/min. The settling of solids to bottom of bioreactor and the creation of anaerobic condition resulted in the division of bioreactor into two zones: aerobic and anaerobic. This effect also resulted in low MLSS in aerobic zone which could reduce the clogging of membrane. The mean hydraulic retention time (HRT) was determined after the permeate flux reached steady state. The average flux was found to be around 4.17 L/m2.h coresponding to an average HRT of 1 day under diurnal varied loading. Diurnal variation in loading play a minor role in the

25
nitrification process since more than 80% nitrification can be observed throughout the experiment.
Fig. 2.8 Schematic of Pilot-Scale Membrane Bioreactor (Source: Chiemchaisri, 1990) The MLSS in the bioreactor was affected by the air flow rate, and optimum air flow rate in this experiment was taken as 7.5 L/min. which provided sufficient oxygen for the microorganisms and maintain low MLSS in the aerobic zone. Direct membrane separation using hollow fiber membrane for activated sludge process was investigated in a pilot scale study by Chiemchaisri et al. (1992). The Experimental set-up used for this study is shown in Fig. 2.9. The system consists of two parts, main bioreactor and separation unit. The separation unit with 10 L volume, was immersed into the main bioreactor which has 62 L volume. Two hollow fiber membrane modules (0.03 and 0.1 µm pore size) of 0.3 m2 surface area each were put in the separation unit. Paddles, drive by a motor, provided a cross flow of mixed liquor across the membrane surface at the speed of 290 rpm in 10 second cycle in alternate direction. By providing highly turbulent conditions within the separation zone in conjunction with jet aerating installation inside the membrane module, sludge accumulation on the membrane surface and inside the module can be reduced. Permeate flux obtained after 330 days of operation was 8.33 L/m2.h (0.2 m3/m2d) under intermittent suction. High degree of organic matter reduction (more than 85%) was observed with 20.8 and 16.5 mg/L of COD in the effluent during continuous and intermittent aeration modes respectively. The degree of nitrification and denitrification was above 90% when intermittent aeration (90 minutes aeration and 90 minutes rest) at a dissolved oxygen level of 4 - 5 mg/L was applied. However a similar interval intermittent aeration but at low dissolved oxygen level (1.5 - 2

26
mg/L) lead to a reduction in nitrification and denitrification efficiency (80%) resulting in 4.9 mg/L of total nitrogen in the effluent. The virus reduction of 4 to 6 log number also observed.
Fig. 2.9 Household Type Hollow Fiber Membrane Separation Bioreactor
(Source: Chiemchaisri, 1992)
A comparison of operating conditions and performance results of submerged membrane bioreactors is presented in Table 2.4. Effects of Aeration in Suction Pressure Aeration in a submerged membrane bioreactor serve three purposes; providing the air required for the biodegradation, keeping the biomass dispersed through out the reactor and creating a cross flow velocity in the vicinity of the membrane module. It can be anticipated increase in air flow rate can improve the flux rate. Udeda et al. (1997) studied this phenomena in a 21.4 m3 pilot scale submerged membrane bioreactor. In this study 42 hollow fiber modules (0.1 µm pore size and 4 m2 surface area each) were used. From this study it was concluded that cake removing efficiency of the uplifting air flow was affected by the turbulence of the flow. The cake removing efficiency was improved either by augmenting an air flow rate or by augmenting aeration intensity (an air flow rate per unit flow area) by concentrating membrane modules over a smaller floor area. It was further mentioned, an increase in the air flow rate partially stimulated the cake-removing efficiency, but there was a critical value beyond which the air flow rate increase had virtually no effect on the cake removing efficiency. The cake removing efficiency was also improved by intensifying the air

27
flow without increasing the air flow rate. Therefor, membrane modules are to be concentrated over a smaller floor area in order to augment the aeration intensity.

28

29
2.8.3 Plunging Liquid Jet Bioreactor Coupled with Membrane Separation As an attempt to energy saving in membrane coupled bioreactors Yamagiwa et al. (1991) studied the possibility of using jet aeration in the bioreactor. The main feature of this bioreactor is that, the membrane module is incorporated into the liquid circulation line for the formation of the liquid jet so that the operation of aeration and membrane separation could both acomplished using only one pump (Fig. 2.10). The jet aeration works on the principle that, a liquid jet after passing through a gas layer plunges into a liquid bath, entrain considerable amount of air. This study was carried out with two ceramic porous microfiltration membranes having a pore size of 0.05 µm and a surface area of 74.5 cm2 each. From this study it was concluded, air entrainment and oxygen transfer characteristics of the reactor were found to correlate well with the empirical equations obtained for larger tank systems. In addition the bioreadtor showed a high removal efficiency of organic pollutants (97% TOC).
Fig. 2.10 Schematic Diagram of the Plunging Liquid Jet Bioreactor (Source: Yamagiwa et al., 1991)
2.8.4 Membrane as Air Diffuser and Clarifier As an another effort to improve performance of the membrane bioreactor system, filtration and aeration by membrane in alternate cycle was studied for the membrane bioreactors with membranes in external circuit and submerged in bioreactor.
Scott and Smith (1997) studied the alternate function of aeration and separation by a microfiltration module in a external circuit of a membrane coupled bioreactor. In this study a
A - Aeration tank B - Pump C - Pressure gauge D - Membrane module E - Valve F - Flowmeter G - Nozzle H - Pemeate reservoir I - Roller pump J - Waste reservoir L - DO probe M - DO meter

30
ceramic membrane (0.2 µm) coupled to a bioreactor has been used in a dual role, combining the alternate function of system aerator and filter for remediating food process industry wastewater. The experimental setup used in this study is shown in Fig 2.11. From this study it was concluded that the 0.2 µm membrane provide markedly superior aeration to a traditional aerators and kept permeate suspended solids below 50 mg/L, despite an input of 1500-3800 mg/L. At 25oC with COD inputs fo 13,330 mg/L and BOD of 6,500 mg/L, reduction in excess of 95% obtained. In addition ammonia nitrogen was reduced from 9-10.2 mg/L to < 0.3 mg/L and total phosphorous from 20-21.2 mg/L to < 4 mg/L. The systems membrane, operated in a dual role also successfully provided alternatively separation of treated liquor by filtration and enhanced aeration through fine bubble diffusion. From this study it was suggested the needs to determine optimum air supply rate and bioreactor HRT. Furthermore, although successful runs were conducted without nutrient supplementation, as in most industrial wastes, there appears a likelihood of nutrient limitation, in this case nitrogen. Supplementation may, therefor provide further enhancement of degradation rates, although any improvement would have to be offset against the costs of additives.
Fig. 2.11 Schematic of Ceramic Membrane Based Bioreactor (Source: Scott and Smith, 1997)
Maythanukhraw (1995) applied 0.1 µm hollow fiber membrane directly in the reactor for solid-liquid separation to treat domestic wastewater from AIT campus, Bangkok. For short term experiments, the effect of transmembrane pressures, intermittent mode of operation and duration of air diffusion were investigated to find out the optimum conditions which corresponding to high and constant flux obtained. Variation of transmembrane pressures were studied with values of 13.3, 21.3, 32.0 and 41.0 kPa. It was found that using 13 kPa transmembrane pressure was a limiting pressure for all experiments. The different operation modes were studied by varied duration of effluent filtration and air diffusion: 5:5, 10:10, 15:15, 30:30, 60:60 and 15:15* (15* = 15 minute without sending air).

31
The results shown that at the operational mode of 15:15 provide the best results. Although cyclic operation with air diffusion could not completely remove the clogging, air backwash technique in this mode of experiment could improve the flux by up to 371% compared to the continuous operation. At 15:15 operation mode, experimental run was continued further to find out the optimum air diffusion duration on that mode. By varied the values of 15:5, 15:10 and 15:15, the best performance was observed under 15:10 mode, considering both recovery of permeate flux and net cumulative flux. To find out the reactor performance in long run under the optimum conditions obtained from short term experiment, the effects of HRT at 12, 6 and 3 h were studied. At the HRT of 3 h the volumetric organic loading in rate was varying between 1.9 and 2.1 kg.COD/m3.d. The experimental results indicate, the transmembrane pressure has increased according to the cake formation on the membrane. So, after the long period of experimental runs the steep increase in transmembrane pressure can be observed even operated under air backflushing. The periodic chemical cleaning for membrane was needed in order to recover the permeate flux. The permeate flux exhibits good quality in terms of very low SS and BOD. Since the infinite SRT was maintained, more than 90% reduction in COD with effluent concentration below 20 mg/L was achieved in all runs. The TKN removal was more than 90%, and total phosphate removal was around 50 % in all experimental runs. The MLVSS/MLSS ratio in the bioreactor was in the order of 20-30%. Solid matter mass balance calculation indicated a steady accumulation of inorganic components within the reactor. The lower fraction of active microorganisms in the bioreactor did not show any significant effects on the process efficiency. Nevertheless, it is anticipated that in longer run it might affect the process, thus it is advisable to have periodic sludge draining. To use the membrane as air diffuser, the compressed air pressure should be high enough to produce steady stream of micro-air bubbles according to the bubble point concept. One way to overcome this problem is to use relatively large pore size membranes. The membrane cleaning process which was adopted in this study was found to be adequate to remove mainly the external membrane resistance. It is necessary to have chemical cleaning procedure for complete elimination of internal and external resistance, which mainly caused by the macromolecular adsorption. Longer air diffusion will improve the recovery of permeate flux. However, by considering both the recovery of permeate flux and net cumulative flux 15:10 operational mode gave better results than the 15:15. Possibility of application of air backflushing technique through hollow fiber microfiltration was investigated by Pliankarom (1996). The process employed direct solid-liquid separation by two membrane modules with pore size of 0.2 µm immersed directly in the activated sludge aeration tank of 80 L volume. This study was conducted with high concentration of activated sludge and divided into short-term and long-term experiments. In short term experimental runs, the optimum air backflushing and filtration cycle was investigated. 15 minutes filtration and 15 minutes air backflushing provided the best result in term of flux improvement and stability. Due to the membrane module stability limitation, the

32
applied compressed air pressure of 1 bar was not sufficient to remove the clogging completely. However this cyclic operation provided higher flux stability compared to operation without air diffusion. In long-term experiments, the initial sludge concentration was 13,000 mg/L. Three different hydraulic retention times (HRT) of 26, 18 and 10.5 h which corresponds to the permeate flux of 3.08, 4.44 and 7.62 L/m2.h were investigated. Here, it was noted that the filtration pressure related to the MLSS concentration. The stable operation could be obtained at 26 and 18 hours. All experimental runs provided more than 90% removal of COD, BOD and TKN with final MLSS of 40,000 mg/L in the reactor. Although the operation with daily sludge draining of 1.6 L/d, the MLVSS/MLSS values seem to be slightly decreased. It was concluded, such conditions would not affect the process performance significantly in terms of physical, chemical, biological and bacteriological qualities of membrane bioreactor effluent. 2.9 Application of Membrane Bioreactors in Anaerobic Wastewater Treatment After being introduced more than four decades ago, anaerobic treatment is now a well established process for concentrated industrial wastewaters. However, in recent years through a better understanding of the microbiology of this process and through improved reactor designs, it has also been considered for the treatment of diluted wastewaters. As mentioned earlier the major difficulty in the anaerobic wastewater treatment process is the retention of a sufficient quantity of active biomass due to its slower net growth rate. Because of the slower net growth rate of anaerobic bacteria than aerobic bacteria, anaerobic systems require a longer minimum solids retention time (SRT). Operating below this minimum SRT would result in micro-organism being washed out of the system faster than the growth rate leading to system failure. An anaerobic treatment process has not been popular due to its low efficiency and inability to meet the discharge regulations, despite the advantages of generating methane fuel gas and reduced amount of sludge generation. The loading rates in a anaerobic wastewater treatment systems are mostly dictated by the biomass retention in the reactor. A high biomass retention will give a good reactor performance leading to better gas yields and better quality effluent. A lower retention capability will lead to a longer hydraulic retention time (HRT) thus requiring reactors of larger volumes leading to higher costs. These problem would be overcome if the biomass in the reactor could be retained longer than the wastewater undergoing degradation, thus increasing biomass concentration in the reactor. For dispersed growth anaerobic systems, high concentration of biomass retention was achieved through the improved separator performance by use of chemical coagulants, and process and component design modifications such as the incorporation of a spiral baffle as part of the settler design, vacuum degasification, flocculation followed by the use of a lamella clarifier and the application of a cold-thermal shock to biomass prior to sedimentation in order to arrest gassification in the settling tank and encourage flocculation of the solids. Apart from

33
this, various anaerobic reactor configurations such as anaerobic filters, fluidized bed reactors, upflow anaerobic sludge blanket reactors (UASB), rotating contactors, etc. are advocated with a view of longer sludge retention times and shorter hydraulic retention times. Although the later mentioned systems need less space compared to suspended growth anaerobic system, except the UASB all other systems need an extra space for the media on which biomasses are attached. On the other hand the problems associated with the UASB are its requirement for a suitable seed sludge which could get granulized and maintaining appropriate organic load with almost a constant upflow velocity. In this situation use of membrane separation for anaerobic wastewater will lead to some distinct advantages:
• increasing the biomass concentration without increasing the reactor volume and irrespective of the granulation of sludge;
• colloidal/suspended solid free good quality effluent. A number of membrane anaerobic systems were tested mostly with industrial wastewater to identify their performance;
• treatment efficiency greatly improved and effluents can easily meet the standards since colloidal matters and macromolecules are retained in the bioreactors by the membranes and completely degraded; and
• since all the micro-organisms including the slow growing methonogens are retained in the system, intermediate toxins get removed at a faster rate, prevent the system failure in most cases.
2.9.1 Treatment of Domestic Wastewater in Membrane Coupled Anaerobic Process Grethlein (1978) has demonstrated that the concept of using a septic tank-membrane system is feasible for the treatment of domestic wastewater. The experimental set-up used in this study is shown in Fig. 2.12. A two-compartment rectangular tank with a total volume of 106 L was constructed and a minimum flow rate of 2.65 L/min. was applied. Operating pressures were in the range of 345 to 1030 kPa (50 to 150 psi). By using the surge capacity of the septic tank, the average volumetric flow rate of inlet and outlet were matched. Two types of membrane module were used (flat sheet membrane module and helicore reverse osmosis unit). In order to provide control of concentration polarization at the membrane surface and to mix the content of the septic tank, the circulation flow (crossflow) over the membrane surface was kept much larger than the effluent rate. The significance of the flux maintenance study is that the feasibility of cyclic operation is demonstrated as a practical way to maintain the flux in the presence of suspended solids. The flux does decline with time until an approximate steady-state value on one-third to one-fourth of the original flux is reached. This steady-state flux is maintained by the hydrodynamic action of the flow under cyclic operation. Moreover, the crossflow velocity may be reduced compared to continuous operation, which is important in reducing the pumping cost.

34
Septictank
Membraneunit
Membraneunit
Wastewater Concentrate F (Circulating flow)
Pressureregulator
Pressuregauge
Flow meterDepressurizationpath
Solenoidvalve
Surge tank
Pump
Timer
F1 (Effluent)
Flowmeter
Fig. 2.12 Experimental Set-up for Septic Tank Effluent Treatment (Source: Grethlein, 1978)
It appears, with the 2:2 operating cycle ( 2 minutes “ON” and 2 minutes “OFF” ) it was possible to maintain a steady flux of about 20.42 L/m2.h with the bulk velocity as low as 22.9 cm/s. During the off period of the cycle when the backflow occurred, some noticeable solids were floated off the membrane surface, but not enough to clean the entire surface. The spontaneous break-up of the gel layer, which results in cleaning the surface of the membrane, is a self-cleaning method unique to the cyclic operation procedure, and in the long run is probably the most important mechanism for achieving long-term practical flux levels. The water quality of the treated effluent is similar, if not better, than that of secondary treatment effluent. For example, E.Coli. and turbidity are zero, while the reduction of BOD by 85 to 95% is possible. A particular feature of this system is its ability to reduce nitrate concentration by about 75 percent. The anaerobic rate of digestion of organic carbon in the septic tank is enhanced by a factor of 3 to 4 because of the increased concentration of micro-organisms and substrate caused by membrane. The pH stability of the digester is excellent (6.5-7.2), even with intermittent loading. The sludge accumulation is less than in an ordinary septic tank. 2.9.2 Treatment of Industrial Wastewater in Membrane Coupled Anaerobic Process A comprehensive study using ADUF® (anaerobic digestion-ultrafiltration) process for the treatment of different industrial wastewters were carried out in South Africa (Ross and Strohwald, 1994). In this processes 9 mm tubular polyethersulphone membrane in combination with the pressure of 500 kPa were used. The ADUF process comprises two main unit operations: an anaerobic digester coupled with an external pressure driven ultrafiltration unit. Some of the studies carried out with this unit are described below.

35
(i) Wine Distillery Wastewater
A pilot scale anaerobic digester with an external ultrafiltration membrane to treat wine distillery wastewater (37,000 mg COD/L) was reported by Ross et al. (1990). A pilot plant comprising a digester and external UF unit is shown in Fig. 2.13. The 2.4 m3 digester operated at a MLSS concentration of 30,000 mg/L and prior to the installation of the UF module, could only be fed with wine distillery waste at a volumetric loading rate of some 4 kg COD/m3.d at 35o C. A UF module with a total membrane area of 1.75 m2 was used for the test at an inlet pressure of 400 kPa. The high rate of sludge re-circulation through the UF unit to comply with a linear velocity of 2 m/s resulted in a permeate volume (2.4 m3/d) well in excess of that of the substrate feed rate (0.3 m3/d ) to the digester. The oversized UF unit was accommodated by wasting a volume of permeate equivalent to the daily feed volume, and by recycling the excess permeate back to the digester. All the sludge concentrate was returned to the digester. The experimental results obtained on the ADUF system may be summarised as follows:
• The extremely high initial permeation flux of 62.5 L/m2.h at 400 kPa inlet pressure gradually decreased to 37.5 L/m2.h after 7 months continuous operation. Temporary substitution of the original module by a new one also gave a flux of 37.5 L/m2.h, indicating that the flux decline was not caused by membrane fouling but by changes in the digester contents, e.g. the SS in the digester had increased over the seven month period to 50 kg/m3 from an initial concentration of 30 kg/m3.
• No suspended solids were lost in the effluent (permeate) which was completely clear. Anaerobic bacterial counts before and after ultrafiltration were carried out and illustrated one of the important advantages of ADUF, i.e. recycling of bacteria back to the digester.
• A build-up of biomass occurred in the digester, with a concomitant increase in permissible volumetric loading rate notwithstanding the poor settleability of the sludge. During the study period, the load rate increased from 4 to 12 kg COD/m3.d.
• The operating flux was successfully maintained for a period of several weeks before cleaning of the membrane was necessary.
• The degree of COD removal was 93%, based on a feed and effluent concentration of 37.0 and 2.6 kg/m3 respectively.
(ii) Industrial Scale Application of ADUF Process A commercial application on an industrial scale ADUF process (digester capacity 2,600 m3, membrane area 800 m2) in South Africa for treatment of maize-effluent, was reported by Ross and Strohwald (1994). The results after four years have illustrated the merits of the process for the production of a colloidal free effluent at a mean COD removal efficiency of 97%. The permeate flux has average 25 L/m2.h at 35oC, inlet pressure of 500 kPa, linear flow velocity through the tubes of 1.5 m/s and digester suspended solids concentration of 25,000 mg/L. A mean volumetric loading rate of 3 kg COD/m3.d guaranteed reliability to withstand high COD shock loadings due to variations in the feed load. This plant was occasionally subject to peak load rate of 12 kg COD/m3.d due to COD values as high as 60,000 mg/L.

36
1.75 m2
Gas Meter
Wine DistilleryWaste FeedCOD 37 kg/m3
ANAEROBIC DIGESTER ULTRAFILTRATION
Excess Permeate Recycle Permeate to Waste
COD = 2.6 kg/m3
SS = 0 kg/m3Sludge Draw-Off
MembraneCleaningSolution Tank
Inlet Pressure400 kPa
Ultrafiltration Module
RegulatorValve
Outlet Pressure120 kPa
Permeate
Sludge Recycle
- Digester Temp. 35oC- MLSS: 50kg/m3
- Total Digester volume: 2.3 m3
- Space Load Rate: 11kg COD/m3.d- Sludge Load Rate: 0.58kg COD.kg VSS/L.d- RH = 3.3 Days
Fig. 2.13 Diagram of Pilot-Scale ADUF Process Applied for the Anaerobic Treatment (Source: Ross et al., 1990)
The membrane flux at the full-scale plant has exhibited a fluctuating trend over the four year period in the range of 10-70 L/m2.h. The lower flux rates recorded were generally due to inferior operating conditions such as low linear flow velocity across the membrane surface, high MLSS concentration or feed shock loading. No long term predictions can as yet be made regarding membrane flux stability and membrane system life. These factors will naturally have direct bearing on process running costs. Including the above, few other investigations have been conducted in pilot-scale and full-scale plants based on ADUF process treating mainly effluents from the food and beverage industries are shown in Table 2.5 with information on principle operating conditions and result of those plants. (iii) Cost Aspects of ADUF Process Strohwald (1994) as sited by Ross and Strohwald (1994) carried out a capital and operating cost estimate for a 1,500 m3/d ADUF system with energy recovery from the generated biogas. The design incorporated a total digester volume of 1,800 m3 and total MEMTUF® membrane area of 1,400 m2. The specific cost calculations are summarised in Table 2.6, assuming a five year depreciation and interest at 20 %, based on a total capital cost for the system of £ 385,000. The redemption of capital is the largest cost contributing factor

37
which is to be expected. With respect to the operating cost breakdown, a conservative two year membrane life was assumed for membrane replacement. The combined specific capital and operating cost of £ 0.04 per m3 effluent treated for a complete ADUF plant compares favourably with the cost for direct disposal of untreated effluent to municipal treatment works. The added benefit of water conservation by possible permeate, increases the economic attractiveness of on site ADUF treatment. Table 2.5 Mean Operation Criteria of ADUF Plants Treating Various Industrial
Effluents
Brewery Wine Distillery
Malting Egg Process
Maize Process
Volume of digester (m3) 0.05 2.4 3.0 80 2610 Operational period (month) 3 18 5 8 36 Feed COD (kg/L) 6.7 37 3.5 8 4-15 Permeate COD (kg/L) 0.18 0.26 0.8 0.35 0.3 COD removal (%) 97 93 77 95 97 Space load rates (kg COD/m3.d) 17.0 12.0 5.0 6.0 3.0 Sludge load rate (kg COD/kg VSS.d) 0.7 0.58 0.5 0.33 0.24 HRT (day) 0.8 3.3 0.8 1.3 5.2 Temperature (oC) 35 35 35 30 35 MLSS (kg/m3) 30-50 50 10 10-30 23 Membrane area (m2) 0.44 1.75 9.6 200 800 Flux (L/m2.h) 10-40 40-80 20-40 15-30 10-70 Inlet pressure (kPa) 340 400 500 500 600 Flow velocity (m/s) 1.5 2.0 1.8 1.8 1.6 Tube diameter (mm) 9.0 12.7 9.0 12.7 9.0
(Source: Ross and Strohwald, 1994) Many other investigators also studied the possibility of using membrane coupled anaerobic digestor for industrial wastewater treatment. Ultrafiltration membrane separation for anaerobic industrial wastewater treatment was studied by Fakhrul-Razi (1994). The experimental set-up used in this study is shown in Fig. 2.14. The study was conducted at a temperature of about 35o C, a pressure range of 100-300 kPa and with minimal pH control (the pH ranges from 6.8 to 7.4 throughout the study). The reactor was subjected to different organic loading rate (OLR) ranging from 12 to 20 kg COD/m3.d. The SRT was varied and this was possible by deliberately wasting reactor sludge from the system. The SRT range achieved was approximately between 83 to 53 days. Six steady states were attained over a MLSS range of about 31,000 to 38,000 mg/L.
From the observations the rate of the gas produced in the reactor increases with
increasing OLR. The methane content of the reactor gas shown a decline from 65.3% to 57.1%. Methane yield ranged from 0.26 to 0. 29 m3 CH4/kg COD. However no sudden increase in volatile acids concentration were recorded during the study indicating that the anaerobic system was coping quiet well with the increasing loading rates. The reduced
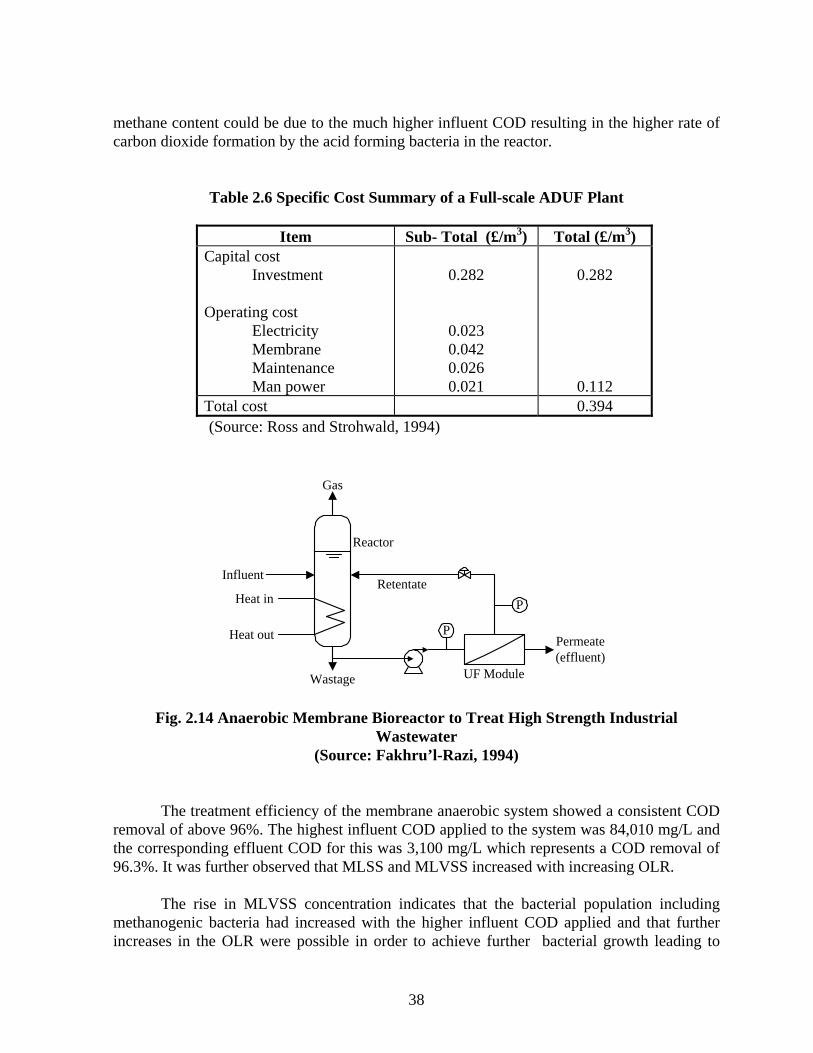
38
methane content could be due to the much higher influent COD resulting in the higher rate of carbon dioxide formation by the acid forming bacteria in the reactor.
Table 2.6 Specific Cost Summary of a Full-scale ADUF Plant
Item Sub- Total (£/m3) Total (£/m3) Capital cost Investment Operating cost Electricity Membrane Maintenance Man power
0.282
0.023 0.042 0.026 0.021
0.282
0.112 Total cost 0.394
(Source: Ross and Strohwald, 1994)
Retentate
Reactor
UF Module
Permeate(effluent)
Wastage
Heat out
Heat in
Influent
P
P
Gas
Fig. 2.14 Anaerobic Membrane Bioreactor to Treat High Strength Industrial Wastewater
(Source: Fakhru’l-Razi, 1994) The treatment efficiency of the membrane anaerobic system showed a consistent COD removal of above 96%. The highest influent COD applied to the system was 84,010 mg/L and the corresponding effluent COD for this was 3,100 mg/L which represents a COD removal of 96.3%. It was further observed that MLSS and MLVSS increased with increasing OLR. The rise in MLVSS concentration indicates that the bacterial population including methanogenic bacteria had increased with the higher influent COD applied and that further increases in the OLR were possible in order to achieve further bacterial growth leading to

39
much higher MLVSS concentration in the reactor. During the experimental study SRT was reduced from 83.3 to 58.8 day. This was due to the increase in the deliberate sludge wastage rate from the reactor thus resulting in more bacteria being lost from the reactor. This was necessary in order to offset the drop in membrane flux experienced from the UF module over the period of the study. The results from the study indicate that the membrane anaerobic treatment system has great potential especially with respect to reactor biomass retention and its treatment efficiency. The study showed that the incorporation of membranes in the system has enabled the new membrane anaerobic system to retain active bacterial populations and produce a clear final effluent through the membrane permeate. The system also showed that it was probably capable of higher loading rates and has yet to achieve its maximum treatment capability. This was made possible with good control of bacterial populations in the reactor provided by the UF membranes. Throughout the study there was negligible biomass loss through the effluent/permeate. Present high-rate advanced anaerobic processes such as UASB, fixed bed and fluidized bed reactors seem to have attained a mature stage with regard to the treatment of certain types of wastes, which mainly contain soluble and readily biodegradable organics. However, the most serious drawback of these processes lies in the fact that the application to such wastewaters as contain high strengths of particulate organics, lipids and inhibitory substances is still restricted. The membrane bioreactor inherently allows no particulate matter to be expelled from the system. As a consequence, the particulate organics retained in the reactor can eventually be liquefied and decomposed because of the long solid retention time. Also, the anaerobic microbes are able to proliferate without being washed out from the process. The process seems also to be favorable for treatment of wastewaters that contain refractory or inhibitory substances.
According to the experiment by Harada et al (1994), the permeate flux decreased significantly as the cultivation time elapsed (Fig 2.15). This may have been brought about by the formation of gel layer at the membrane surface. This phenomenon is a so-called concentration polarization caused by insolubilization of high molecular organic substances. In addition, the increase of MLSS enhanced the deposition of cells into the gel layer matrix, and accelerated the deterioration of flux. Although the water-washing was effective to some extent for elimination of gel layer, the permeate flux did not restore to 100% of the initial level after each washing. In that membrane bioreactor, major portions of organics present in the reactor broth were occupied by substances with molecular weight (MW) as large as 106, while the permeate consisted of substances with MW less than only 1500. This great difference in molecular size between the concentrate and the permeate implies that the membrane was capable of not only separating suspended or colloidal matters but also fractionating soluble organics by molecular size. And the exclusion of higher molecular size materials from the permeate is attributable to the formation of gel layers on the membrane surface. It should be noted that formation of gel layer is responsible for the decline in permeate flux, but conversely useful for production of high quality effluent. Also found that the pattern of methanogenesis for the case of cellulose differed from those of hydrogen-utilizing and acetate-utilizing methanogenesis, exhibiting no linearity with

40
time due to the occurrence of time-lag, as can be seen in Fig. 2.16. This may have arisen from the complexity of cellulose degradation, as it was different from the direct methanogenesis substrates such as H2/CO2 and acetate. This experiment showed a marked improvement in methanogenic activities for H2/CO2 and acetate in the earlier stage of cultivation, increased by a factor of 3.5 and 10 respectively on the 41st day. Then, both activities remained unchanged or rather started to decrease. Both activities lowered eventually to half of the respective peak values at the final run. This can be explained as following. Since the membrane reactor does not allow cells to escape out, a long SRT is a natural consequence of the membrane reactor. A relatively small supply of substrate induced also a long SRT and a resultant endogenous growth phase. Therefore it can be considered that the net growth in the late stage balanced with the autolysis, resulting in the observation of no apparent increase of MLVSS. This deduction also accounts for the fact of deterioration of methanogenic activities.
Fig. 2.15 Time Course of Membrane Permeate Flux (Small arrows indicate periodical washings of membrane by flushing, and large arrows
indicate the exchange of membrane to new one) (Source: Harada et al., 1994)
Fig. 2.16 Behavior of Methanogenic Activity from Cellulose along Cultivation Time (Source: Harada et al., 1994)

41
Kimura (1991) reported a research project intended for waste reuse and energy recovery. The objective was to develop low cost treatment processes utilising bioreactors coupled with membrane separation units to produce reusable water from industrial wastewater. Two of the membrane coupled anaerobic bioreactor system flow diagram reported by Kimura (1991) are shown in Fig. 2.17 and 2.18.
A comparison of different studies with anaerobic bioreactor followed by membrane separation is presented in Table 2.7. 2.9.3 Fouling Characteristics between Inorganic and Organic Membrane As discussed in the preceding sections, greater attentions have been made in the coupling of anaerobic bioreactor with membrane instead of settling tank. But inherent fouling problems and maintenance of sustainable flux lead to limited full scale application of this technology. A study was carried out by Kang et al. (1996) to compare the fouling characteristics between inorganic and organic membranes in membrane coupled anaerobic system for the treatment of alcohol-distillery wastewater.
The anaerobic digester maintained at thermophilic temperature of 55oC was directly connected to a tubular type membrane module. The membranes used for comparison were polypropylene microfilter (0.2 µm) and zirconia skinned ceramic microfilter (0.14 µm). Various resistance were measured experimentally including internal fouling resistance (Ri) and cake layer resistance (Rc) are shown in Table 2.8. During the crossflow microfiltration of anaerobic broth, almost no cake layer was observed on the surface of inorganic membrane. But the inorganic foulant (struvite, MgNH4PO4.H2O) inside the pores played a key role in limiting the flux. Ri represented 90% of total resistance. In case of organic membrane about 13 µm thick cake layer was formed due to its much rougher surface structure. The anaerobic biomass was the major constituent of the cake but the amount of strutive deposited was merely one forth of that of ceramic membrane. 2.10 Clogging Mechanisms in Microfiltration The following four different types of clogging mechanism are observed in a filtration system:
• Complete blocking occurs when particles plug the capillaries; • Cake filtration involves the formation of a porous layer on the membrane surface
which poses an additional resistance; • Standard blocking occurs when solids adhere to the walls of the capillaries which
reducing their internal diameter. Standard blocking was observed to be the most common in the absence of cake filtration.
• The fourth mechanisms was called “ intermediate blocking ” because of the rate of blocking falls between cake filtration and standard blocking.
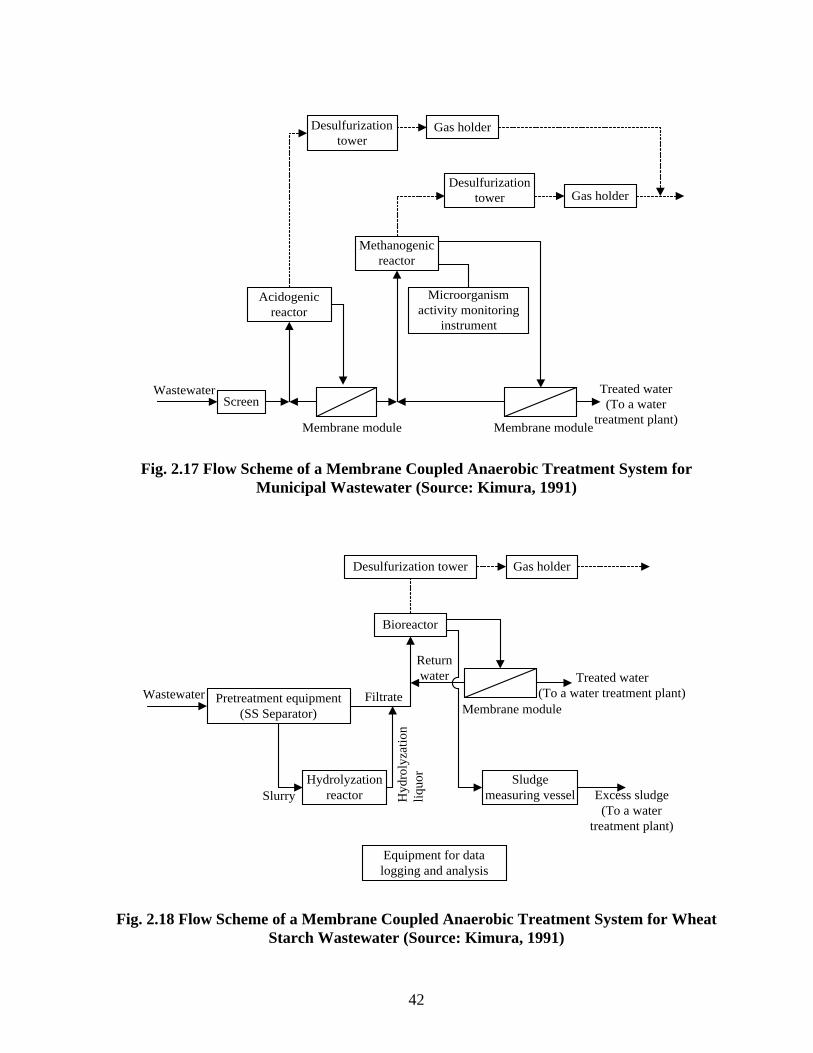
42
ScreenWastewater
Membrane module Membrane module
Treated water(To a water
treatment plant)
Acidogenicreactor
Microorganismactivity monitoring
instrument
Methanogenicreactor
Desulfurizationtower
Desulfurizationtower
Gas holder
Gas holder
Fig. 2.17 Flow Scheme of a Membrane Coupled Anaerobic Treatment System for Municipal Wastewater (Source: Kimura, 1991)
Desulfurization tower Gas holder
Bioreactor
Pretreatment equipment(SS Separator)
Hydrolyzationreactor
Sludgemeasuring vessel
Membrane module
Treated water(To a water treatment plant)
Equipment for datalogging and analysis
Wastewater Filtrate
Returnwater
Hyd
roly
zatio
nliq
uor
Slurry Excess sludge(To a water
treatment plant)
Fig. 2.18 Flow Scheme of a Membrane Coupled Anaerobic Treatment System for Wheat Starch Wastewater (Source: Kimura, 1991)

43
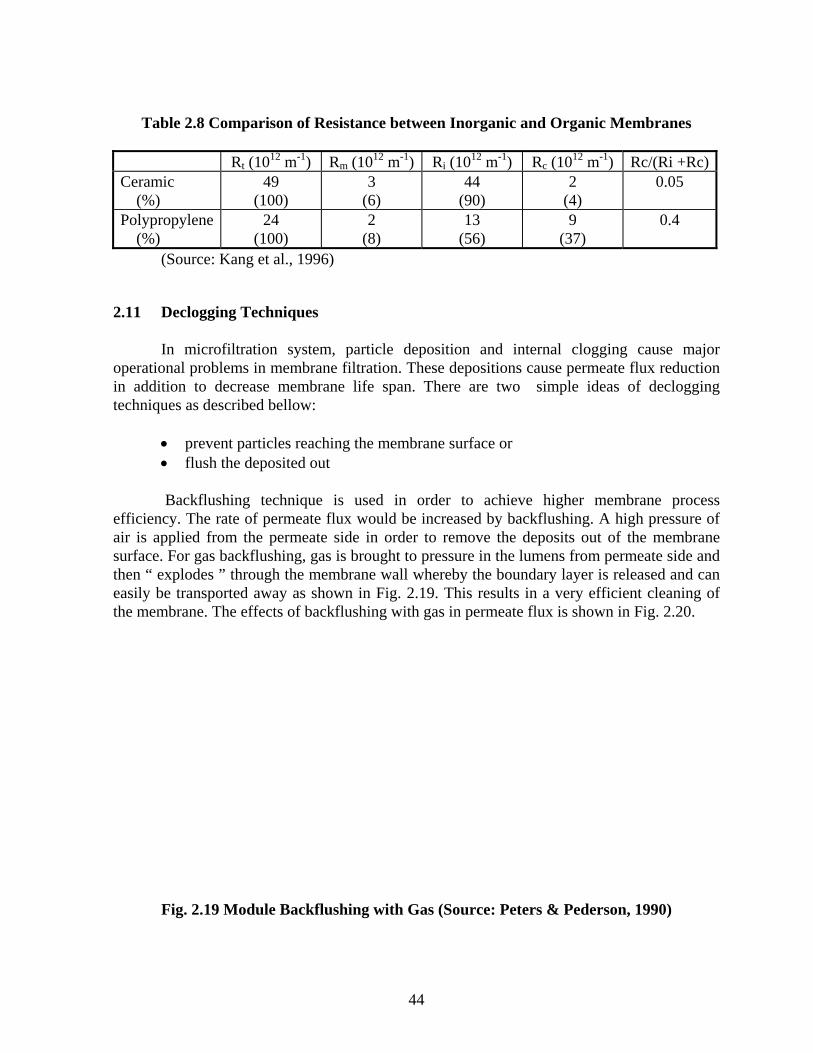
44
Table 2.8 Comparison of Resistance between Inorganic and Organic Membranes
Rt (1012 m-1) Rm (1012 m-1) Ri (1012 m-1) Rc (1012 m-1) Rc/(Ri +Rc)Ceramic (%)
49 (100)
3 (6)
44 (90)
2 (4)
0.05
Polypropylene (%)
24 (100)
2 (8)
13 (56)
9 (37)
0.4
(Source: Kang et al., 1996) 2.11 Declogging Techniques In microfiltration system, particle deposition and internal clogging cause major operational problems in membrane filtration. These depositions cause permeate flux reduction in addition to decrease membrane life span. There are two simple ideas of declogging techniques as described bellow:
• prevent particles reaching the membrane surface or • flush the deposited out
Backflushing technique is used in order to achieve higher membrane process efficiency. The rate of permeate flux would be increased by backflushing. A high pressure of air is applied from the permeate side in order to remove the deposits out of the membrane surface. For gas backflushing, gas is brought to pressure in the lumens from permeate side and then “ explodes ” through the membrane wall whereby the boundary layer is released and can easily be transported away as shown in Fig. 2.19. This results in a very efficient cleaning of the membrane. The effects of backflushing with gas in permeate flux is shown in Fig. 2.20.
Fig. 2.19 Module Backflushing with Gas (Source: Peters & Pederson, 1990)

45
Fig. 2.20 Effect of Gas Backflushing during Wine Filtration (Source: Vigneswaran et al., 1991)
2.12 Fundamentals of Gas Transfer Gas transfer is defined as the process by which gas is transferred from gas phase to liquid phase. Oxygen transfer in the biological treatment of wastewater is the most common application in field of wastewater treatment. Due to the low solubility of oxygen, normal surface air-water interfaces cannot provide sufficient oxygen. To satisfy the requirement of aerobic waste treatment, aeration devices are used to create additional gas-liquid interface. The rate of molecular diffusion of a dissolved gas in the liquid depends on the characteristics of the gas and the liquid, temperature, concentration gradient and the cross-sectional area across which diffusion occurs. Eq. 2.8 is used to explain the two-film theory of gas transfer schematically represented in Fig. 2.21.
rm K A C Cg S= −( ) Eq. 2.8
where rm = rate of mass transfer (mg/s) Kg = coefficient of diffusion for gas (L/m2.s) A = area through which gas is diffusing (m2) CS = saturation concentration of gas in solution (mg/L) C = concentration of gas in solution. (mg/L)

46
Distance frominterface
0
P
P1
C
C1
dg d l
Interface
Liquid phase(bulk)
Gas phase(bulk)
Turbulent flow Laminar flow Turbulent flow
Gasfilm
Liquidfilm
Parti
al p
ress
ure
or c
once
ntra
tion
Fig. 2.21 Schematic of Two-Film Theory of Gas Transfer (Source: Tchobanoglous, 1991)
Under the conditions of mass transfer encountered in the field
r VdCdtm = Eq. 2.9
So, Eq. 2.9 can be written as:
( )rdCdt
KAV
C CC g S t= =⎛⎝⎜
⎞⎠⎟ − Eq. 2.10
KAV
K ag L⎛⎝⎜
⎞⎠⎟ = Eq. 2.11
Therefore Eq. 2.10 can be written as:
( )rdCdt
K a C CC L S= = − Eq. 2.12
where rc = change in concentration, (mg/L.s) KLa = overall mass-transfer coefficient, (s-1) V = volume of gas (L) Eg. 2.12 could be modified to the practical form which is presented as follow:

47
( ) ( )Log C C Log C C K a tS S O L− = − − 2 3. * / Eq. 2.13 where C0 = initial concentration of gas in liquid phase CL = concentration of gas in liquid phase
For a given volume of water being aerated, oxygen-transfer can be evaluated on the basis of the quantity of oxygen transferred per unit of air, which is introduced to the water with equivalent conditions (temperature and chemical composition of the water, depth at which the air is introduced, etc.). To measure oxygen transfer in clean water, the accepted testing procedure involves the removal of disolved oxygen (DO) from a known volume of water by addition of sodium sulfite followed by reoxygenation near the saturation level belonging to the water temperature. The DO of the water volume is monitored during the reaeration period by measuring DO concentration at several different points. The data obtained were then analyzed to estimate the apparent volumetric mass-transfer coefficient, KLa. These estimates of various point of DO are adjusted to standard conditions (Eckenfelder, 1989). 2.13 Applications of Gas Diffusion through Membrane Semmems et al. (1991) developed a bubbleless hollow-fiber membrane aerator and tested for oxygenation of water . The aerator houses a bundle of sealed, hollow, gas permeable fibers that are filled with pure oxygen under pressure. By considering Eq. 2.11 for mass transfer; raising the oxygen transfer efficiency could be accomplished by increasing KLa and Cs values eventhough, practically the external surface area of membrane is fixed. Therefore large KLa can be achieved with the action of elongated stationary bubbles of oxygen. Very high value of Cs can also achieved if specially coated membrane are used, of which it can be operated at pressures up to 60 psi with pure oxygen. At temperature of 10 o C and a flow rate of 4.73 L/sec (75 gal/m) through the pipe, dissolved oxygen of water is ranged from 0 - 23.1 mg/L. Pierre et al. (1988) investigated bench-scale experiments using both dense polymer membrane and porous membrane as an aeration units. Bubble-free aeration using membranes has potential applications for wastewater treatment when conventional bubble aeration gives unsatisfactory results, such as toxic volatile organic compound stripping or foam production. In order to find out the design parameters of membrane aerators, both types of membrane were immersed directly in well-mixed biological reactor.
Three systems which were studied for these experiments based on different settings of design parameters such as:

48
• Specific oxygenation capacity • Mass transfer characteristics of the membranes • Type of gas and • Operating gas pressure
Three operation modes consist of A, B and C were conducted in order to define the
essential design parameters for membrane aerator. Cases A and B used 5 and 9 bar. Case C was evaluated by using pressurized industrial oxygen. The mass transfer analysis indicated that the high oxygen flux were based on surface area of the membrane. The optimal value of 38.3 m2 membrane per m3 aeration basin was suggested to meet the aeration requirements of conventional bioreactor (100 g O2/m3.h) while the high- rate bioreactor required 213 m2/m3. The fraction of oxygen transferred is a design choice. The value of 0.8 was much higher than that possible with conventional diffused or mechanical aeration. As the fraction of oxygen transferred is increased, however, the average driving force decreases. Limitations of membrane aerator were due to the high capital cost according to the membranes. Furthermore, the membrane themselves seem to represent as an additional resistance to oxygen transfer, which could be translated into high energy cost. However, it is suggested that applications should be developed with industrial oxygen in order to reduce the requirement of membranes. Tariq and Semmems (1992) studied the mass transfer in a various pore diameter of hollow fiber membrane aerator. Individually-sealed hollow fibers were filled with oxygen and immersed in a flowing stream of water. Three experiments have been checked by measuring the pressure drop, gas flow velocity and gas composition along the length of the fibers. Pressure drop was measured according to the difference between inlet and outlet. The pressure drop due to friction across the 362 cm length was negligible. By calculating, the optimum operating pressure was below 6.8 - 20.7 kPa (1-3 psi). Gas flow velocity inside the fiber depend on the mass transfer coefficient. The gas flow velocity was ranged from 0.008 cm/sec to 0.03 cm/sec. The decrease of oxygen partial pressure inside the fiber was observed along the fiber length. Better oxygen transfer could be achieved by pumping oxygen continuously through the hollow fibers in addition to removing accumulated nitrogen due to the back diffusion from outside to inside the fibers. Feeding of pure oxygen encourages nitrogen enter the fiber. Since partial pressure of nitrogen within the fiber is less than external partial pressure of approximately 0.79 atm, back diffusion along the fiber occurred. However, the nitrogen back diffusion rate dose not increase significantly when operated with high water flow velocity outside the fiber and high oxygen feed flow rate inside the fiber in order to decrease the nitrogen concentration gradient and increase oxygen concentration gradient between outside and inside the fiber respectively.

47
CHAPTER III
Methodology
The experimental investigation carried out can be divided into four parts as described bellow:
• measurement of initial membrane resistance; • measurement of gas transfer efficiency of stone air diffuser and membrane
modules; • short term experimental runs to identify the optimum backwash air pressure; and • long term experimental runs to evaluate the membrane bioreactor performance.
3.1 Membrane Modules Used in the Experiments Two polypropylene hollow fiber microfiltration membrane modules were used through out the study. One of these membrane module is shown in Fig. 3.1. These membrane modules having the unique feature of gas back washing (Fig 3.2) for membrane declogging were manufactured by Memtech Ltd., Australia. Some of the membrane properties specified by the manufacturer are reported in Table 3.1.
Fig. 3.1 Membrane Module

48
Permeate
(a) Filtration
Permeate
(b) Air backwashing
Air
Air
Fig. 3.2 Schematic Representation of Filtration and Air Backwashing in a Hollow Fiber
Table 3.1 Properties of a Membrane Module
Mean pore size (µm) Maximum gas backwash pressure (kPa) Normal flux (L/m2.h.bar) at 20oC Surface are based on lumen area (m2)
0.2 700
100 - 200 1
(Source: Khoo, 1997) 3.2 Measurement of Initial Membrane Resistance The experimental setup for the measurement of initial membrane resistance is shown in Fig. 3.3. Each membrane modules were immersed separately in a rectangular tank having a working volume of 80 L. The tank was filled with ultrafiltered tap water. The water was withdrawn through the membrane by a suction pump and the suction pressure was measured by a vacuum gauge. At different suction pressures, flux through the membrane were recorded. During the experiment, the withdrawn water was returned to the tank to keep the water level in the tank constant. The initial membrane resistance measurement was carried before the gas transfer coefficient measurement. The relationship between the flux and transmembrane pressure is given in the following equation :
J = δP / µRm Eq 3.1 where J = flux (L/m2.h) δP = transmembrane pressure (kPa) µ = viscosity (kN.s /m2) Rm = apparent membrane resistance

49
For flux measurement
Vacuum gaugeSuction pump
Ultra filtered tap water
Membrane module
Recycle line
Fig. 3.3 Experimental Setup of Membrane Resistance Measurement
But the apparent membrane resistance is contributed by initial membrane resistance and the resistance due to the solid deposition as shown in equation Eq. 3.2.
Rm = Rmo + Rd Eq. 3.2 where Rmo = initial membrane resistance Rd = membrane resistance due to the deposition of solids
When using ultrafiltered water, there is no solid deposition so the term Rd in equation
Eq. 3.2 is redundant. The modified equation to find the initial membrane resistance when clean water is used will be:
δP = µ.Rmo.J + δPo Eq. 3.3
where δPo = initial transmembrane pressure required to over come the air blocking effect. Based on the equation Eq. 3.3 Rmo was determined by plotting the variation of flux with transmembrane pressure. 3.3 Measurement of Gas Transfer Efficiency of Aeration Units

50
In this phase, experiments were carried out to find out the gas transfer efficiency of the ceramic stone diffusers and membrane modules. The materials used in this phase of study are as described bellow. Aeration units:
ordinary ceramic stone diffusers micro filtration membrane modules.
Clean water:
Tap water was pre-filtered by using cartridge ultra-filter to produce clean water. Chemicals:
Sodium sulfite ( Na2SO3 ) and Cobalt chloride ( CoCl2 ) Dissolved oxygen probe:
A dissolved oxygen (DO) probe was used to measure DO concentration in the water. The sampling points were at the head, middle and at the end of reactor. The position of each point (19 cm below the water surface) was at the middle of water depth.
Turbine mixer
For the both cases a turbine mixer at the speed of 50 rpm was used to promote turbulence and homogenous mixing. The experimental setup for stone air diffusers and membrane modules are shown in
Figs. 3.4a and 3.4b respectively. The aeration units connected to an air compressor were placed at the bottom of the rectangular tank consisting a working volume of 80 L. For each trial the tank was filled with fresh ultrafiltered water. The measurement of gas transfer coefficient was started with the deoxygenation of the water by adding 8 mg/L of Na2SO3 per mg/L of DO with 0.05 mg/L of CoCl2 as catalyst (Eckenfelder, 1989). Then the turbine mixer was started to mix the tank content. After that the aeration unit was started at the desired airflow rate/air pressure. Air flow rate and air pressure were used as the controlling parameters for stone air diffusers and membrane modules respectively. Increase in DO concentrations were recorded at every two minutes, until it reach the 90% saturation level. For each measurement, DO concentration at three sampling points (at the middle of water depth along the tank head , middle and end) were checked. Trial was repeated at 9, 14 and 18 L/min for stone diffusers and at 25, 50, 100, 140 and 200 kPa for each membrane module. Experimental temperature also recorded for each trial and in the case of membrane modules corresponding air flow rate also recorded.

51
Compressed air
Stone air diffusers
(a) for stone air diffusers
Compressed air
(b) for membrane modules
Fig. 3.4 Experimental Setup for Gas Transfer Efficiency Measurement The overall transfer coefficient for each trial was calculated from the following Eq.
2.13.
log (Cs -CL) = log (Cs-Co) -(KLa/2.3)*t where Co = initial concentration of gas in liquid phase (mg/L) CL = concentration of gas in liquid phase (mg/L) KLa = overall mass-transfer coefficient (s-1)

52
3.4 Operating Backwash Air Pressure 3.4.1 Experimental Setup A rectangular tank (700 mm × 300 mm × 500 mm) was constructed with a transparent acrylic plastic sheet and both membrane modules were placed in the tank. These membrane modules were connected to the suction pump and compressed air supply through four solenoid valves as shown in the Fig. 3.5. The solenoid valves were connected to the timer arrangement to regulate their intermittent on/off operation. The compressed air supply was connected to the membrane through the regulator, air filter and air flow meter. All connections to membrane were made by 6 mm diameter hard plastic transparent pipes. The reactor was filled with the mixed liquor of 80 L having the MLSS concentration of about 17,500 mg/L. The seed sludge for this study was obtained from the previous study by Pliankarom (1996), and MLSS concentration was increased to above mentioned value by feeding septage. 3.4.2 Process Description In this phase of study, while one membrane was under filtration the other one was backwashed with compressed air. To effect this cyclic operation timer arrangement was set in such a way that each membrane module under filtration for 15 minutes and air back washing for 15 minutes (15:15 operational mode) alternatively. This operational mode was identified as the optimum mode by Maythanukhraw (1995). Flux variation with time over a period of six hours was measured at different backwash air pressure of 50, 100, 150 and 200 kPa. Due to the air compressor’s limitations, the maximum operating backwash air pressure was limited to 200 kPa. Thus considering the limitation 150 kPa backwash air pressure was used as optimum and at this pressure trial was repeated for 26 hours to see the effects on long run. In addition another trial was carried for 26 hours under continuous filtration through the membrane modules without air backwashing, in order to compare the flux improvement in the cyclic operation with air backwashing. Because each membrane module gave different flux at same transmembrane pressure, both modules were connected in series for continuous filtration mode. By doing so average flux of both membrane was obtained. 3.5 Long Term Experiments on Membrane Bioreactor 3.5.1 Experimental Setup
The photograph and the schematic diagram of the experimental setup are shown in Figs. 3.6 and 3.7 respectively. The main reactor (membrane bioreactor) containing membrane modules, compressed air supply and suction pump connection to the membrane modules through the solenoid valve with timer arrangement are the same as described in section 3.3.

53
Compressed air
Vacuum gauge
Suction pump
For fluxmeasurement
Timer
Fig. 3.5 Experimental Setup to Find Out the Optimum Air Backwash Pressure
Fig. 3.6 Experimental Setup

54
Com
pres
sed
air
Feed
tank
Vac
uum
gau
ge
Suct
ion
pum
p
Trea
ted
wat
er ta
nk
Mem
bran
em
odul
e
Com
pres
sed
air
V1
V2
V2
V2
V2
Fig
3.7
Sche
mat
ic D
iagr
am o
f the
Exp
erim
enta
l Set
up fo
r L
ong
Ter
m E
xper
imen
ts
Feed
pum
p
Leve
lse
nsor
Ston
e ai
r diff
user
sA
noxi
c ta
nkM
embr
ane
bior
eact
or
Rec
ircul
atio
npu
mp
V1
V2
- Air
flow
met
er
- Air
filte
r
- Gat
e va
lve
- Sol
onid
e va
lve
- Cur
rent
sign
al
Tim
er

55
However the bioreactor was provided with stone air diffusers at the bottom center of the tank to aerate the mixed liquor whenever the aeration by the membrane backwashing was deficient. Feed wastewater from the feed tank to the main reactor pass through an intermediate tank known as anoxic. The working volume of the anoxic tank for the first three runs was 40 L and for the last 120 L. Increase in working volume of the anoxic tank was necessary to maintain the recycling ratio of more than 100 % with an HRT of 90 minutes in anoxic tank. As the name implied the anoxic tank was not supplied with air to enhance the denitrification, was stired by a turbine mixer to keep the mixed liquor in suspension and to mix well the incoming feed. Flow of wastewater from feed tank was controlled by a floating valve arrangement. To prevent any settlement of solids in the feed tank, content was stirred by a turbine mixer. However due to frequent clogging problem associated with the floating valve arrangement, feed was directly introduced to the anoxic tank by a speed controlled roller pump during the last run. The anoxic tank and main reactor were simply connected by a 20 mm diameter PVC pipe so that the mixed liquor from anoxic tank to MBR flow under plug flow condition and maintain water level in both tank were always constant. Nitrified mixed liquor from the MBR was recirculated to the anoxic tank by a speed controlled roller pump, in such a way that the recycled flow had 90 minutes retention time in the anoxic tank and the recycle ratio was more than 100 %. A centrifugal pump was used to fill the feed tank and operation of the pump was controlled by a level sensor switch (during first three runs). 3.5.2 Process Description In this phase of study also the operation mode was maintained as 15:15. Effect on membrane bioreactor performance and the transmembrane pressure were studied at different HRTs of 15, 10, 6 and 3 h. At the HRT of 15 and 10 hours reactor was operated for 20 days and at 6 hours operated for 15 days. The last run has lasted for more than a month. During each run various parameters were observed to evaluate the bioreactor performance. Transmembrane pressure was measured by a vacuum gauge. Since the air supply by membrane backwashing was inadequate to maintain the desired DO concentration in the reactor, supplementary aeration at the rate of 2 L/min. and 4 L/min, were effected by the stone air diffusers during entire Run III and 58th to 67th day of Run IV respectively. From 71st day onward supplementary aeration was suspended and backwash air pressure was increased to 200 kPa till 78th day. Backwash air pressure was further increased to 250 kPa from 80th day onward of the experiment. Feed wastewater for this study was AIT wastewater added with about 5 - 10 % of settled sepatge so that the feed can reflect the typical domestic wastewater characteristics. The characteristics of the feed wastewater are tabulated in Table 3.2 3.5.3 Monitoring of the MBR and Analytical Methods The analysis in this experiment carried out in accordance with the procedure demonstrated by American Public Health Association (1989) except for nitrate determination. Nitrate analysis done by sodium salicylate methods described in laboratory instruction sheets (Asian Institute of Technology, 1996). To 10 mL of sample (filtered and appropriately diluted), 1 mL of 0.5 % sodium salicylate was added. The resulting solution was heated to

56
dryness at 105oC. The container was cooled in a dessicator. After that, 1 mL of concentrated H2SO4 was added to dissolve the residue and the solution let stand for 10 minutes. 8 mL of distilled water was then added cautiously and the resulting solution allowed to cool down. 7 mL of 30 % NaOH was added to develop the yellow color. The solution was transferred to a 25 mL volumetric flask and the flask filled to mark with 2.5 % NaOH. The solution was then thoroughly mixed and the color measured spectrophotometrically at 420 nm against a standard calibration curve. Since the mixed liquor is a non newtonian fluid, viscosity measuremant was carried out at a specific condition. The container used for the viscosity measurement was 1 L beaker at 31oC, with a spindle speed of 30 rpm. Details of frequency of analysis, sampling points and method of analysis are presented in Table 3.3.
Table 3.2 Characteristics of the Feed Wastewater.
Parameters Unit Range Temperature pH Suspended Solids (SS) Volatile Suspended Solids (VSS) Chemical Oxygen Demand (COD) Biochemical Oxygen Demandm (BOD) Total Kjedhal Nitrogen (TKN) Total Phosphate (TP) Total coliform Fecal coliform
oC -
mg/L mg/L mg/L mg/L mg/L mg/L
No/100 mL No/100 mL
28.5 - 31.5 7.3 - 8.5 145 -290 100 -203 540 - 625 295 - 375 27 - 182 1.6 - 8.2 107 -108
106 -107
In addition microbial popultion in the mixed liquor was observed through the microcope during each run. To identify the sludge characteristics following parameters were measured for the mixed liquor from the reactor once per run.
• Sludge Volume Index (SVI) • Capillary Suction Time (CST) • Total Solids (TS) • Total Volatile Solids (TVS)
3.5.4 Membrane Cleaning Membrane modules were cleaned after second and third runs to remove the reversible clogging. The cleaning was carried out in two steps. First the membrane was removed from the reactor and washed with water followed by air diffusion for 5-6 hours. Just after this membrane resistance was measured to check the cleaning efficiency. After this chemical cleaning of the membrane was carried out. First, the cleaning solution was prepared by mixing 720 mL of 50% Sodium hydroxide solution and 280 mL of Memclean C solution in 50 L dechlorinated ultrafiltered tap water at 35oC. Membrane modules were submerged in the

57
solution and the solution was filtered at 30 kPa for half an hour. After that the modules were soaked in the solution for another two hours Then the modules were washed with clean water and the membrane resistance was measured again with procedure described in section 3.2.
Table 3.3 Sampling Points and Analytical Methods for Parameter Analysis
Parameter Frequency of Analysis
Sampling Points
Apparatus/ method
pH Everyday Inf/Anoxic/MBR
pH meter
DO Everyday Anoxic/MBR DO probe Temperature Everyday Inf/Anno/MBR Thermal sensors Color Once in three days Eff B.D.H lovibond Nesslerizer with color disk Turbidity Once in three days Eff Hach turbidimeter MLSS & MLVSS Once in three days Anoxic/MBR Filtration/Evaporation/Volatilization COD Once in three days Inf/Eff Closed reflux, titrimetric method BOD Weekly Inf/Eff 5 day incubation at 20oC TKN Once in three days Inf/Eff Digestion / Distillation NO2-N Once in three days Inf/Eff Calorimetric NO3-N Once in three days Inf/Eff Sodium Salicylate Total-Phosphate Once in two days Inf/Eff Calorimetric Total coliform Once per run Inf/Eff MPN method Fecal coliform Once per run Inf/Eff MPN method
Inf - Influent Eff - Effluent Anno - Annoxic Tank MBR - Membrane Bioreactor

58
CHAPTER IV
Results and Discussion
4.1 Initial Membrane Resistance Prior to the use of membrane modules in the experimental runs, initial membrane resistance was measured for both modules. The variation of flux with transmembrane pressure at above mentioned conditions are shown in Fig. 4.1 (see Table A-1 of Appendix A for experimental results) and from this plot it could be noted that the variation is linear correspond to the relationship shown Eq. 3.2. The calculated values of membrane resistance and the normalised flux at 1 bar pressure are given in Table 4.1.
Table 4.1 Initial Membrane Resistance and Normal Flux for the Membrane Modules
Initial Membrane Resistance (Rmo) (m-1)
Normal Flux (L/m2.h)
Module I Module II
8.19 * 1011
6.34 * 1011
535
684
Note: Viscosity of the water at 29.7oC is 0.804 * 10-3 N.s/m2
For the case of normalised flux, the obtained values for both membranes are two to three times higher than the value reported by the manufactures which is 100-200 L/m2.h (Table 3.1). However the values reported by manufactures are based on the flux measurement on a carbon filtered tap water at 20oC whereas the measurement in this study was carried with ultrafiltered water at 30oC. On this ground, high flux is expectable. In addition, difference in normal flux between the two membrane modules are significant and this difference in membrane performance was observed through out the study period as described in later sections. However values are some what closer to the values (300 and 350 L/m2.h) obtained by Pliankarom (1996), who used the similar membrane modules manufactured by the same manufactures. Since these modules were specially manufactured upon request for the purpose of these studies only, the inconsistency on the results may be justifiable. It is important to know the initial membrane resistance, so that it will be possible to evaluate the membrane cleaning procedures. Membrane cleaning performance based on membrane resistance is described in section 4.5. 4.2 Gas Transfer Efficiency

59
One of the main objectives of this study is to find out the feasibility of using membrane modules as the aeration device instead of conventional aerators. To verify this, gas transfer coefficient of stone air diffusers and membrane modules were measured and compared. Increase of oxygen concentration in pure water with time when using stone air diffusers is shown in Fig. 4.2. The experimental results are shown in Table B-1 of Appendix B. From this it can be noted that at the air flow rate of 9 L/min., DO level of the water reach the steady state. As it could be noted the increase of oxygen concentration is rapid when higher air flow rate is used and reach the saturation level quickly. Similarly for membrane modules increase in air pressure lead to the rapid increase in DO concentration in the pure water. The experimental results of membrane modules are shown in Tables B-2 and B-3 of Appendix B. To calculate the gas transfer coefficient of aeration units, the Eq. 2.13 was used. Accordingly variation of Cs-Ct with time in semi-log scale is plotted for stone air diffusers and membrane modules (Figs. 4.3, 4.4 and 4.5) and KLa values were calculated using linear regression. To compare the performance of the aeration units, calculated KLa values are corrected for 20oC. Fig. 4.6 shows the variation of KLa at different air flow rate for stone air diffusers and membrane modules. For all aeration units, the gradient of KLa with increased flow rate shows a decreasing trend except for membrane module II at 200 kPa air pressure (31.5 L/min.) From this comparison it can be concluded that the gas transfer efficiency of membrane modules are superior than that of stone diffusers. Higher KLa value of membrane module II compared to membrane module I again follows the trend that of initial flux. From this it may be concluded that the porosity or nominal pore size of the membrane module II is slightly larger than that of membrane module II. The gas transfer coefficient KLa is a function of depth where gas is introduced and effective gassed area (Dudley, 1995). The larger effective gassed area by membrane module than stone diffusers while the gas introduction point was identical, might be the cause for the better performance of membrane modules in terms of gas transfer. Formation of fine air bubbles at lower air pressure would be another reason for the higher KLa values of membrane modules compared to stone air diffusers. 4.3 Backwash Air Pressure
Series of trials were investigated to find out the effect of air pressure on back washing efficiencies of membrane modules during filtration. For this purpose filtration flux through membrane modules were observed at 15:15 operation mode (15 minutes filtration and 15 minutes air back washing) with different backwash air pressure for 6 hours. In all experiments the MLSS concentration of the activated sludge was maintained around 17,000 mg/L. Variation of flux with time at each backwash air pressure investigated is shown in Fig. 4.7. The experimental results are shown in Table C-1 to C-4 of Appendix C. In addition the decline in flux with time during continuos filtration without air back washing also shown in Fig. 4.7 to show the effect of air flushing in comparison to continuos filtration.

60

61

62

63
64
From this experimental results it can be observed that, at the beginning all backwash air pressures except 150 kPa give similar recovery. For 150 kPa backwash air pressure, Module II gives a very high initial flux, however in later stage flux of this module also show similar trend as of other cases. In addition, in a long run, flux recovery is better for higher backwash air pressure. This is evidenced by the flux variation in the 6th hour of experiment for 150 and 200 kPa backwash air pressures. During this period, flux with 200 kPa backwash air pressure tend to improve further while the flux with 150 kPa backwash air pressure seems to be stabilising at that level. A similar trend could be seen at 50 and 100 kPa backwash air pressures. In addition the slow flux decline rate for cyclic operation with air back washing is distinctly seen compared to continuos suction.
From these observations it can be concluded that cyclic operation with air back
washing improve the flux recovery compared to continuos filtration. Further, increase in backwash air pressure improve the flux recovery in a long run. However due to the limitation of air compressor to supply air continuously at 200 kPa pressure, it was decided to conduct the long term experiments with the cyclic operation of 15:15 and a backwash air pressure of 150 kPa.
To study the long term effect of flux recovery in above identified cyclic operation
mode compared to continuos filtration, experiments were carried out on these modes for over 26 hours. The trend in flux variation with time for both operation modes is shown in Fig. 4.8 and the experimental results are tabulated in Tables C-5 and C-6 of Appendix C. From this studies it can be seen, in continuos filtration and cyclic operation flux decline continuously. However the flux decline in continuos filtration more or less smooth and always tend to detoriate throughout whereas in cyclic operation flux decrease is not smooth and in certain instances flux tend to improve (between 10 and 16 hours) though it could not recover to original level.
In this study, after 26 hours of operation flux improved by 90 % compared to
continuos filtration. Considering the flux change trend from 23rd hour onward, the flux of continuos filtration tend to further decline whereas in cyclic operation flux tend to improve. Based on this fact, it can be further concluded that this percentage improvement will further increase, i.e. even more than 90 %.
However due to this cyclic operation half of the membrane filtration time is lost. If this
loss in filtration time is taken into account there is no net flux gain at 26th hour compared to continuos operation. However as mentioned earlier, in a long run flux gain tend to improve further means there is a net flux gain in long run. In addition backwashing of membranes with air in submerged mode means aeration of activated sludge, so there is an added advantage of eliminating the conventional aeration unit.

65

66
67
4.4 Long Term Experiments In order to find out the feasibility of applying membrane bioreactor for domestic wastewater treatment, this study was carried out for 100 days with different operating conditions. This MBR system consist of anoxic zone in addition to the oxic zone aimed for the complete removal of nitrogen during the treatment process. Performance data for the different operating conditions are discussed in the following sections. 4.4.1 Hydraulic Retention Time Performance of MBR system was investigated solely by varying HRT. The HRT maintained in the MBR include 15, 10, 6 and 3 h for Run I, Run II, Run III, and Run IV respectively. The HRT values during each run were maintained at constant level by measuring cumulative volume of permeate flux continuously. Whenever increase in HRT was observed, pump speed was increased to maintain the operating HRT constant.This increase in HRT could be attributed to the plugging of micro-pores which could not be removed by air back washing. However during the Run IV the HRT could not be maintained at 3 h because, within a day the transmembrane pressure reached to 96 kPa. For suction this could be a limitation and as a result flux continued to decrease, leading to increased HRT. During the first seven days of Run IV, HRT increased to 4 h and 45 min, but in next three days it further increased to 6 h and 15 min. The slow increase in the first seven days could be mainly because of lower MLSS concentration (8,200 mg/L). From seventh day onward sludge wastage was temporally stopped and influent COD was increased (1200-1500 mg/L) with the aim of increasing the MLSS concentration to the level similar to earlier runs. This sudden increase in MLSS concentration could be the main reason for the rapid increase in HRT during last three days. After MLSS concentration reached a value of 12,400 mg/L chemical cleaning of membrane was performed twice but in each time the HRT reached to around 6 h after seven days operation. However this increase in HRT reached to maximum value of 9 h on 14th day and after that it fluctuate in between 8 and 9 h. Recirculation flow to anoxic tank was maintained in such a way the return sludge reside in the anoxic tank for 1.5 h in all runs. To maintain this, recirculation flow at each run was adjusted. The recycle ratios at each run are listed in Table 4.2.
Table 4.2 Mixed Liquor Recycle Ratio at Different HRT
HRT (h) Recycle Ratio (%) 15 10 6 3
400 233 100 200
Sludge retention time in the MBR was maintained at 50 days for all runs. This was achieved by deliberately wasting 1.6 L of mixed liquor from the MBR. This sludge wastage

68
help the microbes in a growth phase. However if whole the system (MBR and anoxic tank) is taken into account, the SRT was 75 days for first three runs and 125 days during the last run. 4.4.2 Transmembrane Pressure
Fig 4.9 shows the variation of transmembrane pressure with time for module I and II during different HRT. For the first three runs the transmembrane pressure increase during beginning of the run and stabilised at constant levels at the end of each run period. In case of Run IV transmembrane pressure increased to 96 kPa within a day and remain constant at that level for rest of the operation. Chemical cleaning of membrane twice during Run IV had the similar pattern of transmembrane pressure increase. The increase in transmembrane pressure could be attributed to the progressive pore plugging which could not be removed by air back washing at the beginning of each run. From Fig 4.9 it can be further noted, during long HRT (Run I) the time taken to reach the stabilised transmembrane pressure is long compared to the shorter HRT runs. This can be explained by the fact that at long HRT flux was low, so the chances of fouling materials carried towards membrane modules are less. The transmembrane pressure after stabilisation for each run is presented in Table 4.3.
Table 4.3 Stabilized Transmembrane Pressure for Different HRT
HRT (h) Transmembrane Pressure (kPa) Module I Module II
15 10 6 3
31 44 40 96
32 47 42 96
From the comparison in Table 4.3 it can be noted that the stabilised transmembrane pressure at 6 h HRT is lower than that at 10 h HRT. In addition transmembrane pressure at 10 h HRT have a peak values of 50kPa before reaching the constant value, such phenomenon was not observed in other runs. This abnormal behaviour of transmembrane pressure may be due to the long period of operation (40 days) without membrane cleaning and as a result more fouling materials accumulated created the peak transmembrane pressure. The stability of the foulants might have been disturbed as they got accumulated in the pores/membrane surface and due to the cyclic operation some foulants were removed consequently lead to lower constant transmembrane pressure. In addition during Run III, the microscopic examination on microbial population revealed that abundant number of protozoas present which was not the case in other runs. Protozoas normally scavenge the free swimming bacteria, so reduce the fine microbes in the mixed liquor and reduce the chances of pore plugging. This could be another cause for the reduced transmembrane pressure. However the transmembrane pressures observed by Pliankaron (1996) who used the similar type of modules at HRT of 10.5 h (58.8 kPa for module I and 64.1kPa module II) is higher than that observed at HRT of 10 h

69
HRT in this study. This difference may be justifiable based on the fact that the initial membrane resistance of the modules used and the MLSS concentration in this study are lower than that observed in the previous study. In the case of Run IV due to higher flux, more foulants were carried towards the module and it induced the rapid and firm (irreversible by air back washing) fouling of membrane modules. 4.4.3 Permeate Flux Permeate flux of both membranes are never identical and module II always had lower flux than module I (Fig 4.10). During the first 14 days of the Run I, flux in both modules remain constant. At this time due to the drop in cumulative flux suction pump speed was increased. As a result the flux of both module increased compared to the flux just before the adjustment. However the flux of module I increased and module II decreased in relation to the flux at the beginning. For Run II flux progressively increased for module I and decreased for module II through out the run. However the change in flux (increase/decrease) is not very high. For Run III a rapid flux variation in the initial period of run followed by more or less constant flux during the rest of the run was observed. During Run IV flux always continued to decrease and cumulative flux after a week operation lead to a situation of more than 6 h HRT. With the aim of recovering flux membrane modules were chemically cleaned twice, but in each occasion the HRT reached 6 h within seven days of operation. So the run was continued and the flux started to get more or less a steady state and at that time the HRT has fluctuated in between 8 and 9 h. This so happened after 14 days of last chemical cleaning of membranes. During this run after each membrane cleaning, module II gave more or less a similar initial flux (24 L/m2.h) but module I gave slightly low flux after third membrane cleaning (27.6 L/m2.h compared to 29 L/m2.h). Details of membrane resistance after cleaning is discussed later in section 4.5. It should be noted that the flux could be maintained to get a HRT of 6 h at a moderate transmembrane pressure of 42 kPa but it was not possible at Run IV with very high transmembrane pressure. After each membrane cleaning, back wash air pressure was increased by 50 kPa but very little improvement in flux was observed. From this it can be concluded that the increase in transmembrane pressure has lead to cake layer compaction and internal pore plugging and most of them could not be removed by air back washing. This seems to indicate that the specific resistance caused by cake layer and pore plugging is a strong function of the applied suction pressure, and the increase in resistance to filtration more than offsets the increased driving force. Similar phenomenon of lower flux at higher transmembrane pressure (80 kPa) was observed by Benítez et al (1995). This better flux rate at low transmembrane pressure can be explained by considering the critical flux operation theory, which says linear variation of flux at lower transmembrane pressure operation and there is a pressure (critical) beyond which there is no flux increase can be achieved even though the transmembrane pressure increased. In between this linear variation and critical pressure flux varies exponentially with transmembrane pressure.

70
4.4.4 Mode of Operation The optimum operation mode of 15:15 (15 minutes filtration and 15 air back washing) found by Pliankaram (1996) was used during Run I, Run II, Run III and initial period of Run IV. Since the Transmembrane pressure of Run IV increased to 96 kPa within a day it was anticipated 15 minutes of filtration lead to cake compaction and rapid flux decline. This flux declining trend during one cycle was measured (Fig 4.11) on the ninth day (HRT = 6 h and 40 min) of Run IV. Results are shown in Table D-9 of appendix D. From the results it can be noted that flux of module I declined to 12.6 L/m2.h from 16.8 L/m2.h within 14 minutes of operation (No flux in the first minute of the cycle). Similarly for module II flux declined to 10.8 L/m2.h from 12.1 L/m2.h. This rapid decline in flux would be due to the continuous compaction of cake layer and it was concluded that changing the operating cycle time can improve the flux. To find out the optimum cyclic operation mode, cumulative flux for one cycle (cumulative of both modules) at different operation mode were measured one day after the third chemical cleaning. At this time transmembrane pressure reached to 96 kPa. From this cumulative flux HRT was calculated (Fig 4.12) and based on this result 5:5 operation mode was concluded as the optimum operation mode and used in the rest of the experiment. This might be due to the higher initial flux during cyclic operation as seen in Fig. 4.11. The high HRT of 4:4 operation mode than that of 5:5 mode is due to lack time needed to get the flux (there is no flux during the first minute of operation). 4.4.5 Dissolved Oxygen The variation in dissolved oxygen concentration in MBR and anoxic tank is shown in Fig 4.13 and the results are summarised in Table D-5 to D-8. At the beginning of Run I, DO level in MBR rapidly decreased from 6.3 to 4.7 mg/L within a week time and then stabilised at that level. Similar trend was observed during the Run II also. This very rapid variation in Run I may be due to the acclimatisation of activated sludge for the new environment so the oxygen consumption by the microbes increased and as result the DO concentration in mixed liquor decreased. In addition some permanent pore plugging due to the filtration also might have contributed to decline in DO level in both Run I and II. In the case of Run III and IV much variation is not observed. During Run III membrane aeration was supplemented by porous stone air diffusion to maintain the 2 mg/L of DO level to provide the minimum recommended DO for nitrification. During Run IV, aeration was supplemented by porous stone air diffuser at the rate of 4 L/min until third membrane cleaning. After the third membrane cleaning stone air diffusion was suspended and back wash air pressure was increased to 200 kPa with the anticipation of maintaining the minimum DO level without the supplement aeration and to improve the membrane cleaning efficiency. After forth membrane cleaning a new air compressor was installed and the back wash air pressure was increased to 250 kPa with the anticipation of further improvement in the membrane cleaning efficiency. Consequently DO level in MBR further increased. During Run IV when HRT increased to more than 6 h, a slight increase in DO was observed. This may be due to the decrease in organic loading.

71

72

73
It also can be noted, except at the beginning of Run I and end of Run IV no DO concentration was observed in the anoxic tank which provide optimum condition for denitrification. The small increase in DO level during the start of Run I could be due to the high DO level in MBR as noted above. Similar increase in DO (0.1 mg/L) is observed after 90th day of operation would be mainly due to the low organic loading caused by the reduced HRT (>6 h). 4.4.6 pH
Variation of pH in influent, MBR and anoxic tank is shown in Fig 4.14 and the results are shown in Tables D-5 to D-8 of appendix D. In all runs the pH of influent, MBR and anoxic tank were varying between 7.3 and 8.5, and for all cases the pH of influent is higher than that of pH in anoxic tank and MBR. Biological nitrification causes decline in pH and this should be the cause for the declined pH in the reactors. However except for Run I in all other cases pH of anoxic tank always more than that in MBR but less than influent. Main cause for this would be recycle of mixed liquor from MBR to anoxic tank which reduce the pH from influent level. However denitrification in anoxic tank in turn increase pH and prevent the drastic drop. As mentioned in section 2.3, 1g NH4
+-N consume 7g alkalinity (as CaCO3) during nitrification and generate 3-3.5 g alkalinity during the denitrification. Further the pH range of 7.3-8.5 provides the favourable environmental condition for nitrification and denitrification. 4.4.7 Color and Turbidity Variation of color and turbidity in effluent is shown in Fig 4.15 and the results are presented in Tables D-11 to D-14. In all experiments the effluent turbidity was varying between 0.15 and 0.3, and the color was varying between 20 and 30 Hazen color unit. This extremely good quality turbidity is even below the standard set for the drinking water (0.5-1 NTU) by USEPA (Sawyer et al, 1994). A study by Pliankarom (1996) with the same type membrane shows similar effluent turbidity of 0.4 and 0.3. The reason for this results can be delineated based on the operation with high concentration of activated sludge. This operation caused high cake layer formation on the surface of the membrane and this cake layer assist to prevent any colloid particle to escape. In addition this effluent turbidity corresponds to 0 mg/L SS, thus meeting Thailand’s effluent standard for SS which is 30 mg/L (Pollution Control Department, 1994). The low level of color observed may also be due to the cake layer formation and the absorption of the macromolecules by it. Though the effluent in a small container did not exhibit color, light yellowish color was observed with a naked eye when the effluent was stored in a large containers.

74
75
4.4.8 Removal of Organic Matter Variation of influent and effluent COD, and percentage removal efficiency is shown in Fig 4.16 and the results are tabulated in Tables D-15 to D-18 of Appendix D. The influent COD has varied between 540 to 625 mg/L, therefore it can be classified as a medium strength domestic wastewater (Tchobanoglous, 1991). The effluent COD concentration always maintained below 25 mg/L, with a lowest value of 7 mg/L through out the study. This corresponds to more than 95 % organic matter being removed. Similar amounts of organic matter being removed have also been reported for laboratory-scale treatment plants supplied with domestic wastewater by Chiemchaisri et al (1993); Chaize and Huyard (1991) ( see Tables 2.3 and 2.4). Steady organic matter removal efficiency through out the study indicates the change in operating condition does not have any effect on the organic matter removal. The influent and effluent BOD is shown in Fig 4.17 and results are summarised in Table D-19 to D-22 of Appendix D. The influent BOD varies from 295 to 380 mg/L and effluent varies in a small range of 1.3 to 3.5 mg/L. This effluent BOD concentration is very much lower than the effluent standard (20 mg/L) set in Thailand (Pollution Control Department, 1994). In addition the percentage biodegradable matter (BOD/COD ratio) in the influent (52-64%) depicts the similarity of typical domestic wastewater and very low percentage of biodegradable matter in the (7-17 %) shows that almost all the biodegradable matter is already removed in the bioreactor. The long SRT allows the biodegradable substances with high and low molecular weight can be taken up, broken down and gassified by micro-organisms or converted into polymers as constituents of bacterial cells, thereby raising the quality of treated effluent. 4.4.9 Concentration of Reactor Contents The variation of mixed liquor concentration in MBR and anoxic tank with time is shown in Fig 4.18 and the results are tabulated in Tables D-17 to D-20 of Appendix D. From this results it can be noted that the MLSS concentration during Run I and Run II tend to decrease both in MBR and anoxic tank. But in case of Run III, MLSS concentration slightly increase in MBR and tend to decrease in anoxic tank. During Run IV, MLSS concentration has shown a sharp increase when MLSS concentration in the system was very low (8,000 mg/L). But when MLSS concentration was around 12,000 mg/L, MLSS concentration tend to increase at the beginning and it shows a declining trend in the later stage. When considering the MLVSS variation again Run I and Run II to shows a decreasing trend in both MBR and anoxic tank. During Run III, MLVSS concentration in MBR is more or less constant and in anoxic tank it tend to increase. In Run IV, MLVSS concentration in MBR shows a continuos decline whereas in anoxic tank initially it decrease and at the later stage it tend to stabilise. The decline in MLSS and MLVSS concentration during Run I and II could be attributed to the low organic loading rate and as a result the biomass in these runs were under endogenous respiration. The variation of mixed liquor concentration in reactors can be attributed to the following:

76

77

78
• Inflow wastewater which, contain very less concentration of SS (< 240 mg/L) enter into the anoxic tank as a result it tend to reduce concentration in anoxic tank;
• Filtration of the MBR content by membranes tend to increase the solid content of MBR; • High concentration mixed liquid enter into the anoxic tank from MBR due to sludge
recycle, so the concentration tend to increase in anoxic tank; • Low concentration mixed liquor enter into the MBR from anoxic tank which tend to
reduce the concentration in MBR; • Biomass (autotrop and hetrotrop) growth tend increase the concentration in both reactors; • Endogenous decay of biomass decrease the concentration in both reactors. The biomass growth depends on the organic loading rate and environmental conditions. In addition the biomass concentration in both tanks are different at the beginning. As a result, the variation of concentration in MBR and anoxic tank did not show a similar trend and even when it shown similar trend the rate of variation was not similar. Because of this reason average concentration of mixed liquor (MBR and anoxic tank) was calculated to find out the actual variation in concentrations and this average MLSS and MLVSS variation were also shown in the same plot (Fig 4.18). From this it can be noted that both MLSS and MLVSS tend to decrease during Run I and Run II. In Run III, it almost remain constant. In case of Run IV, MLVSS concentration tend to remain constant whereas MLSS tend to decrease. From this it can be concluded that during Run I and II biomass entered into endogenous respiration. In case of Run III, there is no net growth. For Run IV there is a slight increase of MLVSS at the beginning and tend to decrease during the rest of the run. It can be justfied based on volumetric loading rate. At the beginning of Run IV, HRT was low (3 h) and it increase until it reach the level of 9 h. As a result the volumetric loading rate continue to decrease from a high level of 3.994 kgCOD/m3.d to a low level of 1.861 kgCOD/m3.d. Considering the fact that at 6 h HRT, MLVSS concentration remain constant, the variation of MLVSS concentration during Run IV is justifiable. Further it can be concluded the F/M ratio of 2.4 kgCOD/m3.d (F/M ratio at 6 h HRT) should be a critical loading rate when sludge age is 50 days. Considering the variation of MLVSS/MLSS ratio, it tend to decrease from 71% at the beginning of experiments. But particularly from Run II this tend to increase and reached to a value of nearly 80 % at the end of Run IV. This can be attributed to high biodegradable component in the influent SS and the sludge wasting practice. Initially the sludge was wasted from the surface of the MBR and from 15th day onwards waste sludge was withdrawn from the bottom of the tank by a roller pump. From this and considering the waste sludge MLVSS/MLSS ratio (refer section 4.4.13) it can be said most of the inert materials are settled at the bottom and removed during sludge wastage. By this practice of sludge wastage, accumulation of inert matter in the MBR can be eliminated. Considering this MLVSS/MLSS ratio it can be noted that this ratio is within the operating range of 0.75 to 0.85 (Qasim, 1985) of complete mix activated sludge process.

79
4.4.10 Loading Rates
F/M ratio variation during all runs are shown in Fig 4.17 and the results are included in Tables D-19 to D-22 of Appendix D. The F/M ratio during Run I is low (0.06 kgBOD/kgMLVSS) and high during the early part of Run IV (0.19 kgBOD/kgMLVSS.d). This indicates the F/M ratio during this study never reached values (0.2-0.6 kgBOD/kgMLVSS.d) observed in the conventional system. Because of this low F/M ratio the sludge production rate should be low. In addition at low F/M biomass enter into the stationary or declining phase, and at this phase floc-forming bacteria well flocculate. When floc-forming bacteria grow in high F/M conditions they become dispersed (single cells) (Klopping et al, 1995). So operating at low F/M ratio help the bacteria to flocculate consequently eliminating the chance of membrane pore plugging by dispersed cells. Though the system operates at low F/M ratio it still having volumetric loading rate (0.6 kgBOD/m3.d during Run I to 1.8 kgBOD/m3.d during Run IV) comparable to conventional system (0.8-2 kgBOD/m3.d) (Qasim, 1985). From this observations it can be concluded that operating at similar volumetric loading rate and lower F/M ratio will lead to a situation low sludge production rate in MBR than in a comparable conventional reactor. 4.4.11 Removal of Nitrogen Compounds TKN Influent and effluent TKN along with its removal efficiency is shown in Fig 4.19 and the results are presented in Tables D-23 to D-16 of Appendix D. From the results it can be noted except for Run III in all other runs the influent TKN values are similar to typical TKN in a medium strength domestic wastewater (Table 2.1). But during the Run III it was exceptionally high. This so happened because the septage used at this stage had a very low COD to TKN ratio. However irrespective of this influent characteristics variation more than 95 % of the TKN was removed in each run. The improvement of removal efficiency with the time during each run indicates that the change in operating condition had a slight impact on nitrification efficiency. It was reported by Suwa et al (1989) that TKN was completely oxidised upto a TKN volumetric loading of 0.3-0.6 kg N/m3.d. But in this study a loading rate of 0.73 kg N/m3 shown almost complete oxidation (effluent TKN 0.28 mg/L). However a loading rate of 0.93 exhibit considerable amount of TKN was not oxidised (effluent TKN 12.6 mg/L) but it could not be concluded that this high TKN loading rate is beyond the critical organic loading rate because such high TKN loading has occurred only once in this study. However it should be mentioned here that the study by Suwa et al (1989) was carried out at 20oC and a pH of 7.0 whereas this study was carried out at 29-31oC and >7.5 pH. So with this favourable environment for nitrification there is a definite chance for complete oxidation at high TKN loading rate. NO3-N

80
The variation of NO3-N in influent and effluent is shown in Fig 4.20 and the results are summarised in Table D-23 to D-26 of Appendix D. In all runs the influent concentrations were below 0.5 mg/L. Run I, II and IV had concentration not exceeding 10 mg/L but in Run III effluent concentration as high as 29.85 mg/L was observed. This results reflects the sudden drastic increase in influent TKN. However the NO3-N concentration in the effluent in Run III shows a decreasing trend despite the more or less constant higher value of TKN in the influent. Total Nitrogen (TN)
Fig 4.21 shows the TN in influent and effluent, and its removal efficiency. The results are shown in Tables D-23 to D-26 of Appendix D. From these results it can be seen the removal efficiency is more than 80 % with a few exceptions at the beginning of Run I and IV. In addition during each run removal efficiency got improved. This lower removal efficiency at the beginning is as discussed earlier due to the change in operating conditions. However it can be concluded that the removal of TN would be more than 85 % in a long run with stable operating condition (i.e constant HRT). Further it should be noted that though during the change of operating condition there was a reduced removal efficiency, in a long operation the HRT at which process take place has no effect on total nitrogen removal. Except for Run III in all other cases, effluent TN concentration meets the EC (European Community) effluent standard (10 mg/L and/or 80 % reduction)) for NO3-N (Morris and Bird, 1994). Nitrogen Mass Balance A schematic diagram of the nitrogen balance in a unit of biological treatment plant is shown in Fig 4.22. There are two pathways for the removal of nitrogen: Assimilation into the biomass and nitrification and denitrification. During the nitrification process, ammonia nitrogen is oxidised to nitrite and nitrate by nitrifying bacteria under aerobic condition. The amount of nitrogen lost in assimilation depends on the amount of BOD5 reduced. Based on these facts nitrogen mass balance can be written as follows:
TKNi + NO2-Ni + NO3-Ni = TKNe + NO2-Ne + NO3-Ne + N assimilated + N lost due to dentrification Eq. 4.1
Eq 4.1 can be re-written to find out nitrogen lost due to denitrification.
N lost in dentrification = (TKNi - TKNe) + (NO2-Ni - NO2-Ne) + (NO3-Ni - NO3-Ne) - α(BOD5i - BOD5e) Eq. 4.2
Where α = concentration factor (ratio of nitrogen to BOD5)
i = influent e = effluent

81

82

83
The term α(BOD5i - BOD5e) represents the removal of nitrogen by assimilation. It is generally accepted that during the aerobic process of organic matter removal, each 100 mg/L of BOD5 need 5 mg/L of nitrogen and 1 mg/L of phosphorous (Klopping et al., 1995). Based on this BOD : N = 100 : 5, α can be find out as 0.05. The mass balance of nitrogen in the MBR system is shown in Fig 4.23 (see Appendix E for mass balance calculation).
Based on the mass balance it can be concluded that denitrification has taken place and it should be the main case for such high level of TN reduction in the effluent. Prevalence of favourable pH and temperature during all runs should have enhanced this high level of denitrification. The denitrification is further evidenced because there was no drastic pH drop observed in the system even though the nitrification has taken place. Denitrification process should have compensated the pH drop by producing alkalinity. In addition, presence of air bubbles were observed on the anoxic tank surface indicates the escape of the nitrous gases. 4.4.12 Phosphate Removal Fig 4.24 shows the variation of total phosphate content in influent and effluent and its removal efficiency. The results are included in Tables D-23 to D-26. The influent concentration depicts the medium to high strength domestic wastewater (Tchobanoglous, 1991). The removal efficiency varies in a big range of 52-92 %. In order to identify the removal mechanism a mass balance of total phosphate was carried out. Mass Balance There are two means by which phosphate removal can take place; • Assimilation by micro-organisms for cell synthesis • Sedimentation of total phosphate inside the reactor Based on this, the mass balance can be written as follows: TPi = TPe + γ (BODi - BODe) + δ (VSSi - VSSe) Eq. 4.3
Where
γ - conversion factor (ratio of phosphorus to BOD which macro-organisms require for their growth)
δ - conversion factor (ratio of phosphorous to VSS) i , e - influent and effluent respectively.
The term of γ (BODi - BODe) and δ (VSSi - VSSe) represents the removal of phosphorus by assimilation and sedimentation respectively. For this study, phosphorous was determined in term of total phosphate. Therefore, term of δ (VSSi - VSSe) which indicated the effect of biomass sedimentation is neglected.

84

85
Mass balance of total phosphate at steady state which is used for this study become as followed:
TPi = TPe + γ (BODi - BODe) Eq. 4.4 As stated earlier considering the nutrient requirement for organic matter removal in a conventional activated process, γ can be taken as 0.01 (BOD:N:P = 100:5:1). Based on these facts the total phosphate mass balance is shown is presented in Table 4.4.
Table 4.4 Total Phosphate Mass Balance
HRT BOD5 (mg/L) Uptake of TP*
TP (mg/L) TP Reduction**
Influent Effluent (mg/L) Influent Effluent (mg/L) 15 10 6 3
375 305 345 340
2.7 3.8 1.9 3.2
3.72 3.01 3.43 3.36
6.91 3.56 6.26 3.87
2.92 0.78 2.02 0.64
3.79 2.78 4.24 3.23
* Theoretical calculation [γ (BODi - BODe)] ** Experimental finding From the mass balance calculation (Table 4.5) it can be noted that the Run I and Run III have a slightly higher TP reduction than the theoretical uptake. On the other hand Run II and IV exhibit slightly lower TP reduction than the theoretical uptake. It should be noted that the theoretical calculation made is for conventional system whereas the system used in this study consist of anoxic tank aimed for nutrient removal. So this system work on the similar principle of a A/O process used for phosphorus removal. It was reported that there are cases where effluent soluble phosphorus concentration as low as 0.1-0.2 mg/L have been achieved in A/O system. However, this is not achieved at all plants and for all operating conditions because of the dependence on the availability of fermentation substrate products needed by the phosphorus storing bacteria relative to the amount of phosphors that must be removed in the system. In addition the required ratio of fermentation substrate per unit of phosphorus removal is affected by the amount of nitrate nitrogen entering the fermentation zone and also by the SRT of the system (USEPA, 1987). Lower sludge yields associated with longer SRTs logically decrease the phosphorus removal capacity for the system. Maier et al (1984) found in pilot studies that the rate of phosphorus uptake per unit of mixed liquor solids decreased by a factor of 2.6 as F/M loading was decreased from 0.2 to 0.1 kgBOD/kgMLVSS.d. Barnard (1976) pointed out that nitrate nitrogen entering the anoxic zone of biological phosphorus removal system could reduce the capability of the system. This could be attributed to an increase in the redox potential of the reactor and a reduction in the degree of anaerobic stress to induce phosphorus uptake in the aeration zone. In addition the nitrate reduction in the anoxic zone utilises substrate that would otherwise available for assimilation by the phosphorus storing organisms. So it can be

86
concluded that longer system SRT, low F/M ratio, low SBOD/SP ratio and high concentration nitrate entering anoxic zone will inhibit the phosphorus removal. From the results it can be observed that the influent concentration of TP dictate the amount of phosphorus assimilated into the cell mass. In the case of Run I and III the influent TP concentration is more than 6 mg/L whereas in other two runs it was around 3 mg/L. Luxury uptake of phosphorus in A/O system sludge aided with sufficient amount of influent TP may be the cause for slightly higher removal of TP than the theoretical value for the conventional system during Run I and III. 4.4.13 Pathogenic Micro-organism removal To find out the disinfection ability of micro-filtration process used in this study, total and faecal coliform content of the influent and effluent were checked using MPN method (Multiple Tube Fermentation Technique). The results are summarised in Table 4.5.
Table 4.5 Indicator Organism Content in Influent and Effluent
Total Coliform MPN/100 mL Faecal Coliform MPN/100 mL Influent Effluent Influent Effluent Run I Run II Run III Run IV Conventional AS
250×105
500×105
220×105
140×105
-
<2 <2 <2 <2
1.4×10⁵
23×105
70×105
27×105
8×10⁵
-
<2 <2 <2 <2
2.2×10⁴ From this analysis (Table 4.6) it can be concluded that effluent from the MBR operating with 0.2 µm MF membrane is indicator organism free. This cannot be achievable in conventional AS process. In addition this removal efficiency of 100 % is independent of operating conditions (HRT, transmembrane pressure etc). Disinfection by micro-filtration did not have the disadvantage of current disinfection technologies of disinfectant residual, toxic or carcinogenic by product formation. 4.4.14 Sludge Characteristics Any activated sludge process incur considerable cost for waste sludge handling and its disposal. To easily handle and to reduce the volume of sludge it is necessary to dewater the sludge. Dewaterbility of sludge is reflected by the characteristics of sludge. In order to identify the sludge characteristics a series of tests were carried out on a waste sludge from MBR and the results are summarised in Table 4.6. To provide some idea about the characteristics of the waste sludge from a conventional activated sludge plant sample from Navanakorn wastewater treatment plant (operating in extended aeration mode) was evaluated and this results also included in the Table 4.6.

87
Although there are low values of SVI of MBR waste sludge during all runs (60 to 70 L/g) observed the settled volume of the sludge indicates its low settleability, so it might render difficulties in sludge thickening. However the solids content of the MBR waste sludge (1.5 %) is two fold high than that of conventional system (0.7 %). This solid content values obtained for conventional system is in agreement with the values reported in the literature (0.5-1.0 %). In addition higher CST value for MBR waste sludge indicates difficulties of dewaterability, thus the higher cost for dewatering per unit volume of sludge. This difficulty in dewaterability could be attributed to the higher organic matter content in the sludge (63.44 to 71.46 %). In addition excess extra cellular polymers (ECP) produced also might be another reason for this dewaterability difficulties (Eriksson et al, 1992). It is reported that at low F/M ratio (high sludge age) the cells grow more slowly but produce more ECP (Li and Ganczarczyk, 1990). Since both the cell surfaces and the polymers are negatively charged at neutral pH, the binding between polymers and cell surfaces and different polymers will be counteracted by electrostatic repulsion, unless polyvalent metal ions are present. So additives are necessary for improved thickening and dewatering of the MBR waste sludge. Table 4.6 Characteristics of waste Sludge from MBR and Conventional Activated Sludge
Process
Parameters Conventional
MBR
AS Run I Run II Run III Run IV Settled volume ( mL/L) Suspended solids (SS) (mg/L) Volatile suspended solids (VSS) (mg/L) VSS/SS (%) Sludge volume index (SVI) (mL/g) Capillary suction time (CST) (s) Total solids (TS) (mg/L) SS/TS (%)
840 7,730 3,870 50.06
108.67 21.6 8970 86.18
980 15,110 10,800 71.46 64.80 111
15,352 98.41
985 13,980 9430 67.45 70.5 117
14,520 96.28
960 16,010 10,410 63.44 59.9 102
16,360 97.86
990 14,830 9940
67 66.76 113
15,140 97.95
However sludge age of MBR (50 days) is more than the typical values (5-15 days) for conventional AS process. Thus the rate of sludge production is low. Because of small quantity of sludge need to be handled, the anticipated high cost for dewatering of MBR waste sludge may be compensated if considered as amount of waste sludge produced. The lower VSS/SS ratio of waste sludge during Run I to IV confirm the earlier claim that some amount of inert material settled and removed by sludge wasting. 4.4.15 Dynamic Population of Micro-organisms in the Reactor Microscopic observation on micro-organism population was conducted during each run. Fig 4.25 to 4.28 shows the flocs distribution during each run. From the floc distribution observation it may be said during all runs the floc distribution is some what similar. Absence of filaments may be the cause for slightly dispersed bacterial growth. Filaments growth would

88
have been hindered by sufficient DO saturation, availability of ample amount of nutrients and narrow pH variation range in the bioreactor in addition to the presence of anoxic zone. Based on these observations, predominant organisms which constantly found in all experimental runs were bacterial flocs (mixed culture of bacteria). The very common higher forms of organisms observed during all runs are : Protozoa - free swimming ciliates - euplotes
- stallked ciliates - vorticella, opercularia and epistylis. Metazoa - rotaria - rotifers
Fig. 4.29 shows free swimming ciliates which also can be seen among the bioflocs in Fig. 4.27. This distribution of microbial population indicates the process is lightly to normally loaded activated sludge process. This is true considering the organic loading rates. In addition fair amount of rotifers (Fig. 4.28) observed during Run I but in the later runs they were observed in a very few numbers or absent. This may be due to the low organic loading rate during Run I compared to the other runs.
4.5 Membrane Cleaning Membrane modules were cleaned with the aim of restoring its filtration properties. Cleaning process was carried out immediately after Run II, III and 11th and 21st day of Run IV. Membranes were cleaned in three steps:
1. Membrane modules were washed with tap water to remove the cake layer on the surface of the hollow fibers.
2. The modules were immersed in a clean water tank and cleaned by sending air for 3 h to each modules followed by tap water cleaning.
3. Finally modules were cleaned chemically as described in the methodology. In order to find out the effect of the above membrane cleaning processes, membrane resistance was calculated by measuring the ultrafiltered water flux. For 1st membrane cleaning membrane resistance were measured just after air back washing and after chemical cleaning. The results are summarised in Figs. 4.31 and 4.32. After simple membrane washing and cleaning by air back washing, the membrane resistance were found to be increased by 178 % and 221 % of initial membrane resistance (Rm0) for module I and module II respectively (1a of Figs. 4.30 and 4.31). Since the membrane resistance has not restored to the original level, membrane cleaning by chemicals were carried out. Still membrane resistance measurement indicates the increase of resistance by 11 and 8 % of initial resistance for module I and module II respectively (1b of Figs. 4.30 and 4.31). To find out whether further chemical cleaning would made any improvement, modules were chemical cleaned immediately after first chemical cleaning. The results obtained (8 and 8.3%) shows there is no remarkable improvement in the resistance. Similar trend of slight increase in membrane resistance was observed in subsequent cleanings also.

89

90
Fig. 4.25 Bilogical Flocs During Run I (HRT = 15 h) 100x
Fig. 4.26 Bilogical Flocs During Run II (HRT = 10 h) 100x

91
Fig. 4.27 Bilogical Flocs During Run III (HRT = 6 h) 100x
Fig. 4.28 Bilogical Flocs During Run IV (HRT = 3 h) 100x

92
Fig. 4.29 Free Swimming Ciliates 400x
Fig. 4.30 Rotifers 400x

93

94
Thus it can be concluded that simple washing followed by air back washing cannot restore the membrane’s filterability to original level. So chemical cleaning of membrane modules are necessary to restore the flux to original level. However even with chemical cleaning there is slight increase in membrane resistance is observed (1c, 2nd, 3rd and 4th cleaning of Figs. 4.31 and 4.32). This could be attributed to internal or external absorption of micro molecules which cannot be removed by the chemical cleaning.

4.4 Long Term Experiments In order to find out the feasibility of applying membrane bioreactor for domestic wastewater treatment, this study was carried out for 100 days with different operating conditions. This MBR system consist of anoxic zone in addition to the oxic zone aimed for the complete removal of nitrogen during the treatment process. Performance data for the different operating conditions are discussed bellow. 4.4.1 Effect of Hydraulic Retention Time Performance of MBR system was investigated solely by varying HRT. The HRT values investigated in this study include 15, 10, 6 and 3 hrs for Run I, Run II, Run III, and Run IV respectively. The HRT values during each run were maintained at constant level by measuring cumulative volume of permeate flux continuously. Whenever increase in HRT was observed, pump speed was increased to maintain the operating HRT constant. Such circumstances arose at the beginning of the runs only. This could be attributed to the plugging micro-pores and could not be removed by air back washing. However during the Run IV the HRT could not be maintained at 3 h because over a day two the transmembrane pressure reached 96 kPa. For suction this could be a limitation and as a result flux continued to decrease, so the HRT increased.

93
CHAPTER V
Conclusions and Recommendations
5.1 Conclusions 1. In stone air diffusion KLa value increased from 14.26 to 26.56 h-1 when air flow rate was
increased from 9 to 18 L/min whereas in membrane air diffusion KLa value increased from 11.72 to 48.86 h-1 when the air flow rate was increased from 25 to 200 kPa (4.5 L/min to 27 L/min). So gas transfer efficiency of membrane modules are better than that of stone air diffusers, thus the potential for using membrane as air diffusers is high.
2. Filtration through membrane in cyclic operation with air backwashing plays an important
role in the improvement of permeate flux stability by removing external deposits on the membrane surface, preventing the compaction of cake layer and reducing the internal pore clogging of the membranes. In addition use of air back washing technique can eliminate the need of conventional air diffusers.
3. Study with various backwash air pressure reveals, increase in backwash pressure will have
a better improvement of flux in a long run. In this experiment 150 kPa backwash air pressure was used in the first three runs and it was increased to 250 kPa during the last run. After 26 hours of operation in cyclic mode of 15:15 (15 minutes filtration and 15 minutes air backwashing) with 150 kPa backwash air pressure shows 90 % improvement in flux compared to continuos suction.
4. During this study the flux could be maintained to get a HRT of 6 h at a moderate
Transmembrane pressure of 42 kPa but it was not possible during the last run with the transmembrane pressure of 96 kPa. It can be concluded that the increase in transmembrane pressure has lead to cake layer compaction and internal pore plugging and most of them could not be removed by air back washing. This indicate that the specific resistance caused by cake layer and pore plugging is a strong function of the applied suction pressure, and the increase in resistance to filtration more than offsets the increased driving force.
5. At higher transmembrane pressure of 96 kPa, 15:15 cyclic operation (15 minute filtration
and 15 minute air back washing) could not give higher flux, instead 5:5 operation found to be optimum. This so happened due to rapid flux decline within the filtration time due to high transmembrane pressure.
6. Backwash air at 250 kPa is alone sufficient to aerate the mixed liquor (MLSS = 13,000
mg/L) to a DO level of 3.5 mg/L when system is loaded with 0.19 kg BOD/kg MLVSS.d. 7. COD removal in all experimental runs were observed to the more than 95 % with the
maximum effluent COD value of 27 mg/L. Similarly BOD removal also was more than 98 % with maximum effluent BOD of 4 mg/L. This could be due to the presence of high

94
concentration of mixed liquor and long SRT of 50 days present in the MBR. So there is no significant effect on the BOD/COD removal.
8. The effluent turbidity was extremely good with a maximum value of 0.3 NTU. However
there is a slight color (30 Hazen color unit) could be observed in the effluent. Effluent quality in terms of SS also extremely good since there is no solids lost in the effluent.
9. Due to sufficient DO level (>2 mg/L) maintained in the system through out the study the
TKN removal was more than 95 %. In addition properly maintained anoxic tank lead to total nitrogen removal efficiencies of more than 80 %. Mass balance for nitrogen indicate denitrification took place which also evidenced by the presence of air bubbles on the surface of anoxic tank. Total phosphorus removal was ranging from 50-90%. Mass balance on the TP indicates assimilation was the main mechanism for this removal.
10. In terms of meeting standards effluent BOD, SS and TKN are well bellow the effluent
standard set for Thailand. Effluent turbidity is very much good even meeting the standard set for drinking water by USEPA. Removal of TN also meets the effluent standard set for EC countries.
11. The MLVSS/MLSS in the system was in the range of 70-80%. Wasting 1.6 L sludge from
the bottom of the MBR lead to the removal inert matters which were anticipated as settled in the bottom of the reactor. So wasting the sludge from the bottom might help to maintain MLVSS/MLSS ratio constant.
12. Due to long SRT, extra cellular polymer production by microbes are very high. This lead
to a difficulty in dewaterability of MBR waste sludge. 13. The operation at HRT of 6 h shows a moderate transmembrane pressure of 42 kPa whereas
the operation at 3 h could not be maintained for more than two days and by that time transmembrane pressure reached to 96 kPa. Continuing the operation with this condition lead to a stable HRT of 8.5 h after two weeks of operation.
14. From the process efficiency point of view, the membrane bioreactor produced extremely
good quality effluent over a conventional activated sludge process. Because of the common operational problem of settleability and bulking of sludge could be utterly eliminated by the membrane bioreactor.
5.2 Recommendations for Future Studies 1. Since the data for the performance of conventional air diffuser is available in terms of kg
O2 transferred per unit power, oxygen transfer rate of membrane air diffusers based on power consumption should be studied to evaluate the real benefits.
2. The membrane modules in this type of MBRs are used for dual purposes: aeration and
solid/liquid separation. As a result the membrane modules just after the first filtration step
95
get partially clogged. In this context it is better to measure KLa of clogged membrane modules and compare with conventional air diffusers.
3. To identify the activities of microorganisms, inhibitory effects of nitrifiers and change of
membrane properties the study should be conducted for a longer duration. This study shows even at 3 h HRT, removal efficiency was not affected but the membrane could not hope up with the required flux. To overcome this difficulty either membrane area should be increased or membrane pore size should be increased. A study focus on these alternative aspects should be carried out.
4. This system has very high potential for using as household system. In such a case it is
better if the system can accept the wastewater flow without any equalization compartment. In order to find out the suitability a study should be carried out with diurnally varying flow.
5. To find out the scale up effect a study should be carried out on pilot scale. 6. Total phosphate removal in this study was mainly due to the assimilation by microbes.
Further study should be carried out to find out the possibilities of chemical phosphate removal.
7. It is important to understand what really happens at the membrane/liquid interface in order
to identify the causes of flux reduction. This could be due to the micro molecule absorption in the membrane pores/surface or may be due to bio fouling. Understanding the exact cause will help to operate the system effectively in a long run.
8. Cost benefits of the MBR system over conventional system should be evaluated to identify
the competitiveness of the system in economic point of view. 9. Mathematical modelling should be carried out, so the system performance can be
predicted during the fluctuation in influent concentration and variation in environmental conditions.
10. This study indicates the dewatering will be a difficult task for MBR waste sludge.
Experiments to be conducted on the dewaterability of the sludge. 11. Oxygen reduction potential (ORP) in anoxic tank should be measured so the correlation
between denitrification and environmental conditions can be established.

REFERENCES
American Public Health Association, 1989. Standard Methods for the Examination of Water and Wastewater, 17 th Edition. American Public Health Association, American Water Works Association and Water Pollution Control Fedetration, Washinton DC, USA. Anthonisen, A.C., Loehr, R.C., Prakasam, T.B.S. and Srinath, E.G., 1976. Inhibition of Nitrification by Ammonia and Nitrous Acid, Journal WPCF, 48(5): 835-852. Asian Institute of Technology, 1996. Course ED08.12 Environmental Chemistry and Laboratory, laboratory Instruction Sheet ED08.12/9, Bangkok, Thailand. Aya, H., 1994. Modular Membrane for Self Contained Reuse Systems, Water Quality International, No. 4. Barnard, J.L., 1976. A Review of Biological Phosphorus Removal in the Activated Sludge Process, Water SA, 2: 136-143. Beckman, W.J., Avendt, R.J., Mulligan, T.J. and Kehrberger, G.J., 1972. Combined Carbon Oxidation-Nritrification, Journal WPCF, 44(10):1916-1931. Ben Aim, R., Liu, M.G. and Vigneswaran, S., 1993. Recent Development of Membrane Process for Water and Wastewater Treatment, Water Science and Technology, 27(10): 141-149. Benítez, J., Rodríguez, A. and Malaver, R., 1995. Stabilization and Dewatering of Wastewater Using Hollow Fiber Membranes, Water Reseach, 29(10):2281-2286. Benítez, J., Rodríguez, A. and Malaver, Roger., 1995. Stabilization and Dewatering of Wastewater using Hollow Fiber Membranes, Water Research, 29(10): 2281-2286. Brindle, K. and Stephenson, T., 1996. The Application of Membrane Bilogical Reactors for the Treatment of Wastewaters, Biotechnology and Bioengineering, 49(6):601-610. Brønd, S. and Sund, C., 1994. Biological Removal of Nitrogen in Toxic Industrial Effluents, Water Science and Technology, 29(9):231-240. Chaize, S. and Huyard, A., 1991. Membrane Bioreactor on Domestic Wastewater Treatment Sludge Production and Modelling Approach. Water Science and Technology, 23: 1591-1600. Chiemchaisri, C., 1990. Design Consideration of Membrane Bioreactor in Domestic Wastewater Treatment, Master Thesis, EV 90-97, Asian Institute of Tecnology, Bangkok, Thailand.
-45-
Chiemchaisri, C., Wong, Y. K., Urase, T. and Yamamoto, K., 1992. Organic Stabilization and Nitrogen Removal in Membrane Separation Bioreactor for Domestic Wastewater Treatment, Water Science and Technology, 25(10): 231-240. Chiemchaisri, C., Yamamoto, K. and Vigneswaran, S., 1993. Household Membrane Bioreactor in Domestic Wastewater Treatment, Water Science and Technology, 27(1): 171-178. Cooper, P. and Thomas, V., 1994. Process Option for Phosphorus and Nitrogen Removal from Wastewater, Journal of Institution of Water and Environmental Management, 8: 84 - 93. Dudley, J., 1995. Mass Transfer in Bubble Columns: a Comparison of Correlations, Water Reseach, 29(4):1129-1138. Eriksson, L., Steen, I. and Tendaj, M., 1992. Evaluation of Sludge Properties at an Activated Sludge Plant, Water Science and Technology, 25(6): 251-265. Fakhru’l-Razi, A., 1994. Ultrafiltration Membrane Separation for Anaerobic Wastewater Treatment, Water Science and Technology, 30(12): 321-327. Gaudy, A.F. Jr. and Gaudy, E.T., 1981. Microbiology for Environmental scientists and Engineers, McGraw Hill, Inc. Gauntlett, R.B. and Craft, D.G., 1979. Biological removal of Nitrate from River Water, Rep.TR98, Water Research Centre, Medmenham, UK. Grethlein, H.E., 1978. Anaerobic Digestion and Membrane separation of Domestic Wastewater, Journal Water Pollution Control Federation, 50(3):754-763. Groeneweg, J., Sellner, B. and Tappe, W., 1994. Ammonia Oxidation in Nitrosomonas at NH3 Concentration near Km: Effects of pH and Temperature, Water Research, 28(12):2561-2566. Hall, E.R., Onysko, K.A. and Parker, W.J., 1995. Enhancement of Bleached Kraft Organochlorine Removal by Coupling Membrane Filtration and Anaerobic Treatment, Environmental Technology, 16:115-126. Harada, H., Momonoi, K., Yamazaki, S. and Takizawa, S., 1994. Application of Membrane Bioreactor for Treatment of a Wastewater Containing High Strength Particualte Oragnics, Water Science and Technology, 30(12): 307-319. Haug, R.T. and McCarty, P.L., 1972. Nitrification with Submerged filters, Journal WPCF, 44(11):2086-2102. Kang, I.J., Yoon, S.H. and Lee, C.H., 1996. Comparison of Fouling Characteristics between Inorganic and Organic Membrane in Membrane Coupled Anaerobic Bioreactor (MCAB)

-45-
Kholdebarin, B. and Oertli, J.J., 1977. Effect of pH and Ammonia on the Rate of Nitrification of Surface Water, Journal WPCF, 49(7):1688-1692. Khoo, P., 1997. Personnel Communications with Dr. Paul Khoo, Memtec Ltd, Sydney, Australia. Kim, J.H., 1991. Development of High Efficience Nitrification Process by Micrifiltration (MF) Membrane Bioreactor, Master Thesis, EV 91-21, Asian Institute of Technology, Bangkok, Thailand. Kimura. S., 1991. Japan’s Aqua Renaissance ‘90 Project, Water Science and Technology, 23:1573-1592. Kitamura, Y., Maekawa, T. and Hayashi, H., 1994. Shouchu Distillery Wasterwater Treatment Using Membrane Fermenter Incorporating Ultrafiltration Membrane Separaor, Journal Soc. Food Science and Technology, 41(1):58-64. Klopping, P.H., Marshall, R.H.Jr. and Richhard, M.G., 1995. Activated Sludge Operations for Pulp and Paper Mills, Callan Brooks Publishing Company, Corvallis, Oregon, USA. Kolega, M., Gorhmann, G.S., Chiew, R.F. and Day, A.W., 1991. Disinfection and Clarification of Treated Sewage by Advanced Microfiltration, Water Science and Technology, 23:1609-1618. Krauth, K. and Stab, K.F., 1993. Pressurised Bioreactor with Membrane Filteration for Wastewater Treatment, Water Research, 27:405-411. Langlais, B., Denis, Ph., Triballeau, S., Faivre, M. and Bourbigot, M.M., 1992. Test on Microfiltration as a Tertiary Treatment Downstream of Fixed Baxteria Filtration, Water Science and Technology, 25(10): 219-230. Li, D.-h. and Gacczarczyk, J.J., 1990. Structure of Activated Sludge Floc, Biotechnology and Bioengineering, 35: 57-65. Lübbecke, S., Vogelpohl, A. and Dewjanin. W., 1995. Wastewater Treatment in a Biological High-Performance System with High Biomass Concentration, Water Reseach, 29(3):793-802. Maythanukhraw, R. 1995. Application of Air Backflushing Technique in Membrane Bioreactor, Master Thesis, EV 95-33, Asian Institute of Technology, Bangkok, Thailand McCarty, P.L. and Smith, P.D., 1986. Anaerobic Wastewater Treatment, Environmental Science and Technology, 20 (12):1200-1206.

-45-
Miami, K., Okamera, O., Ogawa, S. and Naritomi, T., 1991. Continous Anaerobic Treatment of Wastewater from a Kraft Pulp Mill, Journal of Fermentation and Bioengineering, 71(4):270-274. Morris, G. and Bird, P., 1994. The EC Urban Wastewater Treatment Directive and the Removal of Nutrients, Nutrient Removal from Wastewaters, Ed, by: Horam et al, Technomic Publishing Co., Inc., Lancaster, Basel. Muller, E.B., Stouthamer, A.H., Verseveld, H.W.van and Eikelboom, D.H., 1995. Aerobic Domestic Wastewater Treatment in a Pilot Plant with Complete Sludge Retention by Cross-Flow Filtration, Water Reseach, 29(4):1179-1189. Nagano, A., Arikawa, A. and Kobayashi, H., 1992. The Treatment of Liquor Wastewater Containing high-strength Susspended Solids by Membrane Bioreactor System, Water Science and Technology, 26(3-4): 887-895. Painter, H.A., 1970. A Review of Literature on Inorganic Nitrogen Metabolism in Microorganisms, Water Research, 14:1695-1703. Painter, H.A., and Loveless, J.E., 1983. Effect of Temperature and pH Value on the Growth-Rate Constants of Nitrifying bacteria in the Activated Sludge Process, Water Research, 17(3):237-248. Peter, T.A. and Pederson, F.S. 1990. MEMCOR-Crossflow-Microfiltration with Gas-backwashing: Design and Different Applications for a New Technical Concept, Proceedings of the 5th World Filtration Congress, Nire, France, pp. 473-478. Pierre, C., Bersillon, J.L., Huyard, A. and Faup, G., 1988. Bubble-Free Aeration Using Membrane Process Analysis, Journal Water Pollution Control Federation, 60(11):1986-1991. Pliankarom, S., 1996. Application of Air Backflushing Technique in Membrane Bioreactor for Septic Wastewater Treatment, Master Thesis, EV 96-36, Asian Institute of Technology, Bangkok, Thailand Pollution Control Department, 1994. Laws and Standards on Pollution Control in Thailand, 3rd Ed., Pollution Control Department, Ministry of Science Technology and Environment, Thailand. Pouet, M.-F., Grasmick, A., Homer, G., Nauleau, F. and Cornier, J.C., 1994. Tertiary Treatment of Urban Wastewater by Cross Flow Microfiltration, Water Science and Technology, 30(4): 133-139. Qasim, S.R., 1985. Wastewater Treatment Plants: Planning, Design and Operation, CBS Publishing Japan Ltd.

-45-
Randall, C.W. and Buth, D., 1984. Nitrite Build-up in Activated Sludge Resulting from Temperature Effects, Journal WPCF, 56(9):1039-1044. Rautenbach, R. and Albrecht, R., (1989). Membrane Process, John Wiley and Sons, Chister. Ross, B. and Strohwald, H., 1994. Membrane Add Edge to Old Technology, Water Quality International, No. 4. Ross, W.R., Barnard, J.P., le Roux, J. and de Villiers, H.A., 1990. Application of Ultrafiltration Membranes for Solids-Liqquid Separation in Anaerobic Digestion System: The ADUF Process, Water SA, 16(2):85-91. Sawyer, C.N., McCarty, P.L. and Parkin, G.F., 1994. Chemistry for Environmental Engineering, McGraw-Hill Inc., Newyork, USA. Scott, J.A. and Smith, K.L., (1997). A Bioreactor Coupled to a Membrane to Provide Aeration and Filtration in Ice-cream FactoryWastewater Remediation, Water Research, 31(1): 69-74. Sharma, B. and Ahlert, R.C., 1977. Nitrification and Nitrogen Removal, Water Research, 11(10):897-925. Smith, C.W., Di Gregorio, D. and Talcott, R.M., 1969. The Use of Ultrafiltration Membrane for Activated Sludge Separation, Proceedings of the 24th Annual Purdue Industrial Waste Conference, pp:1300-1310, Purdue University, West Lafayette, Indiana, USA. Stenstrom, M.K. and Poduska, R.A., 1980. The effect of Dissolved Oxygen Concentration on Nitrification, Water Research, 14:643-649. Stenstrom, M.K., 1980. The Effect of Dissolved Oxygen Concentration on Nitrification, Water Research, 14(6):643-649. Strohwald, N.K.H. and Ross, W.R., 1992. Application of the ADUR Process to Brewery Efflluent on a Laboratory Scale, Water Science and Technology, 25(10): 95-105. Sutton, P.M., Murphy, K.L., Jank, B.E. and Monaghan, B.A., 1975. Efficiency of Biological Nitrification, Water Research, 47(11):2665-2673. Suwa, Y., Suzuki, T., Toyohara. H., Yamagishi, T. and Urushigawa, Y., 1992. Single-Stage, Single-Sludge Nitrogen Removal by an Activated Sludge Process with Cross-Flow Filtration, Water Reseach, 26(9):1149-1157. Suwa, Y., Yamagishi, T., Urushigawa, Y. and Hirai, M., 1989. Simultaneous Organic Carbon Removal Nitrification by an Activated Sludge Process with Cross-flow Filtration, Journal of Fermentation and Bioengineering,67: 119-125.

-45-
Talat, M., 1988. Application of Direct Membrane Separation to Activated Sludge Process, Master Thesis, EV 88-25, Asian Institute of Technology, Bangkok, Thailand. Tariq, A. and Semmems, M.J., 1992. Use of Sealed End Hollow Fibers for Bubbleless Membrane Aeration: Experimental Studies, Journal of Membrane Science, 69(20):1-10. Tchobanoglous, G., 1991. Wastewater Engineering: Treatmetnt, Disposal and Reuse. 3rd Ed., Metcalf & Eddy, Inc., Revised by: Tchobanoglous, G., and Burton, L.F., McGraw-Hill Inc., New York, USA. Trouve, E., Urabin, V., and Manem, (1994). Treatment of Municipal Wastewater by a Membrane Bioreactor: Results of a Semi-Industrial pilot-scale study, Water Science and Technology, 30(4): 151-157. Udeda, T., Hata, K., Kikuoka, Y., and Seino, O., 1997. Effects of Aeration on Suction Pressure in a submerged Membrane Bioreactor, Water Research, 31(3):489-494. USEPA, 1985. Design Manual: Phosphorus Removal, US Environmental Protection Agency Cincinnati, Ohio, USA. Vigneswaran, S., Vigneswaran, B. and Ben Aim. R., 1991. Application of Microfiltration for Water and Wastewater Treatment, Environmental Sanitation Reviews, ENSIC, Asian Institute of Technology, Bangkok, Thailand, No. 31, 1991. Visvanathan, C., 1996. Membrane Technology in Water and Wastewater Treatment Process. Unpublished Cource Lecture Notes, ED 08.33, Environmental Engineering Program, Asian Institute of Technology, Bangkok, Thailand. Wild, H.E., Sawyer, C.N. and McMahon, T.C., 1971. Factors Affecting Nitrification Kinetics, Journal WPCF, 43(9):1845-1854. Wong-Chong, G.M. and Loehr, R.C., 1975. The Kinetics of Microbial Nitrification, Water Research, 9(12):1099-1106. Wuhrmann and Mechner, 1965. The Influence of Oxygen Tension and Hydrogen Ion Concentration on Microbiological Denitrification Path., Applied Microbiology., 28: 123-131. Yamagiwa, K., Ohmae, Y., Dahlan, M.H. and Ohkawa, A., 1991. Activated Sludge Treatment of Small - Scale Wastewater by a Plunging Liquid Jet Bioreactor with Cross-Flow Filtration, Bioresource Technology, 37: 215-222. Yamamoto, K., Hiasa, H., Talat, M. and Matsuo, T., 1989. Direct Solid Liquid Separation using Hollow Fiber Membranes in an Activated Sludge aeration Tank, Water Science and Technology, Vol. 21, pp. 43-54

102
APPENDIX A
Results of Initial Membrane Resistance

103
Table A-1 Experimental Results for Initial Membrane Resistance at 29.7oC
Pressure Flux (L/m2.h) (kPa) Module I Module II
8 16 24 32 40 48
25.27 70.01 116.17 157.14 198.23 246.58
25.71 80.48 143.94 201.34 252.10 307.17
Source of water: Activated carbon/Ultrafilted water

104
APPENDIX B
Results of Gas Transfer Coefficient
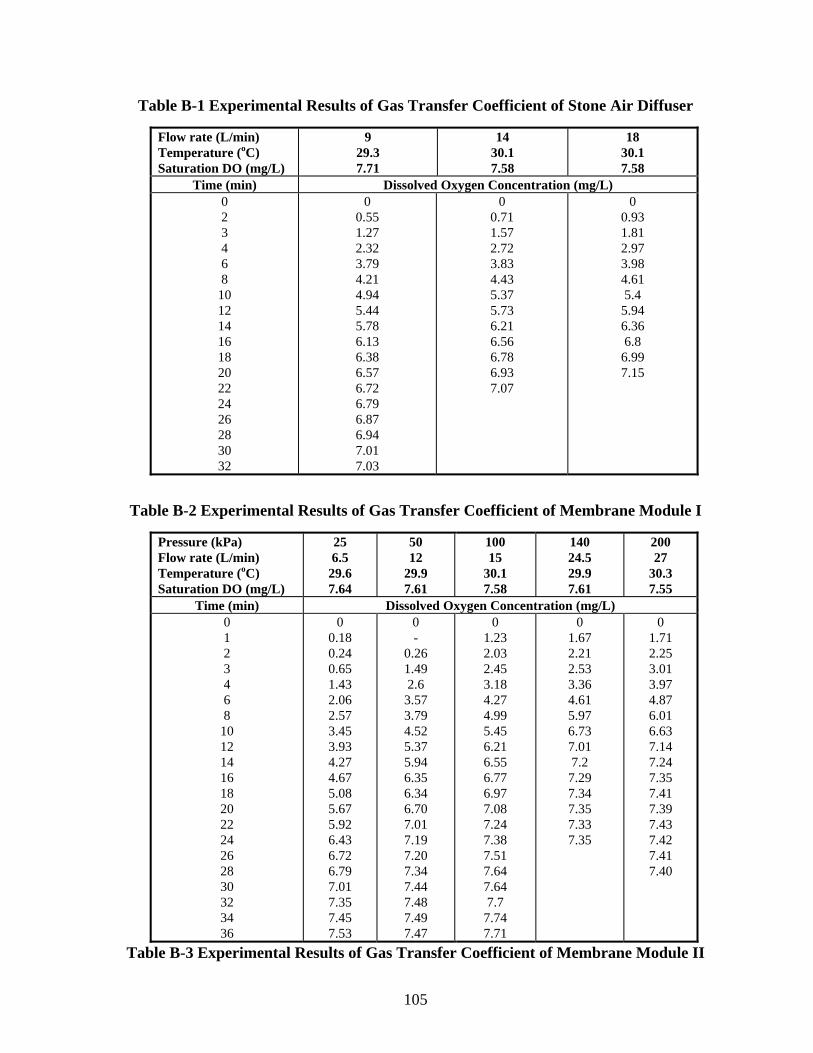
105
Table B-1 Experimental Results of Gas Transfer Coefficient of Stone Air Diffuser
Flow rate (L/min) Temperature (oC) Saturation DO (mg/L)
9 29.3 7.71
14 30.1 7.58
18 30.1 7.58
Time (min) Dissolved Oxygen Concentration (mg/L) 0 2 3 4 6 8
10 12 14 16 18 20 22 24 26 28 30 32
0 0.55 1.27 2.32 3.79 4.21 4.94 5.44 5.78 6.13 6.38 6.57 6.72 6.79 6.87 6.94 7.01 7.03
0 0.71 1.57 2.72 3.83 4.43 5.37 5.73 6.21 6.56 6.78 6.93 7.07
0 0.93 1.81 2.97 3.98 4.61 5.4
5.94 6.36 6.8
6.99 7.15
Table B-2 Experimental Results of Gas Transfer Coefficient of Membrane Module I
Pressure (kPa) Flow rate (L/min) Temperature (oC) Saturation DO (mg/L)
25 6.5
29.6 7.64
50 12
29.9 7.61
100 15
30.1 7.58
140 24.5 29.9 7.61
200 27
30.3 7.55
Time (min) Dissolved Oxygen Concentration (mg/L) 0 1 2 3 4 6 8
10 12 14 16 18 20 22 24 26 28 30 32 34 36
0 0.18 0.24 0.65 1.43 2.06 2.57 3.45 3.93 4.27 4.67 5.08 5.67 5.92 6.43 6.72 6.79 7.01 7.35 7.45 7.53
0 -
0.26 1.49 2.6
3.57 3.79 4.52 5.37 5.94 6.35 6.34 6.70 7.01 7.19 7.20 7.34 7.44 7.48 7.49 7.47
0 1.23 2.03 2.45 3.18 4.27 4.99 5.45 6.21 6.55 6.77 6.97 7.08 7.24 7.38 7.51 7.64 7.64 7.7
7.74 7.71
0 1.67 2.21 2.53 3.36 4.61 5.97 6.73 7.01 7.2
7.29 7.34 7.35 7.33 7.35
0 1.71 2.25 3.01 3.97 4.87 6.01 6.63 7.14 7.24 7.35 7.41 7.39 7.43 7.42 7.41 7.40
Table B-3 Experimental Results of Gas Transfer Coefficient of Membrane Module II

106
Pressure (kPa) Flow rate (L/min) Temperature (oC) Saturation DO (mg/L)
25 4.5
30.2 7.57
50 9.5
29.7 7.66
100 16
28.9 7.77
140 28
29.3 7.69
200 31.5 29.3 7.69
Time (min) Dissolved Oxygen Concentration (mg/L) 0 1 2 3 4 5 6 8
10 12 14 16 18 20 22 24 26 28 30 32 34 36 38 40 42 44 46 48 50 56 58
0 0.06 0.4
0.77 -
1.53 1.93 2.61 3.14 3.66 4.07 4.44 4.74 5.26 5.50 5.73 6.01 6.2
6.42 6.52 6.64 6.67 6.86 6.89 7.04 7.10 7.14 7.21 7.14 7.21 7.22
0 0.18 0.53 1.41 2.12
- 3.34 4.27 4.91 5.53 6.01 6.37 6.65 6.80 6.99 7.14 7.22 7.30 7.33 7.34 7.36 7.33 7.34
0 0.1
1.12 2.21 3.36
- 4.93 5.71 6.43 6.98 7.40 7.57 7.83 7.89 7.87 7.87 7.88
0 0.24 1.76 2.95 4.67
- 5.56 6.37 6.85 7.16 7.38 7.54 7.63 7.78 7.79 7.77 7.78 7.76
0 0.94 3.47 5.68 6.87
- 730 7.52 7.65 7.75 7.81 7.84 7.87 7.84 7.84

107
APPENDIX C
Results of Optimum Backwash Air Pressure

108
Table C-1 Permeate Flux with Time for 15:15 Operation Mode at Back Flush Air Pressure of 50 kPa (TP = 10 kPa, MLSS = 17,000 mg/L)
Time (min)
Flux (L/m2.h)
Time (min)
Flux (L/m2.h
)
Time (min)
Flux (L/m2.h)
Time (min)
Flux (L/m2.h)
0 5 11 16 21 26 31 36 41 46 51 56 60 65 70
9.65 10.08 9.42 10.22 9.18 8.22 9.69 9.02 8.43 9.20 8.53 7.85 8.92 8.28 7.96
75 81 86 91 96 101 106 111 116 121 130 136 141 146 151
8.22 7.63 7.44 8.02 7.61 7.78 7.60 7.30 6.81 7.86 7.30 6.96 7.23 6.46 6.34
157 161 166 171 176 181 186 190 196 201 206 211 216 221 226
7.69 7.30 6.88 6.69 6.41 6.08 7.17 6.68 6.43 6.54 6.22 5.93 6.69 6.44 6.41
231 236 241 247 251 256 261 266 271 277 281 286 292 295 300
6.19 5.87 5.47 6.43 6.02 5.82 5.61 5.20 4.99 6.00 5.55 5.51 5.14 4.75 4.56
Table C-2 Permeate Flux with Time for 15:15 Operation Mode at Back Flush Air Pressure of 100kPa (∆P = 10 kPa, MLSS = 17,000 mg/L)
Time (min)
Flux (L/m2.h)
0 15 30 45 60 75 90 105 120 135 150 165 180 195 210 225
10.08 10.49 8.84 10.02 7.60 8.45 7.07 8.09 7.03 7.25 6.70 7.30 6.70 6.93 6.15 6.85

109
Table C-3 Permeate Flux with Time for 15:15 Operation Mode at Back Flush Air Pressure of 150 kPa (TP = 10 kPa, MLSS = 17,000 mg/L)
Time (min)
Flux (L/m2.h)
Time (min)
Flux (L/m2.h
)
Time (min)
Flux (L/m2.h)
Time (min)
Flux (L/m2.h)
0 6 10 15 20 25 30 35 39 45 50 55 60 65 70 75
10.50 9.44 8.58 17.01 14.48 12.34 9.92 8.62 8.58 14.93 12.28 11.78 9.16 8.96 8.31 14.42
81 85 90 95 99 105 110 115 120 125 130 135 140 145 150
13.78 11.30 9.01 8.83 8.69 12.26 10.95 9.96 8.71 8.21 7.68 10.81 9.67 9.19 9.01
155 160 164 170 175 179 185 190 196 200 205 210 214 220 225
8.02 7.69 9.93 9.44 8.42 9.41 8.75 8.19 9.19 8.67 8.75 9.03 8.11 7.82 9.04
230 235 240 245 250 254 260 264 270 275 280 285 290 294 300
8.20 7.57 8.02 7.48 7.20 8.41 7.74 6.95 7.54 7.48 6.77 7.86 6.94 6.48 7.31
Table C-4 Permeate Flux with Time for 15:15 Operation Mode at Back Flush Air Pressure of 200 kPa (TP = 10 kPa, MLSS = 17,000 mg/L)
Time (min)
Flux (L/m2.h)
Time (min)
Flux (L/m2.h
)
Time (min)
Flux (L/m2.h)
Time (min)
Flux (L/m2.h)
0 5 10 15 20 25 30 35 40 45 50 54 59 65 70
9.93 9.29 9.02 8.23 7.68 7.48 9.18 8.02 7.63 8.15 7.79 7.35 8.02 7.48 7.03
75 80 84 90 95 100 105 111 115 120 125 130 135 140 145
7.46 7.30 6.63 7.30 7.18 6.57 8.12 7.76 7.22 7.09 6.58 6.34 7.62 6.94 6.60
151 156 160 165 170 175 180 185 190 194 200 204 209 215 220
6.44 6.21 5.90 7.20 7.17 6.45 6.44 6.18 6.02 6.93 6.35 6.01 7.03 6.51 6.29
225 231 235 240 245 249 255 260 265 270 275 280 285 290 295
6.52 6.06 5.70 7.62 7.23 6.77 6.35 6.09 5.99 7.37 7.18 6.46 6.57 6.41 6.02

110
Table C-5 Permeate Flux with Time for 15:15 Operation Mode at Optimum Back
Flush Air Pressure of 150 kPa (TP = 10 kPa, MLSS = 17,000 mg/L)
Time (min)
Flux (L/m2.h)
Time (min)
Flux (L/m2.h
)
Time (min)
Flux (L/m2.h)
Time (min)
Flux (L/m2.h)
0 5 10 15 20 25 30 35 40 45 50 55 60 65 70 75 80
8.53 8.04 7.61 9.05 8.14 7.87 8.02 7.80 7.29 8.18 7.30 7.03 7.45 6.69 6.64 7.45 7.03
85 95 105 115 125 135 145 180 210 240 270 300 305 330 335 355
6.75 6.80 6.84 6.45 6.13 6.21 6.19 5.65 5.48 6.13 6.24 6.33 5.37 5.90 5.16 5.94
400 420 427 487 548 821 840 887 917 942 984 992 1020 1183 1198 1208
4.57 6.02 4.30 4.22 3.92 5.16 6.50 5.39 5.10 6.45 4.77 5.46 5.31 3.97 3.41 3.11
1212 1240 1298 1317 1357 1367 1400 1420 1430 1440 1470 1480 1510 1525 1560 1590
3.10 2.96 2.99 3.42 3.11 3.47 3.40 3.34 3.61 3.54 3.47 3.68 3.84 3.44 3.64 3.78

111
Table C-6 Permeate Flux with Time when both Modules Filter Continuously without Air Back Flushing (TP = 10 kPa, MLSS = 17,000 mg/L)
Time (min)
Flux (L/m2.h)
Time (min)
Flux (L/m2.h
)
Time (min)
Flux (L/m2.h)
Time (min)
Flux (L/m2.h)
0 5 10 15 20 25 35 45 55 65
12.03 10.03 10.58 9.14 9.40 9.40 9.00 8.55 7.85 7.19
75 105 135 180 195 270 330 370 410 450
7.24 6.03 5.41 4.17 4.09 3.59 3.43 3.46 3.43 3.07
510 570 650 690 750 820 870 930 980 1320
3.10 2.95 2.87 2.82 2.86 2.78 2.82 2.73 2.78 2.60
1380 1445 1500 1530 1560 1620 1680
2.58 2.48 2.02 2.10 1.93 1.87 1.84

111
APPENDIX D
Results of Long Term Experiments

112
Table D-1 Operating Parameters of Membrane Modules - Run I (HRT = 15 h)
Transmembrane Pressure Time for 100 mL Flux (sec) Flux (L/m2.h) Date Module I Module II Module I Module II Module I Module II
cm Hg kPa cm Hg kPa 27/03 28/03 29/03 30/03 31/03 01/04 02/04 03/04 04/04 05/04 06/04 07/04 08/04 09/04 10/04 11/04 12/04 13/04 14/04
10 12 13 15 16 16 16 16 17 17 17 18 19 21 22 22 22 22 23
13.34 16.00 17.34 20.01 21.34 21.34 21.34 21.34 22.68 22.68 22.68 24.01 25.34 28.01 29.35 29.35 29.35 29.35 30.68
10 12 13 15 16 16 16 16 17 17 17 18 19 24 24 23 24 24 24
13.34 16.00 17.34 20.01 21.34 21.34 21.34 21.34 22.68 22.68 22.68 24.01 25.34 32.01 32.01 30.68 32.01 32.01 32.01
36.95 37.25 37.6
36.85 37.63 38.13 37.39 37.29 38.01 38.11 38.84 38.31 27.01 29.94 35.05 32.36 33.31 35.19 32.67
57.56 56.25 57.1
56.93 57.75 58.02 58.51 57.61 57.32 58.03 58.24 59.21 57.63 65.73 63.56 64.22 63.33 64.56 65.71
9.74 9.66 9.57 9.76 9.56 9.44 9.62 9.65 9.47 9.44 9.26 9.39
13.32 12.02 10.27 11.12 10.80 10.23 11.01
6.25 6.40 6.30 6.32 6.23 6.20 6.15 6.24 6.28 6.20 6.18 6.08 6.24 5.47 5.66 5.60 5.68 5.57 5.47
Table D-2 Operating Parameters of Membrane Modules - Run II (HRT = 10 h)
Transmembrane Pressure Time for 100 mL Flux (sec) Flux (L/m2.h)
Date Module I Module II Module I Module II Module I Module II cm Hg kPa cm Hg kPa
15/04 16/04 17/04 18/04 19/04 20/04 21/04 22/04 23/04 24/04 25/04 26/04 27/04 28/04 29/04 30/04 01/05 02/05
27 28 29 29 31 32 32 33 37 37 37 35 33 33 33 33 33 33
36.02 37.36 38.69 38.69 41.36 42.69 42.69 44.03 49.36 49.36 49.36 46.70 44.03 44.03 44.03 44.03 44.03 44.03
27 28 29 29 31 34 34 35 38 38 38 37 35 35 35 35 35 35
36.02 37.36 38.69 38.69 41.36 45.36 45.36 46.70 50.70 50.70 50.70 49.36 46.70 46.70 46.70 46.70 46.70 46.70
26.25 26.59 25.93 25.53 25.79 24.32 25.01 24.05 22.81 23.16 23.56 22.19 22.67 21.53 22.63 20.81 21.32 23.62
46.84 47.91 48.99 49.26 49.3
49.56 51.82 52.88 57.12 55.26 57.27 58.13 58.33 58.01 60.71 56.23 57.55 58.15
13.71 13.54 13.88 14.10 13.96 14.80 14.39 14.97 15.78 15.54 15.28 16.22 15.88 16.72 15.91 17.30 16.89 15.24
7.69 7.51 7.35 7.31 7.30 7.26 6.95 6.81 6.30 6.51 6.29 6.19 6.17 6.21 5.93 6.40 6.26 6.19

113
Table D-3 Operating Parameters of Membrane Modules - Run III (HRT = 6 h)
Transmembrane Pressure Time for 100 mL Flux (sec) Flux (L/m2.h) Date Module I Module II Module I Module II Module I Module II
cm Hg kPa cm Hg kPa 04/05 05/05 06/05 07/05 08/05 09/05 10/05 11/05 12/05 13/05 14/05 15/05 16/05 17/05 18/05 19/05 20/05 21/05
14 18 24 25 24 26 28 28 28 28 28 30 30 30 30 30 30 30
18.68 24.01 32.02 33.35 32.02 34.69 37.36 37.36 37.36 37.36 37.36 40.02 40.02 40.02 40.02 40.02 40.02 40.02
14 18 24 25 24 26 30 30 30 30 31 31 31 31 31 31 31 31
18.68 24.01 32.02 33.35 32.02 34.69 40.02 40.02 40.02 40.02 41.36 41.36 41.36 41.36 41.36 41.36 41.36 41.36
15.31 16.83 14.62 13.88 14.01 12.03 12.05 11.88 12.1
12.26 11.93 11.83 12.36 11.53 11.63 11.97 12.09 12.13
18.82 21.61 22.91 23.93 22.81 24.06 24.62 25.92 24.63 24.83 25.06 24.62 24.83 24.96 25.03 24.09 25.61 25.21
23.51 21.39 24.62 25.94 25.70 29.93 29.88 30.30 29.75 29.36 30.18 30.43 29.13 31.22 30.95 30.08 29.78 29.68
19.13 16.66 15.71 15.04 15.78 14.96 14.62 13.89 14.62 14.50 14.37 14.62 14.50 14.42 14.38 14.94 14.06 14.28

114
Table D-4 Operating Parameters of Membrane Modules - Run IV (HRT = 3h)
Transmembrane Pressure Flux (L/15 min) Flux (L/m2.h) Date Module I Module II Module I Module II Module I Module II
cm Hg kPa cm Hg kPa 23/05 24/05 25/05 26/05 27/05 28/05 29/05 30/05 31/05 01/06
24 64 72 72 72 72 72 72 72 72
32.02 85.39 96.06 96.06 96.06 96.06 96.06 96.06 96.06 96.06
24 64 72 72 72 72 72 72 72 72
32.02 85.39 96.06 96.06 96.06 96.06 96.06 96.06 96.06 96.06
7.25 7.10 6.91 6.76 6.51 6.13 5.76 5.63 5.32 5.03
5.35 5.02 4.85 4.57 4.30 3.87 3.51 3.37 3.11 2.96
29.00 28.40 27.64 27.04 26.04 24.52 23.04 22.52 21.28 20.12
21.40 20.08 19.40 18.28 17.20 15.48 14.04 13.48 12.44 11.84
Backwash air pressure changed to 200kPa 05/06 06/06 07/06 08/06 09/06 10/06 11/06 12/06
14 72 72 72 72 72 72 72
18.68 96.06 96.06 96.06 96.06 96.06 96.06 96.06
14 72 72 72 72 72 72 72
18.68 96.06 96.06 96.06 96.06 96.06 96.06 96.06
6.31 6.12 5.88 5.61 5.22 4.77 4.36 4.07
5.51 5.27 5.03 4.69 4.17 3.86 3.47 2.96
25.24 24.48 23.52 22.44 20.88 19.08 17.44 16.28
22.04 21.08 20.12 18.76 16.68 15.44 13.88 11.84
Backwash air pressure changed to 250kPa Flux (L/5 min)
14/06 15/06 16/06 17/06 18/06 19/06 20/06 21/06 22/06 23/06 24/06 25/06 26/06 27/06
52 52 72 72 72 72 72 72 72 72 72 72 72 72
69.38 69.38 96.06 96.06 96.06 96.06 96.06 96.06 96.06 96.06 96.06 96.06 96.06 96.06
48 52 72 72 72 72 72 72 72 72 72 72 72 72
64.04 69.38 96.06 96.06 96.06 96.06 96.06 96.06 96.06 96.06 96.06 96.06 96.06 96.06
2.48 1.68 1.94 1.73 1.56 1.43 1.23 1.20 1.15 1.08 1.10 1.04 0.82 0.76
1.65 1.48 1.31 1.21 1.13 1.07 1.01 0.97 0.90 0.92 0.85 0.91 0.73 0.65
29.76 20.16 23.28 20.76 18.72 17.16 14.76 14.40 13.80 12.96 13.20 12.48 9.84 9.12
19.74 17.76 15.72 14.52 13.56 12.84 12.12 11.64 10.80 11.04 10.20 10.92 8.76 7.80

115
Table D-5 Environmental Condition of Influent, Anoxic Tank and Aeration Tank (Run I ; HRT = 15 h)
Influent Anoxic MBR
Date pH Temp (oC)
DO (mg/L)
pH Temp (oC)
DO (mg/L)
pH Temp (oC)
27/03 28/03 29/03 30/03 31/03 01/04 02/04 03/04 04/04 05/04 06/04 07/04 08/04 09/04 10/04 11/04 12/04 13/04 14/04
8.13 8.02 7.93 8.03 8.07 7.76 7.69 7.73 7.71 7.72 7.74 7.71 7.80 8.00 8.08 7.88 7.92 7.81 7.85
30.2 28.3 29.3 29.7 29.1 31.4 30.8 29.9 29.4 30.1 29.3 31.0 30.0 28.6 30.0 30.5 29.2 30.1 30.0
0.2 0.0 0.1 0.0 0.0 0.0 0.0 0.0 0.0 0.0 0.0 0.0 0.0 0.0 0.0 0.0 0.0 0.0 0.0
7.53 7.31 7.63 7.65 7.72 7.60 7.59 7.62 7.63 7.57 7.54 7.56 7.53 7.57 7.56 7.54 7.52 7.53 7.5
29.6 29.0 28.9 29.0 28.9 31
30.3 29.8 29.3 29.8 29.2 29.6 29.9 28.8 28.7 30.2 28.9 29.9 29.9
6.3 5.7 5.5 5.5 5.6 5.4 5.4 5
5.1 4.8 4.6 4.7 4.8 4.7 4.7 4.7 4.7 4.7 4.8
7.58 7.35 7.65 7.70 7.81 7.68 7.61 7.66 7.69 7.60 7.56 7.56 7.56 7.47 7.59 7.52 7.51 7.50 7.50
29.3 29.0 29.0 29.2 28.6 30.5 30.0 29.6 29.3 29.3 28.9 29.3 30.0 28.3 28.3 29.9 29.0 29.8 29.7
Table D-6 Environmental Condition of Influent, Anoxic Tank and Aeration Tank (Run II ; HRT = 10 h)
Influent Anoxic MBR
Date pH Temp (oC)
DO (mg/L)
pH Temp (oC)
DO (mg/L)
pH Temp (oC)
15/04 16/04 17/04 18/04 19/04 20/04 21/04 22/04 23/04 24/04 25/04 26/04 27/04 28/04 29/04 30/04 01/05 02/05
7.61 8.00 7.86 7.93 7.78 8.21 8.14 8.03 7.69 7.82 7.83 7.91 7.63 7.92 8.13 8.01 8.05 8.06
30.2 32.0 30.8 31.2 30.9 30.2 30.8 31.0 30.9 31.2 30.2 30.5 31.2 31.3 29.8 31.2 30.6 30.9
0.0 0.0 0.0 0.0 0.0 0.0 0.0 0.0 0.0 0.0 0.0 0.0 0.0 0.0 0.0 0.0 0.0 0.0
7.41 7.43 7.38 7.45 7.63 7.83 7.90 7.81 7.58 7.89 7.75 7.72 7.67 7.76 8.06 7.95 7.96 7.99
29.9 31.6 30.0 30.8 30.1 29.9 30.5 30.9 30.4 31.0 30.0 30.1 30.8 30.3 29.1 30.8 30.1 30.7
4.0 4.1 4.1 4.0 4.3 4.3 4.2 4.3 3.7 3.6 3.6 3.3 3.2 3.1 3.3 3.2 3.0 2.9
7.35 7.30 7.32 7.32 7.59 7.63 7.72 7.63 7.55 7.71 7.64 7.72 7.60 7.63 7.98 7.88 7.86 7.89
29.6 31.4 30.2 30.8 30.2 29.8 30.7 31.0 30.6 30.9 30.1 29.9 30.1 29.9 28.6 30.1 29.9 30.2

116
Table D-7 Environmental Condition of Influent, Anoxic Tank and Aeration Tank (Run III ; HRT = 6 h)
Influent Anoxic MBR
Date pH Temp (oC)
DO (mg/L)
pH Temp (oC)
DO * (mg/L)
pH Temp (oC)
04/05 05/05 06/05 07/05 08/05 09/05 10/05 11/05 12/05 12/05 13/05 14/05 16/05 17/05 18/05 19/05 20/05 21/05
8.03 8.01 7.73 7.63 7.81 7.92 7.78 7.85 7.81 7.96 7.94 8.05 8.01 7.91 7.85 7.88 7.93 8.20
30.3 29.9 30.5 31.5 30.3 30.5 31.0 29.9 29.9 30.3 31.3 30.0 30.7 31.0 31.3 30.1 29.8 30.9
0.0 0.0 0.0 0.0 0.0 0.0 0.0 0.0 0.0 0.0 0.0 0.0 0.0 0.0 0.0 0.0 0.0 0.0
7.91 7.89 7.65 7.54 7.70 7.79 7.61 7.69 7.68 7.85 7.82 7.91 7.83 7.72 7.69 7.75 7.77 8.03
29.9 29.4 30.6 30.8 30.6 30.0 30.8 30.0 30.1 29.8 31.0 29.8 30.9 30.9 30.8 30.0 30.1 30.4
2.2 2.3 2.2 2.1 2.0 1.9 2.1 1.9 2.0 2.2 2.3 2.0 2.1 2.1 2.2 2.0 2.0 2.1
7.98 7.81 7.51 7.39 7.49 7.52 7.40 7.48 7.49 7.63 7.62 7.67 7.60 7.48 7.47 7.50 7.55 7.86
30.1 29.1 30.5 30.6 30.6 29.1 30.9 30.0 30.0 29.5 30.7 29.5 30.6 30.5 30.4 30.0 29.7 30.2
* Supplementary aeration by porous stone diffusers

117
Table D-8 Environmental Condition of Influent, Anoxic Tank and Aeration Tank (Run IV; HRT = 3 h)
Influent Anoxic MBR
Date pH Temp (oC)
DO (mg/L)
pH Temp (oC)
DO * (mg/L)
pH Temp (oC)
23/05 24/05 25/05 26/05 27/05 28/05 29/05 30/05 31/05 01/06 05/06 06/06 07/06 08/06 09/06 10/06 11/06 12/06 14/06 15/06 16/06 17/06 18/06 19/06 20/06 21/06 22/06 23/06 24/06 25/06 26/06 27/06
7.96 8.12 8.06 8.00 8.01 8.13 8.30 8.21 8.13 8.34 8.13 8.07 8.21 8.23 8.30 8.10 8.06 8.07 8.33 8.25 8.41 8.36 8.29 8.07 8.01 8.22 8.31 8.28 8.35 8.23 8.31 8.40
29.9 28.8 29.6 30.0 30.6 30.3 30.0 30.7 29.0 29.5 31.0 30.6 30.7 28.6 29.1 30.6 30.4 29.8 28.6 29.7 30.3 30.2 28.5 29.9 28.3 29.7 28.7 29.6 29.3 30.3 30.6 28.8
0.0 0.0 0.0 0.0 0.0 0.0 0.0 0.0 0.0 0.0 0.0 0.0 0.0 0.0 0.0 0.0 0.0 0.0 0.0 0.0 0.0 0.0 0.0 0.1 0.0 0.0 0.1 0.0 0.0 0.1 0.0 0.0
7.92 7.90 7.92 7.87 7.83 7.92 8.01 8.05 8.03 8.11 7.87 7.85 7.96 7.95 8.07 7.93 7.88 7.72 8.26 8.03 8.26 8.27 8.11 7.91 7.83 8.13 8.12 8.15 8.23 8.16 8.22 8.35
30.0 28.6 29.3 29.8 29.9 29.7 29.5 30.1 28.8 29.3 30.8 30.1 30.0 28.5 29.0 30.1 30.3 29.5 28.4 29.5 29.9 29.8 28.5 29.6 28.0 29.2 28.6 29.3 29.3 29.7 30.3 28.7
1.8 2.0 2.1 2.0 2.0 2.0 2.1 2.0 2.0
2.0** 2.6 2.7 2.4 2.5 2.8 2.5 2.5 2.5
3.5*** 3.6 3.6 3.7 3.7 3.7 3.6 3.7 3.7 3.6 3.7 3.7 3.7 3.8
7.77 7.72 7.69 7.63 7.67 7.72 7.81 7.90 7.86 7.92 7.86 7.81 7.83 7.79 7.87 7.62 7.69 7.54 8.16 7.84 8.07 8.04 8.00 7.72 7.66 7.94 8.06 8.02 8.12 8.05 8.16 8.33
30.2 28.5 29.0 29.2 29.7 29.6 29.2 29.9 28.7 28.8 30.7 30.0 30.5 28.6 29.1 29.8 29.9 29.3 28.5 29.1 29.6 29.1 28.2 29.1 28.2 29.2 28.4 29.2 29.1 29.9 30.0 28.7
* Supplementary aeration by porous stone diffusers. ** Aeration by stone diffusers suspended and back wash air pressure increased to 200kPa. *** Back wash air pressure further increased to 250 kPa.

118
Table D-9 Trend of Flux Decline (TP = 96 kPa, HRT = 6 h & 40 min)
Time (min) Flux (L/m2.h)
Module I Module II 1 2 3 4 5 6 7 8 9
10 11 12 13 14 15
0.0 16.8 16.5 14.7 14.7 14.7 13.8 13.2 13.5 12.9 12.6 12.6 12.6 12.6 12.0
0.0 12.1 13.5 13.5 13.2 12.6 12.3 12.0 12.0 11.7 11.4 11.4 11.1 11.1 10.8
Table D-10 Variation of HRT at Different Operation Mode (TP = 96 kPa)
Operation Mode HRT (h) 4:4
5 : 5 7.5 : 7.5 10 : 10 15 : 15
4.36 4.07 4.60 6.07 6.50

119
Table D-11 Color and Turbidity of Effluent - Run I (HRT = 15 h)
Time (d) Color (Hazen color unit) Turbidity (NTU) 29/03 01/04 04/04 07/04 10/04 13/04
30 30 30 30 25 20
0.30 0.25 0.25 0.25 0.25 0.20
Table D-12 Color and Turbidity of Effluent - Run II (HRT = 10 h)
Time (d) Color (Hazen color unit) Turbidity (NTU) 16/04 19/04 22/04 26/04 29/04 02/05
30 20 20 20 20 20
0.30 0.25 0.20 0.20 0.20 0.20
Table D-13 Color and Turbidity of Effluent - Run III (HRT = 6 h)
Time (d) Color (Hazen color unit) Turbidity (NTU) 05/05 08/05 11/05 14/05 17/05 21/05
20 20 15 20 25 20
0.25 0.20 0.15 0.20 0.20 0.15
Table D-14 Color and Turbidity of Effluent - Run I (HRT = 3 h)
Time (d) Color (Hazen color unit) Turbidity (NTU) 24/05 27/05 06/06 09/06 12/06 15/06 18/06 21/06 24/06
35 30 30 30 25 20 20 20 20
0.40 0.25 0.30 0.25 0.25 0.20 0.30 0.30 0.30
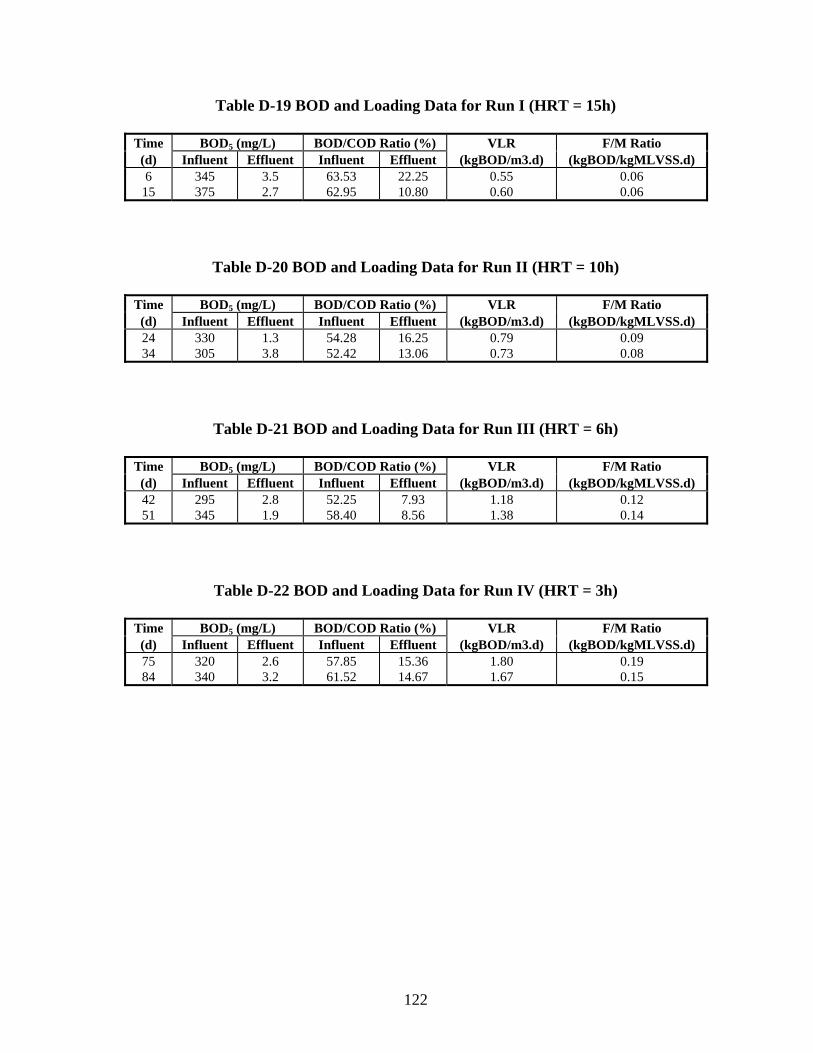
122
Table D-19 BOD and Loading Data for Run I (HRT = 15h)
Time BOD5 (mg/L) BOD/COD Ratio (%) VLR F/M Ratio (d) Influent Effluent Influent Effluent (kgBOD/m3.d) (kgBOD/kgMLVSS.d) 6
15 345 375
3.5 2.7
63.53 62.95
22.25 10.80
0.55 0.60
0.06 0.06
Table D-20 BOD and Loading Data for Run II (HRT = 10h)
Time BOD5 (mg/L) BOD/COD Ratio (%) VLR F/M Ratio (d) Influent Effluent Influent Effluent (kgBOD/m3.d) (kgBOD/kgMLVSS.d) 24 34
330 305
1.3 3.8
54.28 52.42
16.25 13.06
0.79 0.73
0.09 0.08
Table D-21 BOD and Loading Data for Run III (HRT = 6h)
Time BOD5 (mg/L) BOD/COD Ratio (%) VLR F/M Ratio (d) Influent Effluent Influent Effluent (kgBOD/m3.d) (kgBOD/kgMLVSS.d) 42 51
295 345
2.8 1.9
52.25 58.40
7.93 8.56
1.18 1.38
0.12 0.14
Table D-22 BOD and Loading Data for Run IV (HRT = 3h)
Time BOD5 (mg/L) BOD/COD Ratio (%) VLR F/M Ratio (d) Influent Effluent Influent Effluent (kgBOD/m3.d) (kgBOD/kgMLVSS.d) 75 84
320 340
2.6 3.2
57.85 61.52
15.36 14.67
1.80 1.67
0.19 0.15

125
APPENDIX E
Nitrogen Mass Balance

126
Nitrogen mass balance calculation for Run I is shown below. Nitrogen compounds in influent: TKN (mg/L) = 43.96 NO2-N (mg/L) = 0.09 NO3-N (mg/L) = 0.13 ∴ Total Nitrogen in influent (mg/L) 44.18 Nitrogen compounds in effluent: TKN (mg/L) = 0.0 NO2-N (mg/L) = 0.003 NO3-N (mg/L) = 3.21 ∴ Total Nitrogen in influent (mg/L) 3.213 Nitrogen lost by assimilation: BOD5 - inf (mg/L) = 375 BOD5 - eff (mg/L) = 2.7 Nitrogen lost in assimilation (mg/L) = α (BOD5i - BOD5e) = 0.05 (375 - 2.7) 18.62 According to Eq. 4.1 Nitrogen by lost by denitrification
= Total Nitrogen in influent - Total Nitrogen in effluent
- Nitrogen assimilated into biomass
= 44.18 - 3.213 - 18.62 = 22.347 mg/L

All the above mentioned studies on anaerobic process are based on cross flow membrane filtration in an external circuit. Among the all Grethlin (1978) had operated the system with intermittent filtration to have improved steady flux. As used in the aerobic biological treatment system, it is possible to use air back washing techniques in the anaerobic system also. Considering the fact that gas used to back wash should not effect the anaerobic condition, two possible alternatives are shown in Fig. 2.15. The first system shown in Fig. 2.15 will consist of two reactors, first one with mixing devices to achieve high rate biodegradtion and the other one to settled down bio flocks. In this system supernatant will be withdrawn from the second reactor passed through a membrane for solid/liquid separation. In this system, for back washing ambient air could be used as most of the air will escaped and will not induce any significant level of DO concentration in the bioreactors. Since supernatant is passed through the membrane it will have less clogging problem and yield almost constant permeate. However the system suffered from high pumping cost. In the second system membrane submerged into the bioreactor itself. Since the mixed liquor always should be maintained in an anaerobic condition ambient air cannot be used, instead nitrogen gas can be used. However use of nitrogen gas may alter the composition of the biogas produced and may need to undergo some purification stages before the biogas to be used to any purposes. But the major advantage of the second system is less space and low energy requirements.
Fig. 2.15 New Concepts for Membrane Application in Anaerobic Treatment

Excess Sludge
(b) Submerged Membrane Separation
CH4/CO2
Excess Sludge
(a) External Membrane Separation
CH4/CO2

MEMBRANE AS AIR DIFFUSERAND SOLID/LIQUID SEPARATOR
IN A BIOREACTOR FOR DOMESTIC WASTEWATER TREATMENT
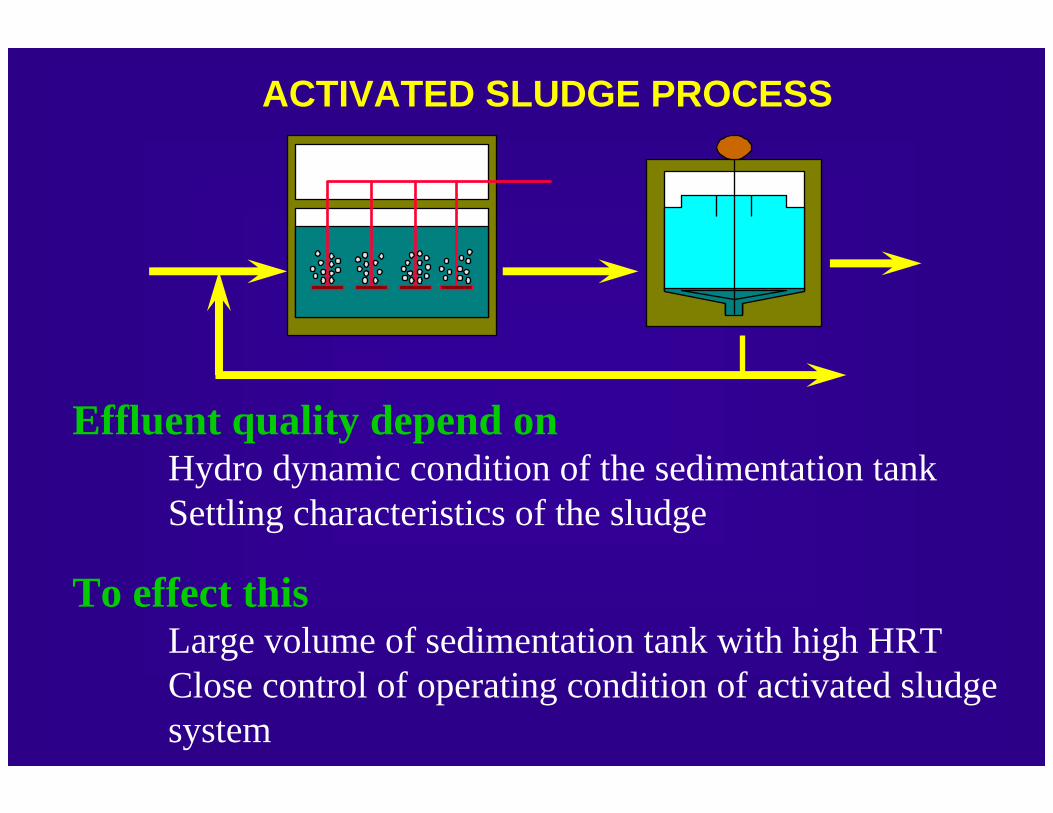
ACTIVATED SLUDGE PROCESS
Effluent quality depend onHydro dynamic condition of the sedimentation tankSettling characteristics of the sludge
To effect thisLarge volume of sedimentation tank with high HRTClose control of operating condition of activated sludge system
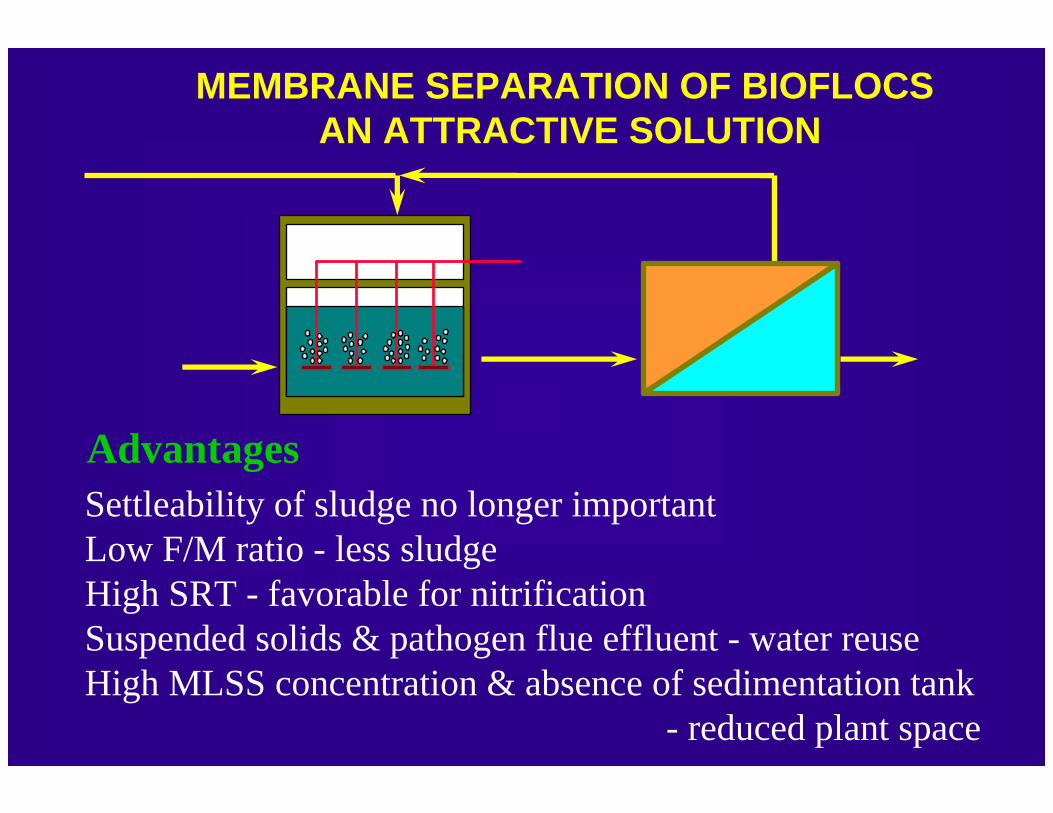
Advantages
MEMBRANE SEPARATION OF BIOFLOCS AN ATTRACTIVE SOLUTION
Settleability of sludge no longer importantLow F/M ratio - less sludgeHigh SRT - favorable for nitrificationSuspended solids & pathogen flue effluent - water reuseHigh MLSS concentration & absence of sedimentation tank
- reduced plant space
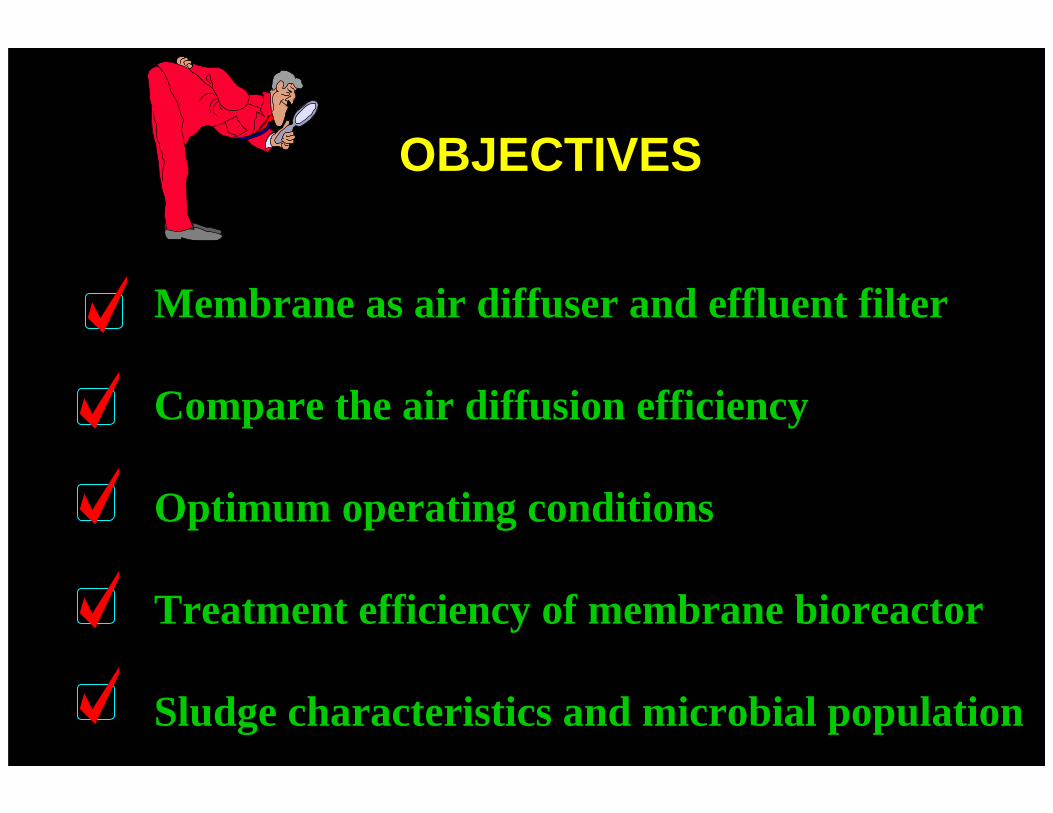
OBJECTIVES
Membrane as air diffuser and effluent filter
Compare the air diffusion efficiency
Optimum operating conditions
Treatment efficiency of membrane bioreactor
Sludge characteristics and microbial population

Optimum Backwash Air Pressure
Compressed air
Vacuum gauge
Suction pump
For flux measurement
Timer

For fluxmeasurement
Vacuum gauge Suctionpump
Ultra filteredtap water
Membranemodule
Recycle line
Membrane Resistance Measurement

Compressedair
Feed tank
Vacuum gauge
Suction pump
Treated watertankMembrane
Module
Compressed air
Experimental Setup forLong Term Experiments
Feed pump
Levelsensor
Stone air diffusersAnoxic tank Membrane
bioreactor
RecirculationPump
Timer

Gas Transfer Efficiency Measurement
Compressed air
Compressed air
Stone air diffusers

METHODOLOGYPhase I
Initial membrane resistanceGas tramsfer efficiencyOptimum backwash air pressure
Phase IIExperimental runs to evaluate the perfomance
SRT - 50 daysHRT - 15 h
- 10 h- 6 h- 3 h
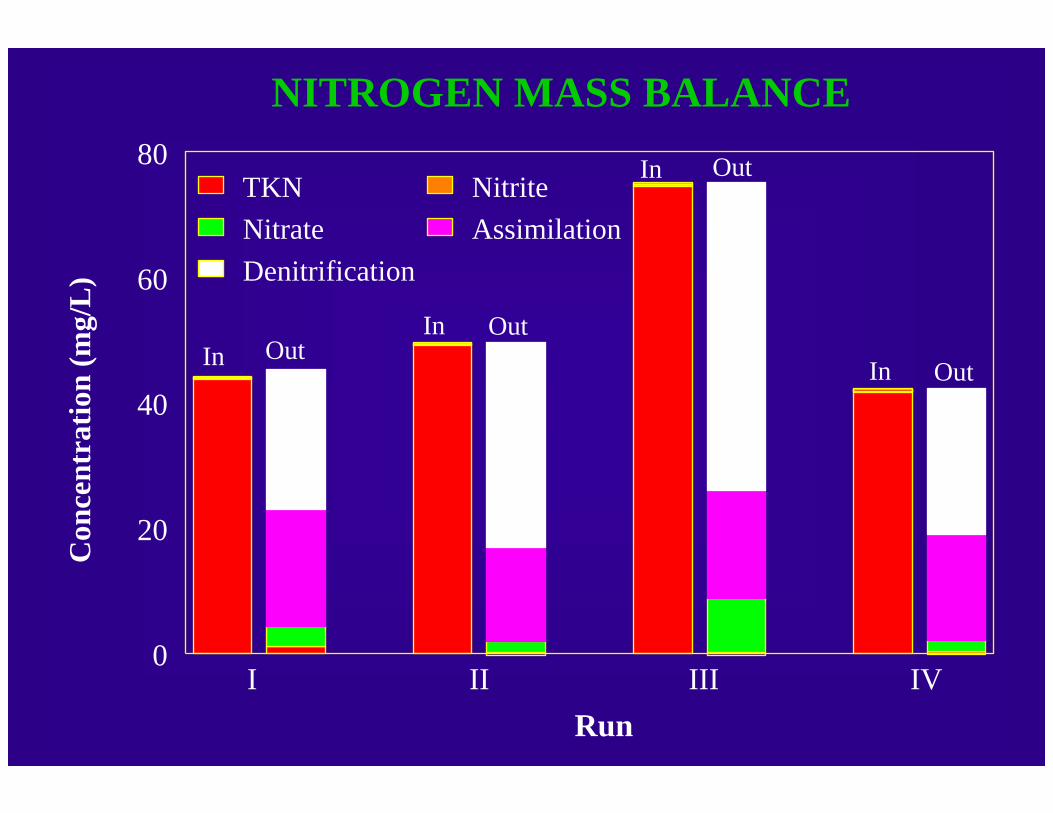
NITROGEN MASS BALANCE
Run
0
20
40
60
80
Con
cent
ratio
n (m
g/L
)
TKN NitriteNitrate AssimilationDenitrification
I II III IV
InIn
In
In
OutOut
Out
Out

Characteristics of waste Sludge from MBRand Conventional Activated SludgeProcess
Parameter ASP MBR
HRT (h) - 15 10 6 3
Settled volume ( mL/L) 840 980 985 960 990
Suspended solids (mg/L) 7,730 15,110 13,980 16,010 14,830
Sludge Volume Index (mL/g) 108.67 64.8 70.5 59.9 66.76
Capillary Suction time (s) 21.6 111 117 102 113

CONCLUSIONMembrane are better air diffusers than stone air diffusers
Cyclic operation with air back flushing improve flux rate
Increased backwash air pressure improve the flux rate inlong run
At 150 kPa backwash air pressure 90 % flux improvement observed
High transmembrane pressure cause more resistance to filtration
Backwash air alone can aerate mixed liquor when treating domestic wastewater

Bioreactor performance - removal efficiencies
COD > 95 % (eff. conc. < 27 mg/L)
BOD removal > 98 %(eff. conc. < 4 mg/L)
TKN > 95 %
Total Nitrogen > 80 %
Total phosphate 50 - 90 %
Faecal/total coliform < 2 No/100 mL
Regular wasting of sludge help to maintain the MLVSS/MLSS ratiobetween 70 to 80 %
Sludge characteristics show dificulties in dewatering but small quantity produced would conpensate this in terms of cost
MBR PRODUCE EXTREAMLY GOOD QUALITYEFFLUENT COMPARED TO CONVENTIONAL
ACTIVATED SLUDGE PROCESS
USING AIR BACKWASHING CAN DO A DUAL FUNTION OF MEMBRANE DECLOGGING AS WELL AS AERATING THE MIXED LIQUOR

RECOMONDATIONSGas transfer efficiency need to be studied based on power consumption
Gas transfer effieciency of clogged membrane need to be studied so can be used as design parameter
Long term experiments are necessary to identifymicroorganism activityinhibitory effects of nitrifierschange of membrane properties
Dirunal varialtion of loading
Enhanced total phosphate removal
Pilot scale experiments
Cause of membrane fouling

NITROGEN MASSBALANCE
Inflow of N-Compounds(TKN+Nitrite+Nitrate)
Escape of nitrous gasesdue to denitrification
Assimilation ofN into Biomass
Outflow of N-Compounds(TKN+Nitrite+Nitrate)