environmental and techno-policy …faculty.ait.ac.th/visu/public/uploads/data/ait-thesis/master...
TRANSCRIPT

ENVIRONMENTAL AND TECHNO-POLICY ANALYSIS OF AN AGRO ECO-INDUSTRIAL NETWORK
IN CHACHOENGSAO PROVINCE
by
Niranchana Authayanraksa
A thesis submitted in partial fulfillment of the requirements for the degree of Master of Science in
Environmental Engineering and Management
Examination Committee: Prof. C. Visvanathan (Chairperson) Dr. Nowarat Coowanitwong Dr. Thammarat Koottatep
Dr. Shabbir H. Gheewala Nationality: Thai Previous Degree: Bachelor of Science (Public Health) Mahidol University, Bangkok, Thailand Scholarship Donor: RTG Fellowship
Asian Institute of Technology School of Environment, Resources and Development
Thailand May 2007

i
ENVIRONMENTAL AND TECHNO-POLICY ANALYSIS OF AN AGRO ECO-INDUSTRIAL NETWORK
IN CHACHOENGSAO PROVINCE
by
Niranchana Authayanraksa
A thesis submitted in partial fulfillment of the requirements for the degree of Master of Science in
Environmental Engineering and Management
Examination Committee: Prof. C. Visvanathan (Chairperson) Dr. Nowarat Coowanitwong Dr. Thammarat Koottatep
Dr. Shabbir H. Gheewala Nationality: Thai Previous Degree: Bachelor of Science (Public Health) Mahidol University, Bangkok, Thailand Scholarship Donor: RTG Fellowship
Asian Institute of Technology School of Environment, Resources and Development
Thailand May 2007

ii
Acknowledgements The author wishes to express her profound gratitude and appreciation to her advisor, Prof. C. Visvanathan for his constant support, valuable suggestions and expertise, and his all encouragement which have enable her to achieve the study. She also would like to express her grateful appreciation to these examination committees, Dr. Nowarat Coowanitwong, Dr. Thammarat Koottatep, and Dr. Shabbir H. Gheewala for their valuable comments. Heartfelt gratitude is due to the Royal Thai Government and the Asian Institute of Technology for granting scholarship and providing a great advantage to pursue her master degree at AIT. The author would like to express her gratefulness to the Head and officers of Chachoengsao Provincial Offices, especially Provincial Natural Resources and Environmental Office, Provincial Industrial Office, and Provincial Livestock Office for the facilities in the collection of data and information needed. Grateful acknowledgement is extended to Mr. Thanaphob Kiatchaweepan, Mr. Pichet Tonitiwong and participant entrepreneurs for their kindly cooperation in the field study. Special thanks are expressed to the Research Associates, Mr. A. Prem Ananth for guidance, regular help and technical supports. Thanks also go to all Research Associates and Advisees under Prof. C. Visvanathan for their helpful discussions. Many thanks are also extended to all the Environmental Engineering and Management staff members for their generous assistant. Warm thanks to Ms. Orathai Klubbankoh for friend her during the data collection at the field. Finally, the author would like to convey her thanks to her family and friend for their great love, support, understanding and encouragement to complete her study at AIT.

iii
Abstract Chachoengsao Province is one of the less urbanized and industrialized zone of the Eastern region evidenced by the presence of traditional agro industries. The eastern districts of the Province, also the fringe areas of the Bangkok urban, are well irrigated by the Bang Pakong River and support paddy cultivation to a large extent. Abundant of natural resources and availability of labor promotes agriculture as a mainstream occupation. The study considering the material flow and economic linkages in the peri-urban areas, the study focused on the five districts; Muang Chachoengsao, Bang Khla, Bang Nam Priao, Bang Pakong, and Ban Pho. Specifically, the system under consideration is the predominant agriculture sector with rice as the major product, its value chain, and the scattered livestock sectors. The environmental setting of the sector and study region was first understood through a baseline study. The material flow starts with paddy cultivation in and proceeds as many steps until all the products and by-products are completely utilized. The livestock sectors are also connected through material flows. The quantitative material flow pattern in the region is formed; it is evident that though a near-perfect material flow occurs, pollution problems due to unrecognized value of materials still exist. The material flow in the rice and livestock sectors of Chachoengsao indicates the potential for its transformation to an Agro Eco-industrial network. Introduction of new technologies are essential for a successful transformation. Appropriate policy reforms considering all related issues of the Eco-industrial network and rightly integrated with national and local development priorities is essential.

iv
Table of Contents Chapter Title Pages Title Page i Acknowledgements ii Abstract iii Table of Contents iv List of Tables vi List of Figures vi Abbreviations vii 1 Introduction 1 1.1 Background 2 1.2 Objectives of the Study 2 1.3 Scopes of the Study 2 2 Literature Review 4 2.1 Introduction of the Environmental Management 4 2.1.1 Industrial Ecology (IE) 4 2.1.2 Eco-Industrial Network (EIN) 6 2.1.3 Eco-Industrial Project 7 2.2 Environmental Management Issues of Agro-based Industry 9 2.2.1 Definition of Agro-based Industry 9
2.2.2 Impacts of Agro Processing Industry 9 2.2.3 Situation and development of Agro-based Industry 10 2.3 Profile of the study area: Chachoengsao Province 11 2.3.1 General information 11 2.3.2 Pollution problems in the region and the Province 12 2.4 Key role of the Rural Urban Fringe area 13 2.5 Policy Aspects 13 2.5.1 Environmental policy 13 2.5.2 Industrial Policy 14 2.6 Economic Aspects 15 2.6.1 General economy of the country 15 2.6.2 Provincial Economic and employment 15 2.6.3 Economic project 16 2.7 Technical Aspects 16 2.7.1 Cluster Development in Thailand 16 2.7.2 Biomass Utilization 17 2.7.3 Bioconversion of carbohydrate residues in Thailand 17 2.8 Applying Industrial Ecology and Research need 17 3 Methodology 20 3.1 Introduction 20 3.1.1 Study area 20 3.1.2 Methods Adopted for the Study 21 3.2 Research Methodology 21 3.2.1 Secondary Data Collection 23 3.2.2 Environmental Baseline 23

v
3.3 Field Study 24 3.3.1 Collecting data on agro industry 24 3.3.2 Designed Questionnaire and Size Selection 25 3.3.3 Interview with the entrepreneurs 25 3.3.4 Evaluation of financial performance of the industry 26 3.3.5 Comprehend the perspectives of entrepreneurs 26 3.4 Material Flow Network Creation 26 3.5 Desk review 27 3.5.1 Technology and Environmental aspects 28 3.5.2 Policy Analysis 28 3.5.3 Commonalities and conflicting condition of policies 29 4 Results and Discussion 30
4.1 Situation of Chachoengsao Province 30 4.1.1 Topography and Physical Setting 30 4.1.2 Meteorology 30 4.1.3 Administration 31 4.1.4 Population 31 4.1.5 Infrastructure 33 4.1.6 Provincial economy development 34 4.1.7 Social, public health and sanitation 38 4.1.8 Natural resources and environmental issues 39
4.2 Major Economic Activities in Chachoengsao Province 44 4.2.1 Rice cultivation 44 4.2.2 Rice mill 47 4.2.3 Rice-based industrial processing in the study area 58 4.2.4 Livestock sectors 67
4.3 Rice based Eco-Industrial network 72 4.4 The calculation explanation of material flow network 75 4.5 Technology needs for EIN formation 76 4.6 Policies 77 4.6.1 Government administration system in Thailand 77 4.6.2 National Level 80 4.6.3 Policy Network 87 4.6.4 Conclusion Remark 91
5 Conclusions and Recommendations 93 5.1 Conclusions 93 5.2 Recommendations 94 References 95 Appendices 98

vi
List of Tables Table Title Pages 2.1 Thailand’s top ten food exports in 1998 11 2.2 Public Complaints on Pollution in the Eastern region of Thailand 12 2.3 Primary attributes of pollution prevention and industrial ecology 18 4.1 Demography of the region 32 4.2 Number of Major Industrial establishment, capital and employees 37 4.3 Water demand in the Province 40 4.4 Solid waste Generation in Chachoengsao Province 43 4.5 Distribution of Rice Mill in Chachoengsao Province 49 4.6 Management methods of Product, By-products and Wastes generation 55 4.7 Energy utilization of electricity and husk fuel in rice mill production 56 4.8 Wastewater characteristic of parboiled rice mill 57 4.9 Rice mill and rice by-product industry in Chachoengsao Province 58 4.10 Raw material consumed and product of Rice noodle Industry 60 4.11 Wastewater characteristic of specific rice noodle industries 62 4.12 Distribution and size of pig farm in the study area 68 4.13 Wastewater generation and characteristic 68 4.14 Biogas parameters of 1 pig (approximately weight 60 kg) 69 4.15 Distribution and size of poultry farm in the study area 70 4.16 Types and number of aquaculture farming of registered farmer 71 4.17 Wastewater discharge from shrimp cultivation and harvesting 71 4.18 Number of each types of factory in Network of the Province 75

vii
List of Figures Figure Title Pages 2.1 Waste management hierarchy 5 2.2 Major components of an industrial ecosystem 6 2.3 Eco-Industrial Network and relationships of between the terms 7 2.4 Kalundborg Industrial Symbiosis 8 2.5 Revenue Sources of Chachoengsao Province 16 3.1 Administration Map of Chachoengsao Province 20 3.2 Research Methodology 22 3.3 Typical information collected from secondary source 23 3.4 Example of Material Balance in a Rice Mill Processing 26 3.5 Potential Material Flows Network of Agro-Eco Industrial Network 27 4.1 Key Map of Chachoengsao 30 4.2 Meteorology of the Chachoengsao Province 31 4.3 Administrative Map 31 4.4 Yearly population growth rates in Chachoengsao Province 32 4.5 Electricity Sales by Type of Consumers and Districts 34 4.6 Agricultural land use of the Province between 1993 and 2003 35 4.7 Number of livestock by district in Chachoengsao Province 36 4.8 Disease prevalence in Chachoengsao Province 39 4.9 Landuse area of Chachoengsao Province 42 4.10 Solid waste composition of Chachoengsao Muang 43 4.11 Rice Cultivation in Chachoengsao Province 45 4.12 Cost in the investment of major rice cultivation 46 4.13 Trend of rice mills established in the province, regions and country 47 4.14 Rice milling process flow diagram 50 4.15 Unit operations of Rice mill production process 51 4.16 Parboiled rice process flow diagram 52 4.17 Mass balance of typical rice mill process 53 4.18 Mass balance of typical parboiled rice mill process 54 4.19 Electricity consumption of rice mill production 56 4.20 Mass balance of rice noodle processing 60 4.21 Rice noodle production process 61 4.22 Wastewater and treatment pond 62 4.23 Rice bran oil extraction flow chart 64 4.24 Mass balance of rice bran oil processing 65 4.25 Piggery farming and wastewater treatment 69 4.26 Actual Rice-based Material Flow Network in the study area 73 4.27 Rice-based Material Flow Network in AEIN 74 4.28 Policies affected to Agro Eco-Industrial Network 78 4.29 Local Administrative Organization affected to AEIN 79 4.30 Action Plans for the 9th NESD Plan – Drive on Cluster development 81

viii
Abbreviations AEIN Agro Eco-Industrial Network PEA Provincial Electricity Authority MEA Metropolitan Electricity Authority EGAT Electricity Generating Authority of Thailand EPPO Energy Policy and Planning Office DIW Department of Industrial Work IE Industrial Ecology EIP Eco-industrial park or estate BPX By-product exchange EIN Eco-industrial network PCD Pollution Control Department ASEAN Association of Southeast Asian Nations OTOP One Tambon, One Product SMEs Small and Medium Enterprises NICs Newly Industrialized Countries GPP Gross Regional and Provincial Product NESDB National Economic and Social Development Board MSG Monosodium Glutamate UNEP United Nations Environment Program DTV Daedok Techno Valley CLA Life-Cycle Inventory Assessment BOI Board of Investment DIP Department of Industrial Production FAO Food and Agriculture Organization PRD Public Relations Department TISC Thailand Investor Service Center WHO World Health Organization

1
Chapter 1
Introduction
1.1 Background Thailand, primarily an agricultural country, has had a diversified economy since the 1960's with about 81% of the population living in rural areas. Today, agriculture constitutes the largest income generating sector followed by the manufacturing industries in the second place. While Thailand's economic prosperity has cemented the country’s image as an industrial leader and development partner, the negative environmental impacts of development, rapid urbanization, and industrialization have taken their toll on the country and its people. Chachoengsao Province, a land of agriculture depends on its natural resources, mainly land and water. Agriculture in the region has developed targeting the urban markets of Bangkok and in some cases the export markets. The proximity of the region makes it to be potentially referred as the satellite town to the economic, administrative and residential nucleus of Bangkok. The Chachoengsao province represents a rural urban fringe area which plays a key role in the economic vitalization of the rural area by meeting the resource needs of the urban centre. With an annual output of about 2 million tons of vital agricultural products such as rice, tapioca and others, Chachoengsao steadily maintains a complex relationship between industry and agriculture. Even in the present days of industrialization and modernization, industries in the Province are characterized with agricultural products. Industries in the province have been always consuming resources from this rural area to feed the urban centre of Bangkok’s. Depleting resources, degrading environmental quality due to poor management systems, lack of awareness on environmental issues and unscientific methods of production, and waste disposal has rendered the region vulnerable. Recently, industrialization has been accelerated in accordance with the Government’s policies with the economy of the province standing a better chance through the rapid expansion of industrial sectors, development of transportation services for product and mankind, and increased investments. The scale of operation and the rate of growth indicate that the industries have been focusing more on the development of the economy than the sustenance of the environment and its resource. The nature of agro industries tends to be highly natural resource dependent, less capital intensive, poorly integrated with the modern technologies and heavily labour dependent. However, these industrial units offer the possibility of technology transfer and opening up of markets. There is need for complementarities between large and smaller indigenous agro-processing operations. The growth of this sector also gives rise to significant environmental degradation. Strategic environmental and economic planning is needed to keep the impacts of economic development on the environment in an acceptable level. Industrial Ecology is a tool to develop sustainable industries in an environmental friendly way to achieve the goals of economic development. Industrial ecology has been gaining momentum in the recent

2
years owing to its nature of solving environmental problems and resource constraints by following innovative approaches and methods. Eco-Industrial Networking (EIN) is a relatively unexpected concept which aims at converting industries with linear consumption, production and waste handling processed into cyclic closed loop industrial systems. Eco-Industrial Clusters thus aim at reduced consumption of resources, efficient production processes and improved waste management methods. This study seeks to find solutions and innovative ideas for development of Eco-Industrial Networking. In addition to environmental protection, economic revitalization and social upliftment are also essential for the development to be sustainable. Therefore this study attempts to understand the implications of prevailing policies and social conditions so as to integrate them with environmental and economic planning in the right level. Thus the results of the study would aid in the development of a blue print for an integrated strategic environmental and economic plan. 1.2 Objectives of the study The general objective of the study is to analyze and assess possibilities and the potential for Eco-industrial network development of agro-based industries in Thailand, using Chachoengsao Province as the case study. The specific objectives include the following:
1. To investigate the existing environmental, economic and technological situation of the agro-based industries in the urban fringe areas of Chachoengsao Province.
2. To study the existing role and level of integration of policies related to the development of industrial clusters and local communities.
3. To develop industrial networks (Material flow network) to identify alternative use of waste or by-product and optimize resource use thus improving the environmental and economic benefits of the industry and the community.
1.3 Scope of the study This study needs the collection and analysis of primary and secondary data on environmental, economic, technological, and policy aspects of agro based industries in the Chachoengsao Province, especially Bangpakong, Ban Pho, Chachoengsao Muang, Bangkla and Bangnampriao districts. A survey of the present industries and socio-economic aspects was carried out through the interviews and questionnaire during the field visit. The existing situation, management options and environmental performances of the agro based industries was investigated. Based on the response and the policy analysis, appropriate technology and policy measures were suggested. The research looks forward to preparing and proposing for agro eco-industrial network report which is focused on findings and suggest the potential material flow network in the

3
macro scale of the Province. Due to the limitation of time, resources, and availability of raw data, the following data boundary was investigated:
1. Rice-based industry was the mainly focused for agro-based industrial sector for network creation. Also, the industrial sectors which are consumed the wastes and by-products from anchor were investigated.
2. Eco-industrial network was focused on the waste or non-product materials and energy exchange.
3. The present industry sectors were selected and it is sampling for data collection within 5 listed districts in Chachoengsao Province.
4. The relevant policies of the proposed eco-industrial network are mainly determined from industrial and environmental institutions so as to maximize environmental, economic and social benefits both to the industry and the community.

4
Chapter 2
Literature Reviews
2.1 Introduction of the Environmental Management The goals of industry are incompatible with the preservation and enhancement of the environment (Graedel and Allenby, 1995). The more demand to provide a suitable life quality for Earth’s citizens will not involve less, but more industrial activities and contribute to serious environmental problems. Thus, providing a sustainable world will require close attention to industry and environment interactions. The disregard for the protection of the environment cannot be justified by the benefits of economic development. Therefore, how to protect and improve the environmental quality has risen thinking many decades ago. Government regulatory agencies and industry have focused their pollution reduction efforts on controlling effluents at the point where they enter the environment, since the beginning of the environmental movement in the early 1960s (Chiu and Peters, 1994). The end-of-pipe measures were added into industrial processes (Khan et al., 2001). However, the advent of strict environmental legislation in recent years, combined with the ineffectiveness and relatively high cost of several end-of-pipe treatment technologies have, in many instances, resulted in making this approach inadequate to deal with the magnitude and complexity of environmental degradation. The limitations of end-of-pipe treatment made environmental decision-makers consider replacement of end-of-pipe treatment by other alternative methods of pollution control. Consequently, during the last decade, environmental researchers began focusing on cleaner production, waste minimization and even a new academic discipline, Industrial Ecology (IE), was born with the mission to design zero-emission industrial processes (Ayres and Simonis, 1994; Graedel and Allenby, 1995) these pollution management approaches have contributed significantly to reducing pollution, improving environmental performance, raising profitability and enhancing competitiveness. Though several successes on environmental protection have been achieved by applying these approaches, environmentalists recognize that their practical sphere is limited due to lack of unsustainable industrial system into a more environmentally sound direction. The environmental protection approaches towards the top are usually preferred, as they are more effective in economic and environmentally; and efficient in reducing the amount of wastes; and therefore reduce present and future threats to human health and the environment. 2.1.1 Industrial Ecology (IE) The new approach of industrial environmental management is Industrial Ecology and we accept the claim of some industrial ecologists this is “the science of sustainable development” (Allenby and Richards, 1994; Lowe et al., 1997). IE focuses on reducing the environmental impacts of goods and services, on systems-based analysis of environmental problems and on innovations that can significantly improve environmental performance.

5
Figure 2.1 Waste management hierarchy Robert Frosch and Gallopoulos (1989) were early drafters of the concept, For them: an industrial ecosystem is the transformation of the traditional model of industrial activity, in which individual manufacturing takes in raw materials and generates products to be sold plus wastes to be disposed of, into ma more integrated system, in which the consumption of energy and materials is optimized and the effluents of one process serve as the raw material for another process. According to Allenby (1994), Industrial Ecology is the study of the flows of materials and energy in industrial and consumer activities, of the effects of these flows on the environment, and of the influences of economic, political, regulatory, and social factors on the flows, use, and transformation of resources, The objective of industrial ecology is to understand better how we can integrate environmental concerns into our economic activities. This integration, an ongoing process, is necessary if we are to address current and future environmental concerns.” The important theme of Industrial Ecology is that design of industrial systems can, to some extent, be modeled upon ecosystem. A simple definition of an industrial ecosystem is focusing on the relations among companies in direct waste and by product exchange (Frosch and Gallopoulos, 1989). Connections with a natural ecosystem have also been made, both a interface level between man-made ecosystems with natural global ecosystem (Tibbs, 1992) as well as the application of the principles of natural systems to man-made systems (Kirchner, 1995). Industrial ecosystem can be defined as including all types of production, processing and consumption, for instance agricultural production as well as purely industrial operation (Manahan, 1999). The four major components are shown in the figure 2.2. Industrial Ecology is an interdisciplinary framework for designing and operating industrial systems as living systems interdependent with natural systems. On of the focus areas of IE is the networking of industries for efficient use of resources and minimizing or avoiding the material discarded as waste by finding an alternate use to it.
Most Favored option
Least Favored option
Prevention
Minimization
Reuse
Recycling
Energy recovery
Disposal

6
Material processing and manufacturing sector
Waste processor
Consumer sector Primary material and energy producers
Figure 2.2 Major components of an industrial ecosystem 2.1.2 Eco-Industrial Network (EIN) A classical definition of an Eco-industrial Park as given by Lowe (2001) is:
“An eco-industrial park or estate is a community of manufacturing and service businesses located together on a common property. Member businesses seek enhanced environmental and resource issues. By working together, the community of businesses seeks a collective benefit that is greater than the sum of individual benefits each company would realize by only optimizing its individual performance” The Goal of an Eco-industrial Park is to improve the economic performance of the participating companies while minimizing their environmental impacts. Components of this approach include green design of park infrastructure and plants (new or retrofitted); cleaner production, pollution prevention; energy efficiency; and inter-company partnering. An EIP also seeks benefits for neighboring communities to assure that the net impact of its development is positive. To be a real EIP, a development must be more than:
A single by-product exchange or network of exchanges; A recycling business cluster; A collection of environmental technology companies; A collection of companies making “green” products; An industrial park designed around a single environmental theme; A park with environmentally friendly infrastructure or construction; or A mixed-use development (industrial, commercial, and residential).
Although many of these concepts may be included within an eco-industrial park and should be more comprehensive. Since the terms Industrial Park and Industrial estate are in common use. Clarifying the EIP terms is important to make it clear usage for proponents and proper chosen use of many different phases to speak of the same basic strategies. Lowe (2001) distinguished three basic categories of eco-industrial projects:
• Eco-industrial park or estate (EIP)- an industrial park developed and managed as a real estate development enterprise and seeking high environmental, economic, and social benefits as well as business excellence.

7
• By-product exchange (BPX) - a set of companies seeking to utilize each other’s by-products (energy, water, and materials) rather than disposing of them as waste.
• Eco-industrial network (EIN) - a set of companies collaborating to improve their environmental, social, and economic performance in a region.
There are various ways projects can overlap and the Figure 2.3 is shown the relations between each terms. EIPs and EINs may include by-product exchange programs. One or more EIPs may participate in either a BPX or EINs.
Figure 2.3 Eco-Industrial Network and relationships of between the terms
An Eco-Industrial Network may include stand-alone companies, companies in industrial parks and the park management organizations. EIN members collaborate to enhance their performance and to create shared service and facilities. One form of collaboration is to exchange by-product materials, energy, or water among companies, when feasible. Eco-Industrial Clusters (EIC) and Eco-Industrial Networks (EIN) are synonymous in terms of nature and have been interchangeably used through out this text. Essentially, both EICs and EINs refer to a collection of industries along the value chain of the same product or similar products. EICs and EINs also collectively represent a manufacturing/service system where a symbiosis exists within and among the components of the system. Components or member industries of the system exchange raw materials and by products, share common resources, technology, information, infrastructure etc. 2.1.3 Eco-Industrial Project In the literature, it can be found that most focus point commonly used for industrial ecosystem approach has been an eco-industrial park or local industrial system with the often cited example in Kalundborgin Denmark. Lowe (1997) stated that the story of it has become the premier case illustrating industry can coexist in a kindly manner while generating bottom-line benefits.
EIP=eco-industrial park EIN=eco-industrial network IP= conventional- industrial park Company by-product exchange
C
EIP
IP
IP
EIN
C
C
C C
C
C
C C
CC
C
C
C
C
C
C
C
C
C
C
C
C

8
• Kalundborg Industrial Park Kaludborg is a small industrial area on the Danish coast (Cohen-Rosenthal and McGalliard, 2003). The industrial symbiosis began to evolve in the 1970s, as several of the core partners, truing to reduce costs and meet regulatory goal, sought innovative way of managing waste materials and using freshwater more efficiently. Symbiotic connections have developed between major and minor partners. The Statoil refinery distributes sulfur by-product to a sulfuric acid manufacture and hot water to local greenhouses. Waste heat and steam from the Asnaes Power Station are used by Novo Nordisk, which in turn distributes organic sludge from its manufacturing process to locals as fertilizer. The Kalundborg model goes beyond material exchanges and in a limited way towards other types of collaborations in worker training and safety (Gertler, 1995).
Source: Cohen-Rosenthal and McGalliard, (2003)
Figure 2.4 Kalundborg Industrial Symbiosis
The primary focus remained on the material and energy exchanges. The symbiotic relationships between the core partners of Kalundborg and others that operate within the system is presented in Figure 2.4. According to Novo Nordisk, one of main participants in the Kalundborg scheme, the 60 million US$ was invested in build 16 exchanges project. These projects produce surplus 10 million US$ annually. The environmental benefits of industrial ecology schemes can be significant as well. At Kalundborg, Large savings have been achieved in consumption of raw materials; annual oil consumption was reduced by 45,000 tons, coal consumption by 15,000 tons, and water consumption by 600,000 m3. The Carbon dioxide and Sulphur dioxide emissions have reduced by 175,000 tons and 10,200 tons per year. Moreover, several EIP projects appeared in many developed countries in the world after Kalundborg such as;
Statoil Refinery
Sulfuric acid maker
Greenhouses
Asnaes Power Station
Novo Nordisk Pharmaceutical Plant
Local Farms
Asnaes Fish farm
Cement Company
Wallboard factory
Sulfur Hot water
Surplus gas Cooling water Steam
Surplus gas
Gypsum Condensate
Steam Waste heat
Fertilizer Sludge
Waste water
Warm water
Fly ash

9
Burnside industrial park, Nova Scotia, Canada. Fairfield Eco-Industrial Park Project, Baltimore, Maryland, USA Port of Cape Charles Sustainable Technology Industrial Park Project, Eastville,
Northampton County, Virginia Brownsville Eco-Industrial Park Project, Brownsville, Texas Riverside Eco-Park Project
In addition of these examples, every time concerns have a symbiotic relationship in which wastes from one are utilized by another, they can be regarded as a partial constitution of an industrial ecosystem, of which exist throughout the world (Tran, 2003). 2.2 Environmental Management Issues of Agro-based Industry 2.2.1 Definition of Agro-based Industry The agro-industry is based on agricultural and forestry production, and its purpose is to preserve and refine raw produce and to extract and concentrate the valuable constituents. The food industry constitutes the most important sector of the agro-industry (World Bank, 1986). Many agro-industries have developed from skilled manual production processes and accordingly can be carried out at varying technical levels. However, applies to small and medium-sized operations. The definition of small and medium-sized operations varies from country to country but a maximum of 100 employees can be taken as an upper limit. There are environmental briefs which focus specifically on a number of agro-industries; particularly large plants. Primary processing is basically most suited to small industrial operations, as technical input increases in line with processing complexity. 2.2.2 Impacts of Agro Processing Industry As the agro-industry will probably increase the demand for certain commodities, or alternatively push towards different forms of land use and farming, the following environmental impacts in the area of agricultural production should be mentioned: Problems relating to the direct expansion and intensification of resource usage include impairment of soil fertility, problems of soil losses and sedimentation, problems of desertification and irrigation problems (soil and water salination, fluctuating water table and water pollution), which in turn reduce resource productivity. The problems of fertility losses, desertification, and salination are generally greatest in countries where the population pressure on land is greatest. Here, agriculture expands most markedly in peripheral areas and marginal resources are utilized intensively (World Bank, 1986). The economic and social parameters in place and those required are key factors in the agro-industrial sector generally. The maintenance and promotion of subsistence production and agro-industrial activities without restricting subsistence are major maxim in this respect. Commodity processing gives rise to environmental impacts on the atmosphere (odors and dust emissions), water (quantity and wastewater), primary energy sources (mainly timber) and the soil.

10
• Environmental pollution from the major Agro-based Industry The following comments are confined to certain branches which have been in the greatest demand in recent years; Mills handling cereal crops; only dry milling is carried out in such plants, thus must be taken of noise and dust emissions which affect not only the specific operational area but also the area surrounding the mill. Surface water quality is impaired in cases where streams and rivers are used for waste disposal. Processing of starch sources and root crops; If the biologically polluted wastewater from washing and processing is discharged into surface water untreated, the result can be over fertilization, reduction in the oxygen content and a general destruction of water quality, changes in the micro flora and fauna. Processing of oil-bearing seeds and fruits; In small and medium-sized works, only pressing processes are used for oil extraction. This produces steam emissions and oil-laden wastewater. Processing of semi-luxury goods and spices; the operations having environmental relevance in the production are fermentation and waste disposal. The pollutants thereby produced can accumulate in the soil over long periods, damaging micro flora and fauna. The biologically polluted wastewater, if discharged untreated. 2.2.3 Situation and development of Agro-based Industry Farmers in many Asian countries, including Japan, Thailand, China, India, and the Philippines have been developing sustainable agriculture practices appropriate to their regions, often with the support of institutes such as the International Institute for Rural Reconstruction, Manila and the Food and Fertilizer Technology Center, Taipei. Often the “innovations” of sustainable farming are simply the relearning of traditional practices. A large scale field test in China in the late 1990s demonstrated that increasing the diversity of rice strains instead of growing only one strain as a monocrop, almost doubled productivity while eliminating most of destruction of crops by fungus and chemical inputs. In Thailand government policy is seeking to regain, through sustainable agriculture practices, the productivity lost to exhaustion of soil by industrialized farming on former forest land. On the demand side, the market for organically produced grains, fruit, and vegetables is growing rapidly in Europe, the US, and Japan and beginning to open in some developing countries. Organic produce sells at premium prices, and many leading supermarkets now feature organic sections. There is growing evidence of a trend toward sustainable agriculture driven by the need to conserve soil, water, and energy in food production and pulled by consumer demand for a healthful, non-polluted food supply (Lowe, 2001). • Thailand Thailand has rich natural resources consisting of tin, rubber, natural gas, tungsten, tantalum, timber, lead, fish, gypsum, lignite, and fluorite. Roughly 49 % of Thailand's labor force is employed in agriculture with rice as the country's most important crop and a major export in the world rice market. Other agricultural commodities produced in

11
significant amounts include fish and fishery products, tapioca, rubber, corn, and sugar, coconuts, soybeans. Exports of processed foods such as canned tuna, pineapples, and frozen shrimp are on the rise (WHO, 2004). Thailand's increasingly diversified manufacturing sector made the largest contribution to growth during the economic boom. Industries registering rapid increases in production included computers and electronics, garments and footwear, furniture, wood products, canned food, toys, plastic products, gems, and jewelry. High-technology products such as integrated circuits and parts, electrical appliances, and vehicles are now leading Thailand's strong growth in exports. Thailand’s top ten food exports in 1998 are shown following the Table 2.1 (Tanticharoen, 2000): Table 2.1 Thailand’s top ten food exports in 1998
Products Export Value (US$ millions)
Rice Canned fish Fresh chilled/frozen shrimps, prawns and lobsters Sugar Tapioca (cassava) products Chilled/frozen poultry cuts Prepared/preserved fruits in air-tight containers Fresh chilled/frozen cuttle fish, squids and octopus Prepared/processed foods for animal feeds Processed poultry
2.17 1.69 1.45 0.66 0.57 0.41 0.38 0.29 0.25 0.22
Total 8.09 Source: Tanticharoen, (2000) 2.3 Profile of the study area: Chachoengsao Province The province is in the Central region of Thailand and also has a short coast to the Gulf of Thailand. The area of province is 5,351 km2 and its rank is 41st with the number of population is 635,153. The west part of the province is the low river plain of the Bang Pa Kong River, which is used extensively for farming rice. To the east is more hilly terrain, with an average height of more than 100 m. above sea level. 2.3.1 General information Chachoengsao province is a land of agriculture, counting on the favorable of rain and soil. And it also is acquiescent to serve as a “Satellite Town” of Bangkok in numerous aspects-particularly as an administrative and residential nucleus (Chachoengsao Provincial, 1996). Because of it is not too remote from existing urban centers, make it intensive expanse of the province and proximity to the economic center of the country. For these reasons, Chachoengsao province is the one to represent the Rural Urban Fringe Area of Thailand. With yielding nearly 2 million tons of agricultural output annually and being vital recipient of farming produce, Chachoengsao entertains and intimate correlation between industry and agriculture. Even now, types of industries are still determined by agricultural yields. Recently, industrialization is being precipitated in accordance with the Government’s policies and the province advancing towards the economic stance. Through the rapid

12
expansion of industrial varieties, the center of transportation of product and service, and development of investment. Then the industries focus on the development of the economy more than the sustenance of the environment and its resource. 2.3.2 Pollution problems in the region and Chachoengsao Province Data on environmental problems in the Eastern region can be show in the table 2.2 revealed that pollution problems mostly complained were air and noise, water, and waste respectively. That most complaints were industrial factories, and most businesses complained were metal products, production of plant seeds or tubers such as grain milling, winnowing, grinding, flour production, peeling tubers and slicing them into round thin pieces or sticks, etc and plastic products such as production of tools, appliances, furnishings, or ornaments including parts of those products. In the Eastern Region, The water quality in 9 main rivers, (Bangpakong River, Prachinburi River, Nakornnayok River, Rayong River, Prasae River, Pangrad River, Chantaburi River, Weru River, and Trad River), has been monitored. Among all, Bangpakong River, Nakornnayok River, Rayong River, and Prasae River had deteriorated water quality condition. The main problem of water resources in the Eastern region was the contamination of Total Coliform Bacteria and Fecal Coliform Bacteria in crowded regions. In addition, seawater trespassing during the dry season was found at Bangpakong River up to Bangkanag Bridge in Bang Nam Priao District of Chachoengsao Province.
Table 2.2 Public Complaints on Pollution in the Eastern region of Thailand
Type
Province No. Odor Noise Dust/ Smoke
Wastewater Solid waste
Hazardous waste
Other Total
Chonburi Rayong Chachoengsao Phrachinburi Chantaburi Trat Sakaeo
18 17 12 8 2 0 0
12 9 9 3 0 0 0
4 2 2 2 0 0 0
6 6 5 1 1 0 0
4 11 3 2 1 0 0
1 0 0 1 0 0 0
1 0 1 5 0 0 0
0 0 1 1 0 0 0
28 28 21 15 2 0 0
Source: Public Complaints Information Center, PCD, (2004)
Chachoengsao province represented of the complex matrix of human and environmental factors that have influenced development in Thailand. Logging and agricultural settlement on the rolling uplands of east and north-east and Thailand have had major impacts on environmental quality in these regions. Therefore, too has the extensive cultivation of cash crops such as cassava. Low input cash-cropping on sandy upland soils has reduced the nutrient status of these soils and increased their susceptibility to erosion (Panyarachun, 1996). Environmental impacts of a new trend in aquaculture in rural Thailand, the conversion of rice farms in freshwater agricultural areas to saltwater ponds for farming shrimp. This has led to the conversion of thousands of hectares of agricultural land into shrimp ponds in Thailand's fertile Central Plains, often referred to as the country's 'Rice Bowl'. The rapid

13
expansion of inland shrimp farming has raised serious concerns about environmental impacts, such as salinization of neighboring agricultural land and increased conflict over scarce freshwater resources. 2.4 Key role of the Rural Urban Fringe area The rural-urban fringe is the boundary zone outside the urban area proper where rural and urban land uses intermix. It is an area of transition from agricultural and other rural land uses to urban use. Located well within the urban sphere of influence the fringe is characterized by a wide variety of land use including dormitory settlements housing middle-income commuters who work in the main urban area. Over time the characteristics of the fringe change from largely rural to largely urban. Suburbanization takes place at the urban boundary of rural-urban fringe (Nagle and Guinness, 2004). Urban development in Asia has dramatically changed in the last four decades. There has been a shift from primary sectors such as agriculture, fishing and mining to secondary and tertiary sectors through industrial growth and service provision accompanied by rapid economic development in many of the Asian developing countries (Douglas, 1995;). In developing countries the relationship between urbanization and industrialization is not always clear. As a result the impact of urban development and industrial development on natural environment is very visible. The vulnerability of the peri-urban region is more complicated by the fact that it includes a large number of individual authorities in term of local government and has both urban and rural characteristics. As no single authority is responsible for overall planning and management of a metropolis, an extended metropolitan area with mixed urban and rural characteristics is a complex and creates conflicts among the natural resources users of different sectors and government. 2.5 Policy Aspects This chapter covers the currents in policies that will enable to the Agro Eco-Industrial Network. Comprehensive lists of the policies are related to the national environment, industry and development agencies in the country. The prevailing policies, regulations and Industries driven by policies and market force are given following this. 2.5.1 Environmental policy The government of Thailand has recognized the following environmental issues and its policies and programs are geared towards addressing them: Air pollution, Water pollution, Traffic congestion, Noise pollution, Solid waste, Flooding, Hazardous waste, Deforestation, Landslides and Lack of institutions' capabilities (Thailand Health Profile, 2000). • Legal, Policy, and Institutional Structure Thailand has specific policies that are protective of health and environment (World Health Report, 2004). The three key policies are:
Policy and Prospective Plan for National Environmental Quality Enhancement and Protection 1997-2017

14
Environmental Quality Management Plan 1999-2006 National Environment Quality Enhancement and Protection Act 1992
The 9th National Economic and Social Development Plan (2002-2006) focused on the management system that based on shared responsibility, transparency and practicality. Knowledge and information shall be disseminated to people, community, and local administrative units, so that they can actively participate in protecting natural wealth. Environmental quality shall be improved in order to promote grassroots economies and quality of life. • Institutional Structure for Environmental Administrative / organizational set-up of the country: Ministry of Environment and Natural Resources, Ministry of Public Health, Ministry of Industry, Ministry of Agriculture and Cooperatives, Ministry of Interior and Ministry of Prime Minister. Relevant agencies and partners other than government: Foundation for Anti Air Pollution and Environmental Protection, Thai Environment and Community Development Association, Hill Area Development Foundation, Thailand Environment Foundation, Think Earth Association, Thailand Development Research Institute, Thailand Environment Institute. Relevant International Conventions and Agreements Ratified or Signed: International Tropical Timber Agreement 1997, Agreement on the Cooperation for the Sustainable Development of the Mekong River Basin 1995, Agreement for the Establishment of the Network Aquaculture Centers in Asia and the Pacific 1994, Biodiversity Convention at Rio de Janeiro on 12 June 1992, Montreal Protocol on Substances that deplete the ozone layer, Framework Convention on Climate Change 1995, ASEAN Agreement on the Conservation of Nature and Natural Resources, Kuala Lumpur 1985, International Plant Protection Convention 1978, Plant Protection Agreement for the Asia and Pacific Region 1956, and Agreement for the Establishment of the Asia Pacific Fishery Commission 1948 etc. 2.5.2 Industrial Policy • National Industrial Policy Thailand’s Ministry of Industry has set up its policy guidelines for 2001-2006 in according to the 9th National Economic and Social Development Plan with particular emphasis on the development of the Small and Medium Size Enterprises (TISC, 2006). Measure aimed at stimulating the grass-root industries in the near term include: initiating the “One Tambon, One Product (OTOP)” projects; speeding up the implementation of the Industrial Restructuring plan: Personnel development in modern production technology, environmental management, industrial safety and the adoption of international standards in both public and private sectors; and providing consulting services for industrial production cost reduction. The Department of Industrial Promotion (DIP, 2006) under the Ministry of Industry acts as the lead agency of government for SMEs promotion and development and follows the

15
guidelines are set by Ministry of Industry and the National Plan in elaborating its own policies to support the sector. The investment promotion policies of the past year, though successful, were implemented for a long period of time. The financial crisis in the middle of 1997 affected the Thai economy. As a result, tax collection was below target and public debts increased significantly affecting the fiscal position of the government. Moreover, the global economic climate and investment environment had undergone change. Therefore, the Board of Investment (BOI, 2006) had responsibility of the Thai Investment Promotion Polices and criteria for granting tax privileges in order to respond to the current and future economic and investment situation. 2.6 Economic Aspects These following sections present the situation of the National economy and its trend. The existing situation of the study area can be useful for significantly describing and development the Networks for Agro Industry. 2.6.1 General economy of the country Thailand was named one of the Asian Newly Industrialized Countries (NICs), before the economic crisis in 1997 with an average economic growth rate of 8-9 percent during 1993-95. The crisis resulted in a negative growth rate of –7.8 percent in 1998. Moreover, the impact of the economic recession in the world market has affected the country’s total exports. At this stage, it is crucial for Thailand to increase the technological capability of the country, to make efficient use of its resources, and to reduce the cost of production, thereby increasing economic growth and competitiveness. Despite the country’s industrialization, agriculture has remained a significant part of the economy. Thailand has been moving towards industrial-based agriculture and has focused on the development of post harvest and processing technologies that are the major problems for industry. The government promotion to develop agribusinesses since 1976 has greatly contributed to the expansion of agro processing. Thailand’s top 10 export products in 1997 and 1998 are rice, canned foods, rubber, frozen shrimp and prawn. Export earnings for the first nine months of 1998 were US$6 and US$3.9 billion for agricultural products and agro-industry products, respectively. Combined export earnings from agriculture accounted for 23 percent of total earnings (Department of Business Economics, 2006). 2.6.2 Provincial Economy Agricultural is prominent in the living of Chachoengsao, 70% of total population of province is farmer and Income from agriculture is 27,681 million Baht/year. The various revenue sources of Chacheongsao Province (2003) are shown in figure 2.5. The past decade saw drastic economic rises in Chachoengsao. The province has grown into a chief exporter of agricultural yields and dominant manufacturer of industrial products. The prospect of Chachoengsao as an economic linkage and trade gateway is promising. The Province is envisioned to merge Bangkok and its vicinities with the Eastern Seaboard, be developed into a transport center for agricultural and industrial outputs in the East of Thailand. The implementation of large scale transportation projects, e.g. The

16
Suvannaphum Airport and efficient mass transit systems. And the province lied in the midpoint, endorsing movements of manpower and economic expansion between the two developing ends.
Miscellaneous, 14,648 million
Baht
Trading and Whole sale,
8,381 million Baht
Public utility, 2,974 million Baht
Agriculture, 7,536 million Baht
Industry, 76,510 million
Baht
Figure 2.5 Revenue Sources of Chachoengsao Province 2.6.3 Economic project The Government formed the Committee on the Development of Thai Food and the Kitchen of the World, chaired by Commerce Minister. The National Food Institute of Thailand, a non-profit and independent network organization of the Ministry of Industry, and the Food Sector of the Federation of Thai Industries are playing an important role in promoting (PRD, 2006). Moreover, efforts are being made to increase Thai food exports by 20% each year. At present, Thailand earns about 500 billion baht from food exports annually. Thai food products depend on 85% of local content. So, the food industry is very important to the country’s economy. 2.7 Technical Aspects Eco-Industrial Parks/Networks are expected to improve both productivity and environmental performance. Then this section presents the improving of networking of industries for material and by product exchanges, reuse/recycling and cleaner production techniques. 2.7.1 Cluster Development in Thailand The Department of Industrial promotion (DIP) is one of core agencies in promoting SME development. Considered cluster formation as a mechanism to boost Thailand’s SME competition in the world market. The cluster project is proposed to build awareness of and participation in cluster development among Thai firms and build close linkages among companies in clusters to better coordination and trust. The formal linkages in clusters include networks, alliances, and partnership and project also aimed at developing mechanism for sustainable cluster. The example projects initiatives taken up by government are OTOP and Blue sky with bio-diesel.

17
2.7.2 Biomass Utilization The importance of wood/biomass fuel as an energy source for the rural areas in Thailand can not be overemphasized. It is still the cheapest fuel available and it will remain the major alternative to commercial energy sources. Many rural small-scale industries still depend on biomass-fuel for energy. It is the main source of energy of industries like agro-processing, food-processing, mineral-based industries, etc. Thus, wood energy will continue to be a major component of total energy consumption in Thailand (FAO, 1998). In order to be able to plan the biomass-fuel demand and supply effectively, as well as to promote awareness of biomass-fuel issues, appropriate information is necessary. This would highlight the socio-economic importance of these rural based industries with a view to contributing to refining and improving prevailing policies and strategies of the sectors concerned. 2.7.3 Bioconversion of carbohydrate residues in Thailand In the ASEAN region alone, for instance, it has been estimated that 30 million tons of rice grain are produced each year. Considering similarly large quantities of other commodities, such as cassava, maize, and sugar cane, tremendous resources of organic raw materials are potentially available for conversion into useful products - the common "F" products: food, fuel, fertilizer, and fiber (Sundhagul et al., 1983). Among many means of converting these wastes materials-mechanical, chemical, and biological-bioconversion (particularly microbiological) seems to be the most suitable for Thailand, and probably for other tropical developing countries as well. • Current Research and Development of Productive utilization of agricultural and
agro-industrial residues throughout the world International Recently, the US National Academy of Sciences convened a group of experts from different parts of the world with the objective of producing a document on the current status of utilization of organic waste materials to produce foods, fuel, and fertilizer. In December 1979, UNEP convened a meeting of policy makers and administrators on the subject of waste utilization as a follow up of the previous consultative meeting of experts on this subject. Regional An ASEAN regional co-operative project has recently been launched by the ASEAN Subcommittee on Protein aimed at better utilization of food crop wastes. The emphases are on converting food waste into acceptable food, followed by making them suitable for animal feed, and as potential alternative sources of energy. National Several research and development programs and projects are being carried out by universities and research institutions in Thailand. Those specifically involving are as; anaerobic digestion, microbial fertilizer, high rate bio-methanation, and biomass power generation. 2.8 Applying Industrial Ecology and Research need In most of the industrialized countries environmental protection and most preferred strategy is the pollution prevention. It has been defined as a top of environmental

18
management hierarchy. The concepts of pollution prevention and industrial ecology both claim similar roots. The two ideas also attempt to solve similar problems. Both concepts begin by assuming that current economic activity is increasingly harmful to the environment and conclude that changes are needed. Both concepts assert that the changes must begin with how people think between the environment and economic activity. But, when it comes to how to make the changes, pollution prevention and industrial ecology start to diverge, so much so that incompatibilities emerge. However, these differences are not so broad that there is not a reasonable potential for convergence. Then Oldenburg and Geiser (1997), identified and there are essential differences between industrial ecology and pollution prevention. Table 2.3 summarizes some of the similarities and differences between the two concepts. Table 2.3 Primary attributes of pollution prevention and industrial ecology
Issues Pollution Prevention Industrial Ecology
Primary goals Primary focus Core concept Primary techniques Role of recycling Role of government Economic domain Mode of evaluation
Prevent pollution Reduce risk Individual firm Planning process Life cycle assessment Process characterization Materials accounting Waste audits Full cost accounting Only in-process Technical assistance Multiple sectors Materials tracking
Optimize resource flows Promote sustainability Networks of firms Integrated system Life cycle assessment Materials accounting Design for environment In-process, off-site and between firms Barriers removal Industrial sector Materials tracking
If industrial ecology schemes are to be made compatible with pollution prevention programs, industrial ecology should de-emphasize the current concept of firms made interdependent by linking waste streams and input needs. This is only one tenet of an ecological system and a narrow one at that. Sound ecological systems also build the health of niche organisms through careful selection and avoidance behaviors. Instead of a narrow focus on waste recycling, industrial ecology schemes should incorporate risk reduction, target those parts of the economy that are most endangering, and assist in identifying and developing materials and technologies that fit comfortably into ecological cycles and support human and ecological health. Considered from this perspective pollution prevention programs that serve to ‘correct’ and tailor production systems could be seen as a powerful tool in an industrial ecologist’s instrument bag and industrial ecology could become a source of vision for the detailed operations of pollution prevention programs at the firm level. Eco-industrial parks (EIPs) provide a basis for applying the concept of industrial ecology. Roberts (2004) undertaken to investigate the application of industrial ecology to ensure more sustainable industry development in the State of Queensland. In Australia, eco-industrial parks are new and are being considered by state governments as a way of achieving more sustainable industrial development. However, for many firms, local

19
government and communities, industrial ecology is a concept that is misunderstood and treated with suspicion. Then, there was attempted to development a set of principles and planning guidelines for use by governments to facilitate the development of eco-industrial parks. The planning and development of this eco-industrial park was a significant challenge to the developer and public agencies concerned with this project. The case study presented provides useful lessons and advice for planners and developers involved with the planning and development of eco-industrial parks. For the Asian country, Deog-Seong et al. (2005) attempted to draw out transferable lessons for future Eco-Industrial Park (EIP) development by analyzing the Daedok Technovalley (DTV) Development Project, the first Korean attempt to design EIP by restructuring a conventional industrial estate development plan. DTV development plan’s progress towards sustainability through in-depth analysis of the planning and design strategies, and technologies adopted. The development could achieve a higher level of sustainability progress in most of the evaluation criteria when compared to conventional industrial estate development practices in Korea. However, some limitations are still apparent in the aspect of symbiotic industrial network construction, cultural identity creation and material flow planning. Despite recent efforts by a variety of industrial organizations to apply Industrial Ecology concepts to the management of materials produced by industries, several constraints to its widespread applications still exist. Among these constraints is the lack of easily implemental decision-making support systems that include significant externalities. In decision-making processes about materials management, recycling costs need to be compared with disposal costs. In some cases, it may be advantageous to provide the byproducts for use as raw materials outside the plant or industry that produce those (Inyang et al., 2003). Lack of enabling technology and regulatory support can pose significant constraints with respect to large-scale material substitution and recycling. Some factors that are needed for comprehensive analysis of materials and energy management options are still not easily quantifiable. For example, valuation of natural resources is an important issue on which research advances need to be made in order to expand the application of Industrial Ecology in materials management. Approaches, techniques and programs such as material and energy flow studies, environmental cost accounting, life-cycle inventory assessment and design (CLA), and design for environment, need to be better interlinked to provide an effective decision-making tool on material and process substitutions.

20
Chapter 3
Methodology
3.1 Introduction Agro industries, especially rice, cassava and livestock have been the main feeding source of the economy in the Chachoengsao Province. In the recent years, the industries have rapidly grown in such a way that they have been causing several significant environmental problems in the region. A transition of these industries into eco-industrial network is essential to preserve the natural resources of the region. The study focuses on the environmental management of these agro eco-industrial clusters by forming material flow linkages to other industries in industrial system so as to reduce resource consumption and waste generation. The study was carried out in Chachoengsao Province, Thailand. Currently, the industries have an unprompted development and imply a need for comprehensive planning. Therefore, this chapter presents the methodology of this study aims to develop an eco-industrial network which can benefit both environmental and economic development in the Province. 3.1.1 Study area This study was carried out in the districts of Bang Pakong, Ban Pho, Chachoengsao Muang, Bangnampreo and Bang Khla in the Chachoengsao Province. The primary focus of the study is the agro industrial clusters of the region, especially rice-based industry.
Source: Chachoengsao Provincial Operation Center, 2006
Figure 3.1 Administration Map of Chachoengsao Province
Phanom sarakha
mSanam
chaikhet
Thatakiap
Plaengyao
Ratchsan
Banpho
Khlongkhuean
Bangkhla
Muang
Bangnamprieo
Bangpakong

21
3.1.2 Methods Adopted for the Study The study method designed to with a view to develop the Eco-industrial network. Therefore, the appropriate data collection instruments need to be applied and suitable to the respondents and the research needs. Combinations of several standard methods were used, to realize the objectives set for the study. • Field Study Observation, is applied when the researcher observes an occurrence in the field situation. Interview, the questions (a structured or an unstructured manner) from researcher arks to the respondents and record their responses. Questionnaire, the participants are responded to the structure question sets, or through the communication as mail. These techniques were carried out to get acquainted with and collection of data on environmental problems and economic performance with special reference of rice-based industry problems. • Secondary Data Review The secondary data such as records, census, documents and indices are used for the analysis of scientific data and information on the existing actors and policies in rice-based industry. The data related with groups involved in rice-based industry was collected to check its reliability and also gather information for material flow network creation. 3.2 Research Methodology The nature of the study requires direct interactions with the enterprises for obtaining first hand information on the industry, understanding the production processes, technologies, waste generation, and treatment methods. In addition, information on the driving forces, such as actors and institutional, policy support market forces, trade and legal requirements for the formation of the network are also essential for a better understanding. In view of the above requirements of the research the following methodology was used in this study as outlined in Figure 3.2.

22
Figure 3.2 Research Methodology
Observation/survey
Local environments, Waste management of Industries, municipalities/province
Field Study and Data collection
Field Study (Primary data sources)
Secondary Data Sources
Interviews
Questionnaire
Production Process Flow and material balance Entrepreneur’s attitude
Government Officers Industrial Leaders Farmer/peasants
Environmental baseline, Socio-economic information, Industry lists, Actors and institutional Industrial/Environmental and related policies, standard, indices
Desk Review Propose SD Options
Conclusion and Recommendation
Material Flow Network
Problem Identification/ Study Objectives
Literature Review
Collected Data

23
3.2.1 Secondary Data Collection The study begins with the collection of required data from secondary sources such as the libraries, journals, feature articles, indigenous magazines, and publications from relevant government departments, NGOs, regional academic/research, institutes and business associations. Typical information was collected from these sources is shown in Figure 3.3:
Figure 3.3 Typical information collected from secondary source
3.2.2 Environmental Baseline In addition to the above, information on the following environmental aspects, particularly in the study area, were collected from several organizations so as to develop an environmental baseline. • The data were obtained from Provincial Profile and Statistical Reports of
Chachoengsao’s Governor Office: o Water resources, rainfall o Water quality, pollution loads and sources o Water consumption; both industrial and domestic o Wastewater generation and treatment; both industrial and domestic
• The data reports from Pollution Control Department (PCD) were contained of;
o Air quality from Regional Air Quality Report 2005
• Demography of the study area and Chachoengsao Province
• Socio-economic profile • Environmental and natural
resources in the region
• List of agro industries • List of Rice-based industry,
other industries and livestock farms that connected to agro processing of, which falling into its supply chain.
• Content of the relevant policies of the Rice-based industries and overview of relevant sector’s policies under the study
Sources
Provincial Strategy Planning Report and Statistical Reports of Chachoengsao’s Governor Office
Annual Report and Industrial Census of Provincial Industrial Office and Provincial Statistic Office
Document Reviewed for Rice mill from Department of Industrial Works, Pollution Control Department, Department of Health
Typical collected data

24
o Sources of air pollution from Summary of State of Thailand's Pollution in Year 2005
o Solid waste generation; both industrial and municipal, and o Solid waste management practices; both industrial and municipal from
Regional solid waste survey report 2005, Municipalities and Provincial Sanitary Office.
• The data of Land use, forest cover, sources of land degradation were collected from the Report of Environmental and Natural Resource Evaluation and Monitoring in Eastern Coastal Area (Phase II), under Office of Natural Resource and Environmental Policy and Planning (ONEP).
• Any other location specific environmental problems as observed during the field survey.
3.3 Field Study The field study focused on obtaining the physical and technological of the industry and locality specific information. Interviews and interactions with the entrepreneurs and communities aimed at local development are absolutely essential for getting reliable information. In addition, municipalities and local offices of government departments provide valuable information on the region. Thus, the field study was an opportunity to obtain location specific information. 3.3.1 Collecting data on agro industry from the local administration The information was collected by interviews and interaction with the officials of local government departments. The main organization directly related to the industrial development is Ministry of Industry and its Provincial Department of Local (Chachoengsao Provincial Industrial Office, 2006). The type of information each level obtained from the relevant departments such Provincial Environmental and Natural Resource Office, Provincial Livestock Office and the study focused to see how the actors and policies can push the existing industrial system of agro-industry in Chachoengsao Province towards an eco-industrial network. For this study, information on the following was collected at the Regional and local level.
• Information on socio-economic profile of the region • Contribution of industries to local development • Share of the industries in the national market • Data on export/import trade activities
Whereas, in the case of policy documents, those that are implemented or awaiting implementation were collected irrespective of their origin, Ministry, Province, District and Sub-district (Tambon). Thus, the following policies were collected for analysis.
• Industrial Policy • Environmental Protection • Social Development Policies • Technology Transfer • Policy on agriculture, aquaculture, livestock etc • Export/Import, Business and Trade Promotions portfolios,
25
• Marketing facilities, Infrastructure Development and Conflict Resolution • Energy Policy
3.3.2 Designed Questionnaire and Size Selection of Typical Enterprises The rice mills in 5 districts were selected to the field study and use the structure manner for interviewed. The selected rice mills were distributed in the size of industry and also the mixing of the 4 groups of product; Sticky rice, Hom mali rice, White rice, and Parboiled rice. Then, the other rice-base industries in supply chain were selected to survey in order to fulfill the linkages and network. The list of surveyed industries is showed following this:
• 8 Rice Mills in Muang, Bangnamprieo, Bangpakong, and Banpho • 2 Rice Noodle industries, which used Broken Rice (Product of Rice mill) • 1 Rice Bran Oil Extraction Industry • 1 Small Power Plant (Biomass from rice husk and wood chips) • 1 Solid Waste Recycling Firm • 1 Animal feed industry • 4 Livestock Farms
The questionnaire was designed to gather the information from Rice mill and the other industries in the supply chain, which following the including sections:
• General Information of Enterprise • Production process and flow data • Waste generation and waste management • Perspectives and comments of the entrepreneur on the relevant actors and policies
3.3.3 Interview with the entrepreneurs The fundamental premise of interviews with entrepreneurs is to obtain industry specific information on the environment and technological framework. The objective of this is to establish a material balance to ascertain the environmental performance of the industry with respect to resource use/conservation, practices and techniques, skill level of employees etc. In essence, the following data were collected to evaluate the environmental performance:
• Types and amount of materials i.e. raw materials, product, by product • Production Process • Energy consumption • Water consumption • Packaging and transportation of products and by products • Wastewater and solid waste; generation and treatment • Technology use and needs assessment • Occupation health and safety aspects
Developing a basic mass balance of material and energy within the process, as in the case of rice mill industry (Parboiled Mill) is shown in example below, Figure 3.4 aids in the process of evaluating the environmental performance of the industry.

26
Figure 3.4 Example of Material Balance in a Rice Mill Processing In this example, quantification of all raw materials, products, non-products are essential to evaluate the environmental performance of the industry. Appropriate data to establish such a material balance was collected. The efficiency of the process can be resulted when the material balance is complete. The energy process is also considered and evaluated in order to rate the performance of the process. The waste stream and by-products are also identified in this stage. The by-products and wastes are analyzed and make it marketable with alternative treatments. 3.3.4 Evaluation of financial performance of the industry In the course of the study, it is proposed that the financial status of the industries also be evaluated. This is done to understand the financial performance of the industry in terms of raw materials, energy costs, waste treatment and disposal costs, value of products and by products. This process aids in comparing the financial baseline of the industry with that after applying by-products and waste exchanges. 3.3.5 Comprehend the perspectives of entrepreneurs on the relevant policies The collected data of the typical surveyed industries such Rice-mill and the connected of rice-based industries were formed in the questionnaire and interviewed from the field study. Because legal systems reflect the desire of society so we need to investigate from many point of views about what they expect on policy and policy-maker are developed a more effective and stringent policy base. Understanding the perspective of manufactures on the relevant policy are helped policy-maker having suitable decision and reforming the policy in order to create better management work. 3.4 Material Flow Network Creation The Formation of Material Flow Network is a key component of the study as it helps to draw strategic inferences about potential material, product, by product and waste exchanges focused at closing the material cycle. A sustainable supply chain with a closed material loop, results in improved environmental and economic performance in addition to augmenting the product quality.
Parboiled Processing
Electricity
Rice
Water
Rice Product
Non-products
Wastewater
Bran, Husk, Ash, Dust
27
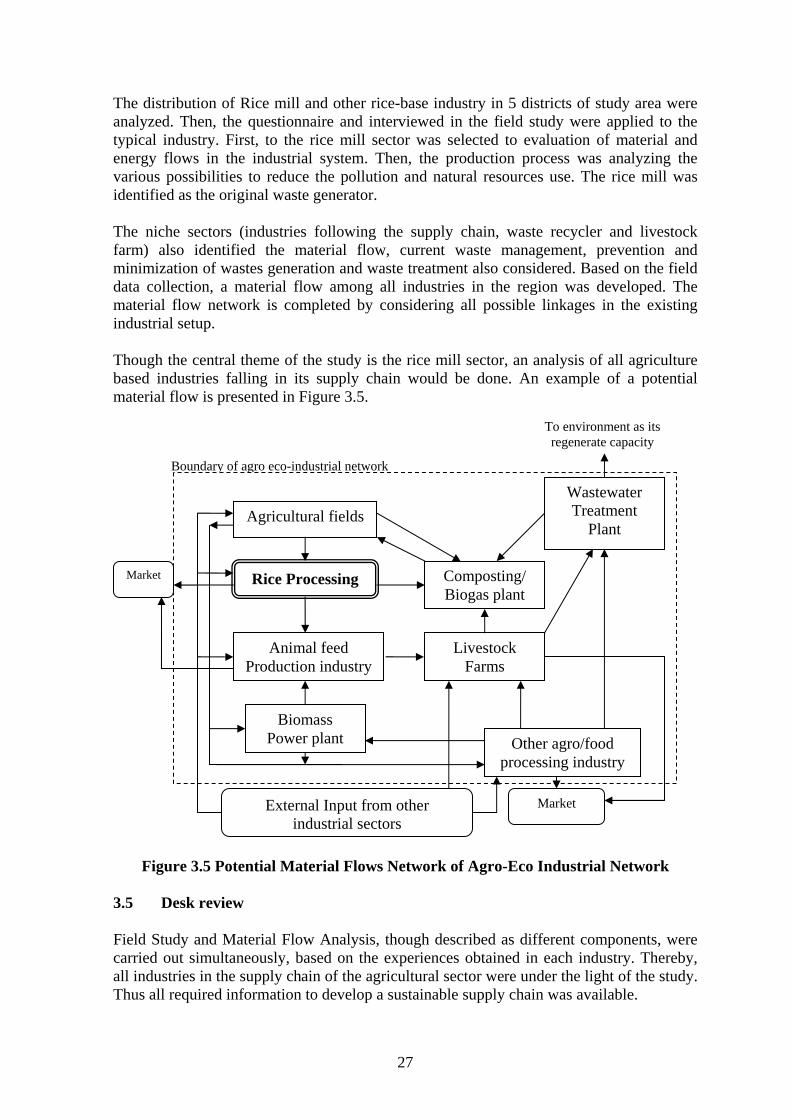
The distribution of Rice mill and other rice-base industry in 5 districts of study area were analyzed. Then, the questionnaire and interviewed in the field study were applied to the typical industry. First, to the rice mill sector was selected to evaluation of material and energy flows in the industrial system. Then, the production process was analyzing the various possibilities to reduce the pollution and natural resources use. The rice mill was identified as the original waste generator. The niche sectors (industries following the supply chain, waste recycler and livestock farm) also identified the material flow, current waste management, prevention and minimization of wastes generation and waste treatment also considered. Based on the field data collection, a material flow among all industries in the region was developed. The material flow network is completed by considering all possible linkages in the existing industrial setup. Though the central theme of the study is the rice mill sector, an analysis of all agriculture based industries falling in its supply chain would be done. An example of a potential material flow is presented in Figure 3.5.
Figure 3.5 Potential Material Flows Network of Agro-Eco Industrial Network
3.5 Desk review Field Study and Material Flow Analysis, though described as different components, were carried out simultaneously, based on the experiences obtained in each industry. Thereby, all industries in the supply chain of the agricultural sector were under the light of the study. Thus all required information to develop a sustainable supply chain was available.
Wastewater Treatment
Plant
Rice Processing
Agricultural fields
Animal feed Production industry
Composting/ Biogas plant
Livestock Farms
Other agro/food processing industry
Biomass Power plant
Market External Input from other industrial sectors
Market
To environment as its regenerate capacity
Boundary of agro eco-industrial network

28
The desk review performed considering technological and environmental aspects of agro eco-industrial network, policy networks, and socio-economic networks in the region of the study. 3.5.1 Technology and Environmental aspects From the Field Study and Material Flow Analysis a broader picture of the material cycle in the region could be obtained. This thoroughly analyzed to identify potential sources of discarded waste. In addition to this, where material exchanges take place the strength of the linkage was evaluated in terms of quantity and quality of material exchanges. Options of strengthening these links could be explored in addition to establishing new links. Technological plays a major role to strengthen the existing link or establish new links. The prevailing technology in the industries is compared with the recent ones and options of introducing new technologies are suggested. In addition to suggesting new technologies, application of simple Cleaner Production concepts also suggested to improve productivity, product quality and profitability. 3.5.2 Policy Analysis This task implemented after all data are collected which need to analyzed. Following the objective of the thesis the policies were analyzed and base on the current condition of the province to suggest an effective management system. So the present related policies were understood all of its envisaged aspects and its effect on the industry in order to find out the several conditions for applying those policies on agro industry not only on the government role but also on the industry. The study the policy networks which are related with the eco-industry networking were done following steps mentioned below;
• Identify the relevant actors and institutions, which determine industrial and environmental policy, reviewed from the reports; 1) Survey and study for an establishment of Nuisance Standard from Rice Mill Factories, and 2) Summary report of industrial sector codes of practice for cleaner technology.
• Identify and group all policies applicable to the major industrial sectors under the material flow network.
• Understand the objectives of the policy; mainly of Industrial Policy and Environmental Protection Policy
• List the industrial sectors to which the policy is applicable • Tabulate the factors of the policy which favor/ hamper the growth of the target
sectors • Mapping the favoring/hampering aspects of the policies cutting across sector
boundaries of all industries in the supply chain The key source of roles, actors, and policies were used in policy analysis of industrial development. The majority of them were collected from Ministry of Industry and its supervised organizations; Department of Industrial Works, Office of Industrial Economics, Board of Investment, SMEs. Policies of each industry based on its properties were analyzed. Such as Joint Venture Company and self employed company; large scale companies and the small and medium size of company. The economic loans policies for each type of industry also are different.

29
The priorities of local and national policies on development of agro based industries also examined and analyzed. 3.5.3 Commonalities and conflicting condition between and within policies The commonalities and the conflicts of policies between the government levels or offices were identified and analyzed such Ministry of Industry, Ministry of Natural Resource and Environment, Ministry of Agriculture and Cooperatives. Thus the gaps in policies and missing aspects also identified. From this analyzed result, the study suggested some solutions to overcome these problems and filling the missing aspects of the related policies for better management and sustainable development. The result of this task is suggested some measures that aims using policy tool to develop an eco-industrial network in the province and effective management system which is suitable with the long term and short term economic–environment development of both national and regional strategies. Given that eco-industrial network are a means of parallel environmental and economic development, and possibilities of material flows and inter-firm networks exist, the study also attempted to identify environmental, social, technical, and policy barriers to their existence.

30
Chapter 4
Results and Discussion 4.1 Situation of Chachoengsao Province 4.1.1 Topography and Physical Setting The area of Chachoengsao Province is 5,351 km2, engrossing the second biggest area of Eastern Thailand next only to Chanthaburi Province. It reaches Nakhon Nayok and Prachinburi in the North, Chonburi and Chantaburi Province in the South, Bangkok Metropolis, Samutprakarn and Pathumthani in the West. The terrain of Chachoengsao is predominantly wet, with corrugated plains, highlands and low hills recurring alternately. There are abundant flatland for cultivation, and at the eastern of province along the ridge is covered by forests with a number of rare and endangered species are found. The Bangpakong River, considered as the vein of Chachoengsao Province passing through the region enriching it with fertile soil before moving seaward into the Gulf of Thailand. The River, flows into the sea at the estuary of Bangpakong district, which has a coast of 12 km. long hold by rich mangrove forests. In close proximity to the sea, the city is influenced by land and sea breezes, and moistened by northeast and southwest monsoons, which carry with them seasonal rainfall and hence fertility. 4.1.2 Meteorology The Eastern region of the gulf of Thailand is influenced by seasonal monsoon winds such as the South-west monsoon, North-east monsoon and occasional cyclones. Time series data on the rainfall of the region is presented in Figure 4.2. The South-West monsoon brings rain through out this region from May to October. In addition to this, tropical cyclones, low pressure depressions, tropical storms and typhoons bring in heavy rain during the month of October. The North-East monsoon brings with it cold and drought weather from China from November to February. However, this region has a less cold weather than the North-east region of Thailand because the landscape of the Sankhampang and Phanomdongrak Mountain and the province’s proximity to the sea.
Figure 4.1 Key Map of Chachoengsao

31
020406080
100120140160180200
Janua
ry
Febu
aryM
arch
April
May Ju
ne July
Augus
t
Septe
mber
Octobe
r
Novem
ber
Decem
ber
Rai
nfal
l,mm
Source: Provincial Statistical Report (2005)
Figure 4.2 Meteorology of the Chachoengsao Province 4.1.3 Administration The province is subdivided into 10 districts and 1 minor-district, 93 sub-districts, 870 villages, 22 municipalities with one provincial administrative organization and 91 district administrative organizations. Figure 4.3 presents the administrative map of the Province. Table 4.1 presents the demography of the various districts. The districts of Chachoengsao are:
1. Mueang Chachoengsao 2. Bang Khla 3. Bang Nam Priao 4. Bang Pakong 5. Ban Pho 6. Phanom Sarakham 7. Ratchasan 8. Sanam Chai Khet 9. Plaeng Yao 10. Tha Takiap 11. Khlong Khuean
4.1.4 Population It could be observed from Figure 4.4 that the population growth in the recent years (2003 and 2004) has followed a negative trend, meaning that the population has decreased. In a developing country like Thailand, especially in rural areas, population always tend to increase. Decreasing population trends are subject to thought with two possible reasons either the spread of epidemics or population migration. No serious life-threatening epidemic has been reported in the region during the recent years and hence it could be concluded that migration of the population to other parts of the province (or country) in search of employment opportunities and other amenities is the foremost reason for the decrease in population.
Figure 4.3 Administrative Map

32
Table 4.1 Demography of the region
Population Change in population (%) District
2001 2002 2003 2004 2001 2002 2003 2004
Population density
(per km2) Mueang Chachoengsao 144,085 145,239 145,181 140,908 0.67 0.79 -0.04 -3.03 372
Bangkhla 46,809 47,029 46,837 45,199 0.88 0.47 -0.41 -3.62 198
Bang Nam Prieo 81,537 81,844 81,730 80,699 0.46 0.38 -0.14 -1.28 162
Bang Pakong 79,082 79,821 80,211 78,415 0.17 0.93 0.49 -2.24 304
Ban Pho 46,115 46,550 46,984 47,891 0.93 0.94 0.92 1.89 220
Phanom Sarakham 76,080 76,862 77,505 77,542 0.49 1.02 0.83 0.05 141
Ratchasan 12,475 12,547 12,518 12,363 0 0.58 -0.23 -1.25 92
Sanam Chai Khet 69,403 69,798 70,252 68,818 1.06 0.57 0.65 -2.08 41
Plaeng Yao 35,373 35,943 36,390 35,974 0.73 1.59 1.23 -1.16 152
Tha Takiap 39,527 40,590 41,357 42,008 1.7 2.62 1.85 1.55 40
Khlong Khuean 13,510 13,535 13,536 13,615 -0.89 0.18 0.01 0.58 107
Total 643,996 649,758 652,501 643,432 0.66 0.89 0.42 -1.41 120
Source: Chachoengsao Provincial Administration Office (2005)
‐4 ‐3 ‐2 ‐1 0 1 2 3
Mueang Chachoengsao
Bangkhla
Bang Nam Priao
Bang Pakong
Ban Pho
Phanom Sarakham
Ratchasan
Sanam Chai Khet
Plaeng Yao
Tha Takiap
Khlong Khuean
2001 2002
2003 2004
Figure 4.4 Yearly population growth rates in Chachoengsao Province

33
4.1.5 Infrastructure • Transportation Chachoengsao Province is situated beside the Bangkok, the center of economy of the country. The Province is important as the entrance to the Eastern Seaboard, which will be the focus of new development. Therefore, this region has completed facilities-services and infrastructure projects to support the part of development. Moreover, the efficiently of communication networks are also makes the region quite accessible and convenient.
Motorized transportation:
The province has developed several route of motorized transportation to serve the mega project development in the region as the central of transport and logistic. Several roads are connecting the region to Bangkok and its vicinity area such motor way (eastern outer ring) by pass the metropolis by mostly transporters from North and North-east region of Thailand. Highway number 304, 3, 34, 315, 23 and sub-highway are the major routes from Bangkok to the Eastern region and major port of country such Map tha put industrial estate and Laem Chabang Port.
Rail Transportation:
The railway passes Chachoengsao Province connecting other destinations with 4 pathways: Chachoengsao-Bangkok, Chachoengsao-Arunyaprated (Srakaew Province), Chachoengsao-Kangkoi (Nakhonratchasima Province), and Chachoengsao-Map Ta Put (Rayong Province) by dividing into Laem Chabang, Sattaheap Port, and Map Ta Put Industrial Estate. This railway from Eastern region is important for transportation of goods and petroleum products. The railway effectively transports these supplies to other regions. The major products such as LPG, Cement powder, sugar, gravel, sand etc.
Waterway Transportation:
Bangpakong River is the major waterway and is the main mean of local communication and transportation of agricultural products to the river mouth for oversea transportation. The River supports in transportation to oversea by two mega-projects of wharf, which are Laem Chabang (Chonburi Province) and Map Ta Put (Rayong Province). More over, the local communication between Chachoengsao, Samutprakarn, and Bangkok becomes far more easy. The major branches such as Sansab, Sumrong, Tha Khai, Bang Khanag and Pravetburirom Canals are used for local people since long. • Water supply production and distribution The Provincial Office of Water Supply operates through 4 offices under Chachoengsao area as following: Chachoengsao Waterworks Office, Bangpakong Waterworks Office, Bangkhla Waterworks Office, and Phanom Sarakham Waterworks Office. The total no of consumers is 46,000 in the water supply accessed area and most of them are located in the municipality areas. The total water production capacity is 23 million m3; with the percentage of water loss is about 13.30. Water is supplied in 19 municipal areas and 27 Sub-district Administration areas, so supplied totally area about 460 km2.

34
• Electricity and energy supply In the year 2005, Chachoengsao Province has 14 electricity service office and 12 main power stations. Total consumption of Province is 2,600 GWh supplied to 201,400 consumers with the entirely supply to the whole 883 villages in the Province. The highest electricity consumer is business and industrial sector by 85%, and the second is residential about 12% and others 3%, as shown in Figure 4.5.
Residential 12%Others 3%
Business and Industry
85%
Source: Chachoengsao Provincial Electricity Authority (2006)
Figure 4.5 Electricity Sales by Type of Consumers and Districts Three high consumption areas are Muang with 43,000 consumers, Bangpakong with 23,000 consumers, and Phanomsarakham District with 20,000 consumers, with a consumption of approximately 560 GWh, 1,000 GWh, and 128 GWh of electricity respectively. The development of industries and enterprises in Bangpakong consumed high electricity for their production. PEA, the organization was responsible for generating and selling electrical power in the provincial area of the state (MEA: Bangkok, Nonthaburi, Samutprakarn). PEA regulates the electricity rates and the collection of the fees. 4.1.6 Provincial economy development • Gross Provincial Product (GPP) Gross Provincial Product of the Chachoengsao Province is about 110,149 million Baht. The GPP ranking is in the 10th of Central region and the 12th of in the whole country. The economic growth rate has been estimated at 4.17% in 2004. In the year 2003, Average population income of Chachoengsao Province is 91,363 Baht/capita/year and the ranking is in the 3rd of Central region and the 9th of the whole country. The GPP of agricultural sector is 7,800 million Baht, while the non-agriculture sector is 87,000 million Baht with the three highest rank of GPP is from the manufacturing 64,000 million Baht, wholesale and retail trading 6,000 million Baht, and transportation service 3,000 million Baht. The information clearly indicates the role played by the agricultural sector in the region. The manufacturing sector contributes to a higher degree in the economy of the region, by

35
good worth of the nature of the products which have more market value. The agriculture stands second only to the manufacturing sector. • Agriculture The topography of the region is such that well irrigated plain lands of Muang Chachoengsao, Bangkhla, Bang Namprieo, Banpho and Bangpakong district are used for paddy cultivation, plantations and animal raising while the undulated lands of Phanomsarakham and Plaengyao district support for farm plantations and ranches. Presently, the cultivation land exceeds 60% of the whole province, half of which is rice. Due to the efficient irrigation, Chachoengsao’s paddy fields are productive, supporting 5 harvests within 2 years. Others economic crops are tapioca, mango, betel nut, coconut, sugar cane, maize, rubber, cashew nut, pineapple and eucalyptus. Chachoengsao gives best yields of mangoes; especially in Bangkhla district and tapioca here make the 2nd highest output of the whole country. Coconuts and betel nuts are mostly produced in Muang and Bangkhla district. The Figure 4.6 is shown the percentage of each cultivation and comparing the land use changed.
Year 1993
Rice58.7%
Permanent crop
10.2%Para Rubber
1.0%Vegetables,
herbs0.5%
Others4.5%
Field crop22.3%
Forest (planted)
2.3%Pasture0.5%
Year 2003
Rice43.3%
Permanent crop8.6%
Para Rubber3.3%
Fresh water culture14.7%
Vegetables, herbs0.8%
Others4.3%
Field crop21.6%
Planted Forest 2.1%
Pasture0.2%
Pen1.0%
Figure 4.6 Agricultural land use of the Province between 1993 and 2003

36
The agricultural land has changed from 1993 to 2003, the rice field are reduced due to the promotion of aquaculture, such as shrimp farming, fresh and brackish water fish farming. However, the rice yield can be increased by using technology, fertilizer, and adaptation of farmers. Though agricultural system of the Province has improved regularly, the local farmer faces a number of problems. The area of province is situated beside the shore and the estuary of Bangpakong River to the Thai Bay. First problem is the salinity of Bangpakong River because the water intrusion during November-June. The Second problem is flooding in the rainy season of Bangpakong River Basin areas around September to October every year. However, technological adaptation can solve these issues. • Livestock Livestock and domestic animals such as cattle, buffalo, swine, duck, chicken, etc. in the province are abundantly used for consumption and other farming use Recently, livestock is the second major occupation in the region follows the agriculture and the farmers always couple it with the agriculture. Because of some advantage such as close proximity of the market and easy access to the sources of feeding livestock raising has seen a good growth. The number of swine mostly farmed in Bangkhla district, and chicken mostly presented in Phanomsarakham and Bangkha. Total animal numbers of the Province are 667,000 swine, 9 million chickens, 4,000 ducts, and 37,000 cattle along the districts as showed in Figure 4.7. • Aquaculture The Province has both fresh water and brine water aquaculture due to the geological favors. That is Bangpakong River and canals are the major sources of fresh water. The brine water aquaculture is settled in Muang, Banpho and Bangpakong districts and mostly is shrimp farm. In addition, fishery is practiced along the seaside and estuary of Bangpakong.
0
500
1,000
1,500
2,000
2,500
3,0001,000 animals
Mua
ng
Bangk
hla
Bang N
am Pr
ieo
Bang P
akon
g
Ban Pho
Plaeng
Yao
Phano
m Sarakh
am
Ratcha
san
Sanam
Cha
i Khe
t
Tha Tak
iap
Khlong
Khu
ean
District
Chicken Swine Duck
Source: Chachoengsao Provincial Livestock Office, (2006)
Figure 4.7 Number of livestock by district in Chachoengsao Province

37
• Industry In the year 2006, Chachoengsao Province has total 1,300 (exclude the industries in industrial estate) industries with a total investment of 162,000 Million Baht employing 93,600 people. The Province also has 2 industrial estates with about 193 industries with an investment of around 133,000 Million Baht generating 38,540 employments. The number of major industrial establishment, capital and employee are shown in Table 4.2. The numbers of employment and capital values are high in the modern type of industrial production process and hi-technology. Although, the agro and food industries performed the major part and its most number of entrepreneurs in the province. Table 4.2 Number of 8 Majors Industrial establishment, capital and employees
Type of industries Number of
industrial establishments
Capital (Million Baht)
Number of employees
Agro-industry 200 3,722 3,400Food industry 108 4,432 4,371Chemical products 41 1,878 1,066Plastic products 94 6,720 8,730Metallic products 163 7,525 7,974Machinery 71 26,141 2,578Electric devices and appliances 58 15,095 15,546Automobile products 104 24,695 11,616Remark: The data exclude the industry of industrial estate
Source: Chachoengsao Provincial Industrial Office (2006) Recently, the number of industrial establishment in the Province has increasing sharply. Number of new industries in 2002 is about 83, in 2003 about 105, in 2004 about 125 and in 2005 about 164 industries. The increasing rate is 25.3% in comparison to the 5-10 years ago. Agro-industry is ranked 1st (about 200 industries), metal production industries are the second highest category with about 163 industries, and food industry is the third (about 108 industries) and 4th is automobile and transport production (104 industries). The industrial areas are distributed to several districts in the Province. However, the crowded areas are Muang, Bangpakong, Phanomsarakham, and Banpho districts. These districts are attracted because the investors interest in the location of market and raw material source. The transportation accessibility and near by the Suvanbhumi Airport where is the large transfer station of goods and products. Considering the investment cost of industrial establishment, the Province categorized the industries with high potential development following this: Electronics industry, Electric devices production, Automobile and compartment manufacture, Plastic production, Furniture from wood production, Metal and steel production, Concrete and Cement, Chemical product, Food and agro-industry, and Wearing apparel. Chacheongsao Province has 2 industrial estates, 2 industrial enterprise areas, and 1 industrial park:

38
Industrial Estate:
1) Well grow Industrial Estate: It is situated in Bangpakong district has totally about 153 industries. The major sectors are electric appliance, electronic devices, automobile parts, paint products, instant foods, stainless kitchen utensil etc.
2) Gateway City Industrial Estate: It is situated in Plaeng Yao district. About 40 industries are operated. The major productions are electronic devices, automobile parts, paint products, instant foods, stainless kitchen utensil etc.
Industrial enterprise area: 1) Alfa Techno-Polis is situated in Muang district, has 1 industry operation.
2) Sunyo is in Muang district with 4 electricity appliance industries.
Industrial park: 304 Industrial Park is situated at Phanomsarakham district The Province has promoted for the investment following these sectors;
1) Agro-industry and agricultural products 2) Technology and human development enterprises 3) Infrastructure and common facilities enterprises i.e. transportation, water
supply, power production 4) Environmental prevention enterprises i.e. green-industrial estate, wastewater
treatment company, solid waste management company 5) Target industrial sector which using high-technology i.e. foundry of steel and
induction furnace, machinery production, automobile parts assembly, electronic devices production and software, warehouse.
The Organizations promote the industrial sector development are following this; 1) Chachoengsao Governor 2) Chachoengsao Provincial Industrial Office 3) Chachoengsao Provincial Commercial Office 4) Chachoengsao Provincial Public Relation Office 5) Chachoengsao Provincial Urban Planning Office 6) Chachoengsao Local Administration Promotion Group 7) Chachoengsao Federation of Thai Industry Office 8) Chachoengsao Chamber of Commerce 9) Chachoengsao Commercial Bank Association 11) Plaeng Yao Industrial Estate Authority of Thailand 12) Chachoengsao Provincial Administration Office
4.1.7 Social, public health and sanitation • Public health and disease In the year 2004, the provincial birth rate is 12.42 per 1,000 capita and death rate is 6.49 per 1,000 capita. Since 2001, the birth rate has decreased and death rate has increased. The natural of population growing rate is about 0.59% which it also has decreasing trend.

39
0 50 100 150 200 250 300
Others
Cancer
Accident and poisonings
Suicide, homicide
Heart diseases
Tuberculosis
Respiratory diseases
Hypertension
Liver and pancreas diseases
Kidney disease
Rate per 100,000 capitaMale Female
Source: Chachoengsao Provincial Statistical Office, 2005
Figure 4.8 Disease prevalence in Chachoengsao Province From the Figure 4.8, the first recognized prevalence rank is the accident and poisoning is high in males. This may be related to occupational health and safety of man worker having the risk of poisoning and accident. These causes vary from car accidents, accident in working places and industries. The remaining are of chronic disease, such cancers, heart disease and respiratory issues related to environment degradation and poor air quality. 4.1.8 Natural resources and environmental issues • Surface Water Sources The Bangpakong River flowing across a distance of 122 km is the main source for about 10 districts of Chachoengsao Province, including six districts of Chonburi Province, one district of Prachinburi Province and one district of Saraburi Province. The Bangpakong River Basin is divided into 4 sub-basins as Bangpakong River, Nakhonnayok River, Klong-Thalad and Klong-Luang. On an average, about 5,700 million m3 flows in the river every year. About 1,800 million m3 of water from the river is used for domestic consumption, agriculture and industrial purposes. Water source from swamps/reservoirs are 167 of which 166 are used in dry season. About 9 springs provide water even in the dry season. About 180 lakes and ponds also act as local water sources. • Water Quality Issues Bangpakong river water quality is periodically monitored and has been categorized under Class 3 and 4 of the standards as shown in Appendix (Class 3: This type of water can be used for agriculture and domestic consumption, but needs to be treated before using, Class 4: Not appropriate for consumption unless other sources are available. However, adequate treatment and quality control is required before supply). Bangpakong River has a Dissolved Oxygen of 2.4-3.5 mg/L. Such water resources are categorized as Class-4.

40
Biochemical Oxygen Demand (BOD) fall in the class 4 standard except in Bangkla and Bangnamprieo district which are in Class 3 which (<1.0-1.9 mg/l) and the Fecal Coliform Bacteria (FCB) contamination was between 40-2,400 MPN/100 ml which falls under class 3. Lead Concentration (Heavy Metal) has been reported higher than the water quality standards at Banpho district and Muang district with 0.059 and 0.089 mg/L. Moreover, Bangpakong River faces sea water intrusion in the dry season, especially in the months of February to June when the Bangpakong river basin needs high amount of water for domestic, industry and agriculture purposes. • Water demand A study performed by the Kasetsart University for the Eastern Region Water Resources Management and Development, estimates a requirement of about 125 million m3 for domestic consumption alone by 2006. This water required is compared with the other purpose used about 170 million m3/year or 73% of the total water requirement in the area, the water crisis are showed in the Table 4.3. Table 4.3 Water demand in the Province
Bangpakong River Basin Problem areas (Districts) Bangnampreo, Chachoengsao Muang, Banpho,
Bangpakong, Plangyao and Klongkaeon subdistrict River volume 2,290 million m3 Water consumption
1996 2006
1,028 million m3 1,057 million m3
Water supply capacity 848 million m3 Additional quantity needed
1996 2006
179 million m3 208 million m3
Source: NESDB and Department of irrigation (1999)
Industrial use In the recent years water consumption has increased due to the rapid growth of industries. Demand projections indicate a requirement of about 50 million m3 in 2006 and 70 million m3 in 2016 (Kasetsart University, 1999) for the Province.
Tourism use
Thailand is known for its tourism which has obviously resulted in an increased demand for water. Hotels, restaurants, recreation, cultural and heritage centers alone are estimated to consume about 1 million m3 of water in 2006 while in 2016 it is projected at 2 million m3.
Agriculture use
Water consumption for agriculture has increased to 387 million m3 in the 2004. Of the total water demand rice cultivation constitutes a huge 42% while permanent crops consume 29%, field crop 24%, aquaculture 4% and others 1%.

41
• Ground water source The quality and quantity of ground water is different in each area and are subject to several factors such as meteorology, geology and hydrogeology. Multiple aquifers are more common in the Chachoengsao province especially in Bangnamprieo, Klongkhaun, Ratchasarn, Bangkla, Muang, Banpho and Bangpakong. This aquifer has low capacity to carry water at less than 0.07 m3 per minute. There are found in Phanomsarakham, Sanamchaiket and Plangyao. Groundwater levels change following the seasons. Though not steady an average of change of not more than 2-3 m has been observed. • Bangpakong Irrigation Dam (Bangpakong Barrage) The Dam was constructed in 1996 and is situated at Banpaisawek, Bangkeaw district, Chachoengsao Muang. The reservoir is about 70 km upstream of the estuary and has a capacity of 30 million m3. This project from the government was aimed at solving the problem of sea water intrusion into the river and to store for water consumption, agriculture and irrigation in this region. However, the operation by gate-closing caused the 2 major problems are 1) destruction of the bank of the river during ebb tide period and 2) sea water intrusion during flood tide. Therefore, the dam has been stop working due to keeping for problem resolve. • Source of Water Pollution Chachoengsao Muang municipality contributes the highest BOD of 1,100 kg/day discharged to Bangpakong River. The second is the Bangpakong District municipality (180 kg/day) and Bangkhanak District Municipality (50 kg/day). The Chachoengsao Muang Municipality is in the process of constructing a sewage treatment plant with a capacity of wastewater 24,000 m3/day.
Rice cultivation areas of the province normally settle near the river or canal. Bangpakong, Banpho, Chachoengsao Muang, Bangnamprieo and Klongkhaun districts are largely paddy fields. Water pollution problems are mostly observed in the post harvesting period. The paddy stubble left after harvesting are flooded with the runoff water discharged in to the local water course.
The highest concentration of shrimp farms is seen in the Banpho district and Chachoengsao Muang. Almost 80% of the farms are small scale family owned, which have not been standard acceptable by the Department of Fisheries due to inadequate environmental management practices such as: feeding with an open system and absence of clarifying ponds, sludge pits, improper treatment of wastewater and sludge discharge into water sources.
Pig farms play a key role in water quality degradation (Muang Chachoengsao, Bangkhla district), especially in the upstream areas of the Bangpakong stream. About 900,000 pigs are grown in 1,751 farms in these districts. Waste generation from pig farms is about 5kg/pig/day of which pig manure (70%) is sold. About 75% of the total pig farm has composting pit, but in the real case they discharge the waste into the water sources.

42
Chachoengsao Muang, Bangpakong and Bangkhla district are the centers of industrial activities. Almost all industries requiring water for the production process are located near water sources. Lack of sound environmental management practices and discharge of wastewater to natural resources without appropriate treatment have given rise pollution problems. • Soil and Land use Soil resource of the Province mostly is categorized in clay soil and founded in the flat land area. Previously, land formed by the estuary sedimentation, has awful water drainage quality. However, this soil properly used for paddy field in Muang, Phanomsarakharm, and Sanamchaikhet districts. The problem in this type of soil area is flooding in rainy season due to poor drainage. However, the drainage is high because some clay soil area has inserted with gravel. This type is properly for crop field such as cassava in Thatakiap and Bangkhla districts, while the high slope can cause the soil erosion as Phanomsarakham and Sanamchaikhet districts. The soil type in Chachoengsao Province can be categorized following the origin materials; Tidal Flat, Former Tidal Flat, River mouth and estuaries, Hills and Mountain, Erosion Surfaces and Local Washes. Chachoengsao Province has total area about 5,351 Km2 and most of land use is the forest area about 45% of the whole province. The second is agriculture area 41% and the third is allocated land about 5.5% and livestock and aquaculture area with 5%. The provincial landuse are shown in Figure 4.9:
Source: Department of Environmental Quality Promotion (2004)
Figure 4.9 Landuse area of Chachoengsao Province • Forestry Half of the forest in the Eastern region is located in the connection area of 5 provinces are Chonburi, Chantaburi, Rayong, Prachinburi and Chachoengsao. Name of largest forest in this junction area is Khwai Rabom-Seeyad, where the most of forest located in Sanamchaikhet and Thatakiap districts of Chachoengsao Province. In the year 2000, the

43
forest area in the Province is 2,400 Km2 which is about 45% of the whole Provincial area. The forest is the origin of many water courses and it has abundant of flora and wildlife diversity, so the Forestry Ministry has kept the forest to be national park. In the year 2004, the conservation area of land forest is about 845 Km2 and mangrove forest is 12 Km2. The total area of both forests in the Province is 16%. • Solid waste Solid waste management is the responsibility of the each local administration such as municipality and the Sub-district administration (Tambon). Total solid waste generation in the Province is about 400 tons/day of which 170 tons/day is from the municipality and 200 tons/day in the district. The waste characteristic and composition is showed in the Figure 4.10. Chachoengsao Muang (53 tons/day), Bangkhla (18 tons/day) and Phanom Sarakham (15 tons/day) are the municipalities which generate the highest volume of waste in the Province. Tambon Bangwua (in Bangpakong district) generates 20 tons/day, Tambon Sanphudad (in Banpho district) 12 tons/day, and Khoh khanoon (in Phanomsarakham district) 11 tons/day are the sub-districts which generate the maximum quantity of waste.
Paper6.5%
Food49.0%
Other11.2%
Plastic19.1%
Glass2.8%
Aluminium1.5%
Wood2.8%
Rubber0.1%
Hazardous waste0.5%
Textile4.9%
Steel1.8%
Source: Pollution Control Department (2006)
Figure 4.10 Solid waste composition of Muang Municipality Solid waste management in the municipality is done by collection and transportation using trucks with a capacity of 8-11 m3. The trucks make about 2-3 roundtrips per day and collect the waste from both commercial and residential areas. The efficiency of the collection system has bee reported to be between 70-90% of the total waste generation. In some places the quantity of waste generation from Sub-district administration areas is small about 2-3 tons/day. In such places solid wastes are disposed and managed by the household in small open dumps or through open burning. The Table 4.4 is showed the solid waste generation and management.

44
Table 4.4 Solid Waste Generation in Muang Municipality
Amount of Solid waste generation Waste generation rate Disposal method Disposal place area Disposal Location
53 Ton/day
1.2 Kg/person/day Open dumping
5 hectare Bangkwan sub-district (Muang District)
Type of Community/Town Industrial, Commercial and Agricultural Source: Pollution Control Department (2006) • Air quality Ambient air quality has monitoring yearly by Pollution Control Department, which the air monitoring station in the Province is situated in Plaeng Yao District. Most of the parameter results are settling in the standard limitation and quite low. However, the results also show the parameters that exceed than the standard only O3 and PM10. This may occur in the post-harvesting season, where farmer operate open burning at their agriculture field. 4.2 Major Economic Activities in Chachoengsao Province From the collected data, the major economic activities in the province and study area have been focused. Rice cultivation, the started point is the original sector of rice-based industry. Then, this part focused on the rice mill as the key point of rice-based processing industry. Focusing on the group of sample rice-based industry in the production process, material input, output by-product and waste of each industry and it environmental means. Data in this part are used to develop the material flow of rice-based industry in the Agro Eco-Industrial Network and final part of analyzed the policy network. 4.2.1 Rice cultivation Rice cultivation is the major agricultural economy of Chachoengsao Province. In the middle region, the topography of prominence land is favor to grow both major rice cultivation and second rice cultivation. Especially, Jasmine rice is originated from this province and well-known in the rice market. The total rice planted area in the province is 166,000 hectare and planted in 660 villages. The highest rice planted is in Muang District. However, the major rice cultivation is the most plentiful in the whole Province which 113,000 hectare and the cultivation present in every district. The second major rice cultivation is the second in the province with 53,000 hectare and the main sources are from Bangnamprieo, Muang, Khlongkhuen, and Bangkhla districts. The two system cultivations are planting in both types of rice and sticky rice. The rice cultivation of each district in Chachoengsao Province is shown in the Figure 4.11.

45
0
10
20
30
40
50
60
70
Muang
Bangk
hla
Bangn
ampri
eo
Bangp
akon
g
Banph
o
Phan
om Sa
rakha
m
Ratcha
san
Sana
mchaik
het
Plaen
gyao
Thatak
iap
Klongk
huean
District
Plan
ted
area
(1,0
00 h
a)
Second Rice Major Rice
Source: Chachoengsao Provincial Statistical Office (2005)
Figure 4.11 Rice Cultivation in Chachoengsao Province The paddy field of lowland and plain in the central part such as Chachoengsao Province, are popularly planting the non-glutinous rice. The depth of water level in farmland during September and November is 1-3 m. Then, the farmer in some area have to use type of floating rice, otherwise most of the area is the type of lowland rice. The rice characteristic depends on the growing factors; high yield, resistant to environment variability, and rice quality. The quality of rice considering on several factors such as seed dormancy, sensitivity photoperiod, floating ability and tolerance to deep water, grain quality, plant type, resistance to diseases and insects. • Production cost and rice trading The rice cultivation price and production cost of farmer is the basic consideration point of value chain of rice based industry. The rice at farm price can be varied in each month and year. The variation of price depends on the market price and several factors such as water resource, oil price, planted area etc. The example of producing jasmine rice can be categorized for a cost analysis. (Mentioned in Figure 4.12) Total cost of paddy cultivation is average for one farm is 240 Baht/hectare, then equal to total cost 5,400 Baht/ton with the yield 4,788 kg/hectare. The paddy sale at farm price is 7,070 Baht/ton, so the net benefit to the farmer is 1,630 Baht/ton. The rice cultivation area is fit to use the large machinery in production e.g. pushcart, tractor to land preparation. The farmer can save the cost for labor and shorter time to harvest, but the material cost is increasing. In the area of deficient land and less nutrient, the farmers need to prepare the farm by using lot of chemical fertilizer.

46
Variable cost 46%Material cost
9%
Opportunities cost 1%
Fixed cost 8%
Labor cost 36%
Source: Office of Agricultural Economics, Ministry of Agriculture and Co-operatives (2006)
Figure 4.12 Cost in the investment of major rice cultivation
In the central region, the fresh paddies are required and purchased from the local rice trader or rice mill agent at the farm. Some farmers sell the paddy to the nearby rice mill directly, so the farmers have not to reduce or maintain the moisture content by themselves. However, the rice mill or paddy trading market has to check the moisture content before purchase for setting the price concerning the quality of paddy. The local paddy trader loads the rice to send the medium size of rice mill. The rice after milling is distributed to; 1) the local consumer in the province and 2) sells through the agent to the Bangkok market. Because the rice market is the major role of rice distributor to the other regions which deficient of rice production e.g. South of Thailand. The medium size of rice mills in Chacheongsao province usually sells the rice to the wholesaler, retailer or large enterprises. Otherwise, the large rice mills are trading to the exporter by passing through the agent. Trader and agent play as a key role in paddy and rice market. They purchase and collect the paddy from high yield of rice region such as North and Central part and stock at their bran/warehouse. Then, they sell the paddy to the rice mills (medium and large size) or rice trading market at Bangkok and vicinity. Moreover, the trader and agent give the loan to farmer for invest the rice cultivation such as rice seed, fertilizer, and pest control chemicals. Especially at the beginning of season, the farmers raise a loan from them and return with interest after production. • Resource constraints and environmental issues Chachoengsao Province has several soil problems, with the major face to high content of gravel and sand in soil in Plaengyao, Sanamchaikhet and Phanomsarakham. The acid soil concentrated in Banpho, Bangnamprieo, Plaengyao, and Phanomsarakham. The saline soil problems occurred in Bangpakong district. However, the rice cultivation mostly in the acid soil (pH 3.5-5) is effected with high composition of sulfur in soil, especially in dry season of irrigation area faced to the sea intrusion from Bangpakong River. The salinity is

47
exceeding than standard highly in November-December and depends on rainfall quantity of each year. The rice yield and net income of farmer is quite low but the capital cost high. The land without acid soil problem is suitable for rice cultivation. This area obtained higher yield and the farmer can obtained more net income. The area is divided into 2 areas of water sources consumption; the irrigation accessed area with the loam quality is quite good in Bangnamprieo, Muang, Klongkhuen, Panomsarakham and in the west of Bangkhla. However, the water is lacked during dry season because the irrigation gate was closed to prevent sea intrusion. The rain fed area; Bangpakong, Banpho, Bangkhla, Ratchasarn have most of the major rice cultivation due to depending on the rain fall. The rainfall is quite low during planting season (May-July), so the water source from canal is used to fulfill this period. In Chachoengsao province the area treated by inorganic fertilizers is totally about 174,000 hectare; the paddy field is treated about 112,000 hectares or 63% of the treated area in the province. The total quantity used in the province is 59,179 kg and the rice cultivation consume the fertilizer about 40,743 kg or 68% of the total crops used fertilizer in the province. The post harvest period of rice, the presented of farmer managed the rice residue in their field such rice straw and paddy stubbles left after harvesting. This is the one cause of air pollution, nuisance and risk of car accident due to closely the transportation route. Water resource is very important to rice cultivation; the water demand for irrigation of rice cultivation is 42% of total agricultural water demand. Chachoengsao has rage of agricultural water consumption is 387 million m3/year. Therefore, the water demands in agricultural purposed also competitive to the other demand purposed due to river and canal water resource. The soil quality in the area is increasingly deficient due to long lasting period of cultivation, intensive use of chemical fertilizer and pesticide, degradation of soil and nutrient loss. Therefore, several projects are developed from government organization to support the farmer livelihood. For example; encouraging the farmer to plow the agricultural residue after harvesting, promote the organic fertilizer and adopt to the farm land, soil improvement techniques promotion. 4.2.2 Rice mill Chachoengsao province has abundant of rice production and it distributed mostly in the study area of 5 districts. Rice milling process is the one kind of agro-industry, which is purposed to processing the paddy for foodstuff. In the past, the rice mills are served at small scale and local area. Thus, the scale and technology is quite low. However, the rice mill developed following the rice production for last 30 years due to the enhancement policies to increasing capacity of rice supply inside the country and export. The number of rice mills in Chachoengsao also presented plentiful for last 10 years following the country statistical number as showed in the Figure 4.13. Last 5 years, it seems the amount of rice mill is stable developed in this area (MOI, 2005).

48
107
356 356 352
196 190196
98 100 102 105 105
05,000
10,000
15,00020,00025,00030,00035,000
40,00045,00050,000
1992 1993 1994 1997 1998 1999 2000 2001 2002 2003 2004 2005
Num
ber
of r
ice
mill
0
50
100
150
200
250
300
350
400
North-east North MiddleSouth Country Chachoengsao Province
Figure 4.13 Trend of rice mills established in the province, regions and country This status of rice mill is caused from the changed number of traditional rice mills was turn into modern rice mill production with higher capacity. Also, it is caused from the change of rice cultivation land use into the other types of development. However, the rice mill still is the first rank of industrial establishment in the Province. Statistical information from the Department of Industrial Works, 2005 indicated that 39,834 rice mill factories are operating in Thailand. A highest number of factories are in the north-eastern part. The north, south and middle are accordingly to the rank. It was found that there were 107 rice mills in Chachoengsao Province and the distribution of rice mills are as following the Table 4.5. Criteria of factory classification are defined as follows:
Small size: maximum production are less than 18 tons/day Medium size: maximum production are 18 to 30 tons/day Large size: maximum production are more than 30 tons/day
Chachoengsao Province has totally 107 rice mills operated in 10 districts. Bangnamprieo is the first rank by 29 rice mills. The rice mill has been categorized in the different scales are small, medium, and large; 44, 15, and 48 by the mills size accordingly. Regarding of rice mill establishment is regulated in the list of factory type and classification No. 00901, which is based on the Ministerial Regulation 1992 (B.E. 2535) issued pursuant to the Factory Act 1992 (B.E. 2535). The type of all industry establishments in the regulation has totally 107 code numbers and each of types of factory is divided into several series number. Moreover, the rice mill can be set in the No. 00201 in case of the entrepreneurs registered and produce other factories of their business. Some

49
parboiled mill also import and produce the drying and roasting rice, additional from their in-line rice production. Table 4.5 Distribution of Rice Mill in Chachoengsao Province
Size of Mill District Small Medium Large
Total
Muang Chachoengsao
5 3 11 19
Bangkhla 2 2 3 7 Bangnamprieo 8 4 17 29 Bangpakong 4 1 7 12 Banpho 8 3 4 15 Phanom Sarakham
9 2 5 16
Ratchasan 1 - - 1 Sanamchaikhet 2 - - 2 Plaengyao 3 - 1 4 Thatakiap - - - 0 Klongkhuean Minor-district
2 - - 2
Total 44 15 48 107 Unit: Number of Rice Mill The code number 009: Factories engaging in any kind or several kinds of the following business related to plant seeds or plant bulbs. Issued in the sub-code number 00901: milling, winnowing or scouring grains;
Classification No.1: Machinery is not more than 20 horsepower and there have not boiler
Classification No.2: Machinery is not more than 50 horsepower. There have not boiler and it is not classified as Group 1
Classification No.3: Machinery is more than 50 horsepower or every size of factory with a boiler
The code number 002: Factory engaged in any kind or several kinds of the following agricultural produce. Issued in the sub-code number 00201: boiling, steaming or roasting plants or plant seeds;
Classification No.1: Not classify Classification No.2: Machinery is not more than 50 Horsepower Classification No.3: Machinery is more than 50 Horsepower
• Rice mill production process This part of the study analyzed the rice mill process in Chachoengsao Province, so as the rice mill established in the study area of 5 districts. The 5 sample of rice mills are selected to study the processing. However, the rice mill production efficiency of each industry is diverged and depended on the industrial management. The rice mills production process are different in terms of production technology, machinery, quality of raw materials, the target quality of product, energy consumption, and production capacity. The rice mill can be categorized by production process and products in 2 groups; Rice mill (Sticky rice, White rice, and Hom mali rice) and Parboiled rice mill.

50
Rice mill A; it is established in Bangnamprieo District for 12 years. The mill is managed by the family owned. The production capacity is 150 tons/day with the 24 operation hours and 25 day working. The paddy is weigh during contained in the truck and also quality checking in the heap such moisture, temperature and % head rice. Then, it is loaded from the truck to process unit. Mostly, the quality is accepted by inspector due to the purchase system of raw material is procured by conversant retailer. The processes of rice mill are composed of de-husking, whitening and separation of head rice and broken rice. Rice quality and rice mill efficiency is major considering from head rice grain because the head rice is the major product with top price. The quantity of head rice production from rice mill also depends on rice variety, cultivation method, harvesting method, moisture reduction of rice, paddy storage and rice milling. The production process of this typical rice mill is showed in the Figure 4.14. Therefore, the key point of each processes are described below;
Figure 4.14 Rice milling process flow diagram
Paddy drying; The principle is moisture decreasing of paddy and prepare to mill process. The proper moisture before milling is affected to the higher percentage of rice. The proper of moisture content of paddy dryer is set at 13% by used mechanical dryer in the mill.
Seed Cleaner
Rice whitener
Paddy Separator
Chaff Separator
Husker
Grain separator
Paddy
Moisture content 13%
Contaminated and straw 1.8%
Husk and Dust 29.8 %
Bran
Un-husked Paddy
Head Rice 52.2% Broken 12.8%
Dust and Bran 10%
Bran
Dryer

51
Cleaning Process; Paddy from storage bin goes to a separator for separating straw chaffs, stones and dust particles. The Screening cleaner: The cleaning set is two screens, on the top screen particle greater than the size of paddy is retained, while paddy is retained on the second screen. The dust particles pass through and collected together with straw to dispose.
De-husking process; Due to the reciprocating motion of the separator, the cleaned paddy falls to a chamber and by pneumatic conveying to the husker machine. The outputs from this process are brawn rice, course bran and husk. Rubber Roll Husker: popular used in rice mill due to it decreases the broken rice problem.
Figure 4.15 Unit operations of Rice mill production process
Chaff Separator; The paddy from husker still mixed with the straw chaffs and leaves, and then it goes to the chaff separator for separate the husk and bran from brown rice. The Air Brower is used with the flinging screens. The husk aspirator chamber collected the husk and course bran in this process.
Paddy Separator; The brown rice and some small paddy go to the paddy separator (tray type) by another conveyor belt which retains the small paddy which is sent back to a rubber huller again. After de-husking, the brown rice and husks are sent to the husk separator for husk separation and storage.
Rice Whitening; The whitening process has 3 stages. The brown rice from the paddy separator goes to a distributor which has different outlets to send the brown rice to different polishers where the brown rice is polished for the first time to give rise to rice and coarse bran. The rice and coarse bran go to a bran separator for separation. The rice is sent to another whitener. The White rice polisher is Vertical cone-shape polisher.
Paddy Storage and conveyer De-husker
Paddy Separator and Rice Whitener

52
Rice Polishing; The major purpose of this process is to eliminate the fine bran at the grain surface and the rice grain is shined and smooth. The whole rice is collected to Grain Separation; in order to separate the broken rice from head rice. The Trieur cylinders is used, also rectangle strainer is used in separation of fine bran. The rice mill just installed the machine of color separator for the need of rice export. It is adapted the automatic color sorter (Photoelectric principal). Normally, the grain length of whole rice is set at the proportion 10 following the Thai Rice Standard. The main components of the product are Head rice, Big broken rice, Small broken rice and Brokens. • Parboiling Rice Mill Parboiled rice mill B; it is established in Bangnamprieo District for 20 years. The mill is managed by the family owned. The production capacity is 600 tons/day with the 24 operation hours and 25 days working. The number of employee is 100 workers working in 3 shifts. Parboiling process is operated the same as rice milling process but the parboiling has adding the processes. The process of paddy cooking is using the Hydrothermal Process. • Parboiled rice production process The typical of sample parboiled rice industry is analyzed the production process. The production process of one typical rice mill is showed in the Figure 4.16. The parboiling process has major unit operations are as following described;
Figure 4.16 Parboiled rice process flow diagram
Paddy
Cleaning
Steaming
Soaking
Drying
Milling Process
Wastewater 70% of water used
Steam Boiler
Burning
Contaminated and defected 4.8%
Water/Warm water 600 m3/d
14% moisture
Husk
Flue gas
Ash
Husk
Ash
Head Rice 60% Broken 10% Bran 10%
Husk 10%

53
Soaking; To prevent the darker color change of parboiled rice (over the starch gelatinized temperature limit), the temperature using should less than 70 οC, the 6 tanks are used and soaking time about 4 hrs and pH 5 is suitable in soaking water.
Steaming; The tanks with rice after soaking are fulfilled with the steam, the pressure is about 100 psi with 3 tons of paddy is required time of parboiling about 15-20 minutes for each tanks. Purposing of this process is the improvement of rice quality, increasing head rice yield, increasing time of rice preservation and obtain higher nutrition value of parboiled rice. However, this process is the major source of wastewater due to it is the main environmental issues of parboiled rice mill.
Parboiled drying; Drying of parboiled paddy is purposing to the reduction of moisture content for proper milling and storage. The drying process of parboiled paddy is different and more special than raw rice milling due to high moisture content and texture changing of the starch from gelatinized. Then, the temperature is required about 100 οC and keeping time is 5 hours with 6 dryer units. The parboiled rice milling; to de-husking of parboiled paddy and polishing the brown rice, to get the rice product are done by the similar processes of rice milling. • Material balance (Input, Output, Waste) The mass balance is a major tool to identify the efficiency of rice production, percentage of head rice and percentage of total rice is the one important to the rice mill. The major raw material cost of rice production is paddy, which is about 95% of the total cost. The cost of electricity, transportation, labor and material is about 5%. The mass balance is established to check the problem of the rice milling process and find out the major problems through the milling unit operation. From the study of typical rice mill information, the rice mill A produced sticky rice 98 tons/day in plastic pack (49 kg/pack), sack (99 kg/sack) and bulk (jumbo pack=1 ton/pack). The input used paddy 150 tons/day as raw materials. Fuel oil used about 200 L/month and packaging materials such as plastic bag. The specific mass balance of one rice mill is showed following the Figure 4.17.
Figure 4.17 Mass balance of typical rice mill process
Milling process
Paddy 6,250 kg/h
(100%)
Head rice (A1) 3,262 kg/h (52.2%) Big broken (C1) 400 kg/h (6.4%) Brokens (C3) 400 kg/h (6.4%)
Straw, Grass 12.5 kg/h (0.2%)
Lean grain 100 kg/h (1.6%)
Husk, coarse bran, dust 1,863 kg/h (29.8%)
Fine bran 625 kg/h (10%)
Total rice 4,063 kg/h
(65%)

54
The output of rice also is the by-product of 29.8 % of husk including dust waste due to the industry has to dispose by mixing it to the husk. Rice bran is produced about 10% of paddy and contaminated things such straw and defected grain is about 2.7 tons/day. All the by-products are sold to the dealer or distributed to other industry. Capital investment of Rice Mill A is 14,000,000 Baht, it established since 1995. The total cost of rice mill production is approximately about 10,080 Baht/ton of paddy. The paddy purchasing cost is about 7,000 Baht (The purchased price is varied following the market price which is set by rice trader and exporter). The minor cost is about 380 Baht/ton of paddy; it is the additional cost from:
Labor cost 50 Baht/ton Electricity cost 100 Baht/ton (for milling),
100 Baht/ton (for drying paddy to 14% moisture) Transportation cost 130 Baht/ton
From the studied of typical parboiled rice mill B information, the production capacity is 600 tons/day with the 24 operation hours and 25 days working. The paddy is from the supply market inside the Province but depend on the sufficient requirement and production capacity in local area, unless the industry will buy from other regions. Water source in production process from canal, it is pump and restore in their pond (1.28 hectare); water used in the process is 600 m3. The outputs are parboiled rice and broken rice about 420 tons/day (70% of paddy). Husk about 60 tons/day (10% of paddy) are used in process for boiling and some of that sale to the farm and ash is sale to the farmer in truck. Bran is obtained about 60 tons/day (10% of paddy), the parboiled rice bran has higher quality than white rice bran, and then the rice mill can sell with the higher price to the rice bran oil extraction industry at Bangpakong District. The specific mass balance of parboiled rice mill is showed following the Figure 4.18.
Figure 4.18 Mass balance of typical parboiled rice mill process
Normally, the transitional standard of total rice percentage and its by-product is around 75% (Department of Health, 2000), and the number could be varied due to many factors such as; amount of contaminated thing mixed with paddy, seed cleaning and separation
Milling process
Paddy 25,000 kg/h
(100%) Head rice 15,000 kg/h (60%) Broken rice 2,500 kg/h (10%)
Straw, grass 50 kg/h (0.2%)
Lean grain and contaminated 1,150 kg/h (4.6%)
Husk and dust 2,500 kg/h
(10%)
Bran 2,500 kg/h
(10%)
Total rice 18,750 kg/h
(70%) Water 25 m3/h Wastewater
17.5 m3/h

55
process, loss of paddy in the cleaning process and chaff separation process, over polishing of rice, maintenance, and experiences of operator.
Some conclusions from the mass balance of rice mill process were drawn as follows;
The rice mills achieved the reference standard of total rice and by-product (75%). The total rice percentage is the parboiled rice mill is higher, due to this mill needs less polishing of rice and the starch content could obtained more than other kind.
The head rice percentage also difference on each mill, there is no benchmark of the accurate values. It is varied due to several factors such as; harvested paddy to rice processing, variety, origin areas of paddy, paddy quality, harvesting period, moisture content reduction process, transportation, de-husking process and polishing.
The products and by-products from the rice mill are mostly recycled either at on-site recycle or at off-site recycle. The management method of the 5 sample rice mills are summarized in the Table 4.6. The alternative options and value of product, by-products and waste are different for each rice mill. It depends on the amount and quality of rice product, cost saving of rice mill, purpose of customer industries need.
Table 4.6 Scheme of Product, By-products and Wastes of Rice mill and Parboiled mill
Rice mill Parboiled rice mill Output kg/ton paddy
Customer/ disposed method
Sale price
(Baht/ton)
kg/ton paddy
Customer Sale price
(Baht/ton) Head rice 522 Dealer (market) 12,000 600 Dealer(market) 10,400 Broken rice 128 Dealer (market) 7,500 100 Dealer(market) 7,500 Bran -Fine -Coarse
100 -
Animal feed Mixed in husk
6,500 -
100
Rice bran oil industry
8,250
Husk 298 Power plant 650 100 In plant used, Sale as fuel, Chicken farm
800
Dust - Mixed in husk - - Mixed in husk - Contaminant things
16 Dump their land - 46 Dump their land, Give to agriculture
-
Straw 2 Agriculture 1,000 2 Agriculture 1,200 Ash - - - 25% of
husk Planting and cultivation
500
Remark: Surveyed data from questionnaires and field study • Energy consumption
The energy utilization in rice mill can categorize into 2 major types are: 1) Electricity, mostly is the new establishment rice mill or unused boiler in rice mill. 2) Combine of electricity and husk fuel, the rice mills set up the boiler by using the husk as a fuel to produce the steam and supply to driving the motor’s machinery. The steam also feeding to the soaking and steaming in parboiled mill. However, recently the price of husk for fuel are keep on increasing, the rice mills tend to change and use the electricity motor for machinery driving.

56
The typical rice mill has measured the energy consumption and reported in the following Figure 4.19. Therefore, the average of electricity energy utilization in the rice mill processing and cost of electricity are summarized in the following Table 4.7.
-
10,000
20,000
30,000
40,000
50,000
60,000
70,000
80,000
90,000Ja
n-04
Feb-
04
Mar
-04
Apr
-04
May
-04
Jun-
04
Jul-0
4
Aug
-04
Sep-
04
Oct
-04
Nov
-04
Dec
-04
Ele
ctri
city
use
d (k
Wh)
Figure 4.19 Electricity consumption of rice mill production
The average electricity consumption for rice processing of rice mill is 52,700 Baht/month. And the maximum consumption is settling in December and June because the rice mill production increasing the capacity following the high production of paddy from agricultural sector during October to December and May to June periods.
Table 4.7 Energy utilization of Rice mill and Parboiled mill production process
Rice mill Unit per Ton of paddy kWh Ton of husk Total cost (Baht)
Rice mill A 17.8 - 53.4 Parboiled mill B 44.4 0.04 154.2 Remark: The husk feeding for boiler is about 700 tons/day and husk price is 600 Baht/ton;
Surveyed data from questionnaires and field study and electricity bill The quantity of combined of electricity and husk fuel used in rice mill is separated in 2 processes: Milling process (Electricity and Fuel) and Soaking-steaming process (Steam is used in soaking-steaming and electricity is used in conveying system). From the Table 4.7, the parboiled rice mill consumed electricity and energy higher than rice mill because the process is more complicated and higher production capacity. The electricity price is lower than normal period due to rice mill did not operate the drying unit. Energy consumption in rice mill mainly used electricity in order to use in several unit operation. The three highest electricity consumed equipments are main axle motors to drive most of hinge unit consumed about 63%, husk vacuum pump in milling unit used about 13 % and Rubber hulling motor consumed about 11% and other minor units are approximately 13%.
Electric power Average (kWh)

57
• Water consumption, wastewater generation and treatment The rice mill is characterized in the dry process industry, but exempt to the parboiled rice mill which used the water in soaking and steaming process. Water consumption of parboiled mill depends on several factors such as quantity of raw material (paddy), original moisture content in paddy, and method of paddy soaking. Over used of water is effected to the production cost and wastewater treatment cost. Table 4.8 Wastewater characteristic of parboiled rice mill
Parameter Value Thai Industrial Effluent
Standard pH 6.7 5-9 Temperature (oC) 38 40 DO (mg/L) 4 - BOD5 (mg/L) 9 ≤ 20 Suspended Solid (mg/L) 239 ≤ 50 Oil and grease (mg/L) 9.6 ≤ 5 Water consumption (m3/day) (Parboiled rice mill B)
420 -
Water consumption of parboiled rice mill B is 420 m3/day, so the BOD loading from wastewater generation is 0.25 kg BOD/ton of paddy. Wastewater generation from rice mill could be from 3 sources; Wastewater from soaking and steaming process (parboiled mill), Wastewater from trapping of fly ash and remove ash from burner (mill using husk fuel), and Oil contaminated wastewater (mill using steam engine and boiler). Comparing to the WHO (1993) Rapid Assessment of Pollution, the benchmark of parboiled milling is generated wastewater 1.5 m3/day per ton product. The benchmark of BOD loading is 1.8 kg/ton and TSS is 0.07 kg/ton of product. It found that, this parboiled rice mill has generated waste water 0.7 m3/day and BOD loading is 0.006 kg/ton. The values are lower than benchmark that could be acceptable. However, the wastewater has high value of TSS, which is 0.168 kg/ton. Thus, the pre-treatment of this fraction should be addressed in this rice mill. In addition, the Table 4.8 shows the reference values of wastewater characteristic studied from rice mill effluent has oil and grease (lubricant and diesel oil are the major source of this parameter), and suspended solid values are higher than standard regulation. Most of wastewater is generated from the soaking and steaming process which is used high amount of water. The BOD loading in wastewater depends on the contaminated matters in paddy, because the deficient seed cleaning causes the higher contaminate dissolved in soaking-steaming water. The parboiled rice mill is the major source of wastewater, due to high consumption of water in the process and less management of discharged wastewater. The pollution problems mostly from neglect of operation and maintenance, and inappropriate designed of treatment system. Furthermore, wastewater treatment system is only simple of pre-treatment such the rice mill discharged to the settling pond and storage in oxidation pond before discharge to the canal. Due to the less amount of parboiled rice mill established in

58
Province (7 parboiled mills), so this problem is not significant impact. However, the wastewater pollution can be caused the compliant and pollution to the local communities. • Air pollution and dust generated from boiler Emission of particulate represents to the efficiency of boiler and pollution control system of rice mill. The emission standard for rice mill boilers is regulated for particulate from the boiler stack and opacity measure. The rice mill emission was studied; the average particulate from boiler exhaust is 290 mg/m3 from rice mill (Department of Industrial Works, 2006) but the average particulate from parboiled mill is about 1,200 mg/m3 and exceed than Particulate standard (value for biomass source is not exceed than 320 mg/m3). The noise pollution from rice mill operation also causes significant problems to the health of worker. The local household can effected to the noise when rice mill operated and rice transportation. However, most of the rice mills situated far from the community more than 100-500 m., so it is rather impact to the health and nuisance to the local people in that area. 4.2.3 Rice-based industrial processing in the study area of Chachoengsao Province This research mentioned in the rice based industry to identify and created the Eco-Industrial Network. The major sector of rice mill is the key point to study in the existing rice production technologies and its environmental implication, production process, material input, product, by-product and waste. Therefore, this part focused on the sample group of rice base industries along the value chain of product, by-product and waste to close the cycle loop of waste. The major types of rice value chain industries (product and non-product) are classified in the following Table 4.9. Table 4.9 Rice mill and rice by-product industry in Chachoengsao Province
Number of Industrial establishments Type of industries
Province 5 Districts
Total Rice Mill: Parboiled mill White Rice mill
107 7
100
82 7 75
Noodle/vermicelli 22 17 Seed Oil Extraction 3 1 Wood shaved 25 21 Organic fertilizer 7 5 Maize/soy bean powder 4 2 Animal feed mill 23 20 Small Power Producer 4 2 Total 195 150 The distribution of rice-base industrial established mostly in the study area of 5 districts, so the relationship of material flow in the area is properly and clearly to identified the existing

59
situation of material flow networking. The product, by-products from rice mill which identified previously in the Table 4.6 are used in selection the sample of existing rice based industries to create the network and complete the appropriate alternative options. • Rice noodle industry Fermented rice noodle industry is the one processing products from rice which is one mainly food stuff supplied to Thai people, so the industry is set up and distributed to every region. In Chachoengsao province, the rice noodle industry is well-known as largest source and supplied to Bangkok market and central region. The number of rice noodle industries established in province is 22 industries and 17 industries are set up in 5 districts. The scale of rice noodle industry is divided into 1) household scale and small scale 2) medium scale and 3) large scale. Mostly of rice noodle industries in Chachoengsao Province are medium and large scale industries which are licensed to factory set up and Thai FDA. The production processes used the raw material such as broken rice, water, fuel, and electricity by inefficiency managed and pollutions is caused from the processes due to wastewater, and solid waste. From the study of sample rice noodle industry, it situated in Muang district in the rice noodle estate. The business was established for 20 years, with supply noodle product to the local market, Bangkok and peri-urban markets. The rice noodle production capacity is 5 tons/day. Broken rice is used about 1:2 (raw material: product). The quality of broken rice, percentage of amylose in rice, and flour mixture loss during the processing are the variation of raw material used. Loss of noodle is mostly from cooling of vermicelli in extruding process and in process of forming a group of vermicelli, while the starch loss mostly in the extruding process. Rice noodle production process The major raw material is rice which chemical compound is in starch form. The starch composed with amylose and amylopectin in different proportion due to variety of rice. The main variety of rice such as Laueg pa tiw variety (non-glutinous rice) due to it has high content of amylase and its texture is suitable to produce rice noodle. The compositions in rice noodle product are; moisture content 63.2-81.6%, Protein 3.6-7.3%, Fat 0.2-1.5%, Amylose 27.5-34%, Fiber 0.5-1.4% and ash content 0.2-0.9%. The reference of protein content in noodle should contain more than 5% and the noodle characteristic should be a little bit muddy texture (Kraidetch, 1992). Starch production process is showed in the Figure 4.21; the broken rice is rinsed and clean with water about 2-3 times, and then the rice is fermented in the water storage tank about 3-5 days (make it soft). Rinse again before grinding in the mill and sifting. Then, keeping for one day before dewater by pressing in the cotton sack about 5-6 hours or using compress machine. The cake of flour is finished in this stage. Flour steaming process; the cake is steamed in the cooking oven for gelatinization about 15-20 minutes. The steamed flour is knead with hot water in mixing machine (pasting) and passes through the filtering machine for uniform flour and separates the flour granules.

60
Extruding process: The mixed flour is extruded into the cooking with contained boil water. The boiled noodle become to the form of long string. The string is taking out and immediately put into water for cooling. Finally, the noodle string is set into a noodle group by manual and packing into baskets, and foam boxes for distribute and sale to the market. Mass balance of rice noodle processing From the production process in rice noodle industry, the mass balance of Figure 4.20 is showed the input, output and waste from rice noodle production process.
Figure 4.20 Mass balance of rice noodle processing
The data of typical industry are; broken white rice 2.5 tons/day which is imported from North region of Thailand and some of rice is brought inside the province. The working and operation times are 8 hrs/day and 25 days/month. Fermented rice noodle is produced from this industry about 5 tons/day with the sell price 10 Baht/kg. The noodle scrap is the left part with production process about 0.7 tons/day. This part can be sold in lower grade of noodle and sale in scale of basket (not per kg). Some of the scraps are used by the owner of industry in purpose of fish feeding at his pond. The Table 4.10 shows the input and output quantity, its purchasing price and sale price of product and by-product. Table 4.10 Raw material consumed and product of Rice noodle Industry
Categories Quantity Price (Baht/ton)
Input: Broken rice (tons/day)
2.5
1,080
Electricity consumption (kWh/ton product) 83 250 Fuel wood (tons/day) 10 550 Water consumption (m3/ton product) 20 15 Output: Noodle products (tons/day)
5 10,000
Scrap of noodle (tons/day) 0.7 2,000 The total production of this industry is 687.5 kg/h with moisture content in rice noodle approximately 80%. The total production of noodle in dry weight is 44% of raw material used. The starch loss is retained in wastewater stream is about 56% which is 175 kg/h of broken rice consumed.
Production
process
Broken rice 312.5 kg/h
(100%)
Rice noodle 625 kg/h (1:2.0) Noodle scarp 62.5 kg/h (1:0.2) (Moisture content 80%)
Starch loss in Wastewater
175 kg/h (56%)
Total product 687.5 kg/h
(1:2.2) = 137.5 kg/h
(44% dry weight)

61
Figure 4.21 Rice noodle production process
Electricity consumption of rice noodle industry is 20,000 kWh/month. Energy consumed approximately about 83 kWh/ton of product. Fuel consumption in the industry also important sources of steam energy, biomass such as fuel wood, wood scrap from furniture manufacture, wood chips etc. are used about 10 tons/day, purchasing price is 55 Baht/ton.
Broken rice
Cleaning and Soaking 1-3 days
Water
Milling
Pump to put through screen
Cake Steaming
Dewatering
Filtering
Wastewater
Mixture Settling
Kneading
Cake filtering
Extruding
Cooling & Forming
Boiler Steam
Ash
Fuel
Flue gas
Wastewater
Dregs
Dregs
Vapor loss Wastewater Noodle loss
Wastewater
Wastewater
Electricity Steam
Water
Water Electricity
Hot water Electricity
Wastewater

62
Water consumption Water sources of rice noodle process in the province are mostly from the river and canal. The industries are established depending on water source. There need improvement of water quality before using in the process. The process is simple, by using coagulant chemical such as alum. This water is used in cleaning and soaking process of rice. However, tap water also used in the rinsing and cooling noodle process due to high quality required in finishing process of noodle. Water consumption in process is approximately 50 m3/day (20 m3/ton of product) and the highest process consumed water is in the process of cooling of noodle. Water using of each industry depends on water cost and water consumer behavior. The water used after processing is turn into wastewater and high value of BOD in the effluent due to the high organic contents. Wastewater characteristics
The wastewater characteristic is presented from the study report by Shu Li, 1992 of selected rice noodle factory. The general information of factory is consumed of broken rice about 3 tons/day. The loss of rice matter to the wastewater streams are 80-170 kg/ton of broken rice (dry weight). The starch yield is 830-920 kg/ton of broken rice. Table 4.11 Wastewater characteristic of specific rice noodle industries
Parameters Water consumption
(m3/ton raw material) pH COD
(mg/L) SS
(mg/L) Total process 7-10 - - - Washing process 1-2 8.2 2,620 10,650 Soaking process 1-2 5.4 930-2,760 900
Effluent pond 1 - 5.2 1,325 548 Fish pond - 7.5 86 100 From the above information of Table 4.11, the rice noodle industry has significance of wastewater pollution. The water consumption and organic loading is mostly from soaking process. However, there is presented one of alternative solution such recycling the wastewater from process to feed the fish in the pond. This method favors to reduce the organic loading in the effluent, while increasing production of fish.
Figure 4.22 Wastewater and treatment pond

63
In addition, total amount of 17 of rice noodle industry in the study area being consumed the water about 600 m3/day and all rice noodle industry are generated the BOD loading 253 kg/ton of noodle. However, the sample of rice noodle industry and other industry in noodle estate has discharged the wastewater to the common wastewater treatment system (Figure 4.22). The wastewater from sump of each industry is pumped to the oxidation pond and storage in the clarifier pond before release to the nearby field. • Rice bran crude oil industry The industry established in Bangpakong district and operated for 21 years ago. The industry installed the extraction unit operation from the investment and technology support of Japanese company (Joint venture). Thus, the extraction efficiency is about 80-90%. The plant can process rice bran 200 tons/day which the plant has two set of production lines (old unit and new unit). The quality of raw material were preferred of Moisture content 12%, Oil content 18% (white rice bran) and 25% (parboiled rice bran), and Acid value not exceed 15. Due to high acid value presents an old of bran that make the high content of wax in crude oil product (low oil content). Oil Extraction Process The Figure 4.23 shows a flow diagram of the oil extraction process. The bran from about 40 rice mills in the study area go to the separator for separation of undesirable material such broken rice and stone from bran. The bran is sent to the heating unit, the two production lines of heating process are selected to operate. Considering of unit use is regulated by amount of rice bran; the new production process line is more suited to the high production capacity of rice bran 200 tons/day. Due to this unit use new technique of bulking pellet bran, it achieved higher oil fraction during extraction process. The conventional production process is able to produce only 70-80 tons/day. The extraction plant received the heat bran; this plant has several units of extraction process which continuous flow of hexane in the close system and automatically controlling. Subsequently, defatted bran goes to the dryer to reduce moisture content less than 12.5% and miscella (it is mixture of hexane, oil and water) goes to evaporation unit of desolventizer. The hexane evaporates at 70 °C and it is captured in condensing unit and sent to storage for reuse. The loss of hexane and water should be less than 0.2% in this process. The filtered crude oil is stored in the storage tank. In addition, the defatted rice bran and pellet are sent to separator and grinder unit. Finally, the defatted bran is sold to the retailer for animal feed production.

64
Figure 4.23 Rice bran oil extraction process
Raw material (White rice and parboiled rice bran)
Rice bran
Broken rice separator
Production line 1 Production line 2
Feeder Cooker
Dryer cooler
Expander
Conditioner
Miscella (Oil+Hexane)
Dryer
Rotocel extractor Solvent (Hexane)
Broken rice
Cake
De-oil rice bran
Meal cooler
Desolventizer toaster
Hexane Condenser
Miscella Desolventizer
Crude rice bran
Sifter
Fine grained de-oiled
Baggage meal
Coarse grained de-oiled
Hammer mill
Steam
Coarse bran

65
Mass balance The input of the production process is rice bran which contains about 18% oil in raw rice and 25% oil in parboiled rice. The hexane is recycling in plant used that approximately no loss from process. The outputs are defatted bran and wastes and the product of crude rice bran oil to the market (distributor collected it to sale to the animal feed mill and farm for feeding in the region) with the price 18,400 Baht/ton. The mass balance of oil extraction process is shown in Figure 4.24.
Figure 4.24 Mass balance of rice bran oil processing
The major point of this rice base industry is the link of by-product exchanged between rice bran oil industry and rice husk power plant. The steam is purchased to use in the extraction process from the power supply company (3 MW cogeneration power plant from biomass of rice-husk). The power plant is established by the same joint venture company as rice bran oil industry. Furthermore, the used water from condenser is produced in the process about 90 m3/day with the sell price 80 Baht/m3, and then sells to the power plant. The pollution prevention also implemented, the wastewater from the production process is high temperature about 100 °C are circulated in the drainage system around the industry, then storage to the pond in the industry area. The rice bran oil industry has high technology of extraction and gets support from Japanese. Almost of processes are worked in automatically machine with require high performance of worker to control. The industry registered and operated under the Industry Office of Chachoengsao Province, DIW and Livestock office of Chachoengsao Province (Defatted rice bran production quality control are set every 3 months). National Food Institute relates about R&D of rice bran. However, the company confronts to the problems of; rice bran is high competition with the other rice bran oil industries in country (about 15 industries and almost are situated in North-East region of Thailand). Rice bran price is increasing continuously due to supply chain since the farmer, rice mill, and wholesaler. The company needs the support from government and promotion about their product has high quality and healthy. Should set the formal team from institutional to research and analyze their products. Then, encourage Thai people to use high quality cooking oil as rice bran oil.
Production
process Rice bran
8,333 kg/h (100%) Crude rice bran oil 1,667 kg/h (20%)
Defatted rice bran 5,833.1 kg/h (70%)
Broken rice 833.3 kg/h (10%)

66
• Biomass power plant The sample of rice husk power plant is situated in Bangpakong District for 16 years. Production capacity of electricity is 10.4 MW/day and with the electric current 3.3 kV. The plant uses rice husk and wood chips as the feed stock. The plant itself uses 1 MW and the excess electricity demand after production is sold to the customers. The customers are divided into 2 groups: First, EGAT is main customer of purchasing electricity 8 MW/day. The power plant is the Firm-contractor under SPP scheme to sell the electricity to EGAT, with the contract time 25 year since 1999. Second, the group of customers around the power plant area about 1-2 MW/day (depend on the customer consumption need). Especially, the wood chip mill (The same share-holder company which located beside the power plant) is the major consumer of electricity for their operation processes such wood cutting and sizing into wood chips. Group of customers around the power plant area (Bangpakong district):
Wood chips mill Sag production industry (Sag weaving) Rice packaging plant Bangpakong warehousing Harbor (for ship transportation and logistic of goods) Machinery products company One company’s office Staff housing (situated out of the power plant area)
Material and resources consumption Material consumption of the plant includes raw material use as a fuel source 1.3 kg/kWh, it composed of rice husk and bark. Rice husk 240 tons/day is purchased from the rice mill within the province by the dealer company (contractor). The quality of husk should have moisture content in the range 13-15%. Bark 60 tons/day come from the co-located of wood chips mill. However, the raw material ratio is prioritized from the rice husk due to it has better quality. It controls the additional amount of bark used in the production process. In the fluidized-bed combustion process, sand 3 tons/day is mixing with the fuel and burning in the 600 °C combustion chamber. De-mineral water about 20-23 m3/day used in boiler. River water from Bangpakong River (Water pump capacity 3,800 m3/hr but actually consumption about 70%) is used in cooling process. The stream passes through the screen for pre-treatment, then the water pass through the column for recirculation. Then the stream is returned to the river with the temperature increasing about 10 °C (Effluent temperature about 45 °C). Production process The fluidized bed combustion system, the boiler is used the heated de-mineral water to produce the steam. The combustion chamber temperature is about 800-900 °C, while burning of rice husk and wood chips as a fuel source. The steam is produce in the boiler unit to be higher exergy steam, and then run the steam turbine and generator for generating electricity. The flow diagram is showed in the appendix.

67
Waste generation and treatment The source of wastewater is the blow down water 20 m3/day. It is collected to store in the pond before recycle used. By spraying the recycling water, when dump and unload the ashes operation at the plant site. Ash was produced about 40 tons/day and it is collected by the dealer to planting and agricultural farming. The quality of ash is low graded in purposing use of export for silica content. The power plant decided to produce electricity as the main product and ash is the by-product. The surplus amount of ash is sent to store at the power industry landfill. However, when the dealer needs to purchased the large amount of ash, the company can withdraw the old ash from the power plant’s landfill. Used engine oil about 20 L/month is sent to the boiler by mixing with fuel oil for combustion in the ratio of used engine oil: fuel oil = 1:1,000,000. The Electrostatic Precipitator (ESP) is invested to air pollution control and the consultant company regularly monitoring it. The sand after burning has to be changed every day. Used sand is disposed with the husk ash by dumping to their landfill. The government support and regulation actors related to the power plant are EGAT, PEA, EPPO, PCD, DIW and Bangpakong municipality. The EPPO has selected the power plant to be the pilot project of biomass to energy, study of thermal conversion efficiency and analyzing the waste characteristic of ash, because it may possibly be hazardous waste. The power plant company is joined to the SPP association and set up the stake holder committees (three firms; industry, government, community) for regularly meeting. The requirement of this business development has two major issues; Technical support such new technology to adopted and know how in new machinery and power production technologies to increasing production efficiency. Policy support, the power plant company concerns in sale price is too low in the market but high price of raw materials. Due to the competition increasing in joining to the SPP program from others company, then the rice husk price is increased. 4.2.4 Livestock sectors • Piggery farm The amount and distribution of pig in the study area of 5 districts is showed in the Table 4.12. There has two main types of pig farming; large scale commercial farming and smaller individual for supplementary occupation ones. The amounts of farms are varied due to its short term lead time for each batch of animals such as 4 months for pigs and depend on the market demand. The farm size can be categorized into 4 groups by using the number of animals such following detail:
Household size: it has less than 50 animals; the pig feeding is the supplementary occupation of family.
Small size: it has 50-20 animals; mostly the farm feeding the hogs since it is piglet to increase the weight and sale to the market. Normally, the pig feed is the

68
premixed food, the prevention of disease system is not well, and the farms have not wastewater treatment system.
Medium size: it has 201-1,000 animals; this pig farm has developed in farm management and cultivation. The farm has feed the sows and sores to produce the piglet and hog feeding. The farms produce the feed and mixed the compositions used on-farm.
Large size: it has more than 1,000 animals; this pig farm has completely system management and adopted the high technology in cultivation and diseases control system.
Table 4.12 Distribution and size of pig farm in the study area
Size of pig farm District Household Small Medium Large
Total farms
Number of 1,000 pigs
Muang 11 32 33 23 99 74 Bangkhla 17 46 90 38 191 276 Bangnamprieo 0 2 1 1 4 3 Bangpakong 0 0 0 0 None None Banpho 0 4 13 8 25 26 Total 28 84 137 70 319 379 The pigsty building is made from permanent materials and mostly the hog and sow houses are built in 2 floors for easy cleaning. The slat is adopted to support the floor, for facilitated the cleaning process. Mostly, the farms have animal feed in automatic machine which can be supply the feed 24 hrs. River water (Bangpakong River and canals) is used for pig required about 50 L/day-pig and use in cleaning the pigsty building. The wastewater characteristics from PCD studied on pig farms in the year 2005, as showed n Table 4.13 the value are differenced depend on each farm management. The major problems are odor and pest, the old type of farm has conventional treatment system such Open pond (Figure 4.25) but it has to use the large area and less maintenance. Table 4.13 Wastewater generation and characteristic
Characteristic Farm size Minimum Maximum Average Generation rate (L/pig/day) Large - - 10 Medium 15 Small 20 BOD (mg/L) Large 1,255 9,000 3,000 Medium 460 7,650 2,500 Small 239 19,280 1,500 COD (mg/L) Large 2,152 18,388 7,000 Medium 2,578 31,096 6,800 Small 778 40,000 4,000 SS (mg/L) Large 1,304 9,530 4,800 Medium 149 14,500 3,000 Small 82 1,887 2,000 TKN(mg/L) Large 367 981 540 Medium 235 3,371 500 Small 261 24,480 400 Source: Pollution Control Department (2005)

69
Figure 4.25 Piggery farming and wastewater treatment In 2000, the Department of Livestock set up the appropriately pig farming development project. To establish the pig waste treatment system of the pig farms in the region of Bangpakong River Basin and Thachin River Basin. Chachoengsao provincial livestock office was responded to develop the system to 106 pig farms in Chachoengsao Province. Anaerobic filter tank and Stabilization pond system are designed into 4 types and selected the appropriate to the size of farm. The study area has one farm of pilot project developed under the National Energy Policy and Planning Office. The promotion of biogas production in animal farm project, phase II for small scale. The biogas system (fixed dome) is funded and implemented by Bureau of development and technology transfer, Ministry of Agriculture and Cooperative. The pilot farm is situated in Banpho district, which recently operate and produce biogas in household using. Table 4.14 Biogas parameters of 1 pig (approximately weight 60 kg)
Description Value Unit
Wastewater generation 27 L/day Biogas production 93 L/day Organic fertilizer (liquid) or; 0.36 kg/day Organic fertilizer (solid) moisture content 35%
0.12 (safety~0.10 kg/day)
kg/day
Source: Energy for Environmental Foundation (2007) From the above information of Table 4.14, the estimation of total production of biogas from pig farm of the whole study area is calculated. The potential biogas production capacity is approximately 35,200 m3/day due to it mentioned from the total of 379,000 pigs. • Poultry farm The amount and distribution of duck, broiler, and layer in the study area of 5 districts is showed in the Table 4.15. The most of poultry farming presented in Banpho district with the intensively of the layer to produced eggs. The cultivation batch of chicken and duck are 45 and 55 days. The cage mostly constructed in single cage (1-2 chicken per one small cage) with row of bars and lifted the cage in the

70
second floor. Some chicken farm constructed over the fish pond, so the manure directly discharge to the fish pond as a fish feed. The building style mostly is gable proof and prepared 2,000 chicks/building. The cage cleaning operated everyday to collect the fresh solid and sale to the dealer to distribute for agriculture farmer and fertilizer plant in the province. The manure of chicken mostly solid part and one chicken produces manure about 7% of chicken weight. Table 4.15 Distribution and size of poultry farm in the study area
Number of poultry farm District Duck Broiler Layer
Total
Muang Chachoengsao 1 4 30 35 Bangkhla 15 3 8 26 Bangnamprieo 0 1 39 40 Bangpakong 0 0 4 4 Banpho 42 20 35 97 Total farms 58 28 116 202 Total Number (1,000 birds) 149 659 5,164 5,971 In the year 2003, Chachoengsao province was badly affected areas during that initial outbreak of bird flu. So the farm have to moves to protect poultry through costly bio-security measures have finished off small-time breeding in this province, which has a mix of industrial estates, paddy fields and open, tree-filled areas that are substituted occupation to these poor farmers. Nearly 1,200 small poultry farms have been forced to shut down, because they failed to meet the new bio-security measures. To prevent the spreading of avian influenza in this area, Bureau of Livestock Standard and Certification, the monitoring program are being implemented regularly in this area. Department of Livestock, responses to following the Ministerial Notification issues in Thailand Livestock Farming Standard 1999. This issue establishes for 3 standards of broiler, swine and milch cow, in order to quality improvement on animal products and farms to complied and meet the national standard and safety for the consumer. It is the voluntary program and cooperative from farmer, the certificated farm can obtained the special service in veterinary process. The scope of standard regulation of chicken farm is broadly about appropriate of solid and chicken waste management. The pig farm standard is regulated in appropriate waste treatment due to solid waste, carcass pig, pig manure and wastewater. • Fish cultivation Aquaculture in Chachoengsao Province also important in terms of it is the major source of protein feed in this central region. The Province has both fresh water and marine aquaculture. According to the appropriate of features of the land such as Bangpakong River is the major stream is suit to the fresh aquaculture in Bangnamprieo, Bangkhla, Muang, Banpho and empting into the upper gulf of Thailand (Bangpakong estuary). The types and number of aquaculture farms in the study area is showed in the Table 4.16. The most aquaculture farming in the area is brackish shrimp (low salinity shrimp). The Black Tiger Shrimp is popular cultivated about 71% of total aquaculture area. The well-liked area of shrimp farms are situated in Bangpakong, Banpho and Muang. However,

71
there has some fish hatchery along the coast in Bangpakong and Muang District. The number of wholesaler and dealer of aquatic animal are 59 entrepreneurs. The wholesaler is playing a major role to distribute the fish and shrimp from farm to the market at Bangkok and peri-urban provinces. Table 4.16 Types and number of aquaculture and registered farm
Aquaculture Types Number of farm Area (Hectare) Brackish shrimp 13,189 15,565 Fresh fish 3,484 5,823 Brackish fish - Pond 81 281 - Pen 180 7 Others (Frog, Crocodile) 150 81 Total 17,084 21,757 The shrimp farming is widely cultivated in the province, according to the spread of new technique of low saline tiger shrimp cultivation and high value of shrimp in the market. The rapid emergence of low salinity shrimp farming within inland freshwater areas has risen. The pollution from low salinity shrimp farm can be divided in 3 types; effluent during shrimp cultivation, effluent during harvesting, and sludge discharge. Larger shrimp require substantial feed inputs and more frequent water exchanges to maintain a suitable growing environment. Uneaten food pellets, faeces, and eroded pond soil tend to accumulate at the center of the pond. The open system of shrimp pond generated the high pollution of untreated wastewater. Wastewater discharge from shrimp cultivation and harvesting two cycles in one year, the wastewater discharge is shown in the Table 4.17. Table 4.17 Wastewater discharge from shrimp cultivation and harvesting
Parameter One cycle Whole Year (2 cycles)
Unit
Wastewater generation 288 576 m3/ha BOD loading 192 384 kg/ha TKN loading 0.12 0.23 kg/ha Salinity 3-10 ppt Wastewater treatment is operated in some shrimp farm before discharge to the water bodies. Most of the wastewater was directly discharged from the open system pond, while the close system has not the effluent from farm. In addition, the fish farm wastewater is approximated values with shrimp farm but it has not salinity in wastewater. The pollution from shrimp farming is the one source of degradation to the water quality of Bangpakong River and cumulative effect to this region. The Department of fisheries established the voluntary program of Thai quality shrimp in the schemes of Code of Conduct Standard (COC) and Good Aquaculture Practice Standard (GAP). However, these programs are in the earlier stage of developing and promoting.

72
4.3 Rice based Eco-Industrial network Based on the earlier part, the rice-based eco-industrial network of the study area can be developed to close the loop of natural resource consumption and environmental impacts. The actual linkages between the studied of rice-based industries and other sector unit involved the complex flow of material inputs and outputs of by-products and waste is presented in the Figure 4.26.

73
Figure 4.26 Actual Rice-based Material Flow Network in the study area
Water bodies
Industrial & Municipal solid
waste
Open dump/
burning
WW 1.2x10⁶ m3
WW 0.15x10⁶ m3
Water bodies& Environment
WW 3.7x10⁶ m3
Rice Mill (N=82)
3,763 KT
Power Plant (N=2) 13.4 MW
Rice Noodle/ Vermicelli
(N=17) 62 KT
Rice Bran Oil Extraction Industry (N=1) 14.6 KT Oil
Paddy 1,633 KT
Process in-use
Animal Feed Industry
(N=20) 250 KT Farm made feed
Fish Pond 8.1 KT Fish
Agricultural Land
Poultry 955x103 birds
Pig Farm 379x103 pigs
Organic Fertilizer Manufacture (N=5) 10 KT White Rice Mill
3,329 KT Parboiled Mill
434 KT
Market
Defatted Bran 51.1 KT
Bark 1.75 KT EGAT
Cooling water Steam
Electricity
Steam
(Chicken cum fish)
Manure
Manure
Ash 11 KT
Paddy (Other region)
(56% of paddy)
(12% of paddy)
(7.8 % of paddy)
(22.2% of paddy)
(Need husk) 61.5 KT
(3.3% of broken rice)
(70% of bran)
(Need bran) 73 KT
Broken Rice 452 KT
Rice Bran 294 KT
Husk 835 KT
Noodle scraps 4 KT

74
Figure 4.27 Rice-based Material Flow of Agro Eco-Industrial Network
Rice Mill (N=82)
3,763 KT
Power Plant 642 GW
Rice Noodle/ Vermicelli
(N=17) 62 KT
Rice Bran Oil Extraction Industry (N=1) 14.6 KT Oil
Paddy 1,633 KT
Process in-use
Animal Feed Industry
Farm made feed 250 KT
Fish Pond 8.1 KT Fish
Agricultural Land
Poultry 955x103 birds
Pig Farm 379x103 pigs
Organic Fertilizer Manufacture (N=5) 10 KT White Rice Mill
3,329 KT Parboiled Mill
434 KT
Market
Defatted Bran 51.1 KT
Bark EGAT
Steam
Electricity
Steam
(Chicken cum fish)
Manure
Manure
Ash 150 KT
Paddy (Other region)
(56% of paddy)
(12% of paddy)
(7.8 % of paddy)
(22.2% of paddy)
(3.3% of broken rice)
(70% of bran)
(Need bran) 73 KT
Broken Rice 452 KT
Rice Bran 294 KT
Husk 835 KT
Anaerobic WWTS Biogas 6.2x10³ m3
Industrial & Municipal solid
waste
Recycling firm/ Sanitary
Landfill
WW 1.2x10⁶ m3
WW 0.15x10⁶ m3
Anaerobic Digester Biogas 12x106 m3
Legend: Product/by-product Solid waste Wastewater KT = Kiloton
Noodle scraps 4 KT
WWTS& Reuse

75
4.4 The calculation explanation of material flow network All the summarized data from previous part and the calculated information in this part facilitated to explain the formation of Agro Eco-Industrial Network of rice-based industry. The yearly production capacities of each type of industries that presented in the studied area are used in network to find out their presents production situation. The number and calculation value are presented in Table 4.18. Table 4.18 Number of each types of factory in Network of the study area
Type of industries
Number of Industrial related to Rice-base EIN in 5 Districts
Production Capacity per one
industry (Tons/year)
Whole industries (Tons/year of paddy)
Rice Mill: Parboiled mill White Rice mill
82 7 (170 t/d of product)
75 (120 t/d of product)
62,050 43,800
3,763,150434,350
3,328,800Noodle/vermicelli 17 (10 t/d of product) 3,650 62,050Seed Oil Extraction 1 (42 t/d of product) 15,330 15,330Wood shaved 21 - -Organic fertilizer 5 2,000 10,000Maize/soy bean powder
2 30 60
Animal feed mill 20 50 1,000Small Power Producer 2 10.4MW+3MW -Total 151 Rice Production, are averaged from the information on the relation of power of machine production and Rice production of several industries in the 5 districts. The production capacity of rice mill is used the paddy consumed in production. The by-products composition of rice mill is calculated from the rice mill reference established. The production capacity number of other industries in the network is used from the field survey. The production of industry also depended on the raw material (some sector demand is higher than supply), then the raw material has to imported from other regions such as paddy, husk. Agriculture and livestock is the role of organic waste recycling firm for the agro-industry, that they obtained the entire biodegradable residue in appropriate used from each type of industrial by-products and waste. The purposed material network is showed in Figure 4.27. The proposal of new linkages to close the cycle of this AEIN are Biogas digester both rice noodle production and livestock especially piggery farm. The overview of technologies and environmental management is presented following this part.

76
4.5 Technology needs for EIN formation Most of the small businesses in the region are driven by raw material availability and income generation than for increasing markets. Therefore the need to shift to advanced technologies has not yet been considered by the entrepreneurs. The following technologies are essential for the transformation to an eco-industrial cluster. Paddy straw and Rice Husk The transformation of the rice cluster as a part of an eco-industrial could be achieved by making the best possible use of the materials. These agricultural residues, paddy straw and rice husk could be used to generate electricity for in-house consumption or for exporting to the grid. For example, the 15 MJ/kg of energy potential of rice straw is used for thermal energy generation. This could be more efficiently used to generate electricity and save budgets on importing fossil fuels in addition to the environmental benefits. Energy consumption in rice mills varies depending on whether the mill produces parboiled rice or white rice, while the parboiling consumes more energy. The energy required for the rice mill can be obtained from the utilization of the husks. In many mills, rice husk is burned under very low efficiency furnaces leaving black ash with high percentage of unburned carbon. Assuming that all rice husks are utilized for power generation, and a specific consumption of 2 kg/kWh the theoretical power potential is considerable that it cannot be put to any simple use. Nevertheless, a consistent and stable supply of paddy for milling and rice straw is essential to establish and operate the electricity generation system. Therefore, the size of the individual mill and its supply chain are key factors in determining the feasibility of generating power. An alternative use of Rice Husk Ash, with 85-90% silica content, rice husk ash can be used in the in the production of special cement and concrete mixes, high performance concrete, high strength, low permeability concrete for use in bridges, marine environments, power plants etc. Rice Processing Units The rice processing units in the region are typically small and medium enterprises with limited funds and relatively intermediate technology. Some industries have been using superior technologies, most of them are limited to improving productivity, reducing energy and raw material consumption, and increasing profits. Little industries have implemented waste recovery or wastewater treatment systems. Therefore, the principle of Cleaner Production and Technology should be applied to increasing production efficiency with environmental concern to each enterprise such as rice mill, rice noodle industry.

77
Essential technologies for rice processing industries include recovery of starch from wastewater and biogas wastewater treatment systems. Some research has been carried out in the production of ethanol from rice processing wastewater. Piggery The piggery sector in the study region has been following various innovative and modern industrial farms. However, all these have been formulated and implemented in improving productivity. Very little is focused on waste disposal issues and environmental concerns. Integration of waste handling and treatment systems in the business is essential to favor growth and sustainability. Anaerobic digestion of piggery waste has been widely tried and tested in many countries across the world. The piggery sector needs to be familiarized with this technology as a means of reducing cost through parallel businesses of electricity generation from biogas generated in anaerobic digesters. The digestate and wastewater resulting from the digestion process can be used as organic fertilizer in agricultural fields. Poultry The open dumping of this poultry litter releases huge amounts of methane due to uncontrolled anaerobic digestion. Technology for high rate bio-methanation is essential in this region to recover resources. 4.6 Policies This part deals with the existing industrial environmental policy framework that enterprises are set in. The actors and different of organizations play in the industrial development and environmental management are described. The policy network is involving of the rice-based processing in the province, also described by the roles of actors and policy situation at different level. That focusing how they can push towards a balanced concept of eco-industrial network. 4.6.1 Government administration system in Thailand The Royal Thai Government’s administration includes three levels: Central, Regional, and Local (Suwanmala, 2002) as shown in Appendix. The provinces ruled by provincial governors and districts by district chiefs. The organizations have the different respect to their operational frameworks. However, there have operated to comply with the NESDB plans and closely linking between organizations. The organizations can divided into many sections, nevertheless this research focused in the policies related to the industrial, environmental, economic and social that related to Agro Eco-Industrial Network (AEIN) as shown in Figure 4.28.

78
Figure 4.28 Policies affected to Agro Eco-Industrial Network The environmental problems resulting from pressures are imposed by rapid industrialization and urbanization and also economic growth. Thus, the country has high potential to achieve sustainable development. The Thai Government has established a policy for industrial development and sustainable use of natural resources. The frameworks of industrial approach to environmental policy are established in the national economic and social development plans and other governmental agencies. This framework is now being translated into specific actions and projects at the local, national and international levels. Institutions responsible for policies and strategies can be identified as major direct government agencies and indirect agencies that are in charge of various aspects as shown in the Figure 4.29. The institutional who affected to the other economic parts that linked in the AEIN also including explored.
AEIN
Industrial Development
policies
Energy policies and
other policies
Environmental policies
Agricultural policies
Economic policies
Social development
policies
Clean Development Mechanism
policies

79
Figure 4.29 Local Administrative Organization affected to AEIN
Chachoengsao Provincial Governor
Provincial Industrial Office
Natural Resource and Environmental
Office
Department of Agricultural Promotion
Department of Livestock
Community Development Department
Department of Fishery
Provincial Energy Office
Provincial Skill Development
Center
Office of the Basic
Education Commission
Provincial Land Development
Center
Department of Internal
Trade
Department of Business
Development
Provincial Public Health
Office
Office of Public Work and Town
and Country Planning
- Organic Farming Association - Provincial Rice mill Association - NGOs

80
4.6.2 National Level The Thai government is composed of the Prime Minister’s office and 19 ministry’s offices and under this have departments which carry out the actual implementation of policies (Thai Government, 2007). These major agencies have formulated policies, strategies and plans such as following;
The National Economic and Social Development Board (NESDB) is responsible for formulating overall development policies, strategies, plans, targets and guidelines for the industrial sector.
The Ministry of Industry (MOI) is responsible for factory licenses, industrial regulations, and enforces laws giving industrial zones and estates. It also provides technical assistance, management training for the industrial sector.
The Ministry of Finance (MOF) is responsible for taxes, duties and levies imposed on industries. It is also responsible for policies on tax concession to industrial development.
The Board of Investment (BOI) is responsible to provide or facilitate industrial infrastructure for investors, it also offers incentives to investor such as one stop services.
The Ministry of Commerce (MOC) has controlled prices and international trade. The Industrial Finance Corporation of Thailand (IFCT) offer credit medium and
large scale firms through government and private sector channels. The Bank of Thailand (BOT) provides foreign exchange and rediscount facilities to
selected industries and exporters. The Industrial Estates Authority of Thailand (IEAT) offers industrial estates and
infrastructure for investors and also responsible for managing industrial estates. These institutional have formed the National industrial Committee which duty and function to formulate and supervise the industrial sector. They are responsible for coordination and implementation process in policies, strategies, plans and works. The NSDB is the core agency that provides the studies and analysis to back up the planning of macro and sector plan. All the government agencies have to follow up this plan to achieve the development goal of nation. Other indirect institutional also indicated to support the development policies, in order to formulate and implementation of policies, strategies and plans. The indirect agencies are describing the major department under ministries and its role and function in Appendix. Recently, The Royal Thai Government and its 9th NESDB (2002-2006) emphasis six industrial policies as follows;
Restructure the industrial sector and promote investment consistent with the national targets and development strategies, while taking into consideration the country’s natural resources, traditional and proven Thai skills and local knowledge, potential in the area of production and marketing, and the need to strike a balance between utilization of domestic or imported raw materials.
Promote the development of basic industries and linkages with related supporting industries.
Development skilled personnel and labor in the industrial sector inline with future industrial development strategies. Support measures to increase value added in

81
industrial production. Promote and develop production processes that are of a high standard, pollution free or low environmental impact, while ensuring transparency and efficiency in management.
Develop small and medium-size industries to play a significant role in the development of the country’s industrial sector by supporting and promoting cooperation in research and development of technology and product among the public and/or private and educational institutions as well as the creation of an information network concerning production and marketing factors.
Promote the role of financial institutions by supporting the establishment and operations of a venture capital fund as well as facilitated for guaranteeing credits for the development of small and medium-size industries.
Support the growth of new entrepreneurs in small and medium-size industrial business in the new knowledge based economy.
Figure 4.30 Action Plans for the 9th NESD Plan: Drive on Cluster development • Industrial Policy Therefore, the MOI formulated four policies to supporting these policies from NESDB for 2 national industrial policies;
Provide assistance to reduce production costs in industrial plants through consulting services by improving production process and management, reduce energy cost, save energy and use alternative energy.
Develop capacity of personnel both in the public and private sectors in the fields of modern production technology, environmental management, industrial safety and the adaptation of international standards i.e. ISO 9000, ISO 14000, ISO18000 and HACCP to be ready for the adaptation towards the new economy and supporting new economy and supporting new small and medium entrepreneurs towards the knowledge-based economy.
Create a strong social
foundation
Develop cluster based economy consistent with
regional economic potentials, preferences, and
functions
Strengthen networks (social and business) linking rural and urban areas
Establish economic clusters linking rural and urban areas
Strengthen grassroots economies to provide sustainable incomes for the rural people
Establish linkages between rural and urban development

82
Encourage measures to increase value-addition to industrial products and increase productivity in the industrial sector in the competition and sustainable development.
Supervise factories with high risk and pollution, then encourage them to relocate in industrial estates, reduce industry’s hazardous wastes by not less than 50% as well as promote the implementation of appropriate technology by focusing on quality of environment and safety in industrial plants such as improving standard on air pollution management, keeping air pollution control within standard, imposing strict measures for business which is the source of pollution and promoting clean production so that local authorities can jointly supervise factories through transparent and efficient management system.
Implementation of policy needs several of policy tools and instruments Organization such as Public enterprise, Public services, Taxation, Commercial, Financial, Procurement, Legal and regulatory, Political, Scientific and technical, Information, Education and Oversee agent. The respective government agencies are responded to introduce and set up these tools of policy to support the agro-industry, the organizations such as POM, NESDB, BOI, MOI, MOSTE, MOF, MOC, MOE, MOAC and MOL. The regulatory measures always used by laws, acts, and regulations for supporting industrial policies which are linking to the network. The hierarchy of laws is as follows; 1) The Constitution; 2) Acts, passed by the Parliament and 3) Regulations and Notifications enacted by the respective Ministries. The main regulations putting integrated into the industrial sector are following this. Example of regulatory and law of rice mill is presented in Appendix as a case of incorporated law using in rice base industry.
The Factory Act, B.E. 2535 (1992); MOI has created the ministerial rules that every factory under this act must comply and respect to the standards, location, methods, documentation, etc.
Enhancement and Conservation of National Environmental Quality Act, B.E. 2535 (1992)
The Hazardous Substances Act, B.E. 2535 (1992) The Public Health Act, B.E. 2535 (1992) Foreign Business Act, B.E. 2542 (1999)
Department of Industrial works The department implementing the government service system capability development plan by providing the organization to the industrial business operators and the people. The agency responses to the service works such as; Machine registration, Industrial environment technology, Hazardous substances control, Factory control and inspection, Industrial registration, Safety technology, and Information center for industrial management and development. There has own policies to support the industrial sector in;
Supervise and coordinate industrial business operation activities by following the guidelines of environmental preservation, safety, hygiene and energy economization
Promote and support the capability and efficiency development of industrial business operation for sustained development

83
Serve as the national information center for industrial works, machines, chemical substances, hazardous substances and volatile substances
Look after the country’s interests in international agreements regarding environment, safety and security
Department of Industrial Promotion The department is the agency under Ministry of Industry, the leading of SMEs promotion and development, and responsibility to follow the guideline of MOI and Nation plan to involving their own policies to support the industrial sector. The policies are as followed;
Encouraging investment in SMEs by; transferring knowledge to rural entrepreneurs, providing advice and incubator service, promoting use of consultancy fund for developing SMEs in rural area, carring the career training for cottage and handicraft to local, and providing investment loans for them.
Encouraging the dispersal of urban industries to rural areas by; preparing the industrial feasibility studies, stimulating to investors, and providing information service for new entrepreneur.
Establishing industrial networks by; promoting rural industries in form of community industries, promoting linkages between large and small industries, coordinating with government financial agency for loan.
Promoting investors in highly potential industrial sectors and enhance the competitiveness of Thai industries by; Encouraging investment in and developing technological of SME supporting industries, and undertaking activities according to the master plan for the development of supporting industries.
Enhancing the competitiveness of export-oriented industries. The cluster development project was initiated following the SME promoting, the DIP’s project aimed to developing mechanisms for sustainable cluster development. The piloted projects of three industries are selected, based on the concentration and distribution in area, impact to the economy, consistency with national policies and criteria. The one major project is of Food processing cluster in the Bangkok and peri-urban areas, the strategies of cluster development are exchanging their views, brainstorming, set up the common goal and vision, developing the business by increasing their capacity in terms of economic, innovation, production technology, and human resource. Board of Investment Policy Board of Investment suppose it appropriate to adjust Thai investment promotion policies and criteria for granting tax privileges in order to respond to the current and future economic and investment situation. The Board of Investment Announcement No. 1/2536 Re: Policies and Criteria for Investment Promotion and they prescribes the following policies and criteria for investment promotion;
Every promoted project that has investment capital of 10 million baht and upwards (excluding land and working capital) must obtain ISO 9000 certification or similar international certification. This is to promote development of quality and production standards in Thai industries and, thereby, to enhance the competitiveness of Thai industry in the world market.

84
Special promotion shall be given to regions or areas with low income and inadequate investment facilities. Maximum tax and duty privileges shall be given to these regions or areas.
Importance is given to small and medium industries by applying a minimum level of investment capital of 1 million baht (excluding cost of land and working capital) for projects eligible for promotion.
Priority is given to activities in agriculture and agricultural products, projects related to technological and human resource development, public utilities and infrastructure, environmental protection and conservation and targeted industries.
Criteria for Project Approval
In determining the suitability of a project for which investment promotion privileges are requested, the Board of Investment applies the criteria: the environmental criteria are also used for a project with investment capital (excluding cost of land and working capital) not exceeding 500 million baht, such; Adequate environmental protection systems are installed. For projects with a potential environmental threat, the Board shall prescribe special conditions on both the location of the project and the manner of pollution treatment. Investment Zones and Criteria for Granting Tax and Duty Privileges
Zone 1; Approved projects located in Bangkok, Nakhon Pathom, Nonthaburi, Pathum Thani, Samut Prakan and Samut Sakhon shall be granted. Zone 2; Approved projects located in Kanchanaburi, Chachoengsao, Chon Buri, Nakhon Nayok, Ayutthaya, Phuket, Rayong, Ratchaburi, Samut Songkhram, Saraburi, Suphanburi and Ang Thong shall be granted
Zone 3; Approved projects located in the remaining 58 provinces shall be granted.
All the zones are designed due to the consideration of supporting industrial investment promotion policies, to enhancement and promoting development to the regions and industrial setting up in the industrial estate zone. Priority Activities
The Board places priority on promoting the following types of projects: Agriculture and agricultural products Direct involvement in technological and human resource development Public utilities and infrastructure Environmental protection and conservation Targeted industries
The projects will be entitled to the following privileges:
Exemption of import duty on machinery regardless of location Corporate income tax exemption for eight years, regardless of location Other privileges entitled for each Zone
• Environmental Policy The Ministry of Science, Technology and Environment (Recently, reforming to be Ministry of Natural Resource and Environment) is the body in charge of dealing with environmental issues in Thailand, through the environmental law “Enhancement and

85
Conservation of National Environmental Quality Act 1992”. MOSTE, immediately after this law created 3 new departments in charge of environmental works; the Office of Environmental Policy and Planning (OEPP), The pollution Control Department (PCD) and the Department of Environmental Quality Promotion (DEQP). National Environmental Board (NEB) presided by the Prime Minister, with the permanent secretary of MOSTE as the NEB’s secretary. The policy and plans are then carried out by the OEPP, with part funding from the Environmental Fund. Pollution monitoring and control is performed by the PCD, which proposes the pollution discharge limits or pollution discharge standards, to the pollution Control Committee and the NEB. The approval limits are then announced by MOSTE. The main policy for Enhancement and Conservation of National Environmental Quality for 1997-2016 consists of the following elements:
Policy on Natural Resources Policy on Pollution Policy on Natural and Cultural Environments Policy on Community Environment Policy on Environment Education and Promotion Policy on Environmental Technology.
These issues of managing environmental quality are followed to the vision of; firstly, Natural resources are the base for SD, then utilization of these for economic development purposes is based on conservation and social justice. Secondly, administration and management of environmental quality are decentralized to be effective, with power being transferred from central offices to local institutions. Thus, all government agencies, the private sector, NGOs and local institutions can participate in formation of policy and planning and monitoring program. The last, people have awareness and are willing to work together to protect, and rehabilitate environmental quality. • Clean Development Mechanism Policy The status of CDM has beginning from Thailand in the international climate change scene. Thailand signed the Kyoto Protocol on 2 February 1999 and ratified it on 28 August 2002 (Jessie, 2007). The significance of the ratification for Thailand is that it could eventually claim the full benefits from CDM projects when the Kyoto Protocol enters into force. The government of Thailand issued a Cabinet Resolution on 1 July 2003 establishing the MONRE as the CDM designated national Authority (DNA). Also, included in this resolution are the establishment of the National Committee on Climate Change (NCCC) and the National CDM Advisory Board (NCAB). The DNA unit will look at CDM projects with respect to satisfying sustainable development criteria, environmental impact assessment, and public participation. Also the unit will have an information center that caters to CDM investors and other stakeholders. Major issues of GHG emissions of more than two-thirds of the total net emissions are CO2 with methane accounting for 27%. CO2 emissions come mainly from the energy sector and it has increasing trends from 1990 to 1998. These indicate that huge opportunities for GHG mitigation are found in the energy sector. In addition, Thailand’s plans and programs in sustainable energy development are probably more advanced than other ASEAN countries,

86
particularly in the areas of energy efficiency and green independent power production or electricity production from new renewable energy sources. The least-cost options in the energy sector that will contribute to further reductions in GHG emissions (ADB, 1998), the mitigation options were found to have net economic benefits and significant in Thailand as following this:
Improving efficiency of existing facilities Adopting more energy efficient techniques in new capital stock Utilizing low emissions energy sources cogeneration in industrial sector increase in oil boiler efficiency in industrial sector application of efficient motors in industrial sector utilizing or switching to cleaner fuels
Through the CDM and international emission trading schemes, emission reductions generated from energy projects can be sold and carbon sales would provide additional cash inflows to the project to cover a portion of financing requirements. The strongest CDM candidates in Thailand are green IPP projects and power plant projects that are using renewable energy sources or wastes and designed to sell to the grid. • Power Generation Policy Electricity Generation Authority of Thailand (EGAT) is the sole body responsible for the generation, transmission and distribution and sale of electricity in Thailand. Realizing the threats to the national energy security, however, EGAT allows private promoters, technically referred to as Independent Power Producers, to establish and operate power generation projects and buys the electricity at nominal rates. The power generation sector is usually categorized under the large scale business and is subject to significant investment and market risks. Nevertheless, the EGAT has also realized the power generation potential from biomass sources and allows generation at relatively smaller scales under special arrangements known as Small Power Producers (SPP) and Very Small Power Producers (VSPP). Table 4.19 presents an overview of the concessions for SPP and VSPP in Thailand.
Table 4.19 Small and Very Small Power Purchase Agreements in Thailand
Small Power Producers Very Small Power Producers Co-generators or facilities using renewable energy fuels,
Sell power to EGAT of not more than 90 MW for each project.
Minimum purchase guarantee – not less than 80%
Allows direct sale to industrial estates near the power plants
Installed capacity of less than 1 MW
Agricultural residues and wastes from agro industries (e.g. rice husk)
Products converted from agricultural residues, and wastes from agricultural or industrial production processes. (e.g. tapioca wastewater)
Municipal waste: RDF, Bio-methanation
Source: EPPO, 2007

87
The Renewable Portfolio Standard (RPS) is a flexible, market-driven policy that can ensure that the public benefits of wind, solar, biomass, and geothermal energy continue to be recognized as electricity markets become more competitive. The policy ensures that a minimum amount of renewable energy is included in the portfolio of electricity resources serving a state or country, and by increasing the required amount over time the RPS can put the electricity industry on a path toward increasing sustainability. Thailand aims to increase renewable energy production of 0.5% in 2002 to 8% in 2011 by following RPS of 5%. Accordingly, new power plants need to generate 5% energy from renewable sources (solar, wind, biomass, solid waste and hydropower). Renewable Portfolio Standard, an innovative power purchase policy. Essentially, power generators under these special arrangements use biomass and biomass residues as fuels for power generation. In most cases, combined heat and power generators utilize the thermal energy and part of the generated electricity for in-plant purposes and sell the excess to EGAT. • Eco-industrial development policy The Industrial Estates Authority of Thailand has starting Eco-Industrial Estate that provided the vision for the development as “To apply the eco-industrial concept as the main strategy for future Thai industrial estate development” with the objective “to reduce the environmental impact and enhance business and social performance using the EIE principles, then expand to be come Eco-industrial Network and develop a stable and lasting industrial estate network for the nation”. The pilot projects are set in the plan and they are located in 5 industrial estates;
Map Tap Phut Industrial Estate will serve as the key case for Eco-forum, Eco-plant, Eco-industrial estate and Eco-networking,
Bang Poo Industrial Estate will serve as the center of implementing the "Clean & Clear" concept using environmental management measures, including Cleaner Technology, Green Productivity, EMS/ISO 14001 etc.
Northern Region Industrial Estate (Lampoon) will serve as the center for waste management with emphasis on adding value and exchange of waste/by-products.
Eastern Seaboard Industrial Estate will serve as center for water management Amata Nakorn Industrial Estate will serve as center for labor management
Eco-Industrial Estates refers to a group of production and service business operators seeking to raise standards of environmental quality, business performance and good relationship with neighboring communities through collaboration on natural resource and environmental management. Eco-development concerning industrial estates has focuses on the values and perceptions of the local population to improve the basic needs of the human welfare. 4.6.3 Policy Network The policy network involving in the agro-based industry in Chachoengsao province, are also described in Figure 4.29. The relationship and linking between Central and Local Administration of the policies are in the vertical link. The Provincial Governor plays the important role as the center oversees the government organization. All the government office such provincial, districts, sub-districts and villages are locates in the province. The Provincial Governor has conveyed the Chachoengsao Provincial Development Strategies

88
from the Regional Development Strategies, set up by the group of 5 provinces in the eastern region are; Chachoengsao, Samutprakarn, Srakaew, Nakhonnayok, and Prachinburi. Their strategic master plan of the group is based on the 9 key issues of National Development Strategies. The Provincial Development Strategies are adopted to be use for each province. All of the Provincial governments, both of local organization and provincial departments have to adopt to integrated and guided for their strategic plan. Chachoengsao Provincial Development Strategy (2005-2008) is composed with 4 issues;
Urban planning and logistic system development to be served the urbanization of Bangkok metropolitan and Suvanabhumi airport with high capability.
Promotion of tourism of Province, both natural and cultural place. Enhance the efficiency of natural resource conservation and environmental
protection. Promote Agro industry production and Agriculture to the world market, with the
food safety without toxic and industrial polluting. In the case of AEIN, Chachoengsao Provincial Industrial Office is the major agency to oversee the industrial development. All of the industrial establishment and new industry in the province need the consideration and allowance according to the industrial and other laws regulate to each types of industry. The Provincial Industrial Office has mostly duty to following on their major responsibility such as; control and monitoring of industrial and hazardous waste, registering of industrial machinery, environmental health and safety in the industry, coordination and promotion the industrial and SMEs development, investment, and ISO initiative in industrial sector. The Policy and Planing Section is planning the industrial development policies by consistent with the MOI and its department policies, also Provincial policy. Working with other organizations and supporting their implementation due to assigned responsibility. However, in reality these are most activities conducted by Department of Industrial Works. The number of officials in charge of provincial industry is limited about 20-25 for all 3 sections. The Provincial Natural Resource and Environmental Office is the main actor in affected to the AEIN formation. To oversee the environmental and natural resource issues, one responded regional level organization located in the province. However, their function is under the Permanent Secretary of Ministry Office of MONRE. The Provincial Office works with linking to the Regional Environmental Office 13, with the responding in the regional agency to overcome the environmental management in eastern region. Therefore, the function and duty of both Regional and Provincial Environmental Offices are reasonably and similar but different scale of implementation. However, they are working with linking coordination. The responsibility of Provincial Natural Resource and Environmental Office is described following this;
Following the implementation plan under Regional Environmental Office 13 has developed.

89
Obliged the Report of provincial environmental situation to the higher level such regional and MONRE.
Working with coordination, monitoring, and evaluation on environmental plan and measures done in the province.
Develop the environmental database and information system of the province. Consultation and education service of environmental management knowledge and
measures. Environmental quality monitoring and control. Enhancement cooperation and environmental network, also promotion to public
relations. Promotion the appropriate environmental technology and management to adapted
with the local community. The industrial environmental management policy in the local level, mostly are responded by the Provincial Industrial Office. However, the Provincial Environmental Office played as the supporting agency such as complaining case occurred, industrial project development concerning environmental issue. Recently, the position of the Office still presents as the undersized unit of the Provincial Forestry Office Building, due to the small number of Environmental official working. In addition, there have linking government agencies to affected the AEIN development in the regional and local level. Those have related activities that unavoidably overlap and they situated and function under the province as the Provincial Department Offices. The major names and their related activities are listed below:
Department of Agricultural Promotion, Ministry of Agriculture and Cooperative (MOAC) helps farmer groups to create income by food and non-food processing of agricultural produce.
Department of Livestock, MOAC, assists farmers in to have higher production capacity by transfer the research and develop information, technology to the farmer. Implementing on animal health, breeding, environmental and animal sanitation. Mainly, regulator under livestock epidemic law, improving animal varieties, controlling animal feeding and nursing enterprises and controlling the rabies epidemic.
Department of Fishery, MOAC, overlooks and promotes fishery businesses starting from harvesting to finish product manufacturing.
Provincial Public Health Office, Ministry of Public Health, responses to development of holistic public health service, to promote health prevention and disease control, health care and recuperate for people. Enhance and promote the Public health networks towards sustainable development.
Provincial Energy Office, Ministry of Energy, overlooks the environmental and safety of oil fuel and natural gas of private enterprises. Follow and function the energy policies from Regional Energy Center.
Community Development Department, Ministry of Interior, it supports the Self-Sufficiency Theory to be adapted in local economy, develop the community leadership, local organization and empowerment. Develop the community management system and network that they can be self organized. And build the community information supported.

90
Social Security Office, Ministry of Labor, and Provincial Skill Development Center. These organization help to protect the labor security and compensation, promotion and development labor and worker livelihood.
Office of the Basic Education Commission, Ministry of Education, oversees the basic education system and school and development educational capacity and build the educational attitude to the student and teacher, also administrator level.
Department of Internal Trade and Department of Business Development, Ministry of Commerce help the local entrepreneurs and local business in order to licensed, accounting and tax, promotion and development local community business. Accelerate the provincial business development and export, active provision of agricultural product for farmer. Enhance competitiveness of SMEs, and community business.
Chachoengsao Land Development Center, Ministry of Agriculture and Cooperative (MOAC), and Office of Public Work and Town and Country Planning, Ministry of Interior, study and planning to the appropriate land and development to solve the land problems in local. Planning, guiding and following the regulations to manage the area zoning and land application.
These government organizations can be supporting and linking work, for minority responsible duty of each other. Purposing to support the provincial policies and planning. However, these institutional need to be linking actors to the local level administration in district, sub-district and villages. Chachoengsao has totally 22 municipalities, and 91 Sub-district Organization Administration and one of the Provincial Administration Office. Generally, local government functions may be classified into 3 types: statutory, optional and those specified by other legislation. The laws that establish each particular form of local government specify functions. All forms of local government perform similar functions. However, urban local governments perform more complex services than rural local governments. The following specification of local government functions is based on those of urban local governments such as following this; Statutory functions:
Maintenance of law and order Provision of public transport Provision of sanitary services (water supply, waste disposal, sewage and drainage) Provision of fire engines Prevention and control of communicable diseases Provision of slaughterhouses Provision of public health services, welfare for mothers and children Provision and maintenance of public recreation space and facilities Provision of primary education.
Optional functions:
Provision of market places, ports and ferry services, crematoriums, hospitals, public utilities, parks, zoos and recreation areas as well as sport facilities.
Provision of vocational training and promotion of citizen’s occupation Improvement of slum dwellings Maintaining government enterprises

91
Considering the above functions, the scope of local government function is very limited. Rural local government functions are further limited by the overlap of authority between that of local government and provincial administration. Many functions at the level of local government are performed by the central government, that departments extend their operations into the provinces. For example; this includes the department of public works, the country and city-planning department, the department of public health and the revenue department. This leads to confusion and also obstructs the development and growth of local government. 4.6.4 Concluding Remark From the above explored part of major institutional, actors, and policies. Those can be affected to the favor and hamper to the industrial development and Agro Eco-Industrial Network in the region. In addition, the entrepreneur’s attitude and administrative officer also summarized to investigate the policies and implementation. The explore situation of the related policies and prospective planning can be concluded as following this; • National level, the central government formulated the industrial policies as top-down
administration to implementation. It specified only economic growth and some of social equity, but less incorporated to the environmental protection aspect. However, the overview of industrial development, environmental protection and other policies has initiative policies and strategies towards sustainable development, thus the government has opening to the long term perspectives.
• Ministry level, the main focusing of the national industrial policies has emphasized in economic growth. However, the implementation policies and strategies have less leaded to act in environmental protection. The implementation of regulation may not be strengthening in command and control of their duties.
• Local level, the information from the field study could help the existing situation of policies implication in the regional development. The perspective of entrepreneurs from several sectors could helped to investigated the final conclusion such as following this;
The environmental problems are the major issues in Provincial Strategic Planning, due to several deterioration of natural resource and environmental problems facing. Because the weakness of command and control regulation implementation from the local actor and organizations in the province. In addition, the speedily developments with not strengthen planning of mega project, structure, industrial and services, and agriculture are forced to the natural revival capacity.
The labor has to be increasing the skill and supporting educational to provide for industrial growth. However, the indigenous knowledge and local development projects should be support in technical and policies from the local administration such as Organic farming that still constraint to the other policies (such import of inorganic fertilizer and complete system company).
The incomplete of access to market such information, incomplete of statistical data from small and medium industries and farmers comparing to the large industries and contracted farms. So, these enterprise are obstructed in supporting and development both technology and finance supporting.

92
The absence of regional initiative to encourage the industrial development and the need of joint public and private development master plan for the regional scale.
The unstable condition and market price of agricultural and agro-processing products due agricultural environment and cultivation system. The standardization of products has to be improved and certified for competition and export.
Recently, the Strategic Planning of Provincial has developing to solve these situations from the joint and cooperation by whole administration levels and local people to cope and develop their Province. • The industries and entrepreneurs studied in the region, by their nature and scale of
operation, they fall into the Small and Medium Enterprises category. The need and potential of its SMEs and has made strong policies in accelerating their growth, and improving national economy after economic crisis. Various institutions have been formed to foster the growth of SMEs. The Province is classified under Investment Zone 2 of the Thai Investment Promotion Zones. New industrial activities in these regions qualify for the following fiscal discounts:
100% waiver of import duty on machinery for industries in estates. 50% waiver for industries outside the estate. Corporate income tax exemption for 7 years for industries within industrial estate
and 3 years outside the estate. Exemption on import duty for raw material for 1 year in both cases.

93
Chapter 5
Conclusions and Recommendations
Chachoengsao Province is one of the less urbanized and industrialized regions of the country evidenced by the presence of traditional agro industries. The eastern districts of the Province also are the fringe areas of the Bangkok urban. There has the natural condition favored for economy development and availability of labor promotes agriculture as a majority occupation. This research aimed to exploring the possibility formation of Agro Eco-Industrial Network on rice-based industry. The conclusions are presented following this; 5.1 Conclusions 1. In this case study, the focus is on the networking of two major different sectors of rice-based industry and agricultural farming to yield better environmental and economic results. The study analyzed the potentials of creating a network of agro industrial sectors in solving environmental problems. The uncontrolled discharge of waste and wastewater from rearing and processing operations into the waterways are the major issue. Consequently, that high organic matter is generated in the study area could be treated and utilized by Small-scale biogas generation systems and Biogas as fuel for cooking or industrial heat and power generation. Both of rice industry and piggery farming could be obtained biogas 12 million m3/year, while reducing BOD loading 8,200 tons/year to the water bodies and environment. Moreover, increasing the resource efficiency of the entire system also is advantaged from creating network by waste and by-product exchange. Agricultural and agro industrial residues are high calorific value with high potential to produce electricity 642 GW/year from rice husk biomass. Small-scale biomass power and decentralized power generation systems are important technology advancements. 2. The material flow in the rice and livestock clusters of Chachoengsao indicates the potential for its transformation to an eco-industrial network. Introduction of technologies are essential for a successful transformation. Appropriate policy development considering all related issues of the eco-industrial cluster and rightly integrated with national and local development priorities is essential. 3. The main strength points of eco-industrial network are the creation of new business that utilize disposed resources as raw materials-rice husk/biomass power generation; piggery waste biogas. As well as increase competitiveness of business by reducing production costs; cost reduction in waste disposal and income generation through resource recovery from waste. 4. Current national policies are encouraging – Environmental, Agricultural, Investment promotion, Power Generation. There has special emphasis on rural-urban linkages in the NESDB plan. Also, Agro industries in the regional have gained prominence in the NESDB plan with an importance on EIN.

94
5. Barriers to Eco-Industrial Cluster are concluded below; • Lack of appropriate technologies prevents full resource recovery and complete reuse
between the existing network. • The industrial sectors studied are unique in their kind and do have certain
characteristic. However, the age of technology in use and Cleaner Technology in the sector is assumed to be a major barrier in its transformation.
• The disjointed linkages between and within business units reduce the opportunities for cooperation and have collective benefits.
• Though all individual policies are attractive, no separate policy adequately addressing all issues in a holistic way exists. The overlapping and inappropriate implementation and monitoring levels of the government organization to development policies, this affected to environmental management responsibility.
• The concept of Industrial Ecology is still unfamiliar to the actors, institutional and policy makers. The opening phase of concept used in the country, it is only in the investigation process and limited pilot project.
6. The industrial profile of the Province clearly indicates the role of agriculture and livestock in regional development. Both agriculture and livestock are resource dependent. The agriculture sector is a major resource consumer, while the livestock is a major source of pollution. This feature needs the function of organization and specific planning to integrating and well coordinating from several actors for better sustainable development. 7. Inter-firm and intra-firm linkages play an important role in the transformation to an eco-industrial network. It is through these linkages that the various benefits of sharing resources and their associated environmental and social gains realized. Local community networking and business association should be supported and promoted to participation. This is build a joint public/private committee and meeting in regional development. 5.2 Recommendations for further study 1. To study cost-benefit of waste recycling/recovery techniques. Also evaluation in terms of the benefit gains of each proposal environmental friendly industries, to link with the social suitable. 2. The network linkage between the industries need to be examined and investigated in order to the strengthen connection. Due to this research is marked force, there need well planning for future development. The selected case study of industry may be mentioned to the different case such scale, individual/group of enterprise. 3. The proximity and re-locating industries were not concerned when formed the network, for future study it is need to be mentioned. 4. The application of Geographic Information System from Natural Resources and Environmental data based would be adopted for the future study, due to its implications of data linkages in spatial scale.

95
References Asian Development Bank (ADB). (1998). Asia Least-cost Greenhouse Gas
Abatement Strategy: Summary Report. ADB Manila. ISBN No. 971-561-186-9.
Allenby, Braden R. and Richards, Deanna J. (1994). The Greening of Industrial Ecosystems. National Academy of Engineering. National Academy Press. Washington, DC. ISBN-10: 0-309-04937-7.
Ayres, R. U. and Simonis, U. E. (1994). Industrial metabolism: Restructuring for Sustainable Development, United Nations, University Press. ISBN 92-808-0984-9.
Board of Investment (BOI). (2006). Industrial Investment Promotion Policy. Retrieved 18 September, 2006 from http://www.boi.go.gh
Chachoengsao Province. (2006). Provincial Strategic Planning. Retrieved 20 September, 2006. from http://www.chachoengsao.go.th
Chachoengsao Provincial. (1996). Chachoengsao: City of Prospects. Bangkok. TCG Printing.
Chiu, S. Y. and Peters, B. (1994). Industrial Pollution Prevention, Asian Development Bank Report.
Cohen-Rosenthal, E. and McGalliard, T.N. (2003), Eco-Industrial Development: the Case of the United States. Retrieved March, 2006. from
http:// www.jrc.es/iptsreport/vol27/english/COH1E276.htm
Department of Industrial Production (DIP). (2006). Industrial development policy and statistical information. Retrieved 19 January, 2007 http://www.smethai.net/en/
Deog-Seong O., Kyung-Bae K. and Sook-Young J. (2005). Eco-Industrial Park Design: a Daedeok Technovalley case study. Habitat International, 29, 269–284.
Douglass, M. (1995). Global Interdependence and Urbanization: Planning for the Bangkok Mega-Urban Region. In McGee, T. G. and Robinson, I. W., The Mega-Urban Regions of Southeast Asia, pp. 45-76. Canada: UBC Press
Food And Agriculture Organization Of The United Nations (FAO). (1998). FAO Regional Wood Energy Development Programme in Asia, Field Document No.52. Retrieved 4 September, 2006. from http://www.rwedp.org
Frosch, R. A. and Gallopoulos, N.E. (1989). Strategies for manufacturing. Managing Planet Earth, pp. 97-108.
Gertler, N. and Ehrenfeld, J.R. (1996). A Down-to-Earth Approach to Clean Production. Technology Review, February-March, pp. 48-54
Graedel, T. E. and Allenby, B. R. (1995). Industrial Ecology. New Jersey : Prentice Hall. ISBN 013-046713-8.
Inyang, H. I., Terezinha Ca´ssia de Brito Galvão and Helene Hilger. (2003). Waste recycling within the context of industrial ecology. Resources, Conservation and Recycling 39, 1-2

96
Khan, F. I., Natrajan, B. R., Revathi, P. (2001). GreenPro: a New Methodology for Cleaner and Greener Process Design. Journal of Loss Prevention in the Process Industries, 14, 307-328.
Kirchner, E. (1995). Eco-Industrial Park Find Growing Acceptance. Chemical and Engineering News, 20, 15
Lowe, Ernest A., Moran, Stephen R., and Warren, John. (1997). Discovering Industrial Ecology: an executive briefing and sourcebook. Battelle Press Cleveland, OH.
Lowe, E.A. (1997). Creating By-products Resource Exchanges: Strategies for Eco-Industrial Parks, J. Cleaner Production, 5(1-2): 57-65
Lowe, Ernest (2001). Eco-Industrial Park Handbook for Asian Developing Nations: A Report to Asian Development Bank. Environment Department, Indigo Development, Oakland, CA. Retrieved 23 August, 2006. from http://www.indigodev.com/Handbook.html
Manahan, S. E. (1999). Industrial Ecology: Environmental Chemistry and Hazardous Waste. Lewis Publishers.
Nagle, G. and Guinness, P. (2004). The nature of the rural-urban fringe. Retrieved 6 August, 2006. from http://www.geocases.co.uk/default.htm
Oldenburg K. U. and Geiser K. (1997). Pollution prevention and…or industrial ecology. Journal of Cleaner Production, 5, 103-108.
Panyarachun, Anand. (1996). H. M. The King and the Environment. Retrieved 10 August, 2006. from http://www.anandp.in.th/en_speech/e010202.pdf.
Public Relations Department (PRD). (2006). Information of the country. Retrieved 25 September, 2006. from http://thailand.prd.go.th/the_inside_view.php?id=1373
Roberts, B. H. (2004). The application of industrial ecology principles and planning guidelines for the development of eco-industrial parks: an Australian case study. Journal of Cleaner Production 12, 997–1010.
Sriroth, Klanarong. (2005). Outlook of Biomass Utilization as Biofuel in Thailand. Biomass-Asia Workshop. Tokyo, Japan. 19-21 January 2005. Retrieved 11 August, 2006. from http://www.cassava.org/Pub/2005.htm
Sundhagul, Malee and Atthasampunna, Poonsook. (1983). Bioconversion of carbohydrate residues in Thailand. Bangkok Microbiological Resources Centre (MIRCEN). Retrieved 8 August, 2006, from
http://www.unu.edu/unupress/unupbooks/80362e/80362E0a.htm
Suwanmala, C., 2002. Fiscal Decentralization in Thailand. International Workshop on Intergovernmental Fiscal Relations in East Asia. January, 2002. Bali, Indonesia.
Tanticharoen, Morakot. (2000). Thailand: Biotechnology for Farm Products and Agro-Industries. In G. J. Persley and M. M. Lantin (eds), Agricultural Biotechnology and the Poor: Proceedings of an International Conference, Washington, DC.
Thai Government. (2007). Thailand: Ministries and responsibility service. Retrieved 5 February, 2007, from

97
http://www.thaigov.go.th/th/service/Ministry.aspx?M_CODE=76&M_NAME=หนวยงานภาครัฐ&menu=3
Thailand Health Profile. (2000). Thailand Health Profile 1999-2000. Ministry of Public Health. Retrieved 7 September, 2006. from http://www.moph.go.th/ops/thealth_44/
Thailand Investor Service Center (TISC). (2006). Industrial development policy. Retrieve 2 November, 2006 from http://www.thailandoutlook.com/thailandoutlook1/govrnment+policy/Government+policy+Update/SMEs+Policy.htm
Thailand Investor Service Center (TISC). (2007). Thai Government Policy: SME policy. Retrieved 16 March, 2007. from http://www.thailandoutlook.com/thailandoutlook1/government+policy/Government+Policy+Update/SMEs+Policy.htm
Tibbs, C.B. Hardin. (1992). Industrial Ecology: An Environmental Agenda for Industry, Pollution Review. Spring, pp. 804-806.
Todoc, L. Jessie. (2007). CDM in Thailand: Status and Policy Issues. Retrieved 5 May, 2007. from http://cdmasean.pelangi.or.id/countrypapers/cp-thailand.pdf
Tran Thi my Dieu. (2003). Greening Food Processing Industry in Vietnam: Putting Industrial Ecology to work. Wagningen. Wagningen University. ISBN 90-5808-825-1
Wikipedia. (2006). Map and Profile of Chachoengsao Province. Retrieved 30 August, 2006 from http://en.wikipedia.org/w/index.php?title=Chachoengsao_Province&oldid=50779432
United Analyst and Engineering Consultant Co., Ltd. (2000). Final Report: Survey and study for an establishment of nuisance standard for Offensive Odor, Dust and Noise from Rice Mill Factories. Bangkok.
World Bank (1986). Environmental Guidelines; Environment Department. Retrieved August 5, 2006, from http://ces.iisc.ernet.in/energy/HC270799/HDL/ENV/enven/ vol235.htm
World Health Organization. (2004). World Health Report 2004. Retrieved 5 August, 2006, from http://www.who.int/whr/en
World Health Report. (2004). World health statistic and profile. Retrieved 4 October, 2006. from http://www.who.int/whr/en/

98
Appendix A
Questionnaire

99
Questionnaire Survey on Agro Industries in Chachoengsao Province
Interviewer: Ms. Niranchana Authayanraksa Graduate Student, Environmental Engineering and Management
1. Name and address of the industry?
2. What is your main product?
3. How much do you produce? (Choose any one)
a. Per Year :
b. Per Month :
c. Per Week :
d. Per Day :
4. What are the raw materials?
a. _______________________Quantity_____________________Price______
b. _______________________Quantity_____________________Price______
c. _______________________Quantity_____________________ Price_____
d. _______________________Quantity_____________________Price______
e. Water consumption: _________________ Price__________
f. Electricity Consumption:__________________ Price__________
5. What are your by-products?
a. _______________________Quantity____________________Price_____
b. _______________________Quantity____________________Price_____
c. ______________________Quantity____________________Price______
d. ______________________Quantity___________________ Price_______
6. What are the waste streams?
a. Solid:_______________________ Quantity_____________________
b. Solid:_______________________ Quantity_____________________
c. Solid:_______________________ Quantity_____________________
d. Liquid /Effluent:_______________________ Quantity_________________
e. Liquid /Effluent:_______________________ Quantity_________________
f. Liquid /Effluent:_______________________ Quantity_________________
7. How do you dispose the waste? Sell / open dumping /Exchange

100
8. Is there a possibility of recycling/reusing the waste?
a. If not, why?
b. If so, is it done?
i. At what price do you sell the waste?
ii. Who buys your waste?
iii. How is it used?
9. How many people work in your industry?
10. Does the number of people working depend on season or work requirement?
a. If it depends on other factors. Please explain why and how
11. What is the ownership of you industry?
Individual / Family Owned / Registered Small Scale
12. Were any permissions / license required to start this business?
a. If so from which departments?
i. _____________________
ii. _____________________
iii. _____________________
iv. _____________________
13. Did those departments support you in any way? (For example, by giving any financial support, market support, tax benefits, etc)
14. Do you have any association of industries like yours?
a. If so what are the main activities of the association?
b. Are they helping to solve any problems faced by the industries?
15. Does your industry involve in any social upliftment activity?
a. If so, What are they?
b. If not, don’t you think, industries consume public goods and hence have a social responsibility? What is your opinion?
16. What do you think has the Government done to improve industries like your’s? Do you have any specific suggestion to be made to the Government?

101
แบบสอบถามขอมูลดานการจัดการของโรงงานอุตสาหกรรมเกษตร ผูสัมภาษณ: น.ส.นิรัญชนา อุทยานรักษา นักศึกษาปริญญาโท สาขาวิชาวิศวกรรมและการจัดการสิ่งแวดลอม คําชี้แจง: 1. แบบสอบถามแบงออกเปน 4 สวน ดังนี ้ สวนที่ 1) ขอมลูทั่วไปของสถานประกอบการ สวนที่ 2) ขอมลูกระบวนการผลิต สวนที่ 3) ขอมลูวัสดุเหลือใช ของเสียจากการผลิตและการจัดการ สวนที่ 4) ความคิดเห็นของสถานประกอบการ 2. กรุณาตอบทุกคําถาม และคําตอบของทาน ผูดําเนินการศึกษาถือเปนความลับ โดยจะไมมีการเปดเผยไมวากรณใีด โดยจะนําขอมูลไปใชเฉพาะในการศึกษาเทานั้น
สวนท่ี 1) ขอมูลท่ัวไปของสถานประกอบการ 1. ช่ือสถานประกอบการ.......................................................................................................................................... 2. ที่อยูโรงงานเลขที่................................หมู........................ซอย......................ถนน................................... ตําบล.........................................อําเภอ...............................จังหวดั.......................รหัสไปรษณีย................. โทรศัพท....................................โทรสาร......................................E-mail.................................................... บุคคลติดตอช่ือ....................................................................โทรศัพท........................................................... ตําแหนง............................................................................... 3. ประเภทอุตสาหกรรม............................................................................................................................. ดําเนินกิจการมา.....................ป ลักษณะความเปนเจาของ ธุรกิจสวนตัว ธุรกิจครอบครัว (ประมาณ 30 ป) บริษัทรวมทุน 4. สัดสวนการขายสินคา: ตลาดภายในประเทศ.........................%, ตลาดตางประเทศ.........................% 5. จํานวนพนกังานทั้งหมด.........................คน: ชาย...................คน, หญิง......................คน 6. ชวงเวลาการทํางาน.............วัน/สัปดาห วันละ..............กะ กะละ...............ช่ัวโมง 7. สถานที่ตั้งของสถานประกอบการ มีชุมชนตั้งอยูในรัศมี 50 เมตร มีชุมชนตั้งอยูในรัศมี 50-100 เมตร มีชุมชนตั้งอยูในรัศมี 100-500 เมตร มชุีมชนตั้งอยูในรัศมีมากกวา 500 เมตร

102
สวนท่ี 2) ขอมูลกระบวนการผลิต 8. ชนิดของวัตถุดิบที่ใชในการผลิต 8.1 วัตถุดิบหลัก 1).............................................ปริมาณ......................ตัน/วัน, ราคา.....................บาท/ตัน
2).............................................ปริมาณ......................ตัน/วัน, ราคา.....................บาท/ตัน3).............................................ปริมาณ......................ตัน/วัน, ราคา.....................บาท/ตัน
8.2 วัตถุดิบรอง 1).............................................ปริมาณ......................ตัน/วัน, ราคา.....................บาท/ตัน2).............................................ปริมาณ......................ตัน/วัน, ราคา.....................บาท/ตัน3).............................................ปริมาณ......................ตัน/วัน, ราคา.....................บาท/ตัน
8.3 อ่ืนๆ .................................................ปริมาณ......................ตัน/วัน, ราคา.....................บาท/ตัน 9. ชนิดของผลิตภัณฑ 9.1 ผลิตภัณฑหลัก 1)..........................................ปริมาณ......................ตัน/วัน, ราคา.....................บาท/ตัน
2)..........................................ปริมาณ......................ตัน/วนั, ราคา.....................บาท/ตัน 3)..........................................ปริมาณ......................ตัน/วนั, ราคา.....................บาท/ตัน
9.2 ผลิตภัณฑรอง 1)...........................................ปริมาณ......................ตัน/วัน, ราคา.....................บาท/ตัน (By-products) 2)..........................................ปริมาณ.......................ตัน/วัน, ราคา.....................บาท/ตัน
3).........................................ปริมาณ.......................ตัน/วนั, ราคา.....................บาท/ตัน ขายตอใหกับสถานประกอบการประเภท................................................
...................................................................................................................................................................... 10. ระยะเวลาการทํางาน.....................ช่ัวโมง/วัน, .....................วัน/เดอืน 11. การใชพลังงานและเชื้อเพลิงในโรงงาน
พลังงานไฟฟา ปริมาณ.......................... กิโลวัตต/เดือน หรือ ............................บาท/เดอืน น้ํามันเชื้อเพลิง ปริมาณ.......................... ลิตร/เดือน หรือ .............................บาท/เดือน ลิกไนต ปริมาณ.......................... ตัน/เดือน หรือ .............................บาท/เดือน กาซธรรมชาติ ปริมาณ.......................... ลบ.ฟุต/เดือน หรือ .............................บาท/เดือน พลังงานชวีภาพ (เชน แกลบ, ฟน, เศษไม, ไบโอกาซ ฯลฯ) ระบุ......................................................
ปริมาณ.......................... ลบ.ฟุต/เดือน หรือ .............................บาท/เดือน อ่ืนๆ ปริมาณ.......................... ./เดอืน หรือ .............................บาท/เดือน
12. แหลงน้ําทีใ่ชในโรงงาน 1).............................................ปริมาณน้ําทีใ่ช.................ลบ.เมตร/เดือน หรือ.....................บาท/เดือน ใชในการ............................................................................................................................................... 2).............................................ปริมาณน้ําทีใ่ช.................ลบ.เมตร/เดือน หรือ.....................บาท/เดือน ใชในการ...............................................................................................................................................

103
3).............................................ปริมาณน้ําทีใ่ช.................ลบ.เมตร/เดือน หรือ.....................บาท/เดือน ใชในการ............................................................................................................................................... 4) อ่ืนๆ................................................................................................................................................. 13. โปรดอธิบายกระบวนการผลิต หรือ แนบแผนผังประกอบ
สวนท่ี 3) ขอมูลวัสดุเหลือใช ของเสียจากการผลิตและการจัดการ 14. ประเภทของเสียที่เกิดจากกระบวนการผลิต
ประเภท ปริมาณ (ตัน/เดือน) วิธีการจัดการ/กําจัด ของเสียและขยะ 1.
2. 3. 4. 5. ของเหลวหรือน้ําเสีย 1.
2. 3.

104
15. สาเหตุที่ไมมีการกําจัด (เลือกไดมากกวา 1 ขอ) ไมมีความจําเปน ปริมาณของเสียมีนอย กําลังศึกษาและออกแบบ
ไมมีเงินลงทุน เสียคาใชจายในการกําจดัสูง(...........บาท/เดือน) ขาดเทคโนโลยีที่เหมาะสม ขาดแคลนเจาหนาที ่ อ่ืนๆ............................................
16. ของเสียของบริษัททานสามารถนําไปรีไซเคิลหรือใชประโยชนใหมหรือสงไปใหสถานประกอบการอ่ืนไดหรือไม ได โดยขายตอใหกับ...............................................................................................................
นําไปใชเพื่อ.........................................................................ราคา...................................... ไมได เนื่องจากสาเหต ุ
ของเสียมีปริมาณนอย ไมมีแหลงรองรับ ไมทราบวาโรงงานใดตองการ ไมมีหนวยงานประสานงานเพื่ออํานวยความสะดวก เสียคาใชจายสูง
สามารถใชประโยชนภายในโรงงานได อ่ืนๆ......................................................................................................................................... สวนท่ี 4) ความคิดเห็นของสถานประกอบการ 17. การเขามาทํางานของพนกังานขึ้นอยูกบัฤดูกาลหรือตามที่โรงงานตองการแรงงานเปนชวงๆหรือไม ไม (พนักงานทํางานตลอดทั้งป) ใช เนื่องจาก.............................................................................................................................. 18. บริษัทของทานตองมีการจดทะเบียนหรือไดรับอนุญาตในการจดัตั้งหรือดําเนินกิจการหรือไม ไมตองจดทะเบียนหรือขออนุญาต ใช โดยไดรับอนุญาตจากหนวยงานราชการใดบาง (โปรดระบุทั้งระดับจังหวดัและทองถ่ิน) 1)............................................................... 2)............................................................... 3)............................................................... 19. หนวยงานราชการไดมีการชวยเหลือและสนับสนุนธุรกิจของทานหรือไม อยางไรบาง โปรดระบุ(ตัวอยางเชน เงินทุนสนับสนุน, ดานภาษี, การตลาด, เทคโนโลยี ฯลฯ) ...................................................................................................................................................................... ...................................................................................................................................................................... ...................................................................................................................................................................... 20. บริษัทของทานไดมีเขารวมสมาคม การรวมกลุมหรือเปนสมาชิกในกลุมผูประกอบการประเภทเดียวกัน หรือไม

105
20.1 ช่ือกลุมหรือสมาคมที่เขารวมและจดุประสงค/กิจกรรมหลักที่ดําเนนิการของกลุมสมาชิก 1)ช่ือ...........................................................................กิจกรรมหลัก............................................. ....................................................................................................................................................... 2)ช่ือ........................................................................................กิจกรรมหลกั................ ....................................................................................................................................................... 3)...................................................................................................................................................
20.2 ทางสมาคมมีสวนรวมในการสนับสนุนและแกปญหาของกลุมผูประกอบการไดอยางไรบาง .............................................................................................................................................................................................................................................................................................................................................................................................................................................................................................
21. บริษัทของทานมีสวนชวยเหลือและสนบัสนุนในดานของชุมชนและสังคมหรือไม ไมมีสวนรวม เพราะ
................................................................................................................................... มีสวนรวม อยางไรบาง
......................................................................................................................................................................
...................................................................................................................................................................... 22. ทานตองการใหรัฐบาลปรับปรุง ชวยเหลือ และสนับสนุนสถานประกอบการของทานในดานใด อยางไรบาง ....................................................................................................................................................................................................................................................................................................................................................................................................................................................................................................................................................................................................................................................................................................................................................................................................................................................................................................................

106
Appendix B
Production process

107
Figure B1. Biomass Power Plant Production Process Diagram
Electricity sale to customer and EGAT
Silo Open area storing
Sedimentation tank and filtering
Water feeding tank
Oil Tank
Mixer Boiler
50 ton/hr 35 Bar 400°C
Clarified
Diesel Air
Rice husk
Bark from WCO
Sand
Tap water Deminerization Chemical
River water
Chemical
Chemical
Air pressure Air
ESP
Ash silo
Turbine Electricity generator
Condenser
Cooling from Bangpakong River Air monitoring
Used sand
Ash for sale/ land reclamation
Treated air

108
Appendix C
Thai Standards Table C1. Thai Classification and Objectives of Surface water quality

109
Classification Objectives/Condition and Beneficial Usage
Class 1 Extra clean fresh surface water resources used for : (1) conservation not necessary pass through water treatment process require only ordinary process for pathogenic destruction (2) ecosystem conservation where basic organisms can breed naturally
Class 2 Very clean fresh surface water resources used for : (1) consumption which requires ordinary water treatment process before use (2) aquatic organism of conservation (3) fisheries (4) recreation
Class 3 Medium clean fresh surface water resources used for : (1) consumption, but passing through an ordinary treatment process before using (2) agriculture
Class 4 Fairly clean fresh surface water resources used for : (1) consumption, but requires special water treatment process before using (2) industry
Class 5 The sources which are not classification in class 1-4 and used for navigation.
Table C2. Surface Water Quality Standards (major parameters)
Standard Value for Class
Parameter Units StatisticsClass1Class2 Class3 Class4Class5
Methods for Examination
Temperature C° - n n’ n’ n’ - Thermometer
pH - - n 5-9 5-9 5-9 - Electrometric pH Meter
Dissolved Oxygen (DO)2/ mg/l P20 n 6.0 4.0 2.0 - Azide Modification
BOD (5 days, 20°C)mg/l P80 n 1.5 2.0 4.0 - Azide Modification at 20°C , 5 days
Total Coliform Bacteria MPN/100
ml P80 n 5,000 20,000- - Multiple Tube Fermentation Technique
Fecal Coliform Bateria MPN/100
ml P80 n 1,000 4,000 - - Multiple Tube Fermentation Technique
NO3 -N mg/l - n 5.0 - Cadmium Reduction
NH3 -N mg/l - n 0.5 - Distillation Nesslerization

110
Remark:
P Percentile value
n naturally
n' naturally but changing not more than 3°C
* when water hardness not more than 100 mg/l as CaCO3
** when water hardness more than 100 mg/l as CaCO3
Source: Notification of the National Environmental Board, No. 8, B.E. 2537 (1994), issued under the Enhancement and Conservation of National Environmental Quality Act B.E.2535 (1992) , published in the Royal Government Gazette, Vol. 111, Part 16, dated February 24, B.E.2537 (1994).
Based on Standard Methods for the Examination of Water and Wastewater recommended by APHA: American Public Health Association, AWWA: American Water Works Association and WPCF : Water Pollution Control Federation. Table C3. Thai Industrial Effluent Standards
Parameters Standard Values Method for Examination
1. pH value 5.5-9.0 pH Meter
2. Total Dissolved Solids (TDS)
not more than 3,000 mg/l depending on receiving water or type of industry under consideration of PCC but not exceed 5,000 mg/l not more than 5,000 mg/l exceed TDS of receiving water having salinity of more than 2,000 mg/l or TDS of sea if discharge to sea
Dry Evaporation 103-105 °C, 1 hour
3. Suspended solids (SS)
not more than 50 mg/l depending on receiving water or type of industry or wastewater treatment system under consideration of PCC but not exceed 150 mg/l
Glass Fiber Filter Disc
4. Temperature not more than 40°C Termometer during the sampling
5. Color and Odor not objectionable Not specified
6. Sulphide as H2S not more than 1.0 mg/l Titrate
7. Cyanide as HCN not more than 0.2 mg/l Distillation and Pyridine
Barbituric Acid Method
8. Fat, Oil & Grease (FOG)
not more than 5.0 mg/l depending of receiving water or type of industry under consideration of PCC but not exceed 15.0 mg/l
Sovent Extraction by Weight
9. Formaldehyde not more than 1.0 mg/l Spectrophotometry
10.Phenols not more than 1.0 mg/l Distillation and 4-Aminoantipyrine Method

111
Parameters Standard Values Method for Examination
11.Free Chlorine not more than 1.0 mg/l lodometric Method
12.Pesticides not detectable Gas-Chromatography
13.Biochemical Oxygen Demand (BOD)
not more than 20 mg/l depending on receiving water or type of industry under consideration of PCC but not exceed 60 mg/l
-Azide Modification at 20 °C , 5 days
14.Total Kjedahl Nitrogen (TKN)
not more than 100 mg/l depending on receiving water or type of industry under consideration of PCC but not exceed 200 mg/l
Kjeldahl
15.Chemical Oxygen Demand (COD)
not more than 120 mg/l depending on receiving water of type of industry under consideration of PCC but not exceed 400 mg/l
Potassium Dichromate Digestion
16.Heavy metals
1. Zinc (Zn) not more than 5.0 mg/l
2. Chromium (Hexavalent) not more than 0.25 mg/l
3. Chromium (Trivalent) not more than 0.75 mg/l
4. Copper (Cu) not more than 2.0 mg/l
5. Cadmium (Cd) not more than 0.03 mg/l
6. Barium (Ba) not more than 1.0 mg/l
7. Lead (Pb) not more than 0.2 mg/l
8. Nickel (Ni) not more than 1.0 mg/l
9. Manganese (Mn) not more than 5.0 mg/l
Atomic Absorption Spectro Photometry; Direct Aspiration or Plasma Emission Spectroscopy ; Inductively Coupled Plama : ICP
10. Arsenic (As) not more than 0.25 mg/l
11. Selenium (Se) not more than 0.02 mg/l
Atomic Absorption Spectrophotometry; Hydride Generation, or Plasma Emission Spectroscopy; Inductively Coupled Plasma : ICP
12. Mercury (Hg) not more than 0.005 mg/l Atomic Absorption Cold
Vapour Techique
Source: Notification the Ministry of Science, Technology and Environment, No. 3, B.E.2539 (1996) issued under the Enhancement and Conservation of the National Environmental Quality Act B.E.2535 (1992), published in the Royal Government Gazette, Vol. 113 Part 13 D, dated February 13, B.E.2539 (1996)

112
Appendix D
Government Institutional and Regulations

113
Figure D1.Administrative structure of the Royal Thai Government
Central Administration Local Administration
The Parliament
Independent Agencies
The Cabinet
The parliament
Ministries Office of the Prime Minister
Ministries of Interior
Departments and State Enterprises
Department of Local
Administration
Provincial Governor
Regional Administration
Provincial Departments and State Enterprises
Provincial Department of Local
District Departmens
District Head
Region all units
Bangkok Metropolitan
Administration
Provincial Administrative Organization
Provincial Governor
Sub-district Administrative Organization
Provincial Governor
114
D2. The Ministry of Industry's Policy Guidelines The Ministry of Industry is an agency responsible for the promotion and development of industry, mineral resources and energy. The Minister has set up policy guidelines covering the period between 2001-2006 in compliance with the 9th National Economic and Social Development Plan, the policy of the present administration and the Ministry's role and mission as follows:
Short-term emergency measures 1. Coordinate with relevant agencies to set up the action plan for " one tambon, one product " projects so that each community can use its local knowledge and potential to develop its products with support from the Ministry of Industry in terms of technology, production technique, management and marketing in view of linking the community's products to both domestic and foreign markets through the chain-store system. 2. Jointly set up the SME Bank to solve liquidity problems in the industrial sector by restructuring the management of the Small Industry Finance Corporation (ISFC) with emphasis on the increase of cash flow and reduction of interest rates and ownership registration of machinery to be used as asset to increase capital, thus providing assistance to existing entrepreneurs as well as opportunity and choice of financial sources to new entrepreneurs so as to create and maintain production base, employment, income creation and export. 3. Provide assistance to reduce production costs in industrial plans through consulting services so as to improve production process and management, reduce energy cost, save energy and use alternative energy. 4. Support measures to solve liquidity problems of the industrial sector by promoting the ownership registration of machinery to be used as asset for loans, cooperating with commercial banks to provide credit to SMEs, accelerating management restructuring, increasing branches and increasing capability to analyze credit as well as reducing interest rates of the Small Industry Finance Corporation (SIFC). 5. Expedite tax restructuring program to reduce production costs and disadvantages of Thai industry's competitiveness. 6. Modernize laws on factories and industrial standards to facilitate industrial entrepreneurship. 7. Expedite the implementation of the Industrial Restructuring Plan in terms of production, management and marketing so as to yield real and continuous results. 8. Develop capability of personnel both in the public and private sectors on the fields of modern production technology, environmental management, industrial safety and adoption of international standards such as ISO 9000, ISO 14000, ISO 18000 and HACCP to be ready for the adaptation towards the new economy and supporting new small and medium entrepreneurs towards the knowledge-based economy. 9. Set up measures to alleviate the impact of and get ready for free trade under the agreements of WTO, AFTA and other economic groupings as well as encourage the private sector to share information on trade, investment and analysis on the impact of agreements in the framework of international cooperation agreements.
Long-term measures 1. Restructure production in the industrial sector and promote investment in compliance with the objective and strategy of the country's development, taking into account natural resources, skill, local knowledge, potential in production and marketing as well as the balanced use between local raw materials and dependence of import.

115
2. Promote the development of basic industry and linkage of continuous industry having continuous results on the production restructuring of the industrial sector as well as promote, support and develop mineral-based economy and basic industry to strengthen industry's linkage system. 3. Strengthen the industry with potential to develop and with high knowledge-and-skilled base, by promoting Thailand as the world's source of quality food production and processed agro-industrial products. 4. Develop SMEs as an important factor in the country's industrial development by supporting and promoting cooperation in R&D of products and technology among the government, the public sector and the academic institutions and creating IT network on production factor and marketing as well encouraging SMEs to do business in e-commerce. 5. Promote the role of financial institutions and the setting up and implementation of venture capital funds as well as credit guarantee in order to develop SMEs by setting up SME Business Plan to have access to credit sources and increase credit for individual SMEs as deemed necessary. 6. Encourage measures to increase value-added to industrial products and increase productivity in the industrial sector in view of competition and sustainable development by which the total factor productivity growth of the industrial sector is not less than 2.5% per annum as well as increase network and process to develop main factors which are conditions of success in productivity such as HRD and increased competitiveness in science and technology. 7. Promote industrial development in local, communal and regional areas to create business with strong management system leading to development of sustainable quality management by developing local job groups, promoting production of Thai products, creating brand name for local products as well as encouraging system to manage industrial land in the form of industrial estates in the areas having potential to be developed as the country's economic area, by encouraging the private sector to take part in establishing industrial estates and encouraging entrepreneurs to locate their factories in industrial estates. 8. Promote sub-contract and production linkage among industrial groups for mutual support and technology exchange and linkage between strong community business and industry business as well as setting up industrial groups capable of exchanging natural resources and being partners (industrial clusters). 9. Supervise industrial factories with high risk and pollution and encourage them to relocate to industrial estates, reduce industry's hazardous wastes by not less than 50% as well as promote the implementation of appropriate technology by focusing in quality of environment and safety in industrial plants such as improving standard on air pollution management, keeping air pollution control within standard, imposing strict measures for business which is the source of pollution and promoting clean production so that local authorities can jointly supervise industrial factories through transparent and efficient management system. 10. Link the Industrial IT system and rules and regulations on trade and export between the capital and the regional areas including local authorities to create early warning system and serve as information for adaptation in the fast-changing situations. 11. Accelerate the establishment of independent institutes to support industrial development in various sectors such as wooden product and furniture institute, pharmaceutical and chemical institute, ceramic institute and plastic institute. 12. Promote and expand cooperation in the fields of industry and investment with foreign countries including neighboring countries to form partnership in trade, economic and social

116
development and to draw up development plan for the whole country with process to continuously assess the development. D3. Table of Structure and Linkages of Government agencies both direct and indirect
in formulation and implementation of policies, strategies and plans: Related to
Industrial Development
The supervision of seven major direct governmental agencies Level Organization/
Ministry Department/Division/Agencies Roles and Function
National Economic and Social Development Board (NESDB)
Policies, Strategies and Plans; Plans of 1st to 10th
Nation Prime Minister’s Office; Governmental Policy
The Board of Investment (BOI) Plans, Policies, Service, Consultant, Promote
Department of Industrial Promotion
Development, Services, Training, Consultant Management Promotion, Design production
Office of Industrial Economics Policies and Plans, Service Information Technology
Office of the Permanent Secretary
Service, Support Region and local investor, Cooperation Public/Private Participation
Department of Industrial Works Permission, Factory licenses, Fees, Support Technology, The Factory Act, B.E. 2535
The Ministry of Industry (MOI)
Thai Industrial Standards Institute
Standard Production, Permission
Office of Small & Medium Enterprises Promotion
SMEs National Database
Thailand Productivity Institute Suggestion, Process Improvement, Quality Control ISO 9000, QS 9000, ISO 14000, ISO/TS 16949, Thailand Quality, Award..
A State Enterprise Agency under Ministry and carrying out the government’s industrial development policy
Industrial Estate Authority of Thailand (IEAT)
Land, Infrastructure, Zoning, Management, Operation, One Stop Service, e- Business, Permit, Licensing, Privilege
Office of the permanent Secretary
Office of Technology Transfer & Promotion
Ministry
Ministry of Science and Technology Thailand Institute of Scientific
and Technological Research Industrial and Technical, Industrial Metrology, Testing & Packaging Center

117
National Science and Technology Development Agency
R& D Improvement of production, Training, Testing and measuring services Technology Transfer Group
Department of Export Promotion
Export Promotion Policy
Department of Foreign Trade Foreign Business Act.
The Ministry of Commerce (MOC)
Department of Internal Trade Support
Fiscal Policy Office The fiscal Policy Government Saving Bank Fund Load The Custom Department Tax, Tariff Export-Import of Bank Thai Tax Refunds on exports Small Industrial Finance Cooperation
Fund load
Small Industrial Credit Guarantee
Participation, Public foreign to support
The Industrial Finance Corporation of Thailand (IFCT)
Load long-term funds to medium- and large-scale firms from credit
Ministry
The Ministry of Finance (MOF)
The Bank of Thailand (BOT) Foreign Exchange, Loans in low interest
Indirect government agencies related to support and performance Pollution Control Department Air Quality and Noise
Standards Enhancement and Conservation of National Environmental Quality Act.
Ministry of Natural Resource & Environment
Department of Environmental Quality Promotion
Environmental protection
Office of the Higher Education Knowledge Ministry of Education Office of the Vocational
Education Commission Knowledge
The Ministry of Transport and Communications
Many Department / division to work infrastructure
Oversees and construction infrastructure
Ministry
The Ministry of Public Health
The Public Health Act, B.E. 2535
Sources: Thai Government (2007)

118
D4. Table of Industrial Policies related to the Rice mill
Hierarchy of laws
Subject Year of announcement
Organization
Act of Legislation
The Factory Act B.E.2535 (1992) Department of Industrial Works, MOI
Act of Legislation
Enhancement and Conservation of National Environmental Quality Act
B.E.2535 MOSTE (A parted to MOST and MONRE)
Ministerial Regulation
Issued Pursuant to the Factory Act B.E. 2535; Types in the list annex of factory
B.E.2535 (1992) Department of Industrial Works, MOI
Ministerial Notification
No.1060 Industrial Product Standard Act: Rice roller manufacturer
B.E.2532 (1989) Thai Industrial Standard Institute, MOI
Ministerial Notification
No.1060 Industrial Product Standard Act: Small Manufacturer of rice milled machine
B.E.2532 (1989) Thai Industrial Standard Institute, MOI
Ministerial Regulation
No.2 Issued Pursuant to the Factory Act B.E. 2535; 1)Location, Environment, Appearance of the Building and Interior of the Factory 2)Machinery, Equipment or Things Used in the Factory 3)Workers in the Factory 4)Control of the Release of Waste, Pollution or Anything Affecting Environment 5)Safety of Factory Operation
B.E.2535 (1992) Department of Industrial Works, MOI
Ministerial Regulation
No.3 Issued Pursuant to the Factory Act B.E. 2535; Reporting/information of the factory operation
B.E.2535 (1992) Department of Industrial Works, MOI
Ministerial Notification
No.4 Occupational and safety registered assigns in the industry
B.E.2514 (1971) Department of Industrial Works, MOI
Ministerial Notification
No.7 The industry setting up the products types and quality
B.E.2516 (1973) Department of Industrial Works, MOI
Ministerial Notification
No.13 Performing and responsibility of the permitted factory
B.E.2525 (1982) Department of Industrial Works, MOI
Ministerial Notification
No.18 Performing and responsibility of the permitted factory
B.E.2528 (1985) Department of Industrial Works, MOI

119
Ministerial Notification
No.22 Performing and responsibility of the permitted factory
B.E.2528 (1985) Department of Industrial Works, MOI
Ministerial Notification
No.24 Performing and responsibility of the permitted factory; Hazardous substance management
B.E.2530 (1987) Department of Industrial Works, MOI
Department Notification
No.1 Control for industrial waste keeping, disposal, transportation and management of the factory
B.E.2531 (1988) Department of Industrial Works, MOI
Ministerial Notification
The support measure for the industry that certified the Product Certification and Industrial Standard
B.E.2542 (1999) Department of Industrial Works, MOI
Ministerial Notification
Regulation to the scale and type of factory, pollution control and management of the industry, pollution treatment administrator
B.E.2545 (2002) Department of Industrial Works, MOI
D5. Table of Air pollution control and air quality standard
Hierarchy
of laws Subject Year of
announcement Organization
Ministerial Notification
Prescribing the air pollutants measure and standard of the emission from industry
B.E.2548 (2005) Department of Industrial Works, MOI
Ministerial Notification
No.2 Prescribing the air pollutants measure and standard of the emission from industry
B.E.2543 (2000) Department of Industrial Works, MOI
Ministerial Notification
National Environment Board; No.10 Prescribing the Ambient Air Quality Standard
B.E.2538 (1995) MOSTE
Ministerial Notification
National Environment Board; No.12 Prescribing the Standard of SO2 (1 hr) in the Ambient Air Quality
B.E.2538 (1995) MOSTE
Ministerial Notification
National Environment Board; No.21 Prescribing the Standard of SO2 (1 hr) in the Ambient Air Quality
B.E.2544 (2001) MOSTE
Ministerial Notification
National Environment Board; No.10 Prescribing the Ambient Air Quality Standard
B.E.2547 (2004) MONRE
Ministerial Notification
Regulation of air pollution control and emission standard for Rice mills boilers
B.E.2548 (2005) MONRE
Ministerial Notification
National Environment Board; No.15 Prescribing the Standard Noise Quality in the Ambient
B.E.2540 (1997) MOSTE

120
D6. Table of Water quality standard and Wastewater discharge
Hierarchy
of laws Subject Year of
announcement Organization
Ministerial Notification
No.2 Prescribing the Industrial Effluent Standard
B.E.2539 (1996) Department of Industrial Works, MOI
Department Notification
Issue pursuant to Ministerial Notification No.2; Prescribing the effluent quality necessity different from the limited standard
B.E.2540 (1997) Department of Industrial Works, MOI
Ministerial Notification
No.3 Regulation and standard for industrial control facilities
B.E.2539 (1996) Pollution Control Department, MOSTE
Ministerial Notification
No.4 Prescribing the types of industry and industrial estate to be regulated as the source of water pollution and need effluent treatment and control
B.E.2539 (1996) Pollution Control Department, MOSTE
Ministerial Notification
Stipulate the types of industry and industrial estate to be regulated as the source of water pollution and need effluent treatment and control
B.E.2536 (1993) Pollution Control Department, MOSTE
Department Notification
Sampling method of effluent from industry and industrial estate; sampling method, frequency, time and period of sampling
B.E.2539 (1996) Pollution Control Department, MOSTE
Department Notification
No.67/2534 Require the permission and approved for all sources of wastewater discharge to the water courses
B.E.2534 (1991) Marine Department, MOT
Department Notification
No.419/2540 Prescribing the effluent control and standard from the industry and industrial estate source
B.E.2540 (1997) Marine Department, MOT
Department Notification
No.435/2540 Prescribing the types of industry and its effluent is required to meet the standard
B.E.2540 (1997) Marine Department, MOT

121
D7. Table of Policies and law related to the energy and boilers
Hierarchy
of laws Subject Year of
announcement Organization
Ministerial Notification
No.18 Duties of permit industry in boiler operation (about boiler)
B.E.2528 (1985) Department of Industrial Works, MOI
Ministerial Notification
No.26 Duties of permit industry in boiler operation (boiler management)
B.E.2534 (1991) Department of Industrial Works, MOI
Department law
Regarding to registration of engineer to boiler facilities and control
B.E.2528 (1985) Department of Industrial Works, MOI
Act of legislation
Energy Development and Promotion
B.E.2535 (1992) Department of Energy Development and Promotion, MOST (2002, Changed to Department of Alternative Energy Development and Efficiency, MOE)
Act of legislation
Enhancement of Energy Conservation
B.E.2535 (1992) Department of Energy Development and Promotion, MOST
Act of legislation
Prescribing the controlled industries
B.E.2540 (1997) Department of Energy Development and Promotion, MOST
Ministerial Regulation
No.5 Reporting form of the required information of industry; process, energy consumption and conservation, industrial energy plan. To control and monitoring the industry follow their plan
B.E.2540 (1997) Department of Energy Development and Promotion, MOST
Ministerial Regulation
No.6 Regular the reporting method and time of submission from the industry. Regularly control to following the industrial conservation plan.
B.E.2540 (1997) Department of Energy Development and Promotion, MOST
Ministerial Notification
Procedure of inspection reporting and energy analysis in the industry
B.E.2540 (1997) Department of Energy Development and Promotion, MOST

122
D8. Table of Laws related to the economy
Hierarchy
of laws Subject Year of
announcement Organization
Ministerial Notification
Rice product standard B.E.2540 (1997) Department of Foreign Trade, MOC
Ministerial Notification
Prescribing Thai Hom Mali Rice as a Standardized Commodity and Standards for Thai Hom Mali Rice
B.E.2544 (2001) Department of Foreign Trade, MOC
Ministerial Notification
Prescribing Thai Hom Mali Rice as a Standardized Commodity and Standards for Thai Hom Mali Rice (No.2)
B.E.2545 (2002) Department of Foreign Trade, MOC
Ministerial Notification
Prescribing Thai Hom Mali Rice as a Standardized Commodity and Standards for Thai Hom Mali Rice (No.3)
B.E.2546 (2003) Department of Foreign Trade, MOC
Ministerial Notification
Rules and Methodologies of Commodities and Thai Hom Mali Rice Standards Inspection B.E.2545 (2002)
B.E.2545 (2002) Department of Foreign Trade, MOC
Ministerial Notification
Establishing Customs Checkpoints Where Exporters or Senders of Standardized Thai Hom Mali Rice Shall Present the Certificates of Commodity Standard
B.E.2545 (2002) Department of Foreign Trade, MOC
Ministerial Notification
Establishing Fees for Commodity Standard Inspection And Issuance of Thai Hom Mali Rice Certificates (No.2) B.E.2545 (2002)
B.E.2545 (2002) Department of Foreign Trade, MOC
Department Notification
CSI (Bureau of Commodity Standard Inspection) Establishment of Locales of Areas for the Purpose of Inspecting Thai Hom Mali Rice Destined for Export
B.E.2545 (2002) Department of Foreign Trade, MOC
Department Notification
Procedure and Methodology of Thai Hommali Rice Sampling to genetic prove
B.E.2547 (2004) Department of Foreign Trade, MOC

By Ms.Niranchana Authayanraksa
Environmental and Techno-Policy Analysis of an Agro Eco-Industrial Network in Chachoengsao Province
Examination Committee: Prof. C. Visvanathan (Chairperson)Dr. Nowarat CoowanitwongDr. Thammarat KoottatepDr. Shabbir H. Gheewala

2/32
ContentsBrief of Literature Review
Study Area
Objectives of Study
Methodology
Results and Discussions
Conclusions and Recommendations

3/32
Industrial Ecology
Novel approach to achieve Sustainable Industry
New concept to environmental management and innovative business strategy
Tool for formulating policy, regulations and incentives
Source: Robert (2004)
Industries as “Eco-systems”Energy flows and material exchanges
between industries and natural ecosystems
Virgin material
Raw material
Process unit
Consumer
Recycle waste
Waste
Products
Waste

4/32
Environmental Management
Re-use & Recycling
End of Pipe Treatment
IE implies other PP approaches, including CP & End-of-pipe TreatmentTry to Closed the Loop with complete material recovery (Recently, unachievable with existing technology)
Industrial Ecology

5/32
Eco-Industrial NetworkA set of companies collaborating Improve their environmental, social, and economic performance in a region
One form of collaboration is to exchange by-product materials, energy, or water among companies
Regional Scale; unlike an EIP (Co-location)
Estate zone
WW Treatment
Plant
Industrial Estate
Eco-Industrial Park
Eco-Industrial Network
Waste
Condensate
Power Plant
Community
Oil WasteElectricity
Low grade oil
Electricity
Waste
WW reuse

6/32
Agro-based IndustryBased on agricultural and forestry productionPurpose:
To preserve and refine raw products To extract and concentrate the valuable constituents
Agro Eco-Industrial Network: using basic strategies of EINHigh opportunity for profitable by-product flow between tenants
e.g. biomass, energy, and water intensive companies in food processingSupport sustainable agriculture and livelihood of rural communities
Conventional Agro EIN
Polluting
Costly chemical inputs
Unsustainable Protection of Environment
Increase Business Success
Ecology Economy
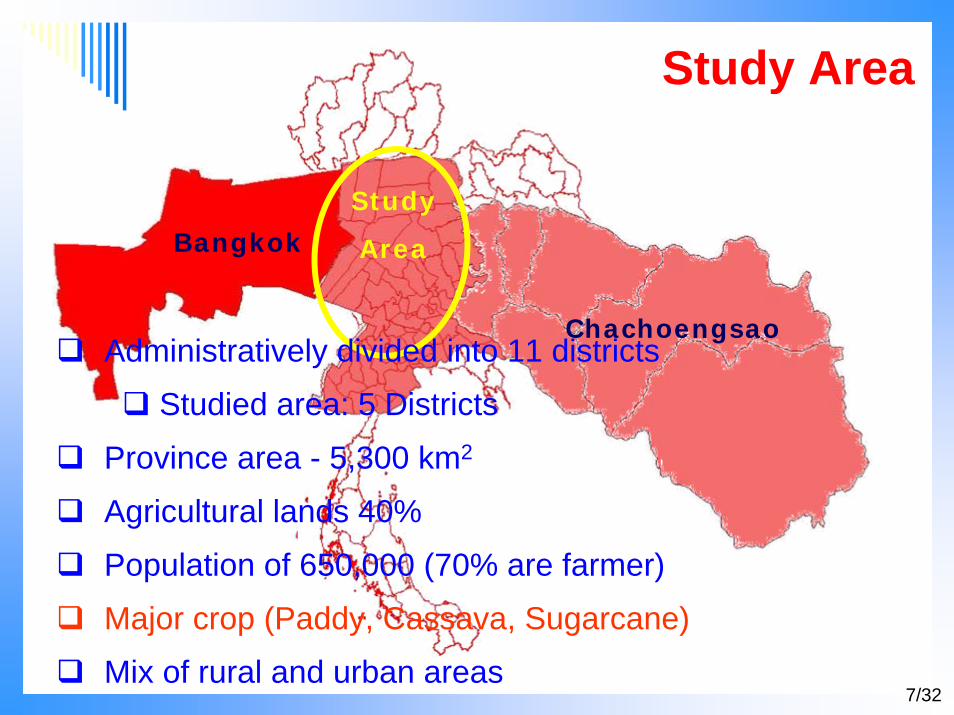
7/32
Bangkok
Chachoengsao
Study
Area
Administratively divided into 11 districts
Studied area: 5 Districts
Province area - 5,300 km2
Agricultural lands 40%
Population of 650,000 (70% are farmer)
Major crop (Paddy, Cassava, Sugarcane)
Mix of rural and urban areas
Study Area

8/32
Objectives of study
To investigate the existing environmental, economic and technological situation of agro-based industries in the fringe areas of Chachoengsao Province
To study the existing role and level of integration of policies related to the development of industrial clusters and local communities
To develop the material flow network so as identify the alternative use of waste and by-product and optimize resource use

9/32
Methodology
•Environmental baseline•Socio-economic information • Industry lists•Actors & institutional •Industrial/Environmental, related policies, standard & indices
Field Study and Data Collection
Field Study Secondary Data Sources
Problem Identification/
Study Objectives
Literature Review
Desk Review & Propose the Sustainable Development
Options
Conclusion and Recommendation
Material Flow Network
Collected Data
Observation/survey
Interviews
Questionnaire

10/32
Bangkok & 5 Study Districts - 1990Bangkok & 5 Study Districts - 2003Bangkok & 5 Study Districts – 1990 - 2003
Urban Land Use Change
UrbanizationPopulation Growth

11/32
Environmental Problems
Solid Waste- 396 Ton/d- Municipal Landfill, Open dump and burning
Surface water quality BangpakongRiver; Class 4 DO<4 mg/LWater pollution; Total Coliform Bacteria = 16,000 MPNHigh concentration NH3-N
Deficient Water Consumption;-Water consumption 1,000 m3/yr-Water supply capacity 850 m3/yr
Source of BOD loading-Domestic WW 0.9 million kg/d-Industrial 0.5 million kg/yr -Livestock 5.9 million kg/yr

12/32
379,000 pigs in 320 pig farms300 tons of piggery waste
5 million chicken in 330 farms700,000 ducks in 100 farms
Results and Discussions
Rice Based Industries
Piggery
Poultry
Biomass &
Biogas
Power Gen
eratio
n
82 Rice Mills17 Rice Noodle industries1 Rice Bran Oil Extraction Industry
10.4 MW Rice husk Biomass Power Plant

13/32
Rice-based Value Chain
Value Increase
Energy consumption
Noise / odor / dust
Wastewater
Environmental
degradation
GHG Emission
CO, CO2, NOx
Solid wasteLost of nutrient
Soil contamination
Pollution Increase
By-Products
ProcessingRice
ProcessingPaddy
ProcessingIntensive
Cultivation

14/32
Existing Material Flow
Paddy FieldsRice Mills
Agricultural Residues
Land disposal
Open burning
Rice Husk
Rice processing
Rice
Wastewater
Rice Products
Local water bodies
Paddy
Piggery
Piggery Waste
Poultry
Poultry Litter

15/32
Rice Mill Statistic
0
100
200
300
400
1992
1993
1994
1997
1998
1999
2000
2001
2002
2003
2004
2005
Num
ber
of ri
ce m
ill
107 Rice Mills
22 Parboiled Mills
1,300 Industries
Rice mill established:
44 Small
15 Medium
48 Large

16/32
Paddy ProcessingWhite Rice Mill Dry process
Production capacity = 150 ton/d (paddy)24 hours, 250 days/yr working
Parboiled MillProduction capacity = 600 ton/d (paddy)24 hours, 250 days/yr working
Cleaning
De-husking
Grain Separation
Whitening
Paddy
Rice
Steaming
Soaking
Cleaning
Parboiled Drying
Milling Process
Water WW
Paddy

17/32
Parboiled Rice Mill: Mass Balance
Energy consume; • Electricity 44.4 kWh/ Ton • Husk Fuel 0.04 Ton
Water consumption = 25 m3/dDust and particulate matter
• Boiler = 290 mg/m3
• Standard= 320 mg/m3
Milling process
Head rice 0.60Broken rice 0.10
Straw, grass0.002 Ton
Lean grain and contaminated
0.046 Ton
Husk and dust0.10 Ton
Bran 0.10 Ton
Total rice 0.70 Ton
Wastewater 0.49 m3
Paddy1Ton
Water 0.7 m3
By-product and Waste Value
- Bran 8,000 ฿/T Oil extraction industry
- Husk 800 ฿/T Power plant- Straw 1,200 ฿/T Farm- Ash 500 ฿/T Farm

18/32
Parboiled Mill WW Treatment
Parameters Effluent Thai effluent standard
pH 6.7 5-9Temperature (oC) 38 ≤ 40DO (mg/L) 4 -BOD5 (mg/L) 9 ≤ 20Suspended solid (mg/L) 239 ≤ 150Oil and grease (mg/L) 9.6 ≤ 5Water consumption of selected Parboiled Mill (m3/ton product)
0.7 -
Major source:Rice soaking
& cooking processLubricant &
oil spill

19/32
Rice Processing: Rice Noodle Industry
Cleaning
Milling
Cake steaming
Dewatering
Cooling and forming
Extruding
Water
Production process
Broken rice 1 TonRice noodle 2 Ton
Water 20 m3Wastewater
10 m3
Noodle scarp 0.2 TonProduct2.2 Ton
Energy consumption:
Electricity 83 kWh/Ton product
Fuel wood 10 Tons/d
Wastewater 10 m3/TonBOD 0.22 kg/Ton product
WW

20/32
Rice Crude Bran Oil Industry
Production process
Rice bran 1 Ton Crude rice bran oil 0.20 Ton
Defatted rice bran0.60 Ton
Broken rice0.10 Ton
Steam 60 m3Condensate
30 m3
Rice bran oil industry
Biomass Power Plant
Steam
Water (Condensate)
Animal feed
Defatted Bran 7,000 ฿/T Broken rice 5,000 ฿/T

21/32
Biomass Power Plant
Fluidized Bed CombustionElectricity 10.4 MW/d ;
Sale to local customers = 1 MW/d EGAT= 8 MW/dIn-plant use= 1 MW/d
Production process
Rice Husk 1.04 kg Electricity1 kWh
Ash 0.26 kg
De-mineral Water 23 m3
Blow down 20 m3
Wood chip 0.26 kg
Power Plant
Wood Chip Industry
By-product (Bark)
Electricity Agriculture
Ash 500 ฿/T

22/32
Piggery Farm
Parameter ValueGeneration rate (L/pig/d) 27
BOD (mg/L) 2,500COD (mg/L) 6,800
Biogas Production (L/pig/d) 93Organic fertilizer (kg/d) 0.36
Existing waste managementPig Manure;
Solid Sale to the farmer & compostingWastewater Directly discharged/ Pond/ Treatment system
Existing Wastewater treatment systemAnaerobic filter tankStabilization pond
Small
Medium
Large
Total 320 pig farms
29%
47%
24%

23/32
Poultry FarmDescription Chicken
Total farms 202Total Number ( x1,000) 5,971Average body weight (kg) 2Wet waste (%TLW/d) 6.6Total Solid (%TWW) 25.3Biogas Production (m3/kg waste) 0.1
Note: TLW = Total life weight, TWW = Total wet weight
LitterSale for organic fertilizer 1,000 ฿/Ton
Chicken cum Fish farm/ sale for fish feed

24/32
Proposal Agro Eco-Industrial Network
Paddy FieldsRice Mills
Agricultural Residues
Rice Husk
Rice processing
Rice
Wastewater
Rice Products
Paddy
Piggery
Piggery Waste
Poultry
Poultry Litter
Reuse&Recycling
Biomass power
generation
Biogas generation
systems
Existing Cluster Eco-Industrial Network

25/32
Major changes and Improvement
Parboiled rice mill WW
Existing Network Agro EINProposed Technology
WWTS
Biogas generation
system
Biomass Power
Generation
Piggery WW
3.7 Million m3/yr
Rice noodle WW
1.2 Million m3/yr
Rice Husk & Residues
835 kT/yr
Recycle Water 150,000 m3/yr
Biogas production; Rice noodle
industry = 6,205 m3/yrPiggery = 12 Million
m3/yr
Electricity Sale to EGAT and Local
businesses642 GW/yr

26/32
Gaps of the proposed Technologies
Biogas generation systemsHigh capital investment Lack of labor skill, expert and technical supportLack of monitoring and control from organization
Biomass power generationRice husk purchase price increasingDeficiency of technical support
Economy& Policies
Efficient use of resources
Prevents environmental
degradation

27/32
Policies Related to AEIN
Agro EIN
Industrial policies
Energy policies
Environmental policies
Agricultural policies
Economic policies
Social development
policies
CDM Policies

28/32
Local Administration
Chachoengsao Provincial Governor
Ministry of Industry
Provincial Industrial Office
Natural Resource & Envi. Office
Dept. Agricultural Promotion
Dept. of Livestock
Community Development
Dept.
Dept. of FisheryProvincial
Energy Office
Provincial Skill
Development Center
Office of the Basic
Education Commission
Provincial Land Development
Center
Dept. of Internal Trade
Dept .of Business
Development
Provincial Public Health
Office
Office of Public Work, Town &
Country Planning
- Organic Farming Asso.- Provincial Rice mill Asso.- NGOsProvincial
Energy Office

29/32
Major Policies Fostering AEIN
Agro-Industrial Development
Policies
National Economic and Social Development Plan
Factory control; DIW
SMEs and Cluster development policy; DIP
Investment Promotion; BOI
Environmental Protection
Policies
Policies on;
Natural resource
Pollution
Natural and cultural environments
Community environment, education & promotion
Technology
Supporting Proposed EIN
Policies
CDM projects and policy
Renewable Portfolio Standard
SPP and VSPP schemes
Rural and regional development strategies and policies

30/32
ConclusionsThe material flow of rice and livestock clusters of Chachoengsao indicates the potential for its transformation to an eco-industrial network
Introduction of technologies are essential for a successful transformation; the proposed technological used in this research are Biogas generation systems and Biomass power generation
Appropriate policy considering all related issues of the eco-industrial cluster and rightly integrated with national and local development priorities is essential

31/32
Recommendations for further study
The network and linkages between and within business units need to examine the Market-based and economy
Cost-effective technologies for Small & Medium -scale, decentralized biomass power and biogas generation is required
Evaluation in terms of the benefit gains of each proposal environmental friendly industries, to link with the social suitable


33/32
EIN Benefits
Community Local Businesses Environment
Dynamic, diverse, stable economic base
Increased profitability and competitiveness
Improved environment and habitat
Increased local business opportunities
Enhanced market image Continuous environmental improvement
Improved tax base Cost savings through shared services
Reduced exposure to pollutants
Increased community pride Cost reductions due to Improved efficiency of materials and energy use
Reduced greenhouse gas emissions
Tax savings since tax breaks aren’t required to attract new business
Access to public funding programs and private financing
Innovative environmental solutions

34/32
EIN Benefits
Community Local Businesses Environment
Recruitment of higher quality, greener companies
Higher value for developers
Preservation of environmentally significant areas
Increased and sustained property values
Reduction of disposal costs
Increased protection of natural ecosystems
Partnership with business Income from sale of by-products
More efficient use of natural resources
Reduced impact on infrastructure, including waste disposal
Reduction of environmental liability
Improved environmental management systems
Improved aesthetics Improved public image
Stable, diverse job-base Increased employee productivity
Business
Institutional
PrivateGovern-ment

35/32
Problems and Constraints to the Development of Agro-industrial Sector
Inconsistent and insufficient supply of raw material, seasonality of crops Poor quality of raw material supply, high losses during transportInappropriate/obsolete processing and equipment Poor and inconsistent quality of processed products Sub-optimal use of processing facilities and equipment Poorly trained personnel and a lack of food technologists A lack of proper hygiene practices and Inappropriate packaging materials/high packaging cost Weak or non-existent market development A lack of technical supportAbsence of good management of the processing facility once commercialized

36/32
9th NESDB Plan Strategies
Restructure economy for balanced and sustainable
development
Develop local economies, small and
medium scale enterprises, and
cooperative systems
Distribute economic growth and
development benefits
Decentralize growth, in/to regional areas
Emphasize development of production networks, supply
chains and services
Develop networks (cluster creation) linking public, private, and civil sectors
Market and distribute products from local to regional, national and international markets
NESDB – National Economic and Social Development Board

37/32
Investment Benefits
Chachoengsao is classified under Investment Zone 2
100% waiver of import duty on machinery for industries in estates50% waiver for industries outside the estateCorporate income tax exemption – 7 years within industrial estate and 3 years outsideExemption on import duty for raw material for 1 year in both cases
Relocating industries from Zone 1 to Zone 2
Zone 1
Zone 2
Zone 3
Zone 4Zone 4

38/32
Incentives for Rural IndustriesBoard of Investment, Thailand identified and classified 30 agro industries for special incentives
Livestock, Slaughtering, meat and food processing, animal feed, agriculture products and waste re-processing –identified as priority activities
Machinery import duty exemption
Corporate income tax exemption for a period of 8 years regardless of zone with no limits

39/32
Power Purchase PolicySmall Power Producers
Co-generators or facilities using renewable energy fuelsSell power to EGAT of not more than 90 MW for each projectMinimum purchase guarantee (> 80%)Allows direct sale to industrial estates near the power plants
Very Small Power ProducersInstalled capacity of less than 1 MW Agricultural residues & wastes from agro industries (e.g. rice husk)Products converted from agricultural residues & wastes from agricultural or industrial production processes. (e.g. tapioca wastewater)Municipal waste: RDF, Biomethanation