melt pelletization in a high shear mixer. viii. effects of binder viscosity
TRANSCRIPT

-; t ;:-5
=.~::\,~, ve i l i
E L S E V I E R International Journal of Pharmaceutics 139 (1996) 125-138
international journal of pharmaceutics
Melt pelletization in a high shear mixer. VIII. Effects of binder viscosity
Torben Schaefer*, Christina Mathiesen
Royal Danish School of Pharmacy, Department of Pharmaceutics, 2 Universitetsparken, DK-2100 Copenhagen, Denmark
Received 19 January 1996; accepted 14 April 1996
Abstract
Lactose monohydrate and anhydrous lactose were melt pelletized in an 8-1 high shear mixer using polyethylene glycol (PEG) 2000, 3000, 6000, 8000, 10000, or 20000 as meltable binder. The maximum impeller speed had to be applied in order to avoid an uncontrollable agglomerate growth with the highly viscous types of PEG. A higher binder viscosity resulted in a lower initial agglomerate growth and in a higher subsequent growth rate. The effect of binder viscosity on agglomerate growth was reflected in the power consumption of the impeller motor. A lower binder viscosity gave rise to more spherical pellets.
Keywords: Binder viscosity; Polyethylene glycols; Melt pelletization; High shear mixer; Power consumption; Agglom- erate growth mechanisms
1. Introduction
In wet granulation processes, agglomeration is usually caused by the addition of a binder solu- tion of a rather low viscosity, typically within the range of 2-300 mPa.s . In a fluidized bed granula- tor, however, a marked evaporation of the solvent occurs during the process. This will increase the viscosity of the binder solution, and the liquid bridges within the agglomerates might become immobile (J/iger and Bauer, 1984).
* Corresponding author.
In fluidized bed granulation experiments, an increase in the viscosity owing to a higher initial viscosity of the binder solution (J/iger and Bauer, 1984; Massoud and Bauer, 1989), or to a gelation during the process (Schaefer and Worts, 1978) resulted in a larger agglomerate size.
The effect of the viscosity of the binder liquid is less pronounced by agglomeration in a high shear mixer, because the shearing forces are higher, and the evaporation of solvent is less than in a fluidized bed. Experiments in a high shear mixer with five binders in different concentrations (Ri- tala et al., 1986) did not show any effect of
0378-5173/96/$15.00 © 1996 Elsevier Science B.V. All rights reserved PII S0378-5173(96)04549-8
126 7". Schcefer, C. Mathiesen / International Journal of Pharrnaceutics 139 (1996)125-138
viscosity, apart from an effect that was ascribed to gelation. On the other hand, other authors (Hoornaert et al., 1994) found that an increase in viscosity obtained by a doubling of the binder concentration gave rise to a larger mean granule size.
A higher viscosity of the binder liquid will make it more difficult to obtain a uniform distri- bution of the liquid (Kinget and Kemel, 1985; Visavarungroj et al., 1990; Wan and Lim, 1991; Kokubo et al., 1993). Consequently, a high viscos- ity might give rise to insufficient agglomeration or to an inhomogeneous size distribution of the ag- glomerates. Such problems are counteracted by atomizing the binder liquid or by increasing the shearing forces involved in the process.
By melt agglomeration with PEGs, the viscosi- ties of the molten binders are normally higher than the viscosities of the binder solutions used for wet agglomeration. In previous melt agglom- eration experiments with PEG 3000 and 6000, a higher viscosity resulted in a smaller agglomerate size (Schaefer et al., 1990, 1992a,b). This was explained by a lower surface plasticity caused by the higher viscosity. It was found, however, that the agglomerate growth rate increased in an un- controllable way when the viscosity exceeded an upper critical limit, which was dependent on the actual product and process variables (Schaefer and Mathiesen, 1996).
The results described in literature indicate that the effect of the viscosity of the binder liquid on agglomerate growth is rather complex. The pur- pose of the present work was to obtain further knowledge of the effect of binder viscosity by means of melt pelletization experiments with dif- ferent types of PEG covering a wide range of viscosities.
2. Theory
The fundamental agglomeration theory of Rumpf (1962) is based upon the tensile strength of liquid bridges which are static. The strength of a static bridge is dominated by the surface tension of the liquid and is independent of the viscosity. In agglomeration processes, the particles are sub-
jected to relative movement, and consequently the liquid bridges are dynamic (Mazzone et al., 1987; Ennis et al., 1991).
The force required to separate two moving particles is much higher than that required in static systems, because the viscosity of the liquid resists the motion in the dynamic case (Mazzone et al., 1987). The strength of the dynamic bridge is dominated by viscous forces. Therefore, agglom- eration models based upon the strength of static bridges will grossly underestimate the agglomerate size (Mazzone et al., 1987).
Ennis et al. (1991) have developed an agglomer- ation model, which takes into consideration that the liquid bridges are dynamic. The theory is based upon a dimensionless viscous Stokes' num- ber
8pUoa St~ = - - (1)
9/1
where p is the density of the particle or granule (g/cm3), Uo is the initial relative granule collisional velocity (cm/s), a is the particle or granule radius (/tm), and # is the binder viscosity (P). The vis- cous Stokes' number is a measure of the ratio of granule collisional kinetic energy to the viscous dissipation brought about by the binder liquid. In a mixer granulator, Uo is assumed to be equal to aco, where co is the impeller rotation speed (I/s). Then Eq. (1) becomes
8pcoa 2 S t v = - - (2)
9/~
Coalescence will occur at collision between par- ticles or granules if Stv is below a critical value, St*, of the viscous Stokes' number. St* is given by
St* = (1 + ~ ) l n ( h ~ ) (3)
where e is a particle coefficient of restitution, which is 1 in the case of rigid particles, and which is lower, the more deformable the particles or granules are; h is the thickness of the liquid layer on the surface of the colliding particles or gran- ules, and ha is a characteristic length scale of surface asperities.

T. Schcefer, C. Mathiesen / International Journal of Pharmaceutics 139 (1996) 125 138 127
Table l Physical properties of the PEGs
PEG True density (g/cm 3) Water content (%) Melting range (°C) Peak temp. (°C)
2000 1.224 0.5 42 53 52 3000 1.221 0.4 48 59 58 6000 1.227 0.2 52 62 61 8000 1.226 0.2 54 63 62
10000 1.226 0.2 57 64 63 20000 1.223 0.2 53-66 64
Agglomerate growth by coalescence is pro- moted by a low value of Sty and a high value of St*. It appears from Eqs. (2) and (3) that the agglomerate growth rate according to the theory is increased by a lower particle density, a lower impeller speed, a smaller particle size, a higher viscosity, a higher deformability of the agglom- erates, an increased thickness of the liquid layer, and by smaller surface asperities.
In practice, it will be difficult to estimate e and h in Eq. (3). They are, however, closely related to the liquid saturation of the agglomer- ates (Adetayo, 1993). A higher liquid saturation will increase St*. This is in accordance with the fact that liquid saturation is a primary factor controlling agglomerate growth (Kristensen, 1995).
In an agglomeration process, the values of Sty will vary within the mixer, because the velocities of the particles or granules will be different at different locations in the mixer. When all the Sty-values are below the critical value, all the collisions will result in coalescence. The Stv-val- ues increase during the process since the particle size (a in Eq. (2)) increases owing to agglomer- ate growth. When the Stv-values become equal to the critical value, no further agglomerate growth will occur (Ennis et al., 1991).
Ennis et al. (1991) supported their agglomera- tion theory by fluidized bed granulation experi- ments. Further, the theory was found to be suitable for a qualitative description of an ag- glomeration process in a drum granulator (Ade- tayo, 1993) as well as in a high shear mixer (Hoornaert et al., 1994).
3. Materials and methods
3.1. Materials
Lactose 450 mesh (a-lactose monohydrate, DMV, The Netherlands) and anhydrous lactose (N.F., impalpable, Quest International, The Netherlands) were used as starting materials.
Polyethylene glycol (PEG) 2000, 3000, 6000, 8000, 10000, and 20000 (Hoechst, Germany) were used as meltable binders. All the PEGs were used as flakes.
The size distributions by volume of the starting materials were determined by a Malvern 2601Lc laser diffraction particle sizer (Malvern Instru- ments, UK). The median particle diameter and the span were found to be 20/zm and 2.1 for lactose monohydrate and 34 /~m and 2.1 for anhydrous lactose. The span is defined as the difference between the diameters at the 90 and the 10 percent- age points relative to the median diameter.
The BET multipoint surface areas, determined by a Gemini 2375 Surface Area Analyzer (Micromeritics, USA), were 0.81 mZ/g for lactose monohydrate and 0.71 m2/g for anhydrous lactose.
The true densities of the materials were deter- mined by an AccuPyc 1330 gas displacement pyc- nometer (Micromeritics, USA) using helium purge. The densities of lactose monohydrate and anhy- drous lactose were 1.547 g/cm 3 and 1.572 g/cm 3, respectively. The densities of the PEGs are shown in Table 1.
The water contents on a wet-weight basis of lactose monohydrate, anhydrous lactose, and the PEGs were estimated by volumetric titration as

128 T. Schcefer, C. Mathiesen / International Journal o f Pharmaceutics 139 (1996) 125-138
previously described (Schaefer and Mathiesen, 1996). The sample size was about 400 mg (lactose monohydrate), about 3 g (anhydrous lactose), and about 1.5 g (PEGs) respectively. The water con- tent was found to be 5.1% for lactose monohy- drate and 0.6% for anhydrous lactose. The water contents of the PEGs are shown in Table 1.
The melting ranges of the PEGs were estimated by a Perkin Elmer DSC 7 differential scanning calorimeter (Perkin Elmer, USA) as previously described (Schaefer and Mathiesen, 1996). The melting ranges and the peak temperatures are shown in Table 1.
The viscosities of the molten PEGs were esti- mated at 70°C, 80°C, and 90°C by a rotation viscosimeter, Rotovisco RV 12 (Haake, Ger- many), with a MV sensor system and a MV II K rotor. Results obtained at the highest rev./min that gave rise to a deflection within the scale are presented in Table 2. The results did not indicate that the viscosity values were dependent on the rotation speed of the rotor. The correlation be- tween the temperature and the logarithm of the viscosity was found to be linear with correlation coefficients between - 0.996 and - 1.000. Viscos- ity values at 100°C and ll0°C were extrapolated by means of the regression lines.
3.2. Equipment
The 8-1 laboratory scale high shear mixer (Pellmix PL 1/8, Niro A/S, Denmark), described in a previous paper (Schaefer et al., 1993), was
employed in the experiments. The temperature of the heating jacket was set to 50°C in all the experiments.
3.3. Mixing procedure
The load of the mixer was 1 kg of lactose monohydrate or anhydrous lactose in all the ex- periments. The concentration of the PEGs was determined on the basis of preliminary experi- ments and was kept constant at 23% in the exper- iments with lactose monohydrate and at 22% in the experiments with anhydrous lactose. The PEG concentration is expressed as the percentage (% m/m) of the amount of lactose.
In all the experiments, the starting material and the PEG were dry mixed at an impeller speed of 1300 rev./min. The impeller speed was increased to 1500 rev./min, 2 min after the melting point of the PEG was observed as an inflection point on the recorded product temperature curve. This in- flection point was defined as the start of mas- sing time.
The power consumption of the impeller motor was measured by a power consumption meter, and the energy input was estimated from the power consumption curves as previously de- scribed (Schaefer et al., 1993).
The procedures for cooling of the agglomerates and for estimation of the adhesion to the bowl were the same as described in a previous paper (Schaefer, 1996).
3.4. Granule characterization
Table 2 The effect of temperature on the viscosities (mPa.s) of the molten PEGs
PEG Temperature, °C
70 80 90 100 110
2000 101 77 60 (46) (36) 3000 222 170 132 (102) (78) 6000 938 701 553 (421) (323) 8000 1620 1230 909 (683) (512)
10000 4660 3560 2730 ( 2 0 8 0 ) (1590) 20000 26 500 19 000 14 900 (10900) (8180)
The values in parentheses are extrapolated values.
3.4.1. Size distribution The amount of lumps larger than 4 mm was
determined as previously described (Schaefer, 1996).
The granule size distribution was estimated by a sieve analysis of a sample of about 100 g drawn by scooping from the cooled fraction finer than 4 mm, and the geometric mean diameter (dgw) and the geometric standard deviation (Sg) were calcu- lated. A series of 12 ASTM standard sieves was vibrated for 10 min by a Fritsch analysette 3 vibrator (Fritsch, Germany). Sieves in the range of 75-2000/~m were used for the experiments at massing times of 1 min and 3 min. For the
T. Schcefer, C. Mathiesen / International Journal of Pharmaceutics 139 (1996) 125-138 129
experiments at massing times of 6, 9, 12, and 15 min the sieves were in the range of 180-2000/tm.
Size fractions including the three sieve fractions closest to the mean diameter were prepared by vibration for 5 min, and these size fractions were applied for the measurements in Section 3.4.2, Section 3.4.3 and Section 3.4.4.
3.4.2. lntragranular porosity The intragranular porosity was estimated by a
mercury immersion method, and the liquid satu- ration was calculated as previously described (Schaefer et al., 1992a; Schaefer and Mathiesen, 1996).
3.4.3. Water content The water content on a wet-weight basis was
estimated by volumetric titration as previously described (Schaefer and Mathiesen, 1996). A sam- ple of about 1 g was used for the measurements.
3.4.4. Image analysis The agglomerates were placed on an illumi-
nated desk, and measurements were carried out using a video camera (MTI CCD72EX, DAGE- MTI, USA) connected to a 55-ram lens (Micro- Nikkor, Nikon, Japan), video digitiser software (Media Pro+/HiRes v2.01 + , Rombo Produc- tions, Scotland, UK), and image processing and analysis software (Global Lab. Image Version 2.20, Data Translation Inc., USA); 200 agglomer- ates were used for one analysis.
3.4.5. Scanning electron microscopy Photographs were taken by a scanning electron
microscope (SEM) (Jeol JSM 5200, Japan).
3.5. Experimental design
A series of 72 factorially designed experiments was carried out with lactose monohydrate. The six types of PEG included in Table 1 were used, and the massing time was varied at 1, 3, 6, 9, 12, and 15 min. All experiments were carried out in dupli- cate.
A series of 10 experiments was carried out with anhydrous lactose. The massing time was kept constant at 12 rain, and experiments were made in
duplicate with PEG 2000, 3000, 6000, 8000, and 10000.
The results shown in this paper are mean values of two experiments unless otherwise stated. The data were analysed by analysis of variance.
4. Results and discussion
4.1. Experiments with lactose monohydrate
In previous experiments (Schaefer and Mathiesen, 1996), PEG 6000 gave rise to an un- controllable agglomerate growth at an impeller speed of 1200 rev./min. This was ascribed to the high viscosity of the PEG 6000. Preliminary ex- periments at 1200 rev./min with PEG 8000, 10000, and 20000 showed a similar uncontrollable growth. The uncontrollable growth was prevented by increasing the impeller speed to 1500 rev./min, which is the maximum speed. This is in accor- dance with Eq. (2), which shows that the potential for agglomerate growth by coalescence is in- creased at a higher viscosity and is counteracted by a higher impeller speed. Consequently, a very high impeller speed is a condition of using highly viscous binders.
The effects of viscosity and impeller speed are, however, more complex than it appears from Eq. (2), because both factors affect Eq. (3) too. A higher binder viscosity will reduce the deformabil- ity of the agglomerates. This will increase the coefficient of restitution, e. Further, the thickness, h, of the liquid layer in the surface is reduced, because less liquid is squeezed to the surface at collisions between agglomerates. Both will coun- teract the agglomerate growth by decreasing St*. A higher impeller speed will augment the de- formability at collisions and will increase the den- sification of the agglomerates. The latter will squeeze more liquid to the surface, and this will decrease e and increase 17 in Eq. (3) (Adetayo, 1993). Thus, the impeller speed will promote the agglomerate growth by increasing St*.
The effects of the viscosity and the impeller speed on the ratio Stv/St* will decide whether an increase in viscosity or impeller speed will aug- ment or reduce the agglomerate growth rate. The
130 T. Schaefer, C. Mathiesen / International Journal of Pharmaceutics 139 (1996) 125- I38
Table 3 Results of the repeated experiments with different types of PEG at a massing time of 1 rain
PEG dew (/zm) sg Lumps > 4 mm (%)
2000 629 2.66 15.6 560 2.77 12.8
3000 569 2.72 13.7 548 2.78 18.7
6000 413 2.36 6.0 422 2.38 5.9
8000 384 2.39 6.2 373 2.41 6.4
10000 466 2.28 3.3 416 2.29 4.5
20000 185 4.46 0.0 190 4.61 0.0
glomerate growth at 1 min. This is reflected in a large mean granule size and a large amount of lumps.
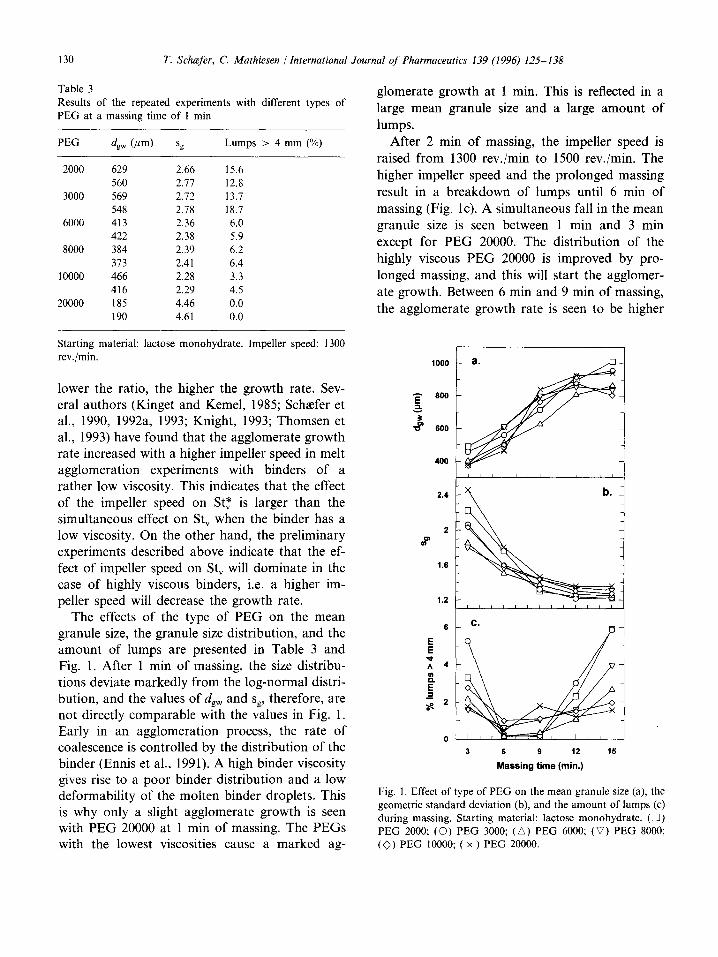
After 2 min of massing, the impeller speed is raised from 1300 rev./min to 1500 rev./min. The higher impeller speed and the prolonged massing result in a breakdown of lumps until 6 min of massing (Fig. lc). A simultaneous fall in the mean granule size is seen between 1 min and 3 min except for PEG 20000. The distribution of the highly viscous PEG 20000 is improved by pro- longed massing, and this will start the agglomer- ate growth. Between 6 min and 9 min of massing, the agglomerate growth rate is seen to be higher
Starting material: lactose monohydrate. Impeller speed: 1300 rev./min.
lower the ratio, the higher the growth rate. Sev- eral authors (Kinget and Kemel, 1985; Schaefer et al., 1990, 1992a, 1993; Knight, 1993; Thomsen et al., 1993) have found that the agglomerate growth rate increased with a higher impeller speed in melt agglomeration experiments with binders of a rather low viscosity. This indicates that the effect of the impeller speed on St* is larger than the simultaneous effect on Stv when the binder has a low viscosity. On the other hand, the preliminary experiments described above indicate that the ef- fect of impeller speed on Stv will dominate in the case of highly viscous binders, i.e. a higher im- peller speed will decrease the growth rate.
The effects of the type of PEG on the mean granule size, the granule size distribution, and the amount of lumps are presented in Table 3 and Fig. 1. After 1 min of massing, the size distribu- tions deviate markedly from the log-normal distri- bution, and the values of dgw and Sg, therefore, are not directly comparable with the values in Fig. 1. Early in an agglomeration process, the rate of coalescence is controlled by the distribution of the binder (Ennis et al., 1991). A high binder viscosity gives rise to a poor binder distribution and a low deformability of the molten binder droplets. This is why only a slight agglomerate growth is seen with PEG 20000 at 1 min of massing. The PEGs with the lowest viscosities cause a marked ag-
1000
800 E
600
~ 0
2.4
2
1.6
1.2
6
A 4
_E m 2
i i I I i I i L i i i i i
i L i i I i i i ~ i i i I
C.
3 6 9 12 15
Massing time (rain.)
Fig. 1. Effect of type of PEG on the mean granule size (a), the geometric standard deviation (b), and the amount of lumps (c) during massing. Starting material: lactose monohydrate. ([~) PEG 2000; (O) PEG 3000; (A) PEG 6000; (V) PEG 8000; (~)) PEG 10000; ( x ) PEG 20000.

T. Schcefer, C. Mathiesen / International Journal of Pharmaceutics 139 (1996) 125-138 131
with PEG 10000 and PEG 20000 than with the PEGs of lower viscosities (Fig. la). This delayed agglomerate growth is ascribed to the slower dis- tribution of binders of a high viscosity.
Between 3 min and 12 min, prolonged massing results in a significantly larger mean granule size (P < 0.00l), whereas no effect of massing time is seen between 12 rain and 15 rain. The type of PEG was found to have a slight effect (P < 0.05) on the mean granule size. PEG 6000 causes the smallest granule size, and the largest granule sizes are obtained with PEG 2000 and PEG 20000. However, this effect is seen at 9 and 12 min of massing only.
Fig. 1 b shows that the size distribution becomes significantly narrower (P < 0.001) at prolonged massing until 12 min, after which no further narrowing occurs. During the start of the process, PEG 6000 and PEG 8000 give rise to the narrow- est size distribution. At the end of the process, a lower viscosity is seen to cause a narrower size distribution. From 3 rain of massing, the size distributions were generally found to be in good agreement with the log-normal distribution except for a slight over-representation of larger granules. The agreement with the log-normal distribution was not found to be affected by the binder viscos- ity.
A minimum in the amount of lumps is seen at 6 rain, from which the amount of lumps rises owing to agglomerate growth (Fig. lc). The amount of lumps becomes larger, the lower the viscosity (P < 0.01). This is assumed to be due to the higher deformability of the agglomerates at decreasing viscosity.
Table 4 shows results on the reproducibility of the process. The reproducibility of the variables is generally seen to become poorer late in the pro- cess, where the agglomerate growth is more difficult to control. The standard deviation on the mean granule size was previously found to be about 20/~m (Schaefer et al., 1993) in experiments with lactose monohydrate in the same mixer. The standard deviation is higher in the present experi- ments, because the higher impeller speed makes the process less reproducible. The analysis of vari- ance gave no indication of an effect of binder viscosity on the reproducibility.
Table 4 The reproducibility of the process expressed by the standard deviations of the dependent variables estimated by analysis of variance at varying massing times
Dependent variable Massing time
6 and 9 min 12 and 7t5 rain
dg w (/~m) 53 84 sg 0.020 0.017 Lumps (%) 0.3 1.0 Porosity (%) 0.17 0.26 Liquid satur. (%) 0.7 1.0 Water content (%) 0.074 0.098 Energy input (kJ/kg) 7.6 10.0 Product temp. (°C) 1.0 1.9
Starting material: lactose monohydrate.
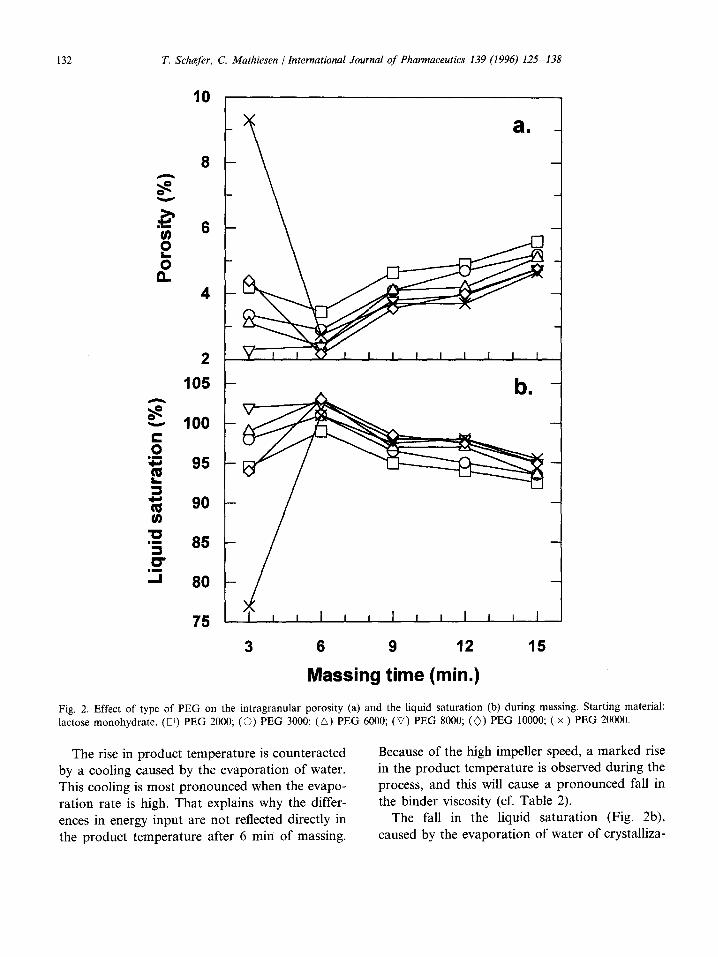
Fig. 2a shows a fall in the intragranular poros- ity until 6 min of massing. A high viscosity delays the densification, and this is why the porosity at 3 min is markedly higher with PEG 20000 than with the other PEGs. The high porosity with the PEG 20000 gives rise to a low liquid saturation, which explains the low initial agglomerate growth rate seen with PEG 20000. After 6 min of massing, the porosity increases, and a simultaneous fall in liq- uid saturation is seen. This increase in porosity was previously found to be due to evaporation of water of crystallization giving rise to formation of small pores (Schaefer and Mathiesen, 1996).
Fig. 3 shows that water of crystallization es- capes during the process. The initial water content of the agglomerates was 4.1-4.2% dependent on the water content of the PEG (cf. Table 1). As can be seen, the evaporation of water is increased by a lower binder viscosity. A lower binder viscosity gives rise to a higher energy input (Fig. 4a). This is due to a higher surface plasticity of the agglom- erates which causes a higher power consumption of the impeller motor (Schaefer et al., 1992b). Since the energy input is converted into heat of friction within the mass, a lower binder viscosity will result in a higher product temperature (Fig. 4b) in accordance with previous results (Schaefer et al., 1990, 1992a). The evaporation of water of crystallization is augmented by the higher product temperature, and this is why the evaporation de- pends on the binder viscosity.
1 3 2 7'. Schcef er, C. Mathiesen / International Journal of Pharmaceutics 139 (1996) 125-/38
10
V
0 L _
0
8
4
a .
1 0 5 -
=~" 1 0 0
~ 95
90
8O
75
t~
| m
,=i
. m
--I
i I i i I i i I i i I
3 6 9 12 15
M a s s i n g t i m e ( m i n . )
Fig. 2. Effect of type of PEG on the intragranular porosity (a) and the liquid saturation (b) during massing. Starting material: lactose monohydrate. (~) PEG 2000; ((3) PEG 3000; (A) PEG 6000; (V) PEG 8000; (~ ) PEG 10000; ( x ) PEG 20000.
The rise in product temperature is counteracted by a cooling caused by the evaporation of water. This cooling is most pronounced when the evapo- ration rate is high. That explains why the differ- ences in energy input are not reflected directly in the product temperature after 6 rain of massing.
Because of the high impeller speed, a marked rise in the product temperature is observed during the process, and this will cause a pronounced fall in the binder viscosity (cf. Table 2).
The fall in the liquid saturation (Fig. 2b), caused by the evaporation of water of crystalliza-
T. Schaefer, C. Mathiesen /International Journal of Pharmaceutics 139 (1996) 125 138 133
1.5
6 9 12 15
Massing time (min . )
3.5
= 3
0 o 2.5
2
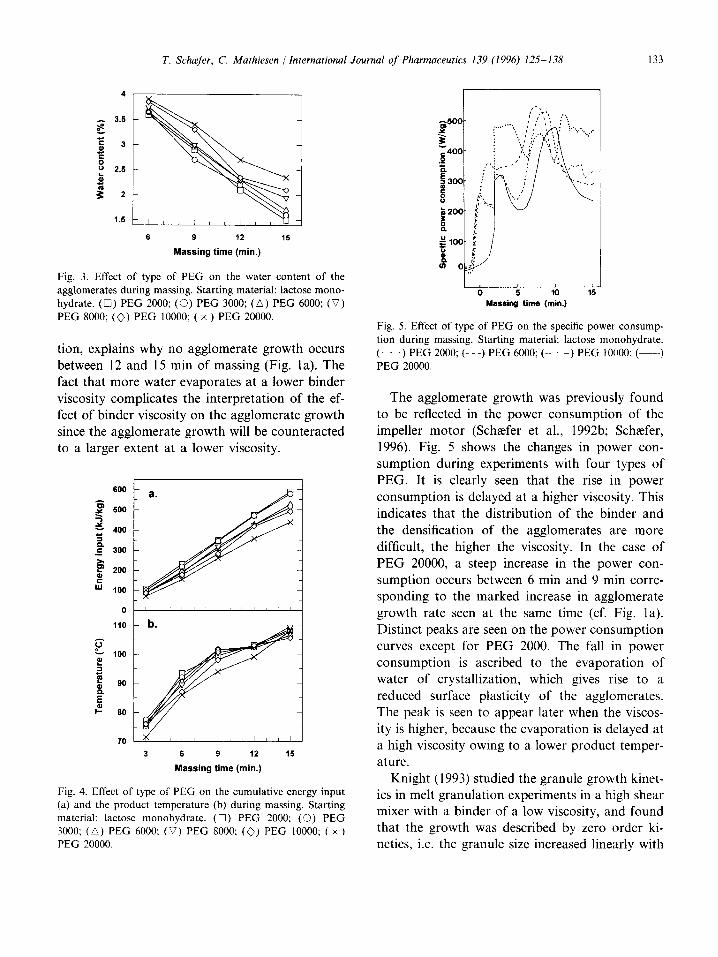
Fig. 3. Effect of type of PEG on the water content of the agglomerates during massing. Starting material: lactose mono- hydrate. (D) PEG 2000; (O) PEG 3000; (A) PEG 6000; (V) PEG 8000; ( ~ ) PEG 10000; ( x ) PEG 20000.
tion, explains why no agglomerate growth occurs between 12 and 15 min of massing (Fig. l a). The fact that more water evaporates at a lower binder viscosity complicates the interpretation of the ef- fect of binder viscosity on the agglomerate growth since the agglomerate growth will be counteracted to a larger extent at a lower viscosity.
600
500
400 e ~ .¢ 3OO
200 4) C " ' 100
0
110
100
"~ 9O
E I- 8O
70
I I r I I I I h I I [ I I
3 6 9 12 15
Massing time (rain.)
Fig. 4. Effect of type of PEG on the cumulative energy input (a) and the product temperature (b) during massing. Starting material: lactose monohydrate. ( [ ] ) PEG 2000; (©) PEG 3000; (A) PEG 6000: (V) PEG 8000; ( ~ ) PEG 10000; ( x ) PEG 20000.
-~500 ,=¢
¢ 400 .2
300 ¢: o0 |2o~
o . g l J
6 ; +~) i+ Massing time (rain.)
Fig. 5. Effect of type of PEG on the specific power consump- tion during massing. Starting material: lactose monohydrate. (. • .) PEG 2000; (-- -) PEG 6000; ( . . . . . ) PEG 10000; (-----) PEG 20000.
The agglomerate growth was previously found to be reflected in the power consumption of the impeller motor (Schaefer et al., 1992b; Schaefer, 1996). Fig. 5 shows the changes in power con- sumption during experiments with four types of PEG. It is clearly seen that the rise in power consumption is delayed at a higher viscosity. This indicates that the distribution of the binder and the densification of the agglomerates are more difficult, the higher the viscosity. In the case of PEG 20000, a steep increase in the power con- sumption occurs between 6 min and 9 min corre- sponding to the marked increase in agglomerate growth rate seen at the same time (cf. Fig. l a). Distinct peaks are seen on the power consumption curves except for PEG 2000. The fall in power consumption is ascribed to the evaporation of water of crystallization, which gives rise to a reduced surface plasticity of the agglomerates. The peak is seen to appear later when the viscos- ity is higher, because the evaporation is delayed at a high viscosity owing to a lower product temper- ature.
Knight (1993) studied the granule growth kinet- ics in melt granulation experiments in a high shear mixer with a binder of a low viscosity, and found that the growth was described by zero order ki- netics, i.e. the granule size increased linearly with

134 T. Schcefer, C. Mathiesen / International Journal of Pharmaceutics 139 (1996) 125-138
Table 5 The results of regression analysis of the linear correlation between time (t, min) and mean d g w = a + t x b
granule size (dgw, ~m):
PEG Mean viscosity (mPa. s) a (pm) b (pm/min) Correlation coefficient
2000 51 348 47 0.989 3000 112 278 51 0.981 6000 473 254 45 0.987 8000 799 255 54 0.913
10000 2570 185 59 0.941 20000 14 700 148 67 0.956
Time interval: 3-12 min. Starting material: lactose monohydrate.
time. In order to evaluate if the growth kinetics in the present experiments was of zero order or of first order, regression analysis was carried out of the linear correlation between time and mean granule size (Table 5) and between time and log mean granule size (Table 6). The results at 15 min are omitted from the regression analysis, since the agglomerate growth between 12 min and 15 min of massing is markedly counteracted by the evap- oration of water of crystallization. The mean vis- cosities stated in Table 5 are the mean values of the viscosities corresponding to the product tem- peratures at 6 min and 9 min.
Neither the linear model (Table 5) nor the exponential model (Table 6) was rejected by the regression analysis except for PEG 20000, which gave rise to rejection of both models. The rather high standard deviation on the mean granule size (cf. Table 4) explains why it is impossible to decide if the growth kinetics is of zero order or of
Table 6 The results of regression analysis of the linear correlation between time (t, min) and log mean granule size (dgw, pm): log dg w = loga + t x logb
PEG a (/~m) %/min Correlation coefficient
2000 405 7.2 0.985 3000 357 8.1 0.991 6000 319 8.0 0.993 8000 319 9.5 0.916
10000 284 10.3 0.960 20000 268 11.5 0.960
Time interval: 3-12 min. The percentage increase in dgw per min (%/min) is calculated on the basis of the constant b. Starting material: lactose monohydrate.
first order. In the case of PEG 20000, the viscosity is so high that the agglomerate growth becomes atypical, and, therefore, none of the models can be used for a description of the growth.
It appears from the correlation coefficients in Tables 5 and 6 that the correlation becomes better at the low viscosities, and that the exponential model gives rise to a slightly better correlation than the linear model. The value, a, obtained from the regression lines is the size of the granules at time zero (Knight, 1993). The agglomerate growth rate is expressed in/ tm/min (Table 5) or in %/min (Table 6). Both models show that a higher binder viscosity results in a smaller initial granule size. This is due to a more difficult distri- bution of the binder as mentioned above. When the distribution of the binder is finished, however, a higher viscosity is seen to increase the agglomer- ate growth rate according to Eq. (2). These coun- teracting effects of binder viscosity on granule size are the cause of the unclear effect of binder viscosity on the final granule sizes in Fig. l a.
The adhesion of material to the bowl was slightly increased during the process and varied between 6% and 10% at 15 min of massing. The adhesion was significantly greater (P < 0.001) at a higher viscosity indicating that the adhesion forces are related to the binder viscosity in accor- dance with previous results (Ugri-Hunyadv~ri, 1975a,b; Massoud and Bauer, 1989).
The shape of the pellets was characterized by the aspect ratio (ratio of length to width), which is a suitable measure of the shape, provided that the pellets show a smooth surface (Lindner and Kleinebudde, 1994). This was the case in the

T. Schcefer, C. Mathiesen / International Journal of Pharmaceuties 139 (1996) 125-138 135
4.2. Experiments with anhydrous lactose
Fig. 6. SEM photographs of pellets produced from lactose monohydrate. Massing time: 15 min. Binder: PEG 2000 (a); PEG 20000 (b).
The effect of binder viscosity was further inves- tigated in a few complementary experiments with anhydrous lactose in order to avoid agglomerate growth being affected by evaporation of water of crystallization. The results are shown in Table 8.
The mean granule size shows a minimum with PEG 6000 and PEG 8000. The PEGs of lower as well as higher viscosities give rise to a larger granule size. The same tendency, although less clear, was seen in the experiments with lactose monohydrate. A higher binder viscosity causes a narrower size distribution and a larger amount of lumps with anhydrous lactose. The opposite effect of binder viscosity was observed with lactose monohydrate (Fig. lb,c). The anhydrous lactose generally gives rise to a wider size distribution and to a smaller amount of lumps than lactose mono- hydrate. In the experiments with PEG 2000, the amount of fines smaller than 250 /zm was found by sieve analysis to be about 2%, and fine parti- cles were seen to adhere to the surface of the pellets. Practically no fines were observed in the experiments with lactose monohydrate and in the other experiments with anhydrous lactose.
The strength of the agglomerates produced with anhydrous lactose is lower than the strength of
Table 7 Effect of the type of PEG on the aspect ratios of the pellets estimated by image analysis
PEG Aspect ratio
present experiments as illustrated in Fig. 6. Table 2000
7 shows that the pellets become more spherical (P < 0.001), and that the variation in shape is lower 3ooo (P < 0.001) when the binder viscosity is lower. The higher surface plasticity at lower viscosity 6ooo makes the rounding of the agglomerates easier.
8000 Fig. 6 shows the difference in shape between pellets produced with PEG 2000 and PEG 20000 1oooo respectively. The aspect ratios of the pellets pro- duced with PEG 2000 and PEG 3000 are lower 2oooo than, or similar to the optimum aspect ratios of pellets previously produced by extrusion/ spheronization (Kleinebudde, 1994; Kleinebudde et al., 1994; Lindner and Kleinebudde, 1994).
1.093 (0.083) 1.093 (0.071) 1.105 (0.079) l.lO0 (0.072) 1.14l (0.097) 1.143 (0.095) 1.169 (0.115) 1.182 (0.109) 1.282 (0.171) 1.233 (0.149) 1.287 (0.182) 1.294 (0.188)
Results of repeated experiments are shown with standard deviations in parantheses. Starting material: lactose monohy- drate. Massing time: 15 min.

136 T. Schtefer, C. Mathiesen /International Journal of Pharmaceutics 139 (1996) 125-138
Table 8 Results of the repeated experiments with anhydrous lactose and different types of PEG
Dependent variable PEG
2000 3000 6000 8000 10000
dgw (/~m) 973 1163 860 853 1142 1250 1147 766 819 1104
sg 1.85 1.43 1.44 1.47 1.34 1.53 1.46 1.45 1.48 1.33
Lumps (%) 0.3 0.4 0.6 1.3 1.5 0.6 0.4 0.5 1.4 1.8
Porosity (%) 1.1 1.3 1.2 1.1 1.5 1.3 1.3 1.2 1.3 1.4
Liquid satur. (%) 111 109 110 110 108 110 110 110 109 109
Energy input (kJ/kg) 392 378 320 321 339 398 376 327 328 330
Product temp. (°C) 118 114 111 109 109 120 116 - - 111 112
Aspect ratio 1.164 1.120 1.132 1.140 1.183 1.161 1.116 1.138 1.132 1.181
Massing time: 12 min.
those produced with lactose monohydrate, be- cause anhydrous lactose has a larger initial parti- cle size (Rumpf, 1962). Agglomeration is a balance between comminution and growth. The weaker the agglomerates, the more comminution will occur. This is why the size distribution be- comes wider, and the amount of lumps becomes lower when anhydrous lactose is used instead of monohydrate. The experiments with anhydrous lactose indicate that the strength of the agglomer- ates is increased by a higher viscosity since less fines, more lumps, and a narrower size distribu- tion are obtained at increasing binder viscosity. This effect is not seen with lactose monohydrate, because the agglomerate strength is high enough to resist comminution at all the binder viscosities examined.
The intragranular porosities of the agglomer- ates produced with anhydrous lactose are not affected by an evaporation of water of crystalliza- tion. The porosities shown in Table 8 are, there- fore, lower than those seen in Fig. 2a. The liquid saturations in Table 8 exceed 100% indicating that free binder liquid is present on the surface of the agglomerates. This is because the liquid saturation has to be high in order to promote an agglomer-
ate growth by coalescence, which is sufficient to overcome the tendency to comminution.
The cumulative energy input at 12 min of mass- ing is lower with anhydrous lactose than with lactose monohydrate, because the particles of an- hydrous lactose are less cohesive owing to a larger size. Nevertheless, the product temperature be- comes higher, because the agglomerates of anhy- drous lactose are not cooled by an evaporation of water of crystallization.
The aspect ratios show that the most spherical pellets are obtained with the PEG 3000. The pellets become less spherical at higher viscosities in accordance with the results in Table 7. The effect of binder viscosity on the sphericity is, however, less pronounced with anhydrous lactose, because the agglomerates are more deformable owing to a higher liquid saturation. With the PEG 2000, the lower agglomerate strength causes a deformability that is too high to resist the shear- ing forces, and this makes the pellets less spheri- cal.
Since the agglomerate growth is reflected in the power consumption of the impeller motor, the power consumption curve gives an indirect indica- tion of the agglomerate growth during the pro-
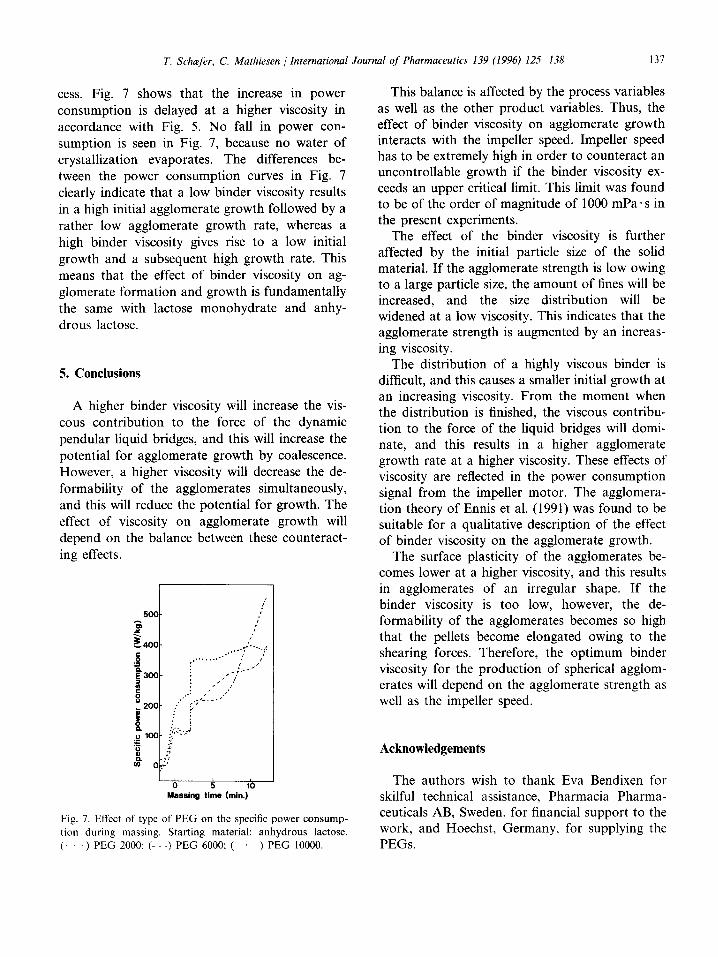
T. Schcefer, C. Mathiesen / International Journal of Pharmaceutics 139 (1996)125-138 137
cess. Fig. 7 shows that the increase in power consumption is delayed at a higher viscosity in accordance with Fig. 5. No fall in power con- sumption is seen in Fig. 7, because no water of crystallization evaporates. The differences be- tween the power consumption curves in Fig. 7 clearly indicate that a low binder viscosity results in a high initial agglomerate growth followed by a rather low agglomerate growth rate, whereas a high binder viscosity gives rise to a low initial growth and a subsequent high growth rate. This means that the effect of binder viscosity on ag- glomerate formation and growth is fundamentally the same with lactose monohydrate and anhy- drous lactose.
5. Conclusions
A higher binder viscosity will increase the vis- cous contribution to the force of the dynamic pendular liquid bridges, and this will increase the potential for agglomerate growth by coalescence. However, a higher viscosity will decrease the de- formability of the agglomerates simultaneously, and this will reduce the potential for growth. The effect of viscosity on agglomerate growth will depend on the balance between these counteract- ing effects.
5OO
~400 ._~ i 3o0 == 8
200
!
~ o
/
! !
. /
. . . . . . . , . • .t / t /
/ " t t
?
;.::=.,J"
g :c,
d g lb Massing time (rain.)
Fig. 7. Effect of type of PEG on the specific power consump- tion during massing. Starting material: anhydrous lactose• (. • -) PEG 2000; ( - - - ) PEG 6000; ( • ) PEG 10000.
This balance is affected by the process variables as well as the other product variables. Thus, the effect of binder viscosity on agglomerate growth interacts with the impeller speed. Impeller speed has to be extremely high in order to counteract an uncontrollable growth if the binder viscosity ex- ceeds an upper critical limit. This limit was found to be of the order of magnitude of 1000 mPa" s in the present experiments.
The effect of the binder viscosity is further affected by the initial particle size of the solid material. If the agglomerate strength is low owing to a large particle size, the amount of fines will be increased, and the size distribution will be widened at a low viscosity. This indicates that the agglomerate strength is augmented by an increas- ing viscosity.
The distribution of a highly viscous binder is difficult, and this causes a smaller initial growth at an increasing viscosity. From the moment when the distribution is finished, the viscous contribu- tion to the force of the liquid bridges will domi- nate, and this results in a higher agglomerate growth rate at a higher viscosity. These effects of viscosity are reflected in the power consumption signal from the impeller motor. The agglomera- tion theory of Ennis et al. (1991) was found to be suitable for a qualitative description of the effect of binder viscosity on the agglomerate growth.
The surface plasticity of the agglomerates be- comes lower at a higher viscosity, and this results in agglomerates of an irregular shape. If the binder viscosity is too low, however, the de- formability of the agglomerates becomes so high that the pellets become elongated owing to the shearing forces• Therefore, the optimum binder viscosity for the production of spherical agglom- erates will depend on the agglomerate strength as well as the impeller speed•
Acknowledgements
The authors wish to thank Eva Bendixen for skilful technical assistance, Pharmacia Pharma- ceuticals AB, Sweden, for financial support to the work, and Hoechst, Germany, for supplying the PEGs.

138 T. Schaefer, C. Mathiesen / International Journal o f Pharmaceutics 139 (1996) 125-138
References
Adetayo, A.A., Modelling and Simulation o f a Fertilizer Granu- lation Circuit. Ph.D. Thesis, University of Queensland, Australia, 1993.
Ennis, B.J., Tardos, G. and Pfeffer, R., A microlevel-based characterization of granulation phenomena. Powder Tech- nol., 65 (1991) 257-272.
Hoornaert, F., Meesters, G., Pratsinis, S. and Scarlett, B., Powder agglomeration in a L6dige granulator. Proceedings of the 1st International Particle Technology Forum, Den- ver, CO, Part I, 1994, pp. 278-283.
J~iger, K.-F. and Bauer, K.H., Verwendung von Poly- merblends aus Polyvinylpyrrolidonen zur Optimierung der Eigenschaften von Aufbaugranulaten und Tabletten. Acta Pharm. Technol., 30 (1984) 85-92.
Kinget, R. and Kemel, R., Preparation and properties of granulates containing solid dispersions. Acta Pharm. Tech- nol., 31 (1985) 57-62.
Kleinebudde, P., Shrinking and swelling properties of pellets containing microcrystalline cellulose and low substituted hydroxypropylcellulose: I. Shrinking properties. Int. J. Pharm., 109 (1994) 209 219.
Kleinebudde, P., Solvberg, A.J. and Lindner, H., The power- consumption-controlled extruder: a tool for pellet produc- tion. J. Pharm. Pharmacol., 46 (1994) 542-546.
Knight, P.C., An investigation of the kinetics of granulation using a high shear mixer. Powder Technol., 77 (1993) 159-169.
Kokubo, H., Nakamura, S. and Sunada, H., Effect of several cellulosic binders on particle size distribution of granules prepared by a high-speed mixer. Chem. Pharm. Bull., 41 (1993) 2151-2155.
Kristensen, H.G., Particle agglomeration. In Ganderton, D., Jones, T. and McGinity, J. (Eds.), Advances in Pharmaceu- tical Sciences, Vol. 7, Academic Press, London, 1995, pp. 221 272.
Lindner, H. and Kleinebudde, P., Use of powdered cellulose for the production of pellets by extrusion/spheronization. J. Pharm. Pharmacol., 46 (1994) 2-7.
Massoud, A. and Bauer, K.H., Klebkraft/Zeit-Kurven von ausgew~ihlten Bindemittell6sungen und Zusammenh/inge mit der Granulatbildung. Pharm. Ind., 51 (1989) 1287- 1292.
Mazzone, D.N., Tardos, G.I. and Pfeffer, R., The behavior of liquid bridges between two relatively moving particles. Powder Technol., 51 (1987) 71-83.
Ritala, M., Jungersen, O., Holm, P., Schaefer, T. and Kris- tensen, H.G., A comparison between binders in the wet phase of granulation in a high shear mixer. Drug Dev. Ind. Pharm., 12 (1986) 1685-1700.
Rumpf, H., In Knepper, W.A. (Ed.), Agglomeration, Inter- science Publishers, New York, 1962, pp. 379-414.
Schaefer, T., Melt pelletization in a high shear mixer. VI. Agglomeration of a cohesive powder. Int. J. Pharm., 132 (1996) 221-230.
Schaefer, T. and Mathiesen, C., Melt pelletization in a high shear mixer. VII. Effects of product temperature. Int. J. Pharm., 134 (1996) 105-117.
Schaefer, T. and Worts, O., Control of fluidized bed granula- tion. IV. Effects of binder solution and atomization on granule size and size distribution. Arch. Pharm. Chem. Sci. Ed., 6 (1978) 14-25.
Schaefer, T., Holm, P. and Kristensen, H.G., Melt granulation in a laboratory scale high shear mixer. Drug Dev. Ind. Pharm., 16 (1990) 1249 1277.
Schaefer, T., Holm, P. and Kristensen, H.G., Melt pelletization in a high shear mixer. I. Effects of process variables and binder. Acta Pharm. Nord., 4 (1992a) 133-140.
Schaefer, T., Holm, P. and Kristensen, H.G., Melt pelletization in a high shear mixer. II. Power consumption and granule growth. Acta Pharm. Nord., 4 (1992b) 141 148.
Schaefer, T., Taagegaard, B., Thomsen, L.J. and Kristensen, H.G., Melt pelletization in a high shear mixer. IV. Effects of process variables in a laboratory scale mixer. Eur. J. Pharm. Sci., 1 (1993) 125 131.
Thomsen, L.J., Schaefer, T., M.-Sonnergaard, J. and Kris- tensen, H.G., Prolonged release matrix pellets prepared by melt pelletization. I. Process variables. Drug Dev. Ind. Pharm., 19 (1993) 1867-1887.
Ugri-Hunyadv~ri, E., Der Einftuss der Eigenschaften des Bindemittels auf die Konsistenz des Granulats, 2. Mitt.: Die Wirkung des Polymerisationsgrades der zur Gran- ulierung verwendeten Tylose-Arten. Arch. Pharmaz., 308 (1975a) 265 271.
Ugri-Hunyadv~iri, E., Der Einfluss der Eigenschaften des Bindemittels auf die Konsistenz des Granulats, 1. Mitt.: Die Wirkung der Eigenschaften der zum Granulieren ver- wendeten Granulierfliissigkeit. Arch. Pharmaz., 308 (1975b) 615-622.
Visavarungroj, N., Herman, J. and Remon, J.P., Crosslinked starch as binding agent. I. Conventional wet granulation. Int. J. Pharm., 59 (1990) 73-78.
Wan, L.S.C. and Lira, K.S., Action of binders in the fluidized bed granulation of lactose. Sip Pharma Sci., 1 (1991) 248-255.