measuring the true value of public relations v2 -...
TRANSCRIPT

Measuring the True Value of Public RelationsHow an AMEC initiative changed the way PR Measurement was seen
November 2012
Seven Principles of PR Measurement
1. Importance of Goal Setting and Measurement
2. Measuring the Effect on Outcomes is Preferred to Measuring Outputs
3. The Effect on Business Results Can and Should Be Measured Where Possible
4. Media Measurement Requires Quantity and Quality
5. AVEs are not the Value of Public Relations
6. Social Media Can and Should be Measured
7. Transparency and Replicability are Paramount to Sound Measurement
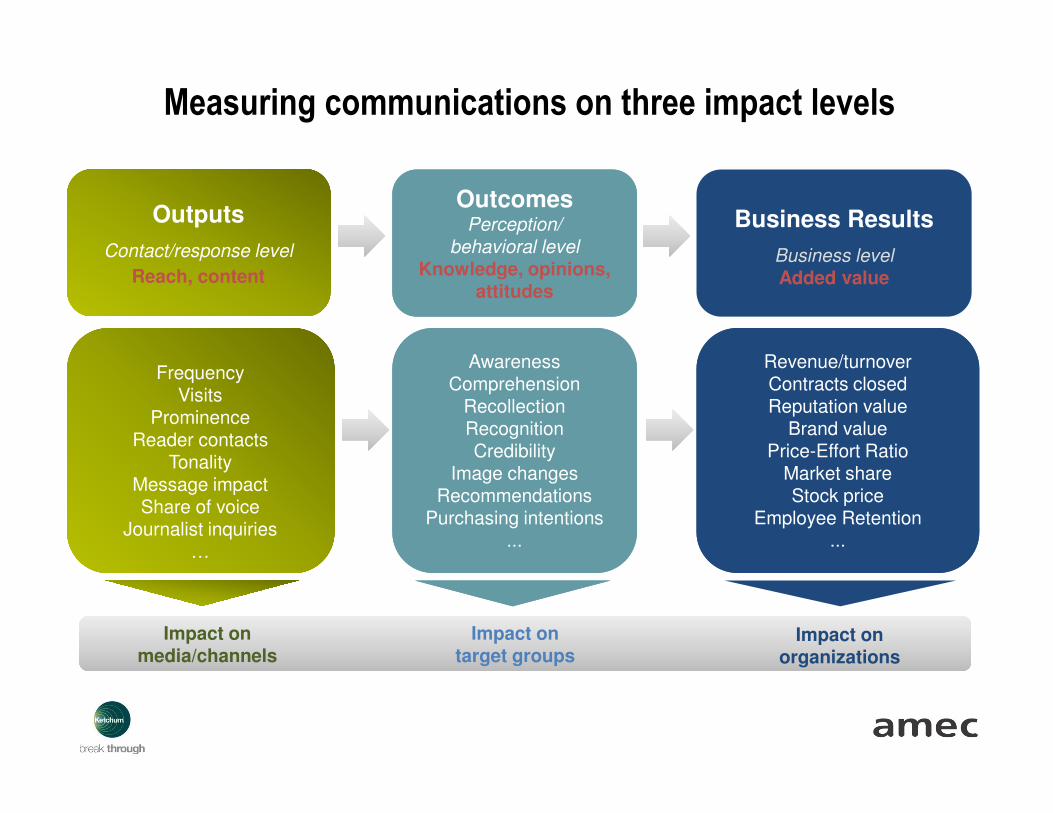
Outputs
Contact/response level
Reach, content
Outputs
Contact/response level
Reach, content
Business Results
Business level
Added value
OutcomesPerception/
behavioral level
Knowledge, opinions, attitudes
OutcomesPerception/
behavioral level
Knowledge, opinions, attitudes
FrequencyVisits
ProminenceReader contacts
TonalityMessage impactShare of voice
Journalist inquiries…
FrequencyVisits
ProminenceReader contacts
TonalityMessage impactShare of voice
Journalist inquiries…
AwarenessComprehension
RecollectionRecognitionCredibility
Image changesRecommendations
Purchasing intentions...
AwarenessComprehension
RecollectionRecognitionCredibility
Image changesRecommendations
Purchasing intentions...
Revenue/turnoverContracts closedReputation value
Brand valuePrice-Effort Ratio
Market shareStock price
Employee Retention...
Revenue/turnoverContracts closedReputation value
Brand valuePrice-Effort Ratio
Market shareStock price
Employee Retention...
Measuring communications on three impact levels
Impact on media/channels
Impact on target groups
Impact onorganizations
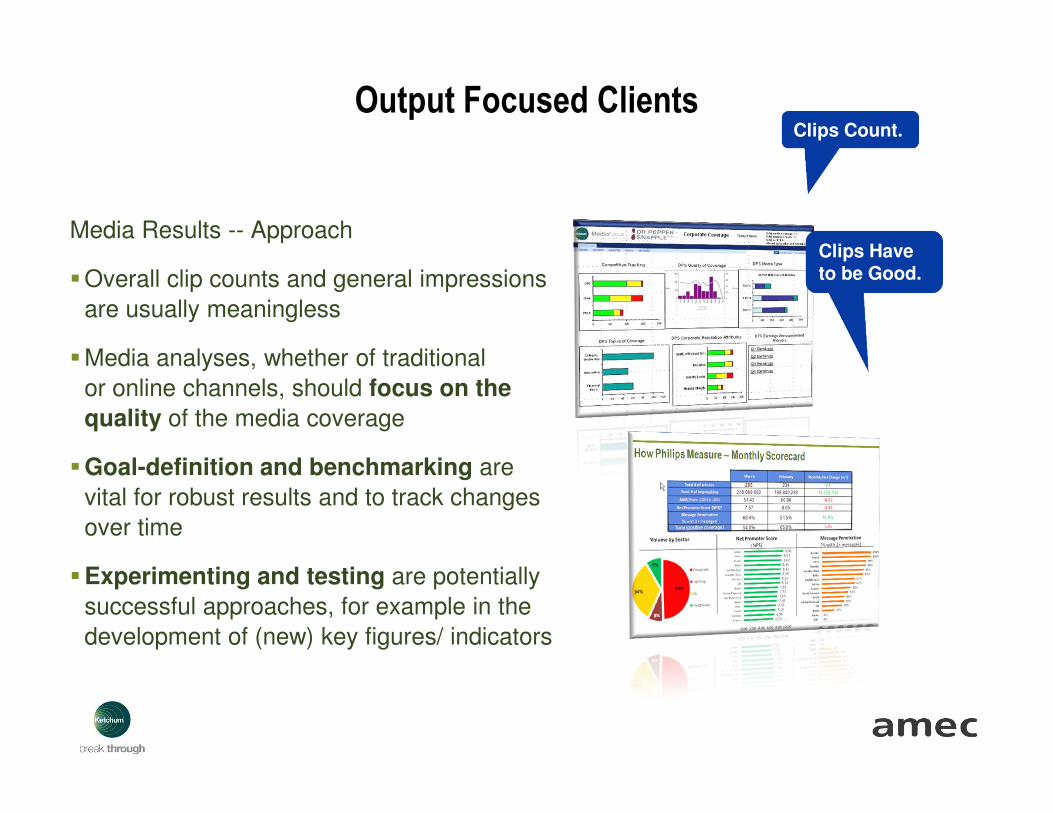
Output Focused Clients
Media Results -- Approach
�Overall clip counts and general impressions
are usually meaningless
�Media analyses, whether of traditional
or online channels, should focus on the
quality of the media coverage
�Goal-definition and benchmarking are
vital for robust results and to track changes
over time
�Experimenting and testing are potentially
successful approaches, for example in the
development of (new) key figures/ indicators
Clips Count.
Clips Have to be Good.
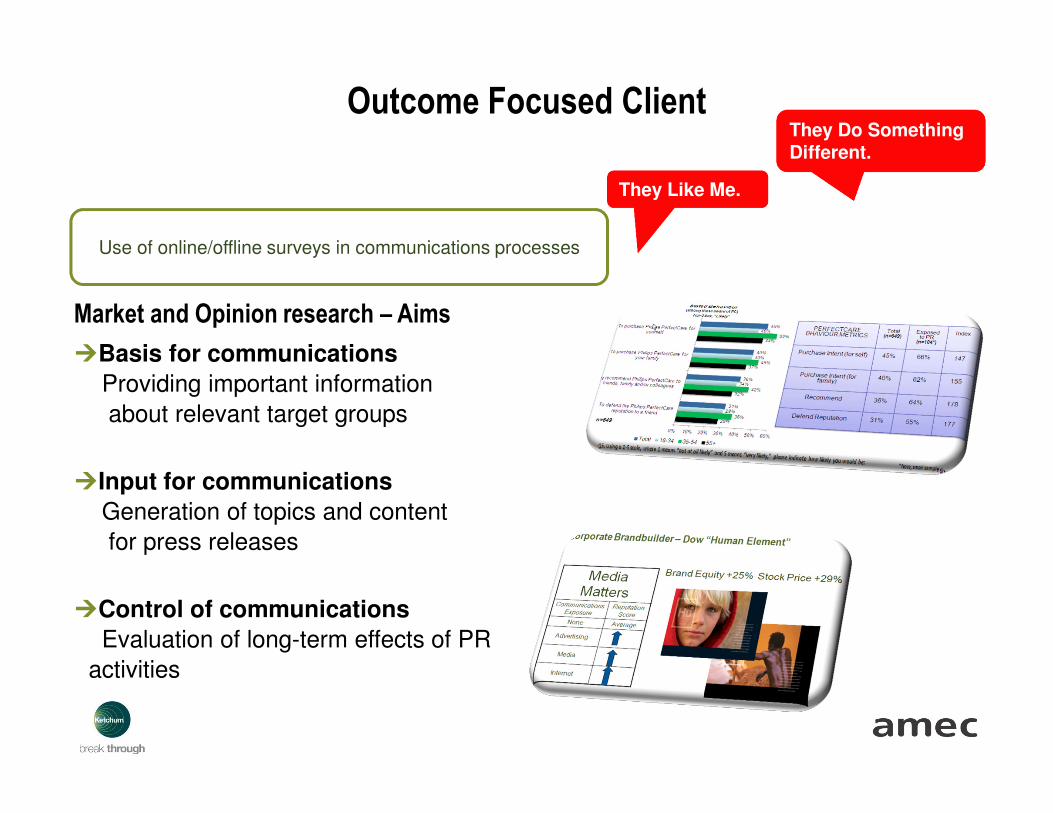
Outcome Focused Client
Market and Opinion research – Aims
�Basis for communications
Providing important information
about relevant target groups
�Input for communications
Generation of topics and content
for press releases
�Control of communications
Evaluation of long-term effects of PR
activities
Use of online/offline surveys in communications processes
They Like Me.
They Do Something Different.

Organizational Results Focused Client
Money Matters.
Set Goals First Before Measuring
Communications
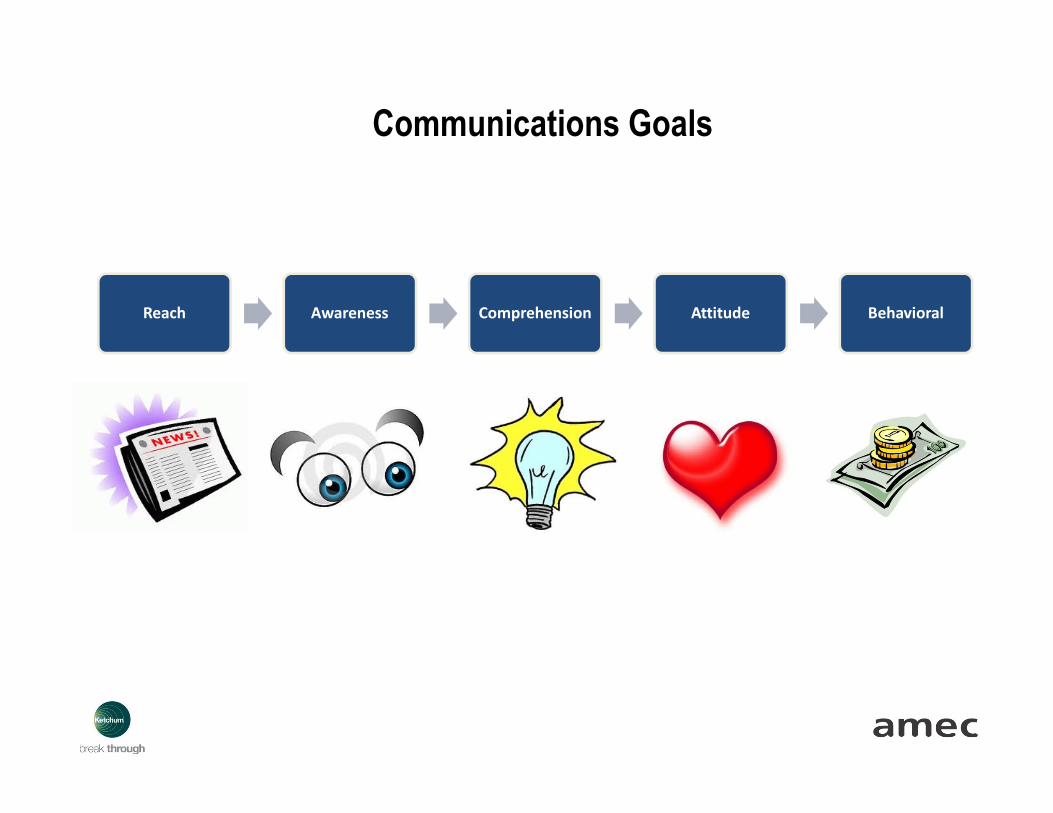
Communications Goals
Reach Awareness Comprehension Attitude Behavioral
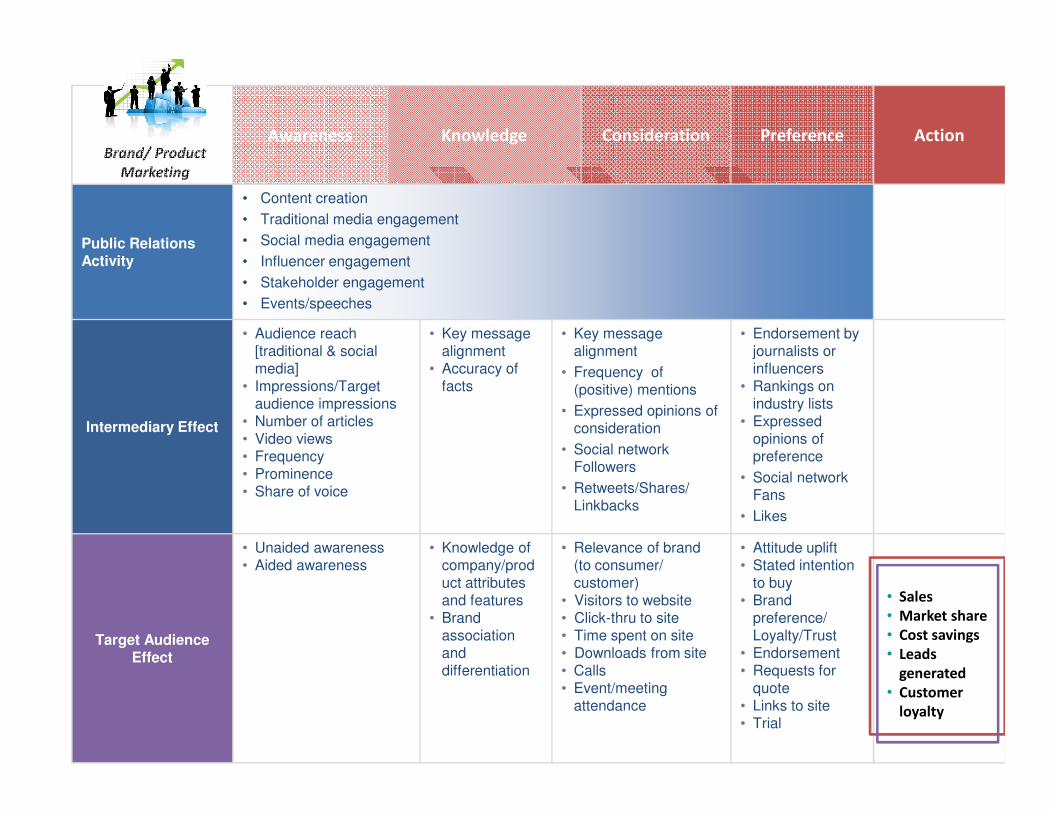
Brand/ Product
Marketing
9
Awareness Knowledge Consideration Preference Action
Public Relations Activity
• Content creation
• Traditional media engagement
• Social media engagement
• Influencer engagement
• Stakeholder engagement
• Events/speeches
Intermediary Effect
• Audience reach [traditional & social media]
• Impressions/Target audience impressions
• Number of articles• Video views• Frequency• Prominence• Share of voice
• Key message alignment
• Accuracy of facts
• Key message alignment
• Frequency of (positive) mentions
• Expressed opinions of consideration
• Social network Followers
• Retweets/Shares/ Linkbacks
• Endorsement by journalists or influencers
• Rankings on industry lists
• Expressed opinions of preference
• Social network Fans
• Likes
Target Audience Effect
• Unaided awareness• Aided awareness
• Knowledge ofcompany/product attributes and features
• Brand association and differentiation
• Relevance of brand (to consumer/ customer)
• Visitors to website• Click-thru to site• Time spent on site• Downloads from site• Calls• Event/meeting
attendance
• Attitude uplift• Stated intention
to buy• Brand
preference/ Loyalty/Trust
• Endorsement• Requests for
quote• Links to site• Trial
• Sales
• Market share
• Cost savings
• Leads
generated
• Customer
loyalty
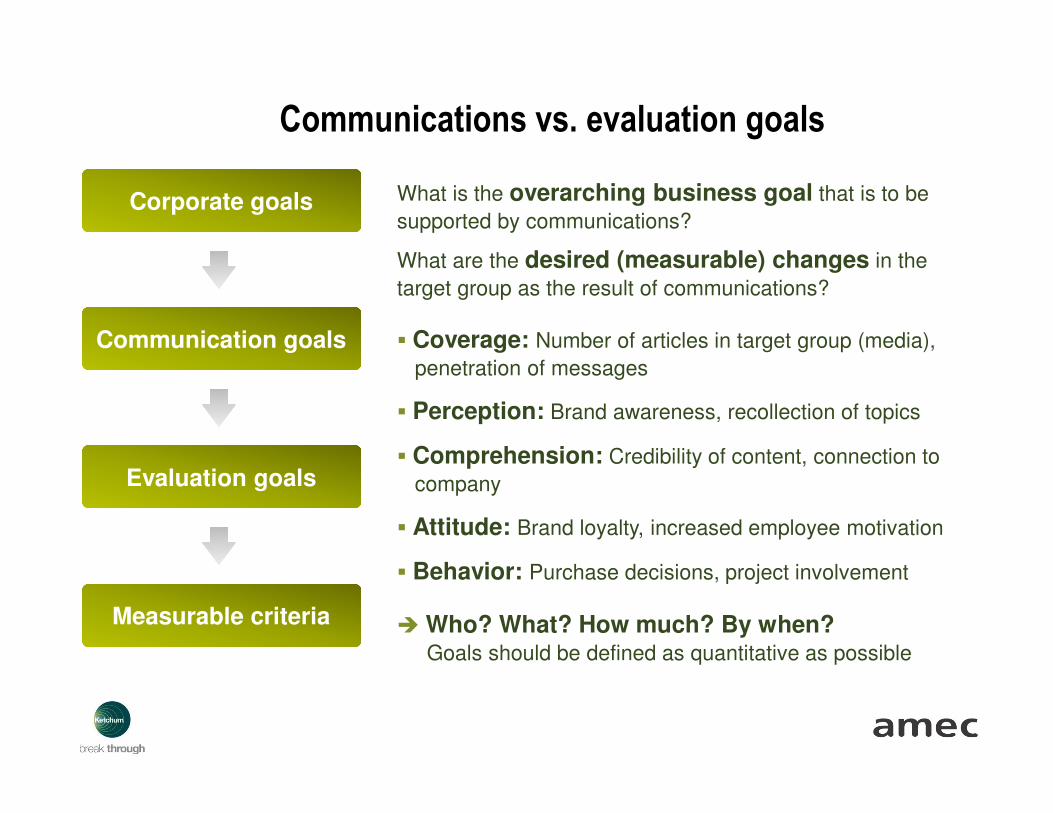
Measurable criteriaMeasurable criteria
Corporate goalsCorporate goals
Evaluation goalsEvaluation goals
Communication goalsCommunication goals
What is the overarching business goal that is to be
supported by communications?
What are the desired (measurable) changes in the
target group as the result of communications?
� Coverage: Number of articles in target group (media),
penetration of messages
� Perception: Brand awareness, recollection of topics
� Comprehension: Credibility of content, connection to
company
� Attitude: Brand loyalty, increased employee motivation
� Behavior: Purchase decisions, project involvement
� Who? What? How much? By when?Goals should be defined as quantitative as possible
Communications vs. evaluation goals
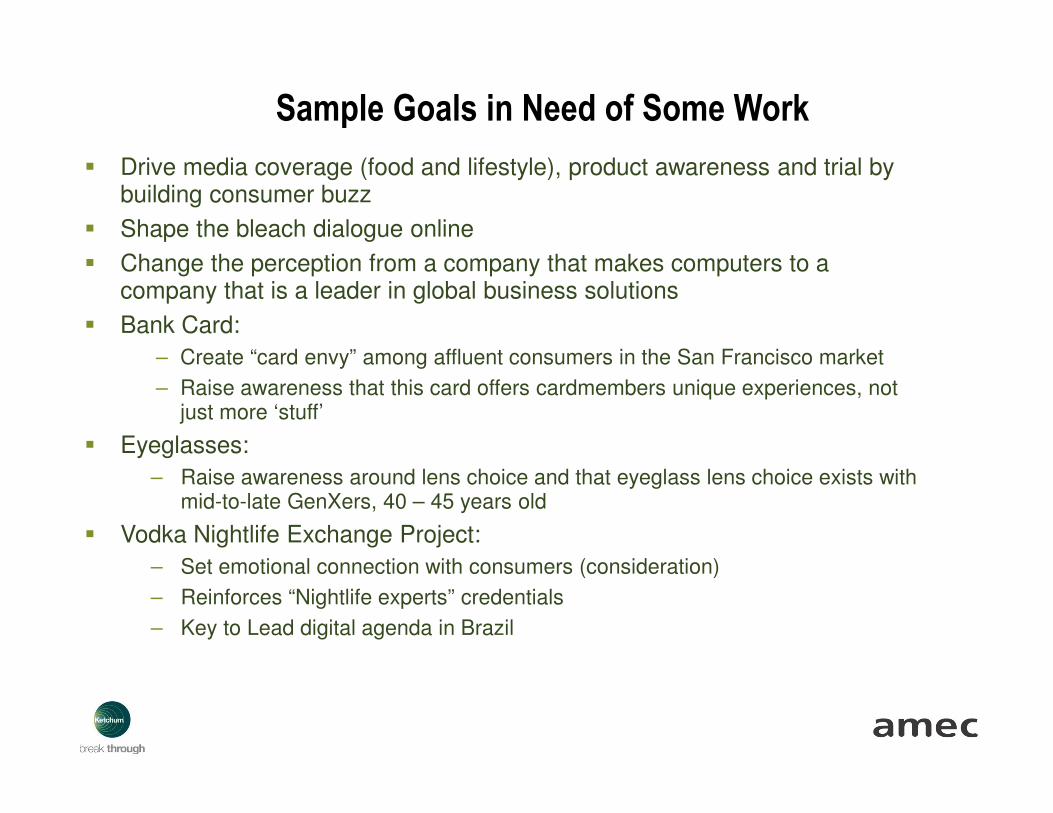
Sample Goals in Need of Some Work
� Drive media coverage (food and lifestyle), product awareness and trial by building consumer buzz
� Shape the bleach dialogue online
� Change the perception from a company that makes computers to a company that is a leader in global business solutions
� Bank Card:
– Create “card envy” among affluent consumers in the San Francisco market
– Raise awareness that this card offers cardmembers unique experiences, not just more ‘stuff’
� Eyeglasses:
– Raise awareness around lens choice and that eyeglass lens choice exists with mid-to-late GenXers, 40 – 45 years old
� Vodka Nightlife Exchange Project:
– Set emotional connection with consumers (consideration)
– Reinforces “Nightlife experts” credentials
– Key to Lead digital agenda in Brazil
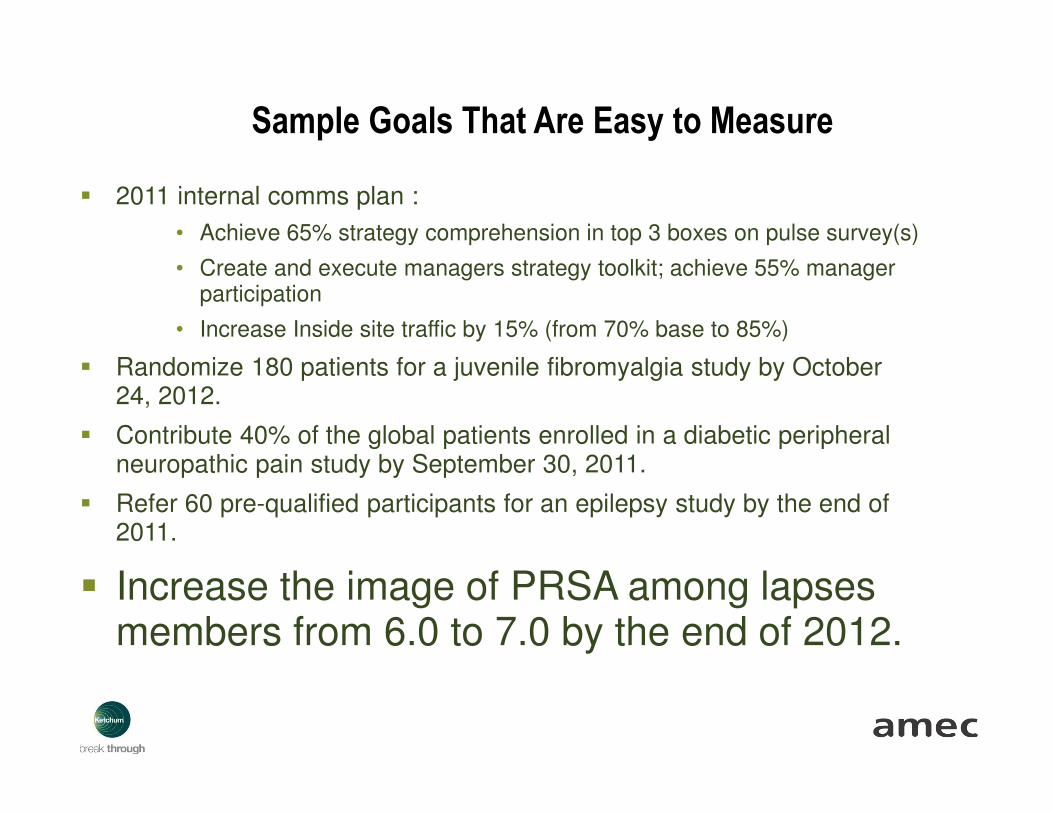
Sample Goals That Are Easy to Measure
� 2011 internal comms plan :
• Achieve 65% strategy comprehension in top 3 boxes on pulse survey(s)
• Create and execute managers strategy toolkit; achieve 55% manager participation
• Increase Inside site traffic by 15% (from 70% base to 85%)
� Randomize 180 patients for a juvenile fibromyalgia study by October 24, 2012.
� Contribute 40% of the global patients enrolled in a diabetic peripheral neuropathic pain study by September 30, 2011.
� Refer 60 pre-qualified participants for an epilepsy study by the end of 2011.
� Increase the image of PRSA among lapses members from 6.0 to 7.0 by the end of 2012.
Measure Media Quantity and Quality, Not
AVEs
Why all the fuss about AVEs? – A Discussion
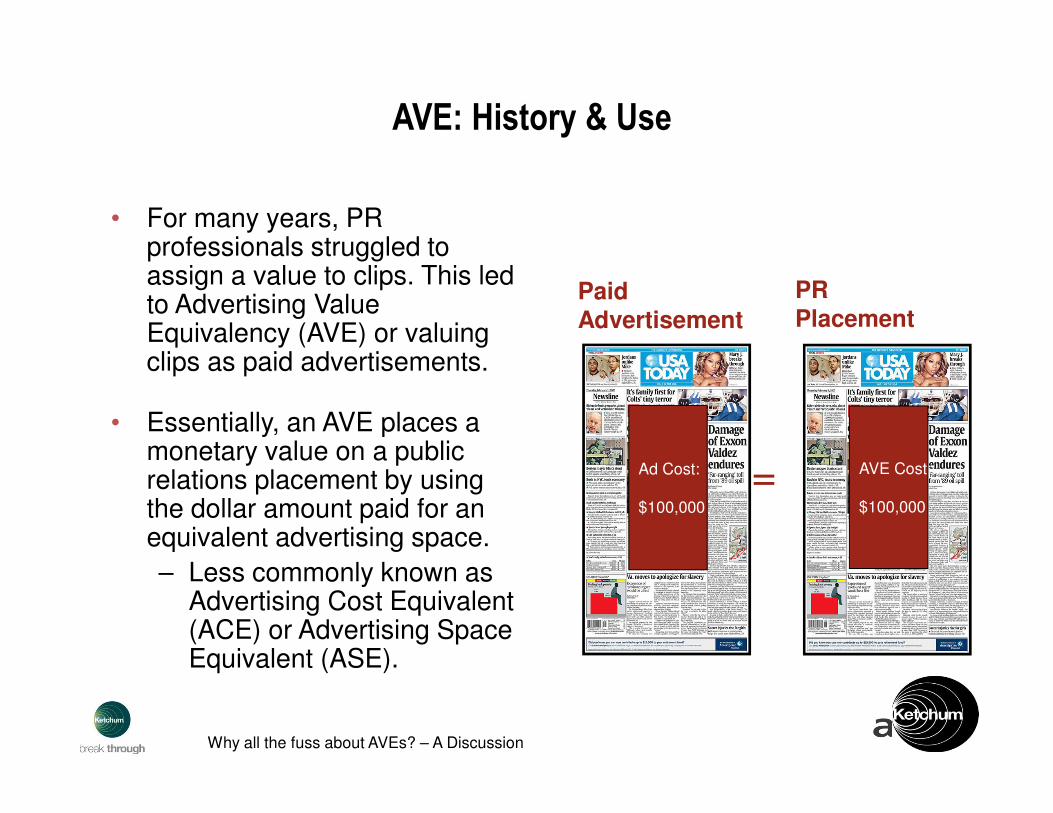
AVE: History & Use
• For many years, PR professionals struggled to assign a value to clips. This led to Advertising Value Equivalency (AVE) or valuing clips as paid advertisements.
• Essentially, an AVE places a monetary value on a public relations placement by using the dollar amount paid for an equivalent advertising space.
– Less commonly known as Advertising Cost Equivalent (ACE) or Advertising Space Equivalent (ASE).
=
Paid Advertisement
Ad Cost:
$100,000
AVE Cost:
$100,000
PR Placement
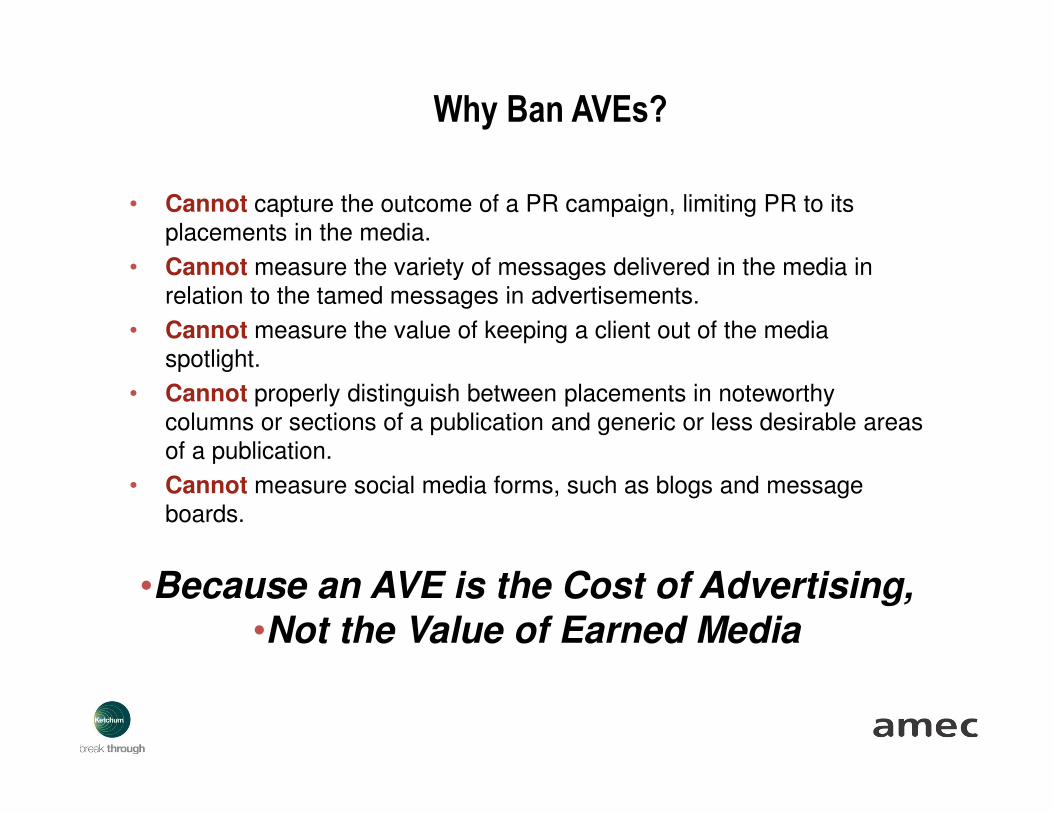
Why Ban AVEs?
• Cannot capture the outcome of a PR campaign, limiting PR to its placements in the media.
• Cannot measure the variety of messages delivered in the media in relation to the tamed messages in advertisements.
• Cannot measure the value of keeping a client out of the media spotlight.
• Cannot properly distinguish between placements in noteworthy columns or sections of a publication and generic or less desirable areas of a publication.
• Cannot measure social media forms, such as blogs and message boards.
•Because an AVE is the Cost of Advertising,
•Not the Value of Earned Media
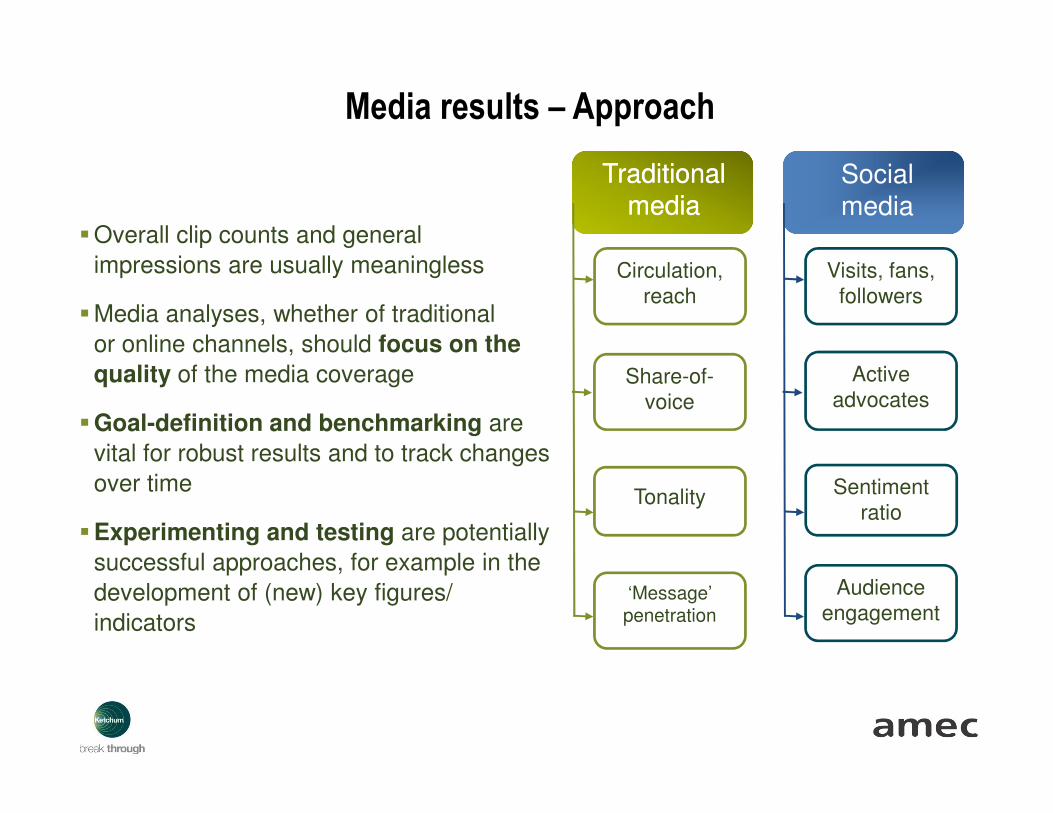
Media results – Approach
�Overall clip counts and general
impressions are usually meaningless
�Media analyses, whether of traditional
or online channels, should focus on the
quality of the media coverage
�Goal-definition and benchmarking are
vital for robust results and to track changes
over time
�Experimenting and testing are potentially
successful approaches, for example in the
development of (new) key figures/
indicators
Circulation, reach
Share-of-voice
Tonality
‘Message’ penetration
Visits, fans, followers
Audience engagement
Sentimentratio
Active advocates
Traditional media
Traditional media
Social media
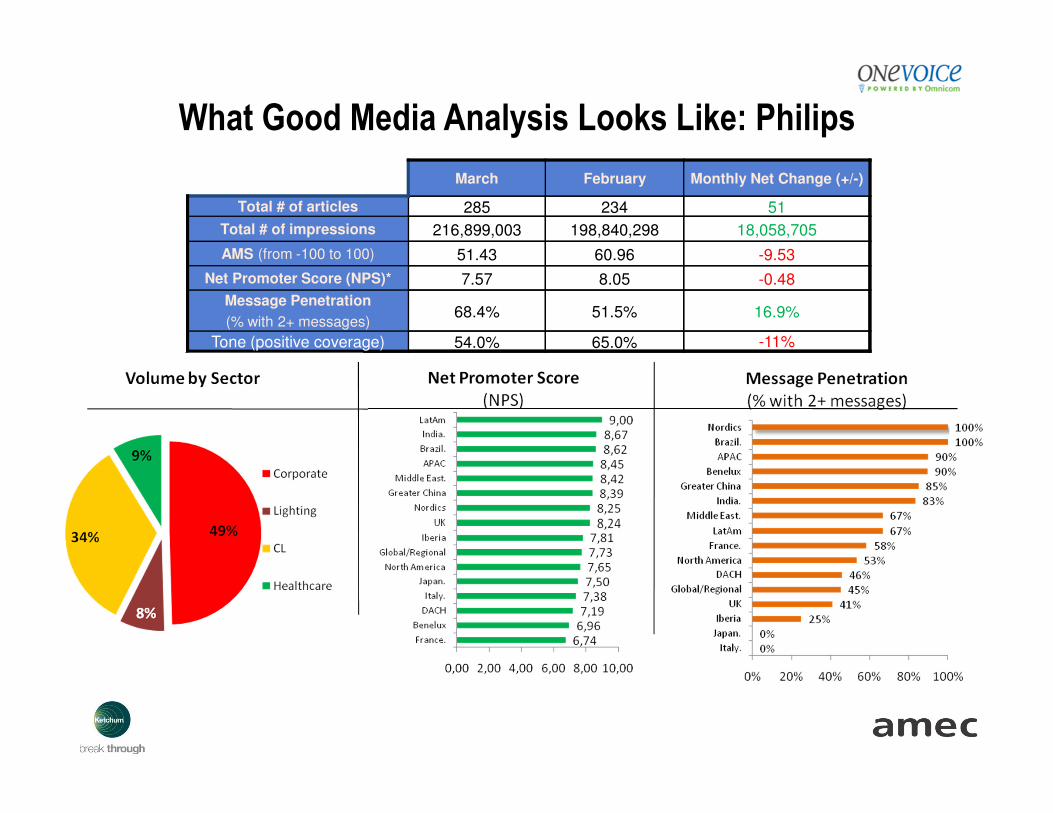
What Good Media Analysis Looks Like: Philips
March February Monthly Net Change (+/-)
Total # of articles 285 234 51
Total # of impressions 216,899,003 198,840,298 18,058,705
AMS (from -100 to 100) 51.43 60.96 -9.53
Net Promoter Score (NPS)* 7.57 8.05 -0.48
Message Penetration
(% with 2+ messages)68.4% 51.5% 16.9%
Tone (positive coverage) 54.0% 65.0% -11%
Social Media Can and Should be Measured
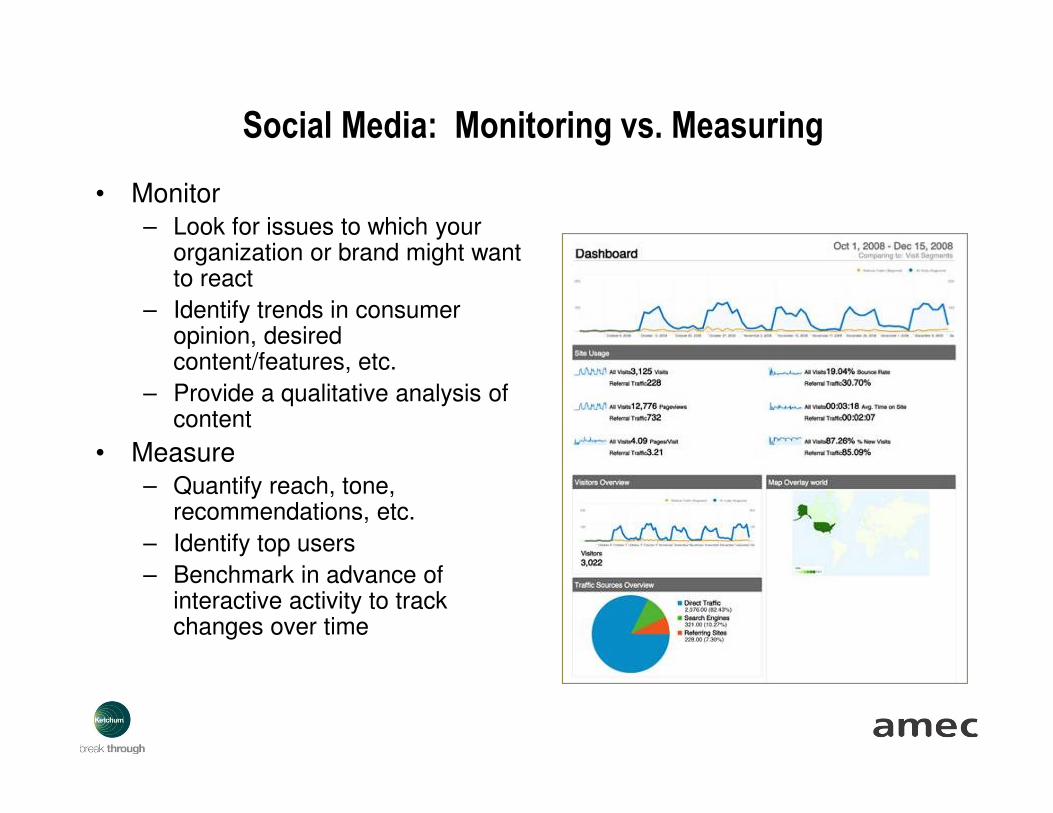
Social Media: Monitoring vs. Measuring
• Monitor– Look for issues to which your
organization or brand might want to react
– Identify trends in consumer opinion, desired content/features, etc.
– Provide a qualitative analysis of content
• Measure– Quantify reach, tone,
recommendations, etc.
– Identify top users
– Benchmark in advance of interactive activity to track changes over time

Outcomes Are Better Than Outputs
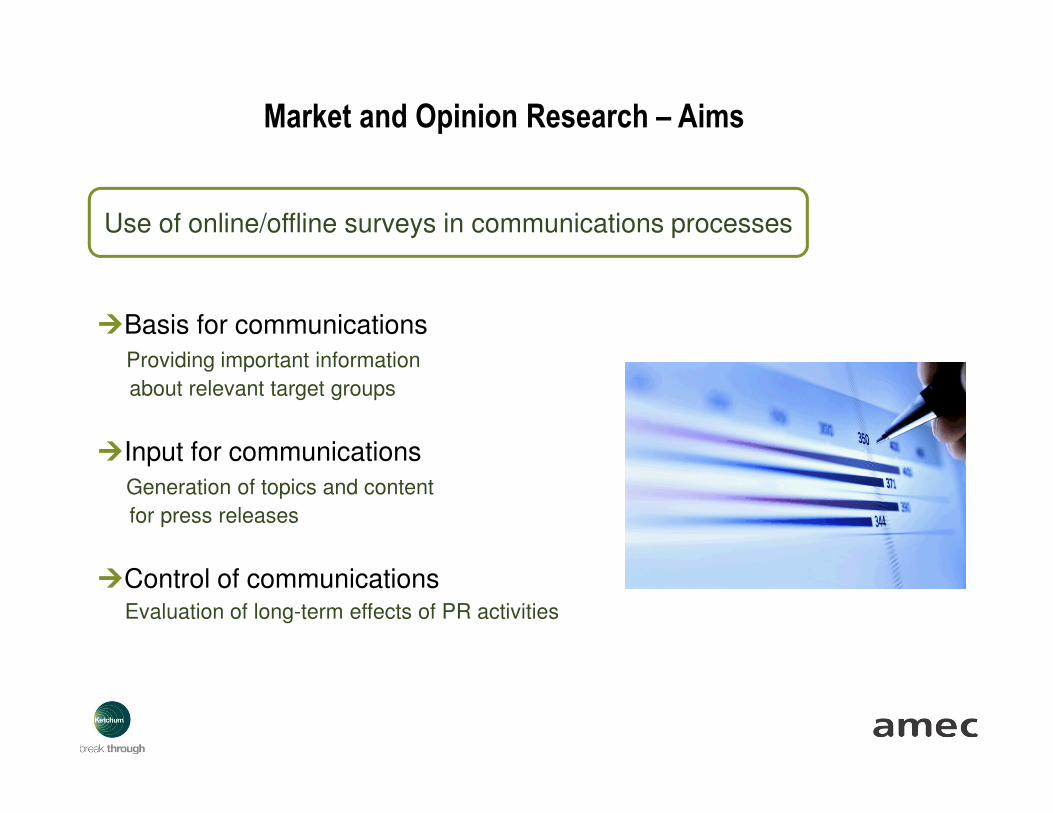
Market and Opinion Research – Aims
�Basis for communications
Providing important information
about relevant target groups
�Input for communications
Generation of topics and content
for press releases
�Control of communicationsEvaluation of long-term effects of PR activities
Use of online/offline surveys in communications processes
18% 18%
9%
6% 6%
21%
Radio Internet Magazine Newspaper TV Other
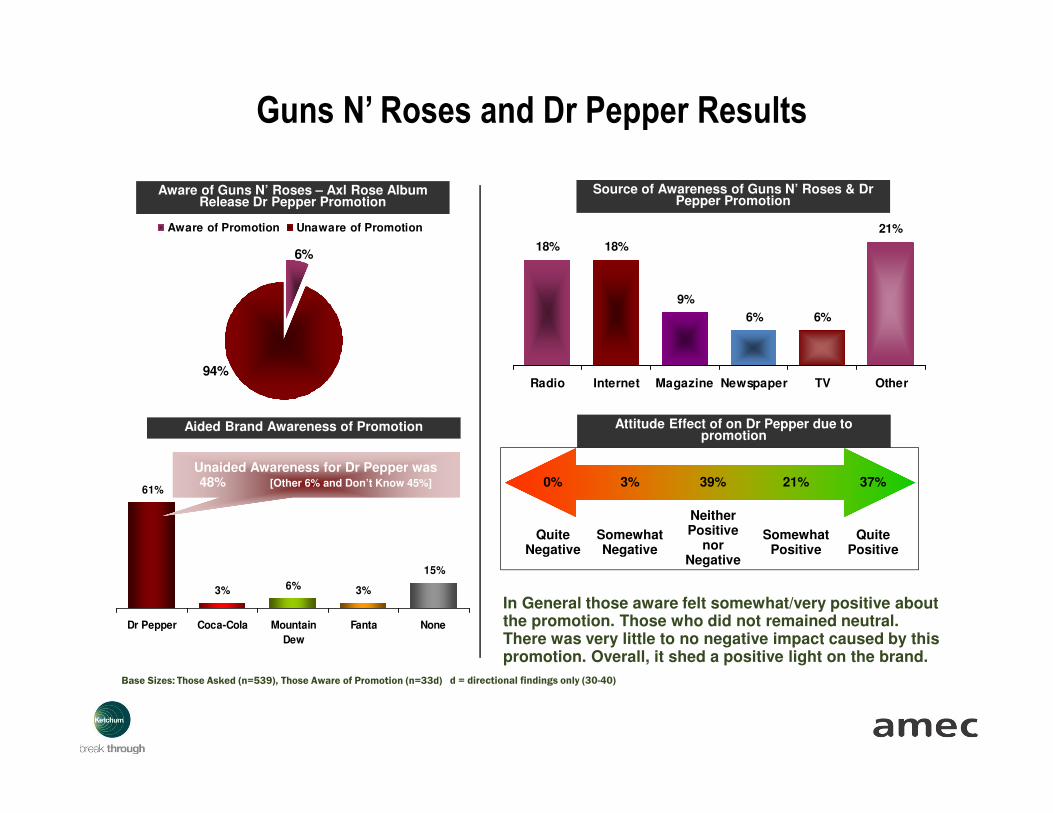
Guns N’ Roses and Dr Pepper Results
6%
94%
Aware of Promotion Unaware of Promotion
Aware of Guns N’ Roses – Axl Rose Album Release Dr Pepper Promotion
Source of Awareness of Guns N’ Roses & Dr Pepper Promotion
Aided Brand Awareness of Promotion Attitude Effect of on Dr Pepper due to promotion
61%
3% 6% 3%
15%
Dr Pepper Coca-Cola Mountain
Dew
Fanta None
Unaided Awareness for Dr Pepper was 48% [Other 6% and Don’t Know 45%]
Quite Positive
Quite Negative
Somewhat Negative
Somewhat Positive
Neither Positive
nor Negative
0% 3% 39% 21% 37%
In General those aware felt somewhat/very positive about the promotion. Those who did not remained neutral. There was very little to no negative impact caused by this promotion. Overall, it shed a positive light on the brand.
Base Sizes: Those Asked (n=539), Those Aware of Promotion (n=33d) d = directional findings only (30-40)
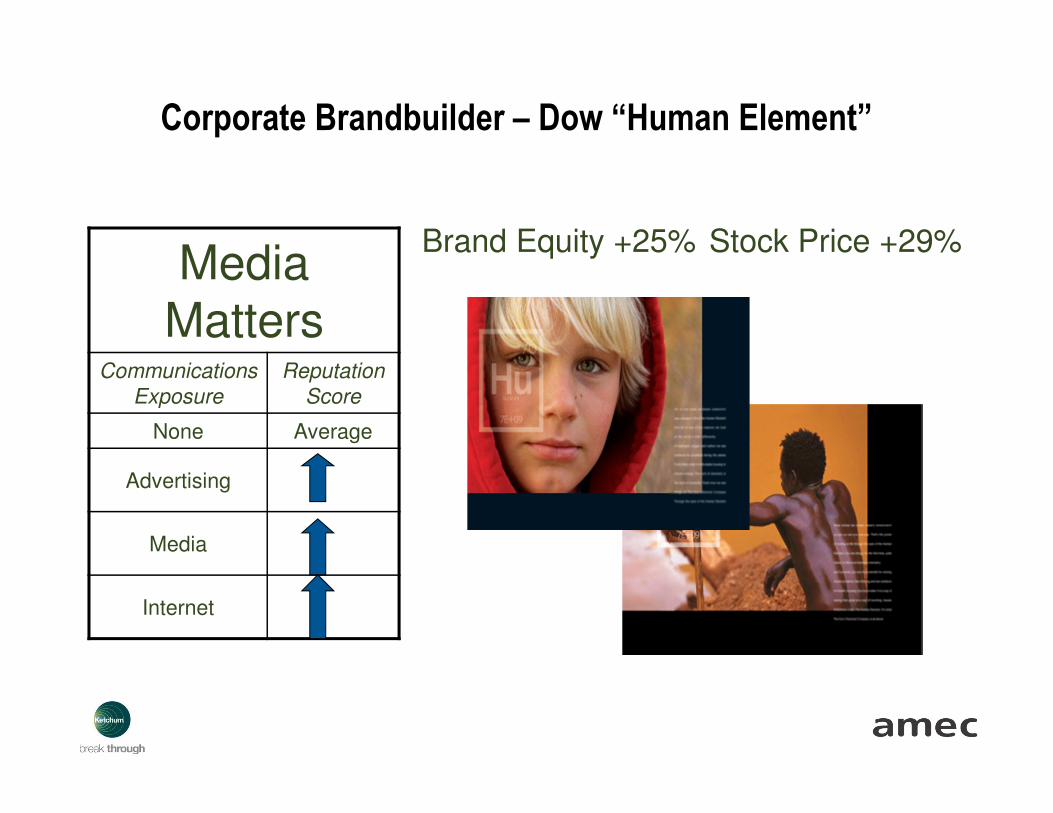
Corporate Brandbuilder – Dow “Human Element”
Brand Equity +25% Stock Price +29%Media
MattersCommunications
Exposure
Reputation
Score
None Average
Advertising
Media
Internet
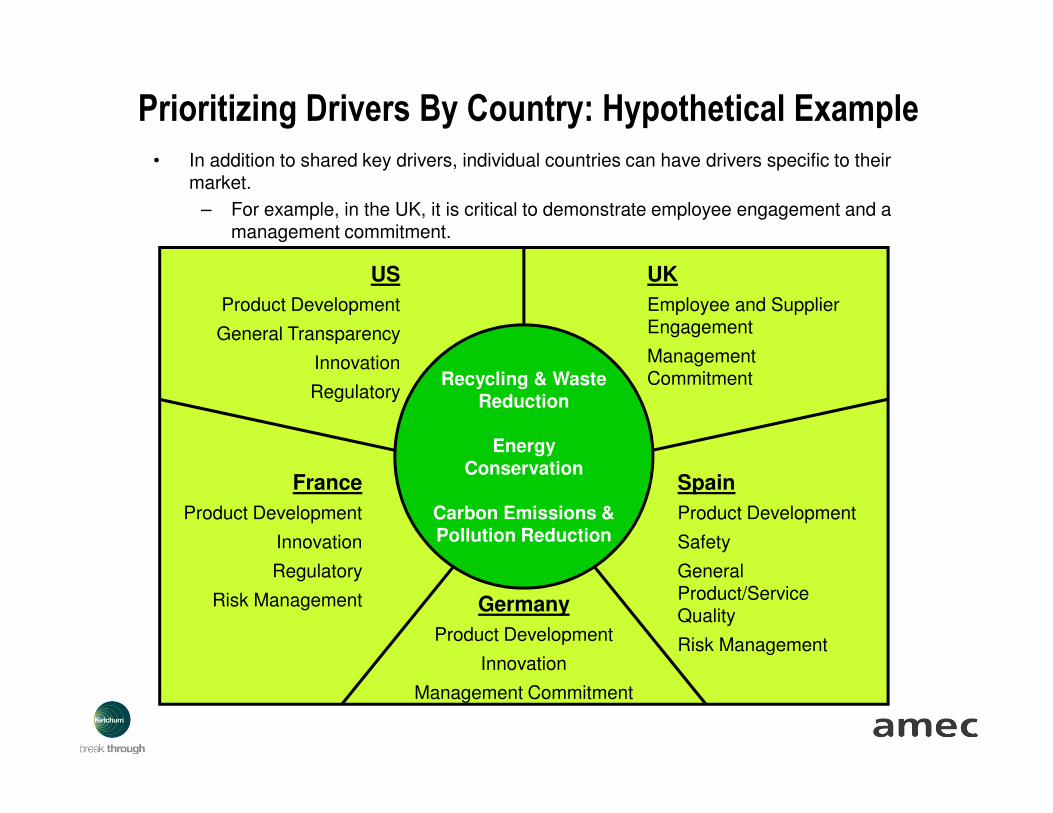
• In addition to shared key drivers, individual countries can have drivers specific to their market.
– For example, in the UK, it is critical to demonstrate employee engagement and a management commitment.
Recycling & Waste Reduction
Energy Conservation
Carbon Emissions & Pollution Reduction
US
Product Development
General Transparency
Innovation
Regulatory
UK
Employee and Supplier Engagement
Management Commitment
France
Product Development
Innovation
Regulatory
Risk Management Germany
Product Development
Innovation
Management Commitment
Spain
Product Development
Safety
General Product/Service Quality
Risk Management
Prioritizing Drivers By Country: Hypothetical Example

Business Results Are Better Than Outcomes: The Trend Toward Analytics
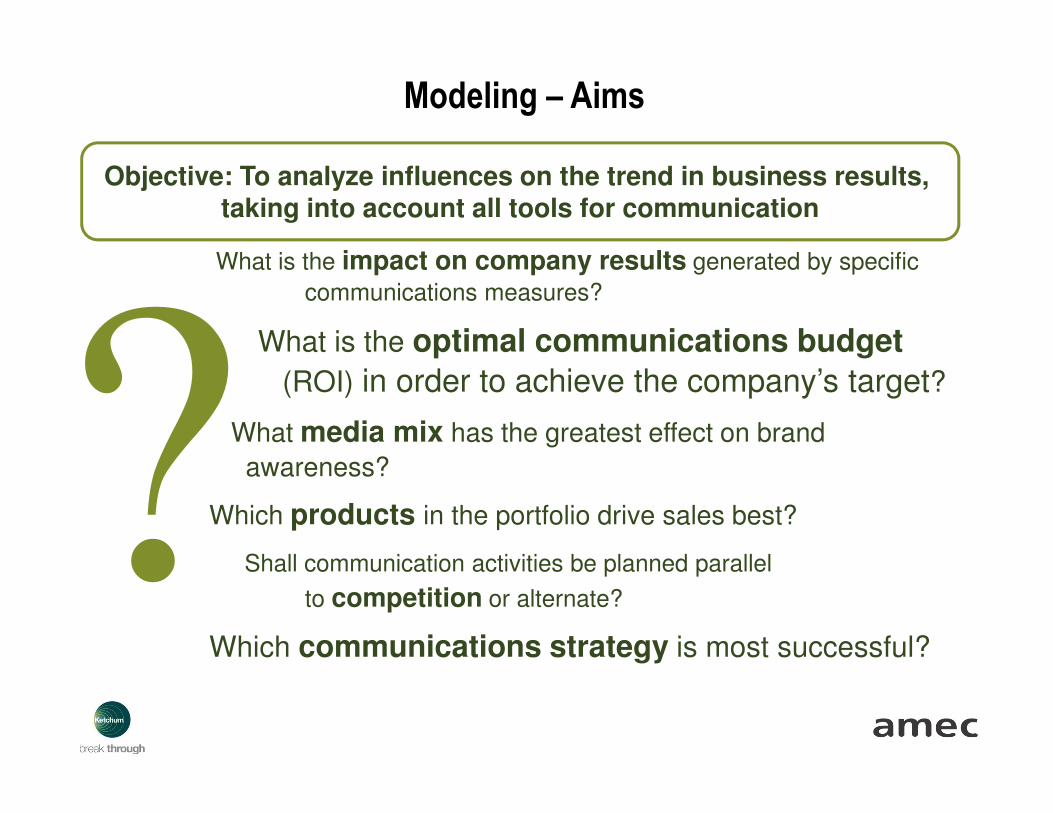
Modeling – Aims
What is the impact on company results generated by specific
communications measures?
What is the optimal communications budget
(ROI) in order to achieve the company’s target?
What media mix has the greatest effect on brand
awareness?
Which products in the portfolio drive sales best?
Shall communication activities be planned parallel
to competition or alternate?
Which communications strategy is most successful?
Objective: To analyze influences on the trend in business results, taking into account all tools for communication
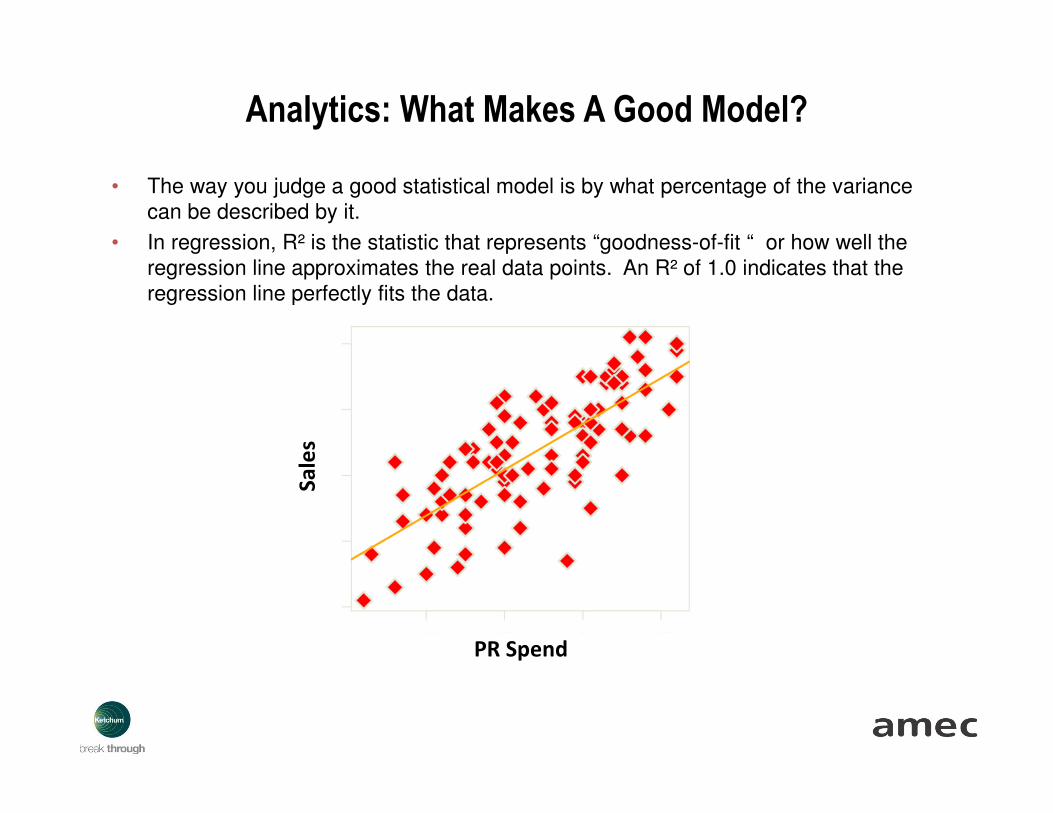
Analytics: What Makes A Good Model?
• The way you judge a good statistical model is by what percentage of the variance can be described by it.
• In regression, R² is the statistic that represents “goodness-of-fit “ or how well the regression line approximates the real data points. An R² of 1.0 indicates that the regression line perfectly fits the data.
PR Spend
Sa
les
Ja
n/ 0
5
Fe
b/ 0
5
Mrz
/ 0
5
Ap
r/ 0
5
Ma
i/ 0
5
Ju
n/ 0
5
Ju
l/ 0
5
Au
g/ 0
5
Se
p/ 0
5
Okt/ 0
5
No
v/ 0
5
De
z/ 0
5
Ja
n/ 0
6
Fe
b/ 0
6
Mrz
/ 0
6
Ap
r/ 0
6
Ma
i/ 0
6
Ju
n/ 0
6
Ju
l/ 0
6
Au
g/ 0
6
Se
p/ 0
6
Okt/ 0
6
No
v/ 0
6
De
z/ 0
6
Ja
n/ 0
7
Fe
b/ 0
7
Mrz
/ 0
7
Ap
r/ 0
7
Ma
i/ 0
7
Ju
n/ 0
7
Ju
l/ 0
7
Au
g/ 0
7
Se
p/ 0
7
Bo
okin
gs
0
3,000,000
6,000,000
9,000,000
12,000,000
15,000,000
PR
circ
ula
tion
PR circulation bookings
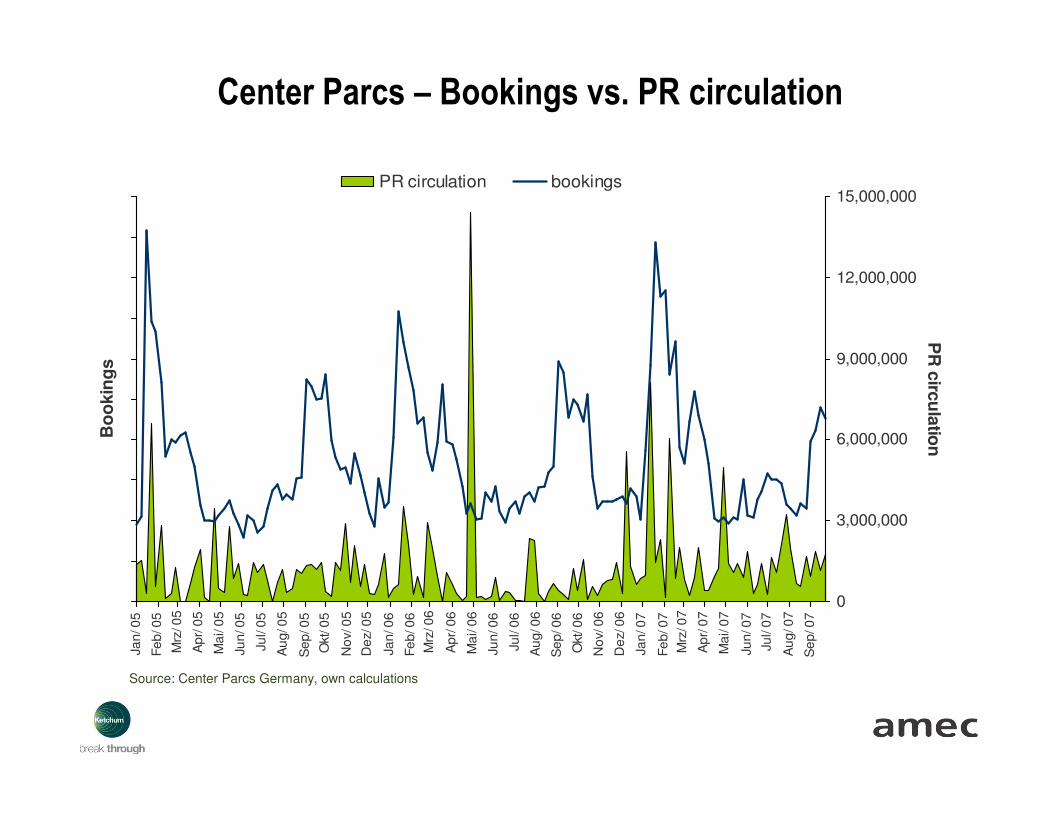
Center Parcs – Bookings vs. PR circulation
Source: Center Parcs Germany, own calculations
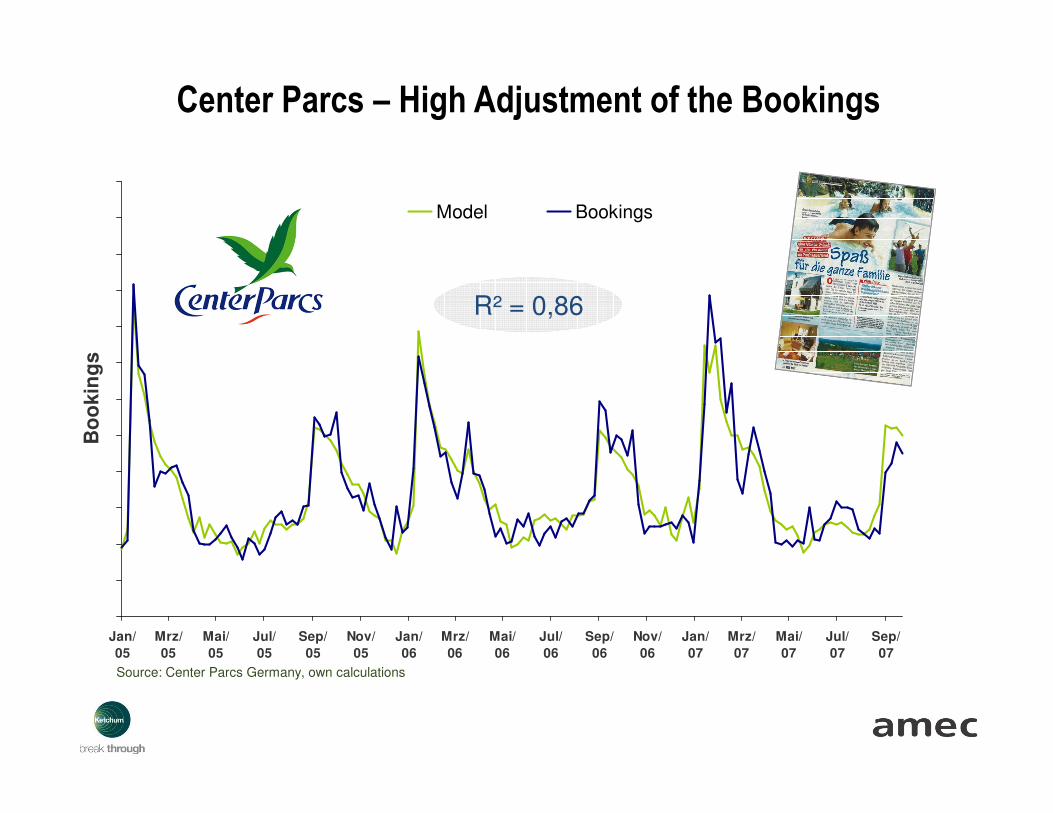
Center Parcs – High Adjustment of the Bookings
Jan/
05
Mrz/
05
Mai/
05
Jul/
05
Sep/
05
Nov/
05
Jan/
06
Mrz/
06
Mai/
06
Jul/
06
Sep/
06
Nov/
06
Jan/
07
Mrz/
07
Mai/
07
Jul/
07
Sep/
07
Bo
okin
gs
Model Bookings
Source: Center Parcs Germany, own calculations
R² = 0,86
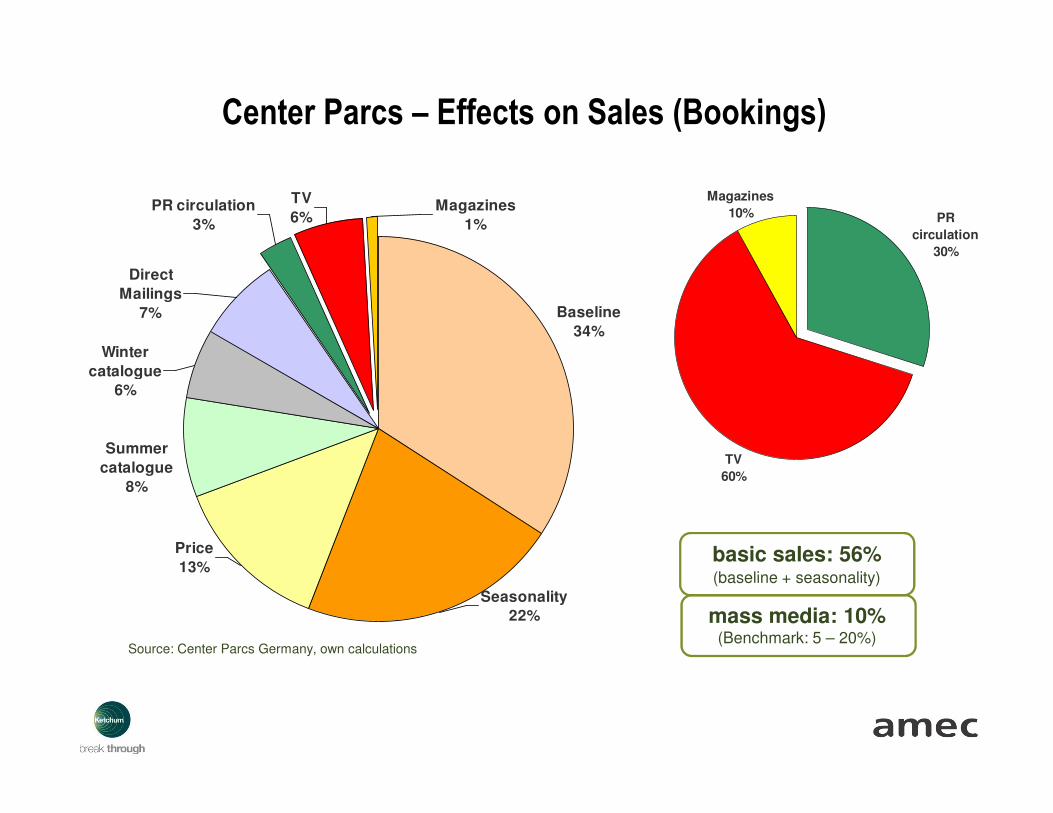
Seasonality
22%
Winter
catalogue
6%
Summer
catalogue
8%
Price
13%
Magazines
1%
TV
6%PR circulation
3%
Direct
Mailings
7% Baseline
34%
Source: Center Parcs Germany, own calculations
PR
circulation
30%
TV
60%
Magazines
10%
Center Parcs – Effects on Sales (Bookings)
basic sales: 56%(baseline + seasonality)
mass media: 10%(Benchmark: 5 – 20%)

CPG Company: Sales Modeling
50,000
75,000
100,000
125,000
150,000
175,000
200,000
225,000
250,000
275,000
300,000
5/3
/20
09
5/3
1/2
00
9
6/2
8/2
00
9
7/2
6/2
00
9
8/2
3/2
00
9
9/2
0/2
00
9
10
/18
/20
09
11
/15
/20
09
12
/13
/20
09
1/1
0/2
01
0
2/7
/20
10
3/7
/20
10
4/4
/20
10
Ttl H
eal
thy
Ch
oic
e Fr
oze
n S
SM S
ale
s (C
SU
)
Online Media
MAT Release
Line Extension PR
In-Store Coupon
PR
In-Pack Coupon
Shelftalk
FSI
New Packaging lift
TV
Trade Merchandising
Base Volume
Chart data reflects estimated volume from the sum of 65 DMAs
Volume Decomposition: (May 2008 – Apr 2010)
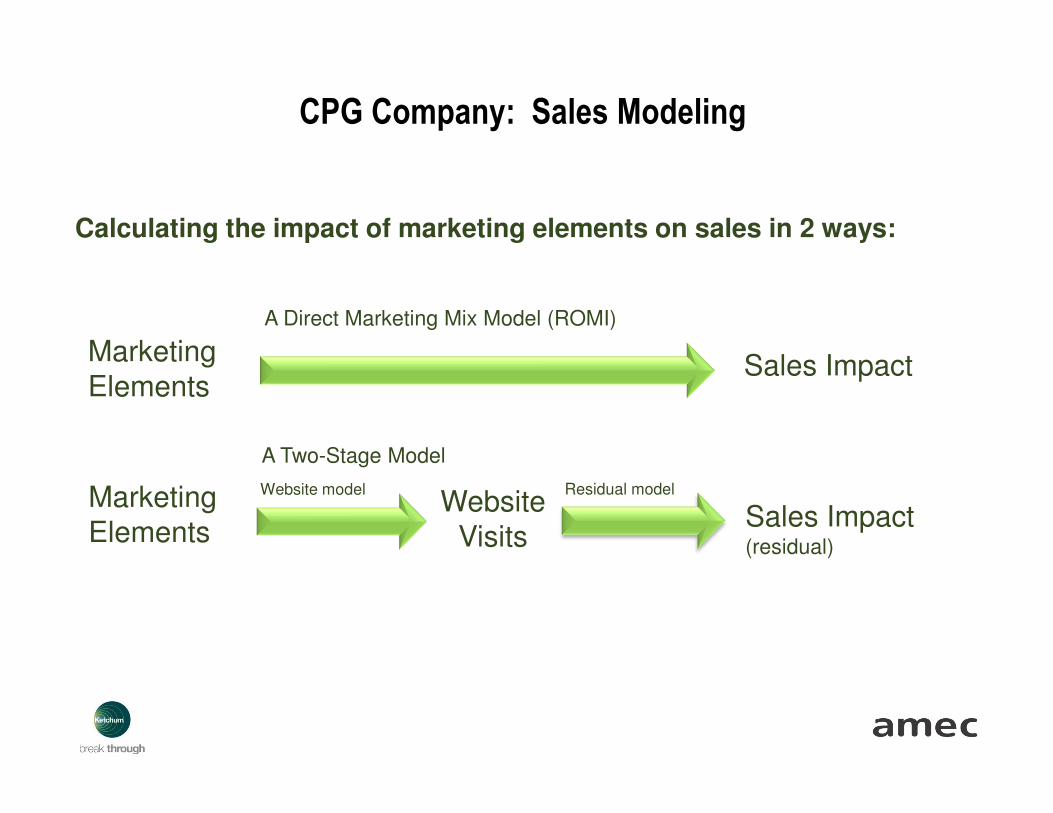
CPG Company: Sales Modeling
Calculating the impact of marketing elements on sales in 2 ways:
Sales ImpactMarketing Elements
A Direct Marketing Mix Model (ROMI)
Marketing Elements
WebsiteVisits
Sales Impact(residual)
A Two-Stage Model
Website model Residual model
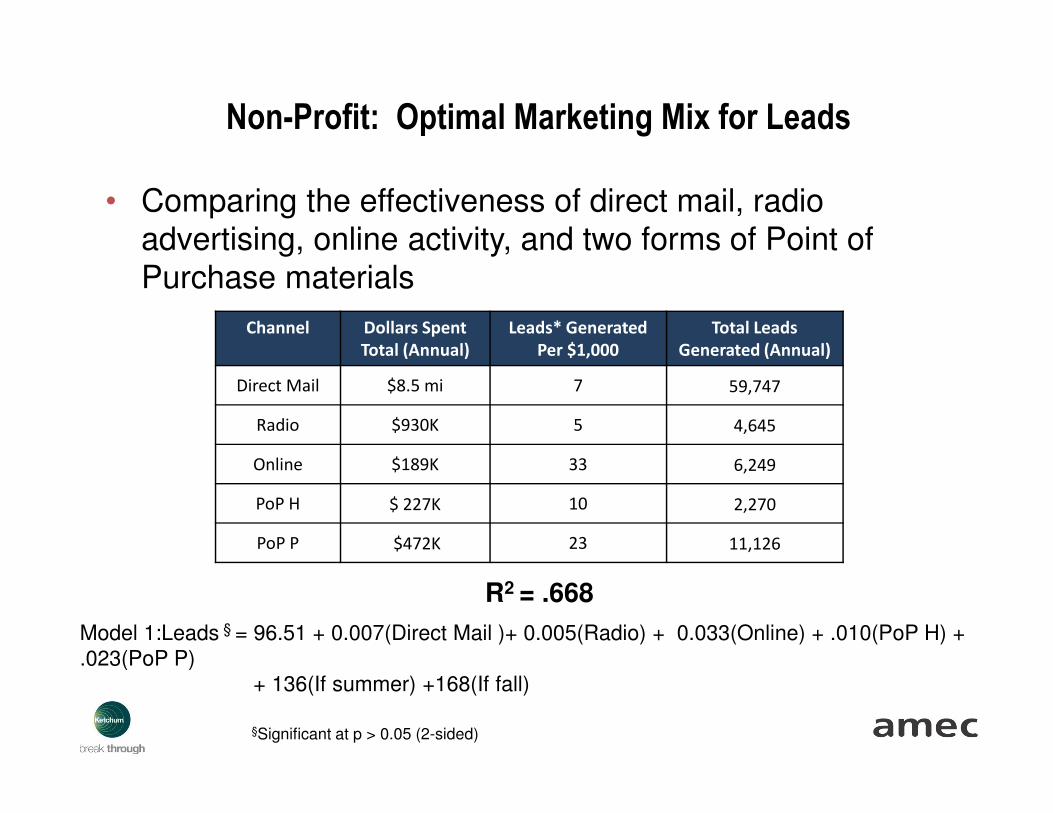
Non-Profit: Optimal Marketing Mix for Leads
• Comparing the effectiveness of direct mail, radio advertising, online activity, and two forms of Point of Purchase materials
§Significant at p > 0.05 (2-sided)
Channel Dollars Spent
Total (Annual)
Leads* Generated
Per $1,000
Total Leads
Generated (Annual)
Direct Mail $8.5 mi 7 59,747
Radio $930K 5 4,645
Online $189K 33 6,249
PoP H $ 227K 10 2,270
PoP P $472K 23 11,126
R2 = .668
Model 1:Leads § = 96.51 + 0.007(Direct Mail )+ 0.005(Radio) + 0.033(Online) + .010(PoP H) + .023(PoP P)
+ 136(If summer) +168(If fall)
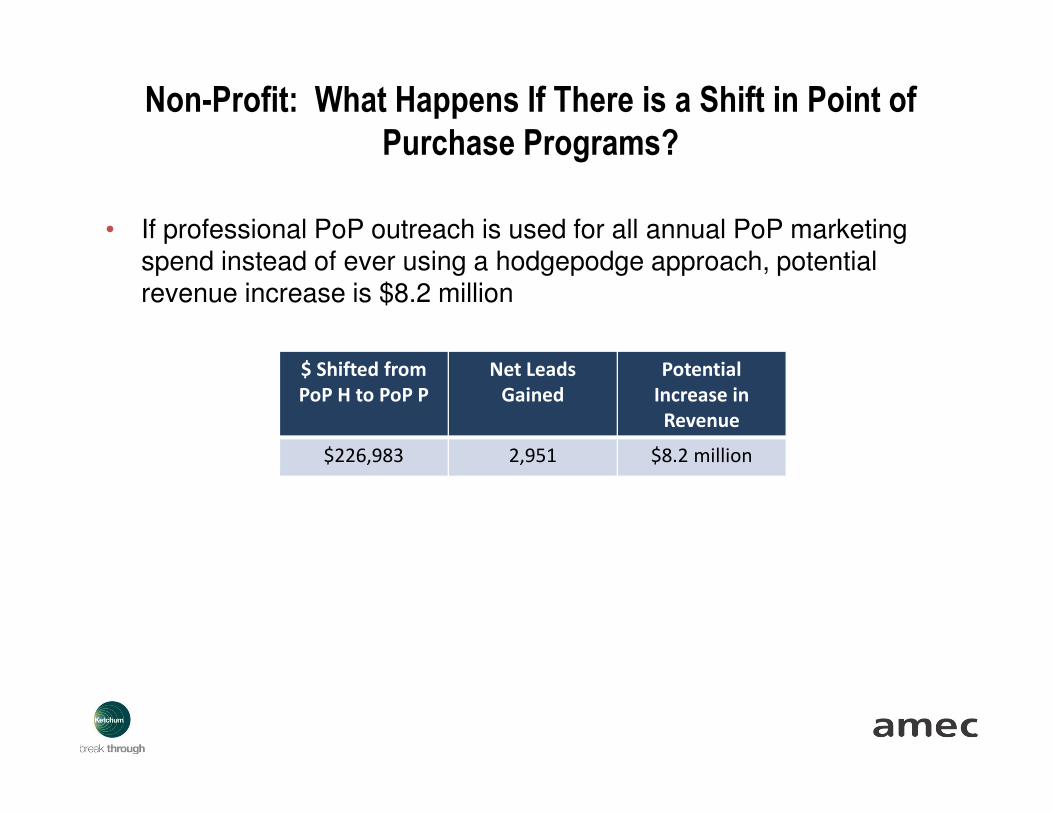
Non-Profit: What Happens If There is a Shift in Point of
Purchase Programs?
• If professional PoP outreach is used for all annual PoP marketing spend instead of ever using a hodgepodge approach, potential revenue increase is $8.2 million
$ Shifted from
PoP H to PoP P
Net Leads
Gained
Potential
Increase in
Revenue
$226,983 2,951 $8.2 million
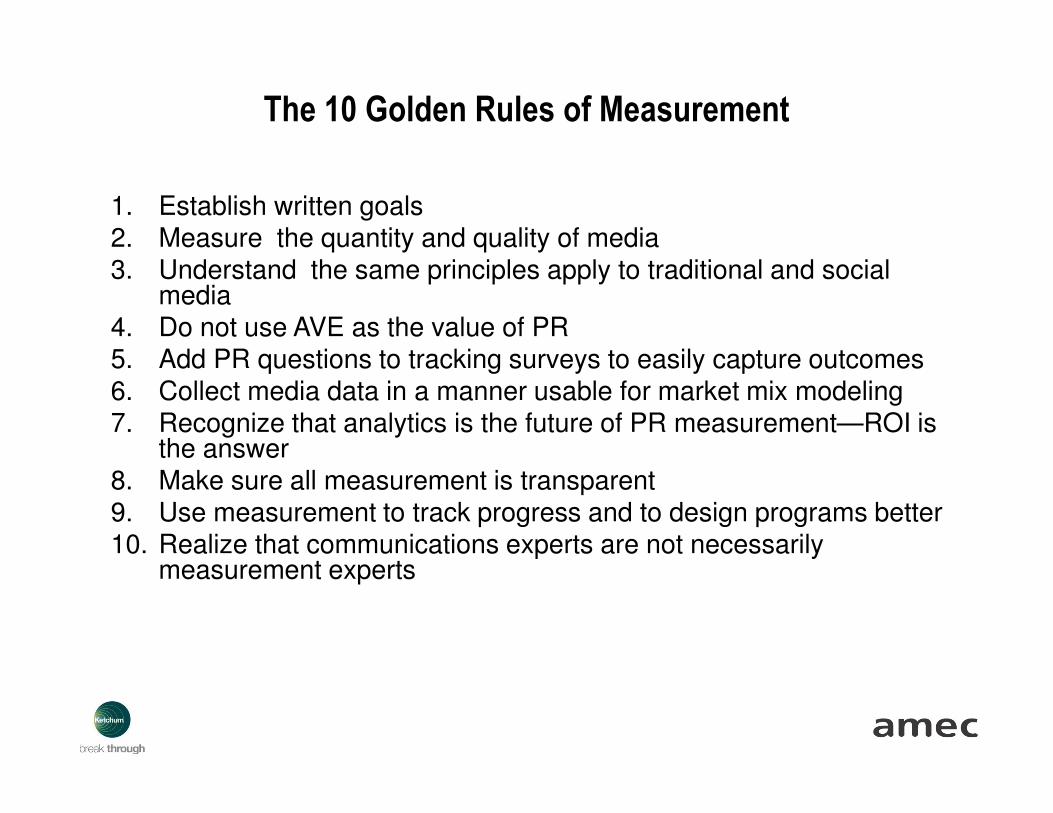
The 10 Golden Rules of Measurement
1. Establish written goals2. Measure the quantity and quality of media3. Understand the same principles apply to traditional and social
media4. Do not use AVE as the value of PR5. Add PR questions to tracking surveys to easily capture outcomes6. Collect media data in a manner usable for market mix modeling7. Recognize that analytics is the future of PR measurement—ROI is
the answer8. Make sure all measurement is transparent9. Use measurement to track progress and to design programs better10. Realize that communications experts are not necessarily
measurement experts

Thank you!