measuring risk in business and economics: possibility of loss or dispersion of outcomes? shyam...
TRANSCRIPT

Measuring Risk in Business and Economics: Possibility of Loss or
Dispersion of Outcomes?Shyam Sunder, Yale University
Sixth International Conference on Trade, Business and Finance, University of Namibia
Windhoek, October 14-16, 2014
2
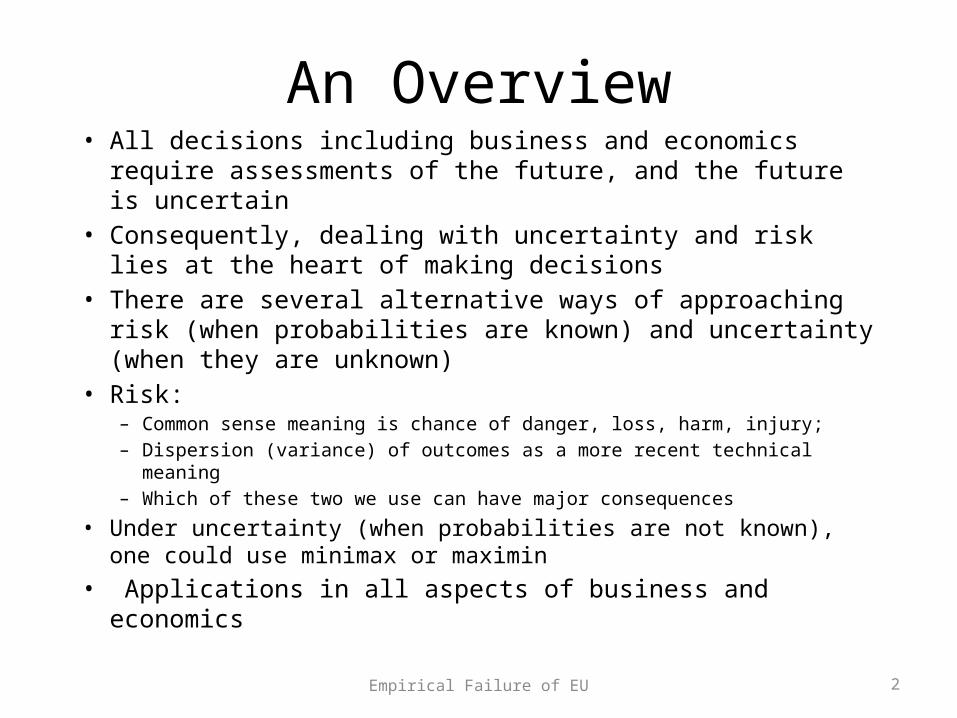
An Overview• All decisions including business and economics require
assessments of the future, and the future is uncertain• Consequently, dealing with uncertainty and risk lies at the
heart of making decisions• There are several alternative ways of approaching risk (when
probabilities are known) and uncertainty (when they are unknown)
• Risk: – Common sense meaning is chance of danger, loss, harm, injury; – Dispersion (variance) of outcomes as a more recent technical meaning– Which of these two we use can have major consequences
• Under uncertainty (when probabilities are not known), one could use minimax or maximin
• Applications in all aspects of business and economicsEmpirical Failure of EU

Basic Decision Model
• Decision variables: x• Objective function: y depends on x so y = f(x)• Environmental constraints: g(x) should not
exceed c• Choose x so as to maximize (or minimize)
objective function y = f(x) without violating the constraints, i.e., g(x) <= c.
• Addition of uncertainty adds complexity to the decisions

Introducing Uncertainty
• Environmental constrains c may be uncertain (e.g., not sure how much labor or machinery would be available)
• Function g(x) that relate the decision variables to constraints may be uncertain (e.g., not sure what the labor wage or machine cost will be)
• Objective function f(.) may be uncertain (e.g., not sure of the price at which the product can be sold)

Common Sense Meaning of Risk• Possibility of harm, injury, failure, loss, or danger• In summary, risk means the possibility of
something bad• In context of a probability distribution, risk
refers to the part of the distribution below the mean, or below zero
• Part of the probability distribution above the mean or above zero is not included in this meaning of risk

Dispersion Meaning of Risk• Dispersion of a probability distribution is a measure of
how far apart or dispersed the outcomes are. • Variance is one measure of dispersion (also, standard
deviation, etc.)• Which bet is more risky in this sense?
– Win $1 or lose $1 on a coin toss– Win $10 or lose $10 on a coin toss
• Second has higher dispersion, and is therefore more risky in the dispersion sense
• Introduced by Daniel Bernoulli (1738) and Markowitz (1952)
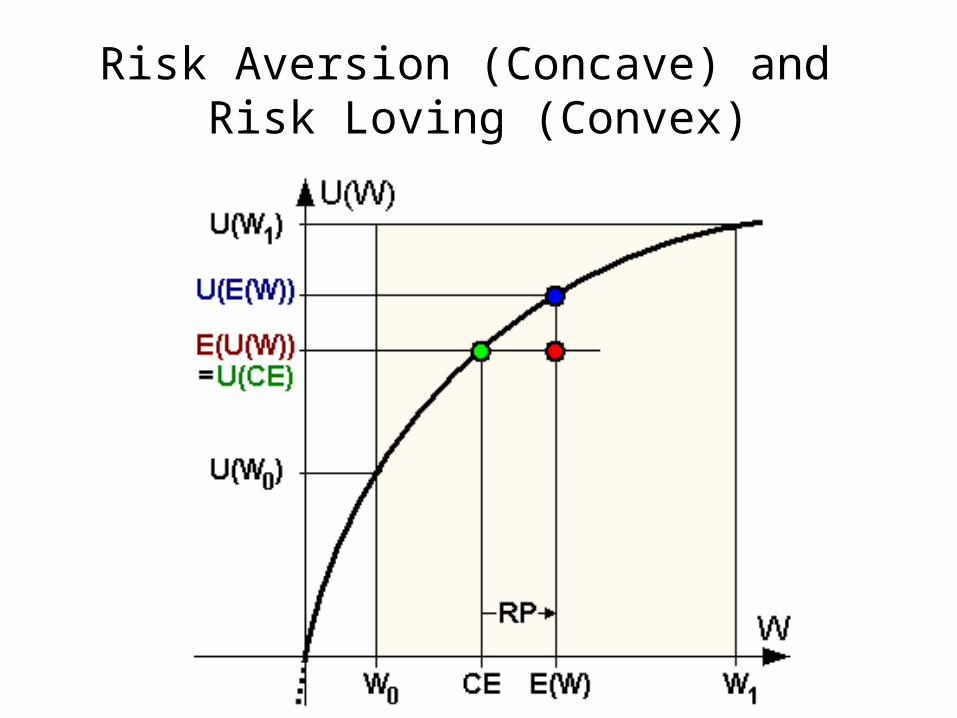
Risk Aversion (Concave) and Risk Loving (Convex)

Human Attitudes to Risk
• In the common sense meaning of risk, it is impossible for some one to prefer risk
• In the second meaning, it is possible for some to like or dislike risk depending on whether their utility or Bernoulli function is convex or concave.
• Let us consider examples from various fields of human experience to see if the shape of utility functions is a useful idea, and if it can be identified for individuals or groups of people
9
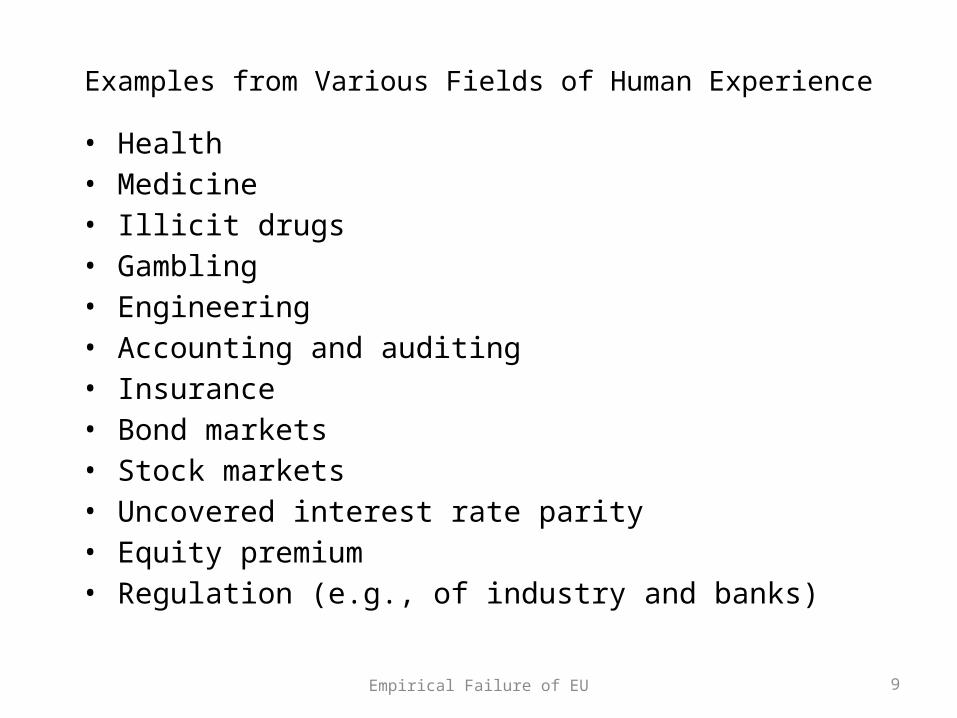
Examples from Various Fields of Human Experience
• Health• Medicine• Illicit drugs• Gambling• Engineering• Accounting and auditing• Insurance• Bond markets• Stock markets• Uncovered interest rate parity• Equity premium• Regulation (e.g., of industry and banks)
Empirical Failure of EU

10
Health: Risk Factors for Heart disease(in the United States)
• Old, male, family history of heart disease, post-menopausal, non-Caucasian race, smoking, high level of low density lipoprotein, hypertension, obesity, diabetes, high level of C-reactive protein, sedentary lifestyle, and stress
• Risk in context of health is used in its common sense meaning
• It is difficult to find examples where the dispersion of outcomes is used for risk in health related contexts
Empirical Failure of EU

11
Medicine: Risks of Statins to treat High Cholesterol (FDA)
– Liver injury– Memory loss– Diabetes– Muscle damage
• Risk in context of medicine is almost always used in its common sense meaning
• It is difficult to find examples where the dispersion of outcomes is used for risk in medicine related contexts
Empirical Failure of EU
12
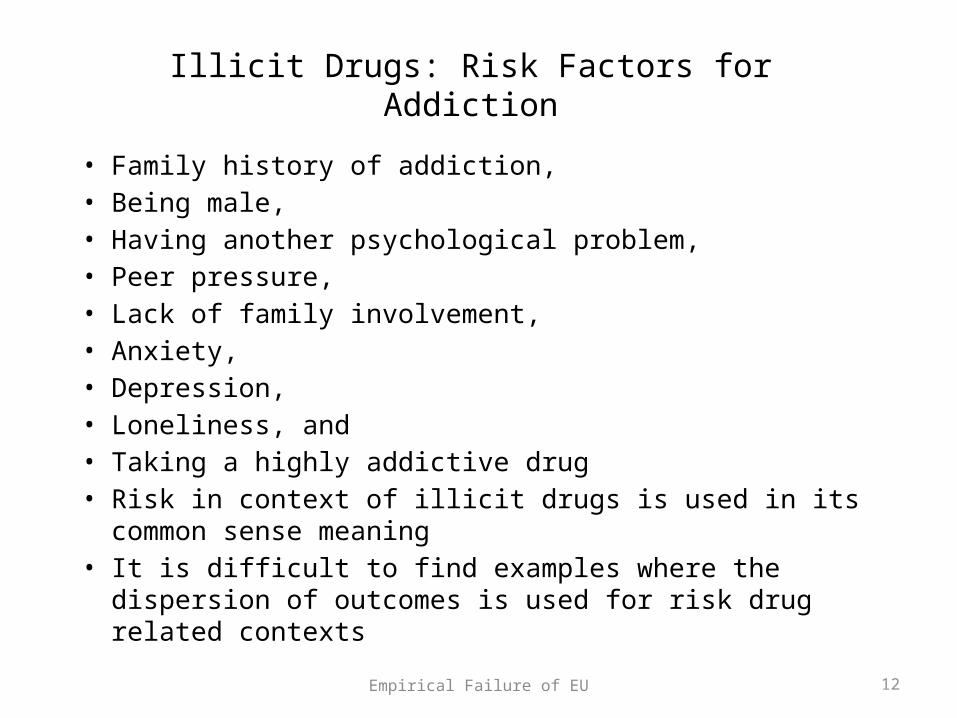
Illicit Drugs: Risk Factors for Addiction• Family history of addiction, • Being male, • Having another psychological problem, • Peer pressure, • Lack of family involvement, • Anxiety, • Depression, • Loneliness, and • Taking a highly addictive drug• Risk in context of illicit drugs is used in its common sense
meaning• It is difficult to find examples where the dispersion of outcomes
is used for risk drug related contextsEmpirical Failure of EU

13
Gambling• Friedman and Savage 1948 tried
to explain gambling by attributing a convex section in utility functions
• But Markowitz 1952 and Marshall 1984 proved that the optimal bet is implausibly large
• Alternative explanations: entertainment, thrill, bluff, arousal, competition, auto-erotic,
• Variable ratio form of Skinnerian conditioning
• Design of state lotteries not explainable by convex Bernoulli functions
Empirical Failure of EU

14
Engineering• NASA: Engineering Reliability Analysis quantifies
system risks through a combination of probabilistic analyses, physics-based simulations of key risk factors, and failure timing and propagation models. ERA develops dynamic, integrated risk models to not only quantify the probabilities of individual failures, but also to learn about the specific systems, identify the driving risk factors, and guide designers toward the most effective strategies for reducing risk.
• No mention of dispersion measure of risk, only failure or breakdown
Empirical Failure of EU

Risk in Accounting and Auditing
• Recognition of revenue• Valuation of assets (fixed, inventory, securities,
cash)• Disclosure• Misappropriation• Audit risks

16
Insurance• Industry size in 2011: $4.6t in premiums; best case for risk
aversion• Almost all have negative actuarial value to policy holders;
textbook example of widespread aversion to risk; but– Marketing emphasizes loss/harm/injury, not dispersion risk– Other explanations: policy as a put option, cuts costs of contingency
planning– Some versions of EUT specify convexity in losses; inconsistent with
insurance– Lack of universality of insurance suggests social learning, marketing,
and legal requirements may play roles– Einav et al. (2012): correlations among individual risk attitudes
obtained from various domains of insurance vary widely (0.06-0.55); but their subjective ordinal measures of risk unrelated to Arrow-Pratt
Empirical Failure of EU

17
Bond Markets• Moody’s and S&P ratings define credit risk as
likelihood of default and associated financial loss• No mention of dispersion of outcomes or concave
Bernoulli functions• Fisher 1959: Chances of default and marketability
of bonds explained 75% variation in yield• Altman 1989: Realized yields net of defaults
increase with lower rating for all except B and CCC bonds; not explained by dispersion measure of risk
Empirical Failure of EU

Moody’s Ratings(2012, p. 4)
• “Ratings assigned on Moody’s global long-term and short-term rating scales are forward-looking opinions of the relative credit risks of financial obligations issued by non-financial corporates, financial institutions, structured finance vehicles, project finance vehicles, and public sector entities. Long-term ratings are assigned to issuers or obligations with an original maturity of one year or more and reflect both on the likelihood of a default on contractually promised payments and the expected financial loss (or impairment) suffered in the event of default. Short-term ratings are assigned to obligations with an original maturity of thirteen months or less and reflect the likelihood of a default on contractually promised payments.” (emphasis added)

19
Stock markets• Markowitz 1952/1959 presented variance as a measure of risk,
tentatively, because of familiarity, convenience, and computability• Sharpe 1964 and Lintner 1965: Linear equilibrium relationship
between expected return and covariance risk• Intensive research on empirical evidence on CAPM and diversification• Fama and French 1992: “Our tests do not support the most basic
predictions of the SLB model, that average stock returns are positively related to market betas.”
• Fama and French 2004: Unfortunately, the empirical record of the model is poor — poor enough to invalidate the way it is used in applications. . . . In the end, we argue that whether the model’s problems reflect weaknesses in the theory or in its empirical implementation, the failure of the CAPM in empirical tests implies that most applications of the model are invalid.
Empirical Failure of EU
20
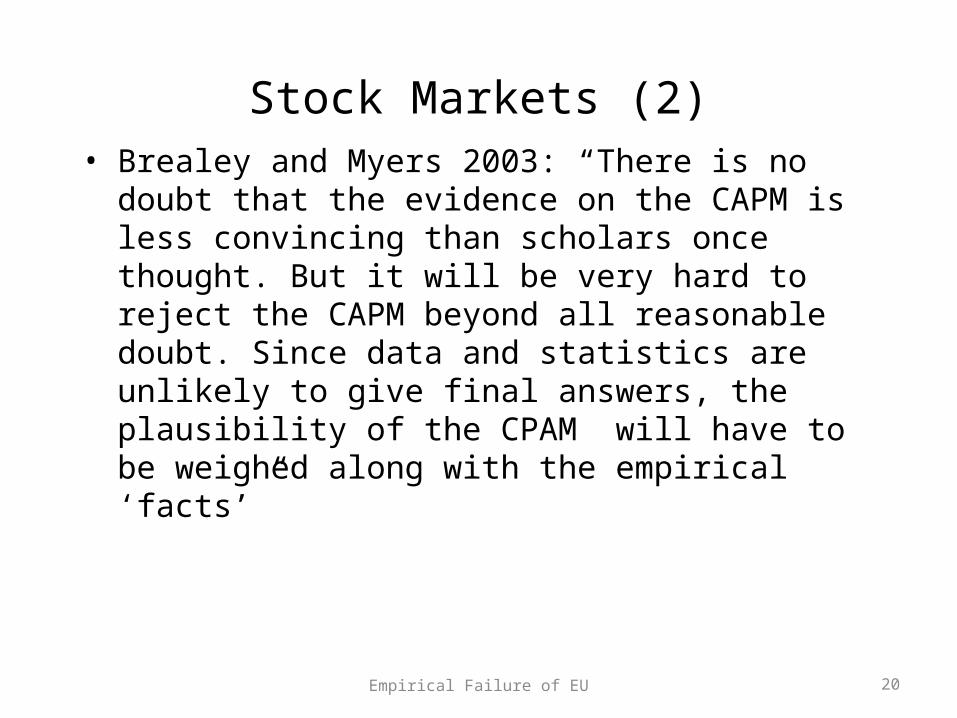
Stock Markets (2)• Brealey and Myers 2003: “There is no doubt that the
evidence on the CAPM is less convincing than scholars once thought. But it will be very hard to reject the CAPM beyond all reasonable doubt. Since data and statistics are unlikely to give final answers, the plausibility of the CPAM will have to be weighed along with the empirical ‘facts’”
Empirical Failure of EU

21
Diversification implication of risk aversion?• Worthington 2009 on household diversification: “Australian household
portfolios have very low levels of asset diversification . . . household portfolios appears to bear little relation to the central predictions of classic portfolio theory.
• Similar results for other economies (U.S., France, the Netherlands, U.K., Germany, and India). Guiso et al. 2000: “The country studies find that the extent of diversification between and within risk categories is typically quite limited.”
• Why aren’t (dispersion) risk averse households partake of almost “free lunch” of diversification?
• Holderness 2009 on distribution of corporate ownershi: “Given that 96% of a representative sample of CRSP and Compustat firms have large shareholders and these shareholders on average own 39% of the common stock (Table 1), it is now clear that atomistic ownership is the exception, not the rule, in the United States.”
Empirical Failure of EU
22
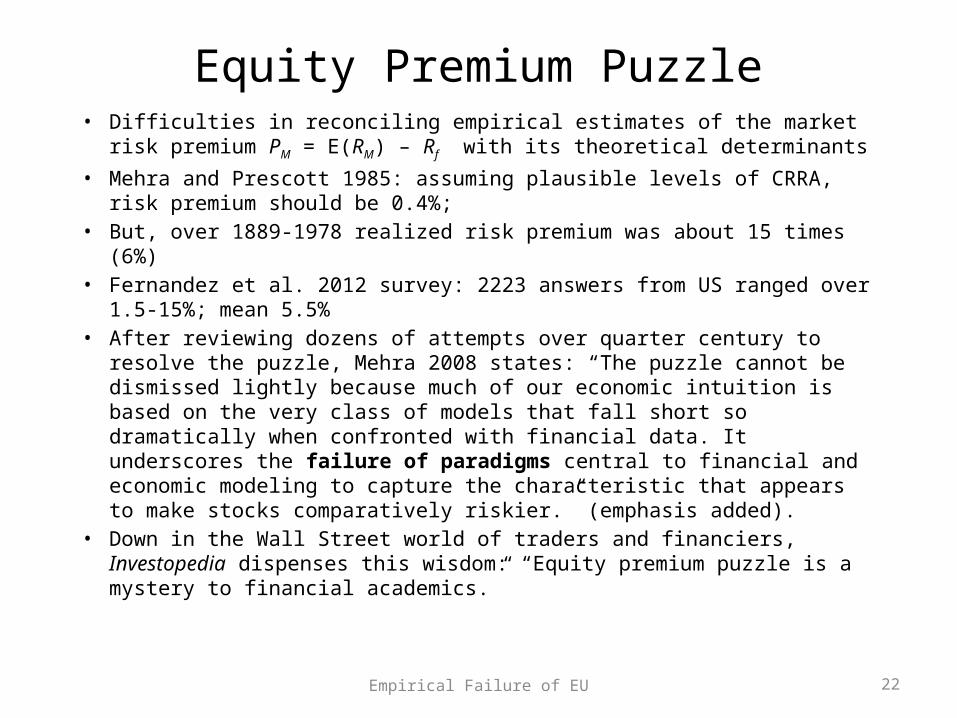
Equity Premium Puzzle• Difficulties in reconciling empirical estimates of the market risk premium
PM = E(RM) – Rf with its theoretical determinants• Mehra and Prescott 1985: assuming plausible levels of CRRA, risk premium
should be 0.4%;• But, over 1889-1978 realized risk premium was about 15 times (6%)• Fernandez et al. 2012 survey: 2223 answers from US ranged over 1.5-15%;
mean 5.5%• After reviewing dozens of attempts over quarter century to resolve the
puzzle, Mehra 2008 states: “The puzzle cannot be dismissed lightly because much of our economic intuition is based on the very class of models that fall short so dramatically when confronted with financial data. It underscores the failure of paradigms central to financial and economic modeling to capture the characteristic that appears to make stocks comparatively riskier.” (emphasis added).
• Down in the Wall Street world of traders and financiers, Investopedia dispenses this wisdom: “Equity premium puzzle is a mystery to financial academics.”
Empirical Failure of EU

Regulatory Risks
• Risk that a change in laws or regulations will materiality impact a security, business, sector or market. A change in laws by a government or regulations by an agency can increase the cost of operating a business, reduce the attractiveness of an investment, or change the competitive conditions. Investopedia.

24
Aggregate Level Evidence From the Field• The hope that curved Bernoulli functions, combined with
dispersion concept of risk, might yield insights into a variety of socio-economic phenomena in the field waits to be fulfilled
• Surprisingly little aggregate level insights or consilience across domains populated by the same agents: credit, insurance, corporate equity, real estate, currency markets, gambling, labor, and business cycles
• Academic literature often assumes curved Bernoulli functions, but attempts to tie the resulting models to data often lead to wildly different, and mutually inconsistent, implied innate preferences in specified populations.
Empirical Failure of EU

25
Measuring Individual Risk Preferences• Unambiguous definitions and methods of measurement at
the heart of sciences• John Von Neumann and Oskar Morgenstern’s challenge:
Theory of Games and Economic Behavior (1943 [1953]) axiomatization; more general; and empirical procedure to estimate Bernoulli function from choice data over lotteries and certain prospects
• Seven decades of attempts to furnish empirical content to VNM theory include:– Free form thought experiments (Friedman and Savage 1948,
Markowitz 1952), both rejected Bernoulli
Empirical Failure of EU

26
Free Form Thought ExperimentsFriedman and Savage 1948
2 points of inflexionMarkowitz 1952
3 points of inflexion
Empirical Failure of EU

27
Empirical Task of Mapping Utilities• Mosteller and Nogee (1951): elicited data from payoff-motivated
choice experiments over sample “poker” hands to construct Bernoulli/VNM utility functions (no statistical estimation)– Max EU not unreasonable; Inconsistency in behavior relative to VNM;
meager support for F&S; Harvard students “conservative” (i.e., concave), National Guard subjects “extravagant” (i.e., convex)
Empirical Failure of EU

28
Mosteller & Nogee 1951
Empirical Failure of EU

29
Empirical Task of Mapping Utilities• Ward Edwards (1955): “Another model, which assumes that Ss choose
so as to maximize expected utility, failed to predict choices successfully.” (p. 214)
• Grayson (1960): “Drilling decisions by oil and gasoperators” (Howard Raiffa’s graduate student
Empirical Failure of EU

30
Edwards (1955): FIG. 1. Experimentally determined individual utility curves. The 45° line in each graph is the curve which would be obtained if the subjective value of money
were equal to its objective value.
Empirical Failure of EU

31
Grayson (1960)
Empirical Failure of EU

32
Grayson (1960)
Empirical Failure of EU

Pratt; Diamond, Rothschild, and Stiglitz (1964-74)
• With the work of Pratt; Diamond, Rothschild, and Stiglitz during this decade, EUT with dispersion-based measures of risk (e.g., variance and Arrow-Pratt) were in the driver’s seat
• Coexistence of ordinal (absent risk) and neo-cardinal (under risk) utilities (F&S denied derivability of their utility curve from riskless choices, p. 464)
• Pure vs. speculative risk distinction of insurance theory and industry fell into disuse
• Explosion of interest in EU with analysis of parameterized utility function• Almost immediately, attempts made to elicit data, and empirically obtain
statistical estimates of these parameters using the VNM mapping process, in the hope of explaining and predicting “Economic Behavior” (the second part of the title of the VNM book) beyond non-statistical methods of F&S, Mosteller and Nogee, Markowitz, Edwards, and Grayson
• To what extent did these elicitations yield dependable estimates of a person’s propensity to choose under risk?
34
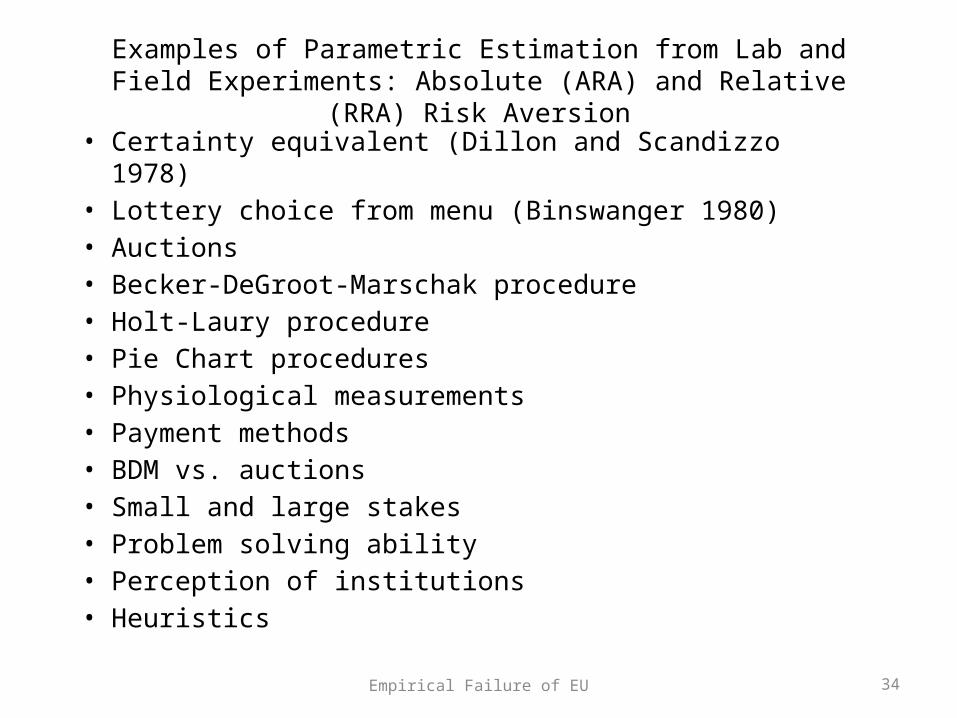
Examples of Parametric Estimation from Lab and Field Experiments: Absolute (ARA) and Relative (RRA) Risk Aversion
• Certainty equivalent (Dillon and Scandizzo 1978)• Lottery choice from menu (Binswanger 1980)• Auctions• Becker-DeGroot-Marschak procedure• Holt-Laury procedure• Pie Chart procedures• Physiological measurements• Payment methods• BDM vs. auctions• Small and large stakes• Problem solving ability• Perception of institutions• Heuristics
Empirical Failure of EU
35
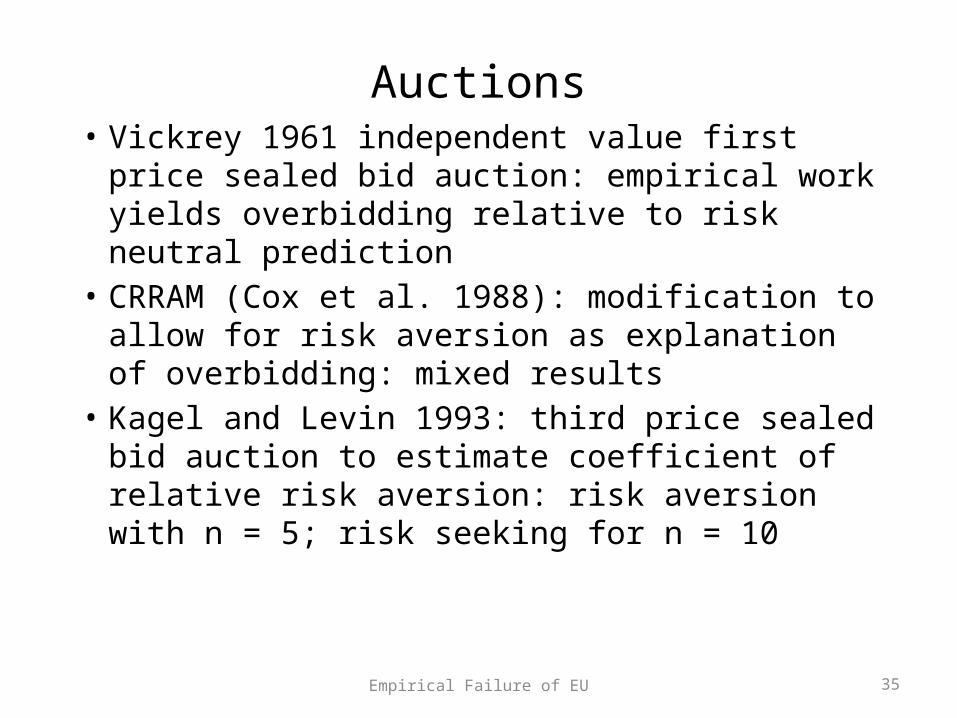
Auctions• Vickrey 1961 independent value first price
sealed bid auction: empirical work yields overbidding relative to risk neutral prediction
• CRRAM (Cox et al. 1988): modification to allow for risk aversion as explanation of overbidding: mixed results
• Kagel and Levin 1993: third price sealed bid auction to estimate coefficient of relative risk aversion: risk aversion with n = 5; risk seeking for n = 10
Empirical Failure of EU
36
Meaning(s) of Risk• If measured Bernoulli functions are so “Protean,” can they help us
understand or predict choices? Why have we not found a reliable way after seven decades of intensive effort?
• What if there is no reliable measure? Might risk preferences be a figment, like phlogiston, a fluid that chemists once conjured up to explain combustion?
• Although it took almost a century, chemists ultimately abandoned the concept, because it failed to explain the data.
• A prior question: What is risk? Outside economic theory, risk almost universally refers to the possibility of harm (in engineering, medicine, drugs, safety, gambling, sports, military)
• Same is true in insurance, credit, and regulation. Only in certain aspects of economic theory (e.g., equity), does risk refer to variability of outcomes
Empirical Failure of EU

37
Where Are We Now?• Little evidence that EU (and its variations) predict
individual choice better than naïve alternatives– Estimation procedures applied to any choice data
necessarily yield a risk coefficient; but exhibit little stability outside contexts
• Different ways of eliciting risk parameters in cash-motivated controlled economics experiments yield different results
• Perhaps the failure to find stable results is the result
Empirical Failure of EU

38
Phlogiston• Greeks; Becher (1635–1682); Stahl (1660–1734)• Invisible compressible fluid; able to organize disparate physical
phenomena better than alchemists’ earth, air, fire, water• Generated some puzzles of its own: context-dependent mass• Proponents of phlogiston added free parameters, even negative mass
to account for the data• Phlogiston theory did not disappear when
– It created puzzles instead of explanations, or – Its supporters failed to isolate phlogiston in the laboratory
• Phlogiston vanished from respectable science only, when Lavoisier’s powerful oxidation/reduction theory emerged in the late 1780s
• Even “Priestley and Cavendish, on whose work much of the new theory was based, clung to the phlogiston theory to the end of their lives.”
Empirical Failure of EU

39
Could Bernoulli Functions be like Phlogiston?• At least since 1940s, risky choice explained by Bernoulli functions• To many, aversion to “dispersion” seems a self-evident truth• But they have not yet delivered the empirical goods (not yet isolated
in lab or field; puzzles proliferate)• Controversies on way to measure attitudes to risk• Decades of intensive search by theorists and empiricists in
economics, game theory, psychology, sociology, anthropology, and other disciplines: no evidence that attitudes to risk modeled by Bernoulli functions can help predict risky choices out of sample
• Nor helped us gain a better understanding of aggregate phenomena in stock, bond, insurance, real estate, labor or forex markets, or about medicine, engineering, or gambling
• But it will survive until we have something better
Empirical Failure of EU

40
How Do People Perceive Risk?• Dispersion of quantified outcomes; Markowitz (1952)• The Oxford English Dictionary: “a situation involving
exposure to danger” or harm• Banking: operational, political, credit, counterparty,
market, or currency risk• Financial economics: June 6, 2012search of SSRN.com
database of 345,529 research papers, the word “risk” appears in the titles of 11,144 (3.3%) papers. Of the ten most frequently downloaded of these finance papers, six use the exposure-to-harm meaning of risk, three use the dispersion meaning, and one uses both.
Empirical Failure of EU
41
Measuring Risk
• Variance or standard deviation• Lower semi-variance (Markowitz considered it but
dropped it, tentatively, for reasons of familiarity, convenience, and computability of portfolios)
• Probability of a loss• Value at risk (VaR at x%)• Expected loss• Measures based on third and higher moments--prudence,
temperance, and beyond– Given the difficulty of dealing with the first two moments, the
higher moments appear unlikely to add much at this point
Empirical Failure of EU

42
Relationship between Expected Loss vs. Standard Deviation
121 Lotteries with uniform distribution with different parameters
Exp
(loss
)
6
5
4
3
2
1
0
0 1 2 3 4
Stdev
5 6 7
121 Lotteries on (-0.5, 0.5) with beta distribution with different parameters
Empirical Failure of EU
Exp
(loss
)
0.6
0.5
0.4
0.3
0.2
0.1
0
0 0.05 0.1 0.15 0.2 0.25 Stdev
0.3 0.35 0.4 0.45

43
Approaching Risk Preferences
• Intrinsic preferences: not directly accessible, difficult to access even indirectly
• Revealed preferences may be driven more by circumstances than intrinsic preferences (e.g., emergent DMU, F&S function from class structure)
• We do not know if perceived risk is better captured by the second or higher moments
• Potential for harm may be captured by direct measures of the lower tail (e.g., first moment)
Empirical Failure of EU

Potential Observable Opportunity Sets• Consider a shift in perspective and
explanatory burden:– From treating circumstances as a
nuisance variable in recovering intrinsic preferences (white vase)
– To circumstances/context as the determining factor in risky choice within neoclassical constrained optimization of simple (linear) utility (black profiles); they are potential source of regularities in risky choices
– If successful, may not need to estimate curved Bernoulli functions
– Similar to Stigler-Becker “De Gustibus…”, and unlike much of behavioral econ emphasis on individual taste

Bernoulli Function and Opportunity Set Perspectives
• Grayson (1960) all ten estimated Bernoulli functions are different
• Mr. Bishop’s EBF shifted after four months
• Costly income smoothing reveals firms’ concave BFs
• Their opportunity sets are different
• His perception of his opportunity set had shifted
• Smith and Stulz 1985: convex taxes create concave after-tax income (for otherwise risk neutral firms; MM 1958) inducing costly smoothing
• Similarly, due to non-linear bankruptcy costs: firms risk neutral in net value to shareholders appear to have concave revealed BFs
• Foraging behavior of dark-eyed juncos

Context as an Opportunity Set
• Stigler and Becker (1977): suggest holding preferences constant across people and time and focus on how contexts (opportunity sets) affect what we observe
• Risk aversion and risk preference is the first in their list of future applications, and that agenda can now be implemented
• Risks change opportunity sets of DMs in observable ways, yielding testable predictions (versus unobservable BFs and probability weights)
• Rich applications of real options (Dixit and Pindyck 1994)

Concave Revealed Preferences from Linear Intrinsic Preferences
• Household: credit card, mortgage, rent, utility and car debt penalties
• Firms: payroll, debt service, bond indentures
• Biology: calories needed to maintain normal activity, survival

Convex Revealed Preferences from Linear Intrinsic Preferences
• Tournament incentives• Decisions under
possibility of bailout
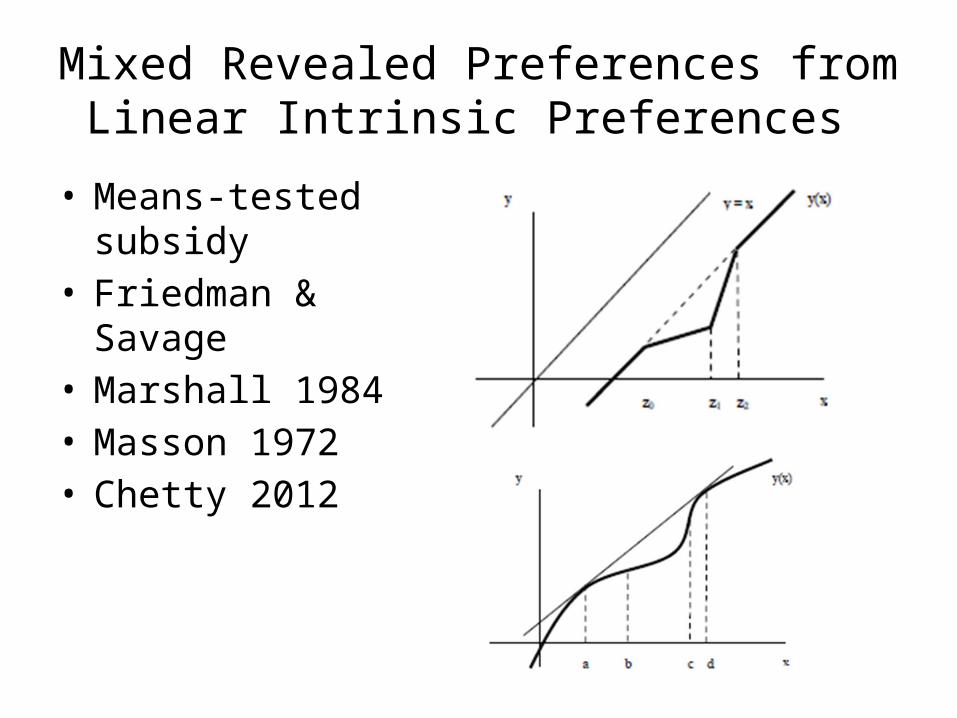
Mixed Revealed Preferences from Linear Intrinsic Preferences
• Means-tested subsidy• Friedman & Savage • Marshall 1984• Masson 1972• Chetty 2012


51
Real Options• Insurance: Other explanations: policy as a put option, cuts costs
of contingency planning• Real estate: But higher uncertainty also increases the option
value from waiting to sink typically irreversible construction costs
• Bulan et al. 2009: analysis of 1214 condominium projects in Vancouver Canada during 1979-98 finds that empirical evidence supports the risk-neutral predictions of real options theory.
• We should explore how far linear utility of net payoffs combined with careful analysis of opportunity sets and embedded real options will take us.
• Perhaps farther than curved but unobservable BFs have
Empirical Failure of EU
Implications for Business and Economics
• Accounting: lower-of-cost-or-market vs. market-to-market accounting
• Finance: Risk (default) in insurance and bond markets vs. beta risk in portfolio theory and equity markets
• Agency theory: risk sharing with concave utility plays an important role without much empirical evidence
• Marketing: new product introduction or price adjustments• Personnel: asymmetric hiring and retention policies• Avoiding confusion between two very different meanings of
risk is important for a rational discourse, and effective management of organization and governance

Conclusions• Concepts of risk, and human attitude to risk have played an
important role in our attempts to understand decision making under uncertainty
• Dispersion-of-outcomes meaning of risk, and curved utility functions to represent human attitudes to risk have not been helpful in this endeavor
• Perhaps it is time for a careful examination if alternative approaches might be more useful:– Common sense (loss or danger) meaning of risk– Real option theory– Looking for explanations in observable opportunity sets instead of
unobservable utility functions– Will require us to consider return to traditional meaning of risk
