measures that matter: designing and developing your own balanced scorecard karin de jager & jim...
TRANSCRIPT

Measures that matter:
Designing and developing your own Balanced Scorecard
Karin de Jager & Jim Self
7th Northumbria International Conference7th Northumbria International Conferenceon Performance Measurement on Performance Measurement
in Libraries and Information Servicesin Libraries and Information ServicesAn IFLA Satellite ConferenceAn IFLA Satellite Conference
August 2007 7th Northumbria Conference, Spier, South Africa
2
Programme: 14h00 – 14h40:
Introduction to the Balanced Scorecard. The South African environment. Implementing a Scorecard with measures that matter. Karin de Jager
14h40 - 15h20:The Balanced Scorecard in practice: how it works and what it can tell us. Problems, pitfalls & solutions. Jim Self
15h20 – 16h40: Small group work: Develop the outline of a Balanced Scorecard for a particular institution. Specify three metrics (with targets) for the four quadrants.
16h40 – 17h30: Reportback session with comment & feedback from speakers & participants.

August 2007 7th Northumbria Conference, Spier, South Africa
3
Measures that matter in SA: an Introduction Higher Education Evaluation in SA Dealing with too much data Assessing Quality Different Perspectives The Balanced Scorecard Measures & Targets Components of a Scorecard

August 2007 7th Northumbria Conference, Spier, South Africa
4
Higher Education Evaluation
2004 HEQC responsible for Quality Assurance Quality Audits mandated CHELSA established own QA Subcommittee Two documents: Measures for Quality; and a Guide
to the Self Review of University Libraries, to assist Large number of possible indicators. but not
prescriptive Individual libraries to select most appropriate for
own circumstances

August 2007 7th Northumbria Conference, Spier, South Africa
5
Data, data everywhere
Over-complexity often a cause for failure Useful information can drown in too much
detail Collecting and sorting through too much
information can become more trouble than it is worth
One way of attempting to manage this deluge of data, is to focus on only a small number of meaningful indicators

August 2007 7th Northumbria Conference, Spier, South Africa
6
What is Quality?
Fitness for purpose Never static or finally achieved Accurate measurement essential “If something can’t be measured, it can’t be
understood. If it can’t be understood, it can’t be controlled; if it can’t be controlled, it can’t be improved” (Harrington)

August 2007 7th Northumbria Conference, Spier, South Africa
7
Quality in libraries seen from different points of view
The consumers of library services: Diverse in nature: from first year to advanced
research Library workers:
Have to be competent in wide range of services Institutional funding authorities:
Objectives addressed & value for money? Overall strategic perspective:
Ensure fitness for purpose into the future

August 2007 7th Northumbria Conference, Spier, South Africa
8
Balanced Scorecard:
One approach Commercial management tool Defines organization's long-term strategy Specific, measurable goals From different perspectives Attempts to integrate large amounts of diverse
data into a single system
August 2007 7th Northumbria Conference, Spier, South Africa
9
Scorecard perspectives User perspective: "how well is the library meeting
the needs or expectations of its users?” Finance perspective: "how well are the library's
finances managed to achieve its mission?" Internal process perspective: "how do the library's
internal processes function to deliver library collections and services efficiently?"
Future, learning or growth perspective: "how well is the library positioned to ensure that goals are met in the future?"

August 2007 7th Northumbria Conference, Spier, South Africa
10
Balanced Scorecard illustrated
Financeperspective
Userperspective
Processperspective
Future/Learning
perspective

August 2007 7th Northumbria Conference, Spier, South Africa
11
Vision at the centre
E.g. a “First Class African research and teaching university”
What does this mean? First class?
Benchmark internationally African?
How African are we really, and how can we demonstrate & measure this?
Evidence of support for research & teaching?

August 2007 7th Northumbria Conference, Spier, South Africa
12
Indicators must be measurable Surveys
Users, e.g. LibQUAL+ Availability
Financial expenditure Totals or per unit
Time expended E.g. on acquisitions, cataloguing, ILL
Counts and tallies of processes and services Targets to see how well one is doing
August 2007 7th Northumbria Conference, Spier, South Africa
13
Constructing a Balanced Scorecard
Select a limited number of meaningful indicators for each quadrant
Select targets for each indicator Four quadrants:
User perspective Internal processes perspective Finance perspective Future/growth perspective
August 2007 7th Northumbria Conference, Spier, South Africa
14
User Perspective (1)
User satisfaction LibQual+ comparative data satisfaction with “the overall quality of the service
provided by the library” Adequate support for teaching & learning
(HEQC) Information literacy activities? How many classes or students are taught at
present?

August 2007 7th Northumbria Conference, Spier, South Africa
15
User Perspective (2)
Adequate support for research? ILL provides research materials for postgraduate
students & academics Extent of use:
Increase in use of electronic resources (increase in full-text downloads, or downloads per capita)
Access to library portal or web page, Loans per student? Market penetration?
August 2007 7th Northumbria Conference, Spier, South Africa
16
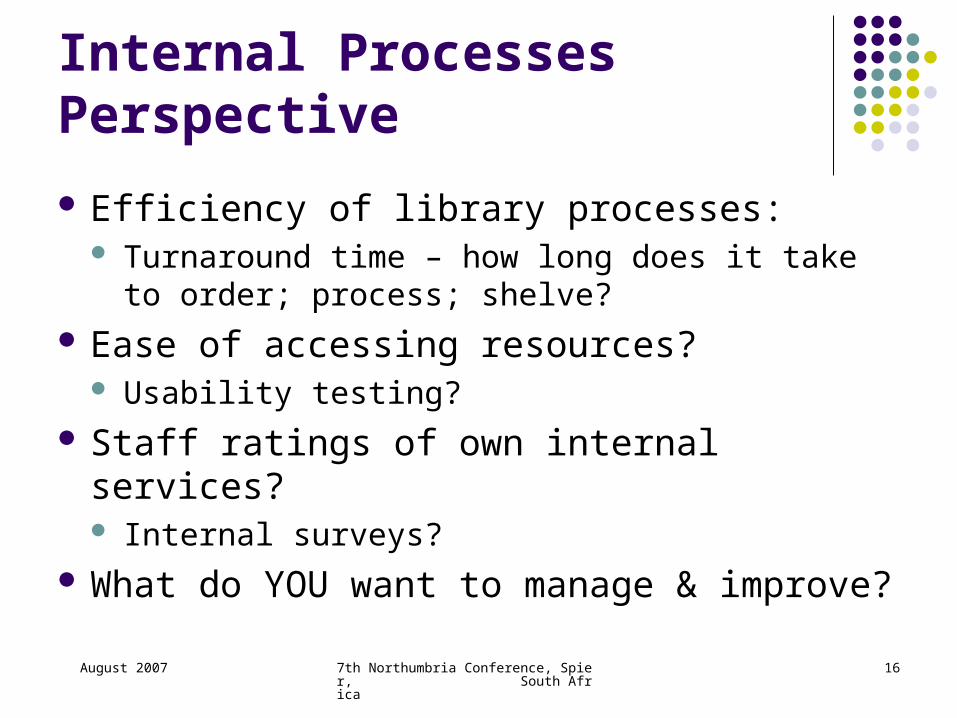
Internal Processes Perspective
Efficiency of library processes: Turnaround time – how long does it take to order;
process; shelve? Ease of accessing resources?
Usability testing? Staff ratings of own internal services?
Internal surveys? What do YOU want to manage & improve?

August 2007 7th Northumbria Conference, Spier, South Africa
17
Financial Perspective
Library budget as % of institutional budget? Unit costs & ratios, e.g.
Library expenditure per student? Books purchased per student? Spend on e-resources as % of acquisitions spend?
Fundraising? Set target amounts

August 2007 7th Northumbria Conference, Spier, South Africa
18
Future/Growth Perspective
Staff development? Staff participation: further education; Staff participation: in-service training Staff participation: conferences, workshops
Continuous alignment with institutional vision? African materials purchased?
Investment in infrastructure Replacement rate for library computers? % of library computers/copiers/printers out of
action?

August 2007 7th Northumbria Conference, Spier, South Africa
19
Importance of Targets
Measure quantitatively Set high but achievable targets Consider two sets of targets:
Complete success Partial success
Aggregate regularly to provide feedback Address problems that are revealed

August 2007 7th Northumbria Conference, Spier, South Africa
20
Targets at a glanceUser Perspective
40%
40%
20%
Target met
Partial success
Target not met
Internal Perspective
34%
33%
33%Target met
Partial success
Target not met
Finance Perspective
25%
50%
25%
Target met
Partial success
Target not met
Future/Growth Perspective
25%
25%
50%
Target met
Partial success
Target not met

August 2007 7th Northumbria Conference, Spier, South Africa
21
The Balanced Scorecard in Practice
Jim Self
Director, MIS
University of Virginia Library
August 2007 7th Northumbria Conference, Spier, South Africa
22
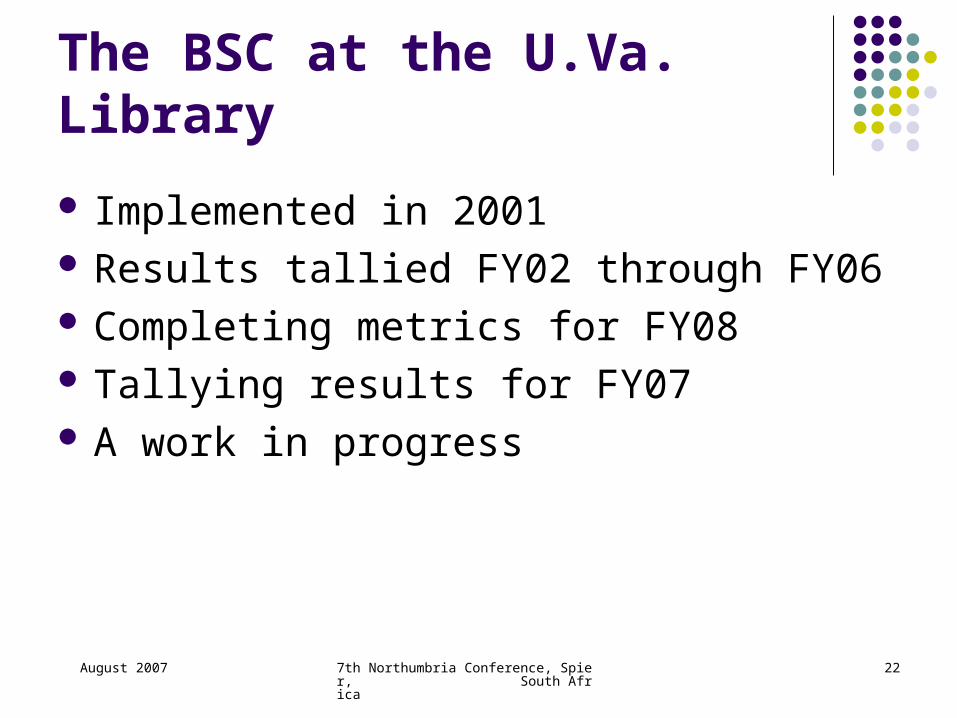
The BSC at the U.Va. Library
Implemented in 2001 Results tallied FY02 through FY06 Completing metrics for FY08 Tallying results for FY07 A work in progress

August 2007 7th Northumbria Conference, Spier, South Africa
23
Choosing the Metrics --Reflecting Values
What is important? What are we trying to accomplish?

August 2007 7th Northumbria Conference, Spier, South Africa
24
Choosing the Metrics--Diversity and Balance
Innovations and operations Variety of measurements

August 2007 7th Northumbria Conference, Spier, South Africa
25
Choosing the Metrics--Ensuring validity
Does the measurement accurately
reflect the reality?

August 2007 7th Northumbria Conference, Spier, South Africa
26
Choosing the Metrics--Being Practical
Use existing measures when possible Use sampling Collect data centrally Minimize work by front line
August 2007 7th Northumbria Conference, Spier, South Africa
27
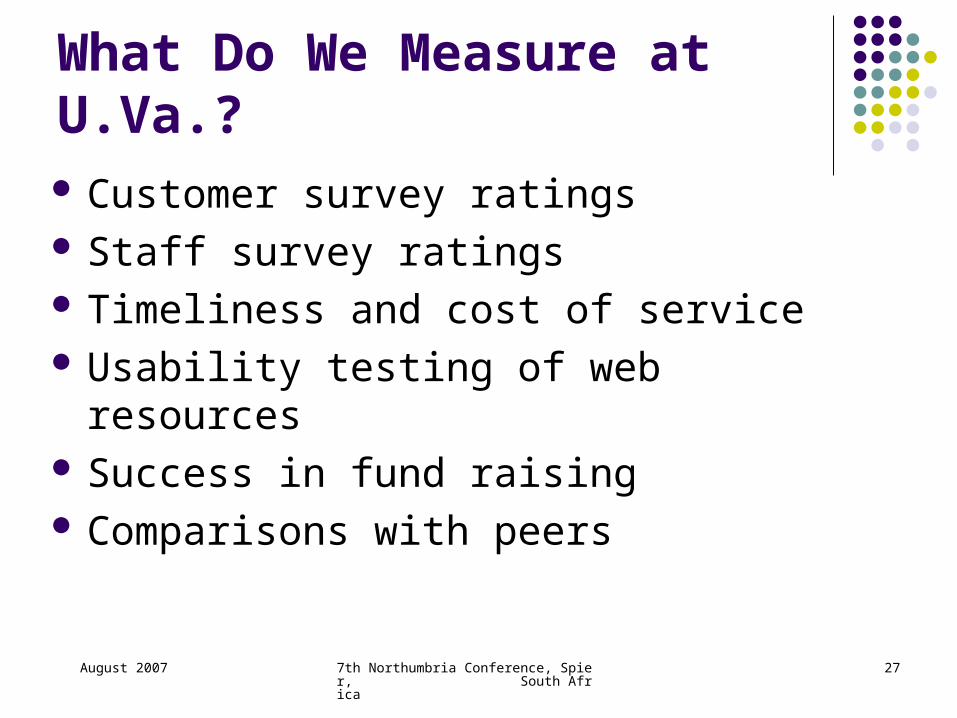
What Do We Measure at U.Va.? Customer survey ratings Staff survey ratings Timeliness and cost of service Usability testing of web resources Success in fund raising Comparisons with peers

August 2007 7th Northumbria Conference, Spier, South Africa
28
A closer look…Impact of the Scorecard

August 2007 7th Northumbria Conference, Spier, South Africa
29
Process improvement…Identifying and dissecting shortfalls

August 2007 7th Northumbria Conference, Spier, South Africa
30
Metric U.4.B: Turnaround time for user requests
Target1: 75% of user requests for new books should be filled within 7 days.
Target2: 50% of user requests for new books should be filled within 7 days.
Result FY06: Target1. 79% filled within 7 days.

August 2007 7th Northumbria Conference, Spier, South Africa
31
Metric VII: Turnaround time for user requests
Target1: 90% of user requests for new books should be filled within 7 days.
Target2: 80% of user requests for new books should be filled within 7 days.
Result FY03: Target not met. 17% filled within 7 days.

August 2007 7th Northumbria Conference, Spier, South Africa
32
Accountability…Institutionalizing customer feedback

August 2007 7th Northumbria Conference, Spier, South Africa
33
Metric U.1.A: Overall rating in student and faculty surveys
Target1: An average score of at least 4.00 (out of 5.00) from each of the major constituencies.
Target2: A score of at least 3.90.
FY06 Result: Target1 Graduate students 4.08 Undergraduates 4.11

August 2007 7th Northumbria Conference, Spier, South Africa
34
Metric I.3.B. Staff Survey Rating of Internal Customer Service
Target1: A composite rating of at least 4.00, with no unit rated below 3.50.
Target2: A composite rating of 3.50, with no unit below 3.00.
Result FY05: Target1.
Composite score of 4.09. Individual unit ranged from 3.52 to 4.57.

August 2007 7th Northumbria Conference, Spier, South Africa
35
Examining priorities

August 2007 7th Northumbria Conference, Spier, South Africa
36
Metric F.2.A: Unit Cost of Electronic Serial Use
Target1: There should be no increase in unit cost each year.
Target2: Less than 5% annual increase in unit cost.
Result FY03-FY05: Target1.
Result FY06: Target not met. 8.8% increase ($2.10 vs. $1.93)

August 2007 7th Northumbria Conference, Spier, South Africa
37
Gaining resources

August 2007 7th Northumbria Conference, Spier, South Africa
38
Metric F.1.B. Library spending compared to University expenditures
Target1: : The University Library will account for at least 2.50% of the University’s academic division expenditures.
Target2: : The Library will account for at least 2.25% of expenditures.
Result FY06: Target1. 2.57% ($25.2M of $972M)

August 2007 7th Northumbria Conference, Spier, South Africa
39
Metric F.1.C. Amount of unrestricted development receipts.
Target1: Increase unrestricted (or minimally restricted) giving by 10% each year.
Target2: Increase of 5% per year.
Result FY06: Target1.
FY06 unrestricted receipts were $774,000; target was $374,000.
August 2007 7th Northumbria Conference, Spier, South Africa
40
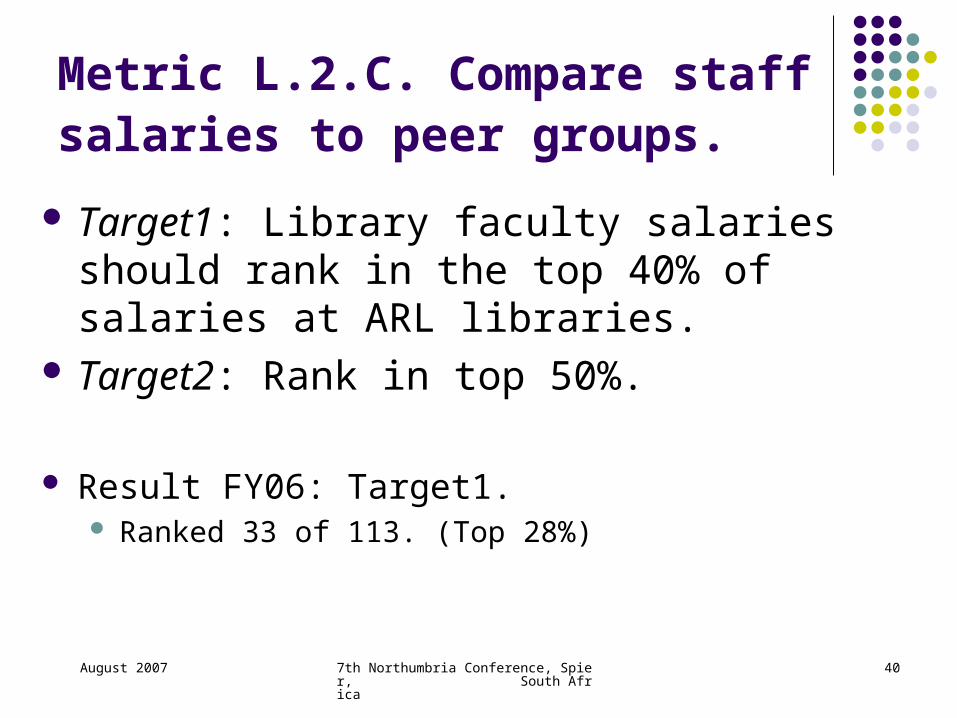
Metric L.2.C. Compare staff salaries to peer groups.
Target1: Library faculty salaries should rank in the top 40% of salaries at ARL libraries.
Target2: Rank in top 50%.
Result FY06: Target1.
Ranked 33 of 113. (Top 28%)

August 2007 7th Northumbria Conference, Spier, South Africa
41
To summarize…The Balanced Scorecard
Reflects the organization’s vision Clarifies and communicates the vision Provides a quick, but comprehensive, picture
of the organization’s health

August 2007 7th Northumbria Conference, Spier, South Africa
42
Assessing the BSC
What are the benefits? Is it worth the costs? Are we measuring the right things? What have we learned? Where do we go from here?