measurement challenges in growth and value added models joseph a. martineau executive director of...
TRANSCRIPT

Measurement Challenges in Growth and Value Added Models
Joseph A. MartineauExecutive Director of Assessment & AccountabilityMichigan Department of Education
Growth in English Language Proficiencyfor Spanish Speaking Females
by Language Domain
3 4 5
Grade
En
glis
h L
ang
uag
e P
rofi
cien
cy Listening
Reading
Writing
Speaking
Composite
Presentation at the Florida State University Dean’s Consortium July 16, 2010

Slide 2 October 24, 2011
What is a Construct?• Theoretical definition?
– Content experts usually define constructs with high levels of dimensionality for sub-constructs with theoretically important differences in meaning
– Each dimension or sub-construct can typically be considered its own construct worthy of individual study
• Statistical abstraction?– Psychometricians and statisticians usually define constructs with low
levels of dimensionality– Depends on correlations among sub-constructs
• A combination?– I fall into this camp– A construct is a characteristic that is…
• Theoretically distinguishable• Statistically distinguishable• High correlations does not mean the constructs are indistinguishable• Highly correlated constructs may be affected differently by different
interventions

Slide 3 October 24, 2011
Construct Definition• Traditional psychometric assumptions
about constructed measures include that measures are…–Unidimensional
• Sensitive to only a single construct• Measure only a single thing
–On an interval-level scale• Changes of the same magnitude on different
parts of a scale indicate the same amount of change
• Implies that the measures are also linear

Slide 4 October 24, 2011
Counterexamples in the Simple Case
• Start out with counterexamples within a single grade level– Grade 8– Mathematics– Based on Michigan Grade Level Content
Expectations– Based on the Michigan Educational Assessment
Program (or MEAP)

Slide 5 October 24, 2011
A Theoretical Counterexample to the Unidimensionality Assumption
Theoretically, math is multidimensional. Traditional statistical tests say math is unidimensional.
Depends on the claim that because the sub-scales are highly correlated, it’s all just undifferentiated mathematics
Question: Are there interventions (including teachers) that help greatly with number & operations, but not so much with algebra? If so, can we claim that math is a unidimensional, undifferentiable construct?
From a theoretical perspective high correlations do not mean that subscales should be modeled as a single construct
Taken from the percentage of Michigan mathematics grade level content expectations covering each strand.
Grade 80%
10%
20%
30%
40%
50%
60%
70%
80%
90%
100%
38
18
22
22
Mathematics content standard distribution
Algebra
Data & Probability
Measurement
Number & Operations
Per
cent
of c
onte
nt s
tand
ards

Slide 6 October 24, 2011
But, those are just theoretical concerns.
The statistics show that you can just treat the subscales as a single overall scale
Can you show me an empirical example of where this matters?

Slide 7 October 24, 2011
Created a composite math scale, placed subscales on the “same scale.”
Ordered students on the composite math scale.
Created 100 groups of students of about 1,100 students each.
Obtained average composite math score of the 100 groups
Obtained average sub-scale scores of 100 groups on the three subscales
Plotted in a three-dimensional achievement space
An Empirical Counterexample (from Martineau et al, 2007)
-2-1
01
2
-2
-1
0
1
2-2
-1
0
1
2
Algebra
Grade 8 MEAP Mathematics
Geometry
Nu
mb
er
& O
pera
tio
ns

Slide 8 October 24, 2011
An Empirical Counterexample (from Martineau et al, 2007)
-2-1
01
2
-2
-1
0
1
2-2
-1
0
1
2
Algebra
Grade 8 MEAP Mathematics
Geometry
Nu
mb
er
& O
pera
tio
ns
Highest achieving group of about 1,100 students on the composite mathematics scale
Lowest achieving group of about 1,100 students on the composite mathematics scale

Slide 9 October 24, 2011
An Empirical Counterexample
-2-1
01
2
-2
-1
0
1
2-2
-1
0
1
2
Algebra
Grade 8 MEAP Mathematics
Geometry
Nu
mb
er
& O
pera
tio
ns
3-D Composite scale: passes all traditional unidimensionality tests.
Projections of 3-D composite onto 2-D composite. If the composite scale is unidimensional and linear, all four plots should be linear and identical. However, changes near the lower end of the scale mostly represent improvement in number & operations and geometry.

Slide 10 October 24, 2011
An Empirical Counterexample
-2-1
01
2
-2
-1
0
1
2-2
-1
0
1
2
Algebra
Grade 8 MEAP Mathematics
Geometry
Nu
mb
er
& O
pera
tio
ns
Important results: composite scale changes meaning over its range, and is multidimensional, non-linear, and non-interval
Statistical models that rely on these scale characteristics will result in distorted interpretations

Slide 11 October 24, 2011
Implications• If scales traditionally considered
unidimensional, linear, and interval are sometimes none of the three…– How badly affected are the results of statistical
models that use those scales as outcomes?– Can powerful statistical models that require those
scale characteristics still be used?
• Essentially, why should I care whether the assumptions are violated?

Slide 12 October 24, 2011
Theoretically, how badly can value-added be affected• Simplest case theoretical thought experiment• Scenario
– Teacher A vs. Teacher B as a reading intervention– A true experiment, assigning students randomly to either Teacher A or
Teacher B– A composite reading measure
• Sensitive to both decoding and comprehension• More sensitive to decoding than comprehension• Does not change meaning over its range
– Known impacts• Teacher A increases gains in comprehension• Teacher B increases gains in decoding by the same amount• Teacher A has no impact on decoding• Teacher B has no impact on comprehension
– Results should identify both as equally effective, but on different parts of the reading construct
– Next slides—graphical representations of the thought experiment

Slide 13 October 24, 2011
Simple Thought Experiment (from Martineau et al, 2007)
400 420 440 460 480 500 520 540400
450
500
550
Decoding
Co
mp
reh
en
sio
n
composite reading scale, sensitive to both decoding and comprehension, but more sensitive to decoding

Slide 14 October 24, 2011
Simple Thought Experiment
400 450 500 550400
450
500
550
Decoding
Co
mp
reh
en
sio
n
pretest centroid for both groups (e.g. a randomized experiment)

Slide 15 October 24, 2011
Simple Thought Experiment
400 450 500 550400
450
500
550
Decoding
Co
mp
reh
en
sio
n
Y = teacher A value added on comprehension
X = normalgains on compre-hension
Y = teacher B value added on decoding
X = normal gains on decoding

Slide 16 October 24, 2011
Simple Thought Experiment
400 450 500 550400
450
500
550
Decoding
Co
mp
reh
en
sio
n
Teacher A post-test centroid
Teacher B post-test centroid

Slide 17 October 24, 2011
Simple Thought Experiment
400 450 500 550400
450
500
550
Decoding
Co
mp
reh
en
sio
n
Projections of multidimensional centroids onto the composite scale

Slide 18 October 24, 2011
Simple Thought Experiment
400 450 500 550400
450
500
550
Decoding
Co
mp
reh
en
sio
n
Effect of Teacher B over Teacher A

Slide 19 October 24, 2011
Simple Thought Experiment• Comparisons
– Results• Accurate
– Equal impact of Teacher A and Teacher B, but on different dimensions of reading achievement
• Observed– Teacher B is better than Teacher A at improving reading achievement
– Policy recommendations• Accurate
– Assign teacher A to take PD on instruction in reading comprehension– Assign teacher B to take PD on instruction in decoding
• Observed– Give Teacher A PD in reading

Slide 20 October 24, 2011
Theoretically, how badly can value-added be affected?• Next simplest case theoretical thought quasi-experiment• Scenario
– Teacher A vs. Teacher B as a mathematics intervention– A quasi-experiment
• Existing groups (e.g., classes taught by teacher A vs. teacher B)• Select teacher A and B to assure matching samples on pre-test
mathematics measure– A composite mathematics measure
• Sensitive to both algebra and geometry• Scale changes meaning over its range
– Known impacts• Teacher A is more effective in eliciting growth in geometry achievement• Teacher B is of average effectiveness in eliciting growth in geometry• Teacher A and B are both of average effectiveness on eliciting growth in
algebra– Results should identify teacher A as the more effective teacher– Next slides—graphical representations of the thought quasi-experiment

Slide 21 October 24, 2011
Simple Thought Quasi-Experiment (from Martineau et al, 2007)
-2-1
01
2
-2
-1
0
1
2-2
-1
0
1
2
Algebra
Grade 8 MEAP Mathematics
Geometry
Nu
mb
er
& O
pera
tio
ns
Used the Geometry/ Algebra composite from the empirical example as the scale in this thought experiment

Slide 22 October 24, 2011
Simple Thought Quasi-Experiment
-1.5 -1.0 -0.5 0.0 0.5-2.0
-1.5
-1.0
-0.5
0.0
0.5
Algebra
Geo
met
ry
Teacher A pre-test centroid
Teacher B pre-test centroid

Slide 23 October 24, 2011
Simple Thought Quasi-Experiment
-1.5 -1.0 -0.5 0.0 0.5-2.0
-1.5
-1.0
-0.5
0.0
0.5
Algebra
Geo
met
ry
Both pre-test centroids project onto the same location on the non-linear unidimensional scale(gives matched samples)

Slide 24 October 24, 2011
Simple Thought Quasi-Experiment
-1.5 -1.0 -0.5 0.0 0.5-2.0
-1.5
-1.0
-0.5
0.0
0.5
Algebra
Geo
met
ry
X = Teacher A value-added on geometry
Y = Average gains on geometry
Y = average gains on geometry
Z = average gains on algebra
Z = average gains on algebra

Slide 25 October 24, 2011
Simple Thought Quasi-Experiment
-1.5 -1.0 -0.5 0.0 0.5-2.0
-1.5
-1.0
-0.5
0.0
0.5
Algebra
Geo
met
ry
Teacher A post-test cen-troid
Teacher B post-test centroid

Slide 26 October 24, 2011
Simple Thought Quasi-Experiment
-1.5 -1.0 -0.5 0.0 0.5-2.0
-1.5
-1.0
-0.5
0.0
0.5
Algebra
Geo
met
ry Effect in favor of teacher B!

Slide 27 October 24, 2011
Simple Thought Quasi-Experiment
• Comparisons– Results
• Accurate– Teacher A is more effective in eliciting geometry growth– Teacher A and B are equally effective in eliciting algebra growth
• Observed– Teacher B is more effective in eliciting mathematics growth
– Policy recommendations• Accurate
– Reward Teacher A• Observed
– Reward Teacher B

Slide 28 October 24, 2011
Summary to this point• Limited thus far to within-grade measures (or
horizontal scales)– Theoretical demonstration that content standards
within a content area are multidimensional– Empirical demonstration that a content
achievement measure contains multiple dimensions (sub-scales) that behave differently
– Theoretical demonstration that ignoring multidimensionality can distort the results of experiments and quasi-experiments in value-added; even to the point of reversing a finding

Slide 29 October 24, 2011
Multidimensionality in Cross-Grade (Vertical) Scales: Adding Another Layer of Complexity
• To this point, the presentation has been limited to within-grade (or horizontal) scales
• Value Added Models in education tend to…– Cover multiple years– Cover multiple grades– Cover broad ranges of achievement– Cover changing foci of instruction
• To allow for such broad coverage, we need…– Cross-grade (or vertical) scales
Slide 30 October 24, 2011
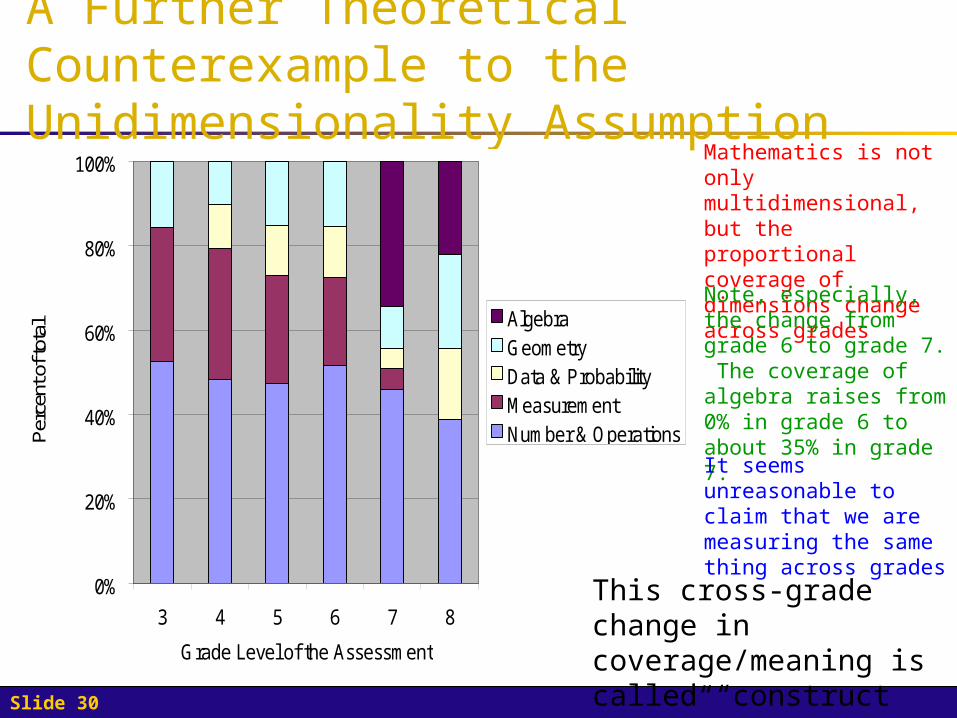
A Further Theoretical Counterexample to the Unidimensionality Assumption
0%
20%
40%
60%
80%
100%
3 4 5 6 7 8
Grade Level of the Assessment
Per
cent
of t
otal
AlgebraGeometryData & ProbabilityMeasurementNumber & Operations
Mathematics is not only multidimensional, but the proportional coverage of dimensions change across grades
Note, especially, the change from grade 6 to grade 7. The coverage of algebra raises from 0% in grade 6 to about 35% in grade 7.
It seems unreasonable to claim that we are measuring the same thing across grades
This cross-grade change in coverage/meaning is called “construct shift”

Slide 31 October 24, 2011
Cross-Grade (Vertical) Scale Terminology
• Types of vertical scale– Purely unidimensional scales
• Measure one and only one construct• Non-construct-shifted, non-composite scales
– Empirically unidimensional scales• Measure more than one construct• The proportional representation of the multiple constructs in the
overall scale is the same across grades• The scale does not change meaning across grades• Non-construct-shifted, composite scales
– Empirically multidimensional scales• Measure more than one construct• The proportional representation of the multiple constructs in the
overall scale varies across grades• The scale changes meaning across grades• Construct-shifted, composite scales
Slide 32 October 24, 2011
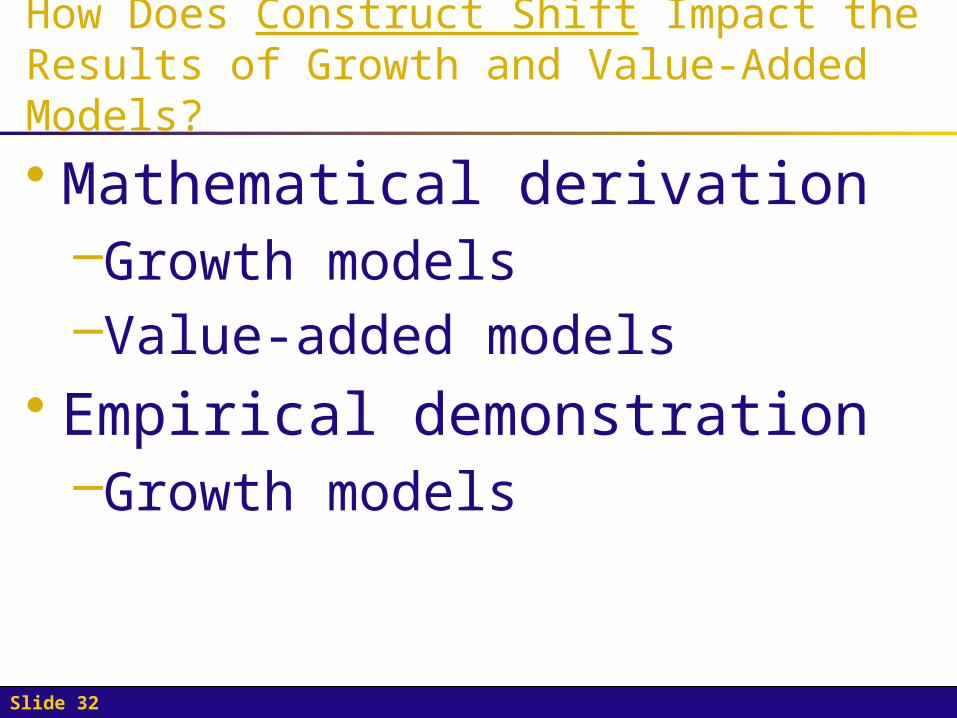
How Does Construct Shift Impact the Results of Growth and Value-Added Models?
• Mathematical derivation–Growth models–Value-added models
• Empirical demonstration–Growth models

Slide 33 October 24, 2011
Let’s say…
• We want to measure the impact of a single teacher (or group of teachers using the same intervention) on student growth
• Let x represent whether a student is instructed by a certain teacher (or group of teachers)
Slide 34 October 24, 2011
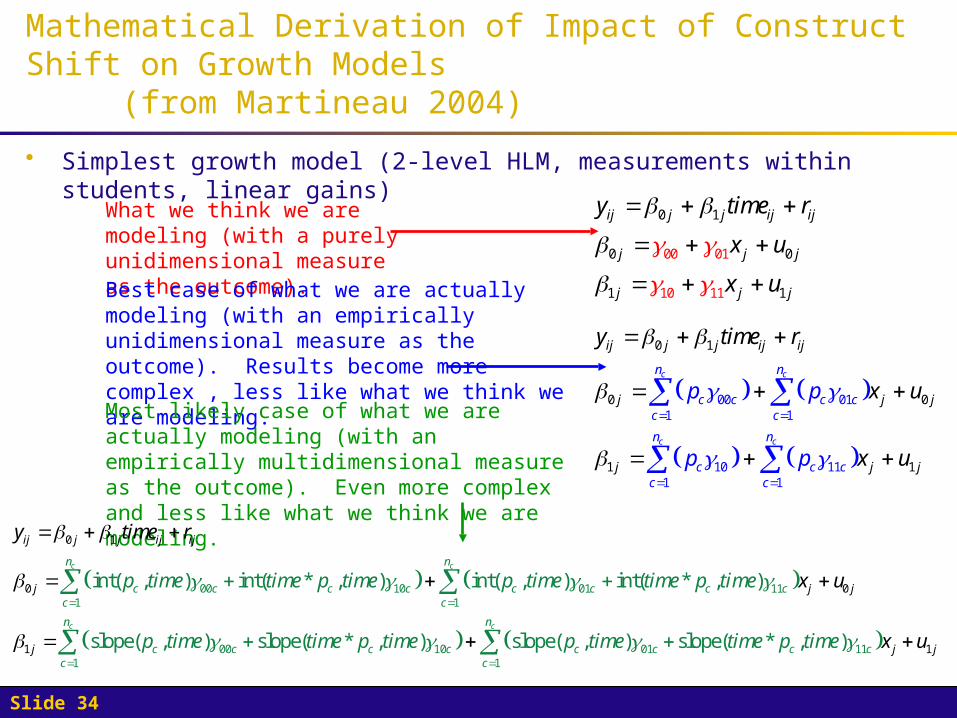
Mathematical Derivation of Impact of Construct Shift on Growth Models (from Martineau 2004)
• Simplest growth model (2-level HLM, measurements within students, linear gains)
00
0 1
0 0
1 1
01
10 11
ij j j ij ij
j j j
j j j
y time r
x u
x u
0 1
0 0
1
00 011 1
10 111 1
1
c c
c c
ij j
n n
c c c
j i
c
j ij
jc c
n n
c c cc
j
c
j
j j j
y tim
p p
e r
x u
x up p
00 10 01 111 1
00 1
0 1
0 0
0 01 11
int( , ) int( * , ) int( , ) int( * , )
slope( , ) slope( * , ) slope( , ) slope(
c c
c
n n
c c c c c c c cc c
n
c c c c
ij j j ij ij
j j j
j c cc
p time time p time p time time p ti
y time r
xme
p time time p time
u
p time ti
111
1* , )cn
c c jc
jme p time x u
What we think we are modeling (with a purely unidimensional measure as the outcome).Best case of what we are actually modeling (with an empirically unidimensional measure as the outcome). Results become more complex , less like what we think we are modeling.
Most likely case of what we are actually modeling (with an empirically multidimensional measure as the outcome). Even more complex and less like what we think we are modeling.

Slide 35 October 24, 2011
0 1
0 00 01 01 1
1 10 11 11 1
c c
c c
ij j j ij ij
n n
j c c c c j jc c
n n
j c c c j jc c
y time r
p p x u
p p x u
0 1
0 00 10 01 11 01 1
1 00 10 011
int( , ) int( * , ) int( , ) int( * , )
slope( , ) slope( * , ) slope( , ) slope(
c c
c
ij j j ij ij
n n
j c c c c c c c c j jc c
n
j c c c c c cc
y time r
p time time p time p time time p time x u
p time time p time p time ti
11 11
* , )cn
c c j jc
me p time x u
Mathematical Derivation of Impact of Construct Shift on Growth Models
0 1
0 00 01 0
1 10 11 1
ij j j ij ij
j j j
j j j
y time r
x u
x u
Overall intercept (starting point)
Effect of teacher x on intercept
Overall slope (growth rate)
Effect of teacher x on growth rate
Analogous Terms
Problem: red and blue should be in the intercept equation (β0j), green and black should be in the slope equation (β1j). All four are in both for the model using an empirically multidimensional scale!

Slide 36 October 24, 2011
Mathematical Derivation of Impact of Construct Shift on Growth Models
0 1
0 00 01 0
1 10 11 1
ij j j ij ij
j j j
j j j
y time r
x u
x u
0 1
0 00 01 01 1
1 10 11 11 1
c c
c c
ij j j ij ij
n n
j c c c c j jc c
n n
j c c c j jc c
y time r
p p x u
p p x u
0 1
0 00 10 01 11 01 1
1 00 10 011
int( , ) int( * , ) int( , ) int( * , )
slope( , ) slope( * , ) slope( , ) slope(
c c
c
ij j j ij ij
n n
j c c c c c c c c j jc c
n
j c c c c c cc
y time r
p time time p time p time time p time x u
p time time p time p time ti
11 11
* , )cn
c c j jc
me p time x u
Another Problem: the intercept and slope equations from construct-shifted (empirically multidimensional) scales contain totally irrelevant terms from the regression of proportional construct representation (pc) on time and the regression of (time multiplied by pc) on time

Slide 37 October 24, 2011
• Simple value-added model (two-level model with measurement occasions cross-nested within both teachers and students)
1
c
i
n
c acc
p u
11
c
i i
n
ci ac ic acc
p u u
Mathematical Derivation of Impact of Construct Shift on Growth-Based Value-Added Models (from Martineau, 2006)
iau
Teacher effect we think we are modeling (with a purely unidimensional measure as the outcome).
Best case of what we are actually modeling (with an empirically unidimensional measure as the outcome). More complex and less like what we think we are modeling.
Most likely case of what we are actually modeling (with an empirically multidimensional measure as the outcome). Even more complex and less like what we think we are modeling

Slide 38 October 24, 2011
1
c
i
n
c acc
p u
11
c
i i
n
ci ac ic acc
p u u
Mathematical Derivation of Impact of Construct Shift on Growth-Based Value-Added Models
iau
Change in proportional representation of construct c from the previous grade
Impact of all teachers previous to teacher a in year i on student gains on construct c
Impact of teacher a on year i student gains on construct c
Year i proportional representation of construct c
Impact of teacher a on unidimensional student gains in year i (what we want) Proportional representation
of construct c

Slide 39 October 24, 2011
1
c
i
n
c acc
p u
11
c
i i
n
ci ac ic acc
p u u
Mathematical Derivation of Impact of Construct Shift on Growth-Based Value-Added Models
iau
Can be considered relevant (with problems)
Definitely irrelevant
We can calculate proportion of variance in teacher effects that is construct relevant in construct-shifted (empirically multidimensional) scales
Definitely relevant

Slide 40 October 24, 2011
Mathematical Derivation of Percent of Variance in Teacher Effects from Construct Relevant Sources (from Martineau 2006)

Slide 41 October 24, 2011
Mathematical Derivation of Percent of Variance in Teacher Effects from Construct Relevant Sources (from Martineau 2006)
Proportion of teacher effects not attributable to prior teachers

Slide 42 October 24, 2011
Mathematical Derivation of Percent of Variance in Teacher Effects from Construct Relevant Sources (from Martineau 2006)
The proportion that I can impact of the estimate of my effectiveness as a teacher depends on the balance of construct representation in the current grade level test, …

Slide 43 October 24, 2011
Mathematical Derivation of Percent of Variance in Teacher Effects from Construct Relevant Sources (from Martineau 2006)
…on change in construct representation from grade to grade, …

Slide 44 October 24, 2011
Mathematical Derivation of Percent of Variance in Teacher Effects from Construct Relevant Sources (from Martineau 2006)
…on the number of teachers who precede me in the analysis, and …

Slide 45 October 24, 2011
Mathematical Derivation of Percent of Variance in Teacher Effects from Construct Relevant Sources (from Martineau 2006)
…on the population-wide correlation in value-added impacts on the multiple constructs
(not on the correlation of the constructs themselves)

Slide 46 October 24, 2011
Mathematical Derivation of Percent of Variance in Teacher Effects from Construct Relevant Sources (from Martineau 2006)
The proportion of the estimate of my effectiveness that I can impact can drop quickly and dramatically depending on my circumstances.

Slide 47 October 24, 2011
Mathematical Derivation of Percent of Variance in Teacher Effects from Construct Relevant Sources (from Martineau 2006)
• How much construct irrelevant variance is acceptable in teacher effects?– In a research study?– In a pay-for-performance
measure?– In a teacher evaluation
measure used for hiring, firing, promotion, and tenure decisions?

Slide 48 October 24, 2011
Empirical Demonstration of the Importance of Which Scale is Used• Lockwood, J.R., et al., (2007)
– Ran VAM on two mathematics subscales– Variation in VAM measures across subscales was greater
than variation across model specifications– Variation within teacher across subscales was greater than
variation within subscales across teachers– Correlation between value-added on the two subscales was
low
• Based on the percent variance from construct relevant sources chart, reliability of value-added based on unidimensional mathematics would be low

Slide 49 October 24, 2011
From Doran and Cohen (2005)
• Bias in vertical linking is so great that they recommended:– Include uncertainty in gains arising from vertical
linking bias in the results of Value Added Models– Consider not using value-added models [based on
vertical scales] to make causal inferences [about individual teachers or schools], the data are too noisy

Slide 50 October 24, 2011
Summary to this point• When using cross-grade (vertical scales)
– Mathematical demonstration that results of growth models are seriously distorted• Slopes contain intercept terms• Intercepts terms contain slope terms• Both intercept and slope terms contain terms from totally
irrelevant regressions of proportional construct weights on assessment occasions
– VAM sensitive to what sub-construct is measured– Cautions against causal interpretations based on
measurement issues

Slide 51 October 24, 2011
Summary to this point• When using cross-grade (vertical scales)
– Mathematical demonstration that results of value added models are seriously distorted• Intent of growth-based value-added models is to isolate individual
teacher effects from each other, but…• Individual teacher effect terms contain include the impact of all
teachers that preceded the individual teacher!• The impact of all preceding teachers in individual teacher effect
terms is amplified by the degree of changes in construct representation in the achievement measure from grade to grade
• You can be harmed (by following either poor or excellent teachers) or helped (by following either poor or excellent teachers) by no fault of your own
– Depends on how the construct representation changes on the test– Difficult to tell whether you will be harmed or helped

Slide 52 October 24, 2011
Summary to this point• Everything to this point has been either
– Theoretical• Thought experiment using “unidimensional” measures as outcomes• Thought quasi-experiment using “unidimensional” measures as
outcomes• Based on content-expert judgment of multidimensionality
– Empirical, but in a limited sense• Counts of content standards covering different sub-constructs• Identification of non-linear composite (multidimensional) scales
within grades– Mathematical
• Derivations of distortions in growth models using construct shifting vertical scales as outcomes
• Derivations of distortions in value-added models using construct shifting vertical scales as outcomes

Slide 53 October 24, 2011
What’s Missing?• Demonstration of major variations in outcomes
resulting from…– Growth models using real construct-shifted vertical
scales– Value-added models using real construct-shifted
vertical scales
Overall Summary

Slide 54 October 24, 2011
Instrument & Sample (from Martineau, Wyse, & Zeng, 2010)
• Michigan English Language Proficiency Assessment (ELPA)– Level III (Grades 3-5)– Measures four domains
• Reading, Writing, Listening, Speaking• Individual domains treated as purely unidimensional
– Dimensionality analysis based on Zeng & Martineau (2010)– More sensitive than traditional dimensionality analyses– Number of dimensions between 3 and 5, inclusive– Likely nearly purely unidimensional

Slide 55 October 24, 2011
Constructing Vertical Scales
• Grade 3-5 receive same assessment• Equating
– Followed the same cohort of students across grades 3 through 5– Common items from grade 3 to 4 and from grade 4 to 5– Common item vertical equating based on non-equivalent groups– Allows for best-case development of vertical scales
• Same level of the test in all three grades• No major differences in item difficulty across grades
• Calibration and scaling– Calibrated all items to the same base scale across years using
WINSTEPS– Used the IWEIGHT command to weight items to create different types
of vertical scales with differing domain contributions

Slide 56 October 24, 2011
Constructing Vertical Scales, continued…
• Types of scales– Purely unidimensional
• (R)eading, (W)riting, (L)istening, (S)peaking• Weights for R are R=1.00, W=0.00, L=0.00, S=0.00
– Empirically unidimensional• For example, (E)qual, (T)ext, (O)ral• Weights for E are R=0.25, W=0.25, L=0.25, S=0.25• Weights for T are R=0.40, W=0.40, L=0.10, S=0.10
– Empirically multidimensional• Text to Oral (T-O), Oral to Text (O-T), etc…• Weights for T-O are
– Grade 3: R=0.40, W=0.40, L=0.10, S=0.10– Grade 4: R=0.25, W=0.25, L=0.25, S=0.25– Grade 5: R=0.10, W=0.10, L=0.40, S=0.40
• Weights for O-T reverse grades 3 and 5 weights for T-O

Slide 57 October 24, 2011
Constructing Vertical Scales, continued…
• Fifteen resulting scales– Purely unidimensional
• R, W, L, S– Empirically unidimensional
• (E)qual – most commonly used• (T)ext – weighted toward R & W• (O)ral – weighted toward L & S• (C)omprehension – weighted toward R & L• (P)roduction – weighted toward W & S
– Empirically multidimensional• Text to Oral (T-O) – transition from T weights to O weights• Oral to Text (O-T) – transition from O weights to T weights• Comprehension to Production (C-P)• Production to Comprehension (P-C)• Speaking to R/W/L (S-3)• R/W/L to Speaking (3-S)
Slide 58 October 24, 2011
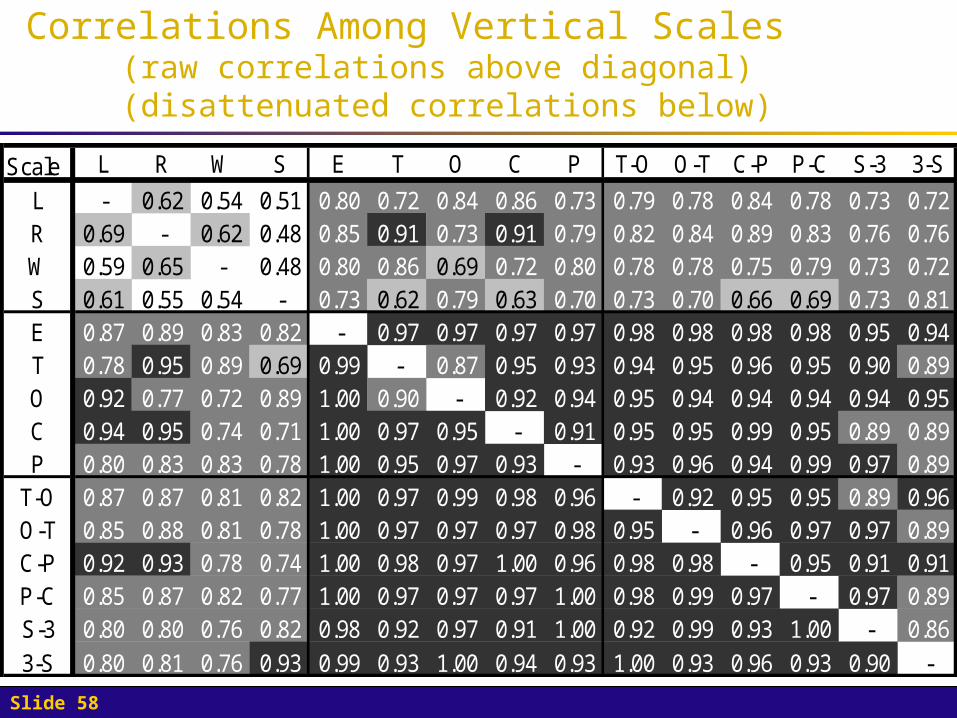
Correlations Among Vertical Scales (raw correlations above diagonal) (disattenuated correlations below)
Scale L R W S E T O C P T-O O-T C-P P-C S-3 3-S
L - 0.62 0.54 0.51 0.80 0.72 0.84 0.86 0.73 0.79 0.78 0.84 0.78 0.73 0.72R 0.69 - 0.62 0.48 0.85 0.91 0.73 0.91 0.79 0.82 0.84 0.89 0.83 0.76 0.76W 0.59 0.65 - 0.48 0.80 0.86 0.69 0.72 0.80 0.78 0.78 0.75 0.79 0.73 0.72S 0.61 0.55 0.54 - 0.73 0.62 0.79 0.63 0.70 0.73 0.70 0.66 0.69 0.73 0.81E 0.87 0.89 0.83 0.82 - 0.97 0.97 0.97 0.97 0.98 0.98 0.98 0.98 0.95 0.94T 0.78 0.95 0.89 0.69 0.99 - 0.87 0.95 0.93 0.94 0.95 0.96 0.95 0.90 0.89O 0.92 0.77 0.72 0.89 1.00 0.90 - 0.92 0.94 0.95 0.94 0.94 0.94 0.94 0.95C 0.94 0.95 0.74 0.71 1.00 0.97 0.95 - 0.91 0.95 0.95 0.99 0.95 0.89 0.89P 0.80 0.83 0.83 0.78 1.00 0.95 0.97 0.93 - 0.93 0.96 0.94 0.99 0.97 0.89
T-O 0.87 0.87 0.81 0.82 1.00 0.97 0.99 0.98 0.96 - 0.92 0.95 0.95 0.89 0.96O-T 0.85 0.88 0.81 0.78 1.00 0.97 0.97 0.97 0.98 0.95 - 0.96 0.97 0.97 0.89C-P 0.92 0.93 0.78 0.74 1.00 0.98 0.97 1.00 0.96 0.98 0.98 - 0.95 0.91 0.91P-C 0.85 0.87 0.82 0.77 1.00 0.97 0.97 0.97 1.00 0.98 0.99 0.97 - 0.97 0.89S-3 0.80 0.80 0.76 0.82 0.98 0.92 0.97 0.91 1.00 0.92 0.99 0.93 1.00 - 0.86
3-S 0.80 0.81 0.76 0.93 0.99 0.93 1.00 0.94 0.93 1.00 0.93 0.96 0.93 0.90 -

Slide 59 October 24, 2011
Correlations Among Vertical Scales
Scale L R W S E T O C P T-O O-T C-P P-C S-3 3-S
L - 0.62 0.54 0.51 0.80 0.72 0.84 0.86 0.73 0.79 0.78 0.84 0.78 0.73 0.72R 0.69 - 0.62 0.48 0.85 0.91 0.73 0.91 0.79 0.82 0.84 0.89 0.83 0.76 0.76W 0.59 0.65 - 0.48 0.80 0.86 0.69 0.72 0.80 0.78 0.78 0.75 0.79 0.73 0.72S 0.61 0.55 0.54 - 0.73 0.62 0.79 0.63 0.70 0.73 0.70 0.66 0.69 0.73 0.81E 0.87 0.89 0.83 0.82 - 0.97 0.97 0.97 0.97 0.98 0.98 0.98 0.98 0.95 0.94T 0.78 0.95 0.89 0.69 0.99 - 0.87 0.95 0.93 0.94 0.95 0.96 0.95 0.90 0.89O 0.92 0.77 0.72 0.89 1.00 0.90 - 0.92 0.94 0.95 0.94 0.94 0.94 0.94 0.95C 0.94 0.95 0.74 0.71 1.00 0.97 0.95 - 0.91 0.95 0.95 0.99 0.95 0.89 0.89P 0.80 0.83 0.83 0.78 1.00 0.95 0.97 0.93 - 0.93 0.96 0.94 0.99 0.97 0.89
T-O 0.87 0.87 0.81 0.82 1.00 0.97 0.99 0.98 0.96 - 0.92 0.95 0.95 0.89 0.96O-T 0.85 0.88 0.81 0.78 1.00 0.97 0.97 0.97 0.98 0.95 - 0.96 0.97 0.97 0.89C-P 0.92 0.93 0.78 0.74 1.00 0.98 0.97 1.00 0.96 0.98 0.98 - 0.95 0.91 0.91P-C 0.85 0.87 0.82 0.77 1.00 0.97 0.97 0.97 1.00 0.98 0.99 0.97 - 0.97 0.89S-3 0.80 0.80 0.76 0.82 0.98 0.92 0.97 0.91 1.00 0.92 0.99 0.93 1.00 - 0.86
3-S 0.80 0.81 0.76 0.93 0.99 0.93 1.00 0.94 0.93 1.00 0.93 0.96 0.93 0.90 -
Moderate (0.40 to 0.59)to high (0.60 to 0.69)
correlations

Slide 60 October 24, 2011
Correlations Among Vertical Scales
Scale L R W S E T O C P T-O O-T C-P P-C S-3 3-S
L - 0.62 0.54 0.51 0.80 0.72 0.84 0.86 0.73 0.79 0.78 0.84 0.78 0.73 0.72R 0.69 - 0.62 0.48 0.85 0.91 0.73 0.91 0.79 0.82 0.84 0.89 0.83 0.76 0.76W 0.59 0.65 - 0.48 0.80 0.86 0.69 0.72 0.80 0.78 0.78 0.75 0.79 0.73 0.72S 0.61 0.55 0.54 - 0.73 0.62 0.79 0.63 0.70 0.73 0.70 0.66 0.69 0.73 0.81E 0.87 0.89 0.83 0.82 - 0.97 0.97 0.97 0.97 0.98 0.98 0.98 0.98 0.95 0.94T 0.78 0.95 0.89 0.69 0.99 - 0.87 0.95 0.93 0.94 0.95 0.96 0.95 0.90 0.89O 0.92 0.77 0.72 0.89 1.00 0.90 - 0.92 0.94 0.95 0.94 0.94 0.94 0.94 0.95C 0.94 0.95 0.74 0.71 1.00 0.97 0.95 - 0.91 0.95 0.95 0.99 0.95 0.89 0.89P 0.80 0.83 0.83 0.78 1.00 0.95 0.97 0.93 - 0.93 0.96 0.94 0.99 0.97 0.89
T-O 0.87 0.87 0.81 0.82 1.00 0.97 0.99 0.98 0.96 - 0.92 0.95 0.95 0.89 0.96O-T 0.85 0.88 0.81 0.78 1.00 0.97 0.97 0.97 0.98 0.95 - 0.96 0.97 0.97 0.89C-P 0.92 0.93 0.78 0.74 1.00 0.98 0.97 1.00 0.96 0.98 0.98 - 0.95 0.91 0.91P-C 0.85 0.87 0.82 0.77 1.00 0.97 0.97 0.97 1.00 0.98 0.99 0.97 - 0.97 0.89S-3 0.80 0.80 0.76 0.82 0.98 0.92 0.97 0.91 1.00 0.92 0.99 0.93 1.00 - 0.86
3-S 0.80 0.81 0.76 0.93 0.99 0.93 1.00 0.94 0.93 1.00 0.93 0.96 0.93 0.90 -
Very high correlations (0.70 to 0.89)with a few high (0.60 to 0.69)
and a few extreme (0.90 to 1.00)correlations

Slide 61 October 24, 2011
Correlations Among Vertical Scales
Scale L R W S E T O C P T-O O-T C-P P-C S-3 3-S
L - 0.62 0.54 0.51 0.80 0.72 0.84 0.86 0.73 0.79 0.78 0.84 0.78 0.73 0.72R 0.69 - 0.62 0.48 0.85 0.91 0.73 0.91 0.79 0.82 0.84 0.89 0.83 0.76 0.76W 0.59 0.65 - 0.48 0.80 0.86 0.69 0.72 0.80 0.78 0.78 0.75 0.79 0.73 0.72S 0.61 0.55 0.54 - 0.73 0.62 0.79 0.63 0.70 0.73 0.70 0.66 0.69 0.73 0.81E 0.87 0.89 0.83 0.82 - 0.97 0.97 0.97 0.97 0.98 0.98 0.98 0.98 0.95 0.94T 0.78 0.95 0.89 0.69 0.99 - 0.87 0.95 0.93 0.94 0.95 0.96 0.95 0.90 0.89O 0.92 0.77 0.72 0.89 1.00 0.90 - 0.92 0.94 0.95 0.94 0.94 0.94 0.94 0.95C 0.94 0.95 0.74 0.71 1.00 0.97 0.95 - 0.91 0.95 0.95 0.99 0.95 0.89 0.89P 0.80 0.83 0.83 0.78 1.00 0.95 0.97 0.93 - 0.93 0.96 0.94 0.99 0.97 0.89
T-O 0.87 0.87 0.81 0.82 1.00 0.97 0.99 0.98 0.96 - 0.92 0.95 0.95 0.89 0.96O-T 0.85 0.88 0.81 0.78 1.00 0.97 0.97 0.97 0.98 0.95 - 0.96 0.97 0.97 0.89C-P 0.92 0.93 0.78 0.74 1.00 0.98 0.97 1.00 0.96 0.98 0.98 - 0.95 0.91 0.91P-C 0.85 0.87 0.82 0.77 1.00 0.97 0.97 0.97 1.00 0.98 0.99 0.97 - 0.97 0.89S-3 0.80 0.80 0.76 0.82 0.98 0.92 0.97 0.91 1.00 0.92 0.99 0.93 1.00 - 0.86
3-S 0.80 0.81 0.76 0.93 0.99 0.93 1.00 0.94 0.93 1.00 0.93 0.96 0.93 0.90 -
Extreme (0.90 to 1.00) correlationswith a few very high (0.70 to 0.89) correlations

Slide 62 October 24, 2011
Growth Model• Grade 3-5 linear growth model with random
(student) effects• Student-level intercept and slope predicted by
demographics
t0 1
0 00 01 02 03 0
1 10 11 12 13 1
iti i i ti
i i i i i
i i i i i
Y grade e
female spanish arabic r
female spanish arabic r

Slide 63 October 24, 2011
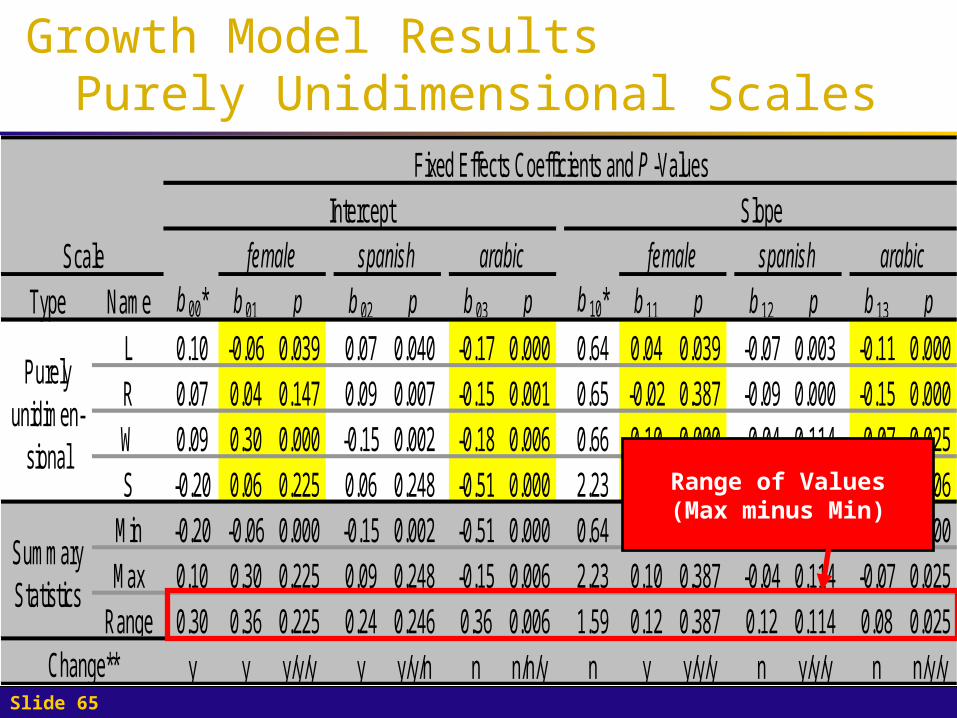
Growth Model ResultsPurely Unidimensional Scales
Type Name b 01 p b 02 p b 03 p b 11 p b 12 p b 13 p
L 0.10 -0.06 0.039 0.07 0.040 -0.17 0.000 0.64 0.04 0.039 -0.07 0.003 -0.11 0.000R 0.07 0.04 0.147 0.09 0.007 -0.15 0.001 0.65 -0.02 0.387 -0.09 0.000 -0.15 0.000W 0.09 0.30 0.000 -0.15 0.002 -0.18 0.006 0.66 0.10 0.000 -0.04 0.114 -0.07 0.025S -0.20 0.06 0.225 0.06 0.248 -0.51 0.000 2.23 0.06 0.146 -0.16 0.000 -0.15 0.006
Min -0.20 -0.06 0.000 -0.15 0.002 -0.51 0.000 0.64 -0.02 0.000 -0.16 0.000 -0.15 0.000Max 0.10 0.30 0.225 0.09 0.248 -0.15 0.006 2.23 0.10 0.387 -0.04 0.114 -0.07 0.025
Range 0.30 0.36 0.225 0.24 0.246 0.36 0.006 1.59 0.12 0.387 0.12 0.114 0.08 0.025y y y/y/y y y/y/n n n/n/y n y y/y/y n y/y/y n n/y/y
SummaryStatistics
Change**
spanish arabic
Purelyunidimen-
sional
Scale
Fixed Effects Coefficients and P -ValuesIntercept Slope
b 00*female spanish arabic
b 10*female

Slide 64 October 24, 2011
Growth Model ResultsPurely Unidimensional Scales
Type Name b 01 p b 02 p b 03 p b 11 p b 12 p b 13 p
L 0.10 -0.06 0.039 0.07 0.040 -0.17 0.000 0.64 0.04 0.039 -0.07 0.003 -0.11 0.000R 0.07 0.04 0.147 0.09 0.007 -0.15 0.001 0.65 -0.02 0.387 -0.09 0.000 -0.15 0.000W 0.09 0.30 0.000 -0.15 0.002 -0.18 0.006 0.66 0.10 0.000 -0.04 0.114 -0.07 0.025S -0.20 0.06 0.225 0.06 0.248 -0.51 0.000 2.23 0.06 0.146 -0.16 0.000 -0.15 0.006
Min -0.20 -0.06 0.000 -0.15 0.002 -0.51 0.000 0.64 -0.02 0.000 -0.16 0.000 -0.15 0.000Max 0.10 0.30 0.225 0.09 0.248 -0.15 0.006 2.23 0.10 0.387 -0.04 0.114 -0.07 0.025
Range 0.30 0.36 0.225 0.24 0.246 0.36 0.006 1.59 0.12 0.387 0.12 0.114 0.08 0.025y y y/y/y y y/y/n n n/n/y n y y/y/y n y/y/y n n/y/y
SummaryStatistics
Change**
spanish arabic
Purelyunidimen-
sional
Scale
Fixed Effects Coefficients and P -ValuesIntercept Slope
b 00*female spanish arabic
b 10*female
Consistent resultsInconsistent results
Slide 65 October 24, 2011
Growth Model ResultsPurely Unidimensional Scales
Type Name b 01 p b 02 p b 03 p b 11 p b 12 p b 13 p
L 0.10 -0.06 0.039 0.07 0.040 -0.17 0.000 0.64 0.04 0.039 -0.07 0.003 -0.11 0.000R 0.07 0.04 0.147 0.09 0.007 -0.15 0.001 0.65 -0.02 0.387 -0.09 0.000 -0.15 0.000W 0.09 0.30 0.000 -0.15 0.002 -0.18 0.006 0.66 0.10 0.000 -0.04 0.114 -0.07 0.025S -0.20 0.06 0.225 0.06 0.248 -0.51 0.000 2.23 0.06 0.146 -0.16 0.000 -0.15 0.006
Min -0.20 -0.06 0.000 -0.15 0.002 -0.51 0.000 0.64 -0.02 0.000 -0.16 0.000 -0.15 0.000Max 0.10 0.30 0.225 0.09 0.248 -0.15 0.006 2.23 0.10 0.387 -0.04 0.114 -0.07 0.025
Range 0.30 0.36 0.225 0.24 0.246 0.36 0.006 1.59 0.12 0.387 0.12 0.114 0.08 0.025y y y/y/y y y/y/n n n/n/y n y y/y/y n y/y/y n n/y/y
SummaryStatistics
Change**
spanish arabic
Purelyunidimen-
sional
Scale
Fixed Effects Coefficients and P -ValuesIntercept Slope
b 00*female spanish arabic
b 10*female
Range of Values(Max minus Min)

Slide 66 October 24, 2011
Growth Model ResultsPurely Unidimensional Scales
Type Name b 01 p b 02 p b 03 p b 11 p b 12 p b 13 p
L 0.10 -0.06 0.039 0.07 0.040 -0.17 0.000 0.64 0.04 0.039 -0.07 0.003 -0.11 0.000R 0.07 0.04 0.147 0.09 0.007 -0.15 0.001 0.65 -0.02 0.387 -0.09 0.000 -0.15 0.000W 0.09 0.30 0.000 -0.15 0.002 -0.18 0.006 0.66 0.10 0.000 -0.04 0.114 -0.07 0.025S -0.20 0.06 0.225 0.06 0.248 -0.51 0.000 2.23 0.06 0.146 -0.16 0.000 -0.15 0.006
Min -0.20 -0.06 0.000 -0.15 0.002 -0.51 0.000 0.64 -0.02 0.000 -0.16 0.000 -0.15 0.000Max 0.10 0.30 0.225 0.09 0.248 -0.15 0.006 2.23 0.10 0.387 -0.04 0.114 -0.07 0.025
Range 0.30 0.36 0.225 0.24 0.246 0.36 0.006 1.59 0.12 0.387 0.12 0.114 0.08 0.025y y y/y/y y y/y/n n n/n/y n y y/y/y n y/y/y n n/y/y
SummaryStatistics
Change**
spanish arabic
Purelyunidimen-
sional
Scale
Fixed Effects Coefficients and P -ValuesIntercept Slope
b 00*female spanish arabic
b 10*female
Indicates whether the sign (+/-)of the coefficient differed
depending on the scale used asthe outcome in the model

Slide 67 October 24, 2011
Growth Model ResultsPurely Unidimensional Scales
Type Name b 01 p b 02 p b 03 p b 11 p b 12 p b 13 p
L 0.10 -0.06 0.039 0.07 0.040 -0.17 0.000 0.64 0.04 0.039 -0.07 0.003 -0.11 0.000R 0.07 0.04 0.147 0.09 0.007 -0.15 0.001 0.65 -0.02 0.387 -0.09 0.000 -0.15 0.000W 0.09 0.30 0.000 -0.15 0.002 -0.18 0.006 0.66 0.10 0.000 -0.04 0.114 -0.07 0.025S -0.20 0.06 0.225 0.06 0.248 -0.51 0.000 2.23 0.06 0.146 -0.16 0.000 -0.15 0.006
Min -0.20 -0.06 0.000 -0.15 0.002 -0.51 0.000 0.64 -0.02 0.000 -0.16 0.000 -0.15 0.000Max 0.10 0.30 0.225 0.09 0.248 -0.15 0.006 2.23 0.10 0.387 -0.04 0.114 -0.07 0.025
Range 0.30 0.36 0.225 0.24 0.246 0.36 0.006 1.59 0.12 0.387 0.12 0.114 0.08 0.025y y y/y/y y y/y/n n n/n/y n y y/y/y n y/y/y n n/y/y
SummaryStatistics
Change**
spanish arabic
Purelyunidimen-
sional
Scale
Fixed Effects Coefficients and P -ValuesIntercept Slope
b 00*female spanish arabic
b 10*female
Indicates whether at least one scale’s model had statisticalsignificance and another’s did not at the common alpha
levels of 0.05, 0.01, and 0.001, respectively

Slide 68 October 24, 2011
Growth Model ResultsComposite Scales
Type Name b 01 p b 02 p b 03 p b 11 p b 12 p b 13 p
E 0.10 0.06 0.025 0.03 0.317 -0.23 0.000 0.62 0.03 0.006 -0.08 0.000 -0.08 0.000T 0.09 0.11 0.000 0.01 0.770 -0.19 0.000 0.63 0.03 0.022 -0.07 0.000 -0.10 0.000O 0.11 0.02 0.574 0.05 0.115 -0.27 0.000 0.62 0.04 0.010 -0.08 0.000 -0.07 0.002C 0.11 0.02 0.427 0.06 0.040 -0.18 0.000 0.62 0.02 0.170 -0.08 0.000 -0.11 0.000P 0.10 0.14 0.000 -0.01 0.676 -0.29 0.000 0.62 -0.03 0.080 -0.04 0.009 -0.05 0.024
T-O 0.09 0.10 0.001 0.00 0.906 -0.19 0.000 0.63 0.00 0.728 -0.05 0.001 -0.11 0.000O-T 0.11 0.02 0.449 0.05 0.080 -0.27 0.000 0.62 0.07 0.000 -0.10 0.000 -0.06 0.010C-P 0.10 0.04 0.116 0.05 0.083 -0.19 0.000 0.62 0.02 0.170 -0.08 0.000 -0.11 0.000P-C 0.10 0.11 0.000 0.00 0.906 -0.28 0.000 0.62 -0.03 0.080 -0.04 0.009 -0.05 0.024S-3 0.13 0.05 0.122 0.05 0.190 -0.36 0.000 0.61 0.04 0.021 -0.09 0.000 -0.01 0.8213-S 0.09 0.06 0.015 0.02 0.468 -0.19 0.000 0.65 0.03 0.076 -0.07 0.000 -0.14 0.000Min 0.09 0.02 0.000 -0.01 0.040 -0.36 0.000 0.61 -0.03 0.000 -0.10 0.000 -0.14 0.000Max 0.13 0.14 0.574 0.06 0.906 -0.18 0.000 0.65 0.07 0.728 -0.04 0.009 -0.01 0.821
Range 0.04 0.12 0.574 0.07 0.866 0.18 0.000 0.05 0.10 0.728 0.05 0.009 0.13 0.821n n y/y/y y y/n/n n n/n/n n y y/y/y n n/n/y n y/y/y
Empiricallymultidimen-sional (i.e., construct shifted)
SummaryStatistics
Change**
Slope
b 00*female spanish arabic
b 10*female spanish arabicScale
Fixed Effects Coefficients and P -ValuesIntercept
Empiricallyunidimen-
sional

Slide 69 October 24, 2011
Growth Model ResultsComposite Scales
Type Name b 01 p b 02 p b 03 p b 11 p b 12 p b 13 p
E 0.10 0.06 0.025 0.03 0.317 -0.23 0.000 0.62 0.03 0.006 -0.08 0.000 -0.08 0.000T 0.09 0.11 0.000 0.01 0.770 -0.19 0.000 0.63 0.03 0.022 -0.07 0.000 -0.10 0.000O 0.11 0.02 0.574 0.05 0.115 -0.27 0.000 0.62 0.04 0.010 -0.08 0.000 -0.07 0.002C 0.11 0.02 0.427 0.06 0.040 -0.18 0.000 0.62 0.02 0.170 -0.08 0.000 -0.11 0.000P 0.10 0.14 0.000 -0.01 0.676 -0.29 0.000 0.62 -0.03 0.080 -0.04 0.009 -0.05 0.024
T-O 0.09 0.10 0.001 0.00 0.906 -0.19 0.000 0.63 0.00 0.728 -0.05 0.001 -0.11 0.000O-T 0.11 0.02 0.449 0.05 0.080 -0.27 0.000 0.62 0.07 0.000 -0.10 0.000 -0.06 0.010C-P 0.10 0.04 0.116 0.05 0.083 -0.19 0.000 0.62 0.02 0.170 -0.08 0.000 -0.11 0.000P-C 0.10 0.11 0.000 0.00 0.906 -0.28 0.000 0.62 -0.03 0.080 -0.04 0.009 -0.05 0.024S-3 0.13 0.05 0.122 0.05 0.190 -0.36 0.000 0.61 0.04 0.021 -0.09 0.000 -0.01 0.8213-S 0.09 0.06 0.015 0.02 0.468 -0.19 0.000 0.65 0.03 0.076 -0.07 0.000 -0.14 0.000Min 0.09 0.02 0.000 -0.01 0.040 -0.36 0.000 0.61 -0.03 0.000 -0.10 0.000 -0.14 0.000Max 0.13 0.14 0.574 0.06 0.906 -0.18 0.000 0.65 0.07 0.728 -0.04 0.009 -0.01 0.821
Range 0.04 0.12 0.574 0.07 0.866 0.18 0.000 0.05 0.10 0.728 0.05 0.009 0.13 0.821n n y/y/y y y/n/n n n/n/n n y y/y/y n n/n/y n y/y/y
Empiricallymultidimen-sional (i.e., construct shifted)
SummaryStatistics
Change**
Slope
b 00*female spanish arabic
b 10*female spanish arabicScale
Fixed Effects Coefficients and P -ValuesIntercept
Empiricallyunidimen-
sionalLarge range changes, even with extreme correlations among the scales

Slide 70 October 24, 2011
Growth Model ResultsComposite Scales
Type Name b 01 p b 02 p b 03 p b 11 p b 12 p b 13 p
E 0.10 0.06 0.025 0.03 0.317 -0.23 0.000 0.62 0.03 0.006 -0.08 0.000 -0.08 0.000T 0.09 0.11 0.000 0.01 0.770 -0.19 0.000 0.63 0.03 0.022 -0.07 0.000 -0.10 0.000O 0.11 0.02 0.574 0.05 0.115 -0.27 0.000 0.62 0.04 0.010 -0.08 0.000 -0.07 0.002C 0.11 0.02 0.427 0.06 0.040 -0.18 0.000 0.62 0.02 0.170 -0.08 0.000 -0.11 0.000P 0.10 0.14 0.000 -0.01 0.676 -0.29 0.000 0.62 -0.03 0.080 -0.04 0.009 -0.05 0.024
T-O 0.09 0.10 0.001 0.00 0.906 -0.19 0.000 0.63 0.00 0.728 -0.05 0.001 -0.11 0.000O-T 0.11 0.02 0.449 0.05 0.080 -0.27 0.000 0.62 0.07 0.000 -0.10 0.000 -0.06 0.010C-P 0.10 0.04 0.116 0.05 0.083 -0.19 0.000 0.62 0.02 0.170 -0.08 0.000 -0.11 0.000P-C 0.10 0.11 0.000 0.00 0.906 -0.28 0.000 0.62 -0.03 0.080 -0.04 0.009 -0.05 0.024S-3 0.13 0.05 0.122 0.05 0.190 -0.36 0.000 0.61 0.04 0.021 -0.09 0.000 -0.01 0.8213-S 0.09 0.06 0.015 0.02 0.468 -0.19 0.000 0.65 0.03 0.076 -0.07 0.000 -0.14 0.000Min 0.09 0.02 0.000 -0.01 0.040 -0.36 0.000 0.61 -0.03 0.000 -0.10 0.000 -0.14 0.000Max 0.13 0.14 0.574 0.06 0.906 -0.18 0.000 0.65 0.07 0.728 -0.04 0.009 -0.01 0.821
Range 0.04 0.12 0.574 0.07 0.866 0.18 0.000 0.05 0.10 0.728 0.05 0.009 0.13 0.821n n y/y/y y y/n/n n n/n/n n y y/y/y n n/n/y n y/y/y
Empiricallymultidimen-sional (i.e., construct shifted)
SummaryStatistics
Change**
Slope
b 00*female spanish arabic
b 10*female spanish arabicScale
Fixed Effects Coefficients and P -ValuesIntercept
Empiricallyunidimen-
sionalChanges in signs of coefficients and in statistical significance interpretations, even with extreme correlations among scales

Slide 71 October 24, 2011
Growth Model ResultsComposite Scales
Type Name b 01 p b 02 p b 03 p b 11 p b 12 p b 13 p
E 0.10 0.06 0.025 0.03 0.317 -0.23 0.000 0.62 0.03 0.006 -0.08 0.000 -0.08 0.000T 0.09 0.11 0.000 0.01 0.770 -0.19 0.000 0.63 0.03 0.022 -0.07 0.000 -0.10 0.000O 0.11 0.02 0.574 0.05 0.115 -0.27 0.000 0.62 0.04 0.010 -0.08 0.000 -0.07 0.002C 0.11 0.02 0.427 0.06 0.040 -0.18 0.000 0.62 0.02 0.170 -0.08 0.000 -0.11 0.000P 0.10 0.14 0.000 -0.01 0.676 -0.29 0.000 0.62 -0.03 0.080 -0.04 0.009 -0.05 0.024
T-O 0.09 0.10 0.001 0.00 0.906 -0.19 0.000 0.63 0.00 0.728 -0.05 0.001 -0.11 0.000O-T 0.11 0.02 0.449 0.05 0.080 -0.27 0.000 0.62 0.07 0.000 -0.10 0.000 -0.06 0.010C-P 0.10 0.04 0.116 0.05 0.083 -0.19 0.000 0.62 0.02 0.170 -0.08 0.000 -0.11 0.000P-C 0.10 0.11 0.000 0.00 0.906 -0.28 0.000 0.62 -0.03 0.080 -0.04 0.009 -0.05 0.024S-3 0.13 0.05 0.122 0.05 0.190 -0.36 0.000 0.61 0.04 0.021 -0.09 0.000 -0.01 0.8213-S 0.09 0.06 0.015 0.02 0.468 -0.19 0.000 0.65 0.03 0.076 -0.07 0.000 -0.14 0.000Min 0.09 0.02 0.000 -0.01 0.040 -0.36 0.000 0.61 -0.03 0.000 -0.10 0.000 -0.14 0.000Max 0.13 0.14 0.574 0.06 0.906 -0.18 0.000 0.65 0.07 0.728 -0.04 0.009 -0.01 0.821
Range 0.04 0.12 0.574 0.07 0.866 0.18 0.000 0.05 0.10 0.728 0.05 0.009 0.13 0.821n n y/y/y y y/n/n n n/n/n n y y/y/y n n/n/y n y/y/y
Empiricallymultidimen-sional (i.e., construct shifted)
SummaryStatistics
Change**
Slope
b 00*female spanish arabic
b 10*female spanish arabicScale
Fixed Effects Coefficients and P -ValuesIntercept
Empiricallyunidimen-
sional
Impact of being an Arabic speaker on growth rate was consistently statistically significantly negative with all four purely unidimensional scales.
Shows up as not statistically significant in one of the empirically multidimensional scales

Slide 72 October 24, 2011
Policy Recommendations?• Translating statistical model results into policy recommendations
– Negative effect on intercept (starting out lower) = focused startup resources– Negative effect on slope (growing more slowly) = continued resources
Type Label Startup resources Ongoing resourcesL F, NS, A M, S, A
R NS, A S, A
W M, S, A M, S, A
S A S, A
E M, A M, S, AT M, NS, A M, S, AO M, NS, A M, S, AC NS, A S, AP M, A S, A
T-O M, A S, AO-T A M, S, AC-P A S, AP-C M, A S, AS-3 A M, S3-S M, A S, A
Groups targeted with…
Note: F = females, M = males, S = Spanish speakers, NS = non-Spanish speakers, A = Arabic speakers
Purelyunidimen-
sional
Empiricallyunidimen-
sional
Empiricallymultidimen-
sional
Scale
All 4
Missing!
Only on writing
On 7 of 11

Slide 73 October 24, 2011
Findings• The real (multidimensional) picture?
– Messy and nuanced– Not consistent across subscales– Real differences in statistical significance and interpretation
• The distorted (composite) picture?– Can’t reflect the real picture (well, yeah, if the results aren’t
consistent across subscales!)– Inconsistent even with extremely highly correlated scales– One construct-shifted scale even reverses a finding that is
consistent across all four purely unidimensional scales– Sends policy and theory in the wrong directions

Slide 74 October 24, 2011
Findings• Construct-shifted vertical scales can cause serious
and practical distortions in the results of growth-based models (including value added models)
• Non-construct shifted, but composite scales also can cause serious and practical distortions in the results of growth-based models (including value-added models)
• Growth model (including value-added model) results are highly sensitive to un-modeled dimensionality, construct-shifted or not, whether the constructs are highly correlated or not
Slide 75 October 24, 2011
Overall Summary• Growth and value-added models requiring linear scales that
are used for theory development, policy development, and policy decisions should avoid the use of composite scales as outcomes
• Growth and value-added models requiring linear scales should be based on as nearly purely unidimensional scales as possible– Use more sensitive measures of dimensionality– Trust content expert judgment on what constitutes a dimension
(construct)
• If one desires to use a composite scale, one should use methods that do not make the assumptions of linearity, unidimensionality, and interval-level scaling; for example…– Michigan’s grade 3-8 “growth” model– Michigan’s Race to the Top submission for teacher evaluations
(including “growth”-based value-added measures)

Slide 76 October 24, 2011
ReferencesDoran, H., Cohen, J. (2005). The confounding effect of linking bias on gains estimated from value-added
models. In Lissitz, R. (ed.) Value Added Models in Education: Theory and Applications. JAM Press: Maple Grove, MN.
Lockwood, J.R., McCaffrey, D.F., Hamilton, L.S., Stecher, B., Li, V-N., Martinez, J.F., (2007). The sensitivity of value-added teacher effect estimates to different mathematics achievement measures. Journal of Educational Measurement, 44(1), 47-67.
Martineau, J.A. (2004). The effects of construct shift on growth and accountability models. Unpublished Dissertation. Michigan State University.
Martineau, J.A. (2006). Distorting value added: the use of longitudinal, vertically scaled achievement data for growth-based, value-added accountability. Journal of Educational and Behavioral Statistics., 31(1), 35-62.
Martineau, J.A., Subedi, D.R., Ward, K.H., Li, T., Lu, Y. Diao, Q. Pang, F-H., Drake, S., Song, T., Lao, S-C., Zheng, Y., Li, X. (2007). Non-linear unidimensional trajectories through multidimensional content spaces: a critical examination of the common psychometric claims of unidimensionality, linearity, and interval-level measurement. In Lissitz, R. (Ed.). Assessing and Modeling Cognitive Development in Schools: Intellectual Growth and Standard Setting. JAM Press: Maple Grove, MN.
Martineau, J. A., Wyse, A. E., & Zeng, J. (2010, May). Distortions in empirical measures of growth arising from using traditional (vertical) scales as outcomes. Paper presented at the Annual Meeting of the National Council of Measurement in Education, Denver, CO.

Slide 77 October 24, 2011
Contact Information
• Joseph A. Martineau, Ph.D.– Executive Director of Assessment & Accountability– Michigan Department of Education– [email protected]