mcc indonesia nutrition project impact evaluation baseline ... · mcc indonesia nutrition project...
TRANSCRIPT

F I N A L R E P O R T
MCC Indonesia Nutrition Project Impact Evaluation Baseline Report
March 18, 2016 Clair Null Amanda Beatty Nick Ingwersen William Leith Evan Borkum Jeremy Brecher-Haimson Anna Gage Matt Peckarsky Anu Rangarajan
Submitted to: Millennium Challenge Corporation Room 3035F, Bowen Bldg. 875 15th St., NW Washington, DC 20005-2221 Project Officer: Shreena Patel
Submitted by: Mathematica Policy Research P.O. Box 2393 Princeton, NJ 08543-2393 Telephone: (609) 799-3535 Facsimile: (609) 799-0005
Project Director: Anu Rangarajan Reference Number: 40275.240

This page has been left blank for double-sided copying.

MCC INDONESIA NUTRITION PROJECT IMPACT EVALUATION BASELINE REPORT MATHEMATICA POLICY RESEARCH
ACKNOWLEDGMENTS
This report was made possible through the contributions of many individuals.
We appreciate the guidance and support of our partners at MCC and MCA-I, especially our project officer, Shreena Patel, for providing insight on the project interventions, and overall direction of this evaluation. We thank MCA-I staff for their input and guidance on the project design, and for their leadership in managing the survey work. Specifically, we thank Ibu Rini Widiastuti (M&E Director), Pak Sugih Hartono (M&E Specialist), Pak Minarto (Nutrition Director), Pak Iing Mursalin (Nutrition Associate Director), Ibu Rosnani Pangaribuan (Nutrition Specialist), Pak Hening Darpito (Sanitation Specialist), Ibu Farah Amini (Communications Specialist), and Ibu Vidia (NST). We also thank MCC Indonesia team members Martha Bowen, Dipika Chawla, Michelle Inkley, Peter Rosner, Carolyn Wetzel Chen, and Troy Wray.
We greatly appreciate the support of and input from various members of government agencies such as Ministry of Home Affairs (Kemendagri), the Ministry of National Development Planning (Bappenas), the Coordinating Ministry for Economy and Social Welfare (Menkokesra), and the Ministry of Health (Kemenkes). We especially thank Pak Rudy Prawiradinata (Director of Poverty Alleviation, Bappenas), Ibu Woro Srihastuti Sulistyaningrum or Ibu Lisa (Deputy Director of Poverty Alleviation, Bappenas), and Pak Doddy Izwardy (Nutrition Director at Ministry of Health).
We also appreciate the feedback and support from members of the PNPM-Support Facility (PSF) Ibu Gerda Gulo, Pak Djoko Hartono, Mbak Yulia Herawati, Karrie McLaughlin, Audrey Sacks, Pak Sadwanto, Pak Ali Subandoro, and Robert Wrobel.
We are very grateful to the data collection team at SurveyMETER, especially Pak Danang Prasetya, Ibu Bondan Sikoki, and Ibu Wayan Suriastini. Sukhmani Sethi assisted in instrument development and fieldwork training. Pak Dedy Junaedi led the quality control of the data collection supported by Pak Anas Sutisna, Ibu Devita Kusuma Rahingtyas, Pak Lulus Kusbubiharjo, Ibu Miza Agria Yudisti, and Ibu Upik Sabainingrum.
We thank nutritionists Anuraj Shankar and Airin Roshita for their expert guidance and feedback on the evaluation and report. Jere Behrman and Elizabeth Frankenberg provided helpful input on the design and data collection instruments, and on the report.
Finally, we are grateful for the support of Ananya Khan for assisting with project management, William Garrett and Thomas Coen for editing the report, and Jennifer Baskwell for formatting the report.
iii

This page has been left blank for double-sided copying.

MCC INDONESIA NUTRITION PROJECT IMPACT EVALUATION BASELINE REPORT MATHEMATICA POLICY RESEARCH
CONTENTS
GLOSSARY ................................................................................................................................................. XI
EXECUTIVE SUMMARY ........................................................................................................................... XIII
I OVERVIEW OF THE NUTRITION PROJECT ................................................................................. 1
A. Introduction ................................................................................................................................ 1
B. Summary of additions to the literature since the design report ................................................. 2
C. Nutrition Project background and implementation status .......................................................... 4
II NUTRITION PROJECT EVALUATION AND BASELINE DATA COLLECTION ............................ 13
A. Research questions and key outcomes .................................................................................. 13
Impacts .................................................................................................................................... 13
Implementation ........................................................................................................................ 13
B. Evaluation design .................................................................................................................... 14
1. Evaluation approach ......................................................................................................... 14
2. Random assignment details .............................................................................................. 15
3. Sample size calculations ................................................................................................... 15
C. Baseline data collection ........................................................................................................... 17
1. Baseline timing .................................................................................................................. 17
2. Sample selection ............................................................................................................... 17
3. Summary of baseline survey instruments ......................................................................... 18
III BASELINE FINDINGS ................................................................................................................... 23
A. Baseline characteristics of households, pregnant women, caregivers, and children .............. 23
B. Generasi implementation progress at the time of the baseline ............................................... 25
1. Some Generasi activities had started by the time of the baseline survey ........................ 25
2. Posyandu activities were mostly unaffected by the Nutrition Project at baseline ............. 27
3. Performance on Generasi indicators was largely unaffected at baseline ......................... 29
C. Health care service provision and access ............................................................................... 32
1. Key maternal and child health services appear to be accessible in terms of proximity and cost ............................................................................................................. 32
2. The overwhelmingly majority of women have decision making authority over health and nutrition decisions ........................................................................................... 33
3. Most puskesmas had the staffing, equipment, and supplies needed to fulfill basic services related to the Nutrition Project ............................................................................ 34
3. High proportions of service providers have been trained ................................................. 36
D. Nutrition ................................................................................................................................... 38
v

MCC INDONESIA NUTRITION PROJECT IMPACT EVALUATION BASELINE REPORT MATHEMATICA POLICY RESEARCH
1. Households experienced varying degrees of food insecurity but diets included a variety of food groups........................................................................................................ 39
2. Rates of breastfeeding are very high but very few children are exclusively breastfed ........................................................................................................................... 42
3. Both caregivers and pregnant women can improve their use of micronutrient supplements ...................................................................................................................... 45
4. Service providers could do more to promote better infant and young child feeding practices ............................................................................................................................ 46
E. Sanitation conditions ............................................................................................................... 49
1. Many children were at high risk of exposure to a contaminated environment .................. 49
2. There had been very little momentum on sanitation issues at the desa level .................. 50
3. Diarrhea was common for children under age three and knowledge of prevention is low ................................................................................................................................. 51
F. Anthropometry and anemia ..................................................................................................... 53
1. Stunting, underweight, and anemia were common among children under three years of age ...................................................................................................................... 53
2. Rates of growth faltering and anemia varied by age ........................................................ 55
3. Anthropometry outcomes were very similar for male and female children but anemia and diarrhea were higher among male children ................................................... 55
4. Most pregnant women are anemic and below the recommended weight by their third trimester .................................................................................................................... 56
IV CONCLUSION ............................................................................................................................... 59
A. Summary of findings ................................................................................................................ 59
B. Updated MDIs .......................................................................................................................... 60
C. Risks to internal validity ........................................................................................................... 62
D. External validity ....................................................................................................................... 63
E. Dissemination, and plans for future data collection ................................................................. 64
REFERENCES ............................................................................................................................................ 67
APPENDIX A: ADMINISTRATION ............................................................................................................. A.1
APPENDIX B: TECHNICAL ....................................................................................................................... B.1
APPENDIX C: KNOWLEDGE LEVELS AMONG SURVEY RESPONDENTS ..........................................C.1
vi

MCC INDONESIA NUTRITION PROJECT IMPACT EVALUATION BASELINE REPORT MATHEMATICA POLICY RESEARCH
TABLES
I.1 The rural Indonesian health system includes providers and volunteers at multiple levels .............. 5
I.2 Some training activities had started in 2014 .................................................................................... 9
I.3 CLTS training will reach 2,431 participants in the evaluation provinces ........................................ 10
II.1 Key indicators measure medium-term project outcomes ............................................................... 14
II.2 We chose a baseline sample size of 16 households with children age 0–35 months per kecamatan to identify baseline treatment-control differences and estimate baseline means............................................................................................................................................. 16
II.3 We chose a baseline sample size of 8 households with pregnant women in the second or third trimester per kecamatan to identify baseline treatment-control differences and estimate baseline means ............................................................................................................... 17
II.4 The Nutrition Project survey spans 22 districts and 4,560 households ......................................... 18
II.5 Response rates for the baseline survey were high ........................................................................ 18
II.6 Household surveys focus on background information about the household, with modules for pregnant women and caregivers of children age 0–35 months ............................................... 19
II.7 Desa-level and puskesmas interviews focus on capacity, knowledge, and outreach activities ......................................................................................................................................... 21
III.1 Demographic, pregnancy, child, and household dwelling characteristics of the baseline sample ............................................................................................................................................ 24
III.2 Posyandu activities were mostly unaffected by the Nutrition Project at baseline .......................... 29
III.3 Performance on Generasi KPIs was balanced across treatment and control kecamatan with the exception of weighing and immunization .......................................................................... 30
III.4 Most pregnant women and caregivers do not need to travel far or pay high transport costs to access basic maternal and child health services ............................................................. 33
III.5 Bidan appear to be accessible in terms of proximity and work load .............................................. 33
III.6 The overwhelming majority of bidan and kader posyandu have received training, and half received training in 2014 ................................................................................................................ 37
III.7 Sanitation officers visit the dusun they supervise, but progress on triggering is slow ................... 51
IV.1 We recommend an endline sample size of 32 households with children 0–35 months per kecamatan to detect plausible impacts on key outcomes .............................................................. 61
IV.2 We recommend an endline sample size of 16 households with pregnant women in the second or third trimester per kecamatan to detect plausible impacts on anemia .......................... 62
C.1 Knowledge levels among survey respondents .............................................................................C.3
vii

MCC INDONESIA NUTRITION PROJECT IMPACT EVALUATION BASELINE REPORT MATHEMATICA POLICY RESEARCH
FIGURES
I.1 Generasi includes a four step planning and implementation process ............................................. 6
I.2 Nutrition Project activities will be implemented through 2018........................................................ 11
I.3 Program Logic Model: Nutrition project activities are intended to reduce stunting, wasting, and underweight and ultimately reduce poverty through economic growth ................................... 12
III.1 Nearly all treatment desa had developed a plan for utilizing Generasi funds and over half received funds ................................................................................................................................ 26
III.2 The vast majority of treatment households in treatment areas were not aware of or participating in Generasi activities ................................................................................................. 27
III.3 Many children had not received recommended vaccines .............................................................. 31
III.4 Women had agency over decisions that affect them and their children ........................................ 34
III.5 Most puskesmas had the staffing, equipment, and supplies needed to implement the project............................................................................................................................................. 35
III.6 Kader posyandu have relatively high levels of training on core posyandu functions .................... 38
III.7 Households experienced varying degrees of food insecurity ........................................................ 40
III.8 Pregnant women and children consumed a fairly diverse diet that included protein, fruits, and vegetables ............................................................................................................................... 41
III.9 There is ample scope to improve breastfeeding knowledge and practices ................................... 43
III.10 Many children were fed formula, and other liquids and foods besides breastmilk, before the recommended age ................................................................................................................... 44
III.11 Few caregivers were familiar with Taburia or had given it to their children ................................... 45
III.12 There is scope to improve consumption of IFA during pregnancy ................................................ 46
III.13 Most service providers report discussing nutrition-related topics with women .............................. 47
III.14 Bidan could do more to promote breastfeeding rather than recommending formula for children under six months, and to educate mothers on complementary feeding .......................... 48
III.15 Sanitation conditions in many households do not safely contain feces ......................................... 50
III.16 Diarrhea is common for children under three................................................................................. 52
III.17 Knowledge of diarrhea prevention methods among caregivers and pregnant women was limited ............................................................................................................................................. 53
III.18 Many children were not growing to their potential and anemia was high ...................................... 54
viii

MCC INDONESIA NUTRITION PROJECT IMPACT EVALUATION BASELINE REPORT MATHEMATICA POLICY RESEARCH
III.19 Anthropometry measures and anemia varied by age, except for wasting ..................................... 55
III.20 Anthropometry outcomes were very similar for male and female children but more boys were anemic ................................................................................................................................... 56
III.21 Most pregnant women were anemic and had not met the recommendation for weight gain during pregnancy ........................................................................................................................... 57
ix

This page has been left blank for double-sided copying.

MCC INDONESIA NUTRITION PROJECT IMPACT EVALUATION BASELINE REPORT MATHEMATICA POLICY RESEARCH
GLOSSARY
Akademi bidan Midwife training college Bidan Midwife/midwives Bantuan langsung masyarakat (BLM) Direct community assistance grants provided
by Generasi BCG Bacillus Calmette-Guérin BMI Body Mass Index Buku KIA Mother and child health handbook Buku KMS Growth tracking chart CAPI Computer assisted personal interviewing CDD Community-driven development CI Confidence interval CLTS Community-led total sanitation Desa Village Desa Facilitator (FD/KPMD) Village facilitator DHO District health office DHS Demographic and Health Survey DPT Diphtheria, pertussis, and tetanus Dusun Sub-village (smallest administrative level) GoI Government of Indonesia HFIAS Household Food Insecurity Access Scale ICC Inter-cluster correlation IFA Iron folic acid IFLS Indonesian Family Life Survey IRB Institutional review board IYCF Infant and young child feeding Kabupaten District Kader desa Village volunteer Kader posyandu Integrated health service post volunteer Kecamatan Subdistrict Kelas balita Class about young children (held at the
posyandu) Kelas ibu hamil Maternal health class (held at the posyandu) Kepala desa Village head KPI Generasi key performance indicator LBW Low birth weight MCA-I Millennium Challenge Account-Indonesia MCC Millennium Challenge Corporation
xi

MCC INDONESIA NUTRITION PROJECT IMPACT EVALUATION BASELINE REPORT MATHEMATICA POLICY RESEARCH
MDD Minimum detectable difference MDI Minimum detectable impact MIYCF Mother, infant, and young child feeding MNP Micronutrient powder MoH Ministry of Health MUAC Middle-upper arm circumference Musyawarah Antar Desa (MAD) Inter-desa meeting NGO Non-governmental organization ODF Open defecation free PHO Provincial health office Polindes Village birthing post/clinic Pos pelayanan terpadu (Posyandu) Monthly integrated maternal and child health
service post Poskesdes Village health post Program Nasional Pemberdayaan Masyarakat —Generasi Sehat dan Cerdas (PNPM-Generasi)
National Community Empowerment Program: A Healthy and Smart Generation
Provinsi Province Pusat kesehatan masyarakat (Puskesmas) Subdistrict health center RCT Randomized control trial Rukun tetangga (RT)/rukun warga (RW) Sub-village or neighborhood (smallest
administrative level) ToT Training of trainers UNICEF United Nations Children’s Fund WHO World Health Organization
xii

MCC INDONESIA NUTRITION PROJECT IMPACT EVALUATION BASELINE REPORT MATHEMATICA POLICY RESEARCH
EXECUTIVE SUMMARY
The Millennium Challenge Corporation contracted with Mathematica Policy Research to conduct a rigorous randomized evaluation of the Indonesian Community-Based Health and Nutrition to Reduce Stunting Project, also known as the Nutrition Project, to understand the project’s effects on stunting and related key maternal and child health outcomes. The baseline report presents the results of the study’s baseline data collection that took place between November 2014 and February 2015 and has two key objectives. The first is to confirm the randomized design of the evaluation by demonstrating equivalence across the treatment and control subdistricts (kecamatan). The second is to describe conditions at baseline and provide Millennium Challenge Corporation (MCC) and Millennium Challenge Account-Indonesia (MCA-I) with information that could improve the design and implementation of project activities.
A. Overview of the Nutrition Project
To address challenges related to undernutrition in Indonesia, MCC has partnered with the government of Indonesia (GoI) and other key stakeholders to fund and implement the Nutrition Project in 11 Indonesian provinces for five years. The Nutrition Project focuses on the health and nutrition of pregnant women and infants and children under age 5, with an emphasis on children under age 2. Project activities can be divided into three major components: (1) the community project activity, which provides block grants and facilitation to villages for activities related to health and schooling; (2) a set of supply-side activities primarily targeting health providers; and (3) a national communications campaign to promote increased awareness about stunting.
MCC anticipates that the Project activities will lead to service providers’ improved ability to prevent, diagnose, and treat undernutrition; improved feeding and sanitation practices in households; and greater community and government awareness around nutrition. These short-term outcomes, along with the direct provision of micronutrient supplements, will lead to improved nutrition among pregnant women and children, reducing the prevalence of stunting, wasting, and underweight.
B. Evaluation methodology and questions
MCC contracted with Mathematica Policy Research to conduct a rigorous randomized evaluation of the Nutrition Project in 3 of the 11 provinces to understand the Project’s effects on stunting and related key maternal and child health outcomes. This report presents the findings from the baseline survey, including differences in pregnant women, young children, village (desa) practitioners and leaders, and subdistrict health centers (puskesmas) between treatment and control kecamatan.
The evaluation seeks to answer three key questions about the Nutrition Project. (1) What is the impact of the Nutrition Project’s package of supply and demand-side activities on key outcomes? (2) What is the impact of the Nutrition Project on key subgroups, such as those defined by socioeconomic status? (3) How were various components of the Nutrition Project implemented? We will also seek, to the extent possible, to provide evidence on which specific project activities in the package were most likely to have led to the measured impacts and how they did so.
xiii

MCC INDONESIA NUTRITION PROJECT IMPACT EVALUATION BASELINE REPORT MATHEMATICA POLICY RESEARCH
To answer these questions, Mathematica is undertaking a mixed-methods evaluation, with the quantitative component using a random assignment design. This design enables us to rigorously answer the first two research questions related to project impacts by analyzing quantitative data on both short- and medium-term outcomes.
C. Key baseline findings
At baseline the treatment and control groups were very similar with regard to their demographic characteristics, including age, education, and religion; characteristics related to pregnancy and children, such as pregnancy trimester, child age, and gender; and socio-economic characteristics. While there is some evidence that the Nutrition Project activities had begun at the time of the baseline data collection, the utilization of most pre- and postnatal health services targeted by the Project were not yet affected, with the exception of monthly weighing, which is significantly more prevalent in the treatment group. Training in infant and young child feeding (IYCF) topics supported by the Project was also higher among the treatment group, which is not surprising as some training activities had started in 2014. Overall we confirm balance between treatment and control kecamatan for most indicators, and will make minor adjustments to the endline analysis to adjust for differences at baseline.
Regarding conditions at baseline, anthropometric measurements revealed poor health outcomes. Almost a third of children across treatment and control groups under age 3 were stunted (low height-for-age) and a quarter were underweight (low weight-for-age). 61 percent of children ages 6–35 months and 55 percent of pregnant women were anemic (hemoglobin level of less than 11 g/dL). These baseline conditions show ample room for improvement from Nutrition Project activities.
While health care services are generally available and well equipped, uptake of these services is poor and there is a need to improve health behaviors. Most puskesmas had the personnel, equipment and supplies necessary to implement Nutrition Project activities and providers like village midwives (bidan desa) were widely available, and their knowledge of topics covered by the IYCF training supported by MCA-I was relatively high.
However, there is room for improvement in some key behaviors and practices potentially linked to stunting. For example, although early initiation and persistence of breastfeeding are very high, with nearly all women initiating early breastfeeding and high proportions of women (approximately 80 percent) continuing to breastfeed for several years, exclusive breastfeeding is not the norm. Many children consumed liquids other than breastmilk early on (mostly powdered formula) and consumed them daily. This practice leads to exposure to contaminated food or water, which could be contributing to the high rates of stunting. The type of counseling women receive around breastfeeding could also help explain these behaviors. When asked what topics bidan discussed with pregnant women and caregivers during pre- or postnatal appointments, 10 percent of bidan mentioned what women should do if they cannot breastfeed and only 16 percent discussed common problems women faced while breastfeeding.
Sanitation conditions at baseline were also poor and put many children at risk of diarrhea. Nearly a third of households defecated directly into the environment and 25 percent of children under age 3 had diarrhea in the past 4 weeks. In addition, households report little socialization about sanitation activities taking place at the desa level. Few households reported being aware of xiv

MCC INDONESIA NUTRITION PROJECT IMPACT EVALUATION BASELINE REPORT MATHEMATICA POLICY RESEARCH
any meeting held on sanitation in the past year, although the sanitation officers stationed at puskesmas reported being active in the communities they serve.
Overall, there are some conditions in the evaluation provinces that present a solid foundation for maternal and child health improvements. Equipment at facilities, access, and health practitioner knowledge do not seem to be major barriers to addressing undernutrition as these conditions are adequate or good. However, impediments appear at the household level with potentially harmful infant and young child feeding practices and poor sanitation. We recommend that the Nutrition Project focus on these areas as MCA-I rolls out further Project activities in 2016 and beyond.
xv

This page has been left blank for double-sided copying.

MCC INDONESIA NUTRITION PROJECT IMPACT EVALUATION BASELINE REPORT MATHEMATICA POLICY RESEARCH
I. OVERVIEW OF THE NUTRITION PROJECT1
A. Introduction
Child stunting, or low height-for-age, affected an estimated 36 percent of children under age 5 in Indonesia in 2010, despite decades of reductions in poverty, child mortality, and the percentage of underweight children (Departemen Kesehatan RI 2010).2 Stunting in early childhood is associated with impaired cognitive ability, and higher morbidity and mortality. This results in lasting impacts on a child’s ability to perform well in school and fight disease, and lifelong effects of lower wages and lost productivity (De Onis, Bloessner et al. 2011; Glewwe and King 2001; Maccini and Yang 2009; Victora, Adair et al. 2008; Ruel and Alderman 2013; Hoddinott, Alderman et al. 2013a; Hoddinott, Behrman et al. 2013b; Alderman, Hoddinott et al. 2006). Indonesia has made strong progress in several child undernutrition indicators, including surpassing its goal of reducing the number of underweight (low weight-for-age) children under age 5 to below 18 percent (UNICEF 2012). However, pregnant women and children in Indonesia continue to confront multiple factors believed to lead to stunting, including long-term inadequate food intake, child diarrhea, and frequent infections (Stewart, Iannotti et al. 2013). In addition, pregnant women and children likely suffer from various micronutrient deficiencies which can make them more susceptible to infection, reduce energy levels, and compromise cognitive development (Black, Allen, et al. 2008; Nyaradi, Jianghong, et al. 2013).
To address the challenges related to undernutrition, the Millennium Challenge Corporation (MCC) has partnered with the government of Indonesia (GoI) and other key stakeholders to fund and implement the Community-Based Health and Nutrition to Reduce Stunting Project, also known as the Nutrition Project. The Nutrition Project focuses specifically on the health and nutrition of pregnant women and infants and children under age 5, with an emphasis on children under age 2. The Nutrition Project is being implemented in 11 Indonesian provinces by Millennium Challenge Account-Indonesia (MCA-I).
MCC contracted with Mathematica Policy Research to conduct a rigorous randomized evaluation of the Nutrition Project to understand the project’s effects on stunting and related maternal and child health outcomes. The evaluation team's roles and responsibilities are highlighted in Appendix A. The details of the evaluation design can be found in the evaluation design report (Beatty, Borkum et al. 2014). This second report presents the results of the study’s baseline survey and has two key objectives. The first is to check the robustness of the randomization by demonstrating equivalence across the treatment and control subdistricts (kecamatan). The second objective is to describe conditions at baseline and provide MCC and MCA-I with information that can improve the design of project activities.
1 Sections of Chapters I, II, and IV of this report are taken from the evaluation design report (Beatty, Borkum et al. 2014). 2 Stunting is defined by the World Health Organization (WHO) as having a height or length for age more than two standard deviations below the median of a healthy reference population. In addition to stunting, the other standard anthropometric indicators of undernutrition are underweight and wasting. These are defined as having a weight-for-age and weight-for-height, respectively, more than two standard deviations below the median of a healthy reference population. Because the term malnutrition includes the overweight (high weight-for-height) indicator, we use the term undernutrition in this report to refer to the outcome of insufficient food intake and repeated infectious diseases as manifested by stunting, underweight, and wasting (WHO 2010). 1

MCC INDONESIA NUTRITION PROJECT IMPACT EVALUATION BASELINE REPORT MATHEMATICA POLICY RESEARCH
This report is organized into four chapters. The remainder of Chapter I provides an update to the literature review since the evaluation design report (Beatty, Borkum et al. 2014) was written in 2014 and an overview of the Nutrition Project design and implementation to date. Chapter II reviews the evaluation questions, outlines the evaluation design, and describes the baseline data collection activities. Chapter III presents findings from the baseline survey. Chapter IV concludes with a summary of findings, an assessment of risks to the internal validity of the study, and recommendations.
B. Summary of additions to the literature since the design report
The design report (Beatty, Borkum et al. 2014) included a review of the existing evidence on the Nutrition Project activities from the literature at that time. Shortly thereafter, the Sackler Institute for Nutrition Science and the World Health Organization (WHO) published a research agenda to gather evidence on the origins of childhood undernutrition and effective nutritional interventions (Ahmed et al. 2014). The list of priority research questions underscores the complex relationships between a host of factors which could all contribute to stunting, including environmental factors, immune system function, prenatal conditions, epigenetics, and the role of gut microbiota. This more holistic understanding of undernutrition, in which lack of food is only one of many causal factors, is very consistent with the Nutrition Program’s approach of promoting improved prenatal health, infant and young child feeding, and sanitation conditions. In the rest of this section, we provide an update on relevant evidence that has become available since the design report was published.
One line of research has explored means of identifying children at risk of stunting in the interest of preventing additional growth faltering. Since it takes extensive training and specialized equipment to be able to collect precise and accurate measures of length, it is usually impractical for community health workers to identify stunted children. A recent study from Bangladesh suggests that successive measures of weight gain, which are much easier to collect, could be used to identify children who are at risk of becoming stunted (Onyango et al. 2015). Using a metric of two consecutive monthly weight gain increments below the fifteenth percentile for their age and sex, one third of children likely to become stunted by their first birthday could be identified for intervention. Given the myriad of other negative outcomes associated with stunting, preventing children from falling farther away from a healthy growth trajectory could have important benefits. For example, a recent multi-country population-level meta-analysis found that stunting early in life was negatively associated with on-track development and learning in countries with high rates of breastfeeding (Miller et al. 2015). These findings complement previous studies showing such associations in specific populations and reinforce the rationale of the Nutrition Project.
Several recent studies have explored associations between stunting and potential causes of undernutrition. The WHO infant and young child feeding indicators are intended to assess the quality of children diets, but a recent study found that across a variety of countries, the indicators including measures of breastfeeding, complementary feeding, diet diversity, and overall diet quality were not consistently correlated with anthropometric measures such as stunting or length or weight for age Z-scores (Jones et al. 2014). The authors speculate that the lack of sensitivity and specificity of many of the indicators could be constraining how well they predict key growth outcomes. On a more hopeful note, researchers found that a child feeding index which
2

MCC INDONESIA NUTRITION PROJECT IMPACT EVALUATION BASELINE REPORT MATHEMATICA POLICY RESEARCH
aggregated a combination of the WHO indicators was more closely correlated with length for age Z-scores in Cambodia (Reinbott 2015). One indicator commonly thought to be paramount for children under age 6 months is the practice of exclusive breastfeeding, but new evidence suggests that breastfeeding alone is not sufficient to improve growth. A multi-country cluster-randomized trial of promotion of exclusive breastfeeding by peer counsellors in sub-Saharan Africa found that after at least five household visits, rates of exclusive breastfeeding in Burkina Faso and Uganda doubled, but there was no effect on stunting and children in the treatment arms were actually slightly more likely to be wasted (low weight for height) (Engebretsen et al. 2014). A study from India found that although exclusively breastfed infants under age 6 months were less likely to be underweight or have had diarrhea than non-exclusively breastfed infants, even the exclusively breastfed were vulnerable to suffer from undernutrition, leading the authors to call for more attention to infants under 6 age months in the formulation of national guidelines for early detection and management of undernutrition (Patwari, Kumar and Beard 2015).
Low rates of exclusive breastfeeding in Indonesia have received considerable attention in recent years, with several studies exploring predictors of infant and young child feeding practices.3 Using data from the 2002/2003 and 2007 Indonesia Demographic and Health Surveys, Titaley and co-authors (2014) find that mothers from wealthier households were less likely to practice early initiation of breastfeeding or to breastfeed exclusively until age 6 months. Delayed initiation was more likely in the Sumatra region and for babies delivered in government-owned facilities, while non-exclusive breastfeeding was associated with parents in the workforce and mothers who had obstetric complications during childbirth. An evaluation of a community-level program to promote exclusive breastfeeding in rural Central Java found that mothers who were knowledgeable about exclusive breastfeeding had the longest duration of the practice, whereas grandmothers’ lack of support, receipt of formula samples at discharge, and maternal experience of engorgement were barriers to exclusive breastfeeding (Susiloretni et al. 2015). A complementary cross-sectional study of breastfeeding facilities and support for working mothers in Jakarta concluded that such facilities could triple the rates of exclusive breastfeeding among working mothers (Basrowi et al. 2015). Both of these studies had relatively small sample sizes and serious design limitations, but the findings suggest that these approaches are worth exploring in more rigorous evaluations.
Turning from nutrition to sanitation as a predictor of stunting, three cluster-randomized evaluations of some version of the community-led total sanitation (CLTS) model to increase access to safe sanitation provide the first rigorous evidence of the effects of sanitation coverage on child growth. In rural Mali, a CLTS program implemented by the government almost doubled latrine coverage from one-third of households at baseline, and the rate self-reported open defecation fell drastically among adults and children (Pickering et al. 2015). Although there was no difference in diarrhea prevalence rates between the treatment and control villages, the prevalence of stunting among children under age 5 was six percentage points less in treatment villages (35 percent versus 41 percent), with a larger difference among children under age 2. In contrast, two other studies from different states in India both found that although the
3 A pair of literature reviews considers the quality and determinants of complementary feeding of children over age 6 months in Indonesia were recently published but do not offer many novel conclusions, with the key findings being that maternal knowledge is important and more research is needed (Basrowi et al. 2015a and 2015b).
3

MCC INDONESIA NUTRITION PROJECT IMPACT EVALUATION BASELINE REPORT MATHEMATICA POLICY RESEARCH
government’s Total Sanitation Campaign led to increases in latrine coverage, there were no effects on diarrhea, parasitic infections or growth (Clasen et al. 2014, Patil et al. 2014).4
None of the aforementioned studies attempted to quantify environmental enteropathy, a condition characterized by inflammation of the intestine and elevated immune system activity, which is hypothesized to be a causal pathway through which sanitation conditions could affect growth and development. Several intervention trials seeking to reduce environmental enteropathy by improving sanitation conditions are under way, but the condition is still not well understood (Crane, Jones and Berkley 2015; Gilmartin and Petri 2015; Petri, Naylor and Haque 2014). One particular area that has recently been highlighted is the link between zinc deficiency and environmental enteropathy, since both conditions are thought to affect large shares of children in developing countries and the two conditions could interact to exacerbate one another (Lindenmayer, Stolzfus and Prendergast 2014 and Young et al. 2014). A study from rural Malawi found that zinc supplementation or albendazole (a common treatment for soil transmitted helminths) slowed the progression of environmental enteropathy during the month following treatment (Ryan et al. 2014). A related paper found that three to six months of supplementation with a multiple micronutrient modestly reduced the progression of environmental enteropathy although there was no difference in linear growth (Smith et al. 2014). Finally, turning to the consequences of environmental enteropathy, new evidence from urban Bangladesh suggests that oral vaccine failure is more common in children suffering from environmental enteropathy (Naylor et al. 2015), linking sanitation to child health through yet a different pathway and implying that boosting immunization coverage might not be sufficient to protect children from life-threatening infections.
C. Nutrition Project background and implementation status
The Nutrition Project activities are being implemented in 11 of Indonesia’s 34 provinces: West Java (Jawa Barat), East Java (Jawa Timur), East Nusa Tenggara (Nusa Tenggara Timur), West Nusa Tenggara (Nusa Tenggara Barat), West Sulawesi (Sulawesi Barat), North Sulawesi (Sulawesi Utara), Gorontalo, Maluku, West Kalimantan (Kalimantan Barat), Central Kalimantan (Kalimantan Tengah), and South Sumatra (Sumatera Selatan). Across the 11 provinces, 499 kecamatan are scheduled to receive funding, benefiting an estimated 5,337 desa. Approximately 1.7 million children are estimated to benefit from the project, according to the 2013 MCA-I Monitoring and Evaluation plan.5
The Nutrition Project’s activities can be divided into three major components: (1) the community project activity, which provides block grants and facilitation to villages (desa) for activities related to health and schooling; (2) a set of supply-side activities primarily targeting health providers including subdistrict health centers (puskesmas), midwives (bidan), and village-
4 In Odisha, latrine coverage increased from less than 10 percent at baseline to over 60 percent at endline (Clasen et al. 2014). In Madhya Pradesh, latrine coverage increased from less than 15 percent at baseline to over 40 percent at endline among treatment villages, although 10 of the 40 control villages saw similar increases as the randomization was not respected by the government and the program was launched pre-maturely, prior to the end of the evaluation (Patil et al. 2014). 5 The plan can be found at https://assets.mcc.gov/documents/IDN_ME_Plan_(full)_FINAL_12_30_14.pdf
4

MCC INDONESIA NUTRITION PROJECT IMPACT EVALUATION BASELINE REPORT MATHEMATICA POLICY RESEARCH
level child health service posts (posyandu); and (3) a national communications campaign to promote increased awareness about stunting.
These activities will be implemented in the context of a decentralized health system. As a background to this context, Table I.1 outlines the structures of the Indonesian administrative and health systems that are relevant to the Nutrition Project and that we refer to throughout the rest of the report. As described below, most project activities will involve health facilities and workers at the kecamatan and/or desa levels.
Table I.1. The rural Indonesian health system includes providers and volunteers at multiple levels
Administrative level Health facilities relevant to the Nutrition Project
Key practitioners or volunteers relevant to the Nutrition Project
Province (provinsi) NA NA
District (kabupaten) District health office (Dinas Kesehatan)
Dinas Kesehatan staff, for example those involved in training
Subdistrict (kecamatan) Health center (puskesmas) Midwife (bidan) coordinator, nutritionist, sanitarian, health outreach workers
Village (desa) Village health post (poskesdes or ponkesdes)
Village birthing post/clinic (polindes)
Bidan, village nurses
Generasi village facilitators and volunteers (Desa Facilitator/Kader Pemberdayaan Masyarakat Desa or FD/KPMD)
Subvillage (dusun, RT or RW) Monthly integrated maternal and child health service post (posyandu)
Bidan, posyandu volunteers (kader posyandu)
NA = not applicable.
The first component of the Nutrition Project, the community project activity, is an updated version of the Program Nasional Pemberdayaan Masyarakat—Generasi Sehat dan Cerdas, the National Community Empowerment Program: A Healthy and Smart Generation (PNPM Generasi), an ongoing project that has been implemented by GoI since 2007. Using a community-driven development (CDD) model, Generasi provides facilitation and annual block grants to desa to be used for activities that could lead to improvements in health and schooling indicators established by Generasi. (See Box I.1 for a list of the most recent Generasi indicators.)
Figure I.1 shows the Generasi implementation steps, including the preparation and socialization, planning, implementation, and assessment phases, as described in the Generasi operation manual.6 During the preparation and socialization phase, FD/KPMD, who guide the implementation of the Generasi activities, bring together village leaders and community members to discuss initial desa conditions and tell them about the Generasi program. The
6 This summary and the figure draws heavily from the Generasi Implementation manual found here http://psflibrary.org/catalog/repository/PTO%20PNPM%20Generasi%202008%20(VERSI%20A)%20new.pdf
5

MCC INDONESIA NUTRITION PROJECT IMPACT EVALUATION BASELINE REPORT MATHEMATICA POLICY RESEARCH
facilitators hold meetings at the inter-desa (known as Musyawarah Antar Desa or MAD), desa, and sub-village (dusun) levels to draw a map of the education and health conditions.7
Figure I.1. Generasi includes a four step planning and implementation process
Source: Generasi Implementation Manual (cited above).
In the activity planning phase, women’s groups hold discussions about the problems in their communities, and needs for children’s health and primary education services. Desa also have meetings regarding activity formulation, fund allocation, and activity prioritization in order for each desa to develop a community-based proposal to improve performance on the Generasi indicators. In the implementation and monitoring phase, a desa advisory team and activity implementers prepare, implement, and monitor their proposed program. Finally in the activity assessment phase, the desa assess their success by comparing the desa targets to their actual performance. Another MAD is held to discuss the program’s results. The cycle starts again in the subsequent year of the program, but many of the preparation, socialization, and activity planning steps are abbreviated or skipped as the community is already familiar with them.
In terms of allocating funding, in the first year of Generasi, kecamatan allocate annual block grants, also known as bantuan langsung masyarakat or BLM, among desa based on the number of projects the desa proposes to undertake and target beneficiaries per desa, focusing on pregnant
7 The relevant administrative units in Indonesia (from largest to smallest are: province (provinsi), district (kabupaten), subdistrict (kecamatan), village (desa), sub-village (dusun or RT/RW).
• Activity implementation preparation meetings
• Activity implementation and monitoring
• Assessment of success indicators achieved
• Intervillage success indicator assessment
• Women focus group discussions
• Activity formulation meetings
• Intervillage fund allocation meeting
• Activity prioritization meeting
• Discussion of desa conditions
• Socialization of service providers and community members
• Selection and training of Village Advisory team and FD/KPMD
• Social mapping ofprogram targets
Step One: Preparation
and Socialization
Step Two: Activity
Planning
Step Three: Implement-ation and
Monitoring
Step Four: Activity
Assessment
6

MCC INDONESIA NUTRITION PROJECT IMPACT EVALUATION BASELINE REPORT MATHEMATICA POLICY RESEARCH
women, and infants and children under age 5, especially children under age 2, and school-aged children. Remote desa with more difficult access to services (as categorized by Generasi) may also receive higher BLM amounts. BLM are generally disbursed in two tranches. In subsequent years, the size of the grants distributed is partially based on desa progress on the indicators, and desa compete for a pool of additional funding that is 20 percent of the total amount allocated to the kecamatan.
As part of the Nutrition Project, MCC is supporting the introduction of PNPM-Generasi in three provinces that have not yet benefited from the program. In collaboration with MCC, other donors, and several ministries, the Generasi project team revised the Generasi indicators to place a larger emphasis on health and nutrition across all Generasi provinces. Specifically, they increased the number of target postnatal care visits from two to three, added new indicators on Generasi maternal health classes (kelas ibu hamil) and classes for caregivers of young children (kelas balita), and removed two of the schooling indicators.8 See Box I.1 for a list of the most recent Generasi indicators. With MCC’s support, Generasi will also include a new requirement that FD/KPMD have experience with health programs and will receive additional training on mechanisms for improving maternal and child health. This training includes information on micronutrients, prenatal health, exclusive breastfeeding (EBF), complementary feeding, immunizations, malaria prevention, and diarrhea prevention and control, among other topics.
Box I.1. Generasi indicators are largely focused on improving maternal and child health and nutrition
Source: PNPM-Support Facility, August 2015.
At the time of baseline data collection, November 2014 to February 2015, Generasi implementation had already begun. As discussed in Chapter III, approximately 90 percent of
8 Agreement on the content of and responsibility for the kelas ibu hamil and kelas balita by the Minsitry of Health and other relevant ministries was not made until the end of 2015, which will likely affect the rollout of classes.
1. Four prenatal care visits
2. Taking at least 90 iron tablets during pregnancy
3. Delivery assisted by a trained professional
4. Three postnatal care visits
5. Complete childhood immunizations
6. Vitamin A twice a year for children under age 5
7. Monthly weighing for infants
8. Monthly weighing and weight increases for children under age 2
9. Participation of pregnant women and spouses in nutrition counseling offered through kelas ibu hamil
10. Participation of parents/caregivers of 0–2 year olds in nutrition counseling offered through kelas balita
11. All primary and junior secondary aged children that have not enrolled in school or have dropped out, including children with disabilities, enroll
12. All children that graduate from primary school, including children with disabilities, enroll in junior secondary school
7

MCC INDONESIA NUTRITION PROJECT IMPACT EVALUATION BASELINE REPORT MATHEMATICA POLICY RESEARCH
treatment villages had trained their Generasi facilitators, held their first socialization meeting, and developed a proposal and budget plan. Slightly more than half of villages had received their first tranche of funding from Generasi. However, few households (37 percent) had heard of Generasi or were aware that Generasi activities tool place (17 percent) in their desa.
The second component of the Nutrition Project is a set of supply-side activities described below. MCC will support the implementation of these activities across the provinces where Generasi is also being implemented, so that each participating kecamatan receives a package of demand and supply-side interventions.
• Training on infant and young child feeding (IYCF).9 Training on IYCF is provided to health staff at national, provincial (provinsi), kabupaten, kecamatan, and desa levels through a cascade model. At the lower levels of the cascade, district health staff train one nutritionist and one bidan coordinator per puskesmas, who in turn train one bidan10, two child health service post volunteers (kader posyandu)11, and one desa-level volunteer (kader desa) per desa. In total, approximately 1,400 puskesmas staff and 17,000 bidan and kader posyandu per desa will be trained across all 11 provinces. Targets for the evaluation provinces are shown in Table I.1.
The content for these trainings was developed by the United Nations Children’s Fund (UNICEF), and lasts for six days. Topics covered include nutritional health improvement policy, the importance of IYCF, counseling on breastfeeding, counseling on complementary feeding, growth monitoring, and overall nutrition and health. The training includes components of group work, role play, discussions, demonstrations, participative presentations, observations, and practice. Each class has a maximum of 14 participants.
As seen in Table I.2, some training had begun at the time of the baseline survey. (See more details in Chapter III.)12 The reason that some kader posyandu and bidan were trained prior to the baseline is that the training of the trainers (ToT) began in mid-2014, and some of the kader posyandu were trained as part of the ToT training. However, most puskesmas and village level staff did not receive the official IYCF training prior to data collection. The remaining health providers will be trained in 2016.
9 Information on the IYCF training comes from the Training for Counseling on IYCF Technical Operation Manual (2014) received from MCC. 10 Bidan are midwives that operate at the village level. 11 Kader posyandu are volunteers who work at the posyandu. There are multiple posyandu per village. 12 Table I.1shows the number of providers trained by provider type as of December 2015. However, since no training took place in 2015, we can assume that these individuals were trained prior to or during the baseline.
8

MCC INDONESIA NUTRITION PROJECT IMPACT EVALUATION BASELINE REPORT MATHEMATICA POLICY RESEARCH
Table I.2. Some training activities had started in 2014
Provider type
South Sumatra West Kalimantan Central Kalimantan
Target (all years) Actual 2014
Target (all years) Actual 2014
Target (all years) Actual 2014
Provincial staff 2 8 2 17 2 16 District staff 10 2 18 3 16 2 Puskesmas staff 86 2 158 1 136 n.a Bidan 688 n.a 1,004 21 813 52 Kader posyandu 1,376 130 2,008 178 1,626 127
Source: MCA-I and Mathematica’s calculations.
• Growth monitoring training.13 The current Ministry of Health (MoH) growth monitoring training curriculum, which has been used to train health workers since 2007, has been revised under the Nutrition Project. The revisions integrate the previous modules developed by the World Health Organization (WHO) into a single module on growth monitoring, with a focus on technical growth assessment, interpreting the results, and follow-up counseling. The revisions also added two modules on case management of severe acute malnutrition, and case management of moderate malnutrition, with a focus on growth assessment and nutrition rehabilitation by preparing therapeutic food. ToT is held for six days, while the end user training lasts for five days.
The training is intended to reach 1,388 health workers across the 11 implementation provinces. The intended participants include health educators, pediatricians, general practitioners, nurses, bidan, and nutritionists at the puskesmas level. Each class consists of 8 to 12 people.
• Provision of anthropometric kits. Training on growth monitoring will be combined with the provision of anthropometric kits to puskesmas in order to support the targets of monthly measuring and weighing. The kits include length- and height-taking equipment, scales, and measuring tapes to measure middle-upper arm circumference (MUAC) for pregnant women. The length of children age 0 to 24 months will be measured monthly so that providers can better diagnose undernutrition, including stunting. Weighing is part of the standard posyandu visit and is tracked monthly up to age 5. Neither the growth monitoring training nor the anthropometric kit distribution had started at the time of the baseline data collection or as of December 2015.
• Distribution of micronutrients. While the MoH has been providing IFA tablets to pregnant women for the past 30 years, the Project will support the distribution of a new formulation of IFA following WHO guidelines and strengthening the supply chain for IFA. In addition, the Nutrition Project will support the distribution of Taburia sachets to children age 6 to 23 months through the posyandu in the three evaluation provinces. Taburia is the brand name for micronutrient sachets that come in powder form most commonly available in Indonesia.
13 Information on the growth monitoring training comes from the Technical Operation Manual for Child Growth Monitoring Training (2015) supplied by MCC.
9
MCC INDONESIA NUTRITION PROJECT IMPACT EVALUATION BASELINE REPORT MATHEMATICA POLICY RESEARCH
This activity had not started at the time of the baseline data collection and has not yet started as of December 2015. The earliest IFA distribution is expected to start is early 2017.
• Support implementation of the CLTS model.14 Training on promoting sanitation behavior change and triggering based on the community-led total sanitation (CLTS) model will be provided to health workers and administrative staff at the kecamatan and desa levels. In the CLTS model, a facilitator raises the community’s awareness on the extent of fecal contamination resulting from open defecation and mobilizes, or “triggers” the community to take action and modify their sanitation behavior. The CLTS model includes three major components: creating an enabling environment, increasing the demand for sanitation, and improving the supply of sanitation and hygiene. The duration of the training course is four days.
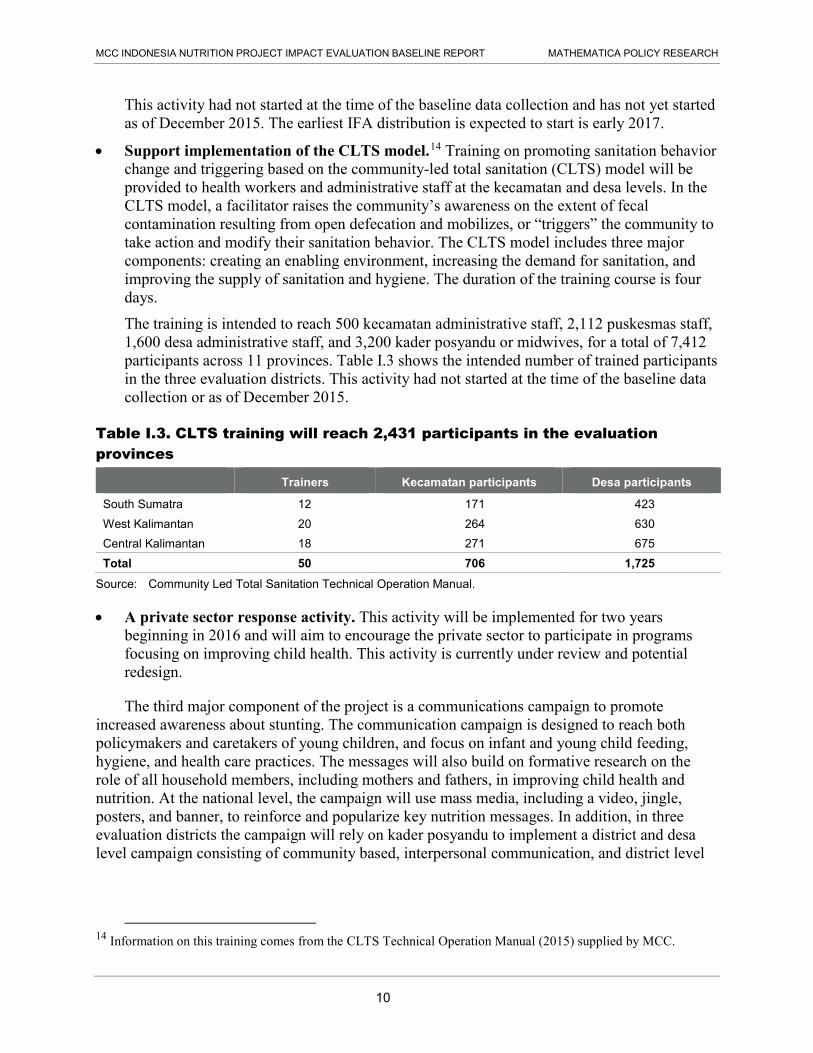
The training is intended to reach 500 kecamatan administrative staff, 2,112 puskesmas staff, 1,600 desa administrative staff, and 3,200 kader posyandu or midwives, for a total of 7,412 participants across 11 provinces. Table I.3 shows the intended number of trained participants in the three evaluation districts. This activity had not started at the time of the baseline data collection or as of December 2015.
Table I.3. CLTS training will reach 2,431 participants in the evaluation provinces
Trainers Kecamatan participants Desa participants
South Sumatra 12 171 423 West Kalimantan 20 264 630 Central Kalimantan 18 271 675 Total 50 706 1,725
Source: Community Led Total Sanitation Technical Operation Manual.
• A private sector response activity. This activity will be implemented for two years beginning in 2016 and will aim to encourage the private sector to participate in programs focusing on improving child health. This activity is currently under review and potential redesign.
The third major component of the project is a communications campaign to promote increased awareness about stunting. The communication campaign is designed to reach both policymakers and caretakers of young children, and focus on infant and young child feeding, hygiene, and health care practices. The messages will also build on formative research on the role of all household members, including mothers and fathers, in improving child health and nutrition. At the national level, the campaign will use mass media, including a video, jingle, posters, and banner, to reinforce and popularize key nutrition messages. In addition, in three evaluation districts the campaign will rely on kader posyandu to implement a district and desa level campaign consisting of community based, interpersonal communication, and district level
14 Information on this training comes from the CLTS Technical Operation Manual (2015) supplied by MCC.
10

MCC INDONESIA NUTRITION PROJECT IMPACT EVALUATION BASELINE REPORT MATHEMATICA POLICY RESEARCH
advocacy activities in treatment kecamatan. The national communications campaign began in December 2015, while the additional activities in the evaluation districts had not yet started.
Nutrition Project activities are being implemented over four years, from 2014–2018 as shown in Figure I.2. Component 1 is shown in dark blue, component 2 is light blue, and component 3 is medium blue. The timelines shown for activities beginning in 2016 and 2017 are tentative but reflect current plans.
Figure I.2. Nutrition Project activities will be implemented through 2018
Project implementation 2014 2015 2016 2017 2018
Quarter (calendar 1 2 3 4 1 2 3 4 1 2 3 4 1 2 3 4 1 2
Generasi facilitator training
Generasi block grants disbursed
IYCF training at PHO (Provincial Health Office)/DHO (District Health Office) level
IYCF training at puskesmas/community level
Growth monitoring training at PHO/DHO level
Growth monitoring training at puskesmas/community level
Sanitation training and triggering events
Sanitation entrepreneur training
Anthropometric kits distributed
IFA distribution for pregnant women
Micronutrient distribution for children 6-24 months
Private sector response activity
Communication campaign
MCC and MCA-I developed the project logic displayed in Figure I.3, which shows the hypothesized relationship between the Nutrition Project’s activities, outcomes, and the ultimate goal of reduced poverty through economic growth. MCC anticipates that the Project activities will lead to service providers’ improved ability to prevent, diagnose, and treat undernutrition; improved feeding and sanitation practices in households; and greater community and government awareness around nutrition. These short-term outcomes, along with the direct provision of micronutrient supplements, will lead to improved nutrition among pregnant women and children, reducing the prevalence of stunting, wasting, and underweight. Note that this was
Component 1 Component 2 Component 3
11

MCC INDONESIA NUTRITION PROJECT IMPACT EVALUATION BASELINE REPORT MATHEMATICA POLICY RESEARCH
the program logic as of August 2014, and several of the components have changed since that time, as discussed above.
Figure I.3. Program Logic Model: Nutrition project activities are intended to reduce stunting, wasting, and underweight and ultimately reduce poverty through economic growth
Source: MCA-I Monitoring and Evaluation Plan (2014). http://www.mcc.gov/documents/data/ME_Plan_-_IDN_-_V1_-_Aug13.pdf.
Additional Generasi donor funding secured and Generasi operations
manual revised
Training modules developed Service provider incentives pilot
designed
Private Sector Activity
designed
Communications Campaign designed based on formative
research
Generasi proposals developed and reviewed
and block grants approved
Health service providers trained on Infant and
Young Child Feeding
Health service providers trained on growth monitoring and provided with
length-taking equipment
Service provider incentives
scheme piloted in 1 district
Micronutrients distributed to
pregnant women and
children
Service providers trained on hygiene and sanitation and
sanitation triggering events implemented
Private Sector Activity
implemented
Communications Campaign
implemented
Community-level activities to improve education outcomes
conducted
Community-level activities to improve health outcomes
(including stunting) conducted
Service providers’ ability to prevent, diagnose, and treat stunting / malnourishment
improved
Improved sanitation behavior
Increased awareness
about stunting at government and community
level
Improved service provider performance in preventing, diagnosing, and treating stunting /
malnourishment
Increased availability of affordable nutrition
products
Reduced incidence of diarrhea and improved
absorption of nutrients
Improved nutrition among pregnant women and children
Reduced stunting, wasting, underweight
Increased pre-/primary/
secondary school attendance
Reduced mortality
Improved child school readiness
Reduced morbidity
Improved human capital accumulation
Increased household income through cost savings, productivity growth and higher lifetime earning
PROCESS
OUTPUT
OUTCOME
Reduced poverty through economic growth
Micronutrient distribution
channel developed
Stakeholders socialized on
sanitation triggering
Village cadre and Generasi
facilitators trained on stunting
12

MCC INDONESIA NUTRITION PROJECT IMPACT EVALUATION BASELINE REPORT MATHEMATICA POLICY RESEARCH
II. NUTRITION PROJECT EVALUATION AND BASELINE DATA COLLECTION
The Nutrition Project’s demand and supply-side activities described in Chapter I are designed to improve a range of health and nutrition outcomes for mothers and children. In this chapter, we recap the evaluation design as outlined in the design report and describe the baseline data collection activities. First, we detail the evaluation research questions and key indicators. Next we summarize pertinent aspects of the evaluation design, including the random assignment of kecamatan and sample size. Finally, we describe the baseline data collection, including the sampling approach, summary of the instruments, collection methods, and analysis approach.
A. Research questions and key outcomes
The evaluation of the Nutrition Project will address three key research questions, and related sub-questions, which focus on both impacts and implementation:
Impacts 1. What is the impact of the Nutrition Project’s package of supply and demand-side activities
on key outcomes, including:
a. Maternal health outcomes (for example, body mass index [BMI] and anemia)
b. Child health outcomes (for example, stunting, wasting, underweight, birth weight, diarrhea, and anemia)
c. Behavioral practices (for example, sanitation, hygiene, breastfeeding, complementary feeding, food diversity, overall maternal and child nutrition, iron/folic acid consumption)
d. Receipt of health services (for example, nutritional counseling, growth monitoring, prenatal and postnatal care access and utilization, vaccination, vitamin supplementation, nutritional and growth counseling)
2. What is the impact of the Nutrition Project on key subgroups, such as those defined by socioeconomic status, mothers’ level of schooling, children’s gender, geographic location (peripheral versus more connected areas), and service availability?
Implementation 3. How were various components of the Nutrition Project implemented?
a. How did actual implementation compare to planned implementation, and what were the reasons for any deviations from plans?
b. What were the main challenges to implementation, and how were these addressed?
c. Which demand-side and supply-side elements were the key drivers of impacts?
To answer these questions, we are implementing a mixed-methods evaluation, using a random assignment design to assess program impacts. This design will enable us to rigorously answer the first two research questions related to project impacts by analyzing quantitative data on both short- and medium-term outcomes described in the logic model. Although it is not possible to directly measure long-term impacts on income and poverty in the time frame of the
13

MCC INDONESIA NUTRITION PROJECT IMPACT EVALUATION BASELINE REPORT MATHEMATICA POLICY RESEARCH
evaluation, estimating impacts on health-related outcomes that are linked to them in the logic model but are more proximal to the activities enable us to assess whether these long-term impacts are plausible. The random-assignment design will be supplemented by a qualitative component that looks at implementation progress.
Table II.1 describes the key medium outcome indicators, definitions, and the sample populations for each indicator. Short-term indicators are described further under the summary of instruments. Data on these indicators was collected at baseline, and will be collected again at endline.
Table II.1. Key indicators measure medium-term project outcomes
Indicator Definition Sample
Stunting, wasting, underweight Two standard deviations below reference median of height-for-age, weight-for-height, or weight-for-age
Children age 0–35 months
Infant/toddler anemiaa Hemoglobin concentration of less than 11 g/dL
Children age 6–35 months
Children with diarrhea in the last week, two weeks, and four weeks
Three or more loose or watery stools in a 24-hour period, or any stool with bloodb
Children age 0–35 months
Percentage of children who are low birth weight
Birth weight under 2.5 kg Children age 0–35 months
Low maternal BMI, chronic energy deficiency
Less than 18.5 kg/m2 Pregnant women in 2nd and 3rd trimesters
Low maternal MUAC Less than 23.5 cm Pregnant women in 2nd and 3rd trimesters
Maternal anemia Hemoglobin concentration of less than 11 g/dL
Pregnant women in 2nd and 3rd trimester and mothers of children age 0-5 months
a Anemia is a condition in which one has insufficient red blood cells or the cells have insufficient oxygen-carrying capacity to meet physiologic needs. Note that not all anemia is caused by iron deficiency. Although iron deficiency is the most common cause of anemia worldwide, other conditions such as deficiencies in folate, vitamin B12, vitamin A, chronic inflammation, parasitic infections, and inherited disorders can also cause anemia. b Definition from Baqui, Black et al. (1991).
B. Evaluation design
In this section we discuss the evaluation approach, randomization process, and sample size requirements. A detailed description of our technical approach is included in Appendix B.
1. Evaluation approach As mentioned above, the evaluation methodology to rigorously assess the effectiveness of
the Nutrition Project is a random assignment design. Project implementers committed to using random assignment in 2012 and randomly assigned eligible kecamatan into two groups: those who will receive the Project activities (the treatment group) and those who will not (the control group) during the evaluation period. Because of random assignment, the treatment and control groups should be similar, on average, in all respects, except that only the treatment group will receive the Project activities. Therefore, the control group can be used to estimate the counterfactual: the average outcomes that could be expected in the treatment group in the absence of the Project. Any differences in outcomes between the treatment and control group 14

MCC INDONESIA NUTRITION PROJECT IMPACT EVALUATION BASELINE REPORT MATHEMATICA POLICY RESEARCH
that are observed after random assignment can thus be attributed to the impact of the package of activities implemented under the Project.15
2. Random assignment details The evaluation is being conducted in 3 of the 11 implementation provinces: South Sumatra,
West Kalimantan, and Central Kalimantan. The procedure for randomizing the kecamatan is described in detail in the evaluation design report (Beatty, Borkum et al. 2014). In summary, the procedure involved three stages: selecting eligible kecamatan across 22 kabupaten, randomly selecting 225 kecamatan to be included in the study, and randomly assigning 190 of the selected kecamatan to treatment or control. This process resulted in a sample of 95 treatment and 95 control kecamatan for the study. An implicit stratification procedure ensured that this sample was balanced across the districts in the study. However, our analysis of the Stata code that was used to implement the implicit stratification at each stage suggested that, although the random selection was valid, it resulted in varying probabilities of selection across kecamatan.16 In the analysis, we adjust for the combined probability of selection across all three stages using kecamatan-level weights, so that the impact estimates are valid and can be generalized to the full set of eligible kecamatan. This weighting adjustment has some cost in terms of reduced statistical power, but is necessary to adjust correctly for the random assignment procedure that was implemented.
3. Sample size calculations Although the Nutrition Project is expected to have long-term impacts on the health and
income of beneficiaries, the majority of the activities are intended to directly support children for a period of 1,000 days, starting at conception through age 2. Therefore, our analysis focuses on two primary samples—women in the second or third trimester of pregnancy and young children age 0–35 months. We are utilizing a repeated cross sectional sample, rather than a panel sample, so that a different random sample of pregnant women and young children will be drawn at endline than from the baseline. Because of this design, and the fact that the baseline and the endline surveys serve slightly different purposes, we assessed the optimal sample sizes required at the two points in time. In particular, we require greater precision—and hence larger sample sizes—at endline, to enable us to precisely estimate ultimate project impacts and conduct impact analyses by subgroup. However, since the baseline is largely used to assess equivalence of the two groups of communities at baseline, and not being used to allow for individual level control variables in regression adjustments for impact analysis, and primarily to be cost effective in terms of the overall data collection costs, we selected smaller sample sizes for baseline (compared to the endline sample requirements). The endline sample sizes, calculated from
15 It is possible that some specific Project activities will affect both the treatment and control groups. Specifically, aspects of the communication campaign are national in scope (for example, a national media campaign around stunting). Provided that exposure to these common activities is similar in the treatment and control groups, the results will then measure the imapct of the Nutirition Project beyond a business-as-usual condition that includes a communication campaign. 16 Specifically, the random start point for the implicit stratification procedure was not selected from a uniform distribution, so that certain kecamatan were more likely to be selected as the start point than others. This had a knock-on effect on the rest of the selection, so that certain combinations of kecamatan were more likely to be selected than others.
15

MCC INDONESIA NUTRITION PROJECT IMPACT EVALUATION BASELINE REPORT MATHEMATICA POLICY RESEARCH
minimum detectable impacts (MDIs), are described in detail in the evaluation design report (Beatty, Borkum et al. 2014); here we summarize the calculation of the baseline sample sizes.
To determine the appropriate baseline sample size, we focused on the minimum detectable differences (MDDs) for baseline treatment-control differences and the confidence intervals (CIs) of the estimated baseline means. We did not expect large differences at baseline given random assignment, however, we still wanted to be able to assess the baseline balance and identify any large differences that may have arisen by chance. We will control for any baseline differences at the community levels in the endline analysis regardless, but assessing balance and identifying any large baseline differences is a standard check as part of a randomized control trial (RCT) design. In terms of confidence intervals, we wanted to ensure that the reported baseline means would be sufficiently precise to be informative for programmatic purposes and for other stakeholders.
In the design report, we conducted MDD and CI calculations for several possible baseline samples (Tables II.2 and II.3). Based on these calculations, we chose a baseline sample of 16 children age 0–35 months and 8 pregnant women in the second and third trimester (a total of 24 households) in each of the 190 sample kecamatan, which provide reasonable CIs and MDDs for baseline differences for key outcomes. For example, for stunting, the main outcome of interest, we are able to identify any baseline differences larger than 6.3 percentage points.17 The sampling strategy led to an overall baseline sample size of 1,520 pregnant women and 3,040 young children in the 0–35 month age range (4,560 households in total).
Table II.2. We chose a baseline sample size of 16 households with children age 0–35 months per kecamatan to identify baseline treatment-control differences and estimate baseline means
Average N per kecamatan
Total N
Stunting (31.0 percent)
Anemia (38.3 percent)
Diarrhea in past month
(17.2 percent) Low birth weight
(7.2 percent)
MDD (pp)
CI Margin
(pp) MDD (pp)
CI Margin
(pp) MDD (pp)
CI Margin
(pp) MDD (pp)
CI Margin
(pp)
8 1,520 7.9 5.5 9.9 6.9 6.1 4.3 3.8 2.7
16 3,040 6.3 4.4 8.4 5.9 4.7 3.3 2.7 1.9
24 4,560 5.7 4.0 7.8 5.5 4.1 2.9 2.2 1.6
Notes: MDDs are for a two-tailed test with 80 percent power at a 95 percent significance level. Baseline prevalence (shown in parentheses) and ICCs (0.05, 0.11, 0.03, and 0.002) are from IFLS 2007. Sample for anemia is five-sixths of the total because it excludes children 0-5 months. Confidence interval upper bound is given by the mean plus the confidence margin; confidence interval lower bound is given by the mean minus the confidence margin. Calculations assume a response rate of 95 percent.
pp = percentage points.
17 With this level of precision for the baseline mean, we will also be able to control effectively in the endline for any large community level differences at baseline that may arise due to chance.
16

MCC INDONESIA NUTRITION PROJECT IMPACT EVALUATION BASELINE REPORT MATHEMATICA POLICY RESEARCH
Table II.3. We chose a baseline sample size of 8 households with pregnant women in the second or third trimester per kecamatan to identify baseline treatment-control differences and estimate baseline means
Average N per kecamatan Total N
Low BMI (11.6 percent)
Anemia in second and third trimester (46.0 percent)
MDD (pp) CI Margin (pp) MDD (pp) CI Margin (pp)
4 760 6.9 4.8 10.6 7.4
8 1,520 5.0 3.5 7.7 5.4
12 2,280 4.2 3.0 6.5 4.5
Notes: MDDs are for a two-tailed test with 80 percent power at a 95 percent significance level. Baseline prevalence (shown in parentheses) and ICCs (0.02 and 0.016) are from IFLS 2007. Confidence interval upper bound is given by the mean plus the confidence margin; confidence interval lower bound is given by the mean minus the confidence margin. Calculations assume a response rate of 95 percent.
pp = percentage points.
C. Baseline data collection
Based on this evaluation design, data were collected in both treatment and control kecamantan. This section describes the baseline data collection timing and sampling strategy and summarizes the instruments. More details on the training of data collectors and the sampling approach are available in Appendix B.
1. Baseline timing MCA-I contracted with SurveyMETER, an Indonesian survey firm, to conduct the baseline
data collection, which took place from November 29, 2014 to February 10, 2015. In advance of the data collection, Mathematica and SurveyMETER received institutional review board (IRB) approval for this study from the Ethics Committee of Faculty of Medicine at the University of Indonesia. Details of the SurveyMETER budget and IRB process are found in Appendix A. The data collection began later than anticipated due to survey firm contracting delays, and thus, as mentioned earlier and discussed in more detail in Chapter III, implementation of some of the Nutrition Project activities—Generasi and IYCF training—had begun by the time of the baseline survey. Data collection activities in each desa comprised a listing to construct the sampling frame; the household, pregnant woman, and caregiver surveys; measurement and blood sample collection from pregnant women and children; and the community-level surveys, including at the puskesmas in the kecamatan. Each of these types of activities were conducted by staff with specialized training working together as a team. Data collection in each kecamatan was conducted over the course of several days and concluded before the team moved on to their next kecamatan.
2. Sample selection Details of the sampling approach can be found in Appendix B, which draws heavily on the
SurveyMETER report “Field report: Data collection for the baseline survey of the Community-Based Health and Nutrition to Reduce Stunting Project” (2015). The resulting study area and samples from the three evaluation provinces sample is summarized in Table II.4.
17

MCC INDONESIA NUTRITION PROJECT IMPACT EVALUATION BASELINE REPORT MATHEMATICA POLICY RESEARCH
Table II.4. The Nutrition Project survey spans 22 districts and 4,560 households
Province Districts Kecamatan Desa Pregnant woman
sample Children sample
West Kalimantan 9 79 316 632 1,264 Central Kalimantan 8 68 272 544 1,088 South Sumatra 5 43 172 344 688
Total 22 190 760 1,520 3,040
Source: SurveyMETER (2015).
In addition to interviewing pregnant women and caregivers of children age 0–35 months, SurveyMETER also gathered baseline data from community service providers and leaders including bidan, kader posyandu, FD/KPMD, and village heads (kepala desa) at the desa level, and puskesmas administrators, bidan coordinators, nutritionists, and sanitarians at the puskesmas level where available. This community level data was collected in order to better understand the current capacity and use of the desa-level and puskesmas facilities, capture any differences between services at baseline between treatment and control kecamatan, and gather additional information on the implementation of Nutrition Project activities. Details of how these individuals were selected is also found in Appendix B.
The sampling process resulted in the final sample sizes displayed in Table II.5. The response rates were quite high, ranging from 84 percent for caregivers, to 100 percent for kader posyandu, kepala desa, and puskesmas administators. Note that this is the response rate for the first interview attempt. If a household refused interview, SurveyMETER found a replacement household and thus the full household sample is 4,560, as recommended above.
Table II.5. Response rates for the baseline survey were high
Instrument Sample size Response rate (percentage)
Household head 4,547 85 Caregiver 3,034 84 Pregnant woman 1,513 86 Kader posyandu 732 100 Kepala Desa 760 100 FD/KPMD 358 94 Bidan desa 570 75 Puskesmas administrators 251 100 Bidan coordinator 245 97 Nutritionist 214 88 Sanitarian 203 88
Source: Mathematica’s calculations.
3. Summary of baseline survey instruments Mathematica developed six distinct questionnaires for baseline data collection based on the
samples described above: household (which includes pregnant women and caregiver
18

MCC INDONESIA NUTRITION PROJECT IMPACT EVALUATION BASELINE REPORT MATHEMATICA POLICY RESEARCH
questionnaires), bidan, kader posyandu, kepala desa, FD/KPMD, and puskesmas (which includes separate modules for bidan coordinators, nutritionists, and sanitarians). SurveyMETER then translated the questionnaires into Indonesian.18 Questions were drawn from a variety of existing surveys, including the Demographic Health Survey (DHS), the Indonesian Family Life Survey (IFLS) and the previous PNPM-Generasi evaluation surveys. In addition, some questions were newly developed for this evaluation. The household questionnaire includes three modules: a household module administered to all households, a pregnant women module only administered to pregnant women, and a caregiver module only administered to the primary caregiver(s) of children age 0–35 months. Table II.6 includes a summary of the household questionnaire modules, selected indicators, and average length. Full English versions of all questionnaires will be published along with the public use data files on MCC’s website in 2016.
Table II.6. Household surveys focus on background information about the household, with modules for pregnant women and caregivers of children age 0–35 months
Household All respondents 56 minutes
Member of household • Household roster, location, age, schooling, employment of household members • Religion and ethnicity of household head
Household characteristics
• Roof, wall material (proxy for income) • Asset inventory • Food security • Receipt of social benefits targeted at poor • Health insurance knowledge and participation
Health • Water sources • Sanitation and hygiene practices, including hand washing • Knowledge of sanitation and hygiene best practices • Participation in triggering and/or CLTS-related events • Home environment • Access to and use of health services (distance, time, travel cost)
Community engagement
• Participation in community groups/activities • Contributions to public and private goods • Participation in social networks
Generasi (treatment group only)
• Participation in Generasi planning and social mapping • Contributions to Generasi in terms of time, labor, and in-kind donations
18 Indonesian was used for most of the interview for 98 percent of respondents.
19
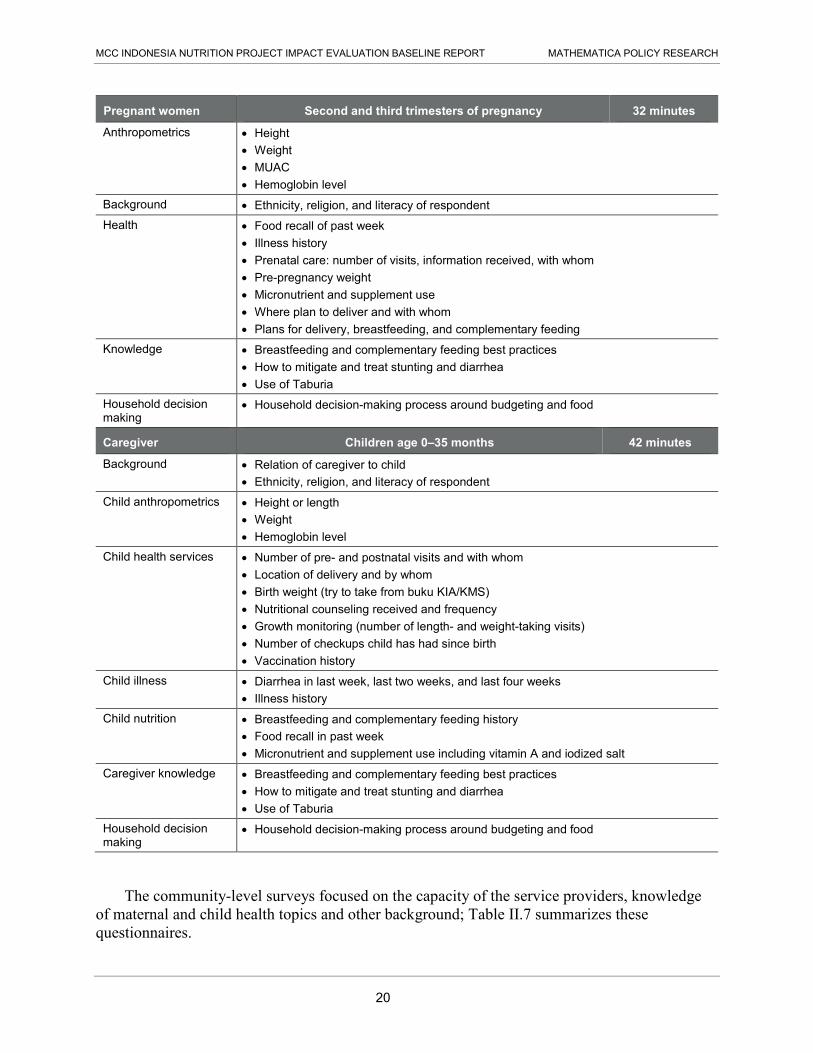
MCC INDONESIA NUTRITION PROJECT IMPACT EVALUATION BASELINE REPORT MATHEMATICA POLICY RESEARCH
Pregnant women Second and third trimesters of pregnancy 32 minutes
Anthropometrics • Height • Weight • MUAC • Hemoglobin level
Background • Ethnicity, religion, and literacy of respondent Health • Food recall of past week
• Illness history • Prenatal care: number of visits, information received, with whom • Pre-pregnancy weight • Micronutrient and supplement use • Where plan to deliver and with whom • Plans for delivery, breastfeeding, and complementary feeding
Knowledge • Breastfeeding and complementary feeding best practices • How to mitigate and treat stunting and diarrhea • Use of Taburia
Household decision making
• Household decision-making process around budgeting and food
Caregiver Children age 0–35 months 42 minutes
Background • Relation of caregiver to child • Ethnicity, religion, and literacy of respondent
Child anthropometrics • Height or length • Weight • Hemoglobin level
Child health services • Number of pre- and postnatal visits and with whom • Location of delivery and by whom • Birth weight (try to take from buku KIA/KMS) • Nutritional counseling received and frequency • Growth monitoring (number of length- and weight-taking visits) • Number of checkups child has had since birth • Vaccination history
Child illness • Diarrhea in last week, last two weeks, and last four weeks • Illness history
Child nutrition • Breastfeeding and complementary feeding history • Food recall in past week • Micronutrient and supplement use including vitamin A and iodized salt
Caregiver knowledge • Breastfeeding and complementary feeding best practices • How to mitigate and treat stunting and diarrhea • Use of Taburia
Household decision making
• Household decision-making process around budgeting and food
The community-level surveys focused on the capacity of the service providers, knowledge of maternal and child health topics and other background; Table II.7 summarizes these questionnaires.
20

MCC INDONESIA NUTRITION PROJECT IMPACT EVALUATION BASELINE REPORT MATHEMATICA POLICY RESEARCH
Table II.7. Desa-level and puskesmas interviews focus on capacity, knowledge, and outreach activities
Desa Respondents are kepala desa, kader posyandu, bidan, and FD/KPMD
Capacity • Facilities/equipment inventory • Training and experience of kader posyandu and bidan • Number of pregnant women and children they see in a month • Access to puskesmas and other health services
Knowledge • Breastfeeding and complementary feeding best practices • Sanitation and hygiene best practice • How to mitigate and treat stunting and diarrhea
Participation in Generasi (treatment kecamatan only)
• Personal involvement with Generasi meetings and activities • Number and content of Generasi meetings • Generasi project focus • Project funding
Other • What the respondents do in terms of outreach • What practices they are promoting with mothers and children • Other maternal and child health programs in the desa • Interactions with and engagement of male caregivers
Bidan-specific • Place of practice • Whether they see private clients • Charge for services • Frequency and attendance of kelas ibu hamil and kelas balita
Kader posyandu– specific • Frequency of posyandu meetings • Health services provided at posyandu • Frequency and attendance of kelas ibu hamil and kelas balita
Kepala desa-specific • Demography of desa • Access to desa • Water and sanitation in the desa • Benefits from social programs in the desa • Recent disturbances to the desa • General community participation
Puskesmas Respondents are puskesmas administrators, nutritionist, sanitarian, and/or bidan coordinator
Background • Puskesmas catchment area • Kecamatan access • Health facilities affiliated with puskesmas • Number of pregnant women and children they see in a month • Records of stunted and underweight children
Capacity • Facility/equipment inventory, includes supplies and Taburia • Staff training and experience • Services provided at puskesmas
Knowledge of nutritionist, sanitarian and bidan coordinator
• Breastfeeding and complementary feeding best practices • Sanitation and hygiene best practice • How to mitigate and treat stunting and diarrhea
Other • Roles and responsibilities of the bidan coordinator, nutritionist, and sanitarian • Time allocation of the bidan coordinator, nutritionist, and sanitarian
21

This page has been left blank for double-sided copying.

MCC INDONESIA NUTRITION PROJECT IMPACT EVALUATION BASELINE REPORT MATHEMATICA POLICY RESEARCH
III. BASELINE FINDINGS
This chapter presents the key findings from the Nutrition Project baseline survey conducted between November 2014 and February 2015. As described in the design report (Beatty, Borkum et al. 2014), the baseline survey was conducted to: (1) assess whether random assignment was successful in creating equivalent treatment and control groups, and (2) provide estimates of baseline conditions in the study area to inform programmatic decisions.19
In sections A and B, we address the first objective by verifying that households in treatment and control areas were similar at baseline in terms of demographic characteristics and key health outcomes that the Nutrition Project is targeting, also considering Project activities that were already underway. In the rest of the chapter (sections C–G), we address the other key objective of the baseline survey, to provide a description of health services available to the population, utilization of these services, the status of pre- and postnatal nutrition, sanitation conditions, and other health outcomes to inform programmatic decisions.20 In these sections, for simplicity we show results for the full sample (i.e., population level means), instead of breaking down results by treatment and control groups. Although they are not included in the report, we have examined treatment and control differences for the entire suite of constructs we use in the analysis. Differences that are statistically significant are noted in the text.
A. Baseline characteristics of households, pregnant women, caregivers, and children
Households were eligible to be surveyed if there was a pregnant woman in her second or third trimester or child under age 3. A common survey instrument was administered to heads of both types of households. In addition, information was obtained from eligible pregnant women, or from the primary caregiver of the index child.21 The household sample size reported below is the sum of the number of households with eligible pregnant women and/or children under age 3.
At baseline, the treatment and control groups were similar across a range of characteristics and we demonstrate baseline equivalence. (Table III.1 shows sample sizes, means, differences and p-values for characteristics of respondents and their households.) Almost all household heads were male with a mean age of 38 years old. About 40 percent of household heads, and 50 percent of pregnant women and caregivers had completed junior high school (which generally ends at grade seven) or higher. More than two-thirds of household heads identified as Muslim, the predominant religion in Indonesia.22 Pregnant women were on average 26 years old and caregivers were on average 28 years old.
19 An additional benefit of the baseline is that it will allow us to get better precision in the endline impact analysis by adjusting for any kecamatan-level differences that may exist between treatment and control groups at baseline (that may have arisen either by chance or due to program activities that were already underway at baseline). 20 The findings in this chapter were presented to MCA-I and other implementers in August 2015 in order to allow them to make any programmatic changes as soon as possible. 21 The “index” child is the child about whom data were collected in the survey. 22 The other religions in the areas (in order of prevalence) are: Catholic, Protestant, and Hindu.
23

MCC INDONESIA NUTRITION PROJECT IMPACT EVALUATION BASELINE REPORT MATHEMATICA POLICY RESEARCH
Treatment and control groups were also similar in characteristics related to pregnant women and children. Slightly more than 40 percent of the pregnant women were in their second trimester as opposed to their third. (The sample is women in their second and third trimesters.) Approximately 30 percent of pregnant women are pregnant with the first child in the household, and the index child is the first born for 39 percent of caregivers.23 Almost all the caregivers identified as the mother of the index child. The average age of the index child was 17 months, and approximately half of the children were female.
Table III.1 also presents information on the dwellings characteristics of surveyed households, including factors that could affect health outcomes such as the type of cooking fuel (wood smoke is associated with respiratory infections), water sources and treatment practices, and the availability of soap and a toilet. Nearly 90 percent of households reported having electricity. Approximately 75 percent of households owned a motorcycle, an important asset across Indonesia. The only significant difference between the treatment and control groups is that more households in the treatment group reported using wood for cooking fuel (45 percent) compared to households in the control group (38 percent).
Regarding water, sanitation, and hygiene indicators, over 80 percent of households reported having a toilet. Nearly 50 percent of households reported using an improved water source year-round and 80 percent reported that they treated their drinking water.24 More than two-thirds of households had soap near the washing facilities (as observed by the interviewers). We provide more detail on sanitation conditions in Section E.
Table III.1. Demographic, pregnancy, child, and household dwelling characteristics of the baseline sample
Treatment sample
size
Control sample
size Treatment Control Adjusted difference p-value
Household head Female (percentage) 2,280 2,280 1.8 2.7 -0.9 * 0.09 Age (years) 2,280 2,280 38.2 38.6 -0.4 0.46 Muslim (percentage) 2,280 2,280 71.0 70.5 0.5 0.86 Completed junior high (percentage)ª 2,245 2,244 41.0 45.3 -4.3* 0.09
Pregnant woman Age (years) 760 760 26.5 26.5 0.0 0.97 Completed junior high (percentage)ª 759 760 54.0 49.5 4.4 0.26
23 Here we say “first child in the household” because we do not have information on children living outside the household or deceased children. 24 Improved water source is defined according to the WHO and UNICEF Joint Monitoring Program recommendations and included piped water, public taps, tube-wells, boreholes, protected dug wells, protected springs, and rainwater collection. See http://www.wssinfo.org/definitions-methods/watsan-categories/
24

MCC INDONESIA NUTRITION PROJECT IMPACT EVALUATION BASELINE REPORT MATHEMATICA POLICY RESEARCH
Treatment sample
size
Control sample
size Treatment Control Adjusted difference p-value
Second trimester (percentage) 758 757 46.9 43.9 3.0 0.34 Child will be first bornb 760 760 33.4 31.4 2.1 0.43
Caregiver Age (years) 1,516 1,518 28.3 28.3 0.0 0.97 Completed junior high (percentage)ª 1,515 1,518 49.0 51.1 -2.1 0.45 Caregiver is the child’s mother (percentage) 1,519 1,520 98.5 98.4 0.1 0.93 Child age (months) 1,494 1,502 16.6 16.8 -0.2 0.66 Child is female (percentage) 1,519 1,520 51.2 49.9 1.3 0.53 Child is first bornb 1,498 1,509 39.3 39.3 0.0 0.99
Household dwelling characteristics House has electricity 2,280 2,280 87.7 87.7 -0.1 0.96 Has a motorcycle 2,280 2,279 77.1 75.1 2.0 0.39 Uses wood as primary cooking fuel 2,280 2,280 43.8 37.7 6.1* 0.07 Uses an improved water source 2,280 2,280 49.8 46.8 3.1 0.35 Treats water 2,280 2,278 81.8 79.5 2.2 0.33 Soap is observed 2,233 2,253 69.5 70.9 -1.4 0.57 Household has toilet 2,278 2,280 84.5 85.6 -1.1 0.60
Source: Household, pregnant woman, and caregiver baseline surveys, 2015. ª This means that the individual has completed junior high or above. In Indonesia, junior high is most commonly called SMP (Sekolah Menengah Pertama) and usually ends at grade 7. b Although this says “first born,” we do not account for deceased children or those living outside the household due to questionnaire limitations. * / ** / *** Significantly different from zero at the .10 / .05 / .01 level, two-tailed test.
B. Generasi implementation progress at the time of the baseline
As described in Chapter I, the Nutrition Project is comprised of three main activities: expanding the Generasi program (the community project activity), a set of supply-side initiatives targeting health providers, and a national communications campaign. Two project components had started at the time of the baseline survey: the Generasi program, and provider training. (Provider training falls under the supply-side activity.) In this section we discuss Generasi implementation progress (and the next section discusses the provider training results). We find very few indications that the community mobilization process initiated by Generasi or the funds the program provided had started to affect supply of, or demand for, health services.
1. Some Generasi activities had started by the time of the baseline survey Our surveys included information not just on Generasi key performance indicators but also
on some of Generasi’s implementation milestones discussed in Chapter I, such as training a desa-level Generasi volunteer (KPMD), holding a meeting across desa (MAD meeting), and 25

MCC INDONESIA NUTRITION PROJECT IMPACT EVALUATION BASELINE REPORT MATHEMATICA POLICY RESEARCH
developing a proposal and budget plan for how to spend Generasi funds. While these activities are important for initiating the program, one would not expect them to induce health behavior change since they are largely centered around planning and soliciting community input regarding how to best use Generasi funds. Because it was anticipated that some Generasi activities would begin in late 2014, it is not surprising that we find that almost all treatment desa had begun some program activities at the time of the baseline survey, November 2014 to February 2015. These milestone activities had taken place in nearly all treatment desa (Figure III.1).
However, despite the fact that these startup activities had occurred, just over half of the treatment desa had received the first tranche of funding and 23 percent had received the second tranche by the time of the baseline survey. (Each desa receives two tranches total and both were expected in 2014.) The funding trigger is important because once desa receive funds they are then able to start the demand-side activities, such as promoting posyandu sessions or transporting pregnant women to skilled providers for check-ups and delivery. While receipt of funds at the desa level signals the potential start of project activities that could affect household level behavior, we do not expect this to be a major threat to the integrity of the baseline because of the time lag between the disbursement of funds, initiation of activities, and its impact on household outcomes. Further, only 5 percent of desa received the first tranche of funding more than a month before the baseline survey, and thus we wouldn’t expect—nor do we find—key outcomes like stunting to be affected in that time period.
Figure III.1. Nearly all treatment desa had developed a plan for utilizing Generasi funds and over half received funds
Source: KPMD and Kepala Desa baseline surveys, 2015. Sample size: 380.
In addition, although most treatment desa had been exposed to the Generasi program, including hosting public meetings, evidence from the household surveys suggest that households in the treatment desa were still largely unaware of Generasi at baseline. Over 60 percent of
88%92% 91%
57%
23%
0
20
40
60
80
100
KPMD receviedtraining
Inter-desa MADmeeting held
Developed aproposal andbudget plan
Received firsttranche of funding
(BLM)
Received secondtranche of funding
(BLM)
Per
cent
age
of tr
eatm
ent d
esa
26

MCC INDONESIA NUTRITION PROJECT IMPACT EVALUATION BASELINE REPORT MATHEMATICA POLICY RESEARCH
households in treatment desa had not heard of Generasi, and over 80 percent of households in treatment desa were not aware that Generasi activities had taken place in their desa (Figure III.2). Participation in Generasi was even more uncommon, with only 7 percent of households in treatment desa reporting that any household member had participated in a Generasi activity.25
Figure III.2. The vast majority of treatment households in treatment areas were not aware of or participating in Generasi activities
Source: Household baseline survey, 2015. Sample size: 2,280.
Using the kepala desa and household questionnaires, we explored whether respondents in control areas reported receiving the program. Of the kepala desa respondents in control areas, only eight stated that their desa was part of the Generasi program. Four of these were from the one kecamatan that, as discussed in Chapter III, had not complied with the randomization and was granted the project in a non-random way prior to the baseline.26 The other four desa are in separate kecamatan and we hypothesize that this is due to reporting error on the part of the kepala desa (i.e., either the kepala desa misunderstood the question or mistook Generasi for another project) as this reported participation is not corroborated by any other surveys or respondents. At the household level, 0.8 percent of control households (22 respondents) said they participated in Generasi; however, very few of these are in the same kecamatan and thus we believe this report of participation is due either to reporting error, misunderstanding, or to these households participating in Generasi outside of their kecamatan.
2. Posyandu activities were mostly unaffected by the Nutrition Project at baseline The poysandu is the primary vehicle for monitoring child growth and development of
children under 5 in Indonesia and thus improving access to and quality of posyandu services is a key focus of Generasi and the Nutrition Project. As discussed in Chapter I (Box I.1), receiving IFA and Vitamin A, monthly weighing, and attending kelas ibu hamil and kelas balita (pregnant
25 For control areas, these percentages were: Heard of Generasi 16 percent; aware that Generasi activities took place in desa 4 percent; and 1 percent participated in Generasi activity. 26 We will use the assigned (control) status in the impact analysis.
37%
17%7%
0
20
40
60
80
100
Heard of Generasi Aware that Generasi activitiestook place in desa
Participated in Generasi activity
Per
cent
age
of tr
eatm
ent
hous
ehol
ds
27

MCC INDONESIA NUTRITION PROJECT IMPACT EVALUATION BASELINE REPORT MATHEMATICA POLICY RESEARCH
women and young child classes) are Generasi indicators. Generasi measures performance on these as reported by pregnant women and caregivers and we demonstrate performance on Generasi indicators as reported by these same respondents in Table III.3. We also highlight Project performance on key indicators related to the posyandu as reported largely by the kader posyandu, since the availability of services is the first step to encouraging greater household utilization (Table III.2). (And we note these performance differences for treatment and control groups.)
We find significant differences between the treatment and control group for three indicators: the share of pregnant woman who have a mother and child handbook (buku KIA or KMS); the share of caregivers who have buku KIA or KMS; and in the stock of Taburia, a micronutrient powder.27 28 Nearly 8 percent of posyandu in control areas whereas 5 percent of posyandu in treatment areas were stocked with Taburia. The share of pregnant women with a buku KIA/KMS was 66 percent in treatment areas, which is 12 percentage points higher than in control areas. The share of caregivers who have a buku KIA/KMS for the index child is 60 percent among the treatment group, 6 percentage points higher than in the control group.
We hypothesize that the significant difference in children’s buku KIA/KMS possession is due to more of the community accessing posyandu services, as promoted by Generasi. This is corroborated by the significant difference in monthly weighing visits shown in Table III.3 across treatment and control groups. When children are weighed they are given a buku KMS, so more children accessing monthly weight checks should also increase along with the possession of a buku KMS. While pregnant women without other children do not attend posyandu, it is possible that the higher rates of buku KIA/KMS possession among pregnant women could be due to Generasi project outreach that occurred prior to the baseline survey.29
There are no significant differences in other indicators across treatment and control groups. The results for the level of services provided by posyandu are mixed. Nearly all posyandu provided weighing services, a core function of the posyandu. Vitamin A distribution was also high, with over 90 percent of posyandu having done this in the last six months. The results for IFA are less promising, with just under 70 percent of posyandu distributing IFA to pregnant women in the past month. Over a quarter had a verified stock of Oralit (oral rehydration packets). Fewer than a third of posyandu reported ever holding a kelas ibu hamil, and only approximately 20 percent had ever held a kelas balita.
27 The buku KIA is roughly translated as the mother and child health book, and is more commonly used during pregnancy. Buku KMS is roughly translated as the becoming healthy chart, and generally more common after birth as it includes the growth monitoring chart. 28 We do not expect that this difference is due to project implementation, since no Taburia had been distributed at the time of the baseline. We do not have an explanation for why control kecamatan had significantly more Taburia and expect this is due to chance. 29 Because we see these as Generasi effects, we will not control for these differences in conducting the endline impact analysis.
28

MCC INDONESIA NUTRITION PROJECT IMPACT EVALUATION BASELINE REPORT MATHEMATICA POLICY RESEARCH
Table III.2. Posyandu activities were mostly unaffected by the Nutrition Project at baseline
Posyandu activities Treatment
sample size Control
sample size Treatment
mean Control mean Difference
p-value
Pregnant woman has buku KIA/KMS 760 760 65.5 53.7 11.8*** 0.00 Child has buku KIA/KMS 1,515 1,519 58.0 52.4 5.6* 0.09 Weighing provided 380 380 95.7 95.9 -0.2 0.87 Distributed vitamin A in past 12 months 364 368 92.1 93.6 -1.5 0.51 Distributed IFA in past 6 months 333 325 60.7 65.9 -5.2 0.199 Had stock of Taburia 364 368 5.1 8.7 -3.6* 0.074 Had stock of Oralit 364 368 26.5 -3.1 0.39 Ever held kelas ibu hamil 364 368 31.0 31.5 -0.5 0.91 Ever held kelas balita 364 368 18.0 18.1 -0.1 0.98
Source: Pregnant women, caregiver, and kader posyandu baseline surveys, 2015. * / ** / *** Significantly different from zero at the .10 / .05 / .01 level, two-tailed test.
3. Performance on Generasi indicators was largely unaffected at baseline In this section we examine the results for the Generasi key performance indicators (KPI)
shown in Chapter I Box I.1 as reported by pregnant women and caregivers, the same respondents supplying information for Generasi program monitoring. These results are found in Table III.3. We found two baseline differences in performance on pre- and postnatal indicators between treatment and control desa that are related to weighing children and immunizations. The percentage of caregivers who reported attending monthly weighing sessions was significantly higher by 14 percentage points in treatment desa than in control desa. This suggests that Generasi volunteers may have been successful in promoting the utilization of weighing services at the posyandu by the time the baseline was conducted.30,31
30 Again, because we interpret these as effects of Generasi, we will not control for these differences in the endline analysis. 31 Many of the KPIs examine results for an age range of children older than could have possibly been affected by the project, and thus the inclusion of relatively older children in the indicators may hide differences between treatment and control indicators because of the relatively short period of time since program start. To investigate this, we also test for differences between treatment and control indicators looking at subsets of younger children (who were born more recently). The only significant difference we find is for the proportion of children age 0–11 months who were weighed in the last month, in which children living in treatment areas are more likely to be weighed (85 percent) than children living in control areas (71 percent). This finding is consistent with the significant difference in children age 0–23 months being weighed (the KPI).
29

MCC INDONESIA NUTRITION PROJECT IMPACT EVALUATION BASELINE REPORT MATHEMATICA POLICY RESEARCH
Table III.3. Performance on Generasi KPIs was balanced across treatment and control kecamatan with the exception of weighing and immunization
Generasi indicator (percentage of women or children)
Treatment sample size
Control sample
size Treatment
mean Control mean Difference
p-value
1. Four prenatal visitsa 251 252 43.2 35.7 7.5 0.21 2. Received 90 iron pills
during pregnancya 252 257 27.2 24.8 2.3 0.64 3. Delivery by trained
professionala 255 255 69.1 68.7 0.4 0.94 4. Three postnatal visitsa 255 255 8.3 10.6 -2.3 0.50 5. Complete childhood
immunizationsb 958 958 31.5 41.2 -9.7 *** 0.01 6. Weighed in last monthc 982 982 58.5 44.5 14.1*** 0.00 7. Vitamin A twice / yeard 1,223 1,223 28.2 26.7 1.5 0.56 8. Ever attend kelas ibu
hamila 255 255 15.7 10.3 5.5 0.19 9. Husband ever attend kelas
ibu hamila 255 255 2.3 1.3 1.0 0.45 10. Ever attend kelas balitac 1,030 1,030 7.9 6.7 1.2 0.52 11. Husband ever attend kelas
balitac 1,030 1,030 1.2 0.5 0.7 0.36
Source: Caregiver and pregnant woman baseline surveys, 2015. Notes: The indicators for postnatal visits, monthly weighing, Vitamin A receipt, and kelas ibu hamil and kelas balita
attendance differ from the Generasi KPI indicators due to data limitations. The indicator for postnatal visits measures the total number of postnatal visits whereas the KPI indicator measures visits within particular weeks after birth. The indicator for monthly weighing measures weighing in the last month whereas the KPI indicator measures weighing over the last three months. The indicator for Vitamin A receipt measures receipt over the course of the child’s life whereas the KPI indicator measures receipt over the last year. The indicators for kelas ibu hamil and kelas balita attendance (for both mother and husband) measures whether the respondent has ever attended whereas the KPI indicator measures monthly attendance.
a Among children/mothers of children 0–5 months of age. b Among children 12–35 months of age. c Among children/mothers of children 0–23 months of age. d Among children 6-35 months of age. * / ** / *** Significantly different from zero at the .10 / .05 / .01 level, two-tailed test.
The share of children receiving the complete suite of childhood immunizations was over 9 percentage points higher in control areas—32 percent in treatment areas and 41 percent in control areas.32 For further detail, Figure III.3 shows the percent of children vaccinated by vaccine type.33 At least 70 percent of children had received the correct number of doses (age adjusted) for each of three vaccines: diphtheria, pertussis, and tetanus (DPT); Bacillus Calmette-
32 We do not have an explanation for this difference, especially since it would take many years for Generasi to have an impact on this indictor, and suspect it is due to chance. 33 Note that the difference in rates of fully immunized children between Table III.3 and Figure III.3 is due to the fact that Figure III.3 shows the overall mean, not broken down by treatment and control.
30

MCC INDONESIA NUTRITION PROJECT IMPACT EVALUATION BASELINE REPORT MATHEMATICA POLICY RESEARCH
Guérin (BCG); and measles.34 However, 37 percent of children had not received a polio vaccine, and over 60 percent had not received a vaccination for Hepatitis B by the age recommended by the WHO.
Figure III.3. Many children had not received recommended vaccines
Source: Caregiver baseline survey, 2015. Sample size: 3,039.
On all other measures of pre- and postnatal care targeted by the program, pregnant women and young children in treatment desa were not significantly more likely than those in control desa to receive the recommended service. For example, pregnant women in treatment desa were no more likely than those in control desa to have received four prenatal visits or to have received iron tablets during pregnancy.
The current performance on the Generasi KPI indicates room for improvement. Prenatal care still doesn’t reach the majority of women. Approximately 40 percent of women received the recommended number of prenatal visits35 and only a quarter of women reported receiving 90 IFA pills during pregnancy.36 Postnatal care is even less common with just around 10 percent of women having received the recommended number of postnatal visits. Very few pregnant women
34 Using the WHO recommendations (http://www.who.int/immunization/policy/Immunization_routine_table2.pdf?ua=1), we counted a child as having completed their age-adjusted doses for a given vaccine if they had as many doses as the WHO recommended by their current age. 35 The KPI is four prenatal visits (1x in the first trimester, 1x in the second trimester, and 2x in the third trimester), thus the 40 percent is using this definition. However if one looks at women having at least four prenatal visits at any time during pregnancy, this figure is 70 percent. 36 The KPI is receiving at least 90 tablets during the pregnancy. However 76 percent of mothers received at least some IFA tablets during their pregnancy.
37%
63%
70%
80%
73%
34%
37%
0 20 40 60 80 100
Hepatitis B
Polio
DPT
BCG
Measles
All vaccination by current age
All vaccinations between 12 and 35months
Percentage of children with recommended vaccinations
31

MCC INDONESIA NUTRITION PROJECT IMPACT EVALUATION BASELINE REPORT MATHEMATICA POLICY RESEARCH
and their male partners attended kelas ibu hamil (between 10 and 15 percent) and even fewer caregivers (who are overwhelmingly female) and their male partners attended kelas balita.
The limited availability of some posyandu services, like IFA distribution or holding kelas balita or ibu hamil, may help explain the low performance of sample desa on some Generasi indicators of pre- and postnatal care, but the baseline data also suggest that pregnant women and caregivers often do not use services even when they are available. For example, in desa where posyandu had held kelas ibu hamil or kelas balita, only 10 percent of pregnant women and 11 percent of caregivers had attended their respective classes. Similarly, even though over 90 percent of posyandu offered weighing, as shown in Table III.2, just approximately 50 percent of caregivers reported having their children weighed in the last month. This suggests that improving the pre- and postnatal care in treatment desa is likely going to require not only improvements in the availability and quality of services but also improvements in utilization of those services, a key objective of Generasi.
C. Health care service provision and access
With the inclusion of Generasi, the Nutrition Project focuses on demand-side interventions such as helping community better access services. However, such demand-side interventions are unlikely to be effective without adequate supply and access. In this section we explore several topics related to health service supply and access: (1) how difficult it is for target communities to access puskesmas, bidan, and posyandu services; (2) whether women have decision-making power over their health and nutrition decisions; (3) whether puskemas have adequate staff and supplies to fulfill the basic services targeted by the Nutrition Project; and (4) service provider (bidan and kader posyandu) training experience on topics covered by the MCA-I IYCF training. Note that in this section and beyond, because we have demonstrated baseline equivalence above, we show results for the full sample (i.e., population level means) instead of breaking down results by treatment and control groups. (We do, however, note in the text any significant differences we found between these two groups.)
1. Key maternal and child health services appear to be accessible in terms of proximity and cost The most fundamental factors that influence service access are travel time and cost, and we
find that travel time and cost were relatively low. Not surprisingly, high proportions of households live in desa with posyandu (92 percent) and desa-level health posts (polindes or poskesdes) (87 percent), and travel a median of 15 minutes or less to key health services (Table III.4).37 The cost was also low, with no cost to travel to the posyandu or polindes, and very minimal cost to travel to the puskesmas or bidan.38 Accessibility to the bidan is corroborated by reports from the bidan. Over 75 percent of bidan live in the same desa where
37 A polindes is a village-level maternal health post or birthing clinic and a poskesdes is a general village health clinic. 38 The minimum wage for West Kalimantan in 2015 is Rupiah 1,560,000/month or 78,000/day. Thus, 4,000 Rupiah is 1/20th of a daily wage and relatively inexpensive. See http://www.wageindicator.org/main/salary/minimum-wage/indonesia.
32

MCC INDONESIA NUTRITION PROJECT IMPACT EVALUATION BASELINE REPORT MATHEMATICA POLICY RESEARCH
they work (Table III.5). Bidan’s availability may depend on how many other desa they work in, the number of other bidan available in the area or their case load. But none of these factors seem to be acute in the sample provinces. Just a quarter of bidan reported working in another desa, there was on average one other bidan in the desa, and bidan were on average serving about 12 patients at the time of interview.
Table III.4. Most pregnant women and caregivers do not need to travel far or pay high transport costs to access basic maternal and child health services
Sample size (N=) Full sample median Standard deviation
Travel time (minutes)
Puskesmas 2,149 15 2.17 Polindes 1,018 10 1.39 Bidan 1,357 10 2.42 Posyandu 3,361 9 1.07
Travel cost (rupiah)
Puskesmas 2,153 4,000 3,686.72 Polindes 1,018 0 2,597.41 Bidan 1,366 3,000 1,281.72 Posyandu 3,366 0 287.78
Source: Household baseline survey, 2015. Notes: One U.S. dollar is approximately 14,000 Rupiah. Sample is respondents who report having visited these facilities.
Table III.5. Bidan appear to be accessible in terms of proximity and work load
Sample size
(N=) Full sample
mean Standard deviation
Live in desa where they work 570 76.8 2.10 Work in at least one other desa 569 23.0 2.20 Number of other bidan working in desa 568 1.0 0.07 Number of pregnant women currently serving 567 12.1 0.62
Source: Bidan baseline survey, 2015.
2. The overwhelmingly majority of women have decision making authority over health and nutrition decisions Another aspect of access for maternal and child health services is the ability of women to
make decisions about issues that affect their health and that of their children.
Most women reported having at least some say in the health and nutrition decisions that affect them and their children. Approximately 90 percent of caregivers and pregnant women reported being part of the decision-making process over their own healthcare and a similar share reported being part of the decision-making process for their children’s healthcare (Figure III.4). Caregivers and pregnant women also had agency with regards to food, albeit less with regard to
33

MCC INDONESIA NUTRITION PROJECT IMPACT EVALUATION BASELINE REPORT MATHEMATICA POLICY RESEARCH
food expenditures. Sixty-four percent of women reported helping decide how much money to spend for food, and 85 percent reported helping decide what food would be eaten.
Figure III.4. Women had agency over decisions that affect them and their children
Source: Pregnant woman and caregiver baseline surveys, 2015. Sample size: 4,554.
3. Most puskesmas had the staffing, equipment, and supplies needed to fulfill basic services related to the Nutrition Project The puskesmas is the primary, government-run health facility serving a kecamatan.
Puskesmas provide maternal and child heath, outpatient, and preventative care. The puskesmas staff relevant to Nutrition Project activities are bidan or bidan coordinator (who manages the desa-level bidan), nutritionist, and sanitarian. Here we look at whether puskesmas are indeed staffed with these personnel. Other indications of puskesmas quality are having a general practitioner and nurse on staff. We find that 88 percent of puskesmas were staffed by at least one full or part-time general practitioner, and all puskesmas had at least one nurse and bidan on staff working full or part time (Figure III.5, Panel A). Nutritionists and sanitation officers were each employed in more than 70 percent of facilities, and around two-thirds of facilities employed both types of officers.39
39 The results of the sanitarian and nutritionist surveys are consistent with the staffing patterns reported by puskesmas administrators. At the time of data collection, 88 percent of the people who responded to the nutritionist survey said they were the nutritionist at the puskesmas (as opposed to serving in some other capacity such as the head of puskesmas, a doctor, or nurse for example), whereas 84 percent of the respondents to the sanitarian survey said they were the puskesmas sanitarian. There is no specific degree or certification to be a sanitarian, but 86 percent of nutritionists reported having a degree in nutrition.
90%
64%
85% 88%
0
20
40
60
80
100
Child's healthcare Food expenditures Food eaten at home Own healthcare
Per
cent
age
of w
omen
mak
ing
hous
ehol
d de
cisi
ons
34

MCC INDONESIA NUTRITION PROJECT IMPACT EVALUATION BASELINE REPORT MATHEMATICA POLICY RESEARCH
Figure III.5. Most puskesmas had the staffing, equipment, and supplies needed to implement the project
Panel A: Staffing
Panel B: Equipment
Panel C: Nutritional supplies
Source: Puskesmas baseline survey, 2015. Sample size: 251.
100%88%
100%
79%72%
62%
0
20
40
60
80
100
Bidan GeneralPractitioner
Nurse Nutritionist Sanitarian Nutritionist andSanitarian
Per
cent
age
of p
uske
smas
sta
ffed
by a
t lea
st o
ne fu
ll or
par
t tim
e pr
actit
ione
r
97% 100% 99% 95%
80%
95% 98%
0
20
40
60
80
100
Baby scale Adult scale Heightmeasurement
device
Length takingdevice
Hemoglobinmeter
Delivery kit Refrigerator (forvaccines)
Per
cent
age
of p
uske
smas
sto
cked
w
ith m
edic
al s
uppl
ies
94%
60%
96% 94%
18%
48%
10%16%
0
20
40
60
80
100
IFA Taburia Oralit Vitamin A
Per
cent
age
of p
uske
smas
Supplies in stock at the time of the baseline survey Reported stock out in last 3 months
35

MCC INDONESIA NUTRITION PROJECT IMPACT EVALUATION BASELINE REPORT MATHEMATICA POLICY RESEARCH
Most puskesmas also possessed the equipment needed to provide basic maternal and early child health services (Figure III.5, Panel B). Ninety-seven percent of facilities had a baby scale, all had an adult scale, and almost as many had height or length measurement devices.40 Nearly all (95 percent) puskesmas also had delivery kits.41 Despite the high presence of weight and length taking instruments, 20 percent of facilities did not have a hemoglobin meter to test for anemia. Refrigerators (for vaccines) were present in over 98 percent of facilities, and almost all facilities reported having at least some access to electricity, but only half had electricity during at least 75 percent of their operating hours.
Along with posyandu, puskesmas are also responsible for distributing key vitamin supplements for pregnant women and children. In fact, puskesmas often supply posyandu with IFA, Taburia, Oralit, and Vitamin A. Overall, very high percentages of puskesmas (94 percent and above) were stocked with IFA, Oralit, and Vitamin A, and few (18 percent or fewer) of puskesmas reported being out of stock for these same supplements over the last three months (Figure III.5, Panel C). Taburia was less common. It was only available in 60 percent of puskesmas, and half of puskesmas reporting having run out of Taburia in the past three months.
3. High proportions of service providers have been trained Even if services are accessible and equipped, improving health outcomes also depends on
the quality of service providers, and one input into quality is the training they have received. In this section we look at the training and experience of service providers, focusing on kader posyandu and bidan. The baseline survey also included an extensive set of questions regarding their knowledge of topics covered in the MCA-I IYCF training. Results comparing the practitioner answers and the correct answers from the IYCF training manuals can be found in Appendix C. We find that bidan knowledge of topics covered at the IYCF training at baseline is overall quite high. Not surprisingly, kader posyandu know less about IYCF and demonstrate a need for training.
Kader posyandu are by definition volunteers who run the posyandu sessions once a month and are not required to have a particular standard of health education or training. But, as mentioned above, the posyandu is a central entity responsible for helping to improve maternal and child health in Generasi and thus the Project expects kader posyandu to take on a wide range of responsibilities. Moreover, because the Nutrition Project offers training for the kader posyadu, we examine the training that they have received and desire. We discuss results by treatment and control status because we find some significant differences, namely in training they received in 2014-5 and training funded by MCA-I.
The vast majority—over 75 percent—of kader posyandu had ever received any training related to their work (Table III.6). This number is even higher at around 90 percent for bidan, and 85 percent of bidan reported having the professional certification of midwife training college (akademi bidan) or certified professional midwife. The higher training rates are likely explained by the fact that becoming a bidan requires professional certification and that bidan on average
40 The availability of medical equipment in good working order was verified by the data collection teams. 41 This kit should include a clamp, scalpel blade, sterile surface, and sterilizing hand wipes, and should be found at any puskesmas.
36

MCC INDONESIA NUTRITION PROJECT IMPACT EVALUATION BASELINE REPORT MATHEMATICA POLICY RESEARCH
have about 10 years of work experience. Similar rates of puskesmas sanitarians (86 percent) and nutritionists (91 percent) reported receiving additional training in relation to their job beyond their degree program.42
Significant differences between these staff in treatment and control areas arise in more recent training. The percentage of kader posyandu who reported receiving any type of training in 2014 was over 14 percentage points higher in the treatment areas than in the control areas (53 percent versus 39 percent), a statistically significant difference. Nine percent of kader posyandu in treatment desa reported having received training on ICYF funded by MCA-I specifically, although the fact that three percent of control kader posyandu also reported receiving this training raises the question of whether kader posyandu were able to correctly identify the sponsor of the training.43 Bidan training levels in 2014 are higher in treatment areas but the difference is not statistically significant. However, as with kader posyandu, the MCA-I-funded training is slightly larger in treatment areas and statistically significant. As discussed in Chapter I Table I.1, the MCA-I-supported IYCF training had begun at baseline, so it is possible that the differences shown here reflect the MCA-I IYCF training.
Table III.6. The overwhelming majority of bidan and kader posyandu have received training, and half received training in 2014
Respondent Treatment
sample size Control
sample size Treatment
mean Control mean Difference
p-value
Kader posyandu Ever received any training 364 368 76.3 70.4 5.9 0.11 Received training in 2014 363 368 52.9 38.5 14.4*** 0.00 Received training on IYCF funded by MCA-I 364 368 8.8 3.0 5.8*** 0.01
Bidan Ever received any training 285 285 89.2 88.8 0.4 0.86 Received training in 2014 285 285 48.4 46.0 2.5 0.57 Received training on IYCF funded by MCA-I 285 285 2.8 1.1 1.8 0.19 Years worked as bidan 285 285 9.1 9.4 -0.3 0.57 Had CPM or Akademi Bidan certification 285 285 85.7 86.7 -1.0 0.73
42 For sanitarians, since they do not necessarily have a relevant degree, the additional training they have received might be the only relevant training they have. Although a high share of sanitarians reported receiving training, training on topics relevant for the Nutrition Project was fairly rare, with 35 percent of sanitarians having been trained on how to trigger communities. A similar share had been trained on the importance of sanitation and slightly fewer (less than 30 percent) on how to promote proper sanitation and hygiene in the community. Very few sanitarians (less than 15 percent) reported having been trained on other topics relevant to the Nutrition Project such as proper handwashing, how to treat diarrhea, or mother and child nutrition. 43 Another possible interpretation is that targeting was not entirely correct and some control kader posyadu did receive training sponsored by MCA-I.
37

MCC INDONESIA NUTRITION PROJECT IMPACT EVALUATION BASELINE REPORT MATHEMATICA POLICY RESEARCH
Figure III.6. shows the topic areas covered in kader posyandu training.44 Kader posyandu appear to have relatively high levels of training on core posyandu functions such as growth monitoring, immunizations and general child feeding, but it is still concerning that almost 40 percent have not been training on these key topics. Kader posyandu seem to be less familiar with antenatal care with just 27 percent of kader posyandu having been trained on that topic, which would make sense given their focus on young children more than antenatal care.
Figure III.6. Kader posyandu have relatively high levels of training on core posyandu functions
Source: Kader posyandu baseline survey, 2015. Sample size: 732.
D. Nutrition
Because stunting reflects the cumulative effects of the mother’s health during pregnancy, and mother and child health after birth, in this section we discuss early childhood and maternal nutrition as a precursor to stunting. In particular, we assess household food security (whether
44 Similar training information is not provided for bidan since the survey question asked about training received outside of their education, and it is hard to determine what skills the bidan lack since these same topics could have been covered in their formal professional training. The same is true for nutritionists. It is notable, however, that a high share of nutritionists reported receiving additional training beyond their degree program and yet few nutritionists reported that those additional trainings focused on topics relevant to the Nutrition Project such as prenatal nutrition or complementary feeding (less than 20 percent for each topic), or even identifying or treating underweight or stunted children (less than 30 percent for each topic). Only one percent of nutritionists reported beign trained on how to involve men in feeding and caregiving.
27%
51%
58%
61%
62%
62%
0 20 40 60 80 100
Antenatal Care
Sanitation
Immunizations
Complementary feeding
Growth moitoring
Breastfeeding
Percentage of kader posyandu receving training
38

MCC INDONESIA NUTRITION PROJECT IMPACT EVALUATION BASELINE REPORT MATHEMATICA POLICY RESEARCH
there is enough food to eat); children’s and pregnant women’s dietary diversity (whether the diet is sufficiently nutritious); breastfeeding practices and knowledge, including the bidan’s role in breastfeeding; and use of micronutrients.
1. Households experienced varying degrees of food insecurity but diets included a variety of food groups In order to assess household food security, we used data collected from the household
survey to create a food security indicator. The indicator is based on the Household Food Insecurity Access Scale (HFIAS)45, an internationally-validated household food insecurity access scale, which categorizes households as experiencing varying degrees of food insecurity (mild, moderate, or severe) based on how often (rarely, sometimes, often) households practiced each of a set of nine behaviors over the past four weeks. The nine behaviors range from worrying about having enough to eat (indicative of mild food insecurity if the household reports this behavior sometimes or often), to eating smaller or fewer meals due to a lack of food (indicative of moderate food insecurity if the household reports this behavior rarely or sometimes, and severe insecurity if this behavior occurs often), to any member of the household going a whole day and night without eating due to lack of food (indicative of severe food insecurity, regardless of frequency). Both the household survey and the HFIAS indicator use a four week recall period and ask whether any member of the household practiced the behaviors in question. Due to time constraints, the household survey included only five of the nine questions about behaviors for coping with not having enough to eat.46 Thus, the data provide a lower bound on the rates of food insecurity that would be identified by the full HFIAS since the modified indicator does not include households who would have been classified as food insecure on the basis of the excluded behaviors.47
As shown in Figure III.7, households reported a number of behaviors that suggest varying degrees of food insecurity. Around a third of households reported worrying about not having enough food and slightly more households reported eating a limited variety of foods. Approximately a quarter reported eating smaller meals than desired and a fifth reported eating fewer meals than desired. Ten percent of households reported ever going to sleep hungry.48
45 http://www.fantaproject.org/sites/default/files/resources/HFIAS_ENG_v3_Aug07.pdf, pages 13-20, accessed October 12, 2015. 46 The four behaviors not included in the baseline survey are being unable to eat preferred foods (indicative of mild food insecurity if reported rarely, sometimes, or often), eating foods that you do not want to (indicative of mild food insecurity if reported rarely and moderate food insecurity if reported sometimes or often), running out of food at home because of a lack of resources and going a whole day and night without eating because there was not enough food (the latter two behaviors are indicative of severe food insecurity if they ever occur). The behaviors included in the baseline survey are shown in Figure III.7 and follow similar coding of frequency of behavior into severity as the excluded behaviors. 47 To the extent that households respond with multiple behaviors, they could already be classified as food insecure based on the behaviors included in the survey. Only a household that responded to food insecurity with the excluded behaviors and none of the included behaviors (or with the included behaviors less frequently than the excluded behaviors) would not be classified with the correct level of food insecurity according to our measure. 48 Significantly more households in treatment areas reported going to sleep hungry relative to control households (11.3 percent versus 8.7 percent, respectively; p-value 0.03).
39
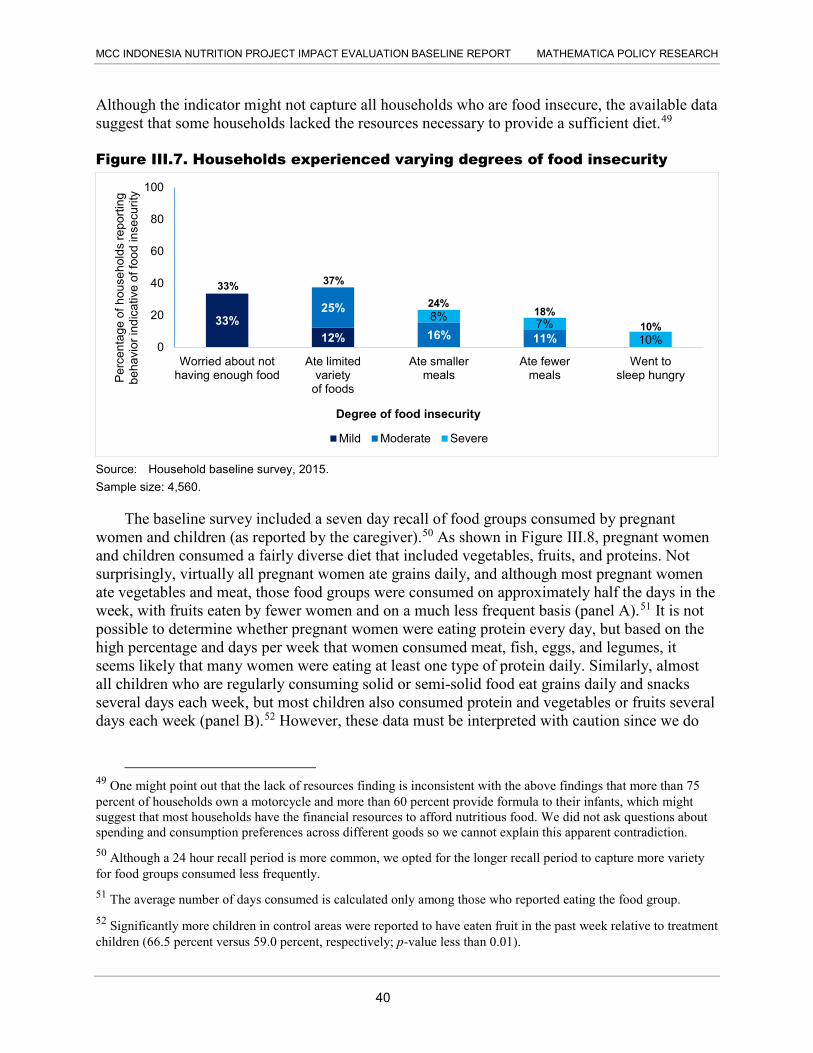
MCC INDONESIA NUTRITION PROJECT IMPACT EVALUATION BASELINE REPORT MATHEMATICA POLICY RESEARCH
Although the indicator might not capture all households who are food insecure, the available data suggest that some households lacked the resources necessary to provide a sufficient diet.49
Figure III.7. Households experienced varying degrees of food insecurity
Source: Household baseline survey, 2015. Sample size: 4,560.
The baseline survey included a seven day recall of food groups consumed by pregnant women and children (as reported by the caregiver).50 As shown in Figure III.8, pregnant women and children consumed a fairly diverse diet that included vegetables, fruits, and proteins. Not surprisingly, virtually all pregnant women ate grains daily, and although most pregnant women ate vegetables and meat, those food groups were consumed on approximately half the days in the week, with fruits eaten by fewer women and on a much less frequent basis (panel A).51 It is not possible to determine whether pregnant women were eating protein every day, but based on the high percentage and days per week that women consumed meat, fish, eggs, and legumes, it seems likely that many women were eating at least one type of protein daily. Similarly, almost all children who are regularly consuming solid or semi-solid food eat grains daily and snacks several days each week, but most children also consumed protein and vegetables or fruits several days each week (panel B).52 However, these data must be interpreted with caution since we do
49 One might point out that the lack of resources finding is inconsistent with the above findings that more than 75 percent of households own a motorcycle and more than 60 percent provide formula to their infants, which might suggest that most households have the financial resources to afford nutritious food. We did not ask questions about spending and consumption preferences across different goods so we cannot explain this apparent contradiction. 50 Although a 24 hour recall period is more common, we opted for the longer recall period to capture more variety for food groups consumed less frequently. 51 The average number of days consumed is calculated only among those who reported eating the food group. 52 Significantly more children in control areas were reported to have eaten fruit in the past week relative to treatment children (66.5 percent versus 59.0 percent, respectively; p-value less than 0.01).
33%12%
25%
16% 11%
8% 7%10%0
20
40
60
80
100
Worried about nothaving enough food
Ate limitedvariety
of foods
Ate smallermeals
Ate fewermeals
Went tosleep hungryP
erce
ntag
e of
hou
seho
lds
repo
rting
be
havi
or in
dica
tive
of fo
od in
secu
rity
Mild Moderate Severe
33% 37%
24% 18%
10%
Degree of food insecurity
40

MCC INDONESIA NUTRITION PROJECT IMPACT EVALUATION BASELINE REPORT MATHEMATICA POLICY RESEARCH
6.9 1.9 4.2 2.3 4.2 3.4 3.4 5.4 3.1 6.1 4.2 3.4
Figure III.8. Pregnant women and children consumed a fairly diverse diet that included protein, fruits, and vegetables
Panel A. Most pregnant women consumed a fairly diverse diet
Source: Pregnant woman baseline survey, 2015. Sample size: 1,520. Note: One percent of pregnant women did not consume any protein source in past 7 days
Panel B. Children ate a lot of snacks and grains but also consumed protein, fruits, and vegetables
Source: Caregiver baseline survey, 2015. Note: Figure only represents children who have eaten semi-solid and/or solid foods regularly. * Includes only those who reported eating the specified food group. Grains: Cooked rice, bread, noodles, or other grains. White starches: Roots (cassava, yams, breadfruit, etc.). Snacks: Cake, crackers, etc. Sample size: 2,560. Note: Thirteen percent of children did not consume any protein source in past 7 days
4%
72%
96%
70%
33%
73%
77%
88%
58%
94%
45%
99%
0 20 40 60 80 100
Palm oil
Sugar
Oil fats
Legumes
Dairy
Eggs
Fish
Meat
Fruits
Vegetables
White starches
Grains
Percentage of pregnant women consuming each food group in past 7 days
85%
14%
36%
52%
25%
64%
61%
47%
63%
63%
31%
94%
0 20 40 60 80 100
Snacks
Baby food
Formula
Legumes
Dairy
Eggs
Fish
Meat
Fruits
Vegetables
White starches
Grains
Percentage of children consuming each food group in the past 7 days
Average number of days consumed*
6.9 1.9 4.2 2.3 4.2 3.4 3.4 5.4 3.1 6.1 4.2 3.4
6.5 1.9 4.4 3.1 2.4 3.6 3.2 4.1 2.8 6.3 5.6
5.2
Average number of days consumed*
41

MCC INDONESIA NUTRITION PROJECT IMPACT EVALUATION BASELINE REPORT MATHEMATICA POLICY RESEARCH
not know the number or size of portions per day; if some women or children eat multiple servings daily, or much larger servings, and others eat only one serving or smaller servings, it is possible that these data mask important heterogeneity in the actual quantity of nutrient intake. In summary, the data are not rich enough to determine if pregnant women and children consumed enough iron to prevent anemia, but we can conclude that in general most food groups are available in the study area and consumed on a fairly regular basis by a large share of the population of pregnant women and children under 3.
2. Rates of breastfeeding are very high but very few children are exclusively breastfed Among the study population, almost all children are breastfed and many are breastfed well
past their first year of life. Knowledge of the recommendation to initiate breastfeeding within the first hour after birth was quite high, with more than 70 percent of pregnant women and caregivers able to answer correctly when breastfeeding should begin (Figure III.9 Panel A). However, based on a question asked earlier in the survey about when the index child was first breastfed, only about half as many caregivers reported that they breastfed their child within one hour of birth. In contrast, knowledge of the recommendation that babies should not be given any food or liquid other than breastmilk for the first six months of life was not widespread, with less than a fifth of pregnant women and a quarter of caregivers saying that children should be exclusively breastfed for the first six months of their lives based on questions about when food and liquids other than breastmilk should be introduced (Figure III.9 Panel A). Using similar questions about the age at which food and liquids other than breastmilk were introduced, as well as questions about the age until which the child was breastfed, we find that only 20 percent of children who were between 0–5 months old at the time of the survey were still exclusively breastfed, and the same share of caregivers reported that their children aged 6–35 months old had been exclusively breastfed for the first six months (i.e., up until their 6 month birthday).53
Rates of breastfeeding were high, but exclusive breastfeeding was rare even within the first month (Figure III.9 Panel B). Only one percent of children under one month old were not breastfeeding and among 5 month-olds in the sample over 80 percent were still breastfeeding (either exclusively or non-exclusively). However, only 23 percent of caregivers of children in their first month of life reported exclusively breastfeeding and that proportion fell to only 13 percent among children 5 months old. As discussed below, for many children it might have been only an occasional exposure to food or liquid other than breastmilk that interferes with exclusive breastfeeding, but a large share of children consumed formula daily from a very young age.
53 Our definition of exclusive breastfeeding, based on UNICEF and WHO recommendations, is as follows:
younger than 6 months—the child is currently breastfeeding and has never been given any food, formula, or other liquid other than breastmilk
ages 6–35 months—the child was breastfed until at least 6 months old and was not given any food, formula, or other liquid other than breastmilk before 6 months of age.
42

MCC INDONESIA NUTRITION PROJECT IMPACT EVALUATION BASELINE REPORT MATHEMATICA POLICY RESEARCH
Figure III.9. There is ample scope to improve breastfeeding knowledge and practices Panel A. Knowledge and practice of early initiation of breastfeeding and exclusive breastfeeding
Source: Caregiver and pregnant woman baseline surveys, 2015. *Caregivers of children 0-23 months (N=2072)
Panel B. Breastfeeding among 0-5 month olds
Source: Caregiver baseline survey, 2015. Note: Some columns add up to 101 percent due to rounding
20%
20%
25%
34%*
71%*
19%
72%
0 20 40 60 80 100
(Among 6-35 month olds, N=2507) child wasexclusively breastfed for 6 months
(Among 0-5 month olds, N=514) child isexclusively breastfed
Exclusive breastfeeding knowledge
Early initiation practice
Early initiation knowledge
Pregnant women (N=1520) Caregivers (N=3039)
23%32%
18% 20% 18% 13%
77% 61%76%
63% 63% 69%
1%7% 7%
18% 19% 19%
0
20
40
60
80
100
0 months(N=58)
1 month(N=74)
2 months(N=93)
3 months(N=99)
4 months(N=102)
5 months(N=88)
Exclusively breastfed Non-exclusively breastfed Not breastfed
43

MCC INDONESIA NUTRITION PROJECT IMPACT EVALUATION BASELINE REPORT MATHEMATICA POLICY RESEARCH
Even though breastfeeding rates were high and sustained, with over three-quarters of children breastfed until at least age 2 as recommended by UNICEF and WHO, the rates of formula feeding were almost equally high, with nearly 60 percent of children given formula within the first month of life (Figure III.10 Panel A). The overwhelming majority (96 percent) of children who were given formula were consuming powdered formula, which must be prepared with water that could be contaminated.
Figure III.10. Many children were fed formula, and other liquids and foods besides breastmilk, before the recommended age
Panel A: Rates of breastfeeding and formula use
Source: Caregiver baseline survey, 2015. Sample size: 58–102.
Panel B: Daily consumption of foods and liquid other than breastmilk among children who are not exclusively breastfed
Source: Caregiver baseline survey, 2015. Sample size: 25–100. Note: 98.6 percent of 6-8 month olds consumed food in the previous week.
0
20
40
60
80
100
1 3 5 7 9 11 13 15 17 19 21 23 25 27 29 31 33 35Per
cent
age
of c
hild
ren
brea
stfe
d an
d gi
ven
form
ula
Age in months
Breastfed Given formula
0
20
40
60
80
100
0 1 2 3 4 5 6
Per
cent
of c
hild
ren
regu
larly
co
nsum
ing
liqui
ds a
nd fo
ods
Age in months
Consumes liquids other than breastmilk daily Consumes food daily
84% of children aged 12-15 months were breastfed
44

MCC INDONESIA NUTRITION PROJECT IMPACT EVALUATION BASELINE REPORT MATHEMATICA POLICY RESEARCH
Since the definition of exclusive breastfeeding is based on whether the child ever consumed anything other than breastmilk, it is possible that children who were only given a bit of sugar water immediately after birth and then given nothing but breastmilk could be depressing the rate of exclusive breastfeeding. This does not appear to be the explanation for low rates of exclusive breastfeeding in this population, though, as evidenced by the high share of children who consume liquids other than breastmilk daily as shown in Figure III.10 Panel B. Almost 60 percent of caregivers of newborns report giving the child formula (Figure III.10 Panel A), and half of those said that the child had formula daily (Figure III.10 Panel B). Approximately half of caregivers introduced complementary feeding at least two months before the child reached the recommended age.
3. Both caregivers and pregnant women can improve their use of micronutrient supplements Although the baseline data on dietary diversity were not rich enough to allow us to
characterize children’s consumption of micronutrients, the survey questions on Taburia awareness and use clearly indicate that very few children were consuming any micronutrient supplements (Figure III.11). Consumption of iodized salt was very common, however.
Figure III.11. Few caregivers were familiar with Taburia or had given it to their children
Source: Caregiver baseline survey, 2015.
Turning to micronutrient consumption during pregnancy, we find that 30 percent of pregnant women and caregivers reported not receiving any IFA pills, but almost all women who received IFA took some of it (Figure III.12 Panel A). About half the pregnant women surveyed had received the recommended amount of at least 30 tablets per trimester, but among caregivers only a quarter reported having received the recommended amount of 90 tablets over the course of their pregnancy. This discrepancy could partially reflect recall bias among caregivers since they might not remember how many tablets they were given or consumed whereas the information is probably fresher in the minds of pregnant women. Less than a quarter of currently pregnant women had consumed the recommended doses of IFA for their gestation, and among caregivers
20%11% 10%
88% 84%
0
20
40
60
80
100
Heard of Taburia Received Taburia Child given Taburiaat least once
Child consumediodized salt
Identified onebenefit of Taburia
All Caregivers (N=2600) Caregivers who heard of Taburia (N=569)
45

MCC INDONESIA NUTRITION PROJECT IMPACT EVALUATION BASELINE REPORT MATHEMATICA POLICY RESEARCH
the share who had consumed the recommended number of doses while pregnant was only 14 percent.
The explanations for low consumption vary from woman to woman, with side effects and bad taste being the most common (Figure III.12 Panel B). Only 15 percent of women said they were bored or lazy, 15 percent forgot to take the pills, and 13 percent said there was no need.
Figure III.12. There is scope to improve consumption of IFA during pregnancy Panel A. Receipt and consumption of IFA
Source: Caregiver and pregnant woman baseline surveys, 2015.
Panel B. Reasons for not taking the recommended dosage of IFA
Source: Caregiver and pregnant woman baseline surveys, 2015. Sample size: 621
4. Service providers could do more to promote better infant and young child feeding practices The majority of nutritionists, bidan, and kader posyandu report talking with pregnant women
and caregivers about topics relevant for the nutrition program, including prenatal nutrition, breastfeeding and complementary feeding, but only around a quarter of kader posyandu say they counseled women on anemia (Figure III.13).54 The majority of service providers also report talking with women about diarrhea and handwashing practices, although not nearly as many service providers demonstrate the recommended handwashing technique. Consistent with the findings discussed above showing that only a small share of caregivers were familiar with Taburia, less than a third of bidan and less than a fifth of kader posyandu report discussing Taburia with the women they serve.
54 Bidan and nutritionists were not asked whether they discussed anemia with women.
68%
70%
14%
25%
23%
48%
0 20 40 60 80 100
Consumed at least 90 IFA
Received at least 90 IFA
Consumed at least 30 IFAper trimester
Received at least 30 IFA pertrimester
Consumed any IFA
Received any IFA
Percentage of women
All Women (N=4508)
Caregivers (N=2935)
Pregnant women (N=929)
4%
4%
8%
13%
15%
15%
26%
30%
0 20 40 60 80 100
Other
Afraid
No Medicine
No need to take pills
Forgot
Bored or Lazy
Don't like taste
Experienced sideeffects
Percentage of women who indicated why they stopped taking IFA
46

MCC INDONESIA NUTRITION PROJECT IMPACT EVALUATION BASELINE REPORT MATHEMATICA POLICY RESEARCH
Figure III.13. Most service providers report discussing nutrition-related topics with women
Source: Puskesmas nutritionist, bidan, and kader posyandu baseline surveys, 2015 *Nutritionist timefame is 4 weeks compared to 6 months for bidan and kader posyandu. Nutritionists were only asked about prenatal nutrition, breastfeeding, and complementary feeding. †Prenatal nutrition question was not included in bidan or kader posyandu surveys. ‡Anemia question was not included in nutritionist or bidan surveys.
Probing more specifically on the topics bidan discuss with their patients, there is a bit of a paradox in that three quarters of bidan report discussing exclusive breastfeeding and less than a third discuss early initiation (Figure III.14 Panel A), whereas the knowledge indicators among pregnant women and caregivers suggest that they are much more familiar with the need to start breastfeeding within the first hour after birth than they are the need to feed nothing but breastmilk for the first six months. Few bidan discussed other topics related to breastfeeding. Less than a fifth of bidan discussed issues such as how to hold the child while breastfeeding, how many times a day to breastfeed, common problems encountered with breastfeeding, or what to do if the mother cannot breastfeed. Rather than equipping mothers with the knowledge they need to successfully breastfeed their children, over 40 percent of bidan reported that in certain situations they recommend that mothers give formula to children less than six months old (Figure III.14 Panel B). In particular, 30 percent of bidan said they recommended formula if the mother could not breastfeed, which does not address the root cause of their challenges, and may condone formula use when it is not necessary.
31%
58%
53%
74%
17%
78%
62%
26%
53%
75%
85%
90%
28%
89%
96%
70%
70%
71%
0 20 40 60 80 100
Demonstrated handwashing
Handwashing
Diarrhea
Vitamin A
Taburia
Complementary feeding
Breastfeeding
Anemia‡
Prenatal nutrition†
Per
cent
age
of h
ealth
care
pro
vide
rs w
ho d
iscu
ssed
he
alth
topi
cs w
ith w
omen
Puskesmas nutritionist (N=214)* Bidan (N=570) Kader posyandu (N=732)
47

MCC INDONESIA NUTRITION PROJECT IMPACT EVALUATION BASELINE REPORT MATHEMATICA POLICY RESEARCH
Figure III.14. Bidan could do more to promote breastfeeding rather than recommending formula for children under six months, and to educate mothers on complementary feeding Panel A. Bidan discussions about breastfeeding
Source: Bidan baseline survey, 2015 Sample size: 570.
Panel B. Situations in which bidan recommended giving formula to children under six months
Source: Bidan baseline survey, 2015 Sample size: 570
16%
10%
17%
18%
25%
76%
29%
0 20 40 60 80 100
Common problems women face while breastfeeding
What to do if woman cannot breastfeed
How many times to breastfeed child each day
How to hold child while breastfeeding
Breastfeeding until child is 2 years old
Exclusive breastfeeding for 6 months
Breastfeeding within 1 hour of birth
Percentage of bidan who discussed breastfeeding topics
14%
1%
1%
4%
4%
5%
30%
44%
0 20 40 60 80 100
Other
Always recommend formula
If mother did not live in same household
If mother is too busy to breastfeed
If mother is worried about health of infant
If breastfeeding was painful
If mother could not breastfeed
Ever
Percent of bidan who recommended formula for children under six months old
48

MCC INDONESIA NUTRITION PROJECT IMPACT EVALUATION BASELINE REPORT MATHEMATICA POLICY RESEARCH
Panel C. Bidan discussions about complementary feeding
Source: Bidan baseline survey, 2015 Sample size: 570
Although 89 percent of bidan said they counseled mothers on complementary feeding, few bidan reported having discussions with mothers about specific recommendations for complementary feeding (Figure III.14 panel C). In particular, only 43 percent of bidan reported that they had advised mothers to complement breastfeeding with foods starting when the child is six months old. While over two-thirds of bidan discussed what types of food to feed the child, less than a third talked about how much to feed the child, and almost none discussed feeding when a child is sick or how to add Taburia to food.
E. Sanitation conditions
In addition to the quantity and quality of food that children consume, their ability to process those nutrients is important. Undernutrition and infection are closely related conditions, with correlations between stunting and diarrhea in particular (Checkley et al. 2008). Nutritionists now hypothesize that a subclinical condition called environmental enteropathy could compromise gut function and the immune system. Although these pathways are not yet well understood, in this section we discuss sanitation conditions that could expose children to a contaminated environment, the status of initiatives to address these conditions, and diarrhea prevalence rates at baseline.
1. Many children were at high risk of exposure to a contaminated environment The baseline data show that sanitation conditions were poor in many households, leaving
household members, particularly young children, exposed to the risk of disease. Only 50 percent of households reported using a toilet that flushed to a piped sewer system or septic tank, thereby safely containing excreta and preventing it from re-entering the environment (Figure III.15 Panel A). A further 10 percent of households reported using an improved latrine, which is also
0%
2%
27%
68%
43%
0 20 40 60 80 100
How to add taburia to food
Feeding when child is sick
How much food to feed the child
What types of food to feed the child
Complementary feeding at 6 months
Percentage of bidan who discussed complementary feeding topics
49

MCC INDONESIA NUTRITION PROJECT IMPACT EVALUATION BASELINE REPORT MATHEMATICA POLICY RESEARCH
considered to safely contain feces. 55 However, 5 percent of households reported using an unimproved latrine which could allow flies to pass between the pit contents and the rest of the household, particularly cooking or eating areas, and almost a third of households reported defecating directly into the environment, using either a hanging toilet (over water) or no toilet at all.56
Children’s feces were particularly likely to be left in the open. Less than 40 percent of caregivers reported that the index child used a toilet (or that the feces were disposed of in the toilet) the last time he or she passed stools (Figure III.15 Panel B). More than half of caregivers reported that children’s stool was left in the open, with only a few percent of caregivers reporting disposing of the stool in the garbage or burying it, methods which often leave feces in the environment.57
Figure III.15. Sanitation conditions in many households do not safely contain feces
Panel A. Nearly a third of households defecated directly into the environment
Source: Household baseline survey, 2015. Sample size: 4,558.
Panel B. Nearly 60 percent of children’s feces were left in the open
Source: Caregiver baseline survey, 2015. Sample size: 3,022.
2. There had been very little momentum on sanitation issues at the desa level The Nutrition Project seeks to improve maternal and child health in part through better
sanitation, specifically by supporting CLTS which involves community-level sanitarians and volunteers working with communities to prevent open defecation. Thus, learning more about community involvement in sanitation improvements is key to understanding the project’s effectiveness. When asked about community meetings on the topic of sanitation, less than
55Consistent with WHO and UNICEF’s Joint Monitoring Program, we define an improved latrine as flush or pour flush to a pit latrine, a ventilated improved pit latrine, a latrine with a slab, or a composting toilet. 56 Significantly more households in treatment areas had unimproved latrines relative to control households (6.4 percent versus 4.0 percent, respectively; p-value 0.02). 57 Significantly more caregivers in control areas reported disposing of their child’s stool in the garbage relative to treatment households (3.5 percent versus 1.2 percent, respectively; p-value less than 0.01).
Flush51%
Improved latrine10%
Unimproved latrine
5%
Hanging17%
None15%
Other2%
Percentage of households using toilet type
Toilet38%
In open57%
Buried2%
Garbage3%
Percentage of children disposing feces (by location)
50

MCC INDONESIA NUTRITION PROJECT IMPACT EVALUATION BASELINE REPORT MATHEMATICA POLICY RESEARCH
5 percent of households could recall any such meeting being held in the past year, while only 3 percent reported that a household member had attended such a meeting. Further, less than 2 percent of the desa were certified to be free of open defecation, according to the kepala desa.
Sanitation officers based at the puskesmas could play an important role in catalyzing improvements in sanitation conditions. Almost all sanitation officers said that they conduct visits to the dusun they supervise, reaching an average of 5 dusun in the past month relative to an average of 21 dusun supervised on average (Table III.7). However, at the current pace of triggering for CLTS that sanitation officers reported over the six months prior to the baseline survey, it would have taken almost five years before all dusun would be triggered.
Table III.7. Sanitation officers visit the dusun they supervise, but progress on triggering is slow
Sample size
(N=) Mean Standard deviation
Number of dusun supervised 168 21.2 1.74 Visits dusun in area 203 97.0 1.20
Number of dusun visited in last month 187 5.0 0.52 Conducted trigger even in dusun as part of work 203 77.8 3.30
Number of trigger events in past six months 158 3.3 0.34 Source: Puskesmas (sanitation officer) baseline survey, 2015.
3. Diarrhea was common for children under age three and knowledge of prevention is low Consistent with the poor sanitation conditions discussed above, the baseline data also show
high rates of diarrhea among children under age three (Figure III.16). The relevant information was collected by asking caregivers to report if their child had diarrhea, defined in the survey as loose or watery stools at least three times in a 24 hour period, or had any loose stool with blood. Thirteen percent of caregivers reported their child had diarrhea in the last week, with a prevalence rate not quite double that over the past month.58 Approximately forty percent of the children who had diarrhea in the last four weeks had received some treatment for their most recent case (not shown), with around a fifth of those children were treated at a bidan’s home or practice and half as many treated at a puskesmas.59 In addition, 41 percent of children who had diarrhea in the last four weeks received oral rehydration therapy (Oralit), but this was not perfectly correlated with seeking treatment.60
58 It is common for the prevalence rate to not increase linearly over longer recall periods due to recall bias. 59 Among children who had diarrhea in the past four weeks, significantly more children in control areas had been treated by a bidan relative to treatment children (26.3 percent versus 15.0 percent, respectively; p-value less than 0.01). 60 Some children who sought treatment were not given oral rehydration therapy while some children who did not seek treatment were nonetheless given oral rehydration therapy by their caregivers.
51

MCC INDONESIA NUTRITION PROJECT IMPACT EVALUATION BASELINE REPORT MATHEMATICA POLICY RESEARCH
Figure III.16. Diarrhea is common for children under three
Source: Caregiver baseline survey, 2015.
When asked how to prevent diarrhea, the most common method suggested by caregivers and pregnant women had to do with food hygiene, a topic that is not specifically addressed in the practices promoted through the IYCF trainings implemented by the Nutrition Project (Figure III.17). Among both caregivers and pregnant women, the next most commonly mentioned methods were boiling and safely storing drinking water, keeping the house clean to avoid flies, and washing hands with soap before eating. Very few respondents associated other times to wash hands, latrine use or breastfeeding with diarrhea prevention.
13%19%
25%
41%
21%12%
0
20
40
60
80
100
Had diarrhea inlast week
Had diarrhea inlast 2 weeks
Had diarrhea inlast 4 weeks
Treated withOralit
Treated by bidanin home or
practice
Treated atpuskesmas
Per
cent
age
of c
hild
ren
All children (N=3038) Children with diarrhea in last 4 weeks (N=787)
52
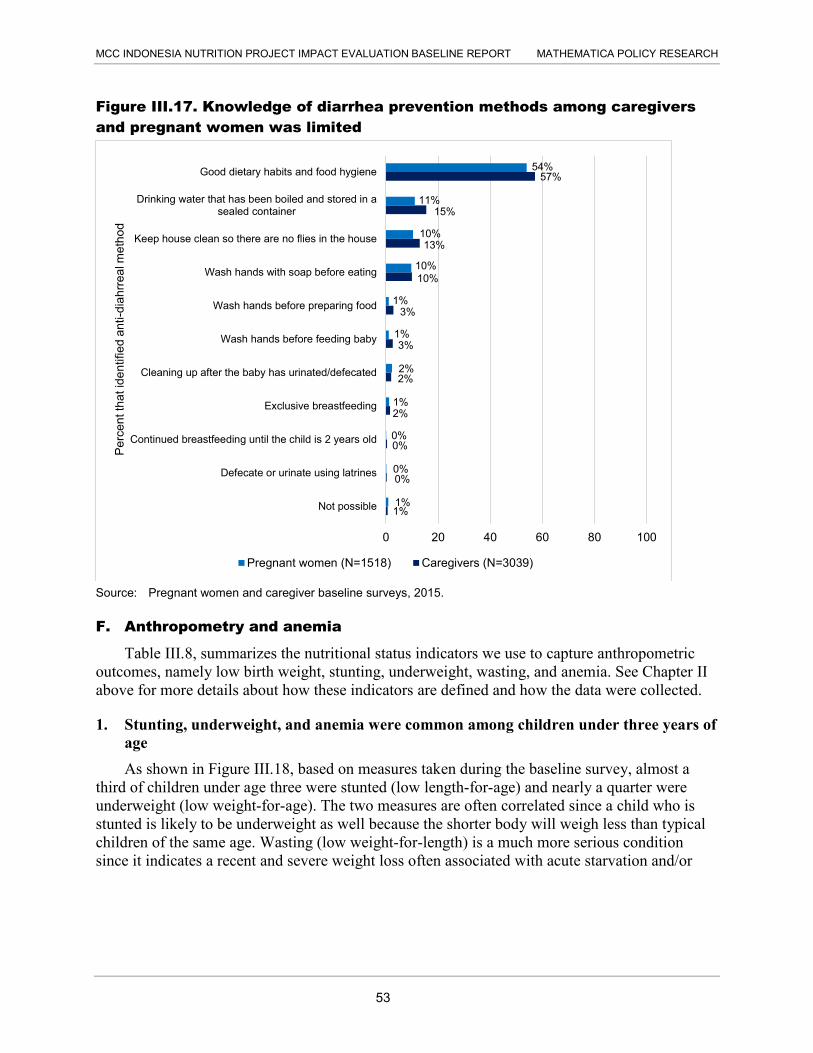
MCC INDONESIA NUTRITION PROJECT IMPACT EVALUATION BASELINE REPORT MATHEMATICA POLICY RESEARCH
Figure III.17. Knowledge of diarrhea prevention methods among caregivers and pregnant women was limited
Source: Pregnant women and caregiver baseline surveys, 2015.
F. Anthropometry and anemia
Table III.8, summarizes the nutritional status indicators we use to capture anthropometric outcomes, namely low birth weight, stunting, underweight, wasting, and anemia. See Chapter II above for more details about how these indicators are defined and how the data were collected.
1. Stunting, underweight, and anemia were common among children under three years of age As shown in Figure III.18, based on measures taken during the baseline survey, almost a
third of children under age three were stunted (low length-for-age) and nearly a quarter were underweight (low weight-for-age). The two measures are often correlated since a child who is stunted is likely to be underweight as well because the shorter body will weigh less than typical children of the same age. Wasting (low weight-for-length) is a much more serious condition since it indicates a recent and severe weight loss often associated with acute starvation and/or
1%
0%
0%
2%
2%
3%
3%
10%
13%
15%
57%
1%
0%
0%
1%
2%
1%
1%
10%
10%
11%
54%
0 20 40 60 80 100
Not possible
Defecate or urinate using latrines
Continued breastfeeding until the child is 2 years old
Exclusive breastfeeding
Cleaning up after the baby has urinated/defecated
Wash hands before feeding baby
Wash hands before preparing food
Wash hands with soap before eating
Keep house clean so there are no flies in the house
Drinking water that has been boiled and stored in asealed container
Good dietary habits and food hygiene
Per
cent
that
iden
tifie
d an
ti-di
ahrr
eal m
etho
d
Pregnant women (N=1518) Caregivers (N=3039)
53
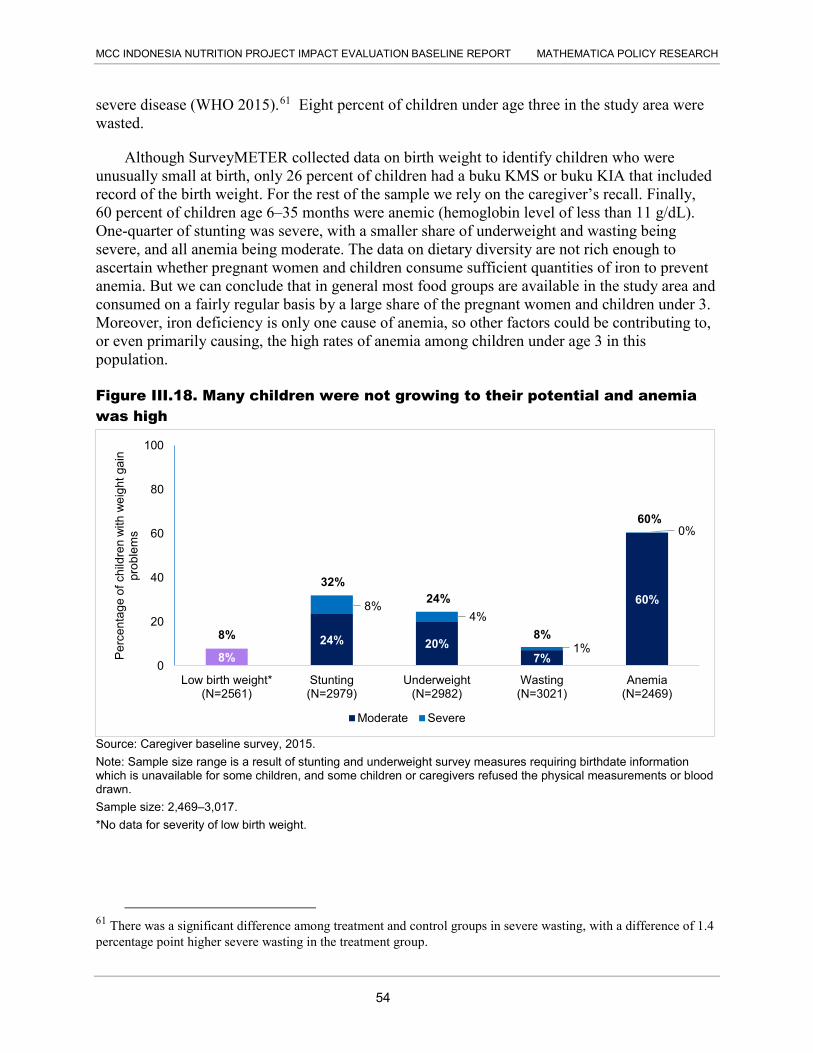
MCC INDONESIA NUTRITION PROJECT IMPACT EVALUATION BASELINE REPORT MATHEMATICA POLICY RESEARCH
severe disease (WHO 2015).61 Eight percent of children under age three in the study area were wasted.
Although SurveyMETER collected data on birth weight to identify children who were unusually small at birth, only 26 percent of children had a buku KMS or buku KIA that included record of the birth weight. For the rest of the sample we rely on the caregiver’s recall. Finally, 60 percent of children age 6–35 months were anemic (hemoglobin level of less than 11 g/dL). One-quarter of stunting was severe, with a smaller share of underweight and wasting being severe, and all anemia being moderate. The data on dietary diversity are not rich enough to ascertain whether pregnant women and children consume sufficient quantities of iron to prevent anemia. But we can conclude that in general most food groups are available in the study area and consumed on a fairly regular basis by a large share of the pregnant women and children under 3. Moreover, iron deficiency is only one cause of anemia, so other factors could be contributing to, or even primarily causing, the high rates of anemia among children under age 3 in this population.
Figure III.18. Many children were not growing to their potential and anemia was high
Source: Caregiver baseline survey, 2015. Note: Sample size range is a result of stunting and underweight survey measures requiring birthdate information which is unavailable for some children, and some children or caregivers refused the physical measurements or blood drawn. Sample size: 2,469–3,017. *No data for severity of low birth weight.
61 There was a significant difference among treatment and control groups in severe wasting, with a difference of 1.4 percentage point higher severe wasting in the treatment group.
8%24% 20%
7%
60%8%4%
1%
0%
0
20
40
60
80
100
Low birth weight*(N=2561)
Stunting(N=2979)
Underweight(N=2982)
Wasting(N=3021)
Anemia(N=2469)
Per
cent
age
of c
hild
ren
with
wei
ght g
ain
prob
lem
s
Moderate Severe
8%
32% 24%
8%
60%
54

MCC INDONESIA NUTRITION PROJECT IMPACT EVALUATION BASELINE REPORT MATHEMATICA POLICY RESEARCH
2. Rates of growth faltering and anemia varied by age Although we were not powered to make comparisons across age groups, the data suggest
that rates of stunting and underweight increased as children aged, whereas the prevalence of wasting was fairly stable (Figure III.19). This makes sense since it is rare for a child to recover from stunting once he or she falls behind in growth, and underweight usually follows stunting fairly closely, whereas it is possible for a child to lose or gain weight relatively quickly and therefore become or recover from being wasted at any age.
Figure III.19. Anthropometry measures and anemia varied by age, except for wasting
Source: Caregiver baseline survey, 2015. Note: Anemia 0 to 5 months not collected because blood drawing is not recommended for children under
6 months.
3. Anthropometry outcomes were very similar for male and female children but anemia and diarrhea were higher among male children When looking at possible differences by gender, we find that both genders had very similar
outcomes for low birth weight, underweight, and wasting (Figure III.20). Although the prevalence of stunting appears to be higher among boys (34 percent) relative to girls (30 percent), this was not statistically significant at conventional levels. Anemia and diarrhea were significantly higher among boys (p-values of less than 0.02 and 0.05, respectively).
0
20
40
60
80
100
0 to 5 months(N= 513)
6 to 11 months(N=530)
12 to 23 months(N=1022)
24 to 35 months(N=916)
Per
cent
age
of c
hild
ren
Age in months
Stunting Underweight Wasting Anemia
55

MCC INDONESIA NUTRITION PROJECT IMPACT EVALUATION BASELINE REPORT MATHEMATICA POLICY RESEARCH
Figure III.20. Anthropometry outcomes were very similar for male and female children but more boys were anemic
Source: Caregiver baseline survey, 2015. Note: Indicators by gender 0–35 months. *Significant difference
4. Most pregnant women are anemic and below the recommended weight by their third trimester Figure III.21 shows findings for pregnant women. The majority of pregnant women were
anemic, although only 10 percent reported having ever been diagnosed with anemia in the past three years (not shown).
Sixteen percent of pregnant women had a low MUAC (<23.5 cm), which is indicative of chronic energy deficiency. Complementary to MUAC, low weight gain among pregnant women is another indicator of possible chronic energy deficiency. We estimated weight gain during pregnancy as the difference between self-reported pre-pregnancy weight and weight as measured at the baseline survey (restricted to women in their third trimester). More than half of pregnant woman in their third trimester had gained less than the recommended weight (adjusted for gestation). Many pregnant women were likely already under a healthy weight even prior to pregnancy, with 14 percent of pregnant women reported having been told by a healthcare provider that they need to gain more weight sometime in the past three years.
8%
34%25%
8%
65%
15%8%
30%24%
9%
56%
12%
0
20
40
60
80
100
Low BirthWeight
Stunting Underweight Wasting Anemia* Had diarrhea inlast week*
Per
cent
age
of c
hild
ren
suffe
ring
from
an
thro
pom
etric
pro
blem
s
Male (N=1257-1549) Female (N= 1212-1472)
56

MCC INDONESIA NUTRITION PROJECT IMPACT EVALUATION BASELINE REPORT MATHEMATICA POLICY RESEARCH
Figure III.21. Most pregnant women were anemic and had not met the recommendation for weight gain during pregnancy
Source: Pregnant woman baseline survey, 2015.
55%
16%
14%
54%
0 20 40 60 80 100
Anemic
Low MUAC
Told to gain more weight in past 3 years
Gained less than recommended weight inthird trimester
Percentage of pregnant women
All pregnant women(N=1520)
Pregnant women in their third trimester(N=502)
57

This page has been left blank for double-sided copying.
MCC INDONESIA NUTRITION PROJECT IMPACT EVALUATION BASELINE REPORT MATHEMATICA POLICY RESEARCH
IV. CONCLUSION
In this chapter, we summarize the key findings from our analysis of the Nutrition Project baseline data, including the implications for the validity of the random assignment design. We also recalculate the minimum detectable impacts (MDIs)—the smallest impacts on key outcomes that our design will be able to distinguish statistically from zero—based on updated parameters from the baseline data. We then discuss the main challenges to the internal validity, and finally outline our plans for data collection and next steps.
A. Summary of findings
Our analysis suggests that at baseline, treatment and control groups were similar across a range of characteristics about households, pregnant women, caregivers, and their children. There were no statistically significant differences in key outcomes or intermediate indicators across treatment and control groups. However, there were some statistically significant differences in indicators related to project implementation, specifically training for bidan and kader posyandu, monthly weighing visits at the posyandu (tracked by Generasi), and the possession of buku KIA by pregnant women and buku KMS by caregivers of young children. The fact that significantly higher proportions of women and children had buku KIA/KMS and that higher proportions of young children were being weighed at the posyandu in the treatment group compared to the control group is not surprising given that Generasi implementation had started at the time of the baseline. Higher proportions of bidan and kader posyandu also reported being trained by MCA-I on IYCF in 2014, which is consistent with the fact that some of bidan and kader posyandu had been trained in 2014 prior to the baseline survey.
Despite these early project activities, we find no differences in key outcomes between treatment and control groups. Nearly a third of children (in both groups) under age 3 were stunted, 9 percent of children were wasted, and a quarter were underweight. Over 60 percent of children ages 6-35 months and 55 percent of pregnant women were anemic. These findings are largely consistent with other national sources. The Riskesdas (2010) reports national rates of stunting, wasting, and underweight as 36, 13, and 18 percent respectively, with the evaluation provinces at 40, 16, and 26 percent.
Conditions at health facilities are not likely to be causing the high prevalence rate of undernutrition, since baseline levels of access to and quality of health service providers appear to be high. Most pregnant women and caregivers did not have to travel for more than 15 minutes or pay more than 4,000 rupiah (approximately 40 U.S. cents) to access key health services, such as the posyandu, bidan or puskesmas. High proportions of bidan and kader posyandu (over 70 percent for kader posyandu and 90 percent for bidan) have been trained on topics of interest to the project, and in a survey of basic questions related to the IYCF training manuals adopted by MCA-I, bidan demonstrated that knowledge on most topics was very high. (Knowledge by kader posyandu demonstrates the need for training.) The overwhelming majority (70 percent and above) of puskesmas were staffed with key personnel, such as bidan coordinators, nutritionists and/or sanitarians. Nearly all puskesmas had height and length taking equipment, and were often stocked with supplements like IFA or vitamin A.
59

MCC INDONESIA NUTRITION PROJECT IMPACT EVALUATION BASELINE REPORT MATHEMATICA POLICY RESEARCH
However, there is room for improvement in some key behaviors and practices potentially linked to stunting. For example, although early initiation and persistence of breastfeeding are very high, with nearly all women initiating early breastfeeding and high proportions of women (approximately 80 percent) continuing to breastfeed for several years, exclusive breastfeeding is not the norm. Rates of exclusive breastfeeding were 23 percent at zero months and dropped to 13 percent at five months. Many children consumed liquids other than breastmilk early on (mostly powdered formula) and consumed them daily. This practice leads to exposure to contaminated food or water, which could be contributing to the high rates of stunting.
To identify the source of contamination that could end up in food or water, we examined the sanitation conditions in the study areas. The problems related to sanitation include both access and behavior. Nearly a third of households did not have access to an improved latrine and defecated directly into the environment. Nearly 60 percent of children's feces were left in the open and not disposed of properly. In addition, households report little socialization about any sanitation activities taking place at the desa level. Fewer than 5 percent of households reported being aware of any meeting held on sanitation in the past year, although the sanitation officers stationed at puskesmas reported being active in the communities they serve. Nearly all sanitation officers reported visiting an average of five dusun in the past month (out of an average of 22 that they supervise), and nearly 80 percent of sanitarians said that in the past six months they had conducted triggering events to start communities on the path toward being ODF.
B. Updated MDIs
In the design report (Beatty, Borkum et al. 2014), we computed MDIs for the random assignment design based largely on the Indonesian Family Life Survey (IFLS) and on our best estimates of sample sizes and other parameters available at the time. Using the baseline data, we were able to revise the MDI calculations based on more up-to-date information (Table IV.1). Specifically, we used the baseline control group means, standard deviations, and intercluster correlation coefficients for the primary outcomes of interest, whereas our original MDI calculations were based on estimates of these parameters from 2007 ILFS data. These are parameters for the full sample because we found no statistically relevant differences between the groups. The revised MDI calculations maintain the same assumption as the baseline regarding the response rate of 95 percent.62
The updated MDIs are nearly identical to the calculations presented in the design report because the stunting prevalence rates in our baseline data were also nearly identical to our assumptions based on IFLS. For example, in the design report, we used a stunting prevalence rate of 31.0 percent and the baseline prevalence rate we estimated was 31.9 percent. In the design report, we recommended sampling 32 households per kecamatan for the endline child sample, which would allow MCC to detect a 5.2 percentage point change in stunting (17 percent of the expected baseline mean).63 This MDI has moved to 5.0 percent with the baseline results. For the other key outcomes shown in Table IV.1, we estimate being able to detect a 2 percentage point
62 SurveyMETER was able to achieve a response rate of 100 percent, but in the event that the survey firm at endline is not able to achieve that, we prefer the more conservative assumption of 95 percent. 63 Due to lower baseline prevalence in wasting and underweight status, we will only be able to detect relatively larger changes in these indicators (in percentage terms) compared to those we can detect for stunting.
60

MCC INDONESIA NUTRITION PROJECT IMPACT EVALUATION BASELINE REPORT MATHEMATICA POLICY RESEARCH
change in the percentage of children with low birth weight, a 6 percentage point change in child anemia, and a 4 percentage point change in the incidence of diarrhea in the last month. The child anemia rate in the baseline of 60.6 percent was much larger than the IFLS rate of 38.3 percent, and as a result the MDIs have gone down slightly. Using the baseline data, we predict being able to identify a reduction of at least 6.1 percentage points in the anemia prevalence rate at endline, as opposed to our earlier MDI of 7.4 percentage points in the design report.
Table IV.1. We recommend an endline sample size of 32 households with children 0–35 months per kecamatan to detect plausible impacts on key outcomes
. . MDI (Percentage points)
Average N per kecamatan Total N Stunting
(31.9 percent) Anemia
(60.6 percent)
Diarrhea in past month
(25.4 percent)
Low birth weight
(7.9 percent)
Full sample . . . . . 16 3,040 6.0 7.1 5.2 2.9 24 4,560 5.3 6.4 4.6 2.4 32 6,080 5.0 6.1 4.2 2.1 40 7,600 4.8 5.8 4.0 1.9
50 percent subgroup . . . . . 8 1,520 7.6 8.9 6.8 4.0 12 2,280 6.5 7.7 5.8 3.3 16 3,040 6.0 7.1 5.2 2.9 20 3,800 5.6 6.7 4.9 2.6
Notes: MDIs are for a two-tailed test with 80 percent power at a 95 percent significance level, and are based on 95 treatment and 95 control kecamatan. Baseline prevalence (shown in parentheses) and ICCs (0.04; 0.06; 0.03; and 0.01) are from the caregiver baseline survey, 2015. Calculations also assume an R2 of 0.05 and a response rate of 95 percent. Sample for anemia is five-sixths of the total because it excludes children 0–5 months.
Table IV.2 shows MDIs for anemia for pregnant women in their second and third trimesters.64 We still maintain the design report recommendation to sample of 16 households per kecamatan for this population, which strikes an appropriate balance between precision and cost (given that we are already recommending sampling 32 households per kecamatan for the child sample). This sample size will enable us to detect a reduction of 6.3 percentage points for anemia. This is nearly a percentage point higher than the 5.6 percentage point MDI calculated in the design report. This discrepancy is due to a much larger ICC in the baseline than in IFLS.
64 We also used low BMI in the design report but were not able to collect this information in the baseline and hence it is not included here.
61

MCC INDONESIA NUTRITION PROJECT IMPACT EVALUATION BASELINE REPORT MATHEMATICA POLICY RESEARCH
Table IV.2. We recommend an endline sample size of 16 households with pregnant women in the second or third trimester per kecamatan to detect plausible impacts on anemia
. . MDIs (Percentage points)
Average N per kecamatan Total N Anemia in second and third trimester
(55.2 percent)
Full sample . . 8 1,520 8.0 16 3,040 6.3 24 4,560 5.6
50 percent subgroup . . 4 760 10.7 8 1,520 8.0 12 2,280 8.6
Notes: MDIs are for a two-tailed test with 80 percent power at a 95 percent significance level, and are based on 95 treatment and 95 control kecamatan. Baseline prevalence (shown in parentheses) and ICCs (0.040) are from the pregnant women baseline survey, 2015. Calculations also assume an R2 of 0.05 and a response rate of 95 percent.
In sum, the proposed sample sizes for endline involve 6,080 young children in the 0–35 month age range (32 per kecamatan) and 3,040 pregnant women (16 per kecamatan), resulting in a total sample size of 9,120 households (48 per kecamatan). These sample sizes will enable us to detect impacts of the expected magnitude for most of the outcomes of interest. They will also enable us to detect impacts for key subgroups; for example, we will be able to detect impacts on stunting of 6.0 percentage points for female children, which we expect to comprise approximately half of the total sample of children.
C. Risks to internal validity
There are two primary risks to the internal validity of the random assignment design. First, underlying differences between the treatment and control groups could affect follow-up outcomes, and second, there may be noncompliance with the randomly assigned treatment status. The first risk is covered in Chapter III Section A, and we do not find any systematic differences between outputs or outcomes of interest across the two groups, with the noted exceptions. We believe that these differences are due to the fact that Generasi and the IYCF training started before the baseline survey was conducted. Therefore, we do not see this as a threat to the validity of the design.
The second risk, noncompliance, remains with several activities. First, we know that one treatment kecamatan was deemed ineligible for the Project due to financial management problems and will not be receiving Generasi grants or engaging in subactivities during the current round of Generasi. Instead, another (non-randomly selected) kecamatan in the same district which was randomized to the control group, will participate in the Project. The survey was conducted in both of these kecamtatan according to the original design, and we will use intent to treat estimates in the impact analysis, analyzing each kecamatan according to their randomly assigned treatment status. This preserves our ability to identify causal impacts of the Program by maintaining the balance achieved by random assignment, although it could slightly
62

MCC INDONESIA NUTRITION PROJECT IMPACT EVALUATION BASELINE REPORT MATHEMATICA POLICY RESEARCH
erode some of the estimated effect since there will now be one treatment kecamatan that actually did not receive the Project and one control kecamatan that did.
Finally, another potential risk is that control kecamatan receive Generasi. Implementers had discussed the possibility of Generasi being granted to the control kecamatan in 2017. If this is the case, and the endline takes place after 2017, this could potentially understate project impacts since treatment and control kecamatan will appear more similar due to the introduction of Generasi. We would expect that it could take several cycles of Generasi for the program to affect key outcomes, but it will be important to monitor Generasi implementation in the control areas, and time the endline appropriately. Ideally, the endline timing would allow for the project to show impacts, but it might need to make a trade-off between that timeline and the threat that the introduction of Generasi in control areas could pose to the evaluation.
D. External validity
The design of the Nutrition Project evaluation is internally valid and robust, yet it is not representative at the province level. Indonesia is an incredibly diverse and large country and thus is challenging to forecast how conclusions from one research study in one area might be relevant elsewhere. However, we appreciate that some audiences might want to consider how the findings from the Nutrition Project study compare with other studies, and how one might apply these findings across and outside of Indonesia.
The first step in examining external validity is to consider how the results from the Nutrition Project study sample are relevant to the same provinces generally. We find some similarities with the Demographic and Health Survey (DHS), which was conducted in 2012 and is representative at the province level. If we compare the province-level DHS results and results from the Nutrition Project, appreciating that these are different samples, most importantly that the DHS was designed to be representative at the province level, we find similar summary statistics. For example, the DHS looks at vaccination rates for 12-23 month olds, specifically those receiving all vaccinations defined as BCG, measles, all four doses of Hepatitis B, three doses each of DPT and polio vaccine. The rate for this population averaged across study provinces is 30.7 percent (34.3 in West Kalimantan, 27.5 in Central Kalimantan, and 30.2 in South Sumatra). This figure in the Nutrition Project sample for children 12-35 months is 37 percent (Figure III.3). (We hypothesize that the difference in rates is due to the timing difference and the fact that the Nutrition Project calculations are with a wider range of children.) Similarly, the two studies show similar rates of diarrhea among children. The three province average in the DHS regarding the percent of children under age five who had diarrhea in the two weeks preceding the survey is 18 percent, and this figure is 19 percent in the Nutrition Project (Figure III.16, for children under age 3).
A second consideration is how relevant the results from West Kalimantan, Central Kalimantan and South Sumatra are to other provinces, especially the other eight provinces in which the Nutrition Project is working: West Java, East Java, East Nusa Tenggara, West Nusa Tenggara, West Sulawesi, North Sulawesi, Gorontalo, and Maluku. There are nearly 3,000 kilometers and much ocean between Maluku and South Sumatra making comparisons between these different provinces challenging. To use the indicator examples above, the percent of children with diarrhea in the last few weeks ranged from nine percent in Maluku and 24 percent
63

MCC INDONESIA NUTRITION PROJECT IMPACT EVALUATION BASELINE REPORT MATHEMATICA POLICY RESEARCH
in West Kalimantan. Or the percent of fully vaccinated children ranged from 43 percent in West Sulawesi to 77 percent in East Java (DHS 2013). Of course these are just a few indicators relevant to the project and they do not paint an overall picture of conditions, but they shed light on how vastly different underlying conditions are and how those underlying conditions could respond differently to the Nutrition Project.
Lastly, one might want to consider how relevant these results are to project design and policymaking in other countries. The Nutrition Project features community-health worker and CDD elements that are being implemented in a host of other countries and thus the results in Indonesia are of interest to other contexts. However, some unique context conditions could warrant caution when trying to apply these results elsewhere. For example, Indonesia is an upper-middle income country with a stunting rate usually only seen in lower-income countries. Indonesia is home to a unique infrastructure of child health centers (the posyandu) that don’t exist in other contexts, and Indonesia’s breastfeeding rates (although not exclusive) are among the highest in the world. These conditions might not rule out utilizing the Nutrition Project example when considering nutrition project designs elsewhere, but underscore the importance of considering the comparability of contexts in applying Nutrition Project research results around the world.
E. Dissemination, and plans for future data collection
Preliminary results from the baseline data were presented to MCC in July 2015 and to the MCA-I team in August in the interest of using the findings to inform aspects of the Project which were still being finalized. MCA-I also organized meetings with key stakeholders at the PNPM-Support Facility (PSF) and the Ministry of Health, and hosted a workshop for stakeholders from other organizations, including both government agencies and NGOs. Feedback from these sessions has been incorporated into this report. Anonymized versions of the baseline data files and all questionnaires will be made available on MCC’s website for public use.
We will continue to discuss endline timing with MCC and MCA-I. As noted in Chapter I, many Project activities have not yet begun, and thus an endline before the end of the Compact in April 2018 may not make sense if the expectation is that the impact on key outcomes like stunting will take several years post-implementation to materialize. Thus the timing of the endline should depend largely on how project activities are rolled out, and what potential activities will be implemented in the comparison groups at what time, as noted above in the internal validity section.
Qualitative work was anticipated by MCC after the quantitative baseline, and we also recommend qualitative data collection with the objective of explaining baseline findings and informing Project implementation. For example, as noted above, Indonesia’s breastfeeding initiation and persistence rates are impressively high. This demonstrates that there is a strong culture of breastfeeding to build upon. However, MCC and MCA-I might want to explore why the practice of exclusive breastfeeding is so low, and how to improve behaviors like preparing water for formula, washing and drying bottles, food hygiene and handwashing that may be exposing infants to contaminated water or food. For example, if exclusivity is low due to women needing to work away from their children and expressing breastmilk is not possible, it makes
64

MCC INDONESIA NUTRITION PROJECT IMPACT EVALUATION BASELINE REPORT MATHEMATICA POLICY RESEARCH
sense that the use of formula is so common. In that case, the focus might shift to making sure that formula is made using clean water and stored safely.
Related to sanitation, one puzzle is that many puskesmas seem to have sanitarians on staff and sanitarians report that they are conducting triggering, yet community respondents do not seem to be engaged with preventing open defecation. So the qualitative work might want to better understand these interactions, and examine why open defecation persists. The fact that sanitation officers seem to be active in villages suggests that they are not being effective in their messaging or there are other challenges affecting sanitation improvements. Sanitation officers report that the greatest challenges to making communities open defecation free are lack of interest among communities and funds for latrines – two barriers not addressed by the project in all communities. Qualitative work could further explore this lack of household interest and how that might be remedied by CLTS. If the qualitative work is to help inform project implementation, we recommend that it take place as soon as possible, since some activities are still under design and rollout.
Overall, there are some conditions in the evaluation provinces that present a solid foundation for maternal and child health improvements. Equipment at facilities, access, and health practitioner knowledge do not seem to be major barriers to addressing undernutrition as these conditions are adequate or good. However, impediments appear at the household level with potentially harmful infant and young child feeding practices and poor sanitation. We recommend that the Nutrition Project focus on these areas as MCA-I rolls out further Project activities in 2016 and beyond.
65

This page has been left blank for double-sided copying.

MCC INDONESIA NUTRITION PROJECT IMPACT EVALUATION BASELINE REPORT MATHEMATICA POLICY RESEARCH
REFERENCES
Ahmed, T., D. Auble, J. A. Berkley, R. Black, P. P. Ahern, M. Hossain, A. Hsieh, S. Ireen, M. Arabi, and J. I. Gordon. “An evolving perspective about the origins of childhood undernutrition and nutritional interventions that includes the gut microbiome.” Annals of the New York Academy of Sciences, vol. 1332, no. 1, 2014, pp. 22–38.
Alderman, Harold, John Hoddinott, and Bill Kinsey. “Long Term Consequences of Early Childhood Malnutrition.” Oxford Economic Papers, vol. 58, no. 3, 2006, pp. 450–474.
Baqui, A. H., R. E. Black, M. D. Yunus, A. R. A. Hoque, H. R. Chowdhury, and R. B. Sack. “Methodological Issues in Diarrhoeal Diseases Epidemiology: Definition of Diarrheal Episodes.” International Journal of Epidemiology, vol. 20, no. 4, 1991, pp. 1057-1063.
Basrowi, R. W., A. B. Sulistomo, N. P. Adi, and Y. Vandenplas. “Benefits of a Dedicated Breastfeeding Facility and Support Program for Exclusive Breastfeeding among Workers in Indonesia.” Pediatric Gastroenterology, Hepatology & Nutrition, vol. 18, no. 2, 2015, pp. 94–99.
Beatty, Amanda, Evan Borkum, Anu Rangarajan, Anna Gage, Claire Null, and Sukhmani Sethi. “MCC Indonesia Nutrition Project Impact Evaluation Design.” Princeton, NJ: Mathematica Policy Research, September 12, 2014.
Black, Robert E., Lindsay H. Allen, Zulfiqar A. Bhutta, Laura E. Caulfield, Mercedes de Onis, Majid Ezzati, Colin Mathers, and Juan Rivera. “Maternal and Child Undernutrition: Global and Regional Exposures and Health Consequences.” The Lancet, vol. 371, no. 9608, 2008, pp. 243–260.
Blaney, S., J. Februhartanty, and S. Sukotjo. “Feeding practices among Indonesian children above 6 months of age: a literature review on their magnitude and quality (part 1).” Asian Pacific Journal of Clinical Nutrition, vol. 24, no. 1, 2015a, pp. 16-27.
Blaney, S., J. Februhartanty, and S. Sukotjo. “Feeding practices among Indonesian children above 6 months of age: a literature review on their potential determinants (part 2).” Asian Pacific Journal of Clinical Nutrition, vol. 24, no. 1, 2015b, pp. 28-37.
Clasen, T., S. Boisson, P. Routray, B. Torondel, M. Bell, O. Cumming, J. Ensink, M. Freeman, M. Jenkins, M. Odagiri, S. Roy, A. Sinha, M. Suar, and W. Schmidt. “Effectiveness of a rural sanitation programme on diarrhoea, soil-transmitted helminth infection, and child malnutrition in Odisha, India: a cluster-randomised trial.” The Lancet Global Health, vol. 2, no. 11, 2014, pp. e645-e653.
Crane, R. J., K. D. J. Jones, and J. A. Berkley. “Environmental enteric dysfunction: An overview.” Food and Nutrition Bulletin, vol. 36, no. 1 0, 2015, pp. S76–S87.
De Onis, Mercedes, Monika Blössner, and Elaine Borghi. “Prevalence and Trends of Stunting Among Pre-School Children, 1990–2020.” Public Health Nutrition, vol. 15, no. 1, 2012, pp. 142–148.
67

MCC INDONESIA NUTRITION PROJECT IMPACT EVALUATION BASELINE REPORT MATHEMATICA POLICY RESEARCH
Departemen Kesehatan RI. “Riset Kesehatan Dasar: Riskesdas 2010.” Jakarta: Badan Penelitian dan Pengembangan Kesehatan, Departemen Kesehatan RI, 2010.
Demographic and Health Survey. “Indonesia Demographic and Health Survey 2012.” Jakarta, Indonesia: Statistics Indonesia (Badan Pusat Statistik), National Population and Family Planning Board, and Kementerian Kesehatan (Kemenkes-MOH), and ICF International, 2013.
Engebretsen, I. M., D. Jackson, L. T. Fadnes, V. Nankabirwa, A. H. Diallo, T. Doherty, C. Lombard, S. Swanvelder, J. Nankunda, V. Ramokolo, D. Sanders, H. Wamani, N. Meda, J. K. Tumwine, E. C. Ekström, P. Van de Perre, C. Kankasa, H. Sommerfelt, and T. Tylleskär. “Growth effects of exclusive breastfeeding promotion by peer counsellors in sub-Saharan Africa: the cluster-randomised PROMISE EBF trial.” BMC Public Health, vol. 14, no. 633, 2014.
Gilmartin, A. A. and W. A. Petri. “Exploring the role of environmental enteropathy in malnutrition, infant development and oral vaccine response.” Philosophical Transactions B, vol. 370, no. 1671, 2015.
Glewwe, Paul, and Elizabeth M. King. “The Impact of Early Childhood Nutritional Status on Cognitive Development: Does the Timing of Malnutrition Matter?” The World Bank Economic Review, vol. 15, no. 1, 2001, pp. 81–113.
Hoddinott, John, Harold Alderman, Jere R. Behrman, Lawrence Haddad and Susan Horton. "The Economic Rationale Forinvesting in Stunting Reduction." Maternal and Child Nutrition, 9(Suppl. 2), 2013, pp. 69-82.
Hoddinott, John, Jere R. Behrman, John A. Maluccio, Paul Melgar, Agnes R. Quisumbing, Manuel Ramirez-Zea, Aryeh D. Stein, Kathryn M. Yount and Reynaldo Martorell. "Adult Consequences of Growth Failure in Early Childhood." The American Journal of Clinical Nutrition, 98(5), 2013, pp. 1170-78.
Jones, A. D., S. B. Ickes, L. E. Smith, M. N. N. Mbuya, B. Chasekwa, R. A. Heidkamp, P. Menon, A. A. Zongrone, and R. J. Stoltzfus. “World Health Organization infant and young child feeding indicators and their associations with child anthropometry: a synthesis of recent findings.” Maternal & Child Nutrition, vol. 10, no. 1, 2014, pp. 1-17.
Lindenmayer, G. W., R. J. Stoltzfus, and A. J. Prendergast. “Interactions between Zinc Deficiency and Environmental Enteropathy in Developing Countries.” Advances in Nutrition, vol. 5, no. 1, 2014, pp. 1-6.
Maccini, Sharon, and Dean Yang. “Under the Weather: Health, Schooling, and Economic Consequences of Early-Life Rainfall.” The American Economic Review, 2009, pp. 1006–1026.
68

MCC INDONESIA NUTRITION PROJECT IMPACT EVALUATION BASELINE REPORT MATHEMATICA POLICY RESEARCH
Miller, A. C., M. B. Murray, D. R. Thomson, and M. C. Arbour. “How consistent are associations between stunting and child development? Evidence from a meta-analysis of associations between stunting and multidimensional child development in fifteen low- and middle-income countries.” Public Health Nutrition, vol. FirstView, no. Supplement -1, 2015, pp. 1-9.
Mize, Lucy. “The Paradox of the Posyandu: Challenges for Community Health Services in Indonesia.” Canberra City: AusAID, Health Resource Facility, 2012.
Naylor, C., M. Lua, R. Haque, D. Mondal, E. Buonomo, U. Nayak, J. C. Mychaleckyj, B. Kirkpatrick, R. Colgate, M. Carmolli, D. Dickson, F. van der Klis, W. Weldon, M. S. Oberste, The PROVIDE study teams, J. Z. Ma, and W. A. Petri Jr. “Environmental Enteropathy, Oral Vaccine Failure and Growth Faltering in Infants in Bangladesh.” EBioMedicine, vol. 2, no. 11, 2015, pp. 1759-1766.
Nyaradi, Anett, Li Jianghong, Siobhan Hickling, Jonathan Foster, and Wendy Oddy. “The Role of Nutrition in Children’s Neurocognitive Development, from Pregnancy through Childhood.” Frontiers in Human Neuroscience, vol. 7, no. 97. doi http://journal.frontiersin.org/Journal/10.3389/fnhum.2013.00097/full
Onyango, A. W., E. Borghi, M. de Onis, E. A. Frongillo, C. G. Victora, K. G. Dewey, A. Lartey, N. Bhandari, A. Baerug, and C. Garza. “Successive 1-Month Weight Increments in Infancy Can Be Used to Screen for Faltering Linear Growth.” Journal of Nutrition, vol. 145, no. 12, 2015, pp. 2725-2731.
Patil S. R., B. F. Arnold, A. L. Salvatore, B. Briceno, S. Ganguly, J. M. Colford Jr, and P. J. Gertler. “The Effect of India's Total Sanitation Campaign on Defecation Behaviors and Child Health in Rural Madhya Pradesh: A Cluster Randomized Controlled Trial.” PLoS Med, vol. 11, no. 8, 2014.
Patwari, A. K., S. Kumar, and J. Beard. “Undernutrition among infants less than 6 months of age: an underestimated public health problem in India.” Maternal & Child Nutrition, vol. 11, no. 1, 2015, pp. 119–126.
Petri, W. A., C. Naylor, and R. Haque. “Environmental enteropathy and malnutrition: do we know enough to intervene?” BMC Medicine, vol. 12, no. 187, 2014.
Pickering, A. J., H. Djebbari, C. Lopez, M. Coulibaly, and M. L. Alzua. “Effect of a community-led sanitation intervention on child diarrhoea and child growth in rural Mali: a cluster-randomised controlled trial.” Lancet Global Health, vol. 3, no. 11, 2015, pp. e701-e711.
Reinbott, A., J. Kuchenbecker, J. Herrmann, I. Jordan, E. Muehlhoff, O. Kevanna, and M. Krawinkel. “A child feeding index is superior to WHO IYCF indicators in explaining length-for-age Z-scores of young children in rural Cambodia.” Paediatrics and International Child Health, vol. 35, no. 2, 2015, pp. 124–134.
69

MCC INDONESIA NUTRITION PROJECT IMPACT EVALUATION BASELINE REPORT MATHEMATICA POLICY RESEARCH
Ryan, K. N., K. B. Stephenson, I. Trehan, R. J. Shulman, C. Thakwalakwa, E. Murray, K. Maleta, and M. J. Manary. “Zinc or Albendazole Attenuates the Progression of Environmental Enteropathy: A Randomized Controlled Trial.” Clinical Gastroenterology and Hepatology, vol. 12, no. 9, 2014, pp. 1507-1513.e1.
Ruel, Marie T., and Harold Alderman. “Nutrition-Sensitive Interventions and Programmes: How Can They Help to Accelerate Progress in Improving Maternal and Child Nutrition?” The Lancet, vol. 382, no. 9891, 2013, pp. 536–551.
Smith, H. E., K. N. Ryan, K. B. Stephenson, C. Westcott, C. Thakwalakwa, K. Maleta, J. Y. Cheng, J. T. Brenna, R. J. Shulman, I. Trehan, and M. J. Manary. “Multiple micronutrient supplementation transiently ameliorates environmental enteropathy in Malawian children aged 12-35 months in a randomized controlled clinical trial.” Journal of Nutrition, vol. 144, no. 12, 2014, pp. 2059-2065.
Stewart, C. P., L. Iannotti, K. G. Dewey, K. F. Michaelsen, and A. W. Onyango. “Contextualizing Complementary Feeding in a Broader Framework for Stunting Prevention.” Maternal and Child Nutrition, vol. 9, no. Suppl 2, 2013, pp. 27–45.
Susiloretni, K. A., H. Hadi, Y. S. Prabandari, Y. S. Soenarto, and S. A. Wilopo. “What Works to Improve Duration of Exclusive Breastfeeding: Lessons from the Exclusive Breastfeeding Promotion Program in Rural Indonesia.” Maternal and Child Health Journal, vol. 19, no. 7, 2015, pp. 1515-1525.
Titaley, C. R., P. C. Loh, S. Prasetyo, I. Ariawan, and A. H. Shankar. “Socio-economic factors and use of maternal health services are associated with delayed initiation and non-exclusive breastfeeding in Indonesia: secondary analysis of Indonesia Demographic and Health Surveys 2002/2003 and 2007.”Asian Pacific Journal of Clinical Nutrition, vol. 23, no. 1, 2014, pp. 91-104.
United Nations Children’s Fund. “The State of the World’s Children 2012: Children in an Urban World.” New York: United Nations Children's Fund, 2012.
———. “Nutrition: Breastfeeding.” Available at [http://www.unicef.org/nutrition/ index_24824.html]. Accessed April 17, 2014.
Victora, Cesar G., Linda Adair, Caroline Fall, Pedro C. Hallal, Reynaldo Martorell, Linda Richter, and Harshpal S. Sachdev. “Maternal and Child Undernutrition: Consequences for Adult Health and Human Capital.” The Lancet, vol. 371, no. 9609, 2008, pp. 340–357. Young, G. P., E. K. Mortimer, G. L. Gopalsamy, D. H. Alpers, H. J. Binder, M. J. Manary, B. S. Ramakrishna, I. L. Brown, and T. G. Brewer. “Zinc deficiency in children with environmental enteropathy—development of new strategies: report from an expert workshop.” The American Journal of Clinical Nutrition, vol. 100, no. 4, 2014, pp. 1198–1207.
World Health Organization. “Global Database on Child Growth and Malnutrition.” Available at http://www.who.int/nutgrowthdb/about/introduction/en/index2.html. Accessed December 23, 2015.
70

APPENDIX A: ADMINISTRATION

This page has been left blank for double-sided copying.

MCC INDONESIA NUTRITION PROJECT IMPACT EVALUATION BASELINE REPORT MATHEMATICA POLICY RESEARCH
A. Institutional review board
Mathematica is committed to protecting the rights and welfare of human subjects by obtaining approval from an Institutional Review Board (IRB) for all relevant research activities. To ensure that the study met local research standards for ethical clearance, we received IRB approval from the Ethics Committee of Faculty of Medicine at the University of Indonesia.
The application consisting of a research proposal, questionnaires, informed consent forms, and application form was submitted to the IRB. The application was approved by the IRB without any changes to the study on September 2, 2014. After approval, revised final versions of the questionnaires were submitted to the IRB and approved.
B. Data access, privacy and documentation plan
As outlined in the EDR, Mathematica will deliver a package of anonymized quantitative baseline data to MCC in 2016. The package will consist of three separate, well-documented, Stata data sets: a raw data file, a clean file suitable for internal use with complete, non-anonymized data, and a clean file suitable for public use with anonymized data. In addition, each package will include standardized metadata in the MCC Evaluation Metadata Template, enumerator and trainer manuals and questionnaires as specified in the MCC Data Anonymization Guidelines. All materials will be provided in English. MCC will make the data available for public use as per its policy (see http://data.mcc.gov/evaluations/index.php/catalog).
We will ensure that the public-use data sets maintain the privacy of survey respondents. To minimize the risk of disclosing sensitive information or the identity of survey respondents, the public data files will be anonymized by omitting some variables and replacing others with recoded or grouped data. These measures are designed to retain the usefulness of the data while preserving the privacy of survey respondents.
C. Evaluation team roles and responsibilities
Our team will do its best to meet MCC and MCA-I’s evaluation needs. Dr. Anu Rangarajan leads the team as the program manager and oversees the design and implementation of the evaluation, working closely with and providing input to team members as necessary. Ms. Amanda Beatty and Dr. Clair Null serve as deputy program managers, and assume primary responsibility for coordinating deliverables and for ensuring the on-time completion of tasks within budget and with high quality. (Dr. Null assumed this role from August 2014 to October 2015 while Ms. Beatty was on a leave of absence from Mathematica.) Dr. Evan Borkum directs the development of the evaluation design and works as the team’s lead economist, supported by Dr. Nicholas Ingwersen who joined the project in August 2015. Mr. William Leith is the lead programmer responsible for data management and analysis. Mr. Jeremy Brecher-Haimson manages the project internally for Mathematica. Dr. Airin Roshita, a nutrition expert at the University of Indonesia, is a local consultant and works closely with us, MCA-I and GoI stakeholders to ensure that the activities are implemented as planned. Dr. Anuraj Shankar is a senior analyst and nutrition specialist, and provides guidance on technical design aspects of the project. Dr. Elizabeth Frankenburg has assisted in reviewing the survey to ensure quality, and Dr. Jere Behrman will review other key deliverables for quality, especially related to technical aspects of the evaluation design. In addition, we worked
A.3
MCC INDONESIA NUTRITION PROJECT IMPACT EVALUATION BASELINE REPORT MATHEMATICA POLICY RESEARCH
with a team of six Indonesian consultants let by Pak Dedy Junaedi and Bu Upik Sabainingrum for the data validation process.
D. Baseline survey budget
MCA-I originally estimated that the baseline survey would cost approximately Rp 13 billion, or about USD 1.14 million, in a budget submitted to MCC in 2013. This figure included several assumptions, including a household sample size twice that of what was actually done, that would result in a substantially different spending amount. The final budget for SurveyMETER was $1.4 million, including survey management staff, field materials and equipment, anthropometric equipment, training, survey pilot, fieldwork and data cleaning. Note that because the sample sizes are larger for the endline survey than for the baseline, this figure is not an accurate estimate of the budget that will be required for endline.
A.4

APPENDIX B: TECHNICAL

This page has been left blank for double-sided copying.

MCC INDONESIA NUTRITION PROJECT IMPACT EVALUATION BASELINE REPORT MATHEMATICA POLICY RESEARCH
A. Data collection methods and quality assurance
After receiving the draft instruments from Mathematica, SurveyMETER translated tham into Indonesian and conducted pilot testing of the instruments in the kabupaten of Mempawah in the province of West Kalimantan, which was outside the study area. The pilot test assessed the quality of the questions in the field setting, making sure that they were understandable, appropriate and organized logically. After the pilot test, questions were revised and tested again in a pretest. The pretest was a dry run of all field activities which helped identify any lingering errors, corrected the additional materials and visual aids required for some questions, and confirmed the target timing and number of field officers required to implement the full study.
For the main fieldwork, SurveyMETER provided training to the enumerators on both how to list and identify sample households and administer the surveys prior to data collection. SurveyMETER developed manuals and presentation materials used in the training. Training for the listing was held for three days, from November 14 to 16, 2014. This training was held simultaneously with the training on the household and community surveys, which lasted for nine days from November 14 to 25, 2014. (Separate teams conducted the listing and the data collection.) Topics covered in these trainings included an overview of the study, rules for filling out the questionnaires, interview techniques and demonstrations, field practice administering the surveys, and how to use the Computer Assisted Personal Interviewing (CAPI) software. Finally, SurveyMETER and Mathematica held a training for health officers from November 19 to 25 on collecting anthropometric measurements for the sample of young children and pregnant women.
Household data was collected in teams of six, which included a supervisor, a data supervisor, three interviewers, and a health officer (for anthropometric measurements) working in a kecamatan. The household questionnaires were administered using CAPI software, using laptops to enter data during the interview. The CAPI software allowed for automated quality checks, such as validation checks that ensured skip patterns were followed, questions were fully answered, responses matched answer options (for categorical variables) or fell within a reasonable range (for continuous variables), and respondents provided consistent answers across questions. The data supervisor checked the entered data on a daily basis for completeness and consistency. In addition the data supervisor listened to recordings of the interviews to identify any problems with the interview process.
As part of the data collection effort, the interview team’s health officer took various anthropometric measurements of pregnant women and children under 36 months, as listed in the anthropometric sections of Table II.1. Measurements included weight and hemoglobin levels for both sample populations, height and MUAC for pregnant women, and height or length for young children. As per WHO protocol, children under age two were measured lying down (length) and children over age two were measured standing (height). All measurements were conducted twice, and if the measurements were substantially different (i.e. more than 0.7 cm for height/length), a third measurement was taken. The health officer collected hemoglobin concentration data using
B.3

MCC INDONESIA NUTRITION PROJECT IMPACT EVALUATION BASELINE REPORT MATHEMATICA POLICY RESEARCH
a finger prick instrument (Heomcue) to gather a drop of blood.65 They did not measure anemia among children less than six months since the blood draw is not recommended for such young children.
The survey team also collected anthropometric data from the household buku KIA/KMS when available. For children’s birth weight, SurveyMETER used buku KIA/KMS and self-reports (recall) if the buku KIA/KMS was not available. SurveyMETER also captured gestational age at birth from the buku KIA/KMS as this indicator naturally relates to birthweight.
The remaining surveys – kepala desa, bidan, kader posyandu, and puskemas surveys - were administered using traditional pencil and paper with field-level data entry. Teams noted responses in paper questionnaires, and data were entered on laptops in the field within several days of the interview. A second entry was conducted using the paper questionnaires at SurveyMETER headquarters, and then SurveyMETER undertook a cleaning process to reconcile any differences between the first and second entries. Throughout the data collection process, SurveyMETER also checked the household and community level data for outliers and consistency using Stata.
Concurrently, Mathematica conducted an independent effort to validate the quality of the data. A team of seven local consultants including nutritionists and survey experts observed the data collection activities conducted by SurveyMETER, conducted back checks (i.e., re-interviewed and re-measured a subset of respondents) and provided feedback to MCC and MCA-I. This validation team worked in pairs of one nutritionist and one survey expert to review the anthropometry collection and general survey practices conducted by SurveyMETER. Based on the validation team’s observations, we were confident that SurveyMETER adhered to all study protocols, including identifying eligible respondents, selecting a random sample, consenting respondents, probing appropriately during surveys, accurately measuring children, and referring respondents to health facilities for anemia and illness. Upon inspecting the full dataset, we did note that four of the 14 health officers recorded the same length or height measurement twice for more than two-thirds of the children they measured, which suggests that they might not have completely reset the measuring device for the second measurement although it does not necessarily imply that the measures were biased in any way. Another anthropometrist appears to have approximated some measurements based on a higher-than expected share of the measurements ending in a zero or a five, and three anthropometrists had standard deviations of more than 1.20 in the heigh-for-age z-scores of the children they measured. Excluding these anthropometrists (who measured roughly half of the children in the sample), we find a stunting prevalence rate that is roughly 1.5 percentage points higher than in the full sample.
B. Sampling approach
SurveyMETER drew the sample of households, pregnant women, and caregivers using a three-stage sampling approach in each eligible kecamatan as described in their report “Field
65 Although the team did not use individually-wrapped cuvettes and each field staff carried their own bottle, we see no relationship between the time since the bottle was opened and the hemoglobin reading. This is likely because the field protocol specified that everything else for the hemoglobin measurement was set up before the bottle of cuvettes was opened so that the bottle was open for as little time as possible. New bottles were opened approximately every 25 days given the pace of field work.
B.4

MCC INDONESIA NUTRITION PROJECT IMPACT EVALUATION BASELINE REPORT MATHEMATICA POLICY RESEARCH
report: Data collection for the baseline survey of the Community-Based Health and Nutrition to Reduce Stunting project” (2015). The process involved randomly selecting desa (the primary sampling unit) within each kecamatan, then secondary sampling units within each sampled desa (these sampling units could be dusun, RTs, or RWs, depending on the structure and size of the desa), and finally respondents (household, pregnant woman, and caregivers) within each sampled secondary sampling unit.
In each kecamatan, MCA-I randomly selected four desa into the sample. If the population of a sampled desa was greater than 250 households, SurveyMETER determined the appropriate administrative level to use as the secondary sampling unit based on having an average population size of approximately 250 households: either the dusun or a sub-village unit (RT or RW). SurveyMETER then developed a list of all the secondary sampling units in the desa with the help of the kepala desa and randomly selected one. All households in the secondary sampling unit were listed in order to identify those with eligible respondents.
To draw the sample of respondents, SureyMETER worked from the results of the listing. Households that had both a pregnant woman and a child under three were included in the pregnant women sampling frame. If a household had more than one child under three, one was randomly selected as the index child for the purposes of the survey and measurements. If a sampled respondent was not successfully interviewed after three attempts, SurveyMETER randomly selected a replacement respondent of the same type in order to meet the enrollment targets. If the secondary sampling unit did not have enough pregnant women or caregivers to meet the target for the desa (two pregnant women and four caregivers), SurveyMETER made up the difference by interviewing extra respondents of the same type from one of the other sampled desa in the same kecamatan.
In addition to interviewing pregnant women and caregivers of children 0-35 months, SurveyMETER also gathered baseline data from community service providers and leaders. These individuals and facilities were sampled using the following methods, as also described in SurveyMETER’s report:
Puskesmas: All main puskesmas located in the sampled kecamatan were selected for the sample. Generally there is one puskemas per kecamatan. Several different respondents at each puskesmas responded to the administrative portion, including administration staff, puskesmas treasurer, personnel and drug and vaccine supply personnel. If an official bidan coordinator, nutritionist, or sanitarian was not available at the puskesmas, SurveyMETER interviewed the staff who took on these responsibilities or was most knowledgeable about these activities.
Bidan: A listing of the bidan working in a sample desa was developed with help from the kepala desa or the bidan coordinator at the puskesmas. If there was more than one bidan in the sample village, SurveyMETER randomly sampled one bidan. If there was no bidan assigned to the sampled desa, the interview was conducted with another bidan who practiced in the desa, or a bidan in another desa who serves the population of the sampled desa. Ultimately, eleven bidan were interviewed as serving two different desa in the same kecamatan. In the presentation of results, we include both of these observations for measures that relate to characteristics of the desa (e.g. if the bidan lived in the desa or how many other bidan were reported to serve that desa), but only include these respondents once in measures that relate to the bidan’s knowledge
B.5

MCC INDONESIA NUTRITION PROJECT IMPACT EVALUATION BASELINE REPORT MATHEMATICA POLICY RESEARCH
or practices. Twenty seven respondents in the bidan coordinator survey were also interviewed as bidan for a sampled desa (all but one of these cases were desa in the same kecamatan as the puskesmas where the bidan coordinator worked); in one of these 27 cases, the bidan coordinator was actually interviewed as the bidan for two sampled desa.
Kader posyandu: SurveyMETER gathered information from caregiver surveys regarding which posyandu the sampled households attend. One posyandu in each sample desa was selected and information was gathered from multiple kader to get the most accurate/complete responses. The primary respondent was the posyandu head or the most active kader knowledgeable at the posyandu’s activities.
Kepala desa: SurveyMETER completed four kepala desa interviews per kecamatan in the sample desa. The primary respondent was the kepala desa or desa secretary along with their staff most knowledgeable about the desa’s characteristics and community activities.
FD/KPMD: Because the FD/KPMD are affiliated with Generasi, FD/KPMD were only interviewed in sampled desa in treatment kecamatan. Note that it was common that the FD/KPMD for a desa was also a kader posyandu. If that was the case, the individual was administered both surveys but questions that were identical between the instruments were skipped.
C. Analysis weights
The weighting scheme for the analysis of the baseline household data had two purposes: (1) to ensure that the sample of households, pregnant women, and caregivers was representative of the relevant population in all kecamatan included in the evaluation, so that we could report valid population-level averages for these areas; and (2) to enable us to conduct a valid comparison of average outcomes of these groups in the treatment and control kecamatan, to assess the validity of the random assignment design. The construction of the weights for these two purposes was largely similar. However, because of differences in the probability of treatment assignment across kecamatan, the weights for the treatment-control comparisons had an additional component. In total, we therefore computed six sets of weights: for each of the three types of respondents (household, pregnant woman, and caregiver) we computed separate sets of weights for analysis of population level averages and for comparisons between the treatment and control groups. The weights account for the following:
Differences in sampling probabilities across respondents. The overall sampling probability accounted for each of the three stages of selection described above (desa within kecamatan, secondary sampling unit within desa, respondents within secondary sampling unit), by multiplying together the probability of selection in each stage. The inverse of the combined sampling probability was used to obtain a respondent-level sampling weight for each of the three types of respondent.
Possible differential nonresponse across kecamatan. To adjust for possible systematic nonresponse among certain types of kecamatan, we computed the response rate for each kecamatan. We used the inverse of this response rate to obtain a nonresponse weight for each of the three types of respondents in a given kecamatan.
B.6

MCC INDONESIA NUTRITION PROJECT IMPACT EVALUATION BASELINE REPORT MATHEMATICA POLICY RESEARCH
Differences in random assignment probabilities (treatment-control comparisons only). As described in the design report (Beatty, Borkum et al. 2014), the method used to randomly assign kecamatan to the treatment group resulted in different probabilities of assignment. To ensure that kecamatan characteristics were not correlated with treatment status, which would affect the validity of treatment-control comparisons, it was necessary to adjust for these differences. We estimated the probability of assignment to the treatment group for each kecamatan by running 1,000 iterations of the random assignment code. The random assignment weight for each kecamatan was then calculated as the inverse of the probability of selection into its group (treatment or control).
For the analysis of population level averages, we combined the sampling and non-response weights by multiplication to yield three sets of respondent-level weights (one for each of the three types of respondents). For the analysis of treatment-control differences, we combined the sampling, non-response, and random assignment weights by multiplication, yielding three more sets of weights. For each of these six sets of weights, we then adjusted for outliers by top-coding the weights at the 95th percentile. Finally, we normalized each of the six sets of weights so that their sum was equal to the number of observations.
We also computed weights for the analysis of desa-level respondents (kepala desa, KPMD, and kader posyandu). For each of these desa-level respondents, we started with the inverse of the desa-level sampling probability as the sampling weight, and for kepala desa and KPMD this was the only weight used for reporting population-level averages. For kader posyandu we computed an additional sampling weight that accounted for the number of posyandu in the desa.66 For treatment-control comparisons of all respondents other than KPMD (since there are no KPMD in comparison areas), we also multiplied the sampling weight by the random assignment weight. Again, each set of weights was normalized so that its sum was equal to the number of observations. Finally, for analysis of puskesmas respondents, which are at the kecamatan level, we did not use weights for the population-level analysis but used the inverse of the random assignment weight (normalized) for treatment-control comparisons.
D. Analysis approach
In addition to describing the characteristics of the sample, the baseline analysis seeks to assess the similarity between the treatment and control groups at baseline (although, as discussed in Chapters I and III, some indicators might have already started to change based on aspects of the program already being underway by the time of the baseline survey). Given the use of random assignment, the basic method for making these comparisons is simply to compare mean outcomes between the treatment and control groups. However, to account for key features of the
66 We make the simplifying assumption that all posyandu in the desa had equal probability of being selected since we do not have information on how many posyandu there were in each secondary sampling unit.
B.7

MCC INDONESIA NUTRITION PROJECT IMPACT EVALUATION BASELINE REPORT MATHEMATICA POLICY RESEARCH
evaluation design we conducted the baseline analysis using the following ordinary least squares regression framework, which includes district fixed effects and clusters the standard errors at the kecamatan level67:
(1)
In this regression, Yij is an outcome for individual i who lives in kecamatan j; Tj is a binary indicator for whether kecamatan j was assigned to the treatment group; λk is a vector of district fixed effects, each of which is equal to one if kecamatan j is located in district k and zero otherwise; and υj and εij are random error terms at the kecamatan and individual levels, respectively. The vector of district fixed effects, λk, accounts for the implicit stratification of randomization by district—effectively, the treatment-control differences are estimated separately for each district and then combined. The coefficient β in regression (1) gives the treatment-control difference adjusted for district fixed effects.
This regression model enabled us to account for features of the evaluation design—specifically the allocation of the sample by district strata, through the inclusion of λk. In addition, because the unit of intervention is the kecamatan, to obtain the correct standard error for the difference β we had to account for the fact that outcomes in the same kecamatan are likely correlated. (This correlation is reflected in the kecamatan-level error term, υj.) The regression model enabled us to account for this using the “cluster” correction in Stata, with the kecamatan as the level of clustering.
In the results by treatment and control group that we present in Chapter III, we report the coefficient from regression (1) added to the weighted means for each outcome among the control group as the adjusted mean for the treatment group. Reported p-values are for the two-tailed test of the hypothesis that β=0.
67 In the case of a binary outcome (for example, whether a child is stunted), equation (1) is termed a linear probability model. Although probit or logit models are often used for binary outcomes, we prefer a linear probability model because it is easier to interpret and relies on weaker parametric assumptions. In practice, probit or logit and linear probability models generally yield similar results for the types of marginal effects that we are estimating here (Angrist and Pischke 2008; Wooldridge 2010).
ij j k j ijY Tα β λ υ ε= + + + +
B.8
APPENDIX C:
KNOWLEDGE LEVELS AMONG SURVEY RESPONDENTS

This page has been left blank for double-sided copying.

C.3
Table C.1. Knowledge levels among survey respondents
Percentage of respondents with correct answer to knowledge questions
Survey Question A. Caregiver
(N=3039)
B. Pregnant Woman
(N=1520)
C. Kader Posyandu
N=732 D. Bidan N=570
E. Bidan Coordinator
N=237 F. Nutritionist
N=214 G. Sanitarian
N=203
Prenatal nutrition What anemia is n.a. n.a. 80.3 100.0 99.2 100.0 n.a. Risks of anemia during pregnancy n.a. n.a. n.a. 99.6 99.1 n.a. n.a. At least 90 IFA tablets should be taken during pregnancy n.a. n.a. 42.3 93.5 96.2 n.a. n.a. Side effects of taking IFA tablets n.a. n.a. n.a. 93.8 94.5 n.a. n.a. Should eat more food during pregnancy n.a. n.a. 76.2 94.6 94.1 97.7 n.a.
Breastfeeding Breastfeeding should begin soon after birth 70.3 72.1 75.6 91.6 92.9 86.8 n.a. Colostrum is healthy for infants n.a. n.a. n.a. 99.8 100.0 100.0 n.a. Babies should get sugar right after birth (false) n.a. n.a. n.a. 98.2 98.7 100.0 n.a. Low weight or premature babies are not too weak to breastfeed n.a. n.a. n.a. 75.6 60.9 71.0 n.a. Benefits of kangaroo care n.a. n.a. n.a. 99.3 99.2 n.a. n.a. When baby can consume liquids other than breastmilk (6 months) 42.0 33.8 52.4 85.3 89.9 91.1 n.a. Mother should breastfeed with a cold n.a. n.a. n.a. 93.3 95.4 n.a. n.a. Times a day that mother should breastfeed a child below six months (8-12 times a day) n.a. n.a. 8.8 19.3 16.9 n.a. n.a. Exclusive breastfeeding is an effective contraceptive n.a. n.a. n.a. 93.7 90.3 n.a. n.a. Mother should frequently switch breasts during breastfeeding n.a. n.a. n.a. 97.5 94.1 n.a. n.a. Mother should continue breastfeeding if breasts engorged n.a. n.a. n.a. 91.2 96.2 n.a. n.a. Continue breastfeeding if nipples are sore or cracked n.a. n.a. n.a. 79.5 86.9 n.a. n.a. Approved advice for mother with sore or cracked nipples n.a. n.a. n.a. 98.6 96.5 n.a. n.a.

C.4
Percentage of respondents with correct answer to knowledge questions
Survey Question A. Caregiver
(N=3039)
B. Pregnant Woman
(N=1520)
C. Kader Posyandu
N=732 D. Bidan N=570
E. Bidan Coordinator
N=237 F. Nutritionist
N=214 G. Sanitarian
N=203
Mother should breastfeed more if child develops diarrhea n.a. n.a. 2.0 90.0 94.1 96.7 n.a. Mother should continue breastfeeding if she learns she is pregnant n.a. n.a. n.a. 37.5 32.9 n.a. n.a.
Complementary feeding 4 months is too early for baby to eat rice n.a. n.a. 92.1 98.4 94.9 97.2 n.a. Complementary feeding should start at 3 months (false) n.a. n.a. 88.4 99.5 97.9 n.a. n.a. Mother should breastfeed for at least 2 years n.a. n.a. 79.0 83.2 84.4 89.3 n.a. Mother should start complementary feeding at 6 months 95.0 71.9 46.7 83.3 81.4 87.4 n.a.
Taburia Familiar with Taburia 18.3 16.9 35.8 71.1 85.2 96.3 n.a. Child should start receiving Taburia at 6 months n.a. n.a. n.a. 65.1 74.3 91.1 n.a. Child should receive Taburia every other day 3.8 2.4 4.4 8.1 12.2 31.8 n.a. Child should receive Taburia for 4 consecutive months 0.3 0.2 0.3 0.2 0.4 5.6 n.a. Taburia should not be mixed with hot food 12.4 10.2 n.a. 57.7 70.0 90.2 n.a. Taburia should be mixed with water 6.3 5.6 n.a. 29.3 n.a. 69.6 n.a. Benefits of Taburia 15.6 14.9 34.3 69.4 83.1 94.8 n.a.
Diarrhea Symptoms of diarrhea in children under 5 86.7 84.8 98.4 100.0 99.2 n.a. 100.0 Diarrhea can be prevented in children under 5 n.a. n.a. 97.6 99.5 97.9 n.a. 100.0 Strategies to prevent diarrhea in children under 5 63.2 53.4 92.8 99.3 97.3 n.a. 99.5 Child with diarrhea should receive more fluid than one without 57.9 53.9 83.9 95.8 94.9 94.4 90.1

C.5
Percentage of respondents with correct answer to knowledge questions
Survey Question A. Caregiver
(N=3039)
B. Pregnant Woman
(N=1520)
C. Kader Posyandu
N=732 D. Bidan N=570
E. Bidan Coordinator
N=237 F. Nutritionist
N=214 G. Sanitarian
N=203
Treatments for a child with diarrhea 90.6 85.4 98.3 100.0 99.1 100.0 99.0
Malaria Symptoms of malaria 72.7 75.5 91.7 99.5 n.a. n.a. n.a. Malaria can be prevented n.a. n.a. 95.6 99.6 n.a. n.a. n.a. Prevention methods for malaria 76.7 76.2 89.4 99.6 n.a. n.a. n.a. Danger of malaria to pregnant women n.a. n.a. n.a. 94.7 n.a. n.a. n.a.
Hygiene and sanitation Occasions when a caregiver should wash hands n.a. n.a. 99.6 100.0 99.1 n.a. 100.0 Minimum distance latrine should be from water (10 meters) n.a. n.a. n.a. n.a. n.a. n.a. 77.3

This page has been left blank for double-sided copying.

This page has been left blank for double-sided copying.

www.mathematica-mpr.com
Improving public well-being by conducting high quality, objective research and data collection PRINCETON, NJ ■ ANN ARBOR, MI ■ CAMBRIDGE, MA ■ CHICAGO, IL ■ OAKLAND, CA ■ WASHINGTON, DC
Mathematica® is a registered trademark of Mathematica Policy Research, Inc.