mcc indonesia procurement modernization project evaluation
TRANSCRIPT

Evaluation Design Report
Final
MCC Indonesia Procurement
Modernization Project
MCC-15-CL-002
February 1, 2017
Prepared for: Millennium Challenge
Corporation 1099 14th Street NW
Washington, DC 20005
Submitted by: Abt Associates
4550 Montgomery Avenue Suite 800 North
Bethesda, MD 20814
CONTENTS
Abt Associates Insert Name of Deliverable ▌pg. i
Table of Contents
1. Introduction .............................................................................................................................. 1 1.1 Background ...................................................................................................................... 1
1.1.1 Country Context .................................................................................................. 1 1.1.2 Objectives of This Report ................................................................................... 4
2. Overview of the Compact and the Interventions Evaluated ................................................ 5 2.1 Overview of the Project and Implementation Plan .......................................................... 5
2.1.1 Original Project Description ............................................................................... 5 2.1.2 Project Participants ............................................................................................. 7 2.1.3 Geographic Coverage .......................................................................................... 8 2.1.4 Implementation Plan ......................................................................................... 10 2.1.5 Description of Implementation to Date ............................................................. 10
2.2 Theory of Change ........................................................................................................... 13 2.3 Cost-Benefit Analysis and Beneficiary Analysis ........................................................... 14
3. Literature Review .................................................................................................................. 16 3.1 Summary of the Existing Evidence ................................................................................ 16 3.2 Gaps in Literature ........................................................................................................... 19
4. Evaluation Design .................................................................................................................. 21 4.1 Policy Relevance of the Evaluation ............................................................................... 21 4.2 Evaluation Questions ..................................................................................................... 21 4.3 Evaluation Design Overview ......................................................................................... 24 4.4 Quantitative Approach ................................................................................................... 29
4.4.1 Methodology ..................................................................................................... 29 4.4.2 Timeframe of Exposure .................................................................................... 30 4.4.3 Study Sample .................................................................................................... 30 4.4.4 Data Collection ................................................................................................. 33 4.4.5 Analysis Plan..................................................................................................... 35
4.5 Qualitative Approach ..................................................................................................... 37 4.5.1 Methodology ..................................................................................................... 37 4.5.2 Timeframe of Exposure .................................................................................... 38 4.5.3 Study Sample .................................................................................................... 38 4.5.4 Data Collection ................................................................................................. 39 4.5.5 Analysis Plan..................................................................................................... 41
4.6 Challenges ...................................................................................................................... 42

CONTENTS
Abt Associates Insert Name of Deliverable ▌pg. ii
5. Administrative ........................................................................................................................ 44 5.1 Summary of IRB Requirements and Clearances ............................................................ 44 5.2 Preparing Data Files for Access, Privacy and Documentation ...................................... 44 5.3 Dissemination Plan ........................................................................................................ 44 5.4 Evaluation Team Roles and Responsibilities ................................................................. 45 5.5 Evaluation Timeline and Reporting Schedule ................................................................ 49
6. References ............................................................................................................................... 50
7. Annexes ................................................................................................................................... 53 7.1 Stakeholder Comments and Evaluator Responses ......................................................... 53 7.2 Evaluation Budget .......................................................................................................... 53
Abt Associates Evaluation Design Report ▌pg. 1
1. Introduction
1.1 Background 1.1.1 Country Context
The procurement of goods and services on behalf of government agencies accounts, on average, for approximately 12 percent of Gross Domestic Product in developed countries and up to 20 percent in developing countries (Organisation for Economic Cooperation and Development (OECD) 2012: 148-9). Indonesia, however, spends more than 30 percent of its national budget, and around 60 percent of foreign development assistance, in this way (CIPE 2011: 13). A considerable part of public procurement spending in Indonesia is linked to public infrastructure development. Total funding for infrastructure development was expected to amount to around IDR 400 trillion ($42 billion) through 2014. The share of procurement money spent on infrastructure development is even more pronounced at the local level (Satriyo et al. 2003).
The country’s procurement system is marred by corruption and inefficiency. This has contributed to the country’s crumbling infrastructure, delayed government spending, and Indonesia’s weak performance on a range of social indicators (Harvard Kennedy School 2010: vi-viii).
The challenges procurement reform initiatives face in present-day Indonesia originate in the country’s colonial era. The Dutch ruled most parts of the archipelago indirectly, as a consequence of which the colonial administration accepted a multitude of indigenous laws and different legal jurisdictions while it only slowly implemented a universal legal code for the country. Hence, “a baroquely complex legal system” (Cribb 2012: 46-48) emerged that created a multi-layered and often contradictory framework for the regulation of state affairs.
After Indonesia achieved independence in 1945, the government ruled that colonial laws would be invalid if they were violating the new constitution. “Since the Constitution was a brief, often vague, document, this provision meant that the application of law was formally subject to political considerations” (Cribb 2012: 39). Against the backdrop of overlapping and diametrically opposed legal frameworks, a “system of exemptions” (Cribb 2012: 23) emerged in which laws were bent in favor of state officials and private sector interests with political connections.
The authoritarian New Order regime under General Suharto, who ruled over Indonesia between 1965 and 1998, consolidated and expanded this system. The Suharto administration created a “franchise system”— similar to the opium and tax farms that had been established during the colonial period (Butcher 1993: 19-44)—that encouraged bureaucrats, military personnel, and politicians to use state power to extract public resources for private gain (McLeod 2005: 367-86).
The collapse of the dictatorship in 1998 had mixed impacts on Indonesia’s public procurement system. On the one hand, the newly democratic environment deregulated Suharto’s patronage system. This created interstices that allowed new players to enter the “business of politics” and push it in new directions. On the other hand, patterns of corruption and collusion established under the New Order remained widespread in public procurement because they provide tangible economic and political benefits to elites (Buehler 2012a; Cribb 2012: 36). The decentralization of political and fiscal powers, which was part of the 1998 reform agenda, also created a highly heterogeneous procurement landscape across the archipelago, only adding to the complexities on the ground.

Abt Associates Evaluation Design Report ▌pg. 2
In this context, the Government of Indonesia (GoI) together with donor agencies has pursued various reform programs aimed at improving the way Indonesia’s procurement system works. These initiatives include the adoption of new procurement regulations, improvements in the organization and execution of procurement processes, the strengthening of administrative capacity for bureaucrats involved in procurement decisions, and the establishment of a central procurement agency with a broad mandate to create rules and monitor compliance with existing rules. National-level agencies have usually driven these reform initiatives, but procurement decisions are increasingly made at the subnational level due to Indonesia’s comprehensive administrative and fiscal decentralization over the past decade.
Soon after 1998, the GoI formally committed to comprehensive public procurement reforms. These commitments were formalized in 2003, when Presidential Decree No. 80/2003 on public procurement was adopted. The decree, which has since been amended seven times, superseded presidential decrees on the same matter dating from 1994 and 2000. It also took precedence over subnational procurement regulations. Meeting most criteria of international standards on public procurement practice, the decree has a broad mandate and covers goods, works, and services that use public funds, irrespective of their value. It also established regulations for government procurers at all levels of the bureaucracy.
Presidential Decree No. 80/2003 also required all local bureaucrats involved in procurement to be procurement-accredited by 2006. As a legacy of the New Order era, procurement professionals were limited in number and mostly employed in selected line ministries. There were also no distinct career paths or salary incentives for procurement professionals. Consequently, bureaucrats joined procurement committees on an ad hoc basis and returned to their former positions upon completion of a project. Institutional memory with regard to procurement procedures therefore remained fragmented and inefficient (World Bank 2007: 104).
In addition to the aforementioned presidential decrees, which focus exclusively on public procurement, several new laws issued in recent years have also strengthened Indonesia’s public procurement system. For example, the State Finances Law No. 17/2003, the State Treasury Law No. 1/2004 and the State Audit Law No. 15/2004 all contain paragraphs on public procurement mechanisms. A construction law dating from 1999 also stipulates regulations on the procurement of civil works and consulting services, as does Indonesia’s comprehensive Competition Law No. 5/1999.
The institutional reforms listed above had several aims. One goal was to increase transparency within government agencies involved in public procurement. The second aim was to increase competition. The third aim of the institutional reform initiatives was to criminalize collusive procurement practices.
In addition to institutional changes, various new government organizations have been established to handle public procurement reform initiatives. Most importantly, Presidential Decree No. 80/2003 created a legal basis for the establishment of a National Public Procurement Agency (Lembaga Kebijakan Pengadaan Barang/Jasa Pemerintah (LKPP)). Established at the end of 2007 under Presidential Decree No. 106/2007 and modeled after the United States’ Office of Federal Procurement Policy, the LKPP is a fully independent body reporting directly to the president and chaired by an appointee from the bureaucracy. The LKPP is tasked with developing policies related to the public procurement of goods and services. It also aims at strengthening procurement practices within the government, and provides advice and recommendations as well as dispute resolution (Gatra 2007: 12). The LKPP does not undertake procurement operations directly, nor does it have any purchasing or contracting function. It is solely in charge of formulating procurement policies and overseeing their implementation.

Abt Associates Evaluation Design Report ▌pg. 3
Presidential Decree No. 80/2003 and Presidential Regulation No. 54/2010 on Public Procurement also mandated the establishment of Procurement Units (Unit Layanan Pengadaan (ULPs)) that are responsible for conducting public procurement procedures on behalf of the government’s technical departments (Satuan Kerja Pemerintah Daerah). ULPs’ tasks include preparing tender schedules, estimating costs for the tendering package, and evaluating bids in response to advertisements, as well as proposing a bid winner (Attström and Ismail 2010: 4). ULPs also handle complaints and appeals from bidders, but have no mandate to monitor the implementation of works and services (Rahman 2012c: 4). The ULPs will replace ad hoc procurement committees previously established by technical departments within government agencies, as stipulated in Presidential Regulation No. 8/2006. Presidential Regulation No. 54/2010 mandated that ULPs had to be established at all levels of government by 2014.
A number of challenges need to be overcome in order to establish an efficient and effective procurement system in Indonesia:
a. Indonesia continues to lack a comprehensive procurement law. The National Development Planning Agency (Badan Perencanaan dan Pembangunan Nasional (Bappenas)) and the LKPP have been working on a draft law for several years, but no law had been issued at the time of writing. The absence of a comprehensive national law is especially cumbersome in a country such as Indonesia, whose procurement activities occur in a highly decentralized fashion. Many local procurement regulations do not meet accepted international procurement standards.
b. The broader organizational environment is another obstacle to the efficient implementation of the aforementioned procurement reform initiatives. The implementation of Presidential Decree No. 54/2010 is overseen first and foremost by the LKPP. The LKPP is seconded by auditing bodies, and anti-corruption agencies, and finally by civil society organizations overseeing procurement operations. Most importantly, the LKPP’s capacity remains limited because it depends on external bodies such as the Ombudsman Office to assure the integrity of public procurement institutions and the compliance of all players with public procurement legislation. There was no independent audit body for public procurement at the time of writing. Fraud and corruption in public procurement could theoretically be detected through the GoI’s other auditing bodies, most of which have several decades of experience in public sector auditing. However, Indonesia’s entire auditing system suffers from a lack of accountability, an unclear legal framework, and overlapping mandates between auditing bodies such as the Audit Board (Badan Pemeriksa Keuangan) and the Development Finance Comptroller (Badan Pengawasan dan Keuangan Pembangunan), as well as a history of corrupt practices exerted by public auditors themselves (Sherlock 2002: 367- 383).
To summarize, comprehensive procurement reforms followed the demise of the New Order regime in 1998 as part of a broader effort to improve Indonesia’s public financial management system (Wescott 2008: 18-37). While the procurement system in Indonesia has been formally strengthened through various institutional-organizational reform initiatives, public procurement remains problematic due to legal inconsistencies, weak state capacity, and insufficient enforcement of this regulatory framework. The decentralization of power has also exposed the varying capacities of local governments to implement these reform initiatives successfully. Consequently, the impact of institutional-organizational reforms on public procurement varies greatly across Indonesia. In addition, the political-economic environment that facilitated collusion in procurement practices largely disintegrated after the end of the New Order era in 1998. On the one hand, this created opportunities for a more competitive, efficient and transparent
Abt Associates Evaluation Design Report ▌pg. 4
procurement system. On the other hand, these changes have created new incentives for procurement-related corruption. For instance, direct elections for politicians have created new financial pressures, which have often allowed private sector interests to sway public procurement processes in their favor. Finally, the devolution of political and fiscal powers has also introduced a high degree of variation into the public procurement landscape.
1.1.2 Objectives of This Report
The objective of this report is to provide a concise description of the evaluation design for the Millennium Challenge Corporation (MCC) / Millennium Challenge Account-Indonesia (MCA-I) Procurement Modernization (PM) Project, which aims to promote best practices in procurement in the Indonesian context through a multi-pronged approach involving human resource development, organizational development, and the development of new policies and procedures. The report is organized into eight sections. The first section introduces the country context and report objectives. The second section provides an overview of the Compact project and the interventions being evaluated. The third section provides a brief literature review, summarizing the existing evidence and providing insight into gaps in the literature. The fourth section presents the evaluation design. The fifth section takes on administrative aspects of the implementation of the evaluation. The sixth section provides references, and finally the seventh section provides annexes to the report.

Abt Associates Evaluation Design Report ▌pg. 5
2. Overview of the Compact and the Interventions Evaluated
This section provides an overview of the relevant part of the Compact and the interventions evaluated. Section 2.1.1 provides an overview of the project as originally conceived in the MCC monitoring and evaluation (M&E) plan. Section 2.1.2 provides a description of the project participants and Section 2.1.3 provides a description of the geographic scope of the program. Section 2.1.4 comments on the implementation plan and Section 2.1.5 provides detail on the project as implemented to date.
2.1 Overview of the Project and Implementation Plan 2.1.1 Original Project Description
The project description that follows is from the revised July, 2016 MCC M&E plan (version 3).
The Procurement Modernization (PM) Project is designed to accelerate the Government’s procurement reform agenda and transform operation of the public procurement system in Indonesia. The objective of the project is to support the implementation of the procurement function within the Government of Indonesia (GoI) by establishing Procurement Service Units (PSUs) resourced with systems, processes, and skilled procurement professionals as per Presidential Regulations No. 54 introduced in 2010. The expected result of building this capacity within the GoI will be cost savings and efficiency improvements on procured goods and services, while assuring their quality satisfies the public need and is delivered to the public as planned. These savings should lead to more efficient provision of goods and services to the economy, potentially enhancing economic growth. The Project was divided into two phases. The first phase, which encompassed years one to three of the Compact, entailed support to 29 demonstration PSUs. The second phase, which is expected to last for the balance of the Compact Term, entails a scaling up of Phase One to up to 100 total PSUs and an adjustment in design, if necessary to yield the best results for the Project. In early 2015, a management decision was taken to limit the number of total PSUs in order to work more in depth and maximize effectiveness in the selected PSUs, rather than spreading resources across many. As a result, Phase 2 will focus on 16 new PSUs in the last two years of the Compact, bringing the total number of PSUs supported by the PM Project to 45.
The PM Project will be implemented, through MCA-Indonesia, by the National Public Procurement Agency (“LKPP”). Reflecting the multifaceted nature of a public procurement system, the PM Project will support the following Activities and Sub-Activities:
a. Improving the procurement function by increasing the capacity and professionalization of the procurement function (the “Procurement Professionalization Activity”)
i. Institutional Structure and Professionalization of PSUs Sub-Activity (the “ISP Sub-Activity”)
ii. Procurement Management Information System Sub-Activity
b. Supporting the development of procurement policies and procedures which would improve procurement outcomes, the rate and success of public private partnerships (“PPPs”), and environmental sustainability (the “Policy and Procedure Activity”)
i. Competitive Tendering for PPPs Sub-Activity ii. Procedures for Sustainable Procurement Sub-Activity
Abt Associates Evaluation Design Report ▌pg. 6
The Procurement Professionalization Activity will consist of two parts. First, the ISP Sub-Activity will train up to 500 procurement professionals in two skill areas: procurement skills and organizational skills. Procurement skills training supports the development of skillful individual full-time procurement staff, while the organizational skills training supports better management of the PSU organizations. The procurement skills training contains structured curricula and training materials jointly developed with LKPP at three levels; basic, intermediate, and advanced. In order to complete each training level, trainees have to attend training on six training modules each. It is understood that completing all modules in the basic and intermediate level trainings (modules 1-12) will equip PSU staff with the competencies necessary to be a procurement professional. The advanced training (modules 13-18) consists of more tailored modules that supplement the basic and intermediate skills.
The procurement skills trainings will cover various competencies aimed at improving procurement professionals’ ability to conduct procurements according to government guidelines, ensuring the best value for the government. The organizational skills training is meant to complement the procurement skills training, and similarly is delivered at two levels, basic and intermediate, each consisting of 6 modules. The competencies covered in the organizational skills training are required to perform in any role across a government institution and provide the basis for core business processes required within an institution. Both trainings will also be provided to non-PSU staff involved in budgeting planning, procurement, and contract management so ensure that actors along the procurement chain, who are outside the PSU, will have skills and knowledge aligned with the procurement professionals. Another component of this Sub-activity will train auditors on how to conduct procurement audits so as to increase the capacity for accurate procurement oversight. This project component is still being designed. Finally, an institutional and staff mentoring system will be established to provide PSUs and individual staff with on-site support from experienced mentors tailored to specific needs, particularly touching on the competencies acquired through the procurement skills or organizational skills trainings.
Through the second Sub-Activity, a Procurement Management Information System (PMIS) will be developed to store data on procurements for the purpose of record-keeping and analysis. The PMIS will focus on collecting data on procurement processing, but may also include data on budgeting and contract management. A key input to the PMIS will be the application of the United Nations Procurement Classification System, to categorize procurements on multiple dimensions. Another part of the PMIS Sub-Activity is the establishment of and capacity building regarding a catalogue purchasing system, commonly known as an e-catalogue system, to ease the administrative burden and transaction costs related to the purchasing of routine commercial products and services. This will be linked with the development of the procurement procedures and standard bidding documents for framework contracting. The e-catalogue will be an electronic information system that contains a list of technical specifications and prices of certain goods and services from various suppliers. It will support and assist in the set-up and delivery of the framework agreements to procuring entities within the pilot PSUs and the GoI as a whole. The e-catalogue platform in conjunction with the standardized framework contracts aims to improve the efficiency and effectiveness of procuring goods and/or services that are expected to be required on a recurring basis over a period of time.
The Policy and Procedure Activity consists of two parts. The first involves the development of policies and procedures around public-private partnerships (PPPs). This includes development of a practical toolkit with templates and model documents for procurement planning and project preparation. The second previously consisted of the development of a sustainable procurement National Action Plan to incorporate the concepts of environmental and social sustainability into government contracts. However,
Abt Associates Evaluation Design Report ▌pg. 7
due to a shift in counterparts and priorities, this component has been re-scoped and some of the budget shifted to the PPP work. As a result, a Discovery Phase Report will replace the National Action Plan and will provide information regarding other Sustainable Procurement Policy (SPP) initiatives, conduct analyses on the regional and domestic markets for sustainable products, and assess the ability of GoI and LKPP to perform sustainable procurement across the GoI, as well as monitor, measure, and report on sustainable procurement and environmental procurement progress and outcomes.
There is also a small gender component linked to the PM Project but implemented by the MCA-I Social and Gender team, focused on training and supporting female entrepreneurs and procurement professionals to promote a more gender equitable procurement system across Indonesia. The interventions include a capacity building training program for women entrepreneurs that aims to equip them with the knowledge, networking and skills required to increase their access to and avail economic opportunities in government procurement. The second intervention involves the creation of the Forum for Women Procurement Specialists in Indonesia (FP4I), which serves as a forum for women procurement specialists in Indonesia to strengthen their network across PSUs in order to support career development, build their capacities as procurement professionals, and increase the number of women in the profession, especially in leadership positions.
2.1.2 Project Participants
The Procurement Modernization Project is in the process of being implemented in two phases, which differ in timing and somewhat in content, as described later in this section of the report. Participating PSUs in both phases were chosen for the program through a process of application, shortlisting, and interviews/site visits. Twenty-nine PSUs were selected for Phase 1, and 16 PSUs (including the LKPP) were selected for Phase 2, representing a broad geography and different levels of government.
In Phase 1 the first step in the process was to solicit expressions of interest in the program at a conference for PSUs. At the conference, a short questionnaire was fielded to PSUs that were interested in the program, and just under 40 PSUs were shortlisted from among the respondents for the program. Site visits were scheduled, which helped further narrow down to 29 the PSUs that were selected overall, on the basis of expressed commitment to reform, response to questionnaires, site visits, and other characteristics recorded in a Commitment Scorecard from the questionnaire responses, as well as on the basis of institutional and geographic diversity. The elements for eligibility in the Commitment Scorecard were:
• Willingness to commit to the main goals of the PM project
• Willingness to share data with LKPP
• Willingness to use e-procurement and an e-catalogue
• Interest in establishing permanent and independent status of the PSU and in establishing permanent functional procurement positions
• Maturity of the PSU (year of establishment, legal basis for the establishment of the PSU, degree of permanence, independence, etc.)
• Organizational structure (number of staff and their positions, whether they were full-time personnel or on temporary assignment)
• Diversity of volume, type and value of procurement
Abt Associates Evaluation Design Report ▌pg. 8
• Presence and use of the Layanan Pengadaan Secara Elektronik (LPSE), LKPP’s system for e-procurements, and percentage of procurements conducted with e-procurement
• Presence of one to two years of historical data
• Level of implementation of procurement regulations
• Institutional capacity
In Phase 2, expressions of interest were first gathered via the LKPP website. Among the over 40 PSUs that applied, 22 were shortlisted using a set of evaluation criteria. The shortlisted PSUs were invited to interview at a conference in January 2016, which the Abt evaluation team was able to attend. An additional four PSUs, primarily ministries, were added to the shortlist for strategic reasons. Based on the interviews of the shortlisted PSUs and ministries, 16 were invited to participate in the project. The evaluation criteria used to rate interviewing PSUs included:
• Institutional permanency
• Staffing
• Impact on economic development
• Total PSU procurement spending
• Policy influence
• Proximity to Jakarta/other pilots
• Leadership commitment
Individual participants in training and mentoring programs, however, were selected on an ad hoc basis by nominating personnel, typically managers, in the individual PSUs, and their participation was not guided by quantifiable eligibility criteria. The types of staff that attended training included PSU staff and staff from related spending units. While many staff members that would benefit most did attend the training, the ad hoc nature of selection led to incomplete coverage of staff members in many instances. The training consisted of 18 modules. These modules were broken up over several training events. The training events all took place in Jakarta. (Trips to Jakarta for training are viewed as highly desirable by PSU staff located across the larger expanse of Indonesia.) Discussions with key stakeholders revealed that these trips were often broken up across multiple staff, implying that perhaps very few staff received training in all the 18 modules. This did spread the benefit of a trip to Jakarta across PSU staff, which may have been positive for staff morale; however, it resulted in some staff not completing all of the intended modules of the training in the intended order. MCA-I is closely tracking the rates of completion and will only strive to achieve the 500 trainee target. This will involve ensuring that trainees complete all required modules at some point, especially if they did not complete the modules sequentially during a single round of training.
2.1.3 Geographic Coverage
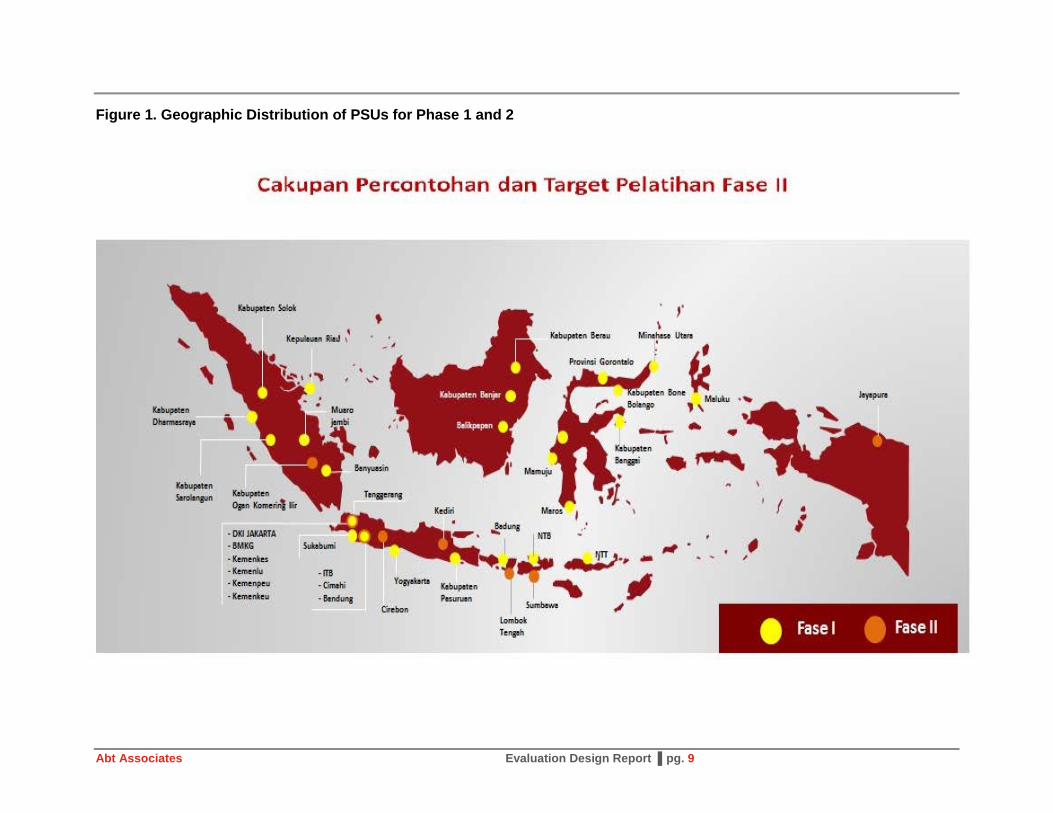
The PM project is being implemented in a geographically diverse set of PSUs, with the aim of establishing models of best practices across the country. While there was no specific effort to include every island, ensuring geographical diversity was a key objective PSU selection process. A map of Phase 1 PSUs and Phase 2 PSUs is shown below in Figure 1.
Abt Associates Evaluation Design Report ▌pg. 9
Figure 1. Geographic Distribution of PSUs for Phase 1 and 2
Abt Associates Evaluation Design Report ▌pg. 10
2.1.4 Implementation Plan
To the knowledge of the evaluation team, no discrete implementation plan was developed by MCC or MCA-I for this activity. The implementation plan for Phase 2 is to follow much of the implementation as exercised for Phase 1, with some specific changes planned. The primary change of which we have been informed is that the human resources training will take place via a web-based platform rather than in person, to save on costs and improve scalability. Relative to the original implementation plan, relatedly, the target number reached with training through the end of Phase 2 has been increased to 1,000 trainees.
2.1.5 Description of Implementation to Date
This section describes the program activities as implemented to date. Implemented in two phases, with Phase 1 initiated with 29 PSUs in March 2015 and Phase 2 initiated with 16 PSUs in April 2016, the project seeks to reform Indonesian procurement in participating PSUs through a diverse set of activities.
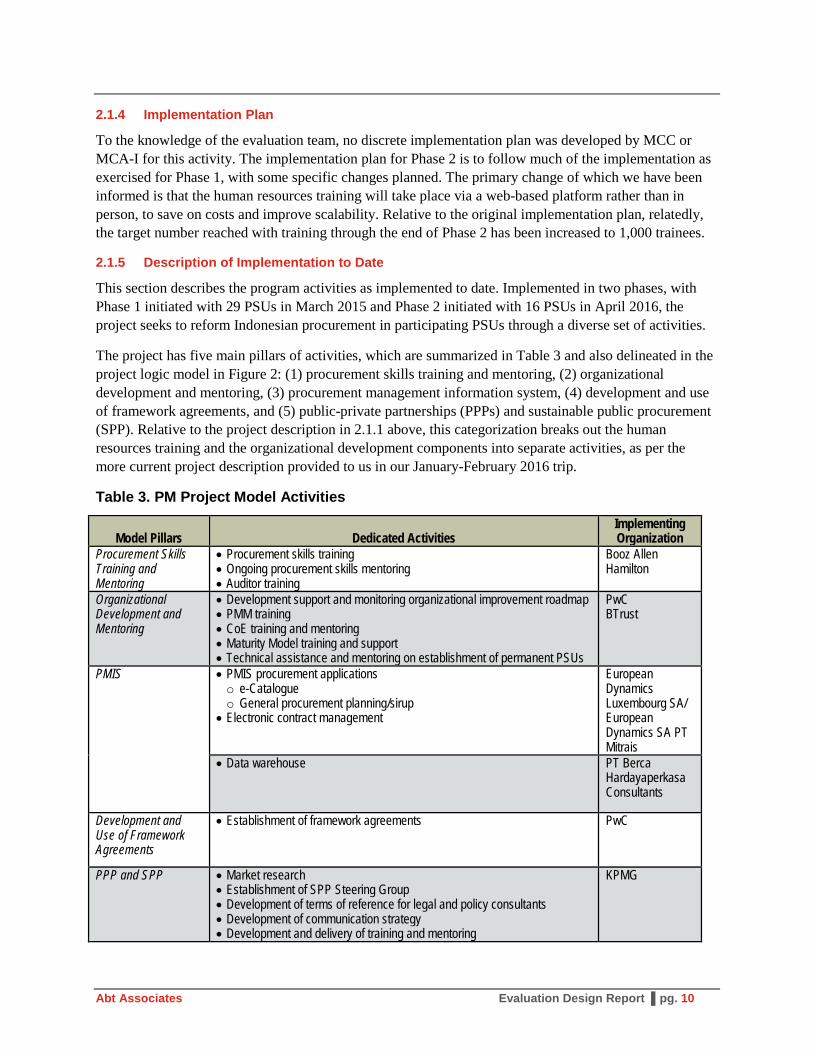
The project has five main pillars of activities, which are summarized in Table 3 and also delineated in the project logic model in Figure 2: (1) procurement skills training and mentoring, (2) organizational development and mentoring, (3) procurement management information system, (4) development and use of framework agreements, and (5) public-private partnerships (PPPs) and sustainable public procurement (SPP). Relative to the project description in 2.1.1 above, this categorization breaks out the human resources training and the organizational development components into separate activities, as per the more current project description provided to us in our January-February 2016 trip.
Table 3. PM Project Model Activities
Model Pillars Dedicated Activities Implementing Organization
Procurement Skills Training and Mentoring
• Procurement skills training • Ongoing procurement skills mentoring • Auditor training
Booz Allen Hamilton
Organizational Development and Mentoring
• Development support and monitoring organizational improvement roadmap • PMM training • CoE training and mentoring • Maturity Model training and support • Technical assistance and mentoring on establishment of permanent PSUs
PwC BTrust
PMIS • PMIS procurement applications o e-Catalogue o General procurement planning/sirup
• Electronic contract management
European Dynamics Luxembourg SA/ European Dynamics SA PT Mitrais
• Data warehouse PT Berca Hardayaperkasa Consultants
Development and Use of Framework Agreements
• Establishment of framework agreements PwC
PPP and SPP • Market research • Establishment of SPP Steering Group • Development of terms of reference for legal and policy consultants • Development of communication strategy • Development and delivery of training and mentoring
KPMG
Abt Associates Evaluation Design Report ▌pg. 11
Implemented by Booz Allen Hamilton, the procurement skills training and mentoring activities comprise 18 modules divided into three levels of procurement skills training. These 18 modules, of which 1-6 comprise the basic training, 7-12 comprise the intermediate training, and 13-18 comprise the advanced training, are:
1. Applying basic procurement principles
2. Planning simple procurement
3. Developing solicitation documentation
4. Receiving and evaluating bids
5. Managing procurement documentation, records and contract files
6. PMIS and framework agreement
7. Planning and developing complex procurement
8. How to develop cost estimates and why
9. How to calculate TCO and why
10. How to develop and interpret specifications
11. How to select appropriate contracting models
12. How to implement and manage contracts
13. Planning and implementing strategic procurement
14. Undertaking framework contracting
15. Identifying and managing risk in complex procurements
16. Managing strategic and complex contracts
17. Developing and conducting bid evaluations for large/complex procurement
18. Fraud schemes and indicators While these trainings were conducted in person for a set of approximately 300+ trainees in Phase 1 PSUs, MCA-I is in the process of contracting for the development of an e-curriculum for a subset of these training modules to be rolled out to a larger number of trainees in Phase 2 PSUs. Individuals were selected for training by the heads of PSUs and included both PSU staff and non-PSU staff from other organizations, such as spending units affiliated with PSUs, in order to generate greater knowledge among individuals involved in different stages of the procurement lifecycle. In addition to the procurement skills training, trained individuals have participated in and will participate in a human resources development mentoring program to help them identify skill gaps and maintain and develop new skills acquired during the trainings. Mentors work individually with trainees on site approximately monthly.
Organizational development and mentoring services are being provided by PwC and bTrust. These activities cover, broadly speaking, development support and monitoring of organizational improvement. More specifically, component activities include mentoring in how to implement monitoring of indicators based on data on tenders and tender outcomes (PMM); training and support in using the Maturity Model—a set of indicators developed to track institutional maturity for PSUs; Center of Excellence (CoE) training and mentoring; and technical assistance and mentoring on establishment of permanent PSUs.

Abt Associates Evaluation Design Report ▌pg. 12
The progress of each of these component activities is described in greater detail below. The PMM consists of a system developed to track a quantitative set of indicators on procurement performance, often taking advantage of electronic data already produced by the national system for e-procurement and stored in the LPSE. While the set of indicators developed and the extent to which PMM development has occurred varies across PSUs, the PMM indicators can include the percentage of on-time procurements, the number of bidders, the cost to owner estimate ratio, the percentage of failed procurements, indicators of the quality of the outcome of procurements, and other measures. The PMM is developed by the PSU staff with help from the organizational development mentors, and has been adopted by treatment PSUs, although with differing data coverage depending on the sophistication of the PSUs’ engagement with the PMM initiative.
Another set of metrics used to assess the current state of organizational development and to frame goals for organizational development consists of the Maturity Model. Version 4 of the Maturity Model includes 11 indicators in four domains: institutional, management, operational, and personnel. The sub-indicators include organization, ethical culture, stakeholders, performance, leadership and vision, process, risk, information systems, competency, career and staffing. PSUs are rated, or self-rate, their current performance for components of each of these sub-indicators on a scale from one to five, where one represents the lowest level of competency (“reactive”) and five represents the highest level of competency (“innovative”). The Maturity Model indicators provide not just a way of assessing current performance, but also a roadmap for improving performance along these metrics, with detailed descriptions for the level ratings for each of the sub-sub-indicators. The Maturity Model has been adopted in treatment PSUs, but with differing indicators and sub-indicators chosen by each PSU, making comparability of progress along these metrics difficult.
Beyond the Maturity Model, there exists a set of standards and programming by which PSUs can become “Centers of Excellence.” The objectives of the CoE standards and programming, developed by PwC, include that the PSUs:
• Develop significant advancement of capabilities and knowledge in procurement envisaged to support organizational maturity enhancement.
• Share knowledge, information and skills.
• Promote good procurement practice for a more effective procurement organization.
• Become advisors and stewards, who can lead the procurement process across the value chain.
• Develop relationships and build networks with other procurement units across bodies and departments to strengthen procurement capability regionally/nationwide.
• Establish PSUs as centers of repute in the wider community that will serve as places of interaction between higher education institutions, governments, industry and the public sector in general.
It is important to note that as of February 2016, the PMM, MM and CoE measures are inconsistently collected. Few, if any, PSUs collect and report all of the measures within each of these systems. In addition each of the systems has a smaller set of core measures on which PSUs are to focus; however, even within that set of measures, PSUs usually collect only a partial set, and the partial set collected varies across PSUs.
Finally, an objective of the organizational mentoring program is to help PSUs obtain permanent status. The program provides mentoring and assistance with this diverse process, which varies depending on the
Abt Associates Evaluation Design Report ▌pg. 13
level of government at which the PSU sits. As of February 2016, the Abt team was informed that fifteen additional PSUs had achieved permanent status as a result of the PM project.
The development and institution of the PMIS is also an activity of the MCC Indonesia PM project. While currently some systems are in place to allow the recording of electronic tenders, no comprehensive system or data warehouse exists. The system envisioned would allow PSUs to enter and record information regarding the tender and performance of procurements, and would also allow them to view and analyze historical data through the use of a data warehouse. The new system will also include a fraud filter to identify potentially illegal activities. To the knowledge of the Abt team, most of the components of the PMIS have yet to be developed and piloted, although a new e-tendering system is being piloted in two PSUs.
The purpose of the framework agreements and e-catalog activity is to establish policies and procedures that will support the development of standardized agreements for repeat purchases and an e-catalog to support repeat purchases of standard items. Because of a declaration by the chairman of LKPP in 2014 that all work on local framework agreements was to be put on hold and all resources were to be focused on national framework agreements, the progress of establishing framework agreements has been delayed at the PSU level. As of April 2016, only one pilot is in the implementation stage (in the Ministry of Finance). Other ministries and agencies still in negotiation include the Jakarta provincial government, the city of Surabaya and the Ministry of Marines and Fisheries.
The PPP and SPP activities are designed to support public-private partnerships and sustainable public procurement, respectively. Limited progress has been made towards the implementation of framework agreements and PPPs, to the knowledge of the Abt team. An SPP report is being developed, which is a policy analysis of the issues surrounding sustainable public procurement. For the PPP activity, the PM project has contributed to the revision of an LKPP regulation on PPPs, and is in the process of developing standard bidding documents (SBDs) for four pilot PPP projects.
2.2 Theory of Change
The intent of the project activities is to further the program goals as outlined in the project logic in Figure 2 through encouraging better assessment of the services needed, greater competition, services procured at lower cost, higher-quality products, and reduced procurement and delivery time. It is ultimately hoped that these improvements in the procurement process will result in more-efficient procurement of goods and services that are critical to Indonesia’s economic growth (e.g. infrastructure), while also leading to budgetary savings that can be applied to other productive investments that will in turn lead to greater economic growth.
Expected outcomes of the project, according to the project logic, are at the highest level “[g]overnment expenditure savings on procured goods and services, while assuring their quality satisfies the public need and to achieve the delivery of public services as planned.” The intermediate outcomes are detailed below:
• Improved procurement process ensuring value for money (i.e., quality, fitness for purpose, total lifecycle cost, and risk management) and better-performing contracts
• Improved planning and budgeting leading to more-strategic procurement and budget execution
• More-effective procurement organization
• Pilots with monitoring and reporting on performance
Abt Associates Evaluation Design Report ▌pg. 14
• Pilots with PSUs as Centers of Procurement Excellence
• Permanent PSUs
• Functional positions established
• Improved policies and procedures to support efficient and effective procurement
Referencing again the project logic in Figure 2, the key program indicators (intermediate outcomes) include:
• Greater skill/knowledge about proper procurement procedures among PSU staff and other actors in procurement ecosystem
• Pilots with performance frameworks established
• Pro-active PSU established (with advisory services)
• Pilots with draft Perda (framework for permanency) completed
• Full-time staff appointed
• Procurement data generated, captured, and available on each procurement process
• PPP pilot projects advanced and promoted by use of SBDs
Additional clarifications were provided regarding the Project Logic following a March 31, 2016 presentation to stakeholders, and we are awaiting a revised Project Logic based on those clarifications and comments.
2.3 Cost-Benefit Analysis and Beneficiary Analysis
MCC performed no cost-benefit analysis or beneficiary analysis for this project.

Abt Associates Evaluation Design Report ▌pg. 15
Figure 2. Project Logic

Abt Associates Evaluation Design Report ▌pg. 16
3. Literature Review
3.1 Summary of the Existing Evidence
This literature review focuses on the status of procurement reforms in Indonesia and, where possible, the evidence available on the impact of these reforms on key outcomes.
Recent public expenditure reviews at both the national and subnational level conducted by the World Bank concluded that Indonesia’s main challenge in the years ahead was no longer to transfer more resources to local governments but to ensure that such resources will be spent effectively and efficiently (World Bank 2007: xvi; World Bank 2012: 2-4). The last comprehensive national public expenditure review, conducted in 2007, recommended the introduction of performance-based budgeting systems, improved linkages between budgeting and development planning, and a stronger procurement and auditing system to increase transparency and predictability in public expenditure processes (World Bank 2007: xxiii).
Institutional-organizational reforms and political and fiscal decentralization have formally increased transparency and accountability while creating more-competitive relations between political elites. Incumbent turnover in Indonesian elections is comparatively high in both executive and legislative elections, especially at the local level. This theoretically bodes well for procurement reform, since it may lead to the realization among elites that the electorate can vote them out of office if they do not live up to reform promises. On the other hand, the newly democratic environment has created new challenges for public procurement reform. Most importantly, democratization and decentralization have deregulated the highly structured New Order patronage networks, and introduced new costs for politicians (McLeod 2000: 99-112). Therefore, politicians have incentives to engage in collusive practices, either to amass campaign funds prior to elections or to pay back campaign donors after the elections. Recent studies show this has led to new dynamics in public procurement collusion (Van Klinken and Aspinall 2012).
The following contradictory assessments of Indonesia’s procurement environment are emblematic of these local complexities. In 2007, the GoI with the assistance of the OECD conducted an evaluation of the country’s legislative, regulatory, and institutional frameworks; management capacity; procurement operations; and market practices; as well as the integrity and transparency of the formal public procurement system against international procurement standards. The assessment revealed that the Indonesian public procurement system matched with more than 60 percent of the OECD baseline indicators, leading the organization to conclude that “public procurement risks in Indonesia are currently perceived to be average” (OECD/DAC 2007: 20-24).
A similar assessment conducted in 2010 found that, overall, procurement reform had been successful in establishing formal mechanisms for tender and bidding processes and in recruiting qualified staff to auxiliary bodies such as the LKPP. At the same time, the report concluded that the sustainability of the current reform drive in the procurement sector was “moderate” (Attström and Rusman 2010: vi). The authors also found that political imperatives rather than principles of efficiency and transparency were defining procurement-related government documents (Attström and Rusman 2010: 6).
In fact, procurement-related corruption and collusion remain endemic in Indonesia and continue to be one of the main reasons for the leakage of public funds and the implementation of development projects of inferior quality. In 2008 and 2009, for instance, accusations of unfair procurement tenders topped the list

Abt Associates Evaluation Design Report ▌pg. 17
of cases reported to the Commission for the Supervision of Business Competition (Komisi Pengawas Persaingan Usaha (KPPU)). In 2009, the last year such data were collected, 84 percent of all cases reported to the KPPU related to unfair procurement tenders, compared to 79 percent in 2008 (The Jakarta Post 2009). In 2007, almost 90 percent of all corruption cases were related to public procurement of goods and services. Anecdotal evidence supports the findings of the National Development Planning Agency that only around 30-40 percent of all government institutions are conducting procurement as required under the regulations (Rahardjo 2007: 73). Similarly, 94 percent of the 2,100 procurement-related complaints the Corruption Eradication Commission received in 2009 referred to failures of holding open tenders. The remaining 6 percent of cases were about schemes, including price mark-ups. Losses to the state due to corruption and collusion amounted to around 35 percent of the total value of procurement projects scrutinized by the Corruption Eradication Commission between 2005 and 2009, according to an official government estimate (The Jakarta Post 2009).
Likewise, the available literature suggests that corruption in the construction sector remains endemic, with the most recent available figures “guesstimating” a loss of between $300 million to $1.4 billion due to bribe payments in 2004 alone (van Klinken and Aspinall 2012: 144-69). The dynamics in the construction industry testify to the fact that the legacies of Suharto’s patronage system and the forces that compromise good governance in public procurement in contemporary Indonesia have survived the post-1998 reform initiatives. In addition, recent studies point out that procurement reforms have, ironically, lowered the quality of public work contracts and the ensuing infrastructure projects. Legal requirements for Indonesian government officials to award contracts to the cheapest bidder have forced many contractors to submit unrealistic project proposals, leading to project delays or the outright failure to complete infrastructure projects (Larasati 2011: i).
In addition to these assessments of the public procurement situation at the national level, a literature has emerged that describes public procurement dynamics at the subnational level. Within less than a decade after the collapse of the New Order regime in 1998, Indonesia became one of the world’s most decentralized countries. Fiscally, its provinces and districts are some of the world’s strongest. This has created new opportunities but also new challenges for procurement reform at the local level. To the best of our knowledge, no studies analyze the subnational procurement environment in a comprehensive and systematic fashion. However, several studies suggest that there is considerable variation in both the implementation and the outcome of public procurement reform between and within the archipelago state’s administrative layers (Rahman et al. 2012a; b; c; d).
Findings from these studies suggest that there is considerable variance in procurement spending, or the value of contracts awarded, both between and within different government layers (Rahman et al. 2012a). For instance, average annual procurement spending at the district level has decreased since 2007, while it has increased at the provincial level over the same period. Overall, annual procurement spending is also higher at the provincial level than at the district level. At the same time, provinces and districts in the outer islands of Indonesia spend more on procurement than provinces and districts in Bali and Java (Rahman et al. 2012b: 4). Still, there are provinces where procurement spending has decreased in both relative and absolute terms between 2007 and 2010 (Rahman et al. 2012e: 1-43). Studies have suggested that the higher aggregate procurement spending in Indonesia’s outer islands is a consequence of administrative fragmentation that occurs predominantly outside Java (Kimura 2013) and in resource-rich areas (Fitrani et al. 2005: 57-79). This “blossoming of jurisdictions” (pemekaran wilayah), which has led to an increase from 27 to 33 provinces and from 341 to 497 districts over the last decade, is usually accompanied by a construction boom since there is a need for new government infrastructure.
Abt Associates Evaluation Design Report ▌pg. 18
Furthermore, a picture emerges from the existing literature that there is considerable local variance with regard to the adoption of the various procurement reform initiatives described above. For instance, a great number of provinces and districts have endorsed the government-promoted LPSE, making e-procurement the most widely adopted procurement reform initiative. However, the percentage of tenders using the e-procurement system of the total number of tenders remains low in almost all provinces and districts. The low implementation rate is especially pronounced in the outer islands. Nurmandi (2013) found that during the 2012 fiscal year only around 10 percent of national government institutions and 21 percent of local governments used e-procurement for public tenders.
The few localities that used e-procurement most often announced tenders only through their e-procurement system. A small number of provincial and district governments have adopted full e-procurement. This means that they accepted online bids in addition to announcing tenders (Rahman et al. 2012b: 7-8). A recent paper argued that the low adoption of e-procurement may not be the result of low government capacity but may instead result from the lobbying activities of entrenched elites that are at risk of losing out if e-procurement programs are adopted (Nugroho 2014).
Several studies have been published in recent years on the impact e-procurement had in jurisdictions where such programs were adopted. A comprehensive study of Indonesian jurisdictions found no evidence that the use of e-procurement lowered the prices paid by governments. However, the quality of companies bidding for contracts increased (Lewis-Faupel et al. 2014). Other studies have been equally critical about the impact e-procurement had in Indonesian jurisdictions. For instance, Hidayat (2015) in his study of e-procurement programs in four districts in East Java Province (Jember, Kediri, Sampang, Surabaya) found that such initiatives had not improved the efficacy and efficiency of procurement processes due to the contentious relationship between Procurement Service Units (ULPs), and end-users of e-procurement services. E-procurement reforms have also not significantly improved the perception of service delivery in Kutai Kartanegara district in East Borneo Province, according to Mutiarin (2104). Nurmandi and Kim (2015) attribute the checkered outcome of e-procurement initiatives to tensions between national and local administrative layers in their recent study of e-procurement in three municipalities in Indonesia.
Besides great variance in the adoption of e-procurement reforms, recent studies have also found considerable differences with regard to the adoption of other procurement reform initiatives. Most importantly, the aforementioned standardization of procurement regulations that has occurred at the national level since 1998 has not been picked up to a similar degree at the subnational level. At the time of writing, only one province and 27 district governments had adopted standard bidding documents, removed barriers for bidders, or crafted and implemented standard operating procedures (SOPs) for local ULPs (Rahman et al. 2012b: 11).
Local capacity-building in public procurement seems to occur in a more balanced manner, particularly with regard to general procurement training in preparation for procurement certification, and e-procurement training on how to operate and maintain the LSPE system. Consequently, the overall number of procurement-certified staff has greatly increased at both the provincial and district level across Indonesia (Rahman et al. 2012b: 12). Still, many subnational governments seem to lack a comprehensive strategy to increase the number of procurement-accredited staff (Rahman et al. 2012d: 9). Research also found that the absolute number of procurement accredited staff was lower on average in districts with decreasing procurement. However, these districts had a higher proportion of procurement-accredited staff compared to the overall number of bureaucrats than districts where procurement values were on the rise
Abt Associates Evaluation Design Report ▌pg. 19
over the period examined in this research (Rahman et al. 2012f). Furthermore, provinces and districts also embrace organizational reform initiatives in an uneven manner. Procurement Service Units, for instance, had been adopted in 27 percent (9/33) of all provinces and 26 percent (130/497) of all districts at the time of writing (Rahman et al. 2012b: 9). The establishment of PSUs was slightly higher in districts with increasing procurement volumes (Rahman et al. 2012f). Finally—despite the considerable power that aforementioned political and fiscal decentralization initiatives have bestowed upon local government heads—governors, district heads and mayors were not really reform drivers in any of the localities examined in a recent study. When governors or district heads were replaced, the procurement reform initiatives continued in most cases (Rahman et al. 2012c: 6).
Furthermore, parliaments were rarely the driver of procurement reform initiatives. In addition, some studies found that local legislatures were relatively free from business interests, and also that service contracts were not awarded based on political alliances (Rahman et al. 2012c: 6). This finding warrants further scrutiny: previous studies on local procurement in both Indonesia and Western democracies showed how predatory business interests dominated parliament in many localities and how this shaped the distribution of procurement packages (Zullo 2006: 273-81).
To summarize, the recent literature on procurement reform initiatives in Indonesia points to considerable variance in the adoption of procurement reforms both between and within administrative layers. The lack of a national procurement law, differences in leadership styles, and different levels of political will—in addition to tensions within the bureaucratic apparatus—have all been put forward in recent studies as potential explanations for the fragmented procurement reform landscape in Indonesia.
3.2 Gaps in Literature
Despite this extensive descriptive literature on public procurement in Indonesia, the most significant gap in the literature remains a rigorous impact study of the effects of broad-scope public procurement reform efforts on procurement outcomes in the country. While Lewis-Faupel et al (2014) explore the effects of e-procurement adoption on procurement outcomes, their work is narrowly focused on e-procurement and also includes a limited range of procurement outcomes.
In addition, currently no studies compare the adoption of procurement reform in Indonesian localities in a comprehensive and systematic manner. Future research on this subject needs to address whether and how the aforementioned variance in subnational procurement reforms and spending patterns is linked to political and fiscal decentralization. For instance, are there districts where vertical accountability mechanisms are stronger than in other districts as shown in higher elite turnover ratios in both executive and legislative elections? If so, are these localities more committed to procurement reform and spending? Likewise, do we see procurement reforms being adopted prior to or after local elections? Are procurement reforms adopted by “old” or “new” elites?
Furthermore, more research needs to be conducted on horizontal accountability mechanisms: how they vary across Indonesia, and what the consequences are for public procurement. For instance, what is the composition of local parliaments in jurisdictions with high procurement spending that have also implemented most procurement reform initiatives? Do parliaments in such “reform” districts consist mostly of newcomers or of “old” elites with ties to the New Order? In a similar vein, there are districts where some parties won a majority in parliamentary elections but failed to get their candidate elected into local executive office. Such a constellation has often led to tensions between local executive and
Abt Associates Evaluation Design Report ▌pg. 20
legislative branches of government. Future research could examine whether districts where the same party controls both the executive and legislative branch are more successful in implementing procurement reform than localities where the executive and legislative are controlled by different parties or party coalitions. An analysis of local debates surrounding procurement reforms and procurement spending would also reveal whether the executive or the legislative is the driving force behind the implementation of procurement reforms, and whether the role executives and legislatures play in local procurement spending varies across Indonesian localities. For instance, do we see higher turnover ratios of mid-level bureaucrats in districts under the auspices of a reform-oriented local government head?
Future research also could examine how subnational variance in procurement spending and reform is linked to fiscal decentralization. For instance, how does the amount of transfers that a local government receives define procurement spending and the implementation of reform initiatives? Do large transfers turn local governments complacent with regard to procurement reform? Likewise, do large transfers undermine efficiency of spending? Previous research has shown that higher transfers lead to more inefficiency (Lewis 2006), but no research existed at the time of writing that addressed this question with regard to procurement spending. Future research also could examine whether provinces and districts in which national transfers constitute a relative small percentage of overall local revenues are implementing local procurement reforms in a more rigorous manner than localities in which national transfers amount to a larger proportion of local revenues. Furthermore, are there provinces and districts in which illegal national government spending is higher than in other localities? If so, what are the impacts on procurement spending? An analysis of subnational budgets is a potential starting point for such research.
Finally, in addition to a lack of research on subnational variance in procurement reform, there is also a dearth of research on drivers of local reform initiatives. As studies mentioned above suggested, local government heads and parliamentarians were rarely actively driving forward procurement initiatives. Instead, groups and networks of local mid-level bureaucrats seemed crucial for the adoption and implementation of reform agendas. Future studies need to examine not only how procurement reform agendas diffuse from one jurisdiction to another but also what role such networks of local administrators play in that process.
Most of these topics are beyond the scope of this evaluation, although we do hope to be able to provide new evidence on the impacts of a broad reform program on the conduct of procurements and the potential effects of the reform on economic growth.

Abt Associates Evaluation Design Report ▌pg. 21
4. Evaluation Design
4.1 Policy Relevance of the Evaluation
The evaluation seeks to establish evidence on the possible effects of an intervention designed to modernize public procurement: effects on cost savings, performance in the procurement process, and corruption, as well as economic growth. While previous MCC programs on reducing corruption in public procurement have been implemented in Paraguay, Uganda, and Kenya, generating interest in the potential of these programs to achieve results more broadly, these three prior programs have been threshold programs and relatively smaller in magnitude than the $50 million procurement modernization component of the Indonesia Compact. The Indonesia Procurement Modernization project is the first to try to achieve results broadly and at a national scale. The impacts of the Indonesia PM project evaluation may have implications for the design of future MCC programs, and with broader dissemination of its findings, may influence other donors as well. Although existing quantitative evidence on the introduction of e-procurement suggests that procedural and other reforms may improve procurement outcomes (Lewis-Faupel et al., forthcoming), there is little quantitative evidence on more- comprehensive reforms, and the MCC Procurement Modernization project evaluation seeks to fill this space with new and more compelling evidence. While we are not able to measure effects on economic growth as a result of the program directly, if the program is found to have strong effects on cost savings and procurement performance, a follow-on effect on economic growth may be plausible.
4.2 Evaluation Questions
The evaluation questions are designed to test the program’s theory of change. The Abt team finalized the list of evaluation questions through a process of consultation with MCC in Washington, and with MCA-I, MCC and the contractors in Indonesia through a stakeholder workshop. The Abt team ensured that the final evaluation questions covered the full scope of program activities and were important to the implementing organizations.
As the program is focused on organizational change, we organize the evaluation questions according to a framework designed to evaluate organizational change.
The Abt team categorized the evaluation questions for the PM project using the 5S model as the organizing framework. This model is explained in greater depth in section 4.5.1. Questions below are categorized according to whether they relate to Superordinate Goals/Shared Values; Structure, Systems, Skills, and Staffing; and/or Overall Evaluation Questions. Questions were added by the Abt team in order to fully cover the program areas of intervention.
1. Superordinate Goals/Shared Values: a. Are there any issues related to the political economy (or other aspects) of the
procurement system and its actors not addressed by the project that may have impacted the project’s ability to achieve its intended results? (Q4): This question relates to the overall goals of the program and whether there were political economy facilitators and barriers to the success of the project.
b. Did the program result in a change in culture or shared values? (New Q): This question asks whether the necessary change in shared values and culture for organization

Abt Associates Evaluation Design Report ▌pg. 22
transformation occurred. It also relates to the program’s goal of reducing corruption and increasing transparency in public procurement. Further, it relates to the idea of shifting the mindset of procurement professionals to focus more on producing value for the government and public.
2. Structure a. What types of organizational or operational changes are taking place at the PSU level?
(Q9): This question asks what organizational and operation changes are happening, broadly speaking, at the PSU level, and relates directly to whether changes are occurring along the dimensions outlined in the program logic as a result of the intervention, such as establishing performance frameworks.
b. Have adopted the Maturity Model as an approach to supporting their organizational development goals? (Q13): This question asks whether the program was effective in getting treatment PSUs to adopt self-assessment and development tools, and relates directly to the inputs and outputs in the program logic.
3. Systems a. What types of procedural changes are taking place in the conduct of procurements?
(Q10): This relates directly to the intermediate outcome of “[g]reater skill/knowledge about proper procurement procedures among PSU staff and other actors in procurement system.”
b. What was the quality of policies and procedures developed by the project (e.g. PPP)? (Q25): This relates broadly across the program inputs in the project logic, and is an important question, as it asks whether the policies and procedures developed by the project were of high quality and considered to be useful.
c. Are there changes in policies, procedures, or otherwise that could lead to quality improvements in ultimate procurement (contract) outcomes? How so? (Q18): This evaluation question relates to multiple points in the project logic, including the high-level outcome of generating an improved procurement process ensuring value for money, including quality.
d. Are there changes in policies, procedures, or otherwise that could lead to savings (financial or total lifecycle) in government procurements? How so? (Q19): This evaluation question relates to multiple points in the project logic, including the high-level outcome of generating an improved procurement process ensuring value for money, including total lifecycle cost.
e. Are PSUs using e-catalog for standard purchases? (Q15): This evaluation question directly links to the inputs and outputs relating to the e-catalog and framework agreements in the project logic.
f. Are PSUs using the lifecycle PMIS? (Q22): This evaluation question directly links to the inputs and outputs relating to the PMIS in the project logic.
g. What was the quality of PMIS? (Q21): This evaluation question directly links to the inputs and outputs relating to the PMIS in the project logic.
h. Has the PMIS contributed to changes in procurement planning or implementation? (Q24): This evaluation question directly links to the inputs and outputs relating to the

Abt Associates Evaluation Design Report ▌pg. 23
PMIS in the project logic, and explores how these inputs and outputs lead to the higher- level outcomes delineated in the project logic, such as more-effective procurement organization and improved planning and budgeting.
i. Does the design of PMIS meet the needs of the PSUs and other procurement actors? (Q23): This evaluation question also directly links to the inputs and outputs relating to the PMIS in the project logic, and explores how these inputs and outputs lead to the higher-level outcomes delineated in the project logic, such as more-effective procurement organization and improved planning and budgeting.
j. Have PSUs developed their own framework contracts? (Q14): This evaluation question directly links to the inputs and outputs relating to the e-catalog and framework agreements in the project logic.
k. Have PPPs been conducted in accordance with the policies and procedures developed by the project? (Q26): This evaluation question directly links to the inputs and outputs relating to PPPs in the project logic.
4. Skills a. Are the skills/knowledge emphasized in the training spreading within the PSU? How so?
(Q8): This evaluation question links directly to the intermediate outcome of “[g]reater skill/knowledge about proper procurement procedures among PSU staff and other actors in procurement eco-system.”
b. What was the quality of training and mentoring? (Q6): This evaluation question directly assesses the quality of program inputs, in particular training and mentoring, and their effectiveness in achieving desired outputs and outcomes.
c. Has the procurement knowledge and skill of trainees improved? (Q7): This evaluation question links directly to the intermediate outcome of “[g]reater skill/knowledge about proper procurement procedures among PSU staff and other actors in procurement eco-system.”
d. Are there detectable improvements in budget execution and efficiency of procurement execution in the PSUs and associated spending units? (Q12): This evaluation question asks directly about an outcome in the project logic, which is “[i]mproved planning and budgeting leading to more strategic procurement and budget execution.”
5. Staffing a. Are staff now permanent staff? (New Q): This evaluation question relates to the program
intermediate outcome of “[f]ull-time staff appointed.” b. Do staff seem committed to and engaged in pursuing a procurement career path? (New
Q): This evaluation question relates to the longer-term impact of the program, as the trained staff need to be committed to pursuing a procurement career path in order to have an impact on practices within treatment PSUs.
c. Are trained or “permanent” staff retained? (New Q): This evaluation question relates to the longer-term impact of the program, as the trained staff need to be retained in order to have an impact on practices within treatment PSUs.
Abt Associates Evaluation Design Report ▌pg. 24
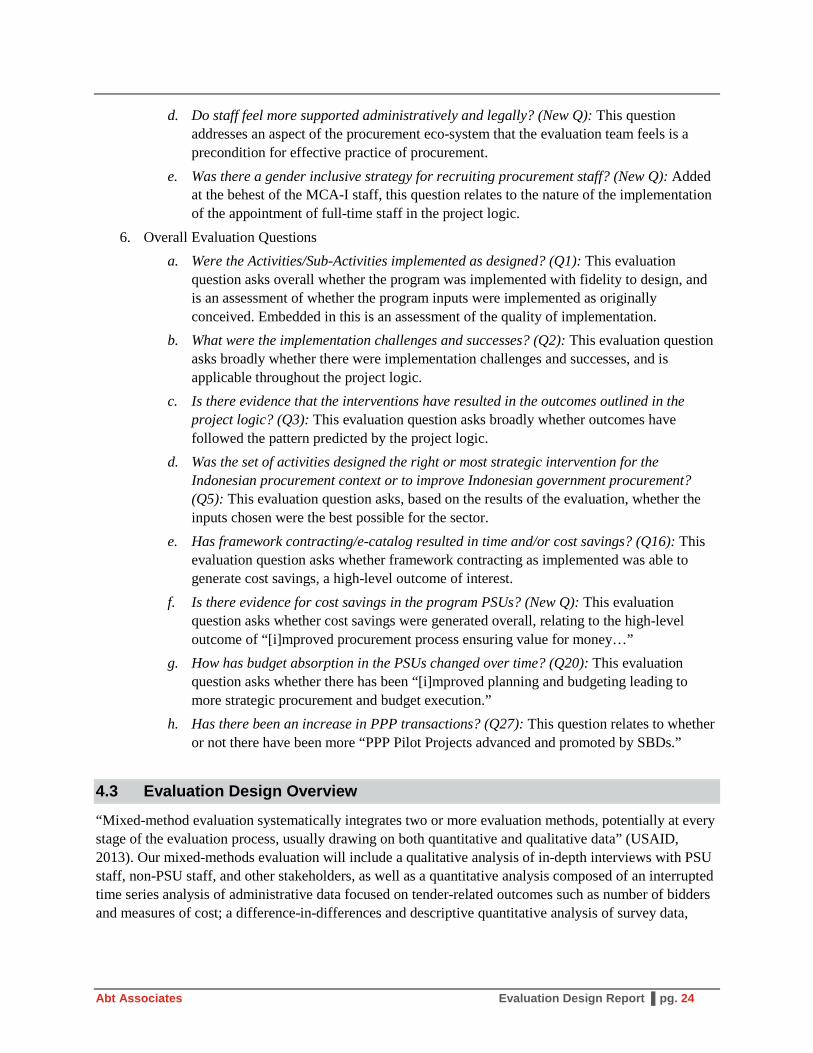
d. Do staff feel more supported administratively and legally? (New Q): This question addresses an aspect of the procurement eco-system that the evaluation team feels is a precondition for effective practice of procurement.
e. Was there a gender inclusive strategy for recruiting procurement staff? (New Q): Added at the behest of the MCA-I staff, this question relates to the nature of the implementation of the appointment of full-time staff in the project logic.
6. Overall Evaluation Questions a. Were the Activities/Sub-Activities implemented as designed? (Q1): This evaluation
question asks overall whether the program was implemented with fidelity to design, and is an assessment of whether the program inputs were implemented as originally conceived. Embedded in this is an assessment of the quality of implementation.
b. What were the implementation challenges and successes? (Q2): This evaluation question asks broadly whether there were implementation challenges and successes, and is applicable throughout the project logic.
c. Is there evidence that the interventions have resulted in the outcomes outlined in the project logic? (Q3): This evaluation question asks broadly whether outcomes have followed the pattern predicted by the project logic.
d. Was the set of activities designed the right or most strategic intervention for the Indonesian procurement context or to improve Indonesian government procurement? (Q5): This evaluation question asks, based on the results of the evaluation, whether the inputs chosen were the best possible for the sector.
e. Has framework contracting/e-catalog resulted in time and/or cost savings? (Q16): This evaluation question asks whether framework contracting as implemented was able to generate cost savings, a high-level outcome of interest.
f. Is there evidence for cost savings in the program PSUs? (New Q): This evaluation question asks whether cost savings were generated overall, relating to the high-level outcome of “[i]mproved procurement process ensuring value for money…”
g. How has budget absorption in the PSUs changed over time? (Q20): This evaluation question asks whether there has been “[i]mproved planning and budgeting leading to more strategic procurement and budget execution.”
h. Has there been an increase in PPP transactions? (Q27): This question relates to whether or not there have been more “PPP Pilot Projects advanced and promoted by SBDs.”
4.3 Evaluation Design Overview
“Mixed-method evaluation systematically integrates two or more evaluation methods, potentially at every stage of the evaluation process, usually drawing on both quantitative and qualitative data” (USAID, 2013). Our mixed-methods evaluation will include a qualitative analysis of in-depth interviews with PSU staff, non-PSU staff, and other stakeholders, as well as a quantitative analysis composed of an interrupted time series analysis of administrative data focused on tender-related outcomes such as number of bidders and measures of cost; a difference-in-differences and descriptive quantitative analysis of survey data,

Abt Associates Evaluation Design Report ▌pg. 25
covering a broader set of outcomes, including measures of procurement practices and knowledge and perceptions of corruption; and a descriptive quantitative analysis of program monitoring data.
We have already begun employing the mixed-methods approach to develop the evaluation design. Interviews with PSUs and key stakeholders have revealed key information about the completeness, quality and usefulness of the data systems to which PSUs contribute. In addition, those interviews provided valuable context regarding how the analytic results will reflect the objectives specified in the project theory of change. For example, respondents pointed out that while increased numbers of bidders may be a desired outcome, there is a critical nuance that needs to be considered. Respondents noted that the PM project interventions promoting greater standardization related to identifying qualified bidders may initially reduce the number of bidders that have historically pursued any and all opportunities announced by a given PSU. Therefore, there may be an overall reduction in the number of bidders, but an increase in the number of qualified bidders.
In addition to honing our understanding of what the quantitative results can indicate, combining the methods will provide insight that cannot come from a single approach. Quantitative data will provide valuable information regarding direction, distribution and magnitude of results, while qualitative data can provide an understanding of the nuance behind the statistical output. For example, the survey may indicate that PSU staff indicate some concern regarding their level of administrative and legal support, but the “why” and “in what way” will come from interviews. Also, qualitative analyses may identify staff perceptions regarding best practices for proliferation and sustainability, but this feedback will need to be validated by objective measures available from the quantitative analyses.
Combining the methods will continue at all phases of the evaluation design, data collection, analysis and reporting. Table 4 below presents an overview of our evaluation design. The subsequent subsection provides details of the quantitative and qualitative methods proposed.
Table 4. Evaluation Design Overview
Evaluation Question Key Outcomes Data Source Data Type 1. Superordinate Goals/Shared Values: a. Are there any issues related to the political
economy (or other aspects) of the procurement system and its actors not addressed by the project that may have impacted the project’s ability to achieve its intended results? (Q4)
Political economy issues or other barriers to success of the project
High-level stakeholders
Qualitative interviews
b. Did the program result in a change in culture or shared values? (New Q)
Perceptions of corruption and transparency
High-level stakeholders, PSU staff, spending unit staff
Qualitative interviews, quantitative surveys
2. Structure a. What types of organizational or
operational changes are taking place at the PSU level? (Q9)
Leadership and management, PSU permanency, staff permanency
High-level stakeholders, PSU staff, spending unit staff
Qualitative interviews, quantitative surveys
b. Have adopted the Maturity Model as an approach to supporting their organizational development goals? (Q13)
Adoption of Maturity Model
PSU staff, project-generated monitoring data
Qualitative interviews, analysis of project-generated monitoring data

Abt Associates Evaluation Design Report ▌pg. 26
Evaluation Question Key Outcomes Data Source Data Type 3. Systems a. What types of procedural changes are
taking place in the conduct of procurements? (Q10)
Adherence to best practices in procurement
PSU staff Qualitative interviews, quantitative surveys
b. What was the quality of policies and procedures developed by the project (e.g., PPP)? (Q25)
Quality of policies and procedures developed by the project
High-level stakeholders, PSU staff
Qualitative interviews
c. Are there changes in policies, procedures, or otherwise that could lead to quality improvements in ultimate procurement (contract) outcomes? How so? (Q18)
Adherence to best practices in procurement related to quality improvements
High-level stakeholders, PSU staff, spending unit staff, LPSE
Qualitative interviews, quantitative surveys, analysis of administrative data
d. Are there changes in policies, procedures, or otherwise that could lead to savings (financial or total lifecycle) in government procurements? How so? (Q19)
Adherence to best practices in procurement related to cost savings
High-level stakeholders, PSU staff, spending unit staff, LPSE
Qualitative interviews, quantitative surveys, analysis of administrative data
e. Are PSUs using e-catalog for standard purchases? (Q15)
Use of e-catalog High-level stakeholders, PSU staff, project-generated monitoring data
Qualitative interviews, quantitative surveys, analysis of project-generated monitoring data
f. Are PSUs using the PMIS? (Q22) Use of PMIS High-level stakeholders, PSU staff, project-generated monitoring data
Qualitative interviews, quantitative surveys, analysis of project-generated monitoring data
g. What was the quality of PMIS? (Q21) Quality of PMIS High-level stakeholders, PSU staff
Qualitative interviews, quantitative surveys
h. Has the PMIS contributed to changes in procurement planning or implementation? (Q24)
Contribution of PMIS to changes in procurement planning or implementation
PSU staff Qualitative interviews
i. Does the design of PMIS meet the needs of the PSUs and other procurement actors? (Q23)
Quality of design of PMIS relative to needs of PSUs and other procurement actors
High-level stakeholders, PSU staff
Qualitative interviews
j. Have PSUs developed their own framework contracts? (Q14)
Development of framework contracts
High-level stakeholders, PSU staff
Qualitative interviews, quantitative surveys
k. Have PPPs been conducted in accordance with the policies and procedures developed by the project? (Q26)
Development of PPPs and conformity to best practices recommended by the project
High-level stakeholders, PSU staff
Qualitative interviews, quantitative surveys
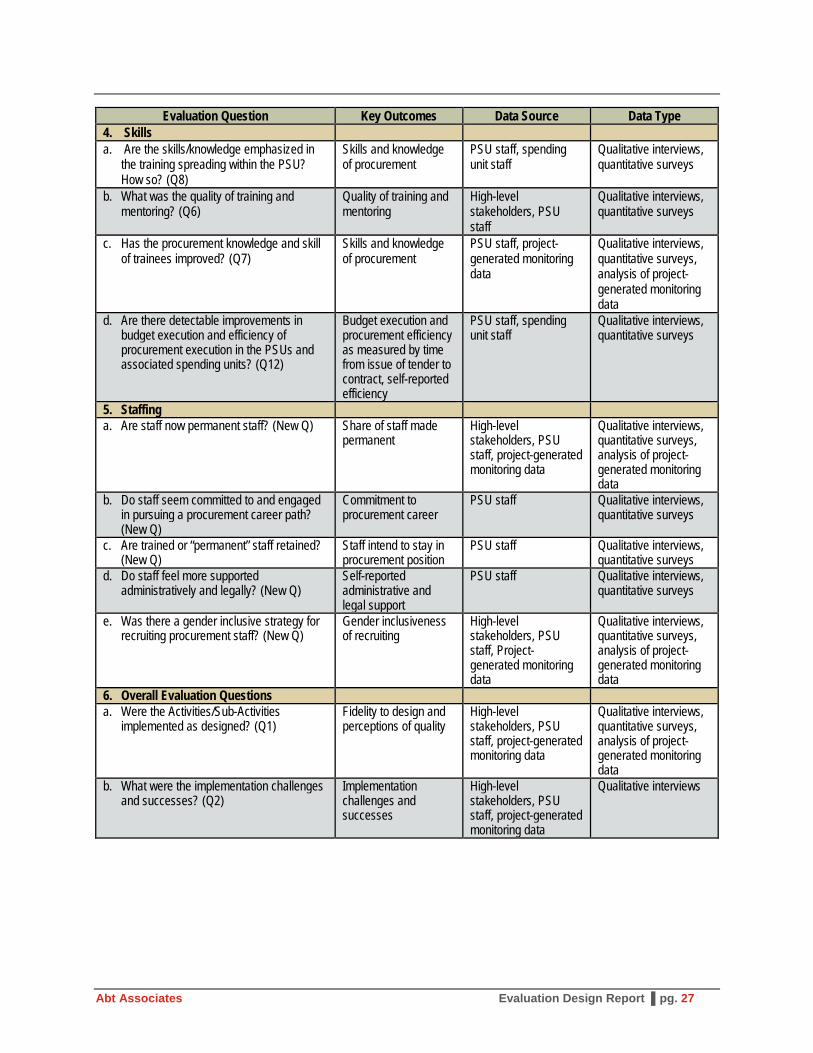
Abt Associates Evaluation Design Report ▌pg. 27
Evaluation Question Key Outcomes Data Source Data Type 4. Skills a. Are the skills/knowledge emphasized in
the training spreading within the PSU? How so? (Q8)
Skills and knowledge of procurement
PSU staff, spending unit staff
Qualitative interviews, quantitative surveys
b. What was the quality of training and mentoring? (Q6)
Quality of training and mentoring
High-level stakeholders, PSU staff
Qualitative interviews, quantitative surveys
c. Has the procurement knowledge and skill of trainees improved? (Q7)
Skills and knowledge of procurement
PSU staff, project-generated monitoring data
Qualitative interviews, quantitative surveys, analysis of project-generated monitoring data
d. Are there detectable improvements in budget execution and efficiency of procurement execution in the PSUs and associated spending units? (Q12)
Budget execution and procurement efficiency as measured by time from issue of tender to contract, self-reported efficiency
PSU staff, spending unit staff
Qualitative interviews, quantitative surveys
5. Staffing a. Are staff now permanent staff? (New Q) Share of staff made
permanent High-level stakeholders, PSU staff, project-generated monitoring data
Qualitative interviews, quantitative surveys, analysis of project-generated monitoring data
b. Do staff seem committed to and engaged in pursuing a procurement career path? (New Q)
Commitment to procurement career
PSU staff Qualitative interviews, quantitative surveys
c. Are trained or “permanent” staff retained? (New Q)
Staff intend to stay in procurement position
PSU staff Qualitative interviews, quantitative surveys
d. Do staff feel more supported administratively and legally? (New Q)
Self-reported administrative and legal support
PSU staff Qualitative interviews, quantitative surveys
e. Was there a gender inclusive strategy for recruiting procurement staff? (New Q)
Gender inclusiveness of recruiting
High-level stakeholders, PSU staff, Project-generated monitoring data
Qualitative interviews, quantitative surveys, analysis of project-generated monitoring data
6. Overall Evaluation Questions a. Were the Activities/Sub-Activities
implemented as designed? (Q1) Fidelity to design and perceptions of quality
High-level stakeholders, PSU staff, project-generated monitoring data
Qualitative interviews, quantitative surveys, analysis of project-generated monitoring data
b. What were the implementation challenges and successes? (Q2)
Implementation challenges and successes
High-level stakeholders, PSU staff, project-generated monitoring data
Qualitative interviews

Abt Associates Evaluation Design Report ▌pg. 28
Evaluation Question Key Outcomes Data Source Data Type c. Is there evidence that the interventions
have resulted in the outcomes outlined in the project logic? (Q3)
High-level outcomes in project logic
High-level stakeholders, PSU staff, spending unit staff, LPSE
Qualitative interviews, quantitative surveys, analysis of administrative data
d. Was the set of activities designed the right or most strategic intervention for the Indonesian procurement context or to improve Indonesian government procurement? (Q5)
Right or most strategic intervention for Indonesian context
High-level stakeholders, PSU staff, spending unit staff, LPSE
Qualitative interviews, quantitative surveys, analysis of administrative data
e. Has framework contracting/e-catalog resulted in time and/or cost savings? (Q16)
Cost savings due to framework contracting/e-catalog
High-level stakeholders, PSU staff, spending unit staff
Qualitative interviews, quantitative surveys
f. Is there evidence for cost savings in the program PSUs? (New Q)
Cost savings due to PM project components
High-level stakeholders, PSU staff, spending unit staff, LPSE
Qualitative interviews, quantitative surveys, analysis of administrative data
g. How has budget absorption in the PSUs changed over time? (Q20)
Budget absorption PSU staff Qualitative interviews, quantitative surveys
h. Has there been an increase in PPP transactions? (Q27)
PPP transactions High-level stakeholders, PSU staff
Qualitative interviews, quantitative surveys
In addition to the detailed approaches provided in this design report, Abt will consider employing a case study approach to answering the PPP-focused questions. If the idea is accepted and endorsed by MCC, the approach will designed at a later date and this EDR will be updated with more design detail at that time.
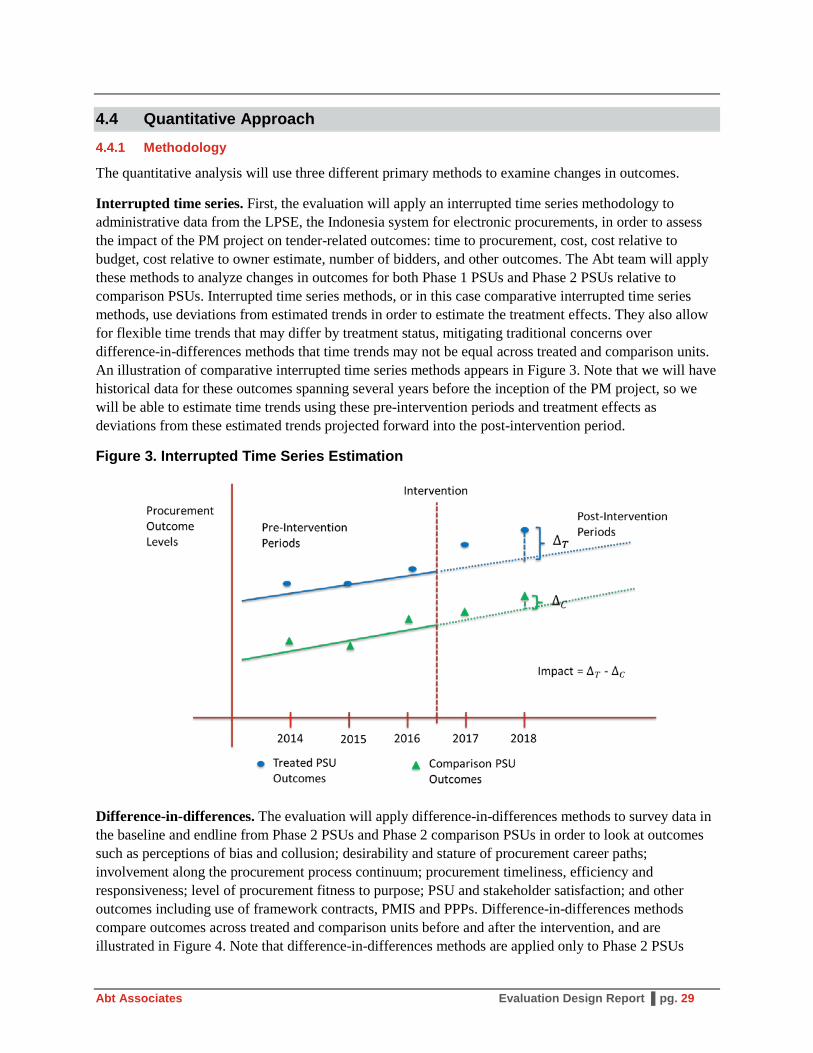
Abt Associates Evaluation Design Report ▌pg. 29
4.4 Quantitative Approach 4.4.1 Methodology
The quantitative analysis will use three different primary methods to examine changes in outcomes.
Interrupted time series. First, the evaluation will apply an interrupted time series methodology to administrative data from the LPSE, the Indonesia system for electronic procurements, in order to assess the impact of the PM project on tender-related outcomes: time to procurement, cost, cost relative to budget, cost relative to owner estimate, number of bidders, and other outcomes. The Abt team will apply these methods to analyze changes in outcomes for both Phase 1 PSUs and Phase 2 PSUs relative to comparison PSUs. Interrupted time series methods, or in this case comparative interrupted time series methods, use deviations from estimated trends in order to estimate the treatment effects. They also allow for flexible time trends that may differ by treatment status, mitigating traditional concerns over difference-in-differences methods that time trends may not be equal across treated and comparison units. An illustration of comparative interrupted time series methods appears in Figure 3. Note that we will have historical data for these outcomes spanning several years before the inception of the PM project, so we will be able to estimate time trends using these pre-intervention periods and treatment effects as deviations from these estimated trends projected forward into the post-intervention period.
Figure 3. Interrupted Time Series Estimation
Difference-in-differences. The evaluation will apply difference-in-differences methods to survey data in the baseline and endline from Phase 2 PSUs and Phase 2 comparison PSUs in order to look at outcomes such as perceptions of bias and collusion; desirability and stature of procurement career paths; involvement along the procurement process continuum; procurement timeliness, efficiency and responsiveness; level of procurement fitness to purpose; PSU and stakeholder satisfaction; and other outcomes including use of framework contracts, PMIS and PPPs. Difference-in-differences methods compare outcomes across treated and comparison units before and after the intervention, and are illustrated in Figure 4. Note that difference-in-differences methods are applied only to Phase 2 PSUs
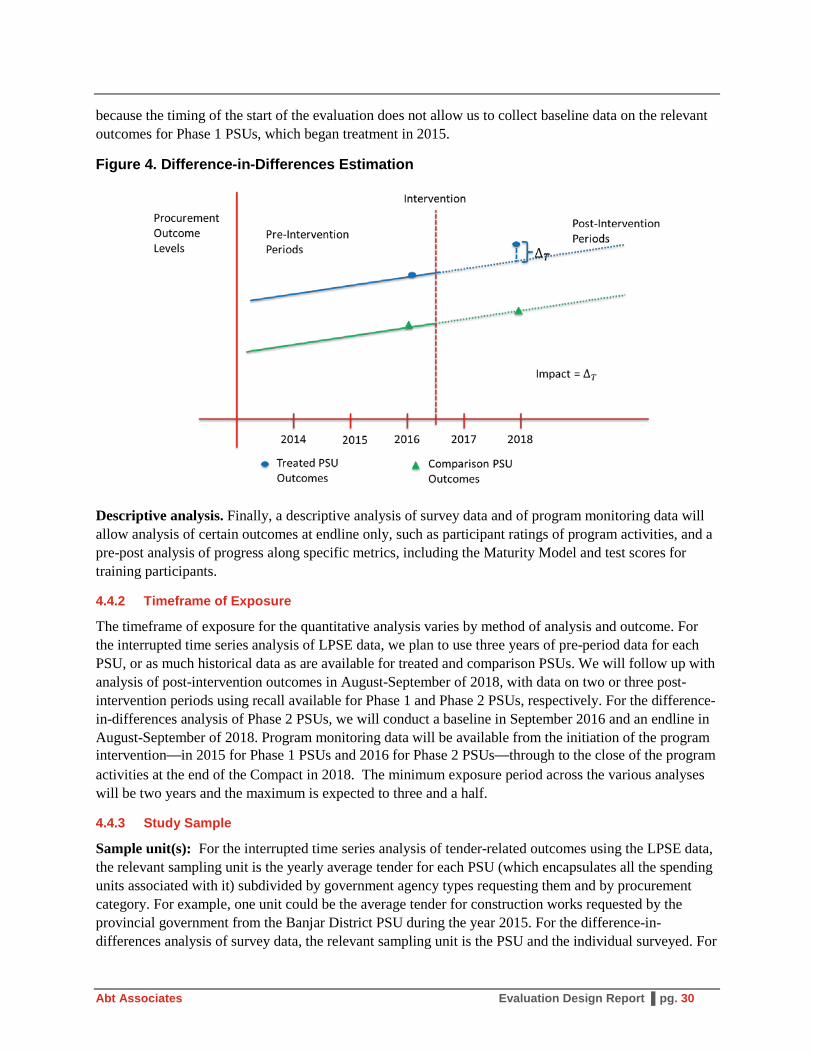
Abt Associates Evaluation Design Report ▌pg. 30
because the timing of the start of the evaluation does not allow us to collect baseline data on the relevant outcomes for Phase 1 PSUs, which began treatment in 2015.
Figure 4. Difference-in-Differences Estimation
Descriptive analysis. Finally, a descriptive analysis of survey data and of program monitoring data will allow analysis of certain outcomes at endline only, such as participant ratings of program activities, and a pre-post analysis of progress along specific metrics, including the Maturity Model and test scores for training participants.
4.4.2 Timeframe of Exposure
The timeframe of exposure for the quantitative analysis varies by method of analysis and outcome. For the interrupted time series analysis of LPSE data, we plan to use three years of pre-period data for each PSU, or as much historical data as are available for treated and comparison PSUs. We will follow up with analysis of post-intervention outcomes in August-September of 2018, with data on two or three post-intervention periods using recall available for Phase 1 and Phase 2 PSUs, respectively. For the difference-in-differences analysis of Phase 2 PSUs, we will conduct a baseline in September 2016 and an endline in August-September of 2018. Program monitoring data will be available from the initiation of the program intervention—in 2015 for Phase 1 PSUs and 2016 for Phase 2 PSUs—through to the close of the program activities at the end of the Compact in 2018. The minimum exposure period across the various analyses will be two years and the maximum is expected to three and a half.
4.4.3 Study Sample
Sample unit(s): For the interrupted time series analysis of tender-related outcomes using the LPSE data, the relevant sampling unit is the yearly average tender for each PSU (which encapsulates all the spending units associated with it) subdivided by government agency types requesting them and by procurement category. For example, one unit could be the average tender for construction works requested by the provincial government from the Banjar District PSU during the year 2015. For the difference-in-differences analysis of survey data, the relevant sampling unit is the PSU and the individual surveyed. For

Abt Associates Evaluation Design Report ▌pg. 31
the descriptive analysis of survey data and program monitoring data that will take place, the relevant sampling unit is the PSU or the PSU and the individual surveyed.
Sample size and associated assumptions, including power calculations: The sample size for the evaluation varies by evaluation method. The sample size for the interrupted time series evaluation of tender-related outcomes using LPSE data will be determined by the size of the universe of average tenders by government agency types requesting them and by procurement category originating from treatment and comparison PSUs. The sample size for the difference-in-differences analysis of survey data is determined by the universe of PSUs and spending unit employees that can reasonably be sampled, and is projected to be 440 respondents. The sample size for the descriptive analysis of survey and program-generated data is projected to be 45 treatment PSUs or 15 non-LKPP Phase 2 PSUs, and 300 respondents. The standard formula for minimum detectable effects (MDEs) was used to calculate MDE for the following outcomes under varying sets of assumptions: number of bidders, ratio of cost to owner estimate, number of months to complete a tender, and for all Likert scale questions included in the survey. These calculations show that under reasonable assumptions, these sample sizes are powered to be able to detect small changes in the relevant outcomes under consideration. The formula used is:
where Y is the outcome of interest, n is the sample size, p is the fraction of the sample treated, is the desired level of significance, is the one minus the desired power, and and are quantiles of the
normal distribution.1
Tables 5, 6 and 7 show very basic MDE calculations using this formula applied to the interrupted time series analysis of number of bidders for the average tender in each PSU by government agency type and procurement category, ratio of cost to owner estimate for the average tender in each PSU by government agency type and procurement category, and number of months within which the tender is completed for the average tender in each PSU by government agency type and procurement category. The tables vary the variance of the outcome variable while holding constant the sample size, the proportion of the sample treated, and the desired power. For the sample size, we assume that we will have 100 observations (20 government agency types multiplied by 5 procurement categories) year over six years for 40 treated and 40 untreated PSUs (excluding LKPP and the three ministries from the treated group for Phase 2, because of the lack of appropriate comparators on the shortlist, and Kota Bandung because it was selected outside of the shortlisting process). This is a conservative assumption. We assume that 25 percent of the observations will be treated observations and that alpha is equal to 0.05 and lambda is equal to 0.2 (for a power level of 0.8). For a range of variances of the outcome variables, the minimum detectable effect is small enough to imply that any economically significant effect would be detectable in our sample.
1 Note that more-precise formulas are available for MDEs calculations using ITS estimation, but require data that
we do not have available to estimate the parameters going into the models. At a minimum, ITS is similar to a difference-in-differences model and additional precision is gained by estimating the separate trends for treated and comparison units. Therefore, our power calculations by using this formula are conservative for the ITS framework.

Abt Associates Evaluation Design Report ▌pg. 32
Similarly, Table 8 shows a very basic MDE calculation using this formula applied to the difference-in-differences analysis. For a wide range of variances of the outcome variables, and Likert scale survey questions, small differences in mean outcomes are detectable with our projected sample size.
Table 5: MDE Calculations for Number of Bidders
Var(Y) N p Alpha Lambda MDE 1 48000 0.25 0.05 0.2 0.02962
1.25 48000 0.25 0.05 0.2 0.033116 1.5 48000 0.25 0.05 0.2 0.036277
1.75 48000 0.25 0.05 0.2 0.039184 2 48000 0.25 0.05 0.2 0.041889
2.25 48000 0.25 0.05 0.2 0.04443 2.5 48000 0.25 0.05 0.2 0.046833
2.75 48000 0.25 0.05 0.2 0.049119 3 48000 0.25 0.05 0.2 0.051303
Table 6: MDE Calculations for Ratio of Cost to Owner Estimate
Var(Y) N p Alpha Lambda MDE 0.15 48000 0.25 0.05 0.2 0.011472 0.2 48000 0.25 0.05 0.2 0.013246
0.25 48000 0.25 0.05 0.2 0.01481 0.3 48000 0.25 0.05 0.2 0.016224
0.35 48000 0.25 0.05 0.2 0.017523 0.4 48000 0.25 0.05 0.2 0.018733
0.45 48000 0.25 0.05 0.2 0.01987 0.5 48000 0.25 0.05 0.2 0.020945
Table 7: MDE Calculations for Tender Completed within X Months
Var(Y) N p Alpha lambda MDE
1 48000 0.25 0.05 0.2 0.02962 1.25 48000 0.25 0.05 0.2 0.033116 1.5 48000 0.25 0.05 0.2 0.036277
1.75 48000 0.25 0.05 0.2 0.039184 2 48000 0.25 0.05 0.2 0.041889
2.25 48000 0.25 0.05 0.2 0.04443 2.5 48000 0.25 0.05 0.2 0.046833
2.75 48000 0.25 0.05 0.2 0.049119 3 48000 0.25 0.05 0.2 0.051303

Abt Associates Evaluation Design Report ▌pg. 33
Table 8: MDE Calculations for Likert Scale Survey Questions
Var(Y) N p Alpha lambda MDEcal 0.5 880 0.25 0.05 0.2 0.154685
0.75 880 0.25 0.05 0.2 0.18945 1 880 0.25 0.05 0.2 0.218758
1.25 880 0.25 0.05 0.2 0.244579 1.5 880 0.25 0.05 0.2 0.267923
1.75 880 0.25 0.05 0.2 0.28939 2 880 0.25 0.05 0.2 0.309371
Sample frame: The sampling frame for the interrupted time series evaluation of tender-related outcomes is the universe of PSUs and tenders in the LPSE. The sampling frame for the difference-in-differences evaluation of survey-measured outcomes is first the universe of PSUs in the LPSE data, and then the universe of employees of PSUs and associated spending units. The sampling frame for the descriptive analysis of survey and program-generated data is the universe of treatment PSUs and their associated employees.
Sampling strategy: For the quantitative analysis, treatment groups will comprise all treated PSUs from Phase 1 and Phase 2, with the exclusion of LKPP from the treatment group in Phase 2, due to its special character and role in procurement in Indonesia. Comparison groups for Phase 1 and Phase 2 PSUs will be constructed as follows. Matching methods will be applied to data in the LPSE to match Phase 1 PSUs to comparison PSUs on the basis of level of government, volume of tenders, value of tenders, number of bidders, percentage of on-time procurements, time to procurement, and other tender-related measures. Phase 2 comparison PSUs will be identified using the list of shortlisted but not selected PSUs. All PSUs that were shortlisted but not selected will be in the comparison group. Within PSUs selected for study, individuals will be sampled randomly from a roster stratified by position. One spending unit associated with each PSU was selected to be surveyed as well. The spending unit was selected based on the number of contracts it had with the PSU. An effort was also made to have an even dispersion across the treatment and comparison PSUs of the type of spending unit interviewed, from the three most common types: public goods, education and health.
The only PSUs that will not be matched with a comparison site are those based in the ministries. This is due to their unique nature. There are no PSUs that can serve as a valid comparison; however, the same data will be collected from the Ministry PSUs as from the other PSUs. This will allow for descriptive and pre-post analyses.
4.4.4 Data Collection
Instruments: Primary quantitative data collection will take place through structured surveys of PSU employees and spending unit employees. Abt Associates has designed an original baseline survey instrument to measure outcomes of interest to the PM evaluation. This survey instrument contains 10 modules and covers a broad range of topics, including administrative structure/staff professionalization, procurement practices, desirability of procurement career paths, involvement along the procurement continuum, procurement timeliness and efficiency, framework contracting/e-catalog/PMIS/PPP, use of performance monitoring data, perceived levels of bias and collusion, and procurement knowledge. An
Abt Associates Evaluation Design Report ▌pg. 34
additional endline survey instrument will contain these outcomes, as well as additional outcomes such as perceptions of the quality of training, etc. No additional instruments are necessary to collect the LPSE data or to collect program monitoring data.
Rounds and timing: There will be a baseline and an endline survey. The baseline survey will be administered in September 2016, and the endline survey will be administered in August-September 2018. The LPSE data will be a complete record of all transactions initiated through the system from its inception through the completion of the study in 2018. The program monitoring data will be a complete record of such data from program inception through the end of the program in 2018.
Respondent(s) within the sample unit: Within PSUs selected for study, up to 20 individuals from the PSU and associated spending unit will be interviewed for the survey, ideally 15 from the PSU and 5 from the spending unit. Most ULP and related spending units will have 20 or fewer employees combined. If there are 20 or more employees per ULP and related spending unit combined, then the employees will be chosen by:
• ULP: Look at a roster of employees at the ULP on the day of the survey and choosing every nth
employee from a roster of staff, including at least 2 management staff.
• Related spending unit: Survey all employees if there are 5 or less employees. If there are more than 5 employees, use the same nth procedure to choose employees from a roster of staff provided by the spending unit on the day of the survey, including at least 1 management staff.
For the LPSE analysis, the relevant unit of sampling is the tender within the PSU and all tenders for treatment and comparison PSUs will be included in the analysis. For the analysis of program monitoring data, the relevant level of sampling is the PSU.
Surveyors: Abt engaged SurveyMETER, a recognized survey firm in Indonesia to implement the quantitative survey. No surveyors are needed for the LPSE data collection or for the program monitoring data collection.
Data processing: Data collection will be electronic and responses will not be linked to name in order to keep responses about possibly illegal activity private. The exact systems for data collection will depend on the survey firm selected for the survey. A consultant has been hired to convert the LPSE data into a usable format in Excel and Stata. No privacy concerns exist for these data because they are public. Program monitoring data will be collected directly from the implementing partners and will be compiled into a unified database.
Data quality: A system of controls to ensure data quality will be built into the electronic data collection platform. In addition, the Abt team will work to ensure data consistency and quality by cleaning and cross-checking data as it comes back. Data will be reviewed daily during the survey period for accuracy and consistency by field supervisors and, in some cases, members of the Abt team. Data will then be uploaded to secure servers and cleaned in several stages by the survey firm and the Abt team using SPSS and/or Stata. Quantitative data analysis will be performed by members of the Abt team using Stata.

Abt Associates Evaluation Design Report ▌pg. 35
Summary table:
Table 9. Data Collection Summary Table
Data Collection
Timing MM/YYYY (include multiple
rounds) Sample Unit/ Respondent Sample Size
Relevant Instruments/
Modules Exposure Period
(months) PSU and Spending Unit Survey (primary data collected by Abt)
Baseline, 09/2016 Endline, 08/2018
PSU (treatment and control) and the individual interviewed
11 treatment PSUs (Phase 2) 11 non-treatment PSUs (Phase 2) Total of 440 respondents (estimated 20 per PSU)
Quantitative survey instrument
Phase 2, 24 months
M&E data (secondary data)
04/2015-07/2016 PSU (treatment only)
45 treatment PSUs
PMM, MM, CoE, etc.
Phase 1 and 2, 36 months
4.4.5 Analysis Plan
The Abt evaluator team will analyze the data in the comparative interrupted time series and difference-in-differences frameworks as described below.
The comparative interrupted time series analysis will be performed on administrative data from the LPSE in order to gauge impacts of the program on tender-related outcomes. In order to present the comparative analysis, we first begin with an explanation of the interrupted time series analysis of the data.
Within each treatment PSU and/or affiliated spending unit, the yearly average tender subdivided by government agency types requesting them and by procurement category will form the unit of analysis. The simplest ITS model specification that reflects this structure is given in Equation 1 below:
(1)
where:
= Outcome measure for the average tender in PSU j requested by government agency type i in year t and belonging to procurement category h. As mentioned above, this model will be estimated separately for all targeted outcomes of interest.
= The counter for year=t=2013, 2014, and 2015 denote the three pre-intervention periods, while year=t= 2016, 2017 and 2018 denotes the post-intervention periods.
= Indicator for the post-intervention observation that were treated in Phase 1 (i.e., equals one if t>2015 and zero otherwise).
= Indicator for the post-intervention observation that were treated in Phase 2 (i.e., equals one if t>2016 and zero otherwise).
= Interaction term between the year counter and the post-intervention indicator for Phase 1
Abt Associates Evaluation Design Report ▌pg. 36
= Interaction term between the year counter and the post-intervention indicator for Phase 2
= Indicator (i.e., fixed effect) for PSU j (j=1,2,…,J) time invariant characteristics (e.g. level of government the PSU belongs to: province, district, city).
= The vector of n-th characteristics of average tender in PSU j requested by government agency type i in year t and belonging to procurement category h. Note that we allow these characteristics to be time variant, but we should be careful not to include those that could be endogenous (i.e., affected by the intervention).
= The vector of m-th characteristic of PSU j at time t. Note that we allow these characteristics to be time variant, but we should include only exogenous attributes.
= Residual associated with observations at time t, which is assumed to be distributed with a mean of zero and variance of . This term captures the variation in the outcome measures of the average tender in PSU j requested by government agency type i and belonging to procurement category h across time.
In Equation 1, is the base level of the outcome at the beginning of the time series, captures the linear time trend in the outcome measure or base trend (which is essentially based on the change in the outcome measure during the pre-intervention segment), and capture the treatment effect (or change in the level) in the post-intervention segment for Phase 1 and Phase 2, respectively, and , and
capture the change in the trend in the post intervention segment for Phase 1 and Phase 2, respectively. This model can further be modified to accommodate more-complex situations and data patterns, including non-linear time trends (e.g., with the addition of the square of the time variable).
An unaffected outcome, represented by , can be used to remove the confounding that may occur in the ITS model as a result of an unrelated shock at the time of the intervention. First, consider the estimation of the pooled impact estimate across all post-intervention time points and the following model specification for , which is parallel to the specification in Equation 1:
(1)
In Equation 2, all right-hand side variables are defined as in Equation 1, and the two error terms capture the random errors at the individual level and the time-specific residual, respectively. In this specification,
represents the linear time trend in the untreated outcome measure, while captures the pooled deviation from this trend for the post-intervention time point, which is attributed to confounders and considered to represent the effect of the confounding factors. Note that this is based on the assumption that is not specifically targeted by the intervention; therefore, the deviation of this measure from its baseline trend is fully attributable to confounding factors. Further, assuming the effect of the confounders on the treated outcome is proportional to the effect on the untreated outcome where the ratio of the two effects is equal to the ratio of the time trends, the impact estimate for the treated outcome that is adjusted for the confounders is given by:

Abt Associates Evaluation Design Report ▌pg. 37
(2)
In Equation 3, is essentially the impact on the targeted outcome for Phase 1 that is free of confounding factors that affect both the affected and unaffected outcomes in the same direction.
The difference-in-differences framework for survey-related outcomes would be estimated as follows:
(3)
where the right-hand side variables are specified as above with the difference that all outcomes are only at the PSU level and are not divided by government agency type nor procurement category. The additional terms are Treatmentit which is an indicator equal to 1 if the observation was treated (in either Phase), and Post equals one if t>2015 and zero otherwise. In this specification, the treatment is given by , the coefficient on , which removes any bias from time trends or time-specific shocks that are common to the treated and comparison units, as well as any bias due to baseline differences in levels of the outcomes across treated and comparison units that are due to factors that are time-invariant.
In addition, we will produce descriptive statistics to the extent we are able using program-generated data, leveraging the outputs produced by the implementing consultants to generate knowledge.
4.5 Qualitative Approach 4.5.1 Methodology
The qualitative approach to evaluating the PM project will involve a comparative pre-post analysis. The objective is to qualitatively assess the changes PM project pilot PSUs (treated) experience over time in comparison to a group of non-pilot PSUs (untreated) over the same period of time. The approach seeks to understand what the specific changes sought by the PM project (intervention) are, and whether those changes actually occur. To do so, it is necessary to understand what it is that the pilot PSUs are changing from, and what the goals of the change are. This can be referred to as moving from a current state (baseline) to a future desired state (outcomes); see Figure 5.
Figure 5. Organization Change Pathway
Shared ValuesStaffSkillsStructuresSystems
Current State(Baseline)
Future Desired State
(Outcomes)
The inputs, outputs and outcomes and associated changes detailed in the PM project logic (Figure 2) reflect an organizational transformation design. Therefore, the evaluation approach will employ an organizational transformation framework to develop a contextualized understanding of the changes resulting from the PM project. The organizational change framework for this evaluation is derived from the classic 7-S McKinsey model. The 7-S
model posits that effective organizational change depends on the interrelationships between key organizational elements—structure, strategy, systems (formal and informal procedures), style, skills

Abt Associates Evaluation Design Report ▌pg. 38
(employee skills and competencies), staff (employees, attitudes, motivations, etc.), and superordinate goals (or shared values).2
The qualitative evaluation will also be utilization-focused; one of its goals will be to develop actionable findings. This will include focusing on the identification of promising practices, as well as strategies to support proliferation and sustainability.
4.5.2 Timeframe of Exposure
The timeframe of exposure for the qualitative analysis is pre-post Phase 1 and Phase 2 PM project interventions. Phase 1 and Phase 2 baseline data collection will take place in September 2016 and the endline data collection will occur in summer 2018. Phase 2 pilot interventions began in August 2016. Phase 1 pilots began in April 2015. Although data collection will not begin until September of 2016, baseline data will be collected for the Phase 1 PSUs using an interview guide that orients the respondent to answering questions based upon PSUs structure, operations and staffing prior to the implementation of any of the PM project interventions directed at the pilot PSUs.
4.5.3 Study Sample
Sample unit(s): The interview data involves three different sampling units: 1) the PSU (treatment and comparison) and the individual interviewed; 2) spending unit and the individual interviewed; 3) stakeholder organization (MCC, LKPP, MCA-I, Contractors) and the individual interviewed.
The sampling unit for the review of extant stakeholder reports (Inception Reports, Consultant Reports, Trip Reports, PSU Strategic Plans/Goals) will be the pilot PSUs.3
Sample size and associated assumptions: The sample size for the PSU interviews is projected to be 22 treatment PSUs and 19 non-treatment PSUs, along with 4 treatment ministries over the two phases. At each of the PSUs we will interview three staff (one management staff and two procurement processing staff), for a total of 123 respondents. The spending unit sample size is projected to be 22 associated with treatment PSUs (one associated with each PSU) and 19 associated with non-treatment PSUs, interviewing one respondent from each, with a total of 41 respondents. The stakeholder sample size is projected to be 4 stakeholder organizations with an estimated total of 12-18 respondents.
Sample frame: The sample frame for the PSU interviews is the universe of treatment PSUs and their associated employees, as well as the universe of shortlisted PSUs (i.e., those that applied and were considered for, but not accepted into, the pilot program) and their associated employees. The sampling frame for the spending unit interviews is the spending units and their associated staff that work with the two groups of PSUs described above. The sampling frame for the key stakeholder interviews comprises the PM project-involved staff associated with MCA-I, LKPP and contractors responsible for supporting the PM project.
2 Note: in the 5-S model, style is subsumed under shared values, which also encompasses organizational culture;
strategy is disaggregated and observed as the change plans across all five other elements. 3 Note: although the reports will be drawn from key stakeholders, the unit of analysis will be the PSUs.
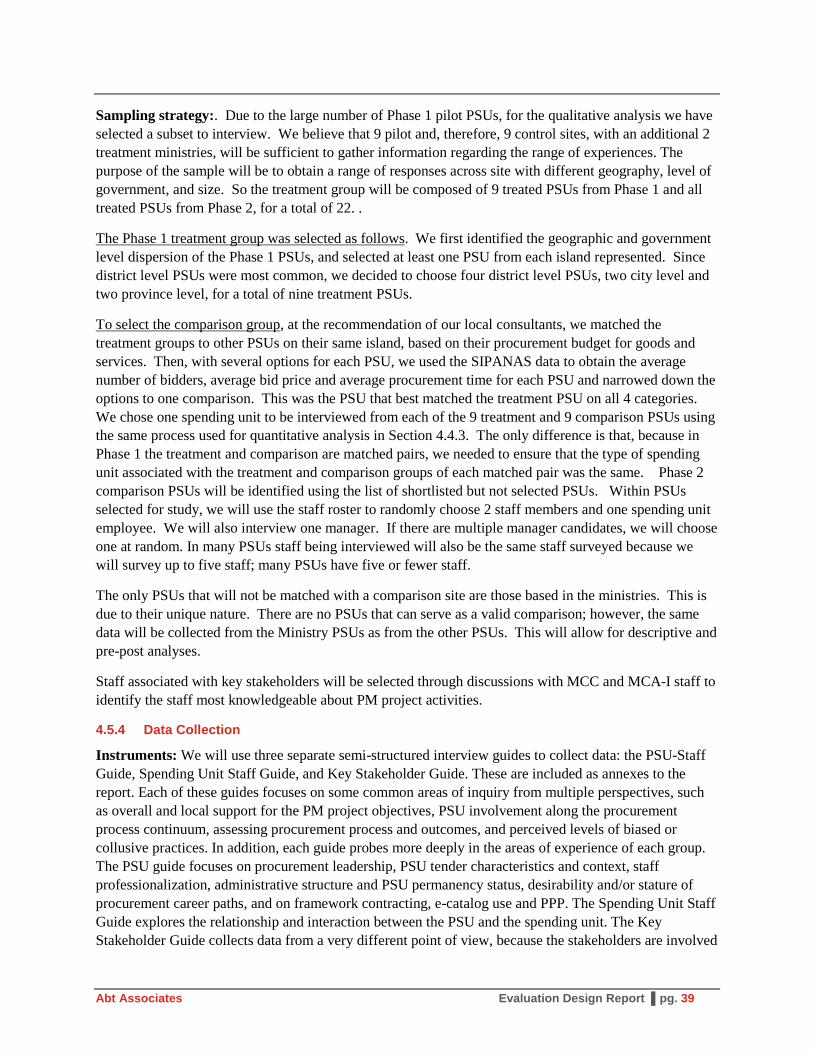
Abt Associates Evaluation Design Report ▌pg. 39
Sampling strategy:. Due to the large number of Phase 1 pilot PSUs, for the qualitative analysis we have selected a subset to interview. We believe that 9 pilot and, therefore, 9 control sites, with an additional 2 treatment ministries, will be sufficient to gather information regarding the range of experiences. The purpose of the sample will be to obtain a range of responses across site with different geography, level of government, and size. So the treatment group will be composed of 9 treated PSUs from Phase 1 and all treated PSUs from Phase 2, for a total of 22. .
The Phase 1 treatment group was selected as follows. We first identified the geographic and government level dispersion of the Phase 1 PSUs, and selected at least one PSU from each island represented. Since district level PSUs were most common, we decided to choose four district level PSUs, two city level and two province level, for a total of nine treatment PSUs.
To select the comparison group, at the recommendation of our local consultants, we matched the treatment groups to other PSUs on their same island, based on their procurement budget for goods and services. Then, with several options for each PSU, we used the SIPANAS data to obtain the average number of bidders, average bid price and average procurement time for each PSU and narrowed down the options to one comparison. This was the PSU that best matched the treatment PSU on all 4 categories. We chose one spending unit to be interviewed from each of the 9 treatment and 9 comparison PSUs using the same process used for quantitative analysis in Section 4.4.3. The only difference is that, because in Phase 1 the treatment and comparison are matched pairs, we needed to ensure that the type of spending unit associated with the treatment and comparison groups of each matched pair was the same. Phase 2 comparison PSUs will be identified using the list of shortlisted but not selected PSUs. Within PSUs selected for study, we will use the staff roster to randomly choose 2 staff members and one spending unit employee. We will also interview one manager. If there are multiple manager candidates, we will choose one at random. In many PSUs staff being interviewed will also be the same staff surveyed because we will survey up to five staff; many PSUs have five or fewer staff.
The only PSUs that will not be matched with a comparison site are those based in the ministries. This is due to their unique nature. There are no PSUs that can serve as a valid comparison; however, the same data will be collected from the Ministry PSUs as from the other PSUs. This will allow for descriptive and pre-post analyses.
Staff associated with key stakeholders will be selected through discussions with MCC and MCA-I staff to identify the staff most knowledgeable about PM project activities.
4.5.4 Data Collection
Instruments: We will use three separate semi-structured interview guides to collect data: the PSU-Staff Guide, Spending Unit Staff Guide, and Key Stakeholder Guide. These are included as annexes to the report. Each of these guides focuses on some common areas of inquiry from multiple perspectives, such as overall and local support for the PM project objectives, PSU involvement along the procurement process continuum, assessing procurement process and outcomes, and perceived levels of biased or collusive practices. In addition, each guide probes more deeply in the areas of experience of each group. The PSU guide focuses on procurement leadership, PSU tender characteristics and context, staff professionalization, administrative structure and PSU permanency status, desirability and/or stature of procurement career paths, and on framework contracting, e-catalog use and PPP. The Spending Unit Staff Guide explores the relationship and interaction between the PSU and the spending unit. The Key Stakeholder Guide collects data from a very different point of view, because the stakeholders are involved

Abt Associates Evaluation Design Report ▌pg. 40
in directing and implementing the PM interventions. Topics in this guide include the intended goals of the PM project, overall challenges to PM project implementation, adaptations to PM project implementation and approaches, high-level assessment of the political economy likely to affect the PM goals, and program data quality and completeness.
Rounds and timing: There will be a baseline and an endline interview. The baseline interview will be administered in September 2016, and the endline interview will be administered in August-September 2018. Stakeholder reports will be reviewed at the same time points, but will also include reports written throughout the baseline-endline interval.
Respondent(s) within the sample unit: Within PSUs and associated spending units selected for study, individuals will be sampled for the interview response at the discretion of PSU and spending unit leadership, or, if possible, at random from a roster. Staff associated with key stakeholders will be selected through discussions with MCC and MCA-I staff to identify the staff most knowledgeable about PM project activities.
Interviewers: Interviews will be conducted by local Indonesian-speaking interview staff. Interviewers will be identified and recruited by in-country Abt team members. These Abt team members are familiar with both the necessary interviewing skill set and with local professionals who have interviewing experience. The Abt evaluation team leads (Costa and Lee) will travel to Indonesia and will train the recruited interview staff in the administration of the PSU and spending unit interview protocols. The Abt evaluation leads will personally conduct the key stakeholder interviews.
The PSU and spending unit interviews will be recorded. The recordings will be uploaded to Abt’s secure servers via FTP. The original recordings will be erased as soon as upload is confirmed. The uploaded files will be transcribed by a professional transcription service based in the United States.
Data processing: The transcribed notes will be entered into NVivo for coding, as will synthesized notes from the review of the stakeholder reports.
Data quality: The sample of NVivo coding will be double-entered to assess inter-rater reliability. Any significant mismatches in coding will trigger additional training for Abt data entry and management staff.
Summary table:
Table 10. Data Collection Summary Table
Data Collection
Timing MM/YYYY (include
multiple rounds) Sample Unit/ Respondent Sample Size
Relevant Instruments/
Modules
Exposure Period
(months) PSU interviews Baseline,
09/2016 Endline, summer 08/2018
PSU (treatment and control) and the individual Interviewed
25 treatment PSUs (10 from Phase 1, 15 from Phase 2) 21 non-treatment PSUs (10 from Phase 1, 11 from Phase 2) Total of 138 respondents (3 from each PSU)
PSU-Staff Guide
Phase 1,39 months Phase 2, 24 months

Abt Associates Evaluation Design Report ▌pg. 41
Data Collection
Timing MM/YYYY (include
multiple rounds) Sample Unit/ Respondent Sample Size
Relevant Instruments/
Modules
Exposure Period
(months) Spending unit Interviews
Baseline, 09/2016 Endline, summer 08/2018
Spending unit and the individual interviewed
25 spending units associated with treatment PSUs 21 associated with non-treatment PSUs Total of 46 respondents (1 from each Spending Unit)
Spending Unit Staff Guide
Phase 1,39 months Phase 2, 24 months
Stakeholder organization interviews
Baseline, 08/2016 Endline, summer 07/2018
Stakeholder organization (LKPP, MCA-I, contractors) and the individual interviewed
~4 stakeholder organizations Total of 12-18 respondents
Key Informant-Staff Interview Guide
Phase 1, 39 months Phase 2, 24 months
4.5.5 Analysis Plan
Coding: Both the interview and report synthesis data will be entered into NVivo using a standardized coding scheme. The coding scheme will be derived from the 5S model in combination with nodes devoted to evaluation question sets and program-logic designated inputs, outputs and outcomes (see Section 4.2 and Table 4 above).
Analysis method/framework: The qualitative approach will use the 5S framework to organize data collection, management and analysis. Using the 5S organizational transformation model as the frame helps to array the PM project logic inputs and outcomes into related groupings defined by: superordinate goals (or shared values), structure, systems, skills and staff (Table 11).
Table 11. 5S Frame
5S Constructs Project Inputs/Activities Superordinate Goals (Shared Values)
• The sum of all inputs/activities
Structure • Organizational Development Training and Mentoring • Institutional Establishment Mentoring • Policy Dialogue • Training Institutions
Systems • Advisory services and development of PMIS • Implementation of PMIS for LKPP and PSU • Development of Policy Procedure for Framework Agreement • Development of Standard Bidding Documents for Framework Agreement • Advisory services for Framework Agreement for LKPP and PSU • Advisory services on PPP for policy and procedures • Development of SBDs for 4 PPP pilot projects • Development of Maturity Module • Development of Computer-Based Training • Development of Competency for Procurement Professional • Development of System of Fraud Filters

Abt Associates Evaluation Design Report ▌pg. 42
5S Constructs Project Inputs/Activities 5S Constructs • Project Inputs/Activities Skills • Procurement skills training and mentoring for PSU
• Procurement skills training for Non-PSU • Training of auditors • Organizational Development Training and Mentoring for PSU and Non-PSU Staff • Capacity Building training on PPP for LKPP and GCA
Staff • Procurement skills mentoring for PSU staff • Organizational development training • Institutional establishment mentoring
Abt will use the analytic output from NVivo to assess the level and types of organizational transition across the five elements of the framework. We will seek to determine respondent perceptions of change regarding the inputs provided through the PM project. These qualitative analyses will be validated by comparing the perceptions of the respondents to the objective measures available from the quantitative analyses.
In order to determine whether, how and why those inputs affected outcomes, we will also assess fidelity to design of the inputs, making note of changes to design and rationale for changes to design. PM project implementation facilitators and barriers will be recorded and used to contextualize the reported experiences and outcomes of pilot PSUs. This information will all be compared to the experiences of the non-pilot PSUs to help tease out general PSU change and evolution from that driven by the PM project inputs.
4.6 Challenges
Limitations and challenges to the evaluation include challenges with measurement, potential challenges to the validity of the assumptions underlying our proposed evaluation design, and potentially power to detect impacts.
For the quantitative analysis, there are challenges measuring difficult-to-measure outcomes, and challenges that the assumptions underlying the design do not hold. In particular, we anticipate having difficulties in measuring outcomes of which respondents may not be aware (such as budget absorption), and which they may not wish to report accurately (for example, regarding corruption and transparency). In addition to this, our analytical framework may not be well suited to accurately measure changes, in particular for the difference-in-differences analysis, if underlying trends are dissimilar for treated and comparison units because of selection into the program. Finally, a third challenge may be power to detect program impacts if they are not large. We will be using the universe of e-tenders in our interrupted time series analysis, and will be surveying nearly all employees of most PSUs in our survey analysis (except for in larger PSUs), and will not have scope to increase our sample to increase statistical precision or power to detect program impacts. We are also aware that the quality, completeness and types of data elements available in LPSE have been changing. This will affect which analyses can be performed over different time periods depending upon the data available (i.e., analyses involving fewer types of data may be possible over a greater number of years (2012 – 2018) while more nuanced analyses involving more varied types of data may only be possible for later years (2016-2018).
In the case of outcomes that may be difficult to measure, or difficulties in reporting, we anticipate that such difficulties will result in a downward bias in estimates, making our impact estimates for the program

Abt Associates Evaluation Design Report ▌pg. 43
conservative. We will learn from the interrupted time series analysis whether trends appear to be similar, for the outcomes for which they can be measured, across treated and comparison units, informing our interpretation of the difference-in-differences estimates. Also, using the sample of shortlisted PSUs helps to mitigate any concerns about selection bias, since these PSUs were also motivated to seek entry into the program. And finally, as shown in our power analysis, we are well powered to accommodate economically small changes in the relevant outcomes.
As in the quantitative analysis, qualitative challenges will include collecting information from interview respondents on topics about which they may have limited knowledge (although that in itself can be useful data). Another challenge will be social desirability response. Respondents may bias their answers toward responses that they believe reflect best on themselves or their organizations. To minimize this bias, we will remind respondents that their answers are confidential and will not be attributed directly to them. In addition, qualitative analyses will be validated against the objective measures available from the quantitative analyses. Other challenges of the qualitative analysis include limitations regarding objectivity and measurement. The information provided in both the interview and stakeholder reports is largely based upon individual perception and not drawn solely from objective evidence. In addition, statistical tests cannot be applied to qualitative data; therefore, differences, distributions and magnitude and cannot be precisely measured or expressed.

Abt Associates Evaluation Design Report ▌pg. 44
5. Administrative
5.1 Summary of IRB Requirements and Clearances
Abt is committed to conducting research in conformity with basic ethical principles and federal and other regulatory requirements that govern research involving human subjects. Abt holds a current Federal-Wide Assurance of Compliance from the U.S. Department of Health and Human Services’ Office for Human Research Protections. Before issuing approval, the Abt institutional review board (IRB) ensures that any research protocol includes adequate provisions to protect the privacy of subjects and the confidentiality of their information. The MCC Indonesia PM project Request for Proposals and contract also require that the evaluation undergo appropriate review by an IRB. Our project team has submitted a study protocol and consent documents to the Abt IRB, which has recommended our study for an expedited review. In addition to this, the study will be reviewed by a local IRB in Indonesia (for the survey being conducted by the in-country firm) prior to launch of data collection in summer 2016.
5.2 Preparing Data Files for Access, Privacy and Documentation
In keeping with MCC’s commitment to transparency and public sharing of data, and to ensure replication of the evaluation, we will keep all the documentation required to replicate the evaluation. The documentation will include:
• Survey summary
• Descriptive statistics
• “Readme” file
• Questionnaires
• Codebook
• Analysis programs, where used
• Final documentation
• Anonymized and raw datasets in STATA
As per the recommendation of our IRB, we will make the quantitative data public as a restricted use dataset through the MCC platform following completion of the study. Direct individual identifiers such as name will not be collected by the study for either qualitative interviews or quantitative surveys, in order to protect the identity of respondents. Indirect identifiers will additionally be removed from the data before they are provided to MCC.
5.3 Dissemination Plan
The Abt team plans to disseminate the results of the evaluation in the form of a stakeholder workshop in country in September 2019, following the completion of the evaluation, and in the form of conference presentations and peer-reviewed journal articles based on the data collection, analysis and findings.
Abt Associates Evaluation Design Report ▌pg. 45
5.4 Evaluation Team Roles and Responsibilities
The key staff comprising the Abt study team includes both U.S. and Indonesia-based staff. Our team has in-depth knowledge of PM leadership and principal actors, including MCC, MCA-I and LKPP. The core evaluation project staff is listed below.
Gissele Gajate-Garrido, Ph.D., Portfolio Manager/Project Director, is a senior impact evaluation and policy analysis specialist with more than 12 years of experience in the design and implementation of impact evaluations in developing countries. She has worked in projects related to institutional performance, agriculture, food security, nutrition, health and education in several developing countries including Ghana, Kenya, Mali, Ecuador, Peru and Pakistan. Dr. Gajate-Garrido has served as Evaluation Team Lead and/or Principal Investigator for many impact evaluations and has successfully taken evaluations from design to conclusion, in several occasions. As a consequence, she has a great deal of experience dealing with project implementing agencies as well as government officials in developing countries. She has participated in and spearheaded all elements of the research process, including proposal writing and development, survey design, data collection, and monitoring, data analysis, final reporting, and dissemination of findings at conferences nationally and internationally. Moreover, she has led multiple teams carrying out impact evaluations with various designs. As such, she has extensive knowledge of and experience with experimental and quasi-experimental impact evaluation methods, such as Instrumental Variables (IV), Difference-in-Difference (DD), Propensity Score Matching (PSM) and Propensity Score Weighting estimation techniques, all of which have been exemplified in her publication record. Moreover she has expertise in both population based survey design and in the design and implementation of Randomized Control Trials (RCTs). Dr. Gajate- Garrido provides overall management and administrative direction to the project as well as impact evaluation expertise.
Tulika Narayan, Ph.D., is the Technical Advisor for this evaluation. The head of the Monitoring, Evaluation and Analytics Practice in Abt’s International Economic Growth Division, Dr. Narayan is an evaluation expert with 15 years’ experience evaluation and applied econometrics. She is intimately familiar with quantitative and qualitative evaluation methods including economic impact analysis, cost-effectiveness analysis, and cost-benefit analysis. She is the Research Director for the multi-donor AgResults initiative, overseeing the research agenda and quantitative assessments for this multi-country program. As team leader of the MCC Farmer Income Support Project evaluation in Mozambique, she has led a multidisciplinary team to design and implement the evaluation. Dr. Narayan will provide detailed input on technical products and approaches for the evaluation.
Theodore M. Hammett, Ph.D., is this evaluation’s Project Quality Advisor. A Vice President and Principal Associate at Abt Associates, Dr. Hammett has extensive domestic and international experience in evaluation of interventions in public health and other domains. Many of these studies employed qualitative, quantitative, and mixed-methods designs. He has led projects and provided technical assistance in all areas of monitoring and evaluation, including process, outcome, and impact evaluation, and dissemination and utilization of research findings. He has also designed interventions and provided capacity development for host governments, civil society organizations, and other stakeholders. Dr. Hammett has experience working on projects in Asia, where he worked on the ground for over eight years and served as Chief of Party in Vietnam. In addition to his project work, Dr. Hammett serves as chair of Abt’s Quality Assurance Council and edits the Abt Thought Leadership Paper Series. Dr. Hammett will provide quality assurance on all technical products and approaches for the evaluation.

Abt Associates Evaluation Design Report ▌pg. 46
Michael Costa, MPH, is the Senior Analyst leading the qualitative evaluation and serves as the overall technical lead on the evaluation. He is a Behavior/Reform Specialist, with 20 years of experience designing, managing and executing research, evaluation and implementation projects for a wide spectrum of clients. Mr. Costa is currently project director of a mixed-methods study to assess adaptation and organizational behavior change at Ryan White HIV/AIDS service providers. He is also currently working with the National Association of Community Health Centers, Community HealthCorps on an organizational change management initiative for their national project. As Abt Project Director/Evaluation Director for SAMHSA from 2001 through 2011, Mr. Costa led the evaluation of, and technical assistance to, 36 minority-focused HIV/AIDS programs. His work included evaluating organizational change regarding culturally competent behavioral health services in service provider organizations. Dr. Costa is the overall technical lead for both the qualitative and quantitative evaluation components.
Hiren Nisar, Ph.D., is a Senior Analyst on this project, leading the quantitative evaluation of the PM project. He has over nine years of experience managing various tasks on evaluation research project and recently leading projects and business proposals. He has led several quantitative research designs and analysis that meet rigorous evaluation standards. Additionally, Dr. Nisar has conducted a variety of quantitative analyses as needed on projects; these analyses include, but are not limited to: descriptive survey analysis, analyzing trends, summarizing high level information, and doing a variety of advanced statistical analyses. He has also performed various tasks in random assignment studies such as randomization of participants to experimental groups, conducting baseline equivalence and analysis of the randomized data. Dr. Nisar will lead the implementation and analysis of the quantitative evaluation.
Kate Hausdorff, M.S., is an Analyst on this project, assisting with the quantitative evaluation of the PM project. Ms. Hausdorff is an economist with extensive training in quantitative evaluation methods and data analysis. At Abt, she is currently the Evaluation Analyst on AgResults’s pilot in Nigeria, for which she supports quantitative data analysis and evaluation design. In 2015, she served as a Research Assistant in Zambia, where she cleaned and collected survey data, conducted FGDs, and created auditing surveys. Ms. Hausdorff will support Dr. Nisar with the quantitative evaluation implementation and analysis.
Our Procurement Reform Expert, Michael Buehler, Ph.D., is a Lecturer in Comparative Politics in the Department of Politics and International Studies, School of Oriental and African Studies, University of London and an experienced researcher with extensive experience in Indonesia. He recently authored a World Bank report analyzing public procurement in Indonesia in a political economy context, and has presented these findings in several international workshops. With a specialty in Southeast Asian politics, his teaching and research interests revolve around state-society relations under conditions of democratization and decentralization. Previously he taught at Columbia University and Northern Illinois University. Dr. Buehler will provide support to the collection and analysis of qualitative data on the PM project.
Kharisma Nugroho, Ph.D., is the in-country Program Manager. The former Director of Monitoring and Evaluation for MCA-Indonesia and former Interim Project Director for the PM project, Dr. Nugroho is uniquely qualified to lead technical aspects of this research. While in his role at MCA-Indonesia, Dr. Nugroho designed and managed the M&E of $600 million programs on nutrition and green prosperity, in addition to procurement modernization. He served as program officer/M&E specialist for an AUSAID-Asia Foundation program, Revitalizing Indonesia’s Knowledge Sector for Development Policy, providing technical assistance in developing an M&E system and tools. Dr. Nugroho is also active in networking
Abt Associates Evaluation Design Report ▌pg. 47
with local government and civil society organizations in Java and Eastern Indonesia in the area of social transformation, focusing on the role of agency and structure in social transformation. He has extensive experience in evaluation, particularly in randomized impact evaluations, as well as in developing and overseeing monitoring. Dr. Nugroho will oversee the administrative aspects of the implementation of the PM project evaluation in Indonesia.
Andysheh A. Dadsetan, in-country Senior Analyst, is a Program Management and Monitoring & Evaluation professional with over six years’ experience conducting program design and coordination, as well as policy research, for think tanks, UN agencies, academic institutions, and private consulting firms. He has an MA in international development, and spent three years conducting federal contracting and defense procurement analysis using the Federal Procurement Data System on behalf of the U.S. Department of Defense, publishing three subsequent reports and policy briefs on our findings regarding spending trends, competitiveness, and data integrity. He has overseen monitoring and & evaluation projects at the national level, including designing and implementing a Disaster Risk Management program and database with the Office of National Security in Sierra Leone, and managing monitoring & evaluation of rural economic development programs with the Ministry of Rural Development in India. His responsibilities included survey design in ODK, trainings of survey teams, and conducting data quality checks and analysis in STATA, as well as assessing trainings and workshops for district program officers in the use of an innovative new data system. Mr. Dadsetan will oversee technical aspects of the implementation of the evaluation in the field.
Ririt Arya, Senior Analyst, will provide in-field research assistance to the evaluation team. Ms. Arya has experience with the MCA-Indonesia M&E Unit. In her capacity as an M&E Specialist, Ms. Arya was responsible for tracking project activities implementation; data collection, review and analysis; and delivering progress reports and recommendations to the M&E Director and other MCA-Indonesia units and stakeholders. In addition to that, she was responsible for internal administration, finance, and contract management issues. Since resigning from MCA-Indonesia in May 2014, Ms. Arya has worked on independent evaluations for other development projects, including the Fred Hollows Foundation Australia and the International Labor Organization Bureau for Employers’ Activities. Ms. Arya will provide support to Dr. Nugroho in the administration and implementation of the evaluation in the field.
During final negotiations of the referenced contract, MCC/W addressed several clarification questions to Abt Associates around important issues of disclosing any work performed related to the project being evaluated, given the inclusion in the Abt team of experts such as Kharisma Nugroho and Ririt Arya who have prior work experience with MCA-Indonesia. Accordingly, a Conflict of Interest and Independence Mitigation Plan was filed during final proposal negotiations and will be regularly reviewed/updated as appropriate to insure the integrity and independence of the evaluation being performed for MCC.
Independence Risk Mitigation Approach
During final negotiations of the referenced contract, MCC/W addressed several clarification questions to Abt Associates around important issues of disclosing any work performed related to the project being evaluated, given the inclusion in the Abt team of experts such as Kharisma Nugroho and Ririt Arya who have prior work experience with MCA-Indonesia. Accordingly, a Conflict of Interest and Independence Mitigation Plan was filed during final proposal negotiations and will be regularly reviewed/updated as appropriate to insure the integrity and independence of the evaluation being performed for MCC.
Abt Associates Evaluation Design Report ▌pg. 48
Abt strongly agrees that the independence of the evaluation is paramount and have included Dr. Nugroho in our proposed team as someone who is knowledgeable about MCA-I and the PM project but had no role in the project’s design and will not threaten the evaluation’s independence. Dr. Nugroho’s primary role at MCA-I was as Director of Monitoring and Evaluation, a position in which he did not have responsibilities relating to the PM project or its design. Dr. Nugroho served as interim director of the PM project for three months in 2014 while MCA-I was recruiting for a new permanent project director to replace one who had left. During those three months, Dr. Nugroho was still serving in his primary role as Director of Monitoring and Evaluation and devoted only 20% of his time to the PM project. His role in the PM project was largely administrative, including tasks such as approving invoices and liaising with the government, MCC, and the project team, so that the project could continue to run while a search was ongoing for a replacement director.
Dr. Nugroho did not work on the design of the PM project at any time, nor were any strategic decisions related to the design made during his time as interim director. His position on the independent evaluation team will not compromise the team’s independence or impartiality.
With regards Ms. Arya, she joined MCA-Indonesia M&E Unit in May 2014 as one of the Unit’s M&E Specialists where her core tasks included providing technical and administrative support to the M&E Unit Director, including support to the monitoring and evaluation of the MCA-Indonesia PM Project. In her capacity as an M&E Specialist, Ms. Arya was responsible for tracking project activities implementation; data collection, review and analysis; and delivering progress reports and recommendations to the M&E Director and other MCA-Indonesia units and stakeholders. In addition to that, she was responsible for internal administration, finance and contract management issues. The design of the PM Project was fully established and underway at the time Ms. Arya jointed and had not undergone any revisions during her employment MCA-Indonesia. Since resigning from MCA-Indonesia in May 2014, Ms. Arya has worked on independent evaluations for other development projects, including the Fred Hollows Foundation Australia and the International Labor Organization (ILO) Bureau for Employers’ Activities (ACT/EMP), but none of these activities relate to MCA-Indonesia programs at any level.
Ms. Arya has never been tasked nor had any involvement in the formulation and/or development of the design of the PM Project either before, during, and/or after her time with MCA-Indonesia. Her position on the team will not compromise the team’s independence or impartiality in any way.
We will take all measures to mitigate risks to the independence of the evaluation to ensure that the evaluation process, as stated in the Organization for Economic Cooperation and Development’s Development Assistance Committee (OECD DAC) Principles for the Evaluation of Development Assistance, is “impartial and independent in its function from the process concerned with the policy making, the delivery and the management of development assistance.” While we do not believe Dr. Nugroho or Ms. Arya’s role on the evaluation team will pose a threat to independence due to the limited role they played in the PM project while employed by MCA-I and their role on the evaluation, we will take the following measures to further guard against any actual or perceived threats:
• Independence of design. Our evaluation design will be led by Senior Technical Expert Michael Costa in collaboration with Jean Lee for Quantitative Issues and Tulika Narayan/Ted Hammet our Project Quality Advisers. They will also receive inputs from Procurement Reform Expert Dr. Michael Buehler. Dr. Nugroho’s involvement in the design will be as an advisor; he will not have influence over crucial design elements such as the refining of evaluation questions and outcome measures or the selection of stakeholders to be interviewed. Rather, Dr. Nugroho’s role will more heavily emphasize data collection and analysis. Ms. Arya’s role in the project will be limited to supporting the team’s

Abt Associates Evaluation Design Report ▌pg. 49
efforts in research, analysis and administration. She will be closely supervised by the Abt Technical Team and will not be directly involved in any issues which would influence the evaluation design.
• Independence of data collection. To ensure that Dr. Nugroho’s involvement in the evaluation will in no way influence the interview responses of key stakeholders, Dr. Nugroho will not conduct interviews with any person with whom he has a current or former professional relationship. Other members of the team and/or survey firm personnel will conduct these interviews rather than Dr. Nugroho. Ms. Arya will play a purely administrative and research role in these efforts, always working closely with other members of the Technical Team to insure independence of data collection.
• Independence of analysis and reporting. Dr. Nugroho will play an important role in data analysis, but will not lead the analysis of key evaluation questions or the overall assessment of program effectiveness. Senior Technical Adviser Michael Costa and Quantitative Lead Jean Lee will have primary responsibility for analysis and report writing and will work in close collaboration with not only Dr. Nugroho, but also other members of the Abt team and Dr. Buehler to formulate conclusions. Dr. Nugroho will not work on any analysis or report writing task that is not also reviewed by another team member. Ms. Arya’s role will be limited here to research and administration support, always under the close supervision of senior technical staff.
Furthermore, as part of our approach to analysis and reporting, Abt has designated two project quality advisors, Dr. Tulika Narayan and Dr. Theodore Hammett, to provide oversight on all key evaluation outputs and to provide advice and input at critical points such as the drafting of the evaluation design. Dr. Narayan and Dr. Hammett will devote special scrutiny to any potential threats to evaluation independence in the evaluation’s design and execution, in addition to ensuring overall quality. While we do not expect independence-related issues to arise, in the event that either project quality advisor sees cause for concern, they will immediately inform both the Program Manager and the home office Portfolio Manager/Project Director, Peter Levine, for action.
5.5 Evaluation Timeline and Reporting Schedule
The Abt Associates contract with MCC establishes a series of deliverables, reports, and related documentation that will be generated over the course of the project’s period of performance (pages 26-28 of Contract). This begins with the Evaluability Assessment and Evaluation Design Report as key deliverables during the Base Period (September 28, 2015 to September 27, 2016), then continues to include material related to the Baseline Evaluation, Program Monitoring and other similar items. The schedule for these and other reports is incorporated into project Work Plans, which are regularly updated in cooperation with our MCC Project Monitor, who works with the team to further coordinate with MCA-Indonesia and other key stakeholders. In addition to technical reports delivered pursuant to our contract schedule, the Abt team prepares and submits other regular reporting such as Trip Reports, Statements of Work (SOWs), and detailed invoices, as well as more ad hoc reports/updates such as the evaluation design report presentation given to MCA-Indonesia and other stakeholders in March of 2016.
Table 12. Evaluation Timeline Summary
Name of Round Data Collection Data Cleaning &
Analysis First Draft Report
Expected Final Draft Report
Expected Baseline 8/2016-9/2016 10/2016-1/2017 2/2017 4/2017 Endline 5/2018-6/2018 7/2018-9/2018 11/2018 3/2019

Abt Associates Evaluation Design Report ▌pg. 50
6. References
Attström, Karin and Rusman, Ismail. 2010. Indonesia Strengthening Public Procurement Program ISP3 INH521: Independent Completion Report. Jakarta: AUSAID. p. 4.
Buehler, Michael. 2012a. Countries at the Crossroads: Indonesia. Washington D.C.: Freedom House.
Butcher, John. 1993. “Revenue Farming and the Changing State in Southeast Asia,” in John Butcher and Howard Dick, The Rise and Fall of Revenue Farming: Business Elites and the Emergence of the Modern State in Southeast Asia. New York: St. Martin‘s Press.
CIPE/Transparency International Indonesia/ Transparency International USA. 2011. Apec Procurement Transparency Standards in Indonesia: A Work in Progress. Available at http://tinyurl.com/9umyads
Cribb, Robert. 2012. “A System of Exemptions: Historicizing State Illegality in Indonesia,” in Edward Aspinall and Gerry van Klinken, Eds., The State and Illegality in Indonesia. Leiden: KITLV, pp. 36-48.
Fitrani, Fitria, Hofman, Bert, and Kaiser, Kai. 2005. “Unity in Diversity? The Creation of New Regions in a Decentralizing Indonesia,” Bulletin of Indonesia Economic Studies, Vol. 41: 57-79.
Gatra. 2007. “Lembaga baru pemantau tender: pemerintah membentuk Lembaga Kebijakan Pengadaan Barang dan Jasa Publik,” Gatra, 26 December, p.12.
Harvard Kennedy School. 2010. From Reformasi to Institutional Transformation: A Strategic Assessment of Indonesia’s Prospects for Growth, Equity and Democratic Governance. Cambridge: Harvard Kennedy School Indonesia Program.
Hidayat, Rachmat. 2015. Local Government E-Procurement Practices in Indonesia: Accountability, Efficiency, and Barriers. Journal of US-China Public Administration, 12, 2: 105-114.
Jakarta Post, 2009. “State agencies to improve procurement system,” The Jakarta Post, 3 December. Available at http://www.thejakartapost.com/news/2010/01/04/unfair-tenders-still-most-reported-cases.html
Kimura, Ehito. 2013. Political Change and Territoriality in Indonesia: Provincial Proliferation. London: Routledge.
Larasati, Dewi. 2011. Development of Contractor Quality Assurance System in Indonesia Construction Procurement. Unpublished Ph.D. Dissertation: Kochi University of Technology.
Lewis, Blane. 2006. “Local Government Taxation: An Analysis of Administrative Cost Inefficiency,” Bulletin of Indonesian Economic Studies, Vol. 42, No. 2: 213-233.
Lewis-Faupel, Sean, Neggers, Yusuf, Olken, Benjamin A., Pande, Rohini. 2014. “Can Electronic Procurement Improve Infrastructure Provision? Evidence from Public Works in India and Indonesia,” NBER Working Paper No. 20344, online. Available at http://www.nber.org/papers/w20344
McLeod, Ross. 2005. “The Struggle to Regain Effective Government under Democracy in Indonesia,” Bulletin of Indonesian Economic Studies, Vol. 41, No. 3.

Abt Associates Evaluation Design Report ▌pg. 51
McLeod, Ross. 2000. “Soeharto’s Indonesia: A Better Class of Corruption,” Agenda, Vol. 7, No. 2: 99-112.
Mutiarin, Dyah. 2014. “Public Service Integrity Perception: Case Study in Kutai Kartanegara,” Journal of Government and Politics 5, 1: 92-103.
Nugroho, Rino. 2014. “Electronic Government Procurement Adoption in Developing Economies: How Corruption Influence System’s Adoption,” Proceedings of the 14th European Conference on E-Government (ECEG): 344.
Nurmandi, Achmad. 2013. “What is the Status of Indonesia’s E-Procurement?” Journal of Government and Politics 4, 2, online. Available at http://journal.umy.ac.id/index.php/jsp/article/view/73/224
Nurmandi, Achmad and Sunhyuk Kim. 2015. “Making E-Procurement Work in a Decentralized Procurement System,” International Journal of Public Sector Management 28, 3: 198-220.
OECD. 2012. Government at a Glance 2011. London: Palgrave Macmillan, pp. 148-9, Available at http://www.oecd.org/gov/governmentataglance2011.htm
OECD/ DAC. 2007. “Snapshot Assessment of Indonesia’s Public Procurement System: Piloting OECD/ DAC Procurement JV Baseline Indicator (BLI) Benchmarking Methodology Version 4,” Available at http://www.oecd.org/development/effectiveness/39254688.pdf
Rahardjo Agus, “Progress and Challenges in Procurement Reform in Indonesia,” in ADB/OECD 2007, Fighting Bribery in Public Procurement in Asia and the Pacific. Bali: Indonesia.
Rahman, Erman et al. 2012a. Improving Public Procurement Outcomes in Local Government in Indonesia: An Empirical Analysis. Jakarta: The Asia Foundation.
Rahman, Erman et al. 2012b. “Report on the Scan of Sub-National Governments Procurement Reform Initiatives,” Case Studies of Procurement Practices at the Sub-National Level in Indonesia. Jakarta: The Asia Foundation.
Rahman, Erman et al. 2012c. “Draft Report: Second Batch of Case Studies of Procurement Reform at Local Level,” Case Studies of Procurement Practices at the Sub-National Level in Indonesia. Jakarta: The Asia Foundation.
Rahman, Erman et al. 2012d. “Third Batch of Case Studies of Procurement Reform at Sub-National Level (Provincial Governments),” p. 9.
Rahman, Erman et al. 2012e. Provincial Government’s Procurement Reform Initiatives: Annex 2, Jakarta: The Asia Foundation: 1-43.
Satriyo, Hana A., Abidin, Adi, Kusdaryanto, Hari and Bulosan, Luce Agnes. 2003. Indonesia Rapid Decentralization Appraisal (IRDA): Third Report. Jakarta: The Asia Foundation.
Sherlock, Stephen. 2002. “Combating Corruption in Indonesia? The Ombudsman and the Assets Auditing Commission,” Bulletin of Indonesian Economic Studies, Vol. 38, No. 3: 367-383.
USAID (2013). “Conducting Mixed-Method Evaluations.” Technical Notes Version 1.
Abt Associates Evaluation Design Report ▌pg. 52
Van Klinken, Gerry and Aspinall, Edward. 2012. “Building Relations: Corruption, Competition and Cooperation in the Construction Industry,” in Edward Aspinall and Gerry van Klinken, Eds., The State and Illegality. Leiden: KITLV, pp. 144-69.
Wescott, Clay G. 2008. “World Bank Support for Public Financial Management: Conceptual Roots and Evidence of Impact,” Background Paper to Public Sector Reform: What Works and Why? An IEG Evaluation of World Bank Support, Washington D.C.: The World Bank, pp. 12-4.
World Bank. 2012. Indonesia - South Sulawesi Public Expenditure Analysis 2012 : Improving public service delivery and financial management in the gateway to Eastern Indonesia. Washington, DC: The World Bank.
World Bank. 2007. Spending for Development: Making the Most of Indonesia’s New Opportunities. Jakarta: The World Bank.
Zullo, Roland. 2006. “Public-Private Contracting and Political Reciprocity,” Political Research Quarterly, Vol. 59, No. 2: 273-81.

Abt Associates Evaluation Design Report ▌pg. 53
7. Annexes
7.1 Stakeholder Comments and Evaluator Responses
Initial feedback from stakeholders (MCC, MCA-I, LKPP, contractors) involved clarify the PM program logic. When Abt began its design, there were multiple versions of the program logic model in circulation among the stakeholders. At two different points in the design process Abt was provided with updated project logic models. Stakeholders were helpful in pointing out updates that affected some of the focus areas of the evaluation design. Additional stakeholder feedback regarding the evaluation design centered on ensuring that the questions addressed by the design were relevant to the evaluation questions of most interest to them. While nearly all comments aligned with the evaluation questions specified by MCC in the original solicitation, Abt deemed that a few were out of scope (e.g., comparing perceived value of PM Project staff training to past trainings). Additional feedback helped the Abt team to clarify the questions (and terminology used) for PSU and Spending Unit staff to avoid confusion and better focus the questions.
7.2 Evaluation Budget
Table 13. Evaluation Budget Summary
Task
Total Estimated
Cost Deliverable
Percentage of Task
Completed Estimated Due Date
1 Assess Evaluation Plan
84,420 Written assessment of program logic, review of evidence, ERR and beneficiary analysis
100% 25-Mar-2016
2 Develop Evaluation Design Report
168,841 SOW, Trip Report for each country visit
Agenda, minutes of each local stakeholder workshop/meeting
Draft Evaluation Design Report 100% 17-May-2016 Local stakeholder feedback with response 100% 27-May-2016 MCC feedback with response 100% 27-May-2016 Final Evaluation Design Report (updated as
needed) 80% 2-Feb-2017
3 Develop Baseline Evaluation Materials
84,420 Draft data collection firm terms of references 100% 7-Jul-2016
Draft English questionnaires, training manuals 100% 25-May-2016 SOW, Trip Report for each country visit Summary of pilot test 100% 25-June-2016 Written review of back-translation 100% 25-June-2016 Final English questionnaires, training manuals 100% 25-June-2016 IRB approval/clearances with informed consent
statement(s) 100% 25-June-2016
Documentation of local stakeholder and MCC feedback and response
100% 25-June-2016
4 Supervise Baseline data collection
253,261 SOW, Trip Report for each country visit Written minutes of meetings with data collection firm(s)
Written summary of quality control checks 100% 15-Sep-2016
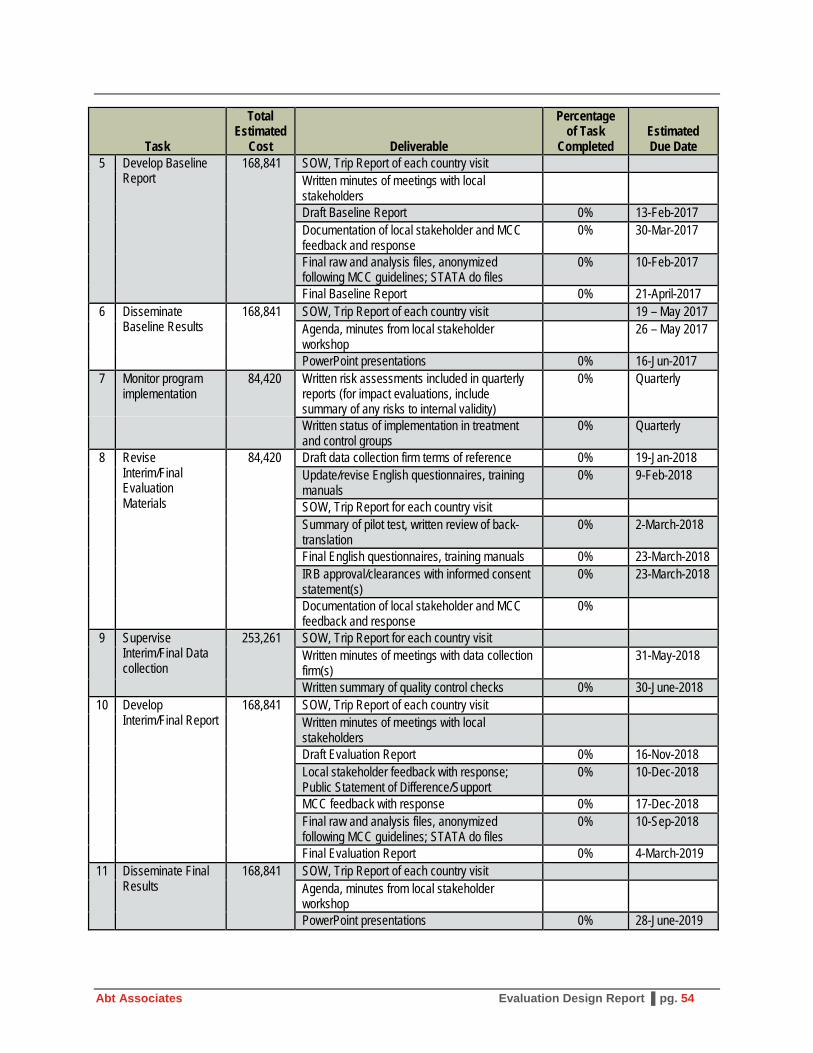
Abt Associates Evaluation Design Report ▌pg. 54
Task
Total Estimated
Cost Deliverable
Percentage of Task
Completed Estimated Due Date
5 Develop Baseline Report
168,841 SOW, Trip Report of each country visit Written minutes of meetings with local stakeholders
Draft Baseline Report 0% 13-Feb-2017 Documentation of local stakeholder and MCC feedback and response
0% 30-Mar-2017
Final raw and analysis files, anonymized following MCC guidelines; STATA do files
0% 10-Feb-2017
Final Baseline Report 0% 21-April-2017 6 Disseminate
Baseline Results 168,841 SOW, Trip Report of each country visit 19 – May 2017
Agenda, minutes from local stakeholder workshop
26 – May 2017
PowerPoint presentations 0% 16-Jun-2017 7 Monitor program
implementation 84,420 Written risk assessments included in quarterly
reports (for impact evaluations, include summary of any risks to internal validity)
0% Quarterly
Written status of implementation in treatment and control groups
0% Quarterly
8 Revise Interim/Final Evaluation Materials
84,420 Draft data collection firm terms of reference 0% 19-Jan-2018 Update/revise English questionnaires, training manuals
0% 9-Feb-2018
SOW, Trip Report for each country visit Summary of pilot test, written review of back-translation
0% 2-March-2018
Final English questionnaires, training manuals 0% 23-March-2018 IRB approval/clearances with informed consent statement(s)
0% 23-March-2018
Documentation of local stakeholder and MCC feedback and response
0%
9 Supervise Interim/Final Data collection
253,261 SOW, Trip Report for each country visit Written minutes of meetings with data collection firm(s)
31-May-2018
Written summary of quality control checks 0% 30-June-2018 10 Develop
Interim/Final Report 168,841 SOW, Trip Report of each country visit
Written minutes of meetings with local stakeholders
Draft Evaluation Report 0% 16-Nov-2018 Local stakeholder feedback with response; Public Statement of Difference/Support
0% 10-Dec-2018
MCC feedback with response 0% 17-Dec-2018 Final raw and analysis files, anonymized following MCC guidelines; STATA do files
0% 10-Sep-2018
Final Evaluation Report 0% 4-March-2019 11 Disseminate Final
Results 168,841 SOW, Trip Report of each country visit
Agenda, minutes from local stakeholder workshop
PowerPoint presentations 0% 28-June-2019