mcc ghana impact evaluation services evaluation design report
TRANSCRIPT

R E P O R T
MCC Ghana Impact Evaluation Services
Evaluation Design Report
DECEMBER 19, 2011
REVISED ON SEPTEMBER 8, 2017
SUBMITTED TO:
Millennium Challenge Corporation
Contracts and Grants Management
Division
Attention: William Hummel,
Senior Contract Specialist
875 15th Street, NW
Washington, DC 20005
Telephone: (202) 521-3600
SUBMITTED BY:
NORC at the University of Chicago
55 East Monroe Street
30th Floor
Chicago, IL 60603
Telephone: (312) 759-4000
Fax: (312) 759-4004

|
i
TABLE OF CONTENTS
A. INTRODUCTION ....................................................................................................... 1
B. PROPOSED EVALUATION DESIGNS ..................................................................... 2
B.1 Agriculture Project: Post Harvest Activity ....................................................... 2
B.2 Agriculture Project: Irrigation Activity ............................................................ 14
B.3. Rural Development Project: Community Services Activity, Education .......... 19
B.4 Rural Development Project: Financial Services ........................................... 23
B.5 Rural Development Project: Credit Activity ................................................... 26
C. DATA SOURCES .................................................................................................... 30
C.1 GLSS5+ Database ....................................................................................... 30
C.2 FBO Survey Data ......................................................................................... 30
C.3 MiDA GIS Database ..................................................................................... 31
C.4 APEX Data ................................................................................................... 32
C.5 School Census, EMIS Database .................................................................. 33
C.6 Population Data from Ghana Statistical Services ......................................... 33
C.7 School District Data ...................................................................................... 33
C.8 Summary of Data Sources ........................................................................... 34
D. PHASE II WORKPLAN ........................................................................................... 34
ANNEX 1: PROPOSED EVALUATION METHODOLOGIES ....................................... 37
ANNEX 2: POWER CALCULATIONS .......................................................................... 39
ANNEX 3: INFORMATION ON POST-HARVEST INFRASTRUCTURE ACTIVITIES . 41
|
1
A. INTRODUCTION
MCC has contracted with NORC to assess the impact of up to five activities under the MCC
Program in Ghana using the most rigorous methods possible. These activities include:
1. Agriculture Project, Post-Harvest Activity and Community Services Project,
Electrification Sub-Activity
2. Agriculture Project, Irrigation Activity
3. Agriculture Project, Credit Activity
4. Rural Development Project, Community Services Activity, Education Sub-Activity
5. Rural Development Project, Financial Services
NORC noted in its proposal that there are several challenges that the evaluations of these
activities must address at the outset. All the activities and sub-activities are already underway
and at different stages of implementation; all of them must be completed by February 2012,
when the MCC Compact with Ghana ends. Impact evaluation designs were not built into the
implementation of the activities from their inception and, as such, rigorous impact evaluations
with statistically valid control groups and unbiased impact estimates are difficult to achieve.
Some projects, such as the Credit Activity, encountered implementation problems and, as such,
did not progress as planned to the point where a measurable impact outcome could be detected.
Finally, no baseline data was collected for the explicit purpose of evaluating these projects,
although some data that may be of value to the impact evaluation exists.
In light of these challenges, in Phase 1 of this evaluation, the NORC team focused on
understanding the specifics of each projects to determine how each activity can best be
evaluated. Our objective at the outset is to design as rigorous an evaluation as possible, given
project implementation realities and available baseline data. Towards this end, we undertook
three information-gathering tasks:
Review of background information for each of the six activities, including objectives,
implementation details, background review of relevant geographical areas and economic
sectors, as well as some baseline data that was available.
Meetings with relevant staff from MCC, who provided additional details about the six
interventions.
A two-week trip to Ghana by key members of the NORC team in November 2011 to meet
with MCC, MiDA, supervising and implementing agencies, and other stakeholders to gather
critical information on project implementation and coverage, and data to inform decisions
regarding evaluation designs. During this trip, NORC staff met with:
o MiDA program staff and implementing/coordinating agencies for the six activities to
gather information about the implementation status for each activity/sub-activity,
discuss implications of the impact evaluation for project implementation, and discuss
feasible options for identifying comparison groups for each intervention;
o Entities responsible for the collection of data that were identified as useful baseline
for the evaluation to discuss available data, data quality and data gaps, and explore

|
2
options for gaining access to the datasets. These organizations included ISSER for the
GLSS5+ and FBO survey; Ghana Statistical Services (GSS) for the 2010 Census, and
the Ministry of Education for EMIS data. Additionally, we had been in contact with
UNICEF and Innovations of Poverty Action to explore access to data through them.
o Apex Bank to discuss options for gathering data from rural banks within the
Confidentiality Regulations.
o Potential direct beneficiaries of several post-harvest and irrigation activities, such as
anchor farmers, SPEG, and FBOs' members, rural bank automation, and the school
construction sub-activity
Based on information gathered during Phase I activities, as well as a preliminary review and
analysis of available datasets, we present below our proposed evaluation designs and potential
data sources for the six activities/sub-activities.
B. PROPOSED EVALUATION DESIGNS
In this section, we discuss each of the MiDA activities and sub-activities separately. For each
activity/sub-activity, we present the following:
Background information about the intervention
Key evaluation hypotheses and impact indicators
Data sources
Proposed Evaluation Methodologies, associated risk factors
Key considerations
B.1 Agriculture Project: Post Harvest Activity
The Post-Harvest Activity aims to provide infrastructure – coolers, pack houses, agribusiness
centers, and a Perishable Cargo Centre at the Accra airport – to producers and other actors in the
value chains for horticultural exports and grains for local markets. These facilities will help
maintain the quality of these agricultural products from the farms to their markets.
Post-harvest infrastructure, supported by adequate power sources, can affect the incomes of
farmers, exporters, and other actors in the respective value chains by providing storage for farm
products; reducing post-harvest losses of fruits, vegetables, and grain crops; and improving their
quality at the time of arrival at their markets. These investments can thereby increase market
prices and/or open or ease access into new markets (export markets, for example) for these
agricultural products.
Based on our assessment of the post-harvest infrastructure activities and their close link with
electricity, we have determined that it is logical to evaluate the two MiDA activities as a
package. All the new post-harvest facilities that were constructed (public pack houses and
agribusiness centers) required electricity investments, as did those improvements to SPEG pack
houses where new cooling facilities were installed. Therefore, we are not proposing a separate
evaluation of the electricity component of the MiDA Program.
|
3
B1.1 Agribusiness Centers
Background Information
The Millennium Development Authority (MiDA) is presently financing the construction of ten
Agribusiness Centers (ABCs) that will provide services for the initial processing, storage, and
marketing of grain crops produced by farmer-based organizations (FBOs) within their respective
intervention areas. Each ABC will be outfitted with specialized equipment for processing either
rice or maize, although its complement of installed equipment can later be modified for
processing other grain crops, such as soybeans, as their operations expand. The initial crop that
was selected for processing at the respective ABCs is based on the prevalent crop that is grown
in the area. Each ABC is designed to store approximately 1,000 tons of grain and will serve as a
grain processing and marketing center for FBO members located in the vicinity of the center,
within a radius of approximately 20 kilometers. All ten ABCs are presently under construction,
with their expected completion between December 2011 and January 2012. Initially, MiDA had
planned to fund the construction of sixteen ABCs but budget constraints limited the number of
facilities to only ten.
The ABCs will provide for-fee grain processing services including maize shelling or paddy rice
de-husking and de-stoning, along with grain drying, cleaning, sorting, selecting, bagging,
palletizing, and storing. If desired, the ABCs will market the grain inventory stored on behalf of
its FBO clients; otherwise, the ABC will store the grain securely until it is sold directly by the
client. In addition to grain processing, storage, and marketing services, the ABCs will sell inputs
to its FBO members, including improved seed, fertilizer, and farm chemicals. It will also provide
tractor services to small farmers who are members of its affiliated FBOs, to help them prepare
their land for planting.
The ABCs will be privately-owned, privately-operated, profit-making service organizations.
Each facility will be jointly owned by a private entrepreneur, known as a “lead investor”, along
with twenty farmer-based organizations, each of which has a membership of approximately 50
members.1 Each ABC will be managed by the respective lead investor, who was selected by
MiDA through a competitive bidding process, and will own 70 percent of the ABC.
The ABCs are generally located within those areas where there are heavy concentrations of grain
production. The lead investors have been instrumental in deciding the specific location of the
respective ABC within the grain producing areas, and most are located along main roads with a
nearby supply of electric power and water.
MiDA delegated the section of FBO partners at each ABC to its regional implementation
consultants (RICs). Once the location of the ABC was decided, the RIC drew an imaginary circle
with a 20-kilometer radius around the location, and all the FBOs within the defined area that had
been registered and trained under the MiDA program became candidates for membership in the
ABC. The RIC then invited these FBO leaders to an executive session to discuss the possibility
of creating a FBO Union that would participate in the proposed ABC. Through this orientation
process the FBO leaders became sensitized to the potential benefits of cultivating the selected
crops and marketing them through the ABCs. Additional meetings and follow-up resulted in the
1 Note that more than one member of a farmer household may belong to an FBO. This means that an FBO member
does not necessarily represent one farm or one rural household.
|
4
creation of an FBO Union composed of 20 FBOs with approximately 1000 members that would
become co-owner of the respective ABC. After the initial FBO selection took place, there was a
second round of fine-tuning for the participants to reach the final composition of the FBO Union.
Some FBO members decided not to participate in the venture, and in a few instances, FBOs with
extremely poor credit repayment records were rejected. The rejection was conducted on a case-
by-case basis, based on a subjective assessment by the MiDA staff on the past credit payment
performance of the FBO.
Evaluation Hypotheses and Impact Indicators
Like other MIDA post-harvest infrastructure investments, ABCs aim to increase the livelihood of
small farmers. This intervention in particular was designed to resolve three major issues that
affect commercial agricultural production by small farmers: 1) deficient handling, processing and
storage of agricultural products after harvest, 2) weak marketing systems that results in below-
market prices for commodities produced by small farmers, and 3) lack of reliable agricultural
input supplies and farm equipment services commercially available to small farmers.
The hypothesis is that solving the above problems should translate into 1) a reduction of post-
harvest losses, 2) better market prices, and 3) higher crop yields. All this in turn increases total
production, total profits and therefore farmers' income from crop harvest.
There are several indicators that can be used to measure the impact of the ABCs on the wellbeing
and productivity of small farmers. They include the following:
1. Total annual household income.
2. Total annual farmer revenue from maize and rice production
3. Annual sales volume (in kilograms, for example) of the targeted crops per household.
4. Percentage post-harvest losses for the targeted crops
5. Crop yield – net amount of grain produced per unit area (e.g., kilograms of maize or rice
produced per hectare)
Additionally, other intermediate outcomes can be measured in order to understand intermediate
impacts. These could be use of fertilizers, insecticide, fungicide, and other production inputs and
unit prices for the crops.
Without additional assumptions, for which there is no data-based evidence, there is no reason to
think that this intervention should have differential effects by sex or age of the farmer. Thus, we
do not recommend separating effects by gender or age.
Evaluation Methodology
As stated in NORC’s original proposal, we propose to use a double-difference estimator with
matching or covariate controls as appropriate, or a combined regression analysis/matching
approach to assess changes in farmers income, production, crop revenue and post-harvest losses
related to access to ABCs. Under this approach, we will try to find units in the comparison group
that are as similar as possible to the treated units by computing the probability that a unit will
belong to the treatment based on its observable characteristics. The goal is to mimic a

|
5
randomized assignment when it does not exist. We will use available data from the FBO Survey
and the 2010 Census, as well as GIS data on climate and topography for the matching process.
Our sample would consist of farmers that belong to FBOs who will have access to and will
benefit from the ABCs, and a comparison group comprised of farmers in similar FBOs that will
not benefit from the ABCs. Sample farmers will be limited to those for whom we have baseline
data in the FBO Survey.
The treatment group for each ABC will be comprised of farmers interviewed in the baseline FBO
survey that belong to FBOs within a 20-kilometer radius around the ABC. The purpose of
including all FBOs within the 20 km radius in the treatment group (as opposed to only the 20 co-
owners of the respective ABC) is twofold: 1) we want to avoid selection into treatment bias (see
details of selection process in Background Information Section above), and 2) we want to
include all farmers that might benefit from the ABCs facilities even if they are not co-owners. 2
In this methodology, it is also essential to identify an appropriate comparison group. In
conversations the NORC team had with local experts during the design trip to Ghana, the MIDA
team and other stakeholders suggested that the comparison group for each ABC can be selected
from MiDA-trained FBOs located outside the approximately 20-kilometer radius around the
ABC. In this regard, those FBOs forming the comparison group would be located between two
concentric circles, centered on the respective ABC. The inner circle will have a radius of
approximately 20 kilometers from its center, corresponding to the ABC location, and the outer
circle will have a radius of approximately 30 kilometers from the ABC. Farmers linked to the
MiDA-trained FBOs that were included in the baseline survey and are located in the area
between these two circles would be defined as the comparison group.
In addition to the difference-in-difference methodology, we propose to use an Instrumental
Variable two stage least square (IV-2SLS) approach, using a model where "treatment" is
instrumented in a first stage by "distance from farmer to closest ABC". We will still select all
sampled farmers within a radius of 30 km but rather than considering everyone within 20km as
“treated” and the rest "controls," we will let the variable "distance to ABC" instrument
participation into treatment. A second stage will estimate the effect of instrumented participation
on outcomes of interest.
Data Sources
To evaluate this sub-activity we propose to use GIS data compiled by MiDA to geo-locate ABCs
and affiliated FBOs for the purpose of identifying treatment and comparison FBOs and farmers
based on their distance from the ABC. We expect that data from the FBO survey conducted by
ISSER will serve as the primary source of information on individual farmers at the baseline. The
FBO survey will allow the construction of the indicators mentioned above.
Based on the documentation we have at the time of preparing this report, the variables necessary
for the calculation of indicators 1 to 4 were collected in the FBO survey. However, the dataset
we have obtained does not match the documentation and some important variables are missing.
We are currently working with ISSER on resolving this inconsistency and hope to have a
satisfactory solution to the problem. It is not clear whether indicator 5 can be constructed from
|
6
the data. It does not seem possible to properly calculate crop yields with the questions included
in the survey. However, ISSER reported crop yields in the summary report corresponding to
Round 1. At present, we are investigating how these indicators were calculated and working to
obtain any complementary data that would allow us to replicate these crop yield calculations.
A new round of the FBO survey will be needed in order to obtain a proper endline data within
the defined area around each post-harvest facility. The post-intervention data collection could be
carried out at any time after approximately one year from the time that each FBO begins
operating, or at minimum, after two crop cycles of the targeted crops have been completed. We
recommend going back to the same farmers interviewed in the initial FOB Survey to create a
panel.
Key Considerations
It is important to keep in mind when interpreting the effects of the ABCs that this sub-activity
involves more aspects that simply the physical ABC and associated services. As described in
Section A1.1 above, the "lead investors" were selected in a competitive bidding process and they
are important in the management of the ABCs. This is a central factor that must be taken into
consideration when replicating this type of intervention. The location of the ABC is also not
random. The Centers are located near main roads, power sources and water. Our analysis will
evaluate the effects of this "ABC package" on farmers’ economic wellbeing and the results
should be interpreted accordingly.
B1.2 Public Pack houses
Background Information
MiDA’s portfolio of post-harvest activities includes support for the construction and equipping
of three large, state-of-the-art public pack houses (PPH) in Ghana’s Southwestern Horticultural
Belt. Two of the pack houses will serve the export pineapple agro-industry, and the third will be
used for mango exports. The two pineapple facilities are located in the districts of Gomoa and
Akwapin South and the pack house for mangos is in the Yilo Krobo district. The three pack
houses have automated packing lines with the capacity for moving freshly harvested fruit on a
conveyor to stations where it is automatically separated and sorted into batches of fruit of similar
size that are then manually packed into carton boxes containing a standard weight. The packed
fruit boxes are palletized for ease of handling and, once the palletized unit has been quick-
cooled, it is stored in refrigerated rooms at the pack house until it is loaded into refrigerated
containers and transported to the Tema Port. At Tema, the fresh fruit remains in the sealed
container until the scheduled arrival of a container ship that transports the container with its
refrigerated cargo to European ports for discharge and distribution to fruit wholesalers, brokers,
and supermarket chains. The European market has extremely demanding quality standards for
fresh fruit, and imposes rigorous procedures for post-harvest handling and temperature control as
essential elements of an export program that serves this market. Consequently, MiDA’s state-of-
the-art pack houses and the capability to support the first link of the “cold chain” for export
horticultural products from the farm to the final customer are an important part of Ghana’s
strategy to increase its horticulture exports to markets overseas.
The public pack houses will each serve from 500-600 farmers, and these will considerably
increase the capacity for pineapple exports from nearby communities. While the anchor farmers

|
7
using these packhouses could pack their fruit for a fee at other packhouses that are further away,
this alternative would increase their transport cost and would also increase post-harvest losses
caused by additional transport and handling. Furthermore, since the distant facilities are utilized
by other exporters, their availability is limited and may result in delays in packing services.
MiDA is providing grants to fund the construction of the three public pack houses and to install
the required packing lines, cooling equipment, product handling equipment, and the extension of
electrical power from the national grid, along with a standby generator. The pack houses are
designated as “public” facilities. This means that they will provide for-fee services to any group
of farmers, or any individual exporter that requires export packing services for mango or
pineapple; and eventually, other products as well. Their services include fruit selection, sorting,
packaging, cooling, handling, storage, quality control, and shipping fresh fruit for export. A
“pack charge” amounting to roughly US $25.00 per pallet-load of fruit (equivalent to
approximately 0.8 metric tons of fruit) is considered by the industry to be a reasonable charge for
this service.
Fruit processed at the public houses that do not meet export quality standards will be sold into
local markets, although at considerably lower prices. For example, fresh pineapples that are
rejected at the pack house because they do not meet export quality standards can be sold to Blue
Skies Company for processing and export as pre-cut, packaged fruit chunks; to local juice
processors for making fruit juice; or on local markets as fresh fruit. Rejected mangos can be sold
to juice processors or as fresh fruit on local markets.
The public pack houses will be privately owned and operated. The co-owners of the pineapple
pack houses will be the anchor farmer (60 percent ownership) and the affiliated FBOs (40
percent ownership) that will serve as pineapple outgrowers (contract farmers) to the anchor
farmer. In the case of the public pack house for mangos, where no anchor farmer is available, its
owners will be the Dangme Union and its FBO members.
Ajanoa pineapple public pack house is led by Greenspan Farms Ltd, the anchor farmer, which
has a network of 11 FBOs that are committed to supply the company with MD2 pineapples for
export packing at the public pack house. Before the end of the compact, MiDA will transfer
ownership of the pack house to a holding company that is now being incorporated to own the
facility. Greenspan will manage and operate the public pack house on behalf of the holding
company, charging a designated service fee in the form of a pack charge per pallet load of fruit
processed. The holding company will, over time, transfer ownership of the pack house to
Greenspan and its FBOs partners in proportion to the amount of initial investment, and the
amount of throughput (in tons) that each entity moves through the pack house.
Gomoa Otwekrom pineapple public pack house is presently being constructed on a foundation
that was placed earlier by Chartered Impex Limited (CIL). CIL has established an outgrower
scheme by providing 500 acres (of its entire holding of 2,000 acres) to small farmers for
pineapple cultivation. The network involves 13 FBOs. Under this scheme, individual farmers
will grow pineapples on five-acre plots to be sold to CIL for export. CIL will provide planting
material, technical support, production coordination, and for-fee agricultural chemicals. The
outgrowers are required to pay a small land fee, to sell their production to CIL, and to assume
responsibility for their growing costs.
|
8
Akorley mango public pack house will be operated and eventually owned by the Dangme
Cooperative Mango Farmers and Marketing Union, known as the Dangme Union. The Dangme
Union represents mango producers in the four districts of Dangme West, Yilo Krobo, and Upper
and Lower Manya Krobo, which collectively form the biggest mango producing enclave in the
country. It will be used to pack fresh mangos grown by the association members and other
producers within the four districts, for sale to local and export markets. While this is a relatively
large catchment area, mangos are quite hardy and can withstand greater transport distances than
more delicate fruit such as pineapples. Dangme was created through the union of nine FBOs that
produce mangos within the four districts.
Evaluation Hypotheses and Impact Indicators
The Yilo Krobo Mango Farmers Association (YKMFA), a key member of the Dangme Union,
has made several attempts in recent years to export fresh mangos to overseas markets, although
with mixed results. The main problem has been the lack of control over fruit quality packed at a
third-party pack house, the processing delays experienced from external packing service, and its
higher cost. In light of its export attempts, YKMFA has concluded that it can deliver good
quality fruit to European markets from a pack house that is controlled directly by its union. The
Akorley PPH will provide direct access to international, as well as local markets for its affiliated
producers.
Without a group packing facility, individual, small-scale mango growers have limited access to
reliable markets for their products. The only marketing option for most small producers is to sell
their mangos at farmgate to middlemen whose bargaining power is considerably greater than that
of the individual farmer. The stark choices facing most small mango farmers are to sell their
mangos to the intermediary at the offered price, or not sell their mangos at all. For mangos sold
into local markets, the purchase price falls at the peak of the harvest to a level that is only
slightly greater than the cost to harvest the fruit.
The public pack house will provide the members of the Dangme Union with access to local
and international markets, and the ability to jointly market their products. Small farmers are
expected to benefit from this facility in several ways.
Linkage with the anchor farmer (Dangme) will provide a stable market for the members of
the cooperative union, and will impose the discipline required to operate within a formal
marketing system.
By leveraging their efforts through the union, small and medium farmers alike will have
much greater opportunities to obtain supplier credit for farm inputs they will require to
produce each mango crop. The union can also serve as a channel for technical assistance and
technology transfer that will likely be available from international organizations after the
Compact ends.
The public pack house will provide packing services for agricultural products to the anchor
farmer, the associated FBOs and their members, as well as other independent FBOs that use
the facility. This will have several positive effects:
|
9
o A well-managed, functional pack house should improve the quality of the agricultural
products that are offered for sale in the targeted market reducing losses from handling
and transportation and claims from buyers for inferior product quality
o A pack house that consistently ships good quality agricultural products can enable the
exporter to increase his or her share of market for that product by displacing inferior
quality products. This could increase product sales.
o Consistent quality can improve the position of the exporter and the average market
prices received.
The idea is that the effect of improved product quality and consistent access to markets, in
particular international markets, will provide higher average selling prices. Better prices are
expected to increase the amount of income received by small farmers. To the extent that part of
the increased income is used for orchard maintenance and reinvestment, the amount of mangos
produced will gradually expand income. Based on these hypotheses and the data available these
anticipated outcomes will be measured as follows:
1. Total annual household income
2. Total annual household income from farming
3. Annual output of the designated crop (mango or pineapple) by a producing farm, in
kilograms.
4. Percentage of on-farm, post-harvest losses of the designated crop.
Unfortunately it is not possible to measure the amount of production that is exported from the
available data.
In addition, there is an alternative channel that could affect small farmers in the area. If PPHs
give incentives to the anchor farmers to increase their production they may want to hire
additional workers for their farms. We therefore suggest including the following parameter as an
impact indicator:
5. Paid employment for agricultural business.
Evaluation Methodology
We propose to evaluate the impact of the two pineapple PPHs using the same approach as that
proposed for the evaluation of ABCs. Our discussions with local stakeholders in Ghana suggest
that, similar to the ABC intervention, FBOs benefiting from the PPHs are likely to fall within a
20 kilometer radius around the PPH. Therefore, we also propose using for the PPH sub-activity:
1) a difference-in-difference methodology, combined with matching or using covariates controls
where farmers linked to FBOs within a 20 km radius of the PPH will serve as the treatment
group, and farmers within the next 10 km radius will serve as the comparison group; and 2) a
Instrumental Variable approach in which we will use distance to the PPH as an instrument for
treatment in a two stage regression, where the sample includes farmers within 30 km of the PPH.
The evaluation approach we propose to use for the mango public pack house will be slightly
different by virtue of the fact that the PPH located in the Yilo Krobo district will serve as a base
for FBO members of the Dangme Union that are located throughout the four mango producing
|
10
districts of Dangme West, Yilo Krobo, and Upper and Lower Manya Krobo. In this case, our
treatment group will comprise FBOs in the four districts, while the comparison group could be
drawn from mango producers that are not located within these four districts. Because of baseline
data constraints, our conjecture at this point is that the comparison farmers will have to be drawn
from other MiDA districts with MiDA trained FBOs.
Risk Factors
The number of farmers that produce pineapple and mangos represented in the FBO survey is not
very large. This is particularly true for mango producers. Although we do not have final numbers
for mango and pineapple farmers in the baseline FBO Survey due to some missing data, for the
purpose of this report, we are estimating them at approximately 45 treatment and 45 comparison
mango producers and 95 treatment and 95 comparison pineapple farmers.
Estimates of impact based on small samples tend to be imprecise, and in such cases detecting the
impact of an intervention or program can be difficult. The power calculations presented in Annex
2, show that for the case of the Mango PPH, with only 45 farmers in the treatment group and 45
in the control group, the effect size would have to be 0.55 or larger to be able to detect an income
change with a moderately high power of 0.8. A 55 percent average change in income is very
ambitious, and in the event that it does not occur, we run the risk of concluding that the
intervention did not have a positive effect. To mitigate this risk, we recommend that in addition
to the proposed quantitative methodology be complemented with qualitative data collection
through focus groups and/or key informant interviews.
In the case of pineapple farmers, the sample is likely to be around 190, with 95 treated farmers
and 95 controls. In this case, the required change in income for detecting a change at a
reasonable level of power would be lower than 55 percent. However, we suggest complementing
the analysis with qualitative information in this case too.
Data Sources
Similar to the proposed evaluation of the ABCs sub-activity, we propose to use the MIDA GIS
database for the PPH evaluation to locate Public Packing Houses and classify FBOs according to
their proximity to the PPH for the purpose of identifying treatment and control groups. We will
rely primarily on the 2008/2010 FBO Survey for baseline data on individual farmers associated
with the MiDA-trained FBOs. The data limitations for the FBO Survey and ongoing efforts to
resolve them, described in Section A1.3, apply here as well.
A new round of the FBO survey will provide endline data. The post-intervention data collection
could be carried out at any time after approximately one year from the time that each PPH begins
operating. As before, we recommend going back to the same farmers interviewed in the initial
FOB Survey to create a panel.
Key Considerations
As is the case with the ABCs evaluation, it is important to keep in mind that in designing an
evaluation for the PPH intervention, this sub-activity, in addition to the provision of the physical
packing line and cooling rooms, is also linked to other interventions such as provision of
electricity, feeder roads and, most importantly, an anchor farmer that leads the initiative and

|
11
offers training and inputs to small farmers. As such, we are evaluating a package of
interventions, one of which are the physical PPH and associated services.
The situation is a little different in the case of the mango PPH where there is no anchor famer.
The Dangme Union will be leading instead.
B1.3 SPEG Loans for Cold Rooms and Packing Lines
This intervention is similar to the PPH activity in terms of the infrastructure it provides. In 2008,
MiDA provided a conditional grant in the amount of US $5.3 million to the Sea-Freight
Pineapple Exporters of Ghana (SPEG) in order to create a loan program administered by SPEG
that would enable its members to construct cold rooms, install automated packing lines and to
provide a stand-by generator for their pack houses. In those cases where the electric power grid
did not reach the pack house, as was the case at the 2K farm, MiDA’s Rural Development
Project provided electricity to the pack houses and to nearby communities by constructing an
electric power line.
In September 2008, MiDA announced the approval of the first loan tranche in the amount of US
$2.17 million for seven SPEG exporters who made up the first phase of the loan program. The
loans were provided for a five-year term at a flat interest rate of 5 percent per year, with annual
loan repayments amounting to 20 percent of the original loan amount, plus interest.
Unfortunately, this first group of loan recipients was not able to repay their loans as scheduled.
As of September 2011 around 17% of the loan has been repaid, and SPEG has unilaterally re-
scheduled its repayment of the MiDA debt (without obtaining formal agreement from MiDA),
and plans to complete all loan payments under its revised schedule by 2015.
Hypotheses and Impact Indicators
The competitiveness of Ghana’s export pineapple industry depends on the quality of the fruit it
exports to international markets, and on the cost of placing its export pineapples in these
markets. Ghana cannot be competitive in export markets without packing facilities that minimize
post-harvest handling damage and that enhance the capability of the exporter to provide good,
consistent quality of the exported fruit under efficient, low-cost packing methods. Another key
element in post-harvest handling of fresh pineapples is the ability to quickly reduce the
temperature of the fruit (“remove the field heat”) to the optimum storage temperature, and to
maintain that temperature until the fruit is delivered to the buyer. Both these elements are
required to compete in Ghana’s export markets. The loans provided to the seven SPEG exporters
were designed to increase their ability to compete in European markets.
The effect of these improvements on the SPEG exporters should follow a model very similar to
the one described for the public pack houses. However, it may differ in the expected impact on
small farmers. In light of the information that MiDA provided the assessment team, it appears
that the SPEG equipment loans provide the greatest benefit to the exporters, whereas their impact
on small farmers should be quite limited given that only three of the seven exporters that
received equipment loans– Bomart, Prudent, and Georgefields – have outgrower programs. Each
of these exporters is associated with a single FBO that has about a dozen members as
outgrowers. The remaining four exporters - Jei River Farms, Koranco Farms, Gold Coast Fruits
and 2K Farms - do not have an outgrower program.
|
12
While the evaluation model and impact indicators described for PPHs is relevant for the cases
where exporters work with outgrowers, the rest of the exporters are unlikely to generate positive
spillover effects for small farmers. The main reason is because in general, outgrower programs
by most SPEG exporters are extremely limited, and without outgrower programs, small farmers
receive little benefit from these investments. If these investments have any effect on small
farmers it is more probable that such an effect would come from increases in paid employment at
the exporter farms and pack houses.
Evaluation Methodology
For this intervention, it may be possible to evaluate the effects on small farmers linked to
exporters that work with outgrowers, using the same methodology and indicators suggested for
PPH evaluation. However, as we mention above, there are only three such exporters, and each of
them is associated with only one FBO. This means we will on have a very small group of treated
farmers that were covered in the FBO Survey (15 at best) and it is highly unlikely that under
such conditions even a very large impact could be statistically detected. Therefore, our
recommendation is to not pursue a quantitative evaluation of the impact of this intervention.
It is possible that we may be able to detect changes on employment at exporter farms associated
with this activity.
B1.4 Perishable Cargo Center
Background Information
MiDA is funding the construction and equipping of a US $2.7 million perishable cargo center at
the Kotoka International Airport (KIA) in Accra under its Agricultural Project, to support
increased exports of fresh fruit and vegetables from Ghana.
KIA presently exports around 20,000 tons of fresh agricultural products annually. Just about all
vegetable and cassava exports are shipped by air to overseas markets; around 80 percent of fresh
papaya exports are shipped as air cargo, and around 10 percent of pineapple exports - mostly pre-
cut packaged pineapple chunks exported by Blue Skies, Ltd. – are shipped by air from KIA.
The perishable cargo center (PCC) will be the final link of an integrated cold chain for the
horticultural sub-sector that begins at the pack houses where products are initially cooled.
At present there is no packing shed at KIA where fresh produce can be consolidated, nor is there
a cold storage facility to maintain the quality of exported fresh products. Even when the cargo
arrives by refrigerated truck, the shipment must be discharged, palletized, and held for export at
ambient temperature, breaking the "cold chain."
The PCC will be owned by the Ghana Airports Company Limited (GACL) and will be managed
and operated by a consortium headed by Ghana Air under a concession from GACL. The
consortium was selected through a public bidding process.
The PCC will be a public facility, providing for-fee export services to all horticultural exporters
in Ghana, and possibly even some in neighboring countries, who wish to use its services. Its
clients will be drawn from the community of active exporters.

|
13
Hypotheses and Impact Indicators
The PCC is a key element in the achievement of better quality of exported fresh produce shipped
by air to markets overseas. The PCC could lead to higher market prices and increased volumes
for its normal fruit and vegetable exports, as well as stimulating export growth in emerging
export products such as cut flowers.
The benefits to be derived from the PCC are summarized as follows:
1. The perishable cargo center will serve Ghana’s fresh horticulture exporters by providing the
range of services required to ship their fresh products by air to buyers in foreign markets. Of
critical importance will be availability of refrigerated storage at the PCC, which will keep the
export products in good, fresh condition to maintain quality and shelf life. A second benefit
is that with cold storage, the exporters will be able to deliver their products ahead of time to
the airport, and will not have to precisely schedule their deliveries around the aircraft
departure time. By ensuring the quality of export products, the PCC will enable horticultural
exporters to effectively compete in upscale markets for fresh fruit and vegetables in the
European Union (EU). The lack of a modern facility for handling fresh horticultural products
has generally limited exports from Ghana to the lower tier of EU markets due to buyers’
concerns of poor product quality. While data are not readily available on the amount of
product loss due to spoilage under current handling conditions, a knowledgeable estimate
would be a loss of around 5 percent. The greatest loss of exporter income under current
conditions results from quality claims, and the foregone revenue resulting from selling into
downscale markets.
2. Increased competitiveness of fresh fruit and vegetables from Ghana sold into European
markets will result in an increased amount of products exported, with higher prices relative to
the average market price for the export product. Many exporters, particularly those who
export fresh vegetables, rely on small farmers to achieve a critical mass of their export
product. The PCC will spur the growth of the export supply chain, and the corresponding
benefits will be shared by small farmers who supply these export products. However, this
benefit would be extremely difficult to measure, given the number of steps the small farmers
are removed from the intervention.
3. Improved handling and storage of export horticultural products will reduce the amount of
claims for poor quality by foreign importers, against the exporters in Ghana.
4. The greater convenience and improved logistics for handling perishable products at the PCC
will make it easier for exporters to comply with aircraft schedules and to meet product
delivery deadlines. This will result in increased exports and fewer shipments held over.
Based on these hypotheses, we propose to use the following impact indicators:
1. Volume of exports
2. Claims from foreign exporters
3. Product loss volumes
Evaluation Methodology and Impact Indicators

|
14
As described earlier, the services provided by the PCC will be available to any exporter of
horticultural products in Ghana, and it is likely that most fruit and vegetable exporters will use
the facility. While in some cases, groups of small farmers supply the community of exporters
with agricultural export products, identifying these groups and determining the impact of the
PCC on their farming operations would be extremely difficult, and impractical. As such, we do
not propose to evaluate the impact of the PCC on small farmers.
Instead, we propose to conduct the evaluation using the exporter as the unit of analysis. We will
focus our analysis on around 30 exporters of horticultural products who consistently air freight
their products from KIA. Since most exporters will use the PCC when it becomes available, we
see no opportunity to construct a comparison group of exporters who do not access the facility.
Therefore, the evaluation approach will be a simple pre- and post-intervention design, which
uses data from a variety of sources for a pre-PCC baseline period and a post-PCC endline period.
This approach, in the absence of a control group, precludes the possibility of attributing change
to the availability of the cargo center.
Data Sources
A broad spectrum of exporters will likely use the services of the PCC, including shippers of fresh
fruit, vegetables, and root crops; as well as exporters of pre-cut, packaged fruit and vegetables.
Consequently, there is no single organization that can serve as the source of data to measure the
impact of the PCC. Instead, both baseline and endline data must be obtained from the Ghana
Airports Company as well as from those individual exporters who have exported their products
through KIA.
These sources would provide data on the following indicators: the annual throughput (metric
tons) of fresh horticultural exports that pass through the perishable cargo center at KIA; the
annual volume (kilograms) and value (US $) of fresh horticultural exports, by commodity, that
are exported through the PCC; and the annual amount of claims against exporters as a percentage
of the annual value of horticultural products that pass through the PCC.
B.2 Agriculture Project: Irrigation Activity
Background Information
MIDA's activities include the renovation of two irrigation schemes in the Tolon Kumbungu
district in the Northern Agricultural Zone, and the construction of a new scheme in the North
Tongu district in the Southeastern Horticultural Belt. The northern schemes are the Bontanga
Irrigation Project and the Golinga Irrigation Project, both located near Tamale, the regional
capital. The new southeastern scheme, known as the Kpong Left Bank Irrigation Scheme, is
located in the Volta Region near the village of Torgorme.
The following table summarizes the most important characteristics of the three irrigation
schemes3:
3 The evaluation design team was informed by MCC that the costs shown in this table (provided by MiDA) include
neither the feasibility studies nor construction supervision, nor the investments done for the anchor farmers in the
irrigation schemes.

|
15
MiDA Construction and Renovation of Irrigation Schemes
Scheme Name Area Small
Farmers (HA)
Area Anchor
Farm (Ha.)
No.
FBOs
No. Small
Farmers
Cost (US
$000)
Kpong Left Bank 450 1070 15 746 10,881
Bontanga 495 315 10 528 3,047
Golinga 40 None 5 246
Source: MiDA and IFDC technical staff
Small farmers operating within each of the three irrigation schemes will have the opportunity to
participate in contract farming arrangements with a large, commercial farm known as an “anchor
farm” located near the small farmer irrigation scheme. The anchor farmer will have access to
irrigation water from the main canal that carries water from the reservoir to the irrigated area for
small farmers. The anchor farmers will be required to pump irrigation water onto their farm,
since the terrain does not permit gravity flow to these farms.
The anchor farmers will provide training, technical assistance, and seed to the contracted small
farmers through their FBO Unions, for the production of the required crops. In addition to
providing market outlets for their designated crops, the anchor farmers will help its small farmers
to comply with international standards for export products (eg. GlobalGap) as required.
Kpong Left Bank: The Kpong irrigation system is presently being constructed just outside
MiDA’s targeted intervention area of thirty districts. The anchor farmer at the scheme, Vegpro,
is planning to farm an irrigated area of 1,070 hectares located adjacent to the small farmer
irrigation scheme. Construction of this irrigation scheme began on January 21, 2011; the
expected end date is January 20, 2012. However, as described in Section B.5, the activity is
facing significant delays.
Bontanga: The Bontanga irrigation project is the largest irrigation scheme in the Northern
Region. Its water source is a large reservoir fed by the Bontanga River. MiDA is in the process
of rehabilitating an area of 495 hectares, of a maximum potential area of 800 hectares. The
anchor farmer, Solar Harvest, will cultivate an area of 315 hectares that is adjacent to the
irrigation scheme. The company will pump irrigation water for its farm from a collection point
that is being constructed at the extreme end of the main canal serving the Bontanga small
farmers. Construction of this irrigation scheme began on March 15, 2011; the expected end date
is January 31, 2012. As of mid-November 2011, three months before the end of the MCC
Compact, construction of the Bontanga scheme was slightly less than 60 percent complete.
However, given the rate of progress and the track record of the contractor for the Bontanga
scheme, there is a fair chance that the construction work on this schemes will be finalized by the
end of the Compact.
Golinga: The Golinga irrigation scheme was originally built in 1965 with a planned capacity of
100 hectares of irrigated land. The scheme draws water from a small reservoir fed by the Jolo
River. Currently, the scheme covers of a total area of 65 hectares, with a net area under
cultivation of 60 hectares. MiDA is now rehabilitating an area of 40 hectares. Due to the
relatively small size of the Golinga scheme, there is no large, commercial anchor farm located
|
16
nearby. However, it is planned that Solar Harvest, the anchor farmer at the Bontanga irrigation
scheme, will negotiate supply contracts with the Golinga farmers as well. Construction of this
irrigation scheme began on March 15, 2011; the expected end date is January 31, 2012. The
status of the Golinga scheme as of mid-November 2011 was similar to that described in the
previous paragraph for Botanga. There is a good chance that this scheme will also be completed
by the end of the Compact.
Evaluation Hypotheses and Impact Indicators
Due to poor scheme management combined with inadequate maintenance and repair, the
performance of the Bontanga and the Golinga schemes has progressively declined and both
schemes now operate at less than half their design capacities. These problems have worsened by
the refusal of the farmers to pay the full amount of the assessed irrigation fees. In recent years
only about 300 hectares have been cropped in the dry season, with a similar crop area cultivated
during the rainy season. During the dry season, the poor condition of the irrigation canals limits
the amount of water that can be provided for crop production. During the rainy season, poor soil
drainage caused by clogged and silted drainage canals makes a large part of the scheme area too
wet to cultivate.
The work being carried out by MiDA is the rehabilitation of the existing network of both
irrigation and drainage canals. This work will increase their operating efficiency and should
improve the overall performance of the entire scheme. The rehabilitation will also equip the
scheme with monitoring equipment for better control and efficient use of irrigation water. The
work presently being carried out by MiDA will make it possible for the small farmers on the
schemes to cultivate their crops without regard to rainfall patterns, which would substantially
increase their production output. Furthermore, contract farming arrangements with the anchor
farmer will provide a reliable market outlet for the small producers, as well as access good-
quality seed and to crop production technology.
The main expected hypotheses regarding outcomes of the irrigation activity are:
1. With irrigation water supply and good crop management, it will be possible to grow three
crops per year in both the north and south regions. Presently, with the limited availability of
irrigation at Botanga and Golinga during the dry season, and given the inadequate farm
drainage that limits the use of land in lower producing areas during the rainy season, one to
two crops annually is the norm for farmers in both locations. More crops would translate into
increased farm production/output and greater farm incomes for small farmers.
2. Irrigation makes it possible to cultivate a mix of higher-value crops. For example, high-value
vegetable crops, particularly leafy vegetables are greatly susceptible to losses from pests and
diseases during the rainy season. With irrigation, these crops could be successfully grown
during the dry season when prices tend to be higher. A higher-value crop mix provides
greater farm incomes for small farmers.
3. Irrigated, commercial crop production is much more intensive and has a greater labor
requirement than subsistence agriculture. Labor requirements for the anchor farms will be
substantial – up to seven workers per hectare. In addition even small farmers could need to
|
17
engage hired labor, especially for harvesting crops. The resulting employment generation at
the irrigation schemes could be substantial.
Based on these hypotheses we propose to use the following indicators to measure impact:
1. Total annual household income
2. Total annual household income from crop production
3. Paid employment per household
4. Crop mix: Annual production output (kilograms) for each of the five most important crops
produced per household. We aim to measure the changes form low to high value crops.
5. Crop yield: A crop will be selected as a representative at each irrigation site and its output
per unit area (kilograms per hectare) will be monitored for each crop cycle.
Evaluation Methodology
We propose a double difference estimate with matching and covariates controls as appropriate to
evaluate the impact of irrigation activities on small farmers. The treatment group for each
irrigation scheme will be the small farmers that belong to FBOs that operate within the
geographic perimeters of the irrigation scheme and will be able to receive irrigation. The control
group will be composed of the farmers outside the water supply perimeters who do not receive
the benefits of the irrigation schemes but are similar in characteristics to the treatment groups.
In order to estimate the effect on paid employment we can use both a difference in difference
approach and an IV approach, based on a distance indicator, similar to post-harvest activities. If
we assume that small farmers who live closer to the anchor farmers are more likely to benefit
from an increased demand for labor on anchor farms, we can instrument treatment by using
"farmer’s distance to the anchor farmer" either as a continuous variable or as discrete categories
defined by distance of, for example, 20km radius and 30km radius as suggested before.
Risk Factors
Similar to the evaluation approach described for the PPH sub-activity, small samples can create a
problem for the evaluation of the irrigation schemes as well. For the two Northern schemes for
which we have FBO survey baseline data, there is information for a maximum of 75 farmers in
the treatment group. Annex 2 presents power calculations for the Irrigation Activity. These
power calculations show that to be detected with high probability (0.9 or higher), the effect size -
the fractional change in income between baseline and endline that is measured by the double-
difference estimator - would have to be 0.5 or larger. Again, to mitigate the risk that smaller
positive changes in income may not be detected, we propose supplementing the quantitative
approach with qualitative data collection and analysis.
Data Sources
For the evaluation of the irrigation schemes in the Northern area, Bontanga and Golinga, we
propose to use data from the MiDA GIS database and the FBO Survey. GIS data will be used to
geo-locate FBOs construct borders that separate FBOs/farmers that do and do not benefit from

|
18
the irrigation water supply. Data from the FBO Survey will provide baseline information for
farmers associated with the treatment and comparison FBOs. For reasons described in Section C,
we will not be able to use the GLSS5+ for this analysis
A second wave of the FBO survey will be needed in order to provide endline information. The
data collection should take place as late as possible, given that there have might be delays in the
completion of irrigation schemes, and sufficient lag time is required to allow the interventions to
show results.
We have some serious concerns regarding the evaluation of the Kpong irrigation facility. First,
the Kpong facility falls outside the MiDA Districts and, as such, no baseline data was collected
through the FBO Survey. However, since the construction is still underway and lands are not
going to be irrigated through the scheme till March 2012 at the earliest, there is still an
opportunity to collect baseline data from farmers linked to the benefiting FBOs and a matched
comparison group. This baseline data collection would use a modified version of the FBO
Survey instrument. A data collection tailored to the evaluation would provide an opportunity to
ensure that an adequate sample of treatment farmers are covered, and that a range of questions
that address the evaluation hypotheses are included in the survey. However, these pros should be
weighed against the cons of conducting a costly data collection for an irrigation scheme that in
all likelihood might not be completed by Compact close-out. See discussion in Section B.5.
Key Considerations
As of mid-November 2011, three months before the end of the MCC Compact, the Bontanga and
Golinga schemes were less than 60 percent complete, and the Kpong Left Bank scheme was less
than 50 percent complete. Given the rate of progress and the track record of the contractor for the
Golinga and Bontanga schemes, there is a fair chance that the construction work on these
schemes will be finalized by the end of the compact. On the other hand, it is highly unlikely that
construction of the Kpong Left Bank irrigation scheme for small farmers will be completed
before the scheduled ending date for the compact, which is February 14, 2012. Contractor delays
and exceptionally heavy rainfall during the 2011 rainy season have severely slowed the pace of
construction of the small farmer irrigation scheme at Kpong. On the other hand, the delivery of
irrigation water to the anchor farmer at the Kpong scheme is nearing completion, and there is an
excellent chance that the anchor farm will be able to irrigate by the time the compact ends. Even
though the anchor farm should be fully operational by the end of the compact, the most likely
result for the small farmer irrigation scheme is that it will not reach its target of 486 hectares by
the end of the compact. Fewer irrigated hectares will result in fewer small farmer beneficiaries at
the Kpong scheme, which will diminish the impact of MiDA’s irrigation investment at this
location.
A related problem is that once the construction work has ended at the three sites, there will be
insufficient time before the compact ends to organize the scheme management structure and to
institute the management and operating systems needed to successfully manage the scheme.
Furthermore, after the compact ends, MiDA will not be available to provide the leadership to
coordinate the functions of the numerous organizations and service providers that will be
involved in scheme activities. This could considerably slow the startup and prolong the time
before the three schemes are able to achieve their full potential. These difficulties could diminish
the impact of MiDA’s investment over the near term.

|
19
Finally, this activity cannot be interpreted as just providing irrigation. The anchor farmer
presence is an important and not random part of the intervention.
B.3. Rural Development Project: Community Services Activity, Education
Background Information
The Education Sub-Activity under the Rural Development Project funds the construction and
rehabilitation of schools. Investing in educational facilities is expected to increase student
enrollment and attendance and reduce drop-out rates by improving access (reducing travel time)
and creating a better learning environment in the schools. Improved access to schools and
conditions may also reduce absenteeism among teachers.
The Education Sub-Activity was rolled out in two phases. While waiting for the completion of
Needs Assessment and the Environmental Impact Assessment Study Reports, the Community
Services Project Department was allowed to select a few school blocks which were listed in the
beneficiary Districts’ Medium Term Development Plans and requiring urgent attention for
rehabilitation under a limited budget. Phase I of the Education Sub-Activity (2007-2009) is
viewed as a quick start project in pilot districts.
Phase II of the Project includes construction and rehabilitation of educational facilities in 151
communities. These facilities include the construction of 106 two-unit classroom blocks for the
kindergarten level, 41 three-unit classroom blocks for the junior high and primary levels, and 29
six-unit classroom blocks for the primary level. Schools will all receive urinal facilities and a full
complement of school furniture (wall-mounted black-board, furniture, desks and benches,
teachers table and chairs, classroom cupboards and basic furniture) for all constructed classroom
blocks and head teachers’ offices. Electrical wiring of the school building also has been done
where electricity is available or where the District Assembly has assured the availability of
electricity in the short term. Phase II activities started in 2009 and will be completed by February
2012.
Phase I school selection did not follow a systematic selection process or defined criteria.
Conversely, however, selection of intervention schools for Phase II followed strict selection
procedures, which began with a close review of District Medium Term Development Plans to
identify the District Assemblies’ list of schools prioritized for construction and rehabilitation.
These schools were then ranked and scored according to a preset set of criteria.
School Ranking and Selection Process:
At the National Level: the FBO concentration in each Zone was evaluated, taking into
consideration the proportion of the total number of FBO in the Zone and the total number of
FBO’s under the MiDA project. The Zonal FBO ratio was then derived, and MiDA’s budgets,
including the Community Services Project budget, were allocated accordingly. Based on this
allocation criterion, the Northern Zone received 30 percent of the MiDA education sub-activity
funding, the Afram Basin received 50 percent, and the South region received 20 percent.
At the Zonal Level: two parameters were used to rank Districts. In order of priority they were:

|
20
Poverty index (40% weight)
Number of FBOs in the District (60%)
At the Community Level:
The Communities with the highest number of FBO’s were ranked in descending order
Schools with sub-standard structures, Category A
Schools with inadequate/deficient educational facilities, Category B.
Sub-standard School Structures -- Priority is given in the following order:
Classes under Trees
Classrooms in unsafe structures (Mud, Open Sheds, etc.)
Uncompleted School Structures
Schools in rented accommodation
Schools in unclad Pavilions
Schools with Inadequate/ Deficient Facilities -- Priority is given in the following order.
Schools with shortfalls in classroom accommodation
Schools with Shift System
Schools without prescribed ancillary facilities, shall be provided with the following in
order of priority:
o Toilet and Urinal,
o Potable Water Facility
o Staff Accommodation
o Library
o Computer Laboratory
o Dining Hall
o Sickbay
Schools lacking Recreational and Sports Facilities
Schools in each target district were ranked and scored from 0 to 100 according to the
community-level criteria, with high priority schools in need of urgent attention receiving a higher
score. The final decision on which schools were selected for construction/rehabilitation in a
given district was based on this eligibility index and the availability of MiDA funds for the
district. Because of funding constraints, not all priority schools in a district were not
built/rehabilitated.
Because the Phase II school construction/rehabilitation activities followed a systematic approach
that is more conducive to a quantitative evaluation, we propose to focus our impact evaluation
only on this phase of the Education Sub-Activity.
Evaluation Hypotheses and Impact Indicators
The hypothesis behind this intervention is that more and better educational facilities can improve
educational outcomes. This is can seem obvious for the cases of new construction and outcomes
such as enrollment. For example, a new Kindergarten facility where there was none will increase
enrollment provided that there is demand from parents to send their young children to pre-

|
21
school. Rehabilitation of existent facilities may have a similar, although more moderate, effects
on enrollment.
We also hypothesize that better educational infrastructure creates an environment that is more
conducive to learning and staying in school, thereby reducing drop-out rates and increasing
attendance.
Access to toilet facilities at the schools can be a benefit for all children and produce positive
externalities for others. However, it has been argued that the availability of separate toilet
facilities has a larger positive effect on girls’ school attendance and enrollment, although
empirical evidence is not conclusive on this point.
Based on the aforementioned hypotheses and available data, we propose to use the following
indicators for measuring impact:
1. Gross enrollment rate (GER) in the catchment areas, total for all schools. Total, by
gender, by age groups
2. Net enrollment rate (NER) in the catchment areas, total for all schools. Total, by gender,
by age groups
3. School gross attendance rates: grade-wise number of children enrolled. Total, by gender,
by age
4. Average % of days that students attend school. Total and by grade and gender.
It is important to note here that we propose to measure enrollment rates for the entire catchment
area of the school, and not for the intervention or comparison school in the sample. We do this
because the presence of a new school could well draw students away from other schools in the
same area, creating a situation in which the new or improved school’s enrollment increases,
while older, less attractive school facilities lose students and suffer enrollment losses. In such
cases the enrollment rate of the school catchment area may remain unchanged. Using catchment
area enrollment rates will allow us capture this dynamic process and avoid overestimation of the
impact.
Evaluation Methodology
As described in Section D.1, MiDA used an eligibility index to select the school units that were
reconstructed or rehabilitated in a given district. Schools that received high scores (i.e. schools in
dire need of attention) were selected for treatment with available funding; schools below the
district-specific cut-off did not receive treatment because the available budget did not permit it.
This selection process lends itself to using a Regression Discontinuity Design (RDD) to evaluate
the impact of the Education Sub-Activity. This strategy exploits the discontinuity around the
cutoff in the eligibility index to estimate counterfactuals. The assumption is that eligible schools
with scores just above the cutoff are very similar to eligible schools with a score just below the
cutoff that were not selected because of funding constraints. Therefore schools that were not
selected for the program but close enough to the threshold can be used as a comparison group to
estimate the counterfactual.

|
22
As a first step, we will analyze the baseline data to test the validity of the RDD. Specifically, we
will compare indicators for eligible schools with scores just above the cutoff to eligible schools
with a score just below the cutoff that were not selected because of funding constraints. In the
RDD literature this analysis is done graphically and allows us to assess how the similarities, or
lack thereof, in the two groups of schools. We will also check the school data to determine
whether we face a case of sharp discontinuity (SRD) or a fuzzy discontinuity (FRD) and plan our
regressions accordingly. In the FRD design, the probability of receiving the treatment does not
need to change from 0 to 1 at the threshold. Instead, the design allows for a smaller jump in the
probability of assignment to the treatment at the threshold4.
Data Sources
School level data is collected each year through the Education Management Information System
(EMIS). NORC has in its possession the EMIS database corresponding to 2010, which can be
used as baseline data. In the future, we will need a new wave of this survey data to analyze post
intervention indicators and evaluate the impact of the education activity.
Other data sources that are required for this evaluation are the following:
2010 Census data, which is still in the process of being compiled and, hence, unavailable
to us at this juncture. NORC has submitted a request for this data to the Ghana Statistical
Services through formal channels, and will also enlist MiDA assistance in obtaining the
dataset when it is finalized. We propose to use age and sex specific population numbers
from the Census data to calculate enrollment rates in school catchment areas for the
impact evaluation of the Education Activity.
Key pieces of data that will need to be collected at the district-level Education Offices.
This information includes communities (or enumeration areas) that fall into the
catchment areas of MiDA and comparison schools; other schools in each catchment area;
and other education projects that have been or are being conducted in the districts. The
District Education Offices may also be able to provide school-age population figures for
each school catchment area; this may be a more direct way to gather this data, rather than
estimating it based on Census figures. Collecting education information from 30 districts
is a daunting task and relying on overburdened district education officers to fulfill this
data collection task is not a recipe for success. Therefore, we will explore the option of
hiring a local consultant for a 2-3 month period to visit district offices and schools and
collect the requisite data.
In the RFP, MCC also expressed interest in evaluating the effects of the education sub-activity
on household indicators such as time use, labor productivity, and income. However, the FBO
Survey is not large enough to provide reliable data to be used in this analysis and GLSS5+ does
not link household data to communities. As a result, we cannot identify the household location or
relevant school. This prevents us from studying the impact of this activity on household level
indicators.
4 See for example, Imbens, G.W., Lemieux, T., Regression discontinuity designs: A guide to practice, Journal of
Econometrics(2007)

|
23
B.4 Rural Development Project: Financial Services
Background Information
MiDA’s Financial Services Activity seeks to establish a computerized networking system
(through WAN using VSAT) between rural banks and the Apex Bank Server (financed by the
project). The activity is aimed at improving financial service delivery, operations, and access to
information at rural banks with the objective of enhancing the depth and value of rural financial
services and widening access to savings services and cash transfers.
Computerization and Connectivity: To date, all Rural Banks (134) in Ghana have received
computers and VSAT satellite dishes, although they are not yet all connected to the server for
fully automated operations. In addition to the computers and satellite dishes banks receive a full
commercial banking software package (eMerge) that enables them to access computerized front
and back office applications for real time transactions with their customers, track cash flow,
revenues, and expenses by profit/cost center, and update customer accounts with an easy end of
the day processing. As of mid-November 2011, 77 of the 134 rural banks had received the full
package of upgrades. Furthermore, all rural banks have received a scanner and software for the
Check Codeline Clearing System.
According to information received from the Project Management Team, the Financial Services
Activity used very strict prioritization criteria for the migration of the rural banks onto the
eMerge platform. The guidelines for the prioritization were designed by the project management
team (PMSC) and were deliberated and amended, where necessary, by the project technical
committee for final approval by the project steering committee. The criteria however got
changed several times as necessitated by the exigencies of the situations, including, the tight
project schedule, limitation of the data center infrastructure, and the location of RCBs. The key
prioritization criteria were as follows: availability of correct and balanced data (weighted
highest), infrastructure readiness, information security compliance, and basic computer
appreciation and training for staff. Unfortunately, no registry of the selection criteria and process
was kept.
Once fully automated, all financial data will be stored centrally at the APEX Bank and Rural
Banks use the software by connecting to the Apex Bank’s Server. The accounting and banking
data is therefore available in real time at the Rural Bank and at the Apex Bank. The Rural Banks
are thereby enabled to provide accurate up-to-date, real-time statements to their customers.
Cheque Clearing and Cash Transfers: All rural banks have received a scanner and software for
the cheque code clearing (CCC). However, due to the absence of data on cheque clearing times,
the evaluation can provide only a qualitative assessment and not a quantitative measurement of
the impact of this activity. Nevertheless, one of the key indicators (see below) to be analyzed
quantitatively will be “non-interest income,” which includes income from cheque clearing (one
percent of the amount of the cheque).
The project did not finance a specific facility for cash transfers. The Apex bank has developed
the Apex link software through internal resources that will be built on the platform of VSAT and
computers financed by the project. The cash transfer module is expected to become live in 2012.
Other cash transfer systems available at Rural Banks include the e-zwitch, a biometrically
|
24
recognized debit card that can be used for loading and unloading funds to the same card or from
one card to another card. The Rural banks have a POS with a SIM card that transfers the
information using the wireless telephone coverage. Irregular coverage and poor service has
hampered the effectiveness of this product, which is no way competing with any of the services
provided by the MiDA Financial Services Activity.
Evaluation Hypotheses and Impact Indicators
The computerization of operations and connectivity that MIDA has supported for the rural banks
should have the following effects:
Improvement of the speed and reliability of transactions
Improvement accuracy and availability of accounts information
Reduction in check clearing times
These improvements not only make bank operations more efficient and potentially less costly per
transaction, but they also improve the customer experience with the services offered by the bank
as well as reducing the incidence fraud. This, in turn, is expected to increase the number of
clients, the number of deposits and credits, and the number of bank operations, among others.
The following indicators cover the key areas of operating efficiency, transaction costs, number and
volumes of various types of deposits and changes in the customer base as compared to non-
computerized rural banks.
1. Number of customers using deposit services
2. Number of customers using loans and overdrafts
3. Total deposits
4. Average size of savings and fixed deposits
5. Ratio of fixed and savings deposits to total deposits
6. Other Income
7. Monthly operating costs per customer = operating costs/number of customers
8. Monthly operating expense ratio (OER) = total operating costs/total income)
Due to the lack of data on check clearing times, we will not be able to quantitatively estimate the
effect of the activity on the speed of clearing.
Methodology
We propose to use a difference-in-difference estimator (with matching or covariates controls
when appropriate) where the staggered rollout of the intervention (VSAT, computerization, and
connection to the server) can be used to define treatment and comparison groups. Because rollout
occurred in batches, the treatment group would be comprised of banks that received the
treatment early and the control group would include the rural banks that receive the treatment
later.
The first bank was connected to the server in June 24th, 2010 and in the following months other
banks followed. By July 25th, 2011, a total of 60 banks were connected to the server. We will
consider this first group of connected banks our "early treatment" group. It was not until October

|
25
17th, 2011 that the first bank in the second batch received a connection and the process of linking
the rest of the banks to the server is still going on. The second batch of banks will make up the
control group.
Originally, we had proposed to do two separate analyses, one estimating the effect of distributing
the equipment to the banks and a second one to estimate the additional effect of connecting the
rural banks. Unfortunately, the distribution of equipment is not sufficiently spread out over time
to allow creating treatment and comparison groups. In the case of connection to the server, there
is a time lag that makes the approach feasible as half the banks were still not connected a year
after the first banks went live.
Although using two groups of banks, early treatment and later treatment or control is appealing
because of its simplicity, it is not the only way to approach this evaluation. Using the monthly
data for each individual banks, the general difference-in-difference models can be specified as a
fixed effects regression model for panels:
yit = α Dit + β xit + λt + μi + εit,
where yit is the outcome of interest, xit is the vector of the subset of control variables in the
vector x that vary both across units and time, μi is a time-invariant effect unique to unit i, λt is a
time effect common to all units in period t (month and year), and εit is a unit time-varying error
distributed independently across units and time and independently of all μi and λt and finally Dit
indicates treatment.
Alternatively we can perform this analysis in annual differences in order to remove seasonality
such that
Δyi y = yit- yit-12 where y denotes year
and estimate the effect of the variable "time since connected to server" on changes in the
proposed indicators, while we control for covariates.
Risk Factors
There are two main complications that can threaten the feasibility of the proposed methodology.
The first is the number of observations. There are only 134 rural banks and all of them will be
eventually treated. With such a small sample is possible that no effect can be detected when
using the two group difference-in-difference approach. We therefore recommend complementing
the analysis with the fixed effects approach described above.
The second difficulty we face is that rural banks were selected for migration to the eMerge
platform according to a set of prioritization criteria (availability of correct and balanced data,
infrastructure readiness, information security compliance, basic computer appreciation for staff,
etc.). The original priority order is not available to us. Although we learned that the order was
altered because of different circumstances, we are concerned that the rural banks that went live
earlier are also 'superior' in other unobservable dimensions that could introduce bias in our
estimates. If this is the case, it is likely that the estimation of the activity will be biased upwards.
Data Sources
|
26
Having reviewed existing data sources, we are aware that the data necessary to estimate indicator
of interest are available at the ARB APEX Bank in the form of monthly returns from individual
rural banks (not by branch). The monthly returns for each bank are available in paper format for
the period prior to full automation of a given bank, and electronically for the period following
full automation of the bank.
We have initiated a request to access these data and are waiting for a response from APEX.
Initial conversations with APEX staff have been encouraging, and we expect MIDA to help us
facilitating the process of acquiring requisite data.
We note that the process of obtaining paper records of monthly bank returns for a period of
several months for 134 banks is a non-trivial undertaking. Our understanding is that these paper
reports will have to be photo-copied and the necessary information from these paper reports will
then have to be entered into an electronic database. For this data gathering and entry exercise, we
anticipate needing to hire several local consultants for a period of 2-3 months.
B.5 Rural Development Project: Credit Activity
Background Information
The Credit Activity sought to improve access to credit in intervention zones and enhance the
ability of rural banks to assess, grant, and manage agricultural loans to facilitate investments,
acquisition of inputs, adoption of technologies, and financing of recurrent costs. Expected
outcomes included increased yields, productivity, and profits, as well as improved use of credit.
However, there have been major implementation difficulties with the credit program, namely low
repayment rates along the entire chain of credit resulting in substantial loan delinquencies both in
the Bank of Ghana loans to Rural and Commercial Banks, and the Agricultural Credit Program
Consultant’s (ACPC) loans to FNGOs, as well as in loans made by these Participating Financial
Institutions (PFIs) vis-à-vis to FBOs. The table below summarizes the status of the credit
component as of 30 September 2011:
ACP/Bank of Ghana Portfolio at risk = 96.07% (Loans to PFIs)
PFI Portfolio at risk = 84.42% (Loans to loan clients)
Funds received: repayments this month from PFIs to the Bank of Ghana: GH¢ 899,639
ACP Fund cumulative return of undisbursed Funds (claw back) from PFIs: GH¢
7,287,778
Net Disbursal from the ACP Fund to PFIs: GH¢ 18,853,798 ( Minus PFI repayments &
claw backs)
Current Loan balance outstanding due by loan clients to PFIs: GH¢ 18,555,990
Balance in ACP repayment account at the Bank of Ghana: GH¢ 11,467,781.
The cumulative amount of scheduled principal repayment overdue: GH¢ 14,837,588.
ACP in its September 2011 report presented the following loan allocation breakdown:
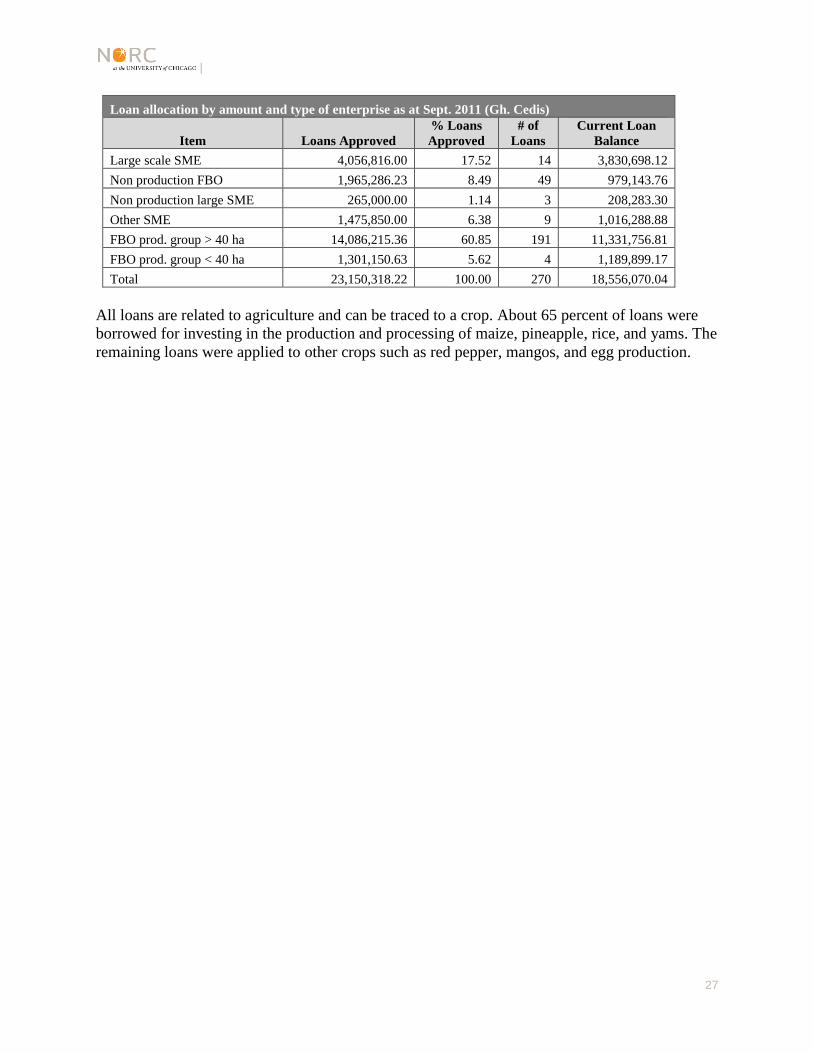
|
27
Loan allocation by amount and type of enterprise as at Sept. 2011 (Gh. Cedis)
Item Loans Approved
% Loans
Approved
# of
Loans
Current Loan
Balance
Large scale SME 4,056,816.00 17.52 14 3,830,698.12
Non production FBO 1,965,286.23 8.49 49 979,143.76
Non production large SME 265,000.00 1.14 3 208,283.30
Other SME 1,475,850.00 6.38 9 1,016,288.88
FBO prod. group > 40 ha 14,086,215.36 60.85 191 11,331,756.81
FBO prod. group < 40 ha 1,301,150.63 5.62 4 1,189,899.17
Total 23,150,318.22 100.00 270 18,556,070.04
All loans are related to agriculture and can be traced to a crop. About 65 percent of loans were
borrowed for investing in the production and processing of maize, pineapple, rice, and yams. The
remaining loans were applied to other crops such as red pepper, mangos, and egg production.
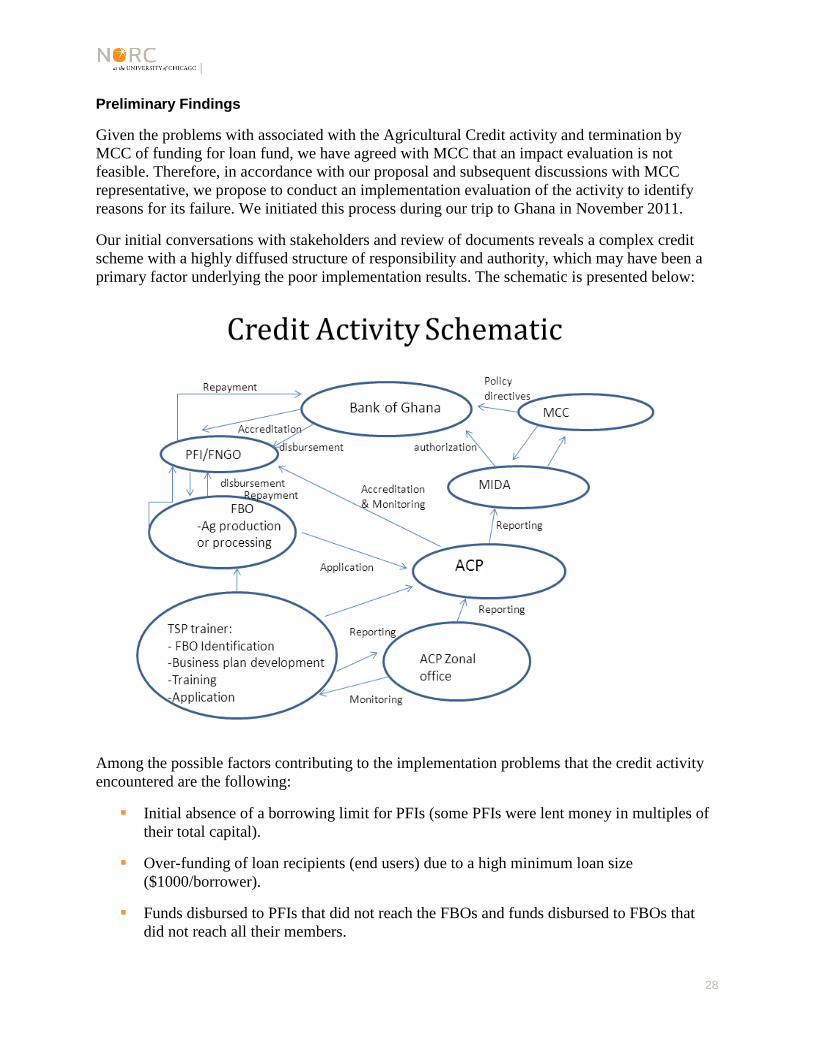
|
28
Preliminary Findings
Given the problems with associated with the Agricultural Credit activity and termination by
MCC of funding for loan fund, we have agreed with MCC that an impact evaluation is not
feasible. Therefore, in accordance with our proposal and subsequent discussions with MCC
representative, we propose to conduct an implementation evaluation of the activity to identify
reasons for its failure. We initiated this process during our trip to Ghana in November 2011.
Our initial conversations with stakeholders and review of documents reveals a complex credit
scheme with a highly diffused structure of responsibility and authority, which may have been a
primary factor underlying the poor implementation results. The schematic is presented below:
Among the possible factors contributing to the implementation problems that the credit activity
encountered are the following:
Initial absence of a borrowing limit for PFIs (some PFIs were lent money in multiples of
their total capital).
Over-funding of loan recipients (end users) due to a high minimum loan size
($1000/borrower).
Funds disbursed to PFIs that did not reach the FBOs and funds disbursed to FBOs that
did not reach all their members.
|
29
Absence of cross checking of loan appraisals by the PFIs and the Bank of Ghana.
Insufficient stringency in borrower selection by the local consultants (TSPs), who all the
parties (PFIs, MIDA, ACP and Bank of Ghana) relied upon as the principal checkpoint.
Lack of understanding by the FBOs in providing cash flow budgets that adequately
reflected the payment capacity of the borrower, which resulted in over-optimistic
business plans that contained exaggerated cash flow estimations.
Marketing problems faced by some of the borrowers that were not taken into account
during loan appraisal.
Repayment schedules that did not match the farmer’s income stream from the crops being
produced.
Data Sources and Methodology
Our recommendation is to limit this evaluation to an implementation evaluation based on
qualitative methods directed at identifying and developing an in-depth understanding of the
factors that led to the low repayment rates in Ghana.
We will review existing data from ACP, the various agreements between the PFIs and ACP, and
monthly ACP reports. Through our discussions with implementing agencies, we have identified a
list of information sources that could be used in a qualitative implementation evaluation. They
include:
ACP Monthly Monitoring Reports
ACP Loan Eligibility Reports
ACP Policies and Procedures Manual
ACP/Bank of Ghana Unit Implementation Manual
ACP Post Harvest Report
ACP Monthly Zonal reports
PFI Returns Files
FNGO Reports
CIG (Capital Incentive Grant) Monthly reports
NORC will combine review of these reports with additional field visits and key informant
interviews with TSPs, rural banks, PFIs, and FBOs to gain a clear understanding of the key
causes of the low repayments rates for this credit activity. Based on an analysis of administrative
and qualitative information, we will develop a set of lessons learned and recommendations.

|
30
C. DATA SOURCES
In this section, we discuss the data sources that we have identified as useful for the evaluation.
Since our initial proposal, we have had the opportunity to review various datasets mentioned in
the RFP, as well as identify new data sources. Below, we present each possible data source, and
discuss the pros and cons of each.
C.1 GLSS5+ Database
The GLSS5+ was a large-scale household survey conducted in 2008 that was funded by MiDA
and covered many of the MiDA target districts. Specifically, 9,300 households in 27
Enumeration Areas in the original 23 program districts were surveyed. As such, we anticipated
using this data source heavily for the impact evaluation of several of the MiDA activities and
sub-activities.
During our trip to Ghana, we obtained the dataset and supporting documentation, and met with
researchers from ISSER who were in charge of the survey. In the course of reviewing the data
and discussing its contents with ISSER staff, we have become aware of two significant
limitations to using the data for the evaluation.
1. GLSS5+ was designed to be used at district level, but not at more disaggregated levels such
as communities or Census enumeration areas. The activities and sub-activities that NORC is
evaluating, however, will have impact at lower levels, such as communities, FBO coverage
areas, and school catchment areas. It is unlikely that the impact of these activities,
particularly given the sample sizes available, would be detected at the district level.
2. The GLSS5+ household data does not include more specific information about the location
of the household than cluster. As such, it is not possible to link households with the
communities or schools catchment areas in which they are located. By extension, it is also
not possible to link GLSS5+ households with MiDA intervention sites and boundary areas
obtained from the MiDA GIS dataset. It is essential to be able to create correspondence
between individual farmer data and MiDA GIS data in order to identify treatment households
and potential controls. GLSS5+ data only allows matching at district level.
Although we are still thinking of strategies to get around these problems, at present, we have not
identified any solutions. Therefore, for the purpose of design report, we assume that GLSS5+ can
only be used at district level.
C.2 FBO Survey Data
The FBO survey, funded by MiDA, was fielded by ISSER during 2008. It covered 2,928 farmers
in its first wave. The FBO collects data among farmers on demographic characteristics,
education and skills/training, health, activity and occupation, migration, housing and housing
conditions, assets, land ownership and land transactions, agriculture production, and non-farm
household enterprises.
Currently, we have two versions of the FBO database: one provided by MCC, and a second one
was provided by ISSER. Neither version is complete. For example, the ISSER’s version is
|
31
missing some sections of the survey for Phase II FBOs; and the MCC version is missing data on
variables such as phase of FBO training, FBO batch number, and degree of technological
adaption. We are currently working on obtaining a complete version of the FBO survey from
ISSER.
In theory, the FBO Survey dataset can be used as a baseline for the impact evaluation, and our
preceding discussion of the evaluation designs for the agriculture activities assumes that we will
do so. However, at this stage, the dataset is missing some key variables that are critical for the
evaluation.
1. The only way to match the FBO data with the MiDA intervention sites in order to select a
sample of treatment and control farmers for the evaluation is by using the geo-coordinates for
the FBOs that are available in the MiDA GIS dataset. Although both datasets contain FBO
IDs, these identification codes are different in the two datasets and, therefore, cannot be
linked. FBO names are also quite different in the two datasets due to different versions of the
names, different spelling, and abbreviations. We have found that we can do a fairly good job
of matching FBOs with MiDA intervention sites by using geographical coordinates.
However, both versions of the FBO survey we have include only the coordinates for Phase I
FBOs. It is essential that we obtain these coordinates for Phase II FBOs as well if we are to
use the FBO data in our evaluation. We have contacted ISSER about obtaining this missing
data, and will request MiDA’s help in facilitating this data acquisition.
2. Some sections in the dataset corresponding to Phase I (in both versions), do not contain
variables specified in the survey instrument. In particular, questions contained in Section 10,
Part G - Output Details, Main Season and Minor Season of the questionnaires do not have
corresponding variables in the dataset – for example, quantity of crop produced, revenues,
and post-harvest losses, among others. This section in the survey captures crop harvest
during the main and minor seasons and, as such, is important for the evaluation of irrigation
and post-harvest activities.
Note that we are aware of the problem with the data in this section because of its critical
importance to the evaluation. It is possible that there are problems with other sections of the
database that we have not discovered yet.
A second wave of the FBO Survey will need to be conducted after the activities are finished,
preferably in late 2013. We strongly recommend re-interviewing the same farmers that were
interviewed in the first round (Phase I and Phase II) in order to create a panel.
3. Reports produced by ISSER contain information about crop yields. It is not clear from the
survey instrument which questions were used to calculate this indicator as there seems to be a
mismatch between data and instrument. Crop yield is a very relevant indicator for the
evaluation of the agricultural activities, and we would like to be able to compute it and use in
our impact evaluations. We will work with ISSER on this issue, but at the present it is
unclear if such an indicator is available at baseline or not.
C.3 MiDA GIS Database
We have obtained the GIS Database from MiDA, which contains shapefiles and data for MiDA
interventions. While this dataset has proven to be very useful in geo-locating intervention sites
|
32
and matching them with FBOs, we have to date, discovered two problems. The first is that FBOs
IDs do not match those of the FBO survey. However we are making good progress matching the
FBOs and farmers in the two datasets by using the geographical coordinates found in the FBO
survey data.
A second problem is that there are several missing data points. For example, shapefiles
containing ABC locations were not included with the rest of the GIS data we received from
MiDA. We are currently working with MiDA in trying to resolve this issue, but in the meantime
we were able to approximate the ABC positions from the district maps that MiDA provided.
We are currently working with MIDA in trying to resolve these issue.
C.4 APEX Data
We have identified seven indicators that are suitable for analyzing the impact of computerization
and connectivity of rural banks. The indicators, listed in Section D.2, cover changes in banks’
operating efficiency, transaction costs, number and volumes of various types of deposits, and
customer base. This data, as mentioned before, is available in banks’ monthly returns in either
paper or electronic form.
Specifically we need:
1. From the Efficiency Monitoring Unit at APEX, as discussed with Mr. S. Twumasi Ankrah,
copies of the complete monthly paper returns for the 134 rural banks starting from January
2009 through month of automation (which would vary by bank).
We would like to obtain copies of these paper records as soon as possible. We will need to
capture these data in electronic format.
2. From the Data Centre at APEX, as discussed with Mr. Michael Appiah, an excel dataset that
includes all reporting variables linked to the indicators listed above for the period following
automation for each of the 134 banks. This list of variables includes the following:
# of customers using demand deposits
# of customers using savings deposits
# of customers using time deposits (fixed deposits)
# of customers using Susu deposits
# of customers getting loans
# of customers with overdrafts
total # customers
# of fixed deposits
# of demand deposits
# of savings deposits
total value of demand deposits
total value of savings deposits
total value of fixed deposits
total operating cost (expense)
non-interest income (commissions and fees)
total income

|
33
We do not need the electronic (post-automation) data at this time. However, we do need a firm
commitment from APEX that they will provide us with the monthly data by bank for the listed
variables when we make a request at a later date. Without these data, the impact evaluation we
propose for the financial services activity will not be possible.
At present, we are working with MiDA to set in place an agreement with APEX to ensure that
NORC has access to this data.
C.5 School Census, EMIS Database
School censuses are annual, and information is collected through the Education Management
System (EMIS). We have identified this database as the main source of data for school-level
indicators to be use in our impact evaluation. For this purpose, we will need to have a minimum
of two waves of the data, one to be used as baseline and another as endline.
NORC obtained the EMIS for the 2009-2010 school year through our own contacts, and this will
serve as a good baseline for the evaluation. It is important to note, however, that we were unable
to access this data through the Ministry of Education. It is critical that we make arrangements
through MiDA and MCC to ensure that we will be able to obtain the EMIS dataset for the
endline, for the 2011-2012 and/or the 2012-2013 school year.
C.6 Population Data from Ghana Statistical Services
Through the EMIS 2010 database, we have access to school-level enrollment numbers. In order
to calculate area-specific enrollment rates, we need age and sex specific population data for
enumeration areas that fall within each school’s catchment area. We hope to obtain this data
from the 2010 Census when it is available. We have already made a formal request to Ghana
Statistical Services, and would like to request MiDA’s help in accessing this data as soon as the
final dataset is available.
In order to compute enrollment indicators for the endline we will need population estimates for
2011-2012 or 2012-2013 based on the census 2010, if they are available. This data is usually
computed by the statistical institutes, GSS in our case. Otherwise, we will need to use 2010
census data as the base and estimate endline indicators under the assumption that population
growth rates are the same across geographical areas of interest.
C.7 School District Data
We have identified key pieces of information that we will to collect at district-level Education
Offices, namely, communities that fall into the catchment areas of MiDA and comparison
schools, other schools in each catchment area, and other education projects that have been or are
being conducted in the districts. The District Education Offices may also be able to provide
school-age population figures for each school catchment area; this may be a more direct way to
gather this data, rather than estimates based on Census figures. We propose to hire a local
consultant to collect necessary data at the district level.
|
34
C.8 Summary of Data Sources
Database Baseline Endline
Available to
NORC?
Status Source Available to
NORC?
Status Source
FBO Yes Incomplete ISSER To be collected NORC
MiDA GIS Yes Incomplete MIDA NA
APEX No Requested APEX No Requested APEX
EMIS Yes Complete IPA No MoE
GSS
Population
No Requested GSS No GSS
School
District
To be collected Districts/
NORC
To be collected Districts/N
ORC
D. PHASE II WORKPLAN
Below we present a preliminary workplan for Phase II of the evaluation. This workplan is based
on the assumption that the evaluation designs presented in this report will be approved by MCC,
and that the baseline data necessary to conduct the evaluations, as described in Section B of the
reports, are available to NORC.
Task 1: Finalizing Evaluation Designs
During the first two quarters (Jan-June) of 2012, following approval of the Evaluation Design
Report by CC, the NORC Team will focus on the following activities:
(1) Complete the collection and compilation of baseline data from existing and new sources
(January – May 2012)
To date, we have gathered large amounts of information and some data that has permitted us to
propose evaluation designs for each of the activities/sub-activities under consideration. However,
as described in Section B above, for every one of the evaluations, we are still missing critical
data that will confirm whether the methodologies proposed are feasible. For example, if we are
unable to gain access to the complete MiDA-funded FBO Survey dataset, there will be no
baseline data for the Irrigation and Post-Harvest activities. Similarly, failure to gain a written
commitment from APEX Bank to release to MCC or NORC monthly returns statements for all
rural banks would render us unable to conduct the rural bank impact evaluation as proposed. Key
activities related to baseline data acquisition include the following:
Obtain from ISSER the complete version of the FBO Survey dataset with full
documentation (assistance from MiDA required before closeout)
Obtain a complete GIS database, which includes shape files for the full set of MiDA
interventions (MiDA cooperation required before closeout)
As soon as it is available, obtain the Census 2010 dataset from GSS (MiDA assistance
required before closeout)

|
35
Sign an agreement from APEX Bank confirming that MCC and NORC will have access
to paper and electronic monthly return for 134 rural banks, as specified in the letter sent
by NORC to MiDA for transmittal to APEX Bank (MiDA assistance required before
closeout; NORC will hire a local consultant to make copies of and conduct data entry of
paper reports)
Collect school-level data (as listed in Section B.3 of this report) from District-level
Education Offices in 30 MiDA intervention sites (NORC will hire local consultants to
collect this data; a letter from MiDA or MCC may be required)
Collect export data from the Ghana Airports Company and up to 30 individual exporters
who export their products through KIA
Although NORC does not recommend conducting a rigorous impact evaluation for the irrigation
activity in Kpong (for reasons discussed in Section B.2), we understand that MCC might choose
to pursue an evaluation of this program component. In this case, it will be necessary to conduct a
full-scale primary baseline data collection in treatment and control sites before April/May 2012.
Towards this end, NORC would revise the FBO Survey questionnaire to directly reflect the
needs of the evaluation, and then work with a local data collection firm to develop a data
collection plan and protocols, set in place quality control procedures, recruit and train
enumerators, pilot test the questionnaire, conduct field work, and enter and process the data.
We anticipate using the better part of the first two quarters of 2012 to fill the gaps in our data
sources. This includes collecting data from district-level education offices and paper return from
APEX, and entry and processing of this data.
It is critical to emphasize the importance of MiDA support during January and February in
helping NORC gain access to critical datasets that have been funded by MiDA, as well as to gain
commitments from MiDA counterparts.
We anticipate up to two NORC trips during the first half of 2012 to support and implement these
data gathering activities. If a full-fledged adapt collection activity in the Kpong region is
required, a much higher level of effort will be required.
(2) Finalize evaluation design and update evaluation design report (May-June 2012)
Based on a review of the data collected/obtained in the first few months of 2012, as well as the
commitments gained from data collection agencies and the APEX Bank, NORC will revisit the
evaluation designs presented in this report.
One of the key tasks that we will perform using the complete GIS and FBO Survey datasets, as
well as any school data collected at the district-level is the conduct of power calculations and
identification of treatment and control groups for each intervention where such an approach is
feasible.
We will prepare and present a final design report that contains this detail to MCC for review and
approval.

|
36
(3) Conduct endline data collection (April-September 2013)
In our proposal, we discussed two types of data collection activities:
(1) data collection that will occur prior to Compact close-out (before February 2012); and
(2) post-compact data collection (endline).
Our expectation was that all data collection during the compact would be undertaken by MiDA
and its implementing agencies, and that some of this data would be used by NORC for an interim
analysis of results to be completed before February 2012. Based on our initial trip to Ghana and
discussions with MiDA and implementing agencies, it does not appear to us that an analysis of
results at Compact close-out will yield any information on the outcomes of the interventions
primarily because many of the activities and sub-activities will not be completed until February
2012. As such, we would like to revisit the discussion of interim results analyses with MCC.
For endline data collection activities, which are listed in Section C.8, the NORC team will
develop/refine data collection instruments, recruit and train interviews, pilot test instruments,
develop field protocols and quality control procedures, conduct interviews/focus groups, and
process the data. We anticipate that the endline data collection activities – namely the second
round of the FBO Survey and district-level data collection from Education Offices - will occur in
beginning in the second quarter of 2013, thereby allowing a least one year of lag time after
Compact closeout. We will also conduct qualitative data collection that supplements the
quantitative analysis in 2013; however, we propose conducting the qualitative research for the
credit activity somewhat earlier, in mid- 2012, since it is important to gather the information
about implementation while those details are still fresh in the minds of implementers and project
participants. NORC will also collect secondary data from APEX Bank, GSS, ISSER, and the
Ministry of Education through agreements established with these data collection entities to
ensure access to data after Compact close-out.
(4) Conduct data analysis and prepare evaluation report (2013/2014)
Consolidate data from different sources (as identified in Evaluation Design Report) into
clean datasets that follow MCC’s guidelines for Public Use Data. Ensure that all
documentation exists for data collected by NORC and, to the extent possible, for other
data sources. (July-December 2013)
Conduct data analysis in accordance with the impact evaluation designs in the final
Design Report – this may include regression analysis with matching, calculation of
double difference estimators, qualitative analysis of focus group and/or key informant
interview data. (January-May 2014)
Recalculate ERR at defined endline for each project (January-May 2014).
Conduct outreach sessions in Ghana for local academics, government statisticians,
development professionals, and other interested stakeholders to discuss evaluation
implementation, preliminary results, final results, and lessons learned. Conduct 2-3
outreach sessions in Washington for MCC staff and other stakeholders (June 2014)
Prepare Draft and Final Evaluation reports (July-September 2014)
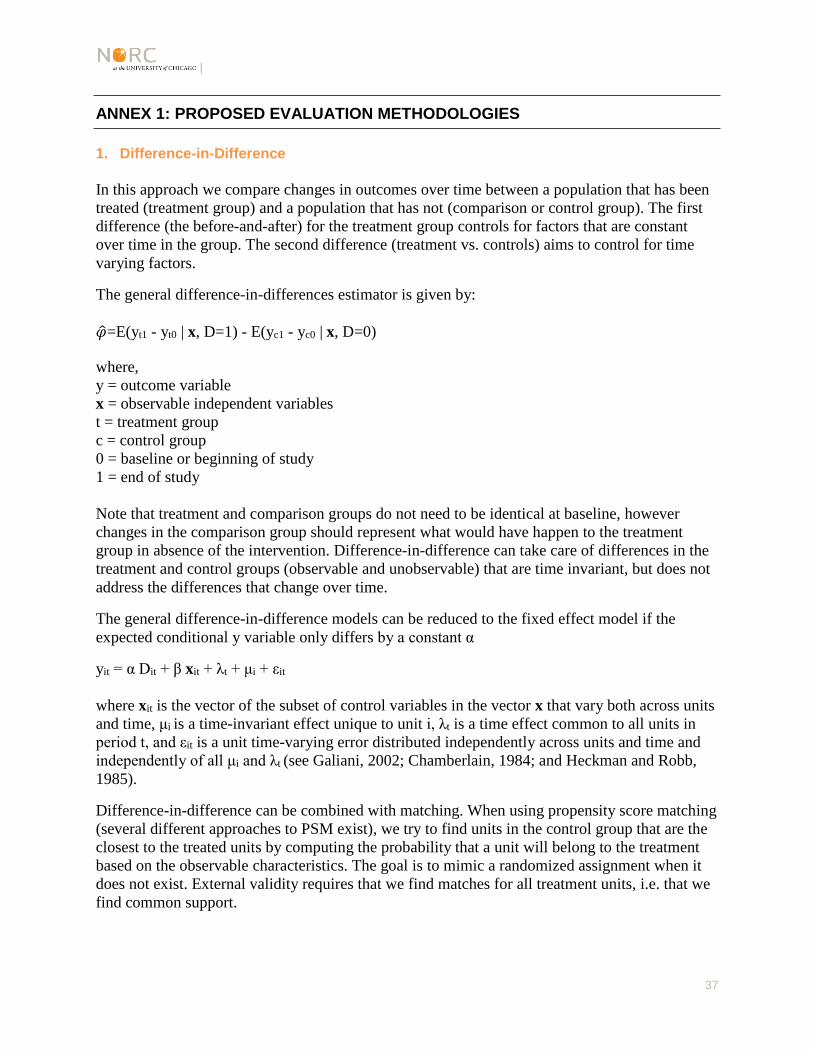
|
37
ANNEX 1: PROPOSED EVALUATION METHODOLOGIES
1. Difference-in-Difference
In this approach we compare changes in outcomes over time between a population that has been
treated (treatment group) and a population that has not (comparison or control group). The first
difference (the before-and-after) for the treatment group controls for factors that are constant
over time in the group. The second difference (treatment vs. controls) aims to control for time
varying factors.
The general difference-in-differences estimator is given by:
�̂�=E(yt1 - yt0 | x, D=1) - E(yc1 - yc0 | x, D=0)
where,
y = outcome variable
x = observable independent variables
t = treatment group
c = control group
0 = baseline or beginning of study
1 = end of study
Note that treatment and comparison groups do not need to be identical at baseline, however
changes in the comparison group should represent what would have happen to the treatment
group in absence of the intervention. Difference-in-difference can take care of differences in the
treatment and control groups (observable and unobservable) that are time invariant, but does not
address the differences that change over time.
The general difference-in-difference models can be reduced to the fixed effect model if the
expected conditional y variable only differs by a constant α
yit = α Dit + β xit + λt + μi + εit
where xit is the vector of the subset of control variables in the vector x that vary both across units
and time, μi is a time-invariant effect unique to unit i, λt is a time effect common to all units in
period t, and εit is a unit time-varying error distributed independently across units and time and
independently of all μi and λt (see Galiani, 2002; Chamberlain, 1984; and Heckman and Robb,
1985).
Difference-in-difference can be combined with matching. When using propensity score matching
(several different approaches to PSM exist), we try to find units in the control group that are the
closest to the treated units by computing the probability that a unit will belong to the treatment
based on the observable characteristics. The goal is to mimic a randomized assignment when it
does not exist. External validity requires that we find matches for all treatment units, i.e. that we
find common support.

|
38
We plan to use this approach to evaluate the impact of several activities such as ABCs, Public
Pack Houses, Cold Rooms, Irrigation, and Financial Services.
2. Instrumental Variables
In addition to the difference-in-difference approach, we have also proposed using Instrumental
Variables. A naive OLS estimator would be biased if the explanatory variables are correlated
with the error terms. This is likely to be the case in most of the activities we want to evaluate
given that participating FBOs where selected into treatment based on some characteristics
unobservable to us. However, if an instrument is available we may obtain consistent estimates.
Our instrument must be correlated with the endogenous explanatory variable (treatment, in our
case) and uncorrelated with the error term.
We propose to use "distance to facility" as an instrument for treatment given that in our case the
location of the farmer is not endogenous. The rationality behind this idea is that some farmers are
more likely to participated into treatment given that they are located closer to a particular facility,
for example an ABC.
We calculate IV estimates using two-stage least-squares (2SLS). In the first stage, treatment (T)
is regressed on all the exogenous variables in the model, Z. The predicted values for T* are
obtained and in the second stage we regress:
Yi = β Ti* + εi
3. Regression Discontinuity Approach
In the case of the education activity there is an eligibility ranking and clear cut-offs by district to
assign schools to treatment and control. We have therefore proposed a Regression Discontinuity
Approach. The RDD strategy exploits the discontinuity around the cut-off score to estimate the
counterfactual. The idea is that units close to the threshold, just above and just below the cut-off,
are similar.
Yi = β0 + β1Ti + β2(Xi - Xc) + εi
where:
Y is the outcome variable
T is the treatment dummy
X is the assignment variable
Xc is the cut-off
β2 predicts outcome from assignment
β1 is the estimate of treatment effect

|
39
ANNEX 2: POWER CALCULATIONS
The objective of the analysis is to determine the power function corresponding to a specified
sample size. The power function shows the probability of detecting an effect of specified size. In
order to estimate the power, the following must be specified:
1. The impact estimator to be used.
2. The significance level of the test of hypothesis (that the effect is zero).
3. Coefficient of variation of the measure of interest.
4. Sample design and sample size.
Irrigation Activity
For the Golinga and Botanga schemes for which we have data, it is assumed that the sample size
will be 75 treatment farmers and 75 control farmers in the baseline survey, and that these same
farmers will be re-interviewed in the endline survey, i.e., a panel sampling approach will be used.
It is assumed that the panel sampling introduces a correlation of .5 into outcome measures of
interest. It is assumed that a double-difference estimator or covariate-adjusted double-difference
estimator will be used. The significance level of the test (probability of making a “Type I” error
of deciding that the effect is non-zero when in fact it is) is assumed to be α = .05. For incomes in
rural settings in developing countries, the coefficient of variation (standard deviation divided by
the mean) is usually in the range .5 – 2. The value 1 will be assumed.
The following table shows the power function under these assumptions. The effect size, D, is the
fractional change in income between baseline and endline, measured by a double-difference
estimator. The sample size, n, is the sample size for each design group (treatment before,
treatment after, control before, control after).
Sample
Size per
design
group
(n)
Power (probability of detecting an effect of size D)
D = 0 D=.05 D=.1 D=.15 D=.2 D=.25 D=.3 D=.35 D=.4 D=.45 D=.5 D=.55
75 .05 .092 .151 .234 .337 .455 .576 .691 .789 .865 .919 .956
This table shows that to be detected with high probability (.9 or higher), the effect size (fractional
change in income between baseline and endline, as measured by the double-difference estimator)
would have to be .5 or larger. This is a substantial change in income. For a smaller change in
income, such as .10, the power is quite low (i.e., .151 for D=.1).
Post-harvest intervention: Mango PPH
We use the same assumptions will be made except for sample size, which is assumed to be 45
treatment and 45 control in the baseline and in the endline. It is understood that the distinction
between treatment and control may not be clear, and that an instrumental variable may be used in
lieu of a binary treatment indicator variable. In this case, the sample size is assumed to be 90 in

|
40
the baseline and 90 in the endline, and the sample-size parameter, n, refers to half the total
baseline sample size. In this case, the power function is as follows:
Sample
Size per
design
group
(n)
Power (probability of detecting an effect of size D)
D = 0 D=.05 D=.1 D=.15 D=.2 D=.25 D=.3 D=.35 D=.4 D=.45 D=.5 D=.55
45 .05 .083 .123 .176 .244 .323 .412 .506 .600 .688 .766 .831
This table shows that to detect an income change with moderately high power (.8), the effect size
(fractional income change between baseline and endline, measured by a double-difference
estimator) would have to be about .55 or larger. If an instrumental-variable estimator is used, the
power would likely be less.
|
41
ANNEX 3: INFORMATION ON POST-HARVEST INFRASTRUCTURE ACTIVITIES
The following table provides background information on the ten ABCs that are now under
construction:
Details of MiDA-Funded Agribusiness Centers
ABC Name District Location No.
FBOs
No.
Members
Cost US$
Northern Region
IPSL Savelugu Nanton Savelugu 20 1003 371,801.68
Savannah Farmers Tamale Metro Chanzini 20 826 371,801.68
AMSIG
Resources
Tolon Woribogu
Kukuo
20 998 371,801.68
GAABIC Karanga Karanga City 20 754 375,178.85
Presbyterian Ag.
Services
West Mamprusi Kperiga 72 3508 390,934.97
Afram Basin
CPDF Kwahu North Kwanpo Ng
Nkwanta
20 978 356,818.82
Yawah Shalom Ejura-Sekyedumasi Dome (Aframso) 20 975 310,607.76
Victory Feed Ejura-Sekyedumasi Bonyon 20 1035 371,007.33
Southwestern Horticultural Belt
Quality Ag.
Services
Manya Krobo Asesewa 20 984 359,214.82
Seed Shop Gomoa Abassa 52 2593 359,214.82
Total cost 3,638,382.41
Source: MiDA technical staff

|
42
The following table provides background information on the three Public Pack Houses supported
by MIDA:
Public Pack House
Name District Anchor Farmer No.
FBOs
No.
Members
Cost (US
$000)
Ajanoa (Pineapple) Akwapim
South
Greenspan Farms,
Ltd.
11 492
3,693 Gomoa Otwekrom
(Pineapple)
Gomoa Chartered Impex,
Ltd.
8 394
Akorley (Mango) Yilo Krobo None 9 587
Source: MiDA technical staff
The outgrowers that are affiliated with the three SPEG exporters with contract farming
arrangements are shown in the following table:
FBOs Associated with SPEG Exporters
Exporter FBO Community No.
Members
Bomart Farms Millennium Co-operative Pineapple Farmers
Society Limited
Dobro/Nsawam
14
Prudent Farms Awutu Bereku Prudent Outgrowers
Association
Awutu Bereku
11
Georgefields
Farms
Akubresie Pineapple Outgrowers Association Ayerasu Bendum 12