may 4, 2012 financial results of petróleos mexicanos
TRANSCRIPT
May 4, 2012
Financial Results of Petróleos Mexicanos, Subsidiary Entities and Subsidiary Companies as of March 31, 20121
First Quarter (Jan.-Mar.)
2011 2012 Variation 2012 Highlights
(Ps. Billion)
(U.S.$Billion)
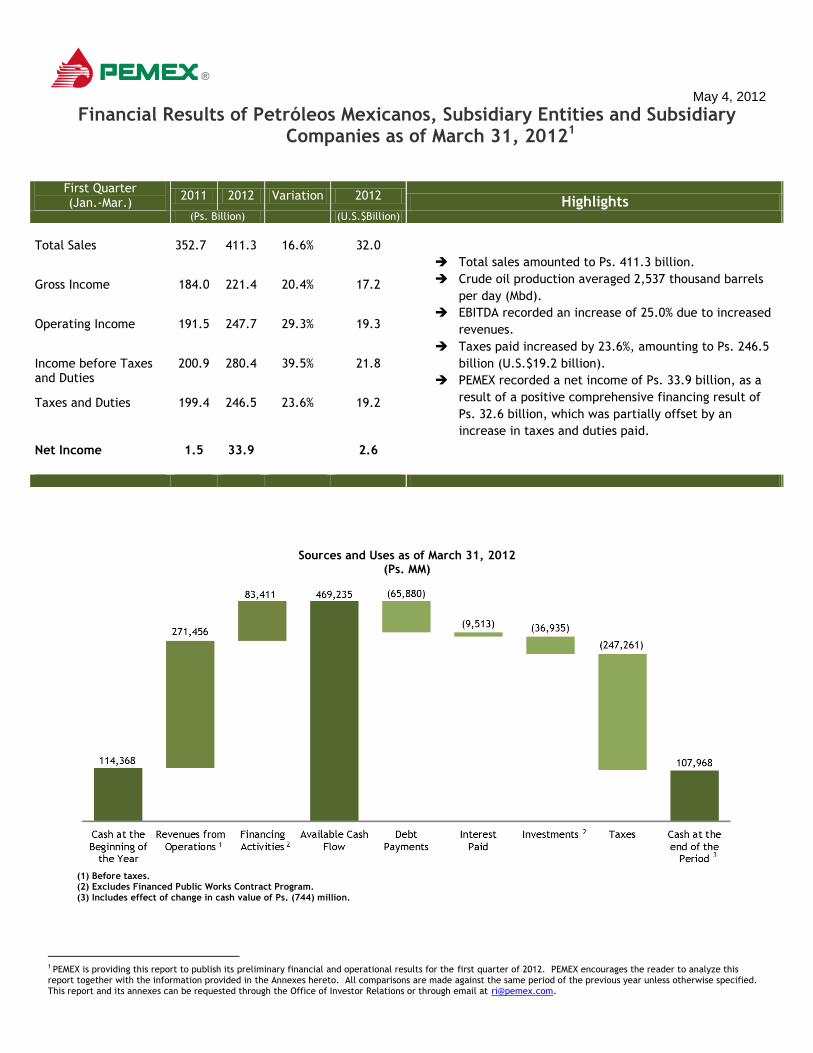
Total Sales 352.7 411.3 16.6% 32.0
Total sales amounted to Ps. 411.3 billion.
Crude oil production averaged 2,537 thousand barrels
per day (Mbd).
EBITDA recorded an increase of 25.0% due to increased
revenues.
Taxes paid increased by 23.6%, amounting to Ps. 246.5
billion (U.S.$19.2 billion).
PEMEX recorded a net income of Ps. 33.9 billion, as a
result of a positive comprehensive financing result of
Ps. 32.6 billion, which was partially offset by an
increase in taxes and duties paid.
Gross Income 184.0 221.4 20.4% 17.2
Operating Income 191.5 247.7 29.3% 19.3
Income before Taxes and Duties
200.9 280.4 39.5% 21.8
Taxes and Duties 199.4 246.5 23.6% 19.2
Net Income 1.5 33.9 2.6
Sources and Uses as of March 31, 2012 (Ps. MM)
(1) Before taxes. (2) Excludes Financed Public Works Contract Program. (3) Includes effect of change in cash value of Ps. (744) million.
1 PEMEX is providing this report to publish its preliminary financial and operational results for the first quarter of 2012. PEMEX encourages the reader to analyze this report together with the information provided in the Annexes hereto. All comparisons are made against the same period of the previous year unless otherwise specified. This report and its annexes can be requested through the Office of Investor Relations or through email at [email protected].
PEMEX
PEMEX Results Report as of March 31, 2012 2 / 20 www.pemex.com
Operating Results
Upstream
Crude Oil Production
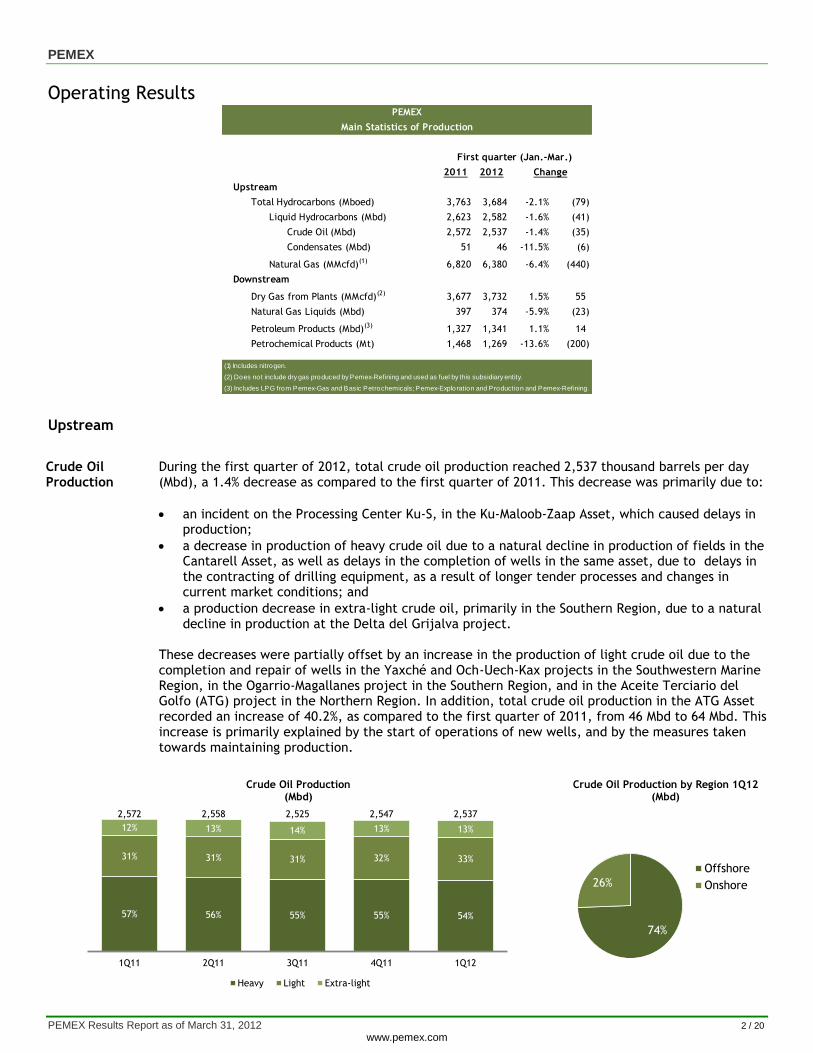
During the first quarter of 2012, total crude oil production reached 2,537 thousand barrels per day (Mbd), a 1.4% decrease as compared to the first quarter of 2011. This decrease was primarily due to:
an incident on the Processing Center Ku-S, in the Ku-Maloob-Zaap Asset, which caused delays in production;
a decrease in production of heavy crude oil due to a natural decline in production of fields in the Cantarell Asset, as well as delays in the completion of wells in the same asset, due to delays in the contracting of drilling equipment, as a result of longer tender processes and changes in current market conditions; and
a production decrease in extra-light crude oil, primarily in the Southern Region, due to a natural decline in production at the Delta del Grijalva project.
These decreases were partially offset by an increase in the production of light crude oil due to the completion and repair of wells in the Yaxché and Och-Uech-Kax projects in the Southwestern Marine Region, in the Ogarrio-Magallanes project in the Southern Region, and in the Aceite Terciario del Golfo (ATG) project in the Northern Region. In addition, total crude oil production in the ATG Asset recorded an increase of 40.2%, as compared to the first quarter of 2011, from 46 Mbd to 64 Mbd. This increase is primarily explained by the start of operations of new wells, and by the measures taken towards maintaining production.
Crude Oil Production (Mbd)
Crude Oil Production by Region 1Q12 (Mbd)
First quarter (Jan.-Mar.)
2011 2012 Change
Upstream
Total Hydrocarbons (Mboed) 3,763 3,684 -2.1% (79)
Liquid Hydrocarbons (Mbd) 2,623 2,582 -1.6% (41)
Crude Oil (Mbd) 2,572 2,537 -1.4% (35)
Condensates (Mbd) 51 46 -11.5% (6)
Natural Gas (MMcfd)(1) 6,820 6,380 -6.4% (440)
Downstream
Dry Gas from Plants (MMcfd)(2) 3,677 3,732 1.5% 55
Natural Gas Liquids (Mbd) 397 374 -5.9% (23)
Petroleum Products (Mbd)(3) 1,327 1,341 1.1% 14
Petrochemical Products (Mt) 1,468 1,269 -13.6% (200)
(1) Includes nitrogen.
(2) Does not include dry gas produced by Pemex-Refining and used as fuel by this subsidiary entity.
(3) Includes LPG from Pemex-Gas and Basic Petrochemicals; Pemex-Exploration and Production and Pemex-Refining.
PEMEX
Main Statistics of Production
57% 56% 55% 55% 54%
31% 31% 31% 32% 33%
12% 13% 14% 13% 13%
2,572 2,558 2,525 2,547 2,537
1Q11 2Q11 3Q11 4Q11 1Q12
Heavy Light Extra-light
74%
26%
Offshore
Onshore

PEMEX
PEMEX Results Report as of March 31, 2012 3 / 20 www.pemex.com
Natural Gas Production
Total natural gas production decreased by 6.9%,2 primarily as a result of:
the fact that in response to lower natural gas prices in the U.S. market, there was a programmed reduction in the completion of wells and drilling activities in the Burgos and Veracruz Assets of the Northern Region; and
natural declines in production at the Abktun-Pol Chuc Asset in the Southwestern Marine Region, at the Samaria Luna Asset in the Southern Region and at the Cantarell Asset in the Northeastern Marine Region.
These decreases were partially offset by an increase in associated gas production at the Litoral de Tabasco Asset in the Southwestern Marine Region and at the ATG Asset in the Northern Region.
Natural Gas Production (MMcfd)
Natural Gas Production by Asset (MMcfd)
Natural Gas Production by Region 1Q12 (MMcfd)
2 Does not include nitrogen.
63% 63% 63% 63% 64%
37% 37% 37% 37% 36%
6,1675,937 5,838 5,717 5,742
1Q11 2Q11 3Q11 4Q11 1Q12
Associated Non-Associated
-
800
1,600
2,400
3,200
4,000
4,800
5,600
6,400
1Q11 2Q11 3Q11 4Q11 1Q12
Other
Litoral de Tabasco
Abkatún-Pol Chuc
Samaria-Luna
Veracruz
Cantarell
Burgos
26%
23%
8%
11%
12%
9%
11%
5,742
34%
66%
Offshore
Onshore
PEMEX
PEMEX Results Report as of March 31, 2012 4 / 20 www.pemex.com
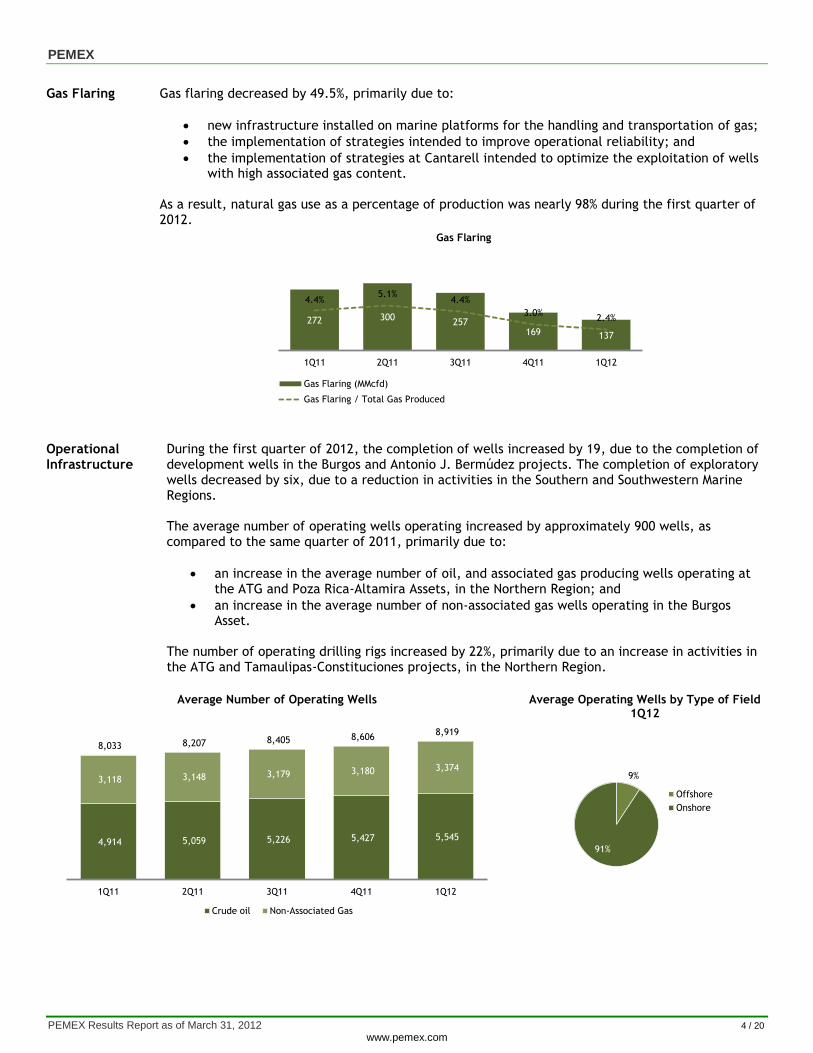
Gas Flaring Gas flaring decreased by 49.5%, primarily due to:
new infrastructure installed on marine platforms for the handling and transportation of gas;
the implementation of strategies intended to improve operational reliability; and
the implementation of strategies at Cantarell intended to optimize the exploitation of wells with high associated gas content.
As a result, natural gas use as a percentage of production was nearly 98% during the first quarter of 2012.
Gas Flaring
Operational Infrastructure
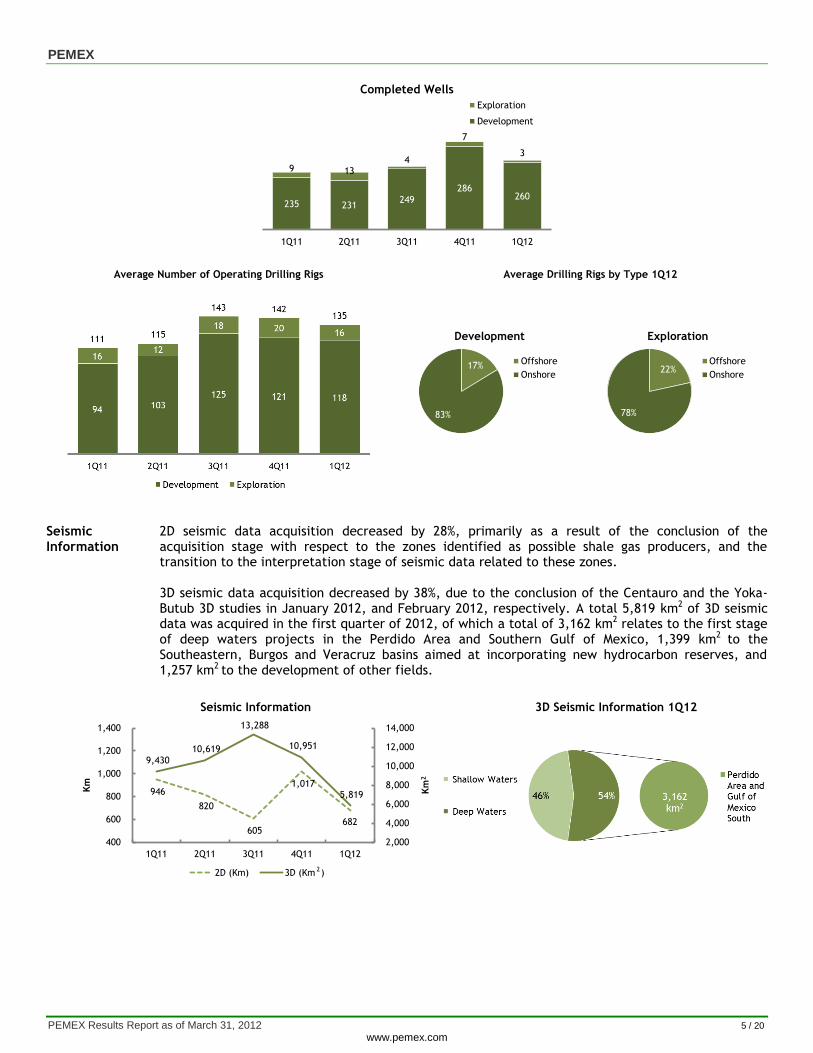
During the first quarter of 2012, the completion of wells increased by 19, due to the completion of development wells in the Burgos and Antonio J. Bermúdez projects. The completion of exploratory wells decreased by six, due to a reduction in activities in the Southern and Southwestern Marine Regions. The average number of operating wells operating increased by approximately 900 wells, as compared to the same quarter of 2011, primarily due to:
an increase in the average number of oil, and associated gas producing wells operating at the ATG and Poza Rica-Altamira Assets, in the Northern Region; and
an increase in the average number of non-associated gas wells operating in the Burgos Asset.
The number of operating drilling rigs increased by 22%, primarily due to an increase in activities in the ATG and Tamaulipas-Constituciones projects, in the Northern Region.
Average Number of Operating Wells Average Operating Wells by Type of Field 1Q12
272 300257
169 137
4.4%5.1%
4.4%
3.0%2.4%
1Q11 2Q11 3Q11 4Q11 1Q12
Gas Flaring (MMcfd)
Gas Flaring / Total Gas Produced
4,914 5,059 5,226 5,427 5,545
3,118 3,148 3,179 3,180 3,374
8,033 8,207 8,405 8,606 8,919
1Q11 2Q11 3Q11 4Q11 1Q12
Crude oil Non-Associated Gas
9%
91%
Offshore
Onshore
PEMEX
PEMEX Results Report as of March 31, 2012 5 / 20 www.pemex.com
Completed Wells
Average Number of Operating Drilling Rigs Average Drilling Rigs by Type 1Q12
Seismic Information
2D seismic data acquisition decreased by 28%, primarily as a result of the conclusion of the acquisition stage with respect to the zones identified as possible shale gas producers, and the transition to the interpretation stage of seismic data related to these zones. 3D seismic data acquisition decreased by 38%, due to the conclusion of the Centauro and the Yoka-Butub 3D studies in January 2012, and February 2012, respectively. A total 5,819 km2 of 3D seismic data was acquired in the first quarter of 2012, of which a total of 3,162 km2 relates to the first stage of deep waters projects in the Perdido Area and Southern Gulf of Mexico, 1,399 km2 to the Southeastern, Burgos and Veracruz basins aimed at incorporating new hydrocarbon reserves, and 1,257 km2 to the development of other fields.
Seismic Information 3D Seismic Information 1Q12
235 231249
286260
9 134
7
3
1Q11 2Q11 3Q11 4Q11 1Q12
Exploration
Development
17%
83%
Development
Offshore
Onshore22%
78%
Exploration
Offshore
Onshore
946
820
605
1,017
682
9,430
10,619
13,288
10,951
5,819
2,000
4,000
6,000
8,000
10,000
12,000
14,000
400
600
800
1,000
1,200
1,400
1Q11 2Q11 3Q11 4Q11 1Q12
Km
2
Km
2D (Km) 3D (Km )2
PEMEX
PEMEX Results Report as of March 31, 2012 6 / 20 www.pemex.com
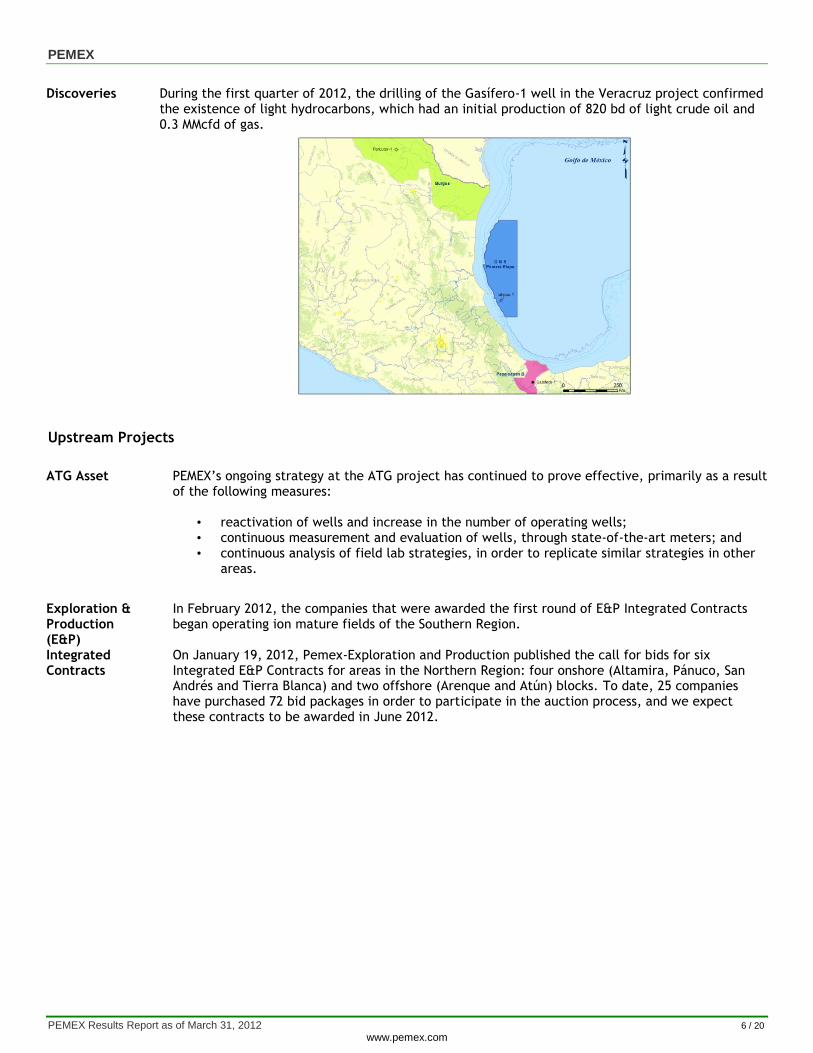
Discoveries During the first quarter of 2012, the drilling of the Gasífero-1 well in the Veracruz project confirmed the existence of light hydrocarbons, which had an initial production of 820 bd of light crude oil and 0.3 MMcfd of gas.
Upstream Projects
ATG Asset PEMEX’s ongoing strategy at the ATG project has continued to prove effective, primarily as a result of the following measures:
• reactivation of wells and increase in the number of operating wells; • continuous measurement and evaluation of wells, through state-of-the-art meters; and • continuous analysis of field lab strategies, in order to replicate similar strategies in other
areas.
Exploration & Production (E&P) Integrated Contracts
In February 2012, the companies that were awarded the first round of E&P Integrated Contracts began operating ion mature fields of the Southern Region. On January 19, 2012, Pemex-Exploration and Production published the call for bids for six Integrated E&P Contracts for areas in the Northern Region: four onshore (Altamira, Pánuco, San Andrés and Tierra Blanca) and two offshore (Arenque and Atún) blocks. To date, 25 companies have purchased 72 bid packages in order to participate in the auction process, and we expect these contracts to be awarded in June 2012.

PEMEX
PEMEX Results Report as of March 31, 2012 7 / 20 www.pemex.com
Downstream
Crude Oil Processing
Total crude oil processing increased by 2.9%, primarily due to the resumption of regular operations of the hydrodesulphuration diesel oil plant at the Cadereyta Refinery. Light crude oil processing as a percentage of total crude oil processing decreased from 65% to 57%, while heavy crude oil processing increased from 35% to 43%.
Crude Oil Processing and Petroleum Products Production (Mbd)
Production of Petroleum Products
Total petroleum products production increased by 1.1%, or 14 Mbd, due to an increase in production of gasolines and diesel, since the new plants at the Minatitlán Refinery came into operation, and in response to the resumption of regular operations of the hydrodesulphuration diesel oil plant at the Cadereyta Refinery.
Petroleum Products Production (Mbd)
Variable Refining Margin
PEMEX’s National Refining System recorded a negative variable refining margin of U.S.$2.66 per barrel during the first quarter of 2012, a decrease of U.S.$6.16 per barrel as compared to the same quarter of 2011. This decrease is primarily explained by the volatility in the prices of crude oil and petroleum products in the international markets, as well as unfavorable structural conditions in the domestic market.
Variable Refining Margin (U.S.$/b)
752 729 722 731 677
409 439 436 448 517
1,327 1,319 1,304 1,315 1,341
1Q11 2Q11 3Q11 4Q11 1Q12
Light Crude Heavy Crude Petroleum products production
413 399 389 401 421
310 308 307 305 274
279 270 276 271 301
210 212 210 205 203
57 57 56 55 58 58 72 66 79 84
1,327 1,319 1,304 1,315 1,341
1Q11 2Q11 3Q11 4Q11 1Q12
Other*
Jet Fuel
LPG
Diesel
Fuel oil
Automotive gasolines
* Includes paraffins, furfural extract, aeroflex, asphalt, lubricants, coke, cyclical light oil and other gasolines.
3.50
1.04
-2.17
-2.64
-2.66
1Q11 3Q11 1Q12
PEMEX
PEMEX Results Report as of March 31, 2012 8 / 20 www.pemex.com
Natural Gas Processing and Production
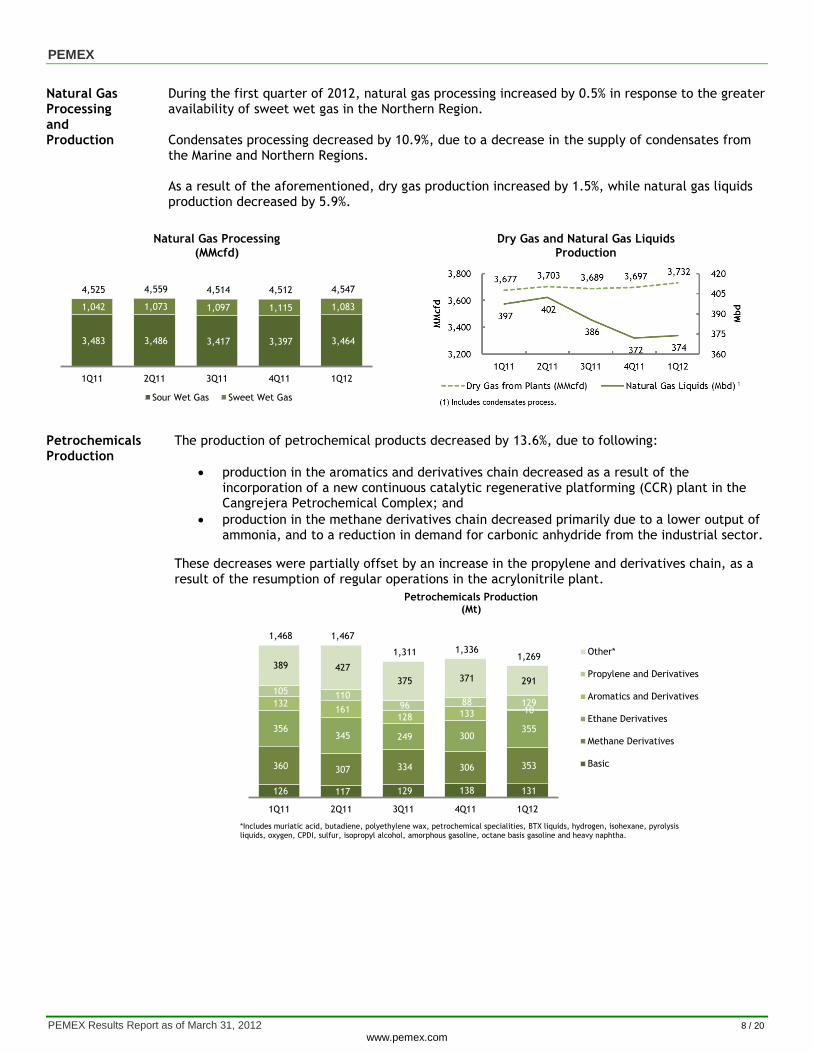
During the first quarter of 2012, natural gas processing increased by 0.5% in response to the greater availability of sweet wet gas in the Northern Region. Condensates processing decreased by 10.9%, due to a decrease in the supply of condensates from the Marine and Northern Regions. As a result of the aforementioned, dry gas production increased by 1.5%, while natural gas liquids production decreased by 5.9%.
Natural Gas Processing
(MMcfd)
Dry Gas and Natural Gas Liquids Production
Petrochemicals Production
The production of petrochemical products decreased by 13.6%, due to following:
production in the aromatics and derivatives chain decreased as a result of the incorporation of a new continuous catalytic regenerative platforming (CCR) plant in the Cangrejera Petrochemical Complex; and
production in the methane derivatives chain decreased primarily due to a lower output of ammonia, and to a reduction in demand for carbonic anhydride from the industrial sector.
These decreases were partially offset by an increase in the propylene and derivatives chain, as a result of the resumption of regular operations in the acrylonitrile plant.
Petrochemicals Production (Mt)
3,483 3,486 3,417 3,397 3,464
1,042 1,073 1,097 1,115 1,083
4,525 4,559 4,514 4,512 4,547
1Q11 2Q11 3Q11 4Q11 1Q12
Sour Wet Gas Sweet Wet Gas
126 117 129 138 131
360 307 334 306 353
356 345 249 300
355
132 161
128 133 10
105 110 96 88 129
389 427
375 371 291
1,468 1,467
1,311 1,336 1,269
1Q11 2Q11 3Q11 4Q11 1Q12
Other*
Propylene and Derivatives
Aromatics and Derivatives
Ethane Derivatives
Methane Derivatives
Basic
*Includes muriatic acid, butadiene, polyethylene wax, petrochemical specialities, BTX liquids, hydrogen, isohexane, pyrolysisliquids, oxygen, CPDI, sulfur, isopropyl alcohol, amorphous gasoline, octane basis gasoline and heavy naphtha.
PEMEX
PEMEX Results Report as of March 31, 2012 9 / 20 www.pemex.com
Downstream Projects
Gas Quality During the first quarter of 2012, PEMEX continued implementing measures in order to comply with official gas quality parameters established in the Mexican regulation entitled NOM-001-SECRE-2010, such as: 1. Operating procedures to control nitrogen concentration in processing gas. 2. PEMEX completed modifications to Cryogenic Plant II of the Ciudad Pemex Gas Processing
Center. 3. PEMEX installed H2S and H2O analyzing equipment, as well as chromatographs for gas quality
testing. 4. PEMEX conducted adjustments to operating and control systems, to calculate discounts in case
of a failure to comply with natural gas quality parameters. 5. PEMEX hired services for control of liquefiable contents through dew point control plants at
the Veracruz Asset.
Opening Ceremony of the CCR Plant at the Cangrejera Complex
On March 18, 2012, a CCR plant was installed at the Cangrejera Petrochemical Complex, in Coatzacoalcos, Veracruz. The CCR plant is divided in three sections: the reaction section, the cyclemax CCR regenerator section, both of which will operate in coordination, and the production unit, U10. The plant is expected to produce 21.254 barrels per day of reformate rich in aromatics content (benzene, toluene and xylene), and 71.777 Nm3/hr of grid gas.
PEMEX
PEMEX Results Report as of March 31, 2012 10 / 20 www.pemex.com
Financial Results
Adoption of International Financial Reporting Standards
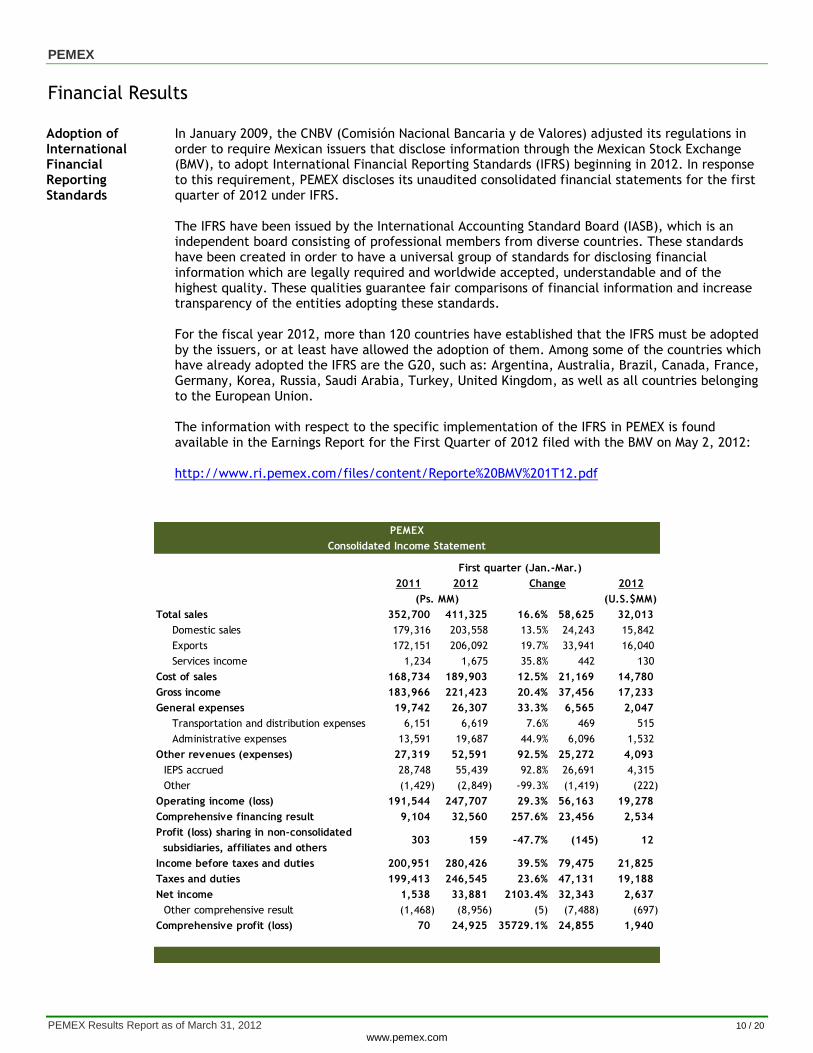
In January 2009, the CNBV (Comisión Nacional Bancaria y de Valores) adjusted its regulations in order to require Mexican issuers that disclose information through the Mexican Stock Exchange (BMV), to adopt International Financial Reporting Standards (IFRS) beginning in 2012. In response to this requirement, PEMEX discloses its unaudited consolidated financial statements for the first quarter of 2012 under IFRS. The IFRS have been issued by the International Accounting Standard Board (IASB), which is an independent board consisting of professional members from diverse countries. These standards have been created in order to have a universal group of standards for disclosing financial information which are legally required and worldwide accepted, understandable and of the highest quality. These qualities guarantee fair comparisons of financial information and increase transparency of the entities adopting these standards. For the fiscal year 2012, more than 120 countries have established that the IFRS must be adopted by the issuers, or at least have allowed the adoption of them. Among some of the countries which have already adopted the IFRS are the G20, such as: Argentina, Australia, Brazil, Canada, France, Germany, Korea, Russia, Saudi Arabia, Turkey, United Kingdom, as well as all countries belonging to the European Union. The information with respect to the specific implementation of the IFRS in PEMEX is found available in the Earnings Report for the First Quarter of 2012 filed with the BMV on May 2, 2012: http://www.ri.pemex.com/files/content/Reporte%20BMV%201T12.pdf
First quarter (Jan.-Mar.)
2011 2012 Change 2012
(Ps. MM) (U.S.$MM)
Total sales 352,700 411,325 16.6% 58,625 32,013
Domestic sales 179,316 203,558 13.5% 24,243 15,842
Exports 172,151 206,092 19.7% 33,941 16,040
Services income 1,234 1,675 35.8% 442 130
Cost of sales 168,734 189,903 12.5% 21,169 14,780
Gross income 183,966 221,423 20.4% 37,456 17,233
General expenses 19,742 26,307 33.3% 6,565 2,047
Transportation and distribution expenses 6,151 6,619 7.6% 469 515
Administrative expenses 13,591 19,687 44.9% 6,096 1,532
Other revenues (expenses) 27,319 52,591 92.5% 25,272 4,093
IEPS accrued 28,748 55,439 92.8% 26,691 4,315
Other (1,429) (2,849) -99.3% (1,419) (222)
Operating income (loss) 191,544 247,707 29.3% 56,163 19,278
Comprehensive financing result 9,104 32,560 257.6% 23,456 2,534
Profit (loss) sharing in non-consolidated
subsidiaries, affiliates and others 303 159 -47.7% (145) 12
Income before taxes and duties 200,951 280,426 39.5% 79,475 21,825
Taxes and duties 199,413 246,545 23.6% 47,131 19,188
Net income 1,538 33,881 2103.4% 32,343 2,637
Other comprehensive result (1,468) (8,956) (5) (7,488) (697)
Comprehensive profit (loss) 70 24,925 35729.1% 24,855 1,940
Consolidated Income Statement
PEMEX
PEMEX
PEMEX Results Report as of March 31, 2012 11 / 20 www.pemex.com
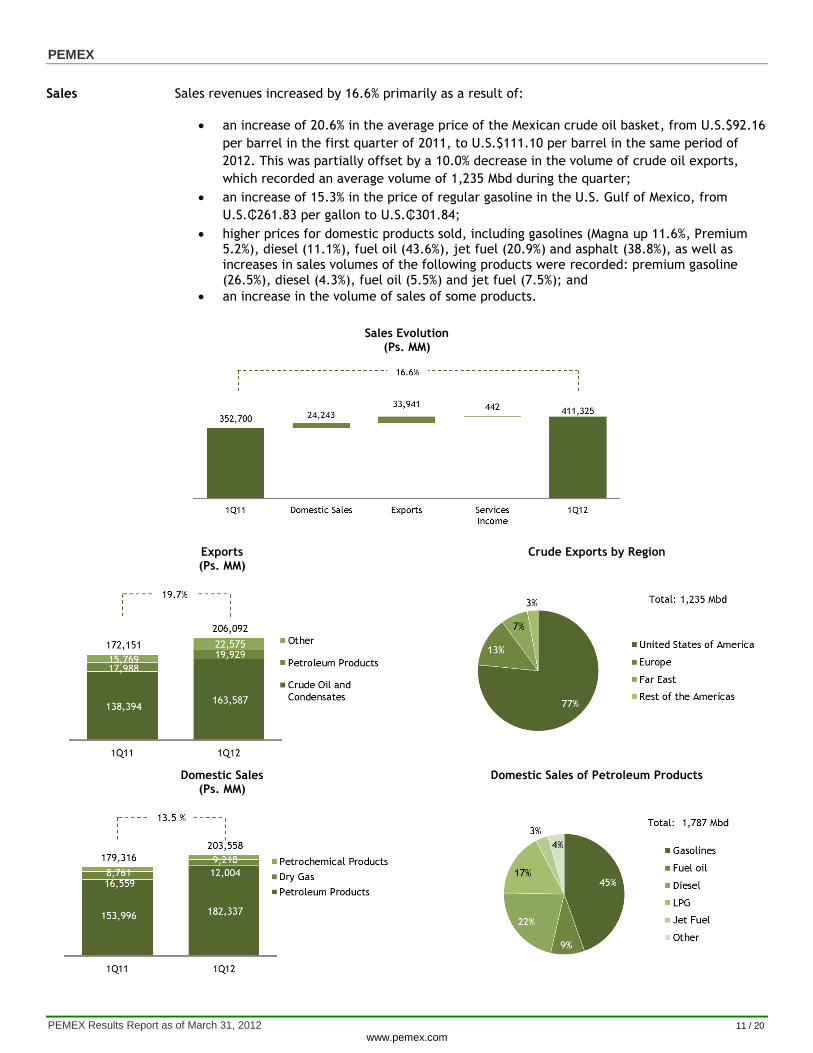
Sales Sales revenues increased by 16.6% primarily as a result of:
an increase of 20.6% in the average price of the Mexican crude oil basket, from U.S.$92.16
per barrel in the first quarter of 2011, to U.S.$111.10 per barrel in the same period of
2012. This was partially offset by a 10.0% decrease in the volume of crude oil exports,
which recorded an average volume of 1,235 Mbd during the quarter;
an increase of 15.3% in the price of regular gasoline in the U.S. Gulf of Mexico, from
U.S.₵261.83 per gallon to U.S.₵301.84;
higher prices for domestic products sold, including gasolines (Magna up 11.6%, Premium 5.2%), diesel (11.1%), fuel oil (43.6%), jet fuel (20.9%) and asphalt (38.8%), as well as increases in sales volumes of the following products were recorded: premium gasoline (26.5%), diesel (4.3%), fuel oil (5.5%) and jet fuel (7.5%); and
an increase in the volume of sales of some products.
Sales Evolution (Ps. MM)
Exports (Ps. MM)
Crude Exports by Region
Domestic Sales (Ps. MM)
Domestic Sales of Petroleum Products

PEMEX
PEMEX Results Report as of March 31, 2012 12 / 20 www.pemex.com
Cost of Sales A 12.5% increase in cost of sales during the first quarter of 2012, primarily due to:
a 12.5% increase in purchases for resale, due to higher prices of hydrocarbons and its derivatives;
an increase in operating expenses mainly due to increases in the costs of personal services (15.5%), materials (48.8%), auxiliary services payable to third parties (86.3%), and liabilities provisions;
an increase in depreciation (7.6%), amortization (7.8%), preservation and maintenance expenses (45.6%), as well as in inventory variation; and
these increased expenses were partially offset by a 25.6% decrease the net cost of employee benefits during the period.
General Expenses
Distribution expenses increased by 7.6%, primarily due to a 21.7% increase in operating expenses, primarily in personal services and freight charges. Moreover, beginning 2012, the net cost of employee benefits corresponding to retired personnel was reclassified into administrative expenses. For comparison purposes, the table below shows the reconciliation of the reclassification made:
Operating Costs and Expenses (Ps. MM)
Other Revenues
Other revenues recorded an increase of 92.5%, primarily as a result of a 92.8% increase in the IEPS3 credit.
3 IEPS means Impuesto Especial sobre Producción y Servicio (Special Tax on Production and Services).
2011(1) 2012 Change 2012
(Ps. MM) (U.S.$MM)
Total administrative expenses 18,817 19,687 4.6% 870 1,661.50
Administrative expenses 11,816 11,635 -1.5% (181) 981.95
Net cost of employee benefits during the period 7,001 8,052 15.0% 1,051 679.56
Administrative Expenses
First quarter (Jan.-Mar.)
(1) The reconciliation for 2011 data has been made solely for comparison purposes.
PEMEX
PEMEX
PEMEX Results Report as of March 31, 2012 13 / 20 www.pemex.com
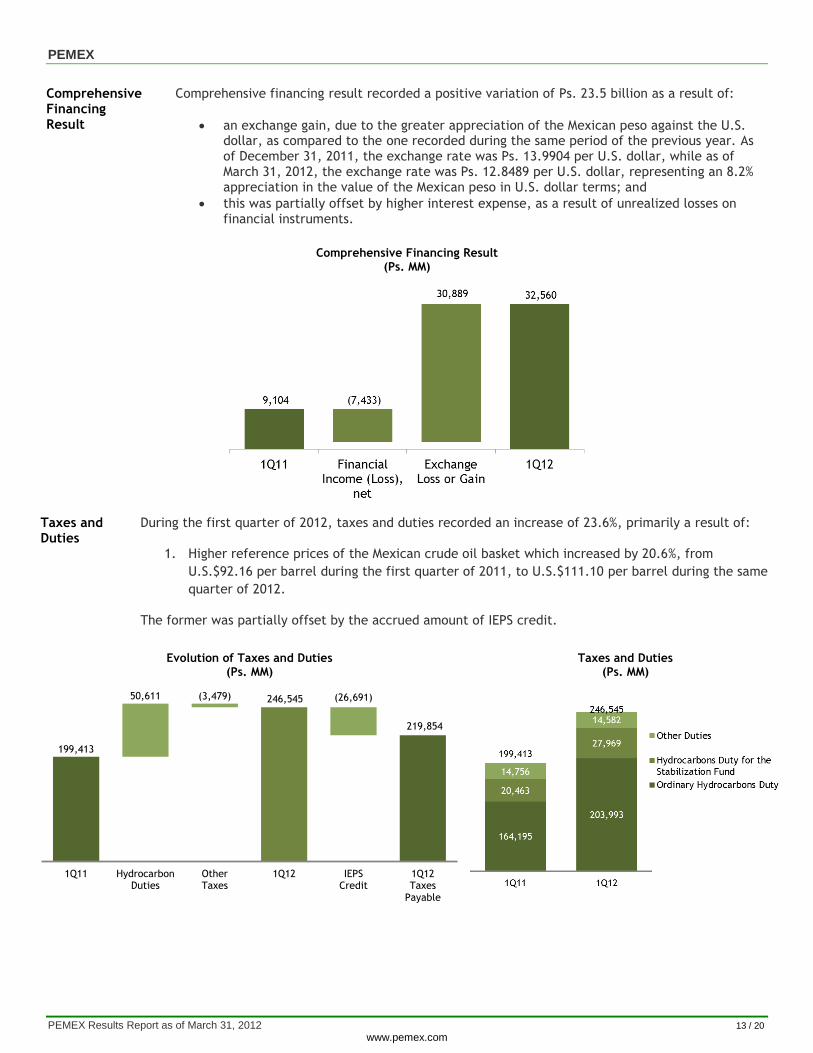
Comprehensive Financing Result
Comprehensive financing result recorded a positive variation of Ps. 23.5 billion as a result of:
an exchange gain, due to the greater appreciation of the Mexican peso against the U.S. dollar, as compared to the one recorded during the same period of the previous year. As of December 31, 2011, the exchange rate was Ps. 13.9904 per U.S. dollar, while as of March 31, 2012, the exchange rate was Ps. 12.8489 per U.S. dollar, representing an 8.2% appreciation in the value of the Mexican peso in U.S. dollar terms; and
this was partially offset by higher interest expense, as a result of unrealized losses on financial instruments.
Comprehensive Financing Result (Ps. MM)
Taxes and Duties
During the first quarter of 2012, taxes and duties recorded an increase of 23.6%, primarily a result of:
1. Higher reference prices of the Mexican crude oil basket which increased by 20.6%, from
U.S.$92.16 per barrel during the first quarter of 2011, to U.S.$111.10 per barrel during the same
quarter of 2012.
The former was partially offset by the accrued amount of IEPS credit.
Evolution of Taxes and Duties (Ps. MM)
Taxes and Duties (Ps. MM)
199,413
246,545
219,854
50,611 (3,479) (26,691)
1Q11 HydrocarbonDuties
OtherTaxes
1Q12 IEPSCredit
1Q12Taxes
Payable

PEMEX
PEMEX Results Report as of March 31, 2012 14 / 20 www.pemex.com
Net Income During the first quarter of 2012, PEMEX recorded a net income of Ps. 33.9 billion, primarily as a result of an increase in sales, and a positive comprehensive financing result, which were partially offset by an increase in taxes and duties.
Net Income Evolution 1Q12 vs 1Q11
(Ps. MM)
(1) Includes profit-sharing in non-consolidated subsidiaries, affiliates and others of Ps. (144.5) million. (2) Comprehensive financing result.
PEMEX
PEMEX Results Report as of March 31, 2012 15 / 20 www.pemex.com
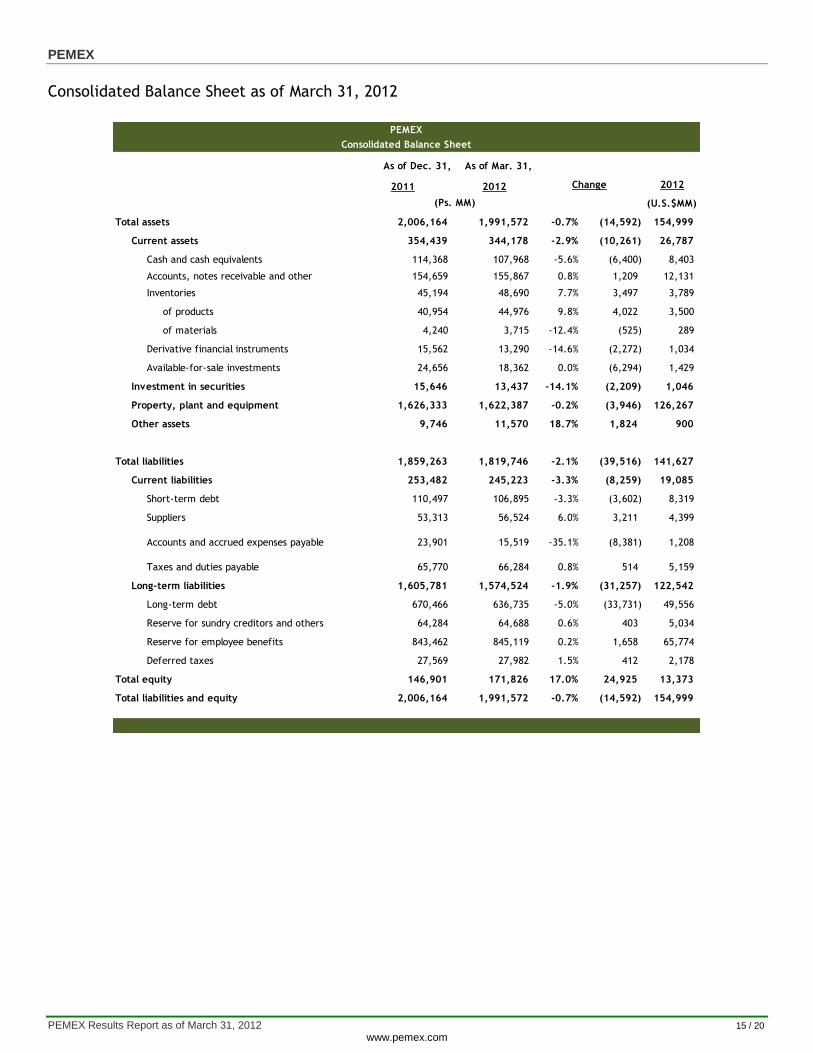
Consolidated Balance Sheet as of March 31, 2012
Consolidated Balance Sheet
As of Dec. 31, As of Mar. 31,
2011 2012 Change 2012
(U.S.$MM)
Total assets 2,006,164 1,991,572 -0.7% (14,592) 154,999
Current assets 354,439 344,178 -2.9% (10,261) 26,787
Cash and cash equivalents 114,368 107,968 -5.6% (6,400) 8,403
Accounts, notes receivable and other 154,659 155,867 0.8% 1,209 12,131
Inventories 45,194 48,690 7.7% 3,497 3,789
of products 40,954 44,976 9.8% 4,022 3,500
of materials 4,240 3,715 -12.4% (525) 289
Derivative financial instruments 15,562 13,290 -14.6% (2,272) 1,034
Available-for-sale investments 24,656 18,362 0.0% (6,294) 1,429
Investment in securities 15,646 13,437 -14.1% (2,209) 1,046
Property, plant and equipment 1,626,333 1,622,387 -0.2% (3,946) 126,267
Other assets 9,746 11,570 18.7% 1,824 900
Total liabilities 1,859,263 1,819,746 -2.1% (39,516) 141,627
Current liabilities 253,482 245,223 -3.3% (8,259) 19,085
Short-term debt 110,497 106,895 -3.3% (3,602) 8,319
Suppliers 53,313 56,524 6.0% 3,211 4,399
Accounts and accrued expenses payable 23,901 15,519 -35.1% (8,381) 1,208
Taxes and duties payable 65,770 66,284 0.8% 514 5,159
Long-term liabilities 1,605,781 1,574,524 -1.9% (31,257) 122,542
Long-term debt 670,466 636,735 -5.0% (33,731) 49,556
Reserve for sundry creditors and others 64,284 64,688 0.6% 403 5,034
Reserve for employee benefits 843,462 845,119 0.2% 1,658 65,774
Deferred taxes 27,569 27,982 1.5% 412 2,178
Total equity 146,901 171,826 17.0% 24,925 13,373
Total liabilities and equity 2,006,164 1,991,572 -0.7% (14,592) 154,999
PEMEX
(Ps. MM)
PEMEX
PEMEX Results Report as of March 31, 2012 16 / 20 www.pemex.com
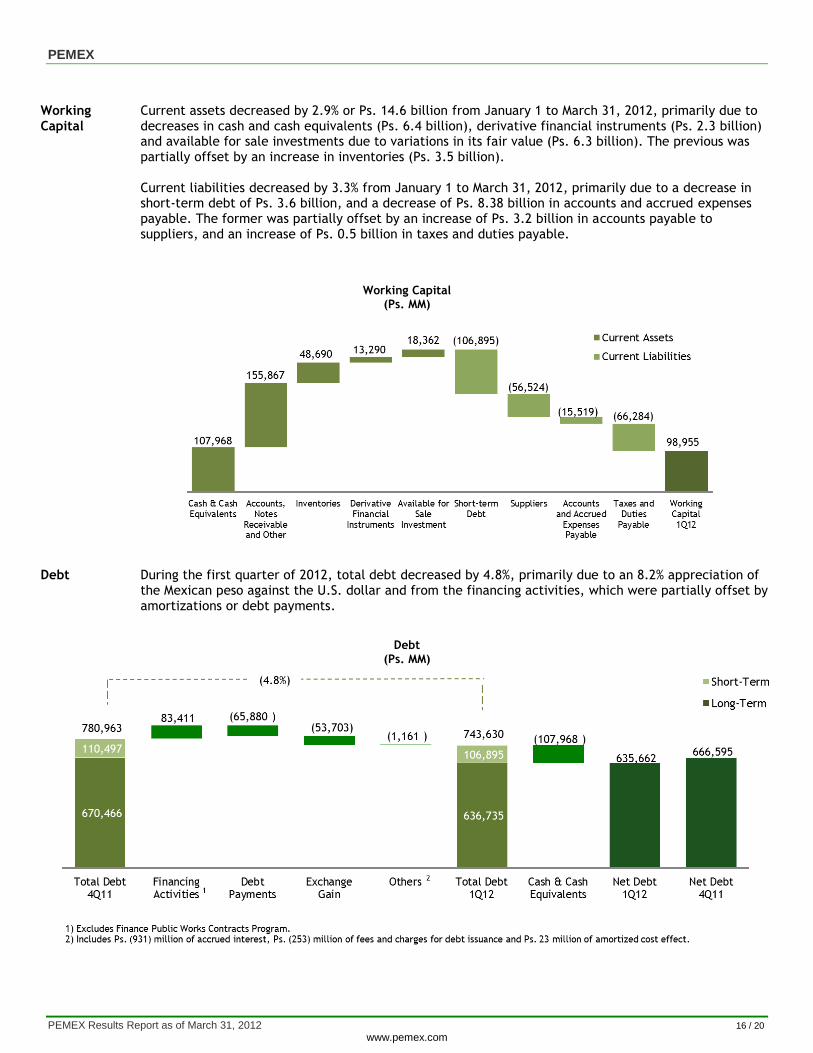
Working Capital
Current assets decreased by 2.9% or Ps. 14.6 billion from January 1 to March 31, 2012, primarily due to decreases in cash and cash equivalents (Ps. 6.4 billion), derivative financial instruments (Ps. 2.3 billion) and available for sale investments due to variations in its fair value (Ps. 6.3 billion). The previous was partially offset by an increase in inventories (Ps. 3.5 billion). Current liabilities decreased by 3.3% from January 1 to March 31, 2012, primarily due to a decrease in short-term debt of Ps. 3.6 billion, and a decrease of Ps. 8.38 billion in accounts and accrued expenses payable. The former was partially offset by an increase of Ps. 3.2 billion in accounts payable to suppliers, and an increase of Ps. 0.5 billion in taxes and duties payable.
Working Capital (Ps. MM)
Debt During the first quarter of 2012, total debt decreased by 4.8%, primarily due to an 8.2% appreciation of the Mexican peso against the U.S. dollar and from the financing activities, which were partially offset by amortizations or debt payments.
Debt (Ps. MM)
PEMEX
PEMEX Results Report as of March 31, 2012 17 / 20 www.pemex.com
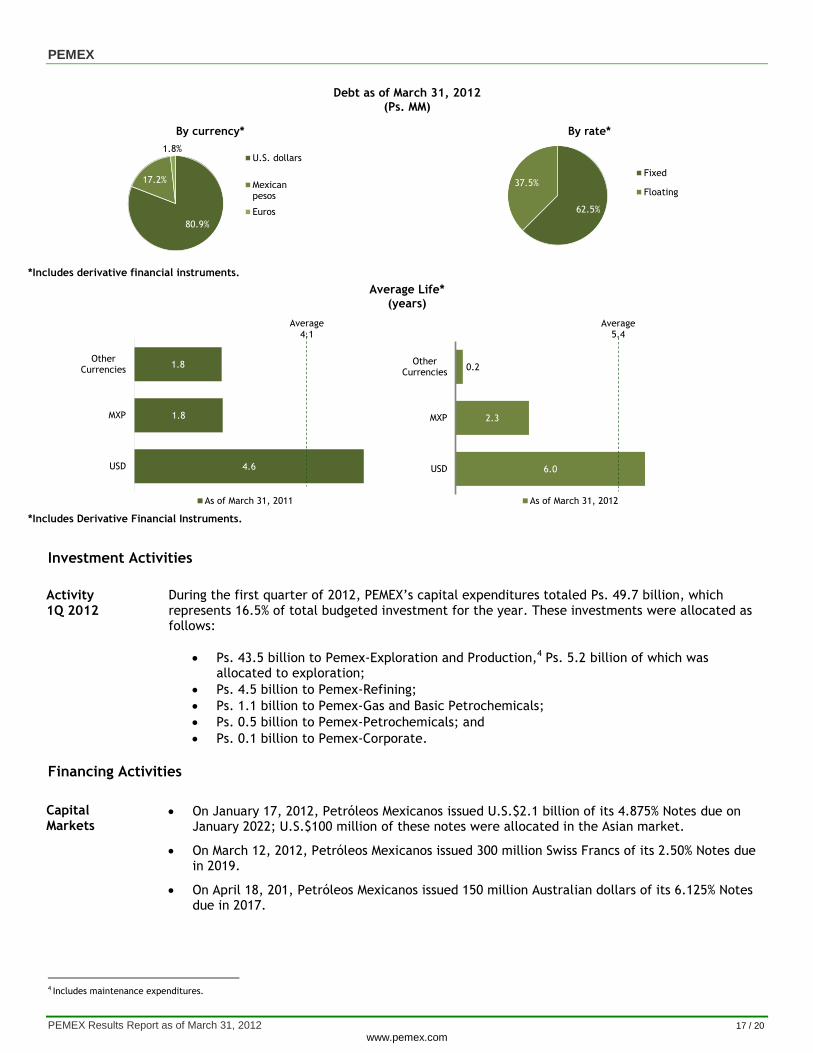
Debt as of March 31, 2012 (Ps. MM)
*Includes derivative financial instruments.
Average Life* (years)
*Includes Derivative Financial Instruments.
Investment Activities
Activity 1Q 2012
During the first quarter of 2012, PEMEX’s capital expenditures totaled Ps. 49.7 billion, which represents 16.5% of total budgeted investment for the year. These investments were allocated as follows:
Ps. 43.5 billion to Pemex-Exploration and Production,4 Ps. 5.2 billion of which was allocated to exploration;
Ps. 4.5 billion to Pemex-Refining;
Ps. 1.1 billion to Pemex-Gas and Basic Petrochemicals;
Ps. 0.5 billion to Pemex-Petrochemicals; and
Ps. 0.1 billion to Pemex-Corporate.
Financing Activities
Capital Markets
On January 17, 2012, Petróleos Mexicanos issued U.S.$2.1 billion of its 4.875% Notes due on January 2022; U.S.$100 million of these notes were allocated in the Asian market.
On March 12, 2012, Petróleos Mexicanos issued 300 million Swiss Francs of its 2.50% Notes due in 2019.
On April 18, 201, Petróleos Mexicanos issued 150 million Australian dollars of its 6.125% Notes due in 2017.
4 Includes maintenance expenditures.
80.9%
17.2%
1.8%
By currency*
U.S. dollars
Mexicanpesos
Euros 62.5%
37.5%
By rate*
Fixed
Floating
4.6
1.8
1.8
USD
MXP
OtherCurrencies
As of March 31, 2011
Average4.1
6.0
2.3
0.2
USD
MXP
OtherCurrencies
As of March 31, 2012
Average5.4
PEMEX
PEMEX Results Report as of March 31, 2012 18 / 20 www.pemex.com
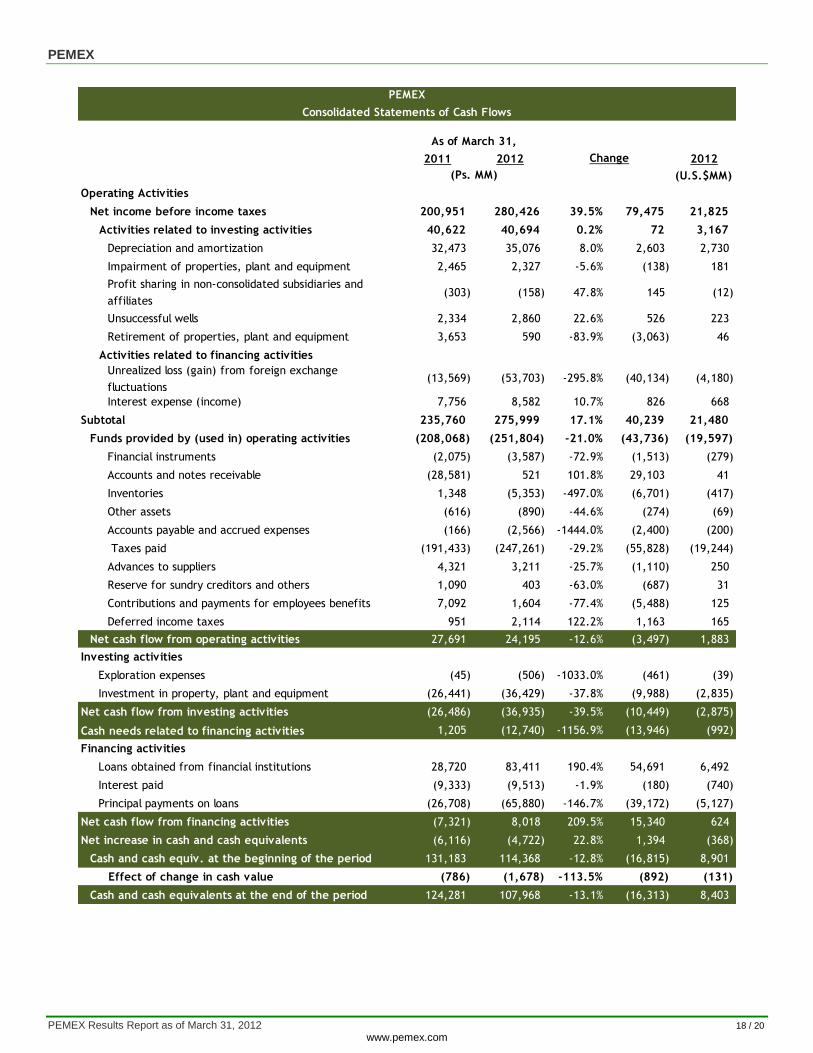
Consolidated Statements of Cash Flows
2011 2012 2012
(U.S.$MM)
Operating Activities
Net income before income taxes 200,951 280,426 39.5% 79,475 21,825
Activities related to investing activities 40,622 40,694 0.2% 72 3,167
Depreciation and amortization 32,473 35,076 8.0% 2,603 2,730
Impairment of properties, plant and equipment 2,465 2,327 -5.6% (138) 181
Profit sharing in non-consolidated subsidiaries and
affiliates(303) (158) 47.8% 145 (12)
Unsuccessful wells 2,334 2,860 22.6% 526 223
Retirement of properties, plant and equipment 3,653 590 -83.9% (3,063) 46
Activities related to financing activities (5,814) (45,121) -676.1% (39,307) (3,512)
Unrealized loss (gain) from foreign exchange
fluctuations(13,569) (53,703) -295.8% (40,134) (4,180)
Interest expense (income) 7,756 8,582 10.7% 826 668
Subtotal 235,760 275,999 17.1% 40,239 21,480
Funds provided by (used in) operating activities (208,068) (251,804) -21.0% (43,736) (19,597)
Financial instruments (2,075) (3,587) -72.9% (1,513) (279)
Accounts and notes receivable (28,581) 521 101.8% 29,103 41
Inventories 1,348 (5,353) -497.0% (6,701) (417)
Other assets (616) (890) -44.6% (274) (69)
Accounts payable and accrued expenses (166) (2,566) -1444.0% (2,400) (200)
Taxes paid (191,433) (247,261) -29.2% (55,828) (19,244)
Advances to suppliers 4,321 3,211 -25.7% (1,110) 250
Reserve for sundry creditors and others 1,090 403 -63.0% (687) 31
Contributions and payments for employees benefits 7,092 1,604 -77.4% (5,488) 125
Deferred income taxes 951 2,114 122.2% 1,163 165
Net cash flow from operating activities 27,691 24,195 -12.6% (3,497) 1,883
Investing activities
Exploration expenses (45) (506) -1033.0% (461) (39)
Investment in property, plant and equipment (26,441) (36,429) -37.8% (9,988) (2,835)
Net cash flow from investing activities (26,486) (36,935) -39.5% (10,449) (2,875)
Cash needs related to financing activities 1,205 (12,740) -1156.9% (13,946) (992)
Financing activities
Loans obtained from financial institutions 28,720 83,411 190.4% 54,691 6,492
Interest paid (9,333) (9,513) -1.9% (180) (740)
Principal payments on loans (26,708) (65,880) -146.7% (39,172) (5,127)
Net cash flow from financing activities (7,321) 8,018 209.5% 15,340 624
Net increase in cash and cash equivalents (6,116) (4,722) 22.8% 1,394 (368)
Cash and cash equiv. at the beginning of the period 131,183 114,368 -12.8% (16,815) 8,901
Effect of change in cash value (786) (1,678) -113.5% (892) (131)
Cash and cash equivalents at the end of the period 124,281 107,968 -13.1% (16,313) 8,403
Change
PEMEX
As of March 31,
(Ps. MM)
PEMEX
PEMEX Results Report as of March 31, 2012 19 / 20 www.pemex.com
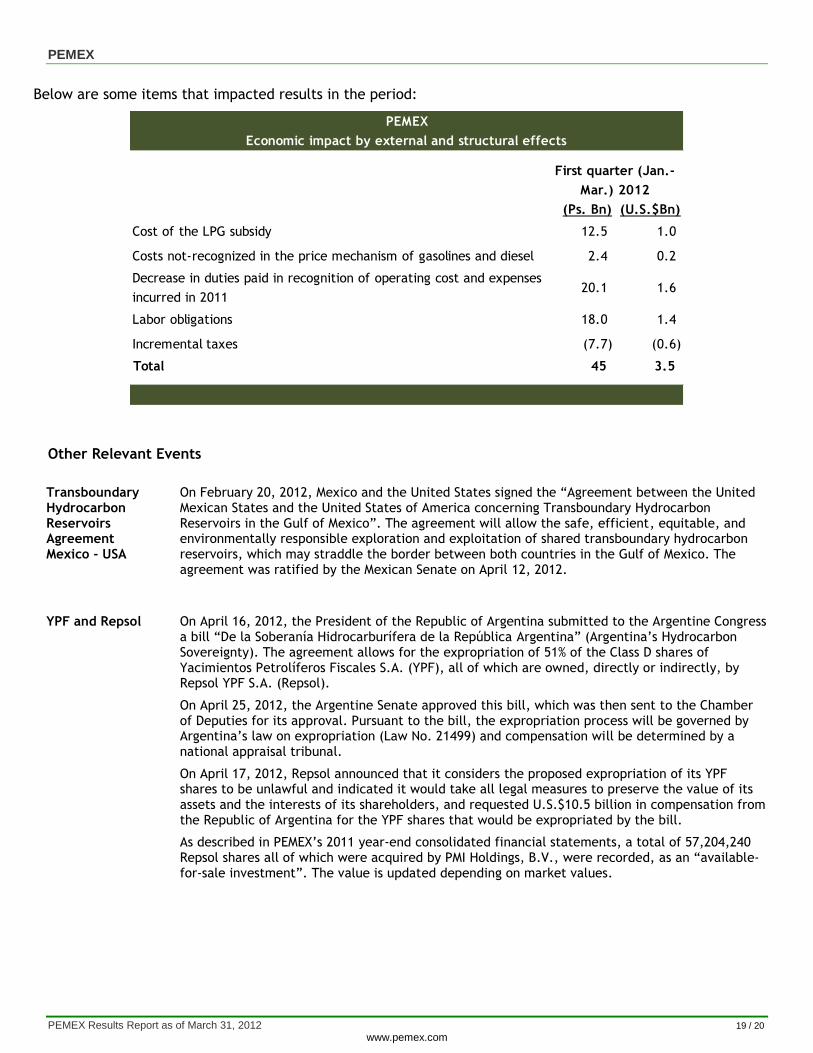
Below are some items that impacted results in the period:
Other Relevant Events
Transboundary Hydrocarbon Reservoirs Agreement Mexico - USA
On February 20, 2012, Mexico and the United States signed the “Agreement between the United Mexican States and the United States of America concerning Transboundary Hydrocarbon Reservoirs in the Gulf of Mexico”. The agreement will allow the safe, efficient, equitable, and environmentally responsible exploration and exploitation of shared transboundary hydrocarbon reservoirs, which may straddle the border between both countries in the Gulf of Mexico. The agreement was ratified by the Mexican Senate on April 12, 2012.
YPF and Repsol
On April 16, 2012, the President of the Republic of Argentina submitted to the Argentine Congress a bill “De la Soberanía Hidrocarburífera de la República Argentina” (Argentina’s Hydrocarbon Sovereignty). The agreement allows for the expropriation of 51% of the Class D shares of Yacimientos Petrolíferos Fiscales S.A. (YPF), all of which are owned, directly or indirectly, by Repsol YPF S.A. (Repsol).
On April 25, 2012, the Argentine Senate approved this bill, which was then sent to the Chamber of Deputies for its approval. Pursuant to the bill, the expropriation process will be governed by Argentina’s law on expropriation (Law No. 21499) and compensation will be determined by a national appraisal tribunal.
On April 17, 2012, Repsol announced that it considers the proposed expropriation of its YPF shares to be unlawful and indicated it would take all legal measures to preserve the value of its assets and the interests of its shareholders, and requested U.S.$10.5 billion in compensation from the Republic of Argentina for the YPF shares that would be expropriated by the bill.
As described in PEMEX’s 2011 year-end consolidated financial statements, a total of 57,204,240 Repsol shares all of which were acquired by PMI Holdings, B.V., were recorded, as an “available-for-sale investment”. The value is updated depending on market values.
(Ps. Bn) (U.S.$Bn)
Cost of the LPG subsidy 12.5 1.0
Costs not-recognized in the price mechanism of gasolines and diesel 2.4 0.2
Decrease in duties paid in recognition of operating cost and expenses
incurred in 201120.1 1.6
Labor obligations 18.0 1.4
Incremental taxes (7.7) (0.6)
Total 45 3.5
PEMEX
Economic impact by external and structural effects
First quarter (Jan.-
Mar.) 2012
PEMEX
PEMEX Results Report as of March 31, 2012 20 / 20 www.pemex.com
If you would like to be included in our distribution list, please access www.ri.pemex.com and then “Distribution List.” If you would like to contact us, please call or send an email to [email protected]. Telephone: (52 55) 1944 9700 Voice mail: (52 55) 1944 2500 ext. 59412
Follow us at @PEMEX_RI
Rolando Galindo Carmina Moreno Cristina Arista [email protected] [email protected] [email protected] Arturo Limón Ana Lourdes Benavides Cristina Pérez [email protected] [email protected] cristina.perez @pemex.com
Variations Cumulative and quarterly variations are calculated comparing the period with the same one of the previous year; unless specified otherwise. Rounding Numbers may not total due to rounding. Financial Information Excluding budgetary and volumetric information, the financial information included in this report and the annexes hereto is based on unaudited consolidated financial statements prepared in accordance with International Financial Reporting Standards as issued by the International Accounting Standards Board (“IFRS”), which PEMEX has adopted effective January 1, 2012. Information from prior periods has been retrospectively adjusted in certain accounts to make it comparable with the unaudited consolidated financial information under IFRS. For more information regarding the adoption of IFRS, see Note 20 to the consolidated financial statements included in Petróleos Mexicanos’ 2011 Form 20-F filed with the SEC on April 30, 2012. Adjusted EBITDA is a non-IFRS measure. We show a reconciliation of Adjusted EBITDA to net income in Table [34] of the annexes to this report. EBITDA is a non-U.S. GAAP and non-FRS measure issued by the CINIF. Budgetary information is based on standards from Mexican governmental accounting; therefore, it does not include information from the subsidiary companies of Petróleos Mexicanos. Foreign Exchange Conversions Convenience translations into U.S. dollars of amounts in Mexican pesos have been made at the established exchange rate, at March 31, 2012, of Ps. 12.8489= U.S.$1.00. Such translations should not be construed as a representation that the Mexican peso amounts have been or could be converted into U.S. dollars at the foregoing or any other rate. Fiscal Regime Since January 1, 2006, PEMEX has been subject to a new fiscal regime. Pemex-Exploration and Production’s (PEP) tax regime is governed by the Federal Duties Law, while the tax regimes of the other Subsidiary Entities continue to be governed by Mexico’s Income Tax Law. The most important duty paid by PEP is the Ordinary Hydrocarbons Duty (OHD), the tax base of which is a quasi operating profit. In addition to the payment of the OHD, PEP is required to pay other duties. Under PEMEX’s current fiscal regime, the Special Tax on Production and Services (IEPS) applicable to gasoline and diesel is regulated under the Federal Income Law. PEMEX is an intermediary between the Secretary of Finance and Public Credit (SHCP) and the final consumer; PEMEX retains the amount of IEPS and transfers it to the Federal Government. The IEPS rate is calculated as the difference between the retail or “final price,” and the “producer price.” The final prices of gasoline and diesel are established by the SHCP. PEMEX’s producer price is calculated in reference to that of an efficient refinery operating in the Gulf of Mexico. Since 2006, if the final price is lower than the producer price, the SHCP credits to PEMEX the difference among them. The IEPS credit amount is accrued, whereas the information generally presented by the SHCP is cash-flow. Hydrocarbon Reserves Pursuant to Article 10 of the Regulatory Law to Article 27 of the Political Constitution of the United Mexican States Concerning Petroleum Affairs, Pemex-Exploration and Production’s hydrocarbon reserves estimates as of January 1, 2012, were reviewed by the National Hydrocarbons Commission (which we refer to as the NHC). The NHC approved our hydrocarbon reserves estimates on February 24, 2012. The registration and publication by the Ministry of Energy, as provided in Article 33, paragraph XX of the Organic Law of the Federal Public Administration, is still pending. As of January 1, 2011, the SEC (Security and Exchange Commsision) changed its rules to permit oil and gas companies, in their filings with the SEC, to disclose not only proved reserves, but also probable reserves and possible reserves. In addition, we do not necessarily mean that the probable or possible reserves described herein meet the recoverability thresholds established by the SEC in its new definitions. Investors are urged to consider closely the disclosure in our Form 20-F and our annual report to the Mexican Banking and Securities Commission, available at http://www.pemex.com/.
Forward-looking statements This report contains forward-looking statements. We may also make written or oral forward-looking statements in our periodic reports to the CNBV (Comisión Nacional Bancaria y de Valores) the SEC, in our annual reports, in our offering circulars and prospectuses, in press releases and other written materials and in oral statements made by our officers, directors or employees to third parties. We may include forward-looking statements that address, among other things, our: drilling and other exploration activities; import and export activities; and projected and targeted capital expenditures ; costs; commitments; revenues; liquidity, etc. Actual results could differ materially from those projected in such forward-looking statements as a result of various factors that may be beyond our control. These factors include, but are not limited to: changes in international crude oil and natural gas prices; effects on us from competition; limitations on our access to sources of financing on competitive terms; significant developments in the global economy; significant economic or political developments in Mexico; developments affecting the energy sector; and changes in our regulatory environment.
Accordingly, you should not place undue reliance on these forward-looking statements. In any event, these statements speak only as of their dates, and we undertake no obligation to update or revise any of them, whether as a result of new information, future events or otherwise. These risks and uncertainties are more fully detailed in PEMEX’s most recent Form 20-F filing with the SEC (www.sec.gov), and the PEMEX prospectus filed with the CNBV and available through the Mexican Stock Exchange (www.bmv.com.mx). These factors could cause actual results to differ materially from those contained in any forward-looking statement. PEMEX PEMEX is Mexico’s national oil and gas company. Created in 1938, it is the exclusive producer of Mexico’s oil and gas resources. The operating subsidiary entities are Pemex-Exploration and Production, Pemex-Refining, Pemex-Gas and Basic Petrochemicals and Pemex-Petrochemicals. The principal subsidiary company is PMI Comercio Internacional, S.A. de C.V., Pemex’s international trading arm.