mathematics internal assessment - ib documents
TRANSCRIPT

MathematicsInternalAssessmentMay2019
TheNutritionalTransition: ProteinperCapitaandGDPperCapita

2
TableofContentsIntroduction 3StatementofTask 3
PlanofInvestigation 3
RawData 4
DataProcessingandAnalysis 5CalculationofMedian 5CalculationofMean 6CreationofScatterPlots 7Pearson’sProductMomentCorrelationCoefficient–PMCC 10
Conclusion 12
DiscussionofValidity 12
WorksCited 13
Appendix 14

3
IntroductionStatementofTaskAssomeonelivinginacountrywithampleaccesstoawidevarietyoffood,Ihavetheabilitytotailormydiettomypersonalpreferences.Foratleastoneweekwithinafortnight,mydietisentirelyvegetarianand/orvegan,yetitisstillbalancedwithanappropriateamountofmacronutrients(carbohydrates,proteins,fats)tomaintainahealthylifestyle.Inothercountriesaroundtheworld,starchesandcarbohydratesoftenformthebasisofdiets,asproteinismoredifficulttoaccess,thusdietcompositionaroundtheworldcanvarygreatly. InGeographyclass,welearnedabouttheconceptofthenutritionaltransition,whichtheorisesthatascountriesdevelopeconomically,theirmeatandproteinconsumptionandproductionwillalsoincrease,andoveralldietarydiversitywilldecrease(Codrington258).BRICScountriesareidentifiedascountrieswith“emergingeconomies”,andincludeBrazil,Russia,India,ChinaandSouthAfrica(“WhatisBRICS”).IhavechosentoinvestigateChinaandIndia,astheyarethetwoEastAsiancountriesamongstthisgroupandclosestingeographicallocationtoHongKong,thereforewithmorerelevancetotheareaIamin.Additionally,astheyhavetheworld’slargestpopulationsat1.4and1.3billionrespectively,anychangethattakesplacewithinthisdemographicofpeoplewillhavesignificantimplicationsfortheworld’sconsumptionofresources(Anil).Iwantedtoseeiftheconceptofthenutritionaltransitionwouldbedemonstratedintheevolvingdietarypatternsinthesetwoemerging,middleincomecountrieswithfastgrowingpopulations. PlanofInvestigationThisinvestigationwillexamineproteinconsumption(g/capita/day)asitchangesovertime,withrespecttoGDPpercapita(GrossDomesticProduct).TheinitialstepforthisinvestigationistoretrievedataforproteinpercapitaandGDPfromtheirrespectiveUNDatabases.DataforproteinindietpercapitawillbecollectedfromtheFoodandAgricultureOrganisationoftheUnitedNations.ThedataforGDPpercapita($PPP)willbecollectedfromUNData.Statisticsforproteinwillbetakenfrom1973toensuresufficientdataforgraphing-thiswillprovide40yearsworthofproteindata,andthus40datapointsforeachcountry.TheappropriatefilterswillbeusedontheFAOdatabasetoselectalleightfoodgroupsdeemedtohaveproteincontent.Forpercapitaprotein,outofavailablecategoriesontheFAOwebsite,animalproducts,pulses,treenuts,meat,eggs,milk,fish,seafoodwillbecountedasprotein.Thesubdividedproteincategorieswillthenbesummedtocreateatotalamountofproteinpercapitaperdayforeachyearbeginningin1973.Thisdataprocessingwillhappenforbothcountries.ThesetwodatasourceswereselectedastheUnitedNationskeepstrackofcomprehensivestatisticsfromhundredsofcountries,andisgloballyrecognisedforhavingextensive,detailedstatisticaldata. Toprocessdata,Iwillfirstcalculatethemedianproteinintakeforeachcountry,asitisthemiddleofthedatasetandwillnotbeskewedbytheoutliersatthebeginningandendofthedata.Themeanfortheentiredatasetisnotpreferableinthissituationasthedataoccursovertime,meaningthevaluemaybeimpactedbyoutliersandwillthusprovideaninaccuraterepresentationofthecountry.Next,asanalternativetomeasurechangesinproteinintakeovertime,the‘5yearmean’ofproteinintakeforperiodsoffiveyearswillbecalculated.Thesenumberswillprovideasummaryofhowproteinintakemayincreaseordecreaseovertime,whichcanthenbelinkedtochangesinGDP.SuchchangesinbothproteinintakeovertimeandproteinintakewithregardstoGDPwillbefurtherdemonstratedthroughtheuseofscatterplots.IwillplotbothChinaandIndia’sproteinconsumptionovertime,andthenplotproteinagainstGDP.Thesegraphswillprovideavisualrepresentationofpotentialrelationshipsbetweenthesevariablesandwillallowforinterpretationsoftrends.Finally,thePearson’sProductMomentCorrelationCoefficientorrvaluewillalsobecalculatedbyhandtodeterminewhetherthereisacorrelationbetweenthevariables,thussuggestingwhetherornotthe‘nutritiontransition’theorycanbesupportedbythesetwocountries.IwillcomparethecorrelationcoefficientsofbothIndiaandChinatodeterminethechangesindietcompositionandGDPovertimeinacountry.Basedonthefindingswithintheinvestigation,aconclusionwillbeformed.

4
AftercollectingtherawdatafromtheUNDatabases,Iorganisedthembycountryintothefollowingtablestomakeiteasierformysimpleandfurtherprocessestobeconducted.RawData*SeefulldataintheAppendix. ExcerptofData
CHINA
INDIAYear Sumofg/capita/day GDP/capita($PPP) Year Sumofg/capita/day GDP/capita($PPP)
1973 15.53
…
1973 20.20
…
1974 15.61 1974 19.54
1975 15.76 1975 25.35
1976 14.99 1976 28.40
1977 14.91 1977 27.17
1978 15.65 1978 26.42
1979 16.84 1979 26.33
1980 17.69 1980 22.94
1981 17.77 1981 20.59
1982 18.50 1982 26.41
1983 18.72 1983 27.91… … … … … …
1993 35.47 1461.61 1993 28.69 1290.351994 39.79 1668.58 1994 29.73 1378.501995 43.70 1869.47 1995 31.32 1485.031996 46.20 2070.77 1996 30.12 1595.711997 47.59 2277.21 1997 31.38 1657.411998 50.39 2458.63 1998 30.02 1746.491999 52.24 2664.49 1999 31.62 1895.442000 54.68 2933.31 2000 29.84 1977.652001 54.68 3226.85 2001 30.00 2083.822002 56.28 3551.66 2002 30.20 2159.362003 58.84 3961.27 2003 29.13 2336.472004 60.34 4455.21 2004 30.14 2549.272005 62.43 5092.56 2005 29.97 2830.412006 64.34 5883.72 2006 31.84 3138.632007 66.90 6863.98 2007 33.68 3484.882008 69.82 7635.07 2008 33.96 3637.642009 71.80 8374.43 2009 34.82 3920.012010 73.63 9333.12 2010 35.75 4315.602011 74.47 10384.37 2011 37.09 4635.882012 77.22 11351.06 2012 37.15 4916.492013 78.06 12367.97 2013 37.57 5250.51Afteramassingallmyrawdata,IdiscoveredUNdatabaseIcollectedtheGDPpercapitadatafromdidnotdisplayGDPdataforanycountriespriorto1990.Assuch,thismaybealimitationtobeinvestigatedfurtherbecauseitmeanswhencomparingGDPandproteinintake,Icanonlycompare23yearsworthofinformationratherthan40years.ThiscouldpreventamorecompletepatternofhowGDPandproteinintakearerelatedfrombeingdrawn.

5
Afterorganisingmydata,Iwillbeginprocessingandanalysingtheresults,beginningwiththecalculationofthemedian.Asmentionedbefore,themedianisthemiddleofadatasetandwillbecalculatedinthiscontexttoprovideaninitialsnapshotofChinaandIndia’slevelofproteinintakeatthesamepointintime.DataProcessingandAnalysisCalculationofMedianInordertocalculatethemedianforproteinintake,thedatawasorderedfromsmallesttolargest.MedianProteinIntake(g/capita/day)–ChinaAsmydatasethas40points,anevennumber,theaverageofthemiddletwopointswillbetakentoobtainthemedian.OrderedDataforProteinIntake:14.91,14.99,15.53,15.61,15.65,15.76,16.84,17.69,17.77,18.50,18.72,20.36,22.23,23.04,24.53,26.54,27.25,28.32,30.15,32.20,35.47,39.79,43.70,46.20,47.59,50.39,52.24,54.68,54.68,56.28,58.84,60.34,62.43,64.34,66.90,69.82,71.80,73.63,74.47,77.22,78.0635.47and39.79arethe20thand21stvalueswithinthesetof40values.AverageofTwoMiddleValues:
Themedianintakeofproteinfrom1973to2013inChinais37.63gramsofproteinpercapita.MedianProteinIntake(g/capita/day)–IndiaOrderedDataforProteinIntake:19.54,20.2,20.59,22.94,25.35,26.33,26.41,26.42,27.17,27.66,27.85,27.91,28.40,28.42,28.57,28.69,28.98,29.03,29.13,29.73,29.84,29.86,29.97,30.00,30.02,30.02,30.12,30.14,30.14,30.20,31.32,31.38,31.62,31.84,33.68,33.96,34.82,35.75,37.09,37.15,37.5729.84and29.86arethe20thand21stvalueswithinthesetof40values.AverageofTwoMiddleValues:
Themedianintakeofproteinfrom1973to2013inIndiais29.85gramsofproteinpercapita.ItisworthytonotethatChina’smedianproteinintakeis7.78gramshigherthanIndia’sattheexactsamepointintime:theyears1993-1994.Thisdiscrepancybetweenthetwocountrieswillbeshowntocontinuetowidenthroughlatermathematicalprocesses.Thereareseveralreasonsthatthiscouldoccur–themostprominentbeingChinawasmoreeconomicallyadvancedatthattimethanIndiawas,withrespectiveGDPsof564.3billionUSDand333billionUSD,andthusmayhavehadbetterresourcestoprovidefoodforthemajorityofthepopulation(“GDP(currentUS$)”).Therecommendedproteinintakeperpersonperdaydependsonseveralfactors,includingtheweight,height,ageandsexofanindividual(Pendick).A6montholdbabyrequiresdifferentamountsofproteinthanan80yearoldmaleweighing65kilos,thereforeitisimportanttonotethatthemedianproteinintakepercapitaforeachcountrymaybelowerorhigherdependingonthedemographicinquestion(“ProteinIntake”).AstheparticulardataIuseddoesnotprovidesuchdemographicspecifics,thismaybealimitationtothedatawhichwillbediscussedfurtherinthevaliditysection.
!(35.47+39.79)
2 =37.63
!(29.84+29.86)
2 =29.85

6
Whilemedianprovidesabriefcomparisonofproteinintakeinthetwocountriesatonespecificpointintime,Ichosetocalculatethemeanproteinintakeforeachcountryoverfiveyearperiods,inordertobegintoseehowproteinintakehaschangedovertime.CalculationofMean
Themean ofproteinintake(g/capita/day)is is ,where
Asthischosendatasetprogressesovertime,themeanproteinintakewascalculatedeveryfiveyears,ratherthanthemeanforthedataoverall,asthiswouldbeaffectedbyoutliers.ThiswascalculatedusingtheaboveformulainanExcelspreadsheet.MeanProteinIntake(g/capita/day)OverTime–ChinaandIndia
CHINAYear 1973-1977 1978-1982 1983-1987 1988-1992 1993-1997 1998-2002 2003-2007 2008-20135yearmean 15.34 17.31 21.78 28.89 42.55 53.65 53.65 53.65
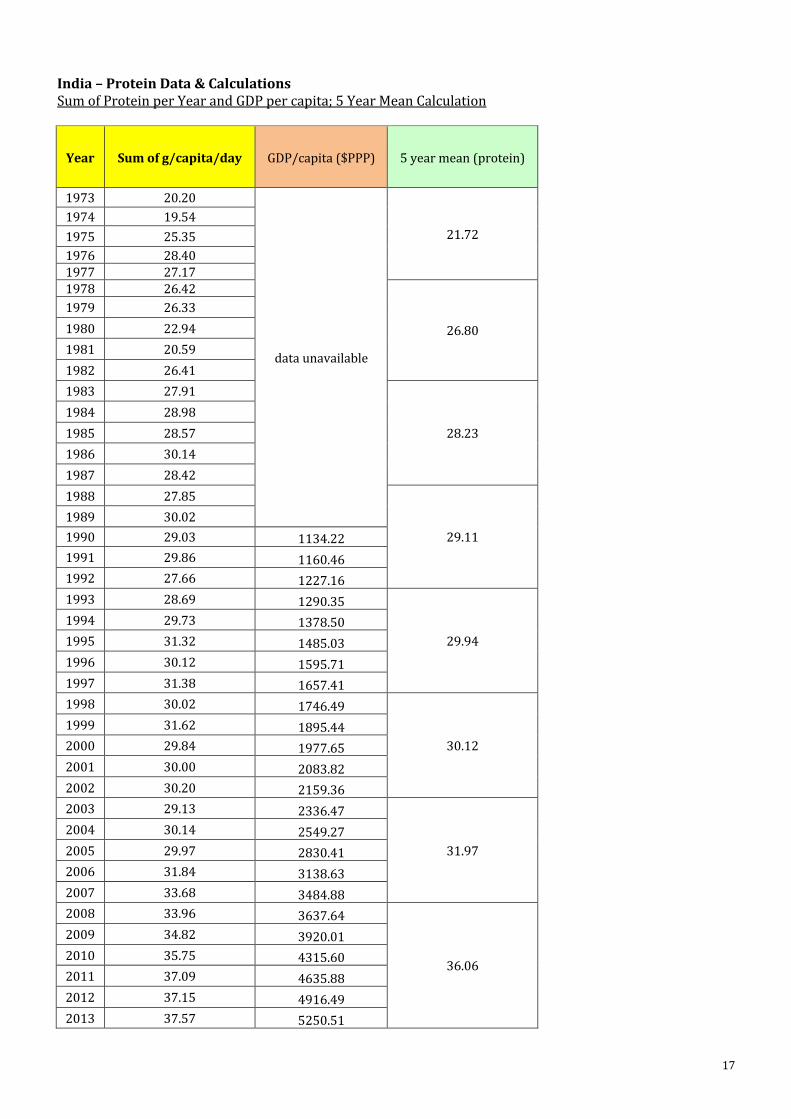
INDIAYear 1973-1977 1978-1982 1983-1987 1988-1992 1993-1997 1998-2002 2003-2007 2008-20135yearmean 21.72 26.80 28.23 29.11 29.94 30.12 31.97 36.06
SampleCalculationofMeanForthefirstfiveyearsof1973–1977:
The5yearmeanintakeinChinaovertimechangesfrom15.34to74.17gramsofproteinpercapita.Basedonthe5yearmeanalone,therearenodecreasesovertime,onlyincreases.Aftertheyears1988-1992,theproteinintakeforincreasesdramaticallyby8ormoregramspercapitaeveryfiveyearincrement.Forexample,themeangoesfrom53.65to62.57between1988and2007,representinganincreaseof8.92gramsofproteinoverthistimeperiod.The5yearmeanintakeinIndiaovertimechangesfrom21.72to36.06gramsofproteinpercapita.UnlikeChina,theincreasesinproteinovertimearenotasconsistentorasdramatic.Between1993-1997and1998-2002therewasonlya0.18gincreaseinprotein,whilebetween2003-2007and2008-2013theincreasewas4.09grams,onlyhalfasmuchincreaseasChinainanygivenfiveyearperiod.Whencomparingthemeanovertimeforthetwocountries,thedifferencebetweenChina’sfirstmeanandlastmeanisfargreaterthanthedifferencebetweenIndia’sfirstandlastmean.ThisindicatesthatthechangeinproteinpercapitaovertimeinChinahasamuchmoredramaticincrease,whereasIndiaonlyhasamoderateincreaseof14.34gramswithinthe40yearperiodofdataused.Asbothcountry’s5yearmeansultimatelyincreaseovertime,thisdoesbegintosuggestthattimeandproteinpercapitaindevelopingcountriesmayhavesomerelation.
!X !! X1 ,…,Xn !!X =
fixii=1
k
∑n !!
n= fii=1
k
∑
!
(15.53+15.61+15.76+14.99+14.91)5
=15.34

7
Thoughthe5yearmeanprovidessomepictureofthechangesinproteinintakeovertime,novisualtrendscanbeseenbasedonthisprocess.Therefore,thenextstepistoconstructscatterplotstofurtheranalyseandcomparethedata.CreationofScatterPlotsProteinIntake(g/capita/day)vs.Timevs.GDPinChinaIcreatedthefollowingscatterplotofproteinintakeovertimeinChinatobettervisualisethepossiblerelationshipbetweenthesetwovariables,withtimeastheindependentvariableandproteinintakeasthedependentvariable.
Figure1.ProteinIntake(gofprotein/capita/day)overTime(years)inChina.Basedonthisgraph,thereappearstobeapositivecorrelationbetweentimeandtheamountofprotein.Accordingtotheconceptofthenutritionaltransition,asacountrydevelopseconomicallyovertime,theamountofdisposableincomethepopulationhasshouldalsotheoreticallyincreaseduetothegrowingglobalmiddleclass(Rodhe).Asthisdevelopmentoccurs,thedietcompositionofthemajorityofindividualswillalsoshifttocontainingmoreprotein–thisisbecausetraditionally,grainsandcarbohydratesarecheapertomanufactureandtopurchase,whilemostformsofmeatproteinareconsideredahighordergoodindevelopingcountries(“WhatistheNutritionTransition?”)Chinathereforeappearstoexhibitsomeelementsofthisconceptoverthecourseoftime.TodeterminewhetherproteinintakeandGDPdemonstratearelationshipinChina,Igraphedboththosevariablestogetheraswell.GDPistheindependentvariable,whileproteinintakeisthedependentvariable.
10.0015.0020.0025.0030.0035.0040.0045.0050.0055.0060.0065.0070.0075.0080.0085.0090.00
1970 1973 1976 1979 1982 1985 1988 1991 1994 1997 2000 2003 2006 2009 2012 2015ProteinIntake(gofprotein/capita/day)
Year
ProteinIntake(gofprotein/capita/day)overTime(years)inChina
8
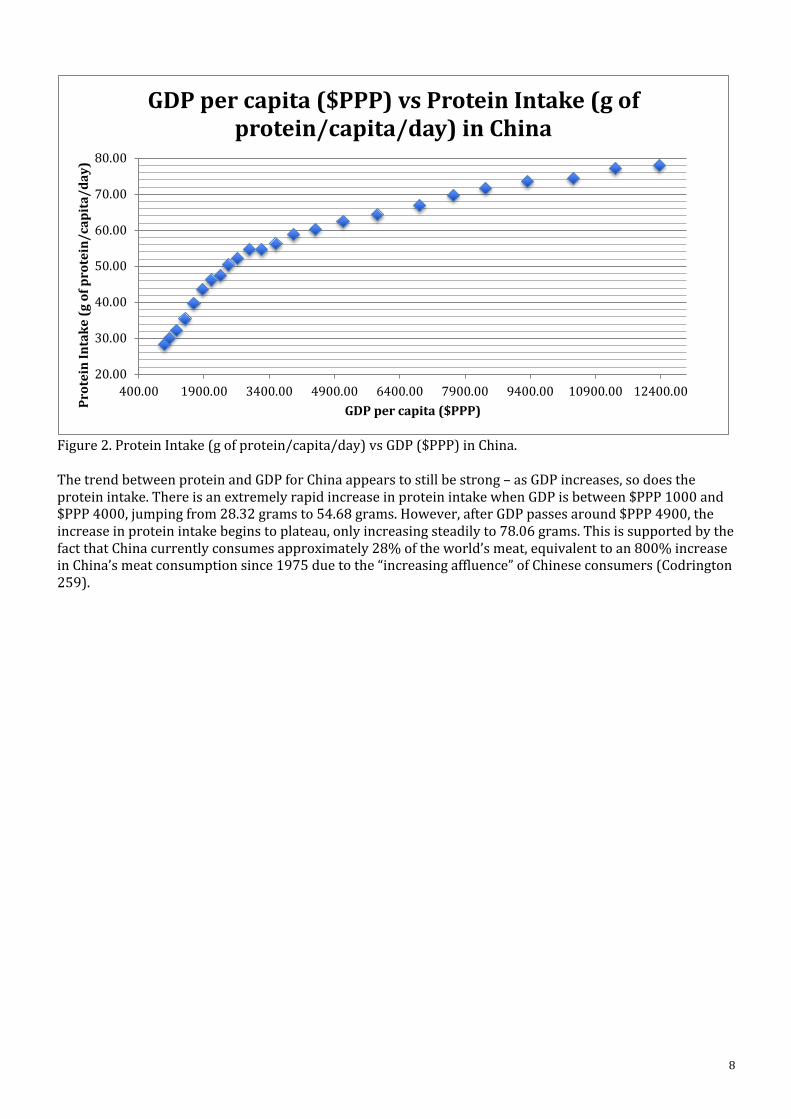
Figure2.ProteinIntake(gofprotein/capita/day)vsGDP($PPP)inChina.ThetrendbetweenproteinandGDPforChinaappearstostillbestrong–asGDPincreases,sodoestheproteinintake.ThereisanextremelyrapidincreaseinproteinintakewhenGDPisbetween$PPP1000and$PPP4000,jumpingfrom28.32gramsto54.68grams.However,afterGDPpassesaround$PPP4900,theincreaseinproteinintakebeginstoplateau,onlyincreasingsteadilyto78.06grams.ThisissupportedbythefactthatChinacurrentlyconsumesapproximately28%oftheworld’smeat,equivalenttoan800%increaseinChina’smeatconsumptionsince1975duetothe“increasingaffluence”ofChineseconsumers(Codrington259).
20.00
30.00
40.00
50.00
60.00
70.00
80.00
400.00 1900.00 3400.00 4900.00 6400.00 7900.00 9400.00 10900.00 12400.00
ProteinIntake(gofprotein/capita/day)
GDPpercapita($PPP)
GDPpercapita($PPP)vsProteinIntake(gofprotein/capita/day)inChina

9
ProteinIntake(g/capita/day)vs.Timevs.GDPinIndiaThesameprocesswasrepeatedwhengraphingthedataobtainedforIndia’sproteinintake.
Figure3.ProteinIntake(gofprotein/capita/day)overTime(years)inIndia.UnlikethegraphgeneratedforChina,theproteinintakeforIndiafluctuatesconsiderablymoreovertime,eventhoughthereappearstobeanultimateincreaseoverthefourdecadeperiod.TherelationshipbetweentimeandproteinforIndiacannotbedescribedasstrong;itisamoderatepositivecorrelationatbest.Notableanomaliesinthisgraphincludethetwolargedropsbetween1979and1982whereintakefallsto23gramspercapitaandbelow.Thesefluctationsinthedatamayindicatealessstablecountry–whethereconomically,politicallyorsocially,asthedecadepreceeding1981inIndiawasknownas‘thecrisisyears’(Panagariya).Thisresultedinaperiodofeconomicreformandincreasedstabilisedeconomicgrowth,contributingtotheoverallgrowthofproteinovertimeinIndia(Panagariya).Often,governmentpoliciesplayaroleindeterminingacountry’ssituation,whichcouldimpactthemoderatecorrelationseenhere.
Figure4.ProteinIntake(gofprotein/capita/day)vsGDP($PPP)inIndia.
15.0017.0019.0021.0023.0025.0027.0029.0031.0033.0035.0037.0039.00
1970 1973 1976 1979 1982 1985 1988 1991 1994 1997 2000 2003 2006 2009 2012 2015
ProteinIntake(gofprotein/capita/day)
Year
ProteinIntake(gofprotein/capita/day)overTime(years)inIndia
25.00
27.00
29.00
31.00
33.00
35.00
37.00
39.00
500.00 1500.00 2500.00 3500.00 4500.00 5500.00
ProteinIntake(gofprotein/capita/day)
GDPpercapita($PPP)
GDPpercapita($PPP)vsProteinIntake(gofprotein/capita/day)inIndia

10
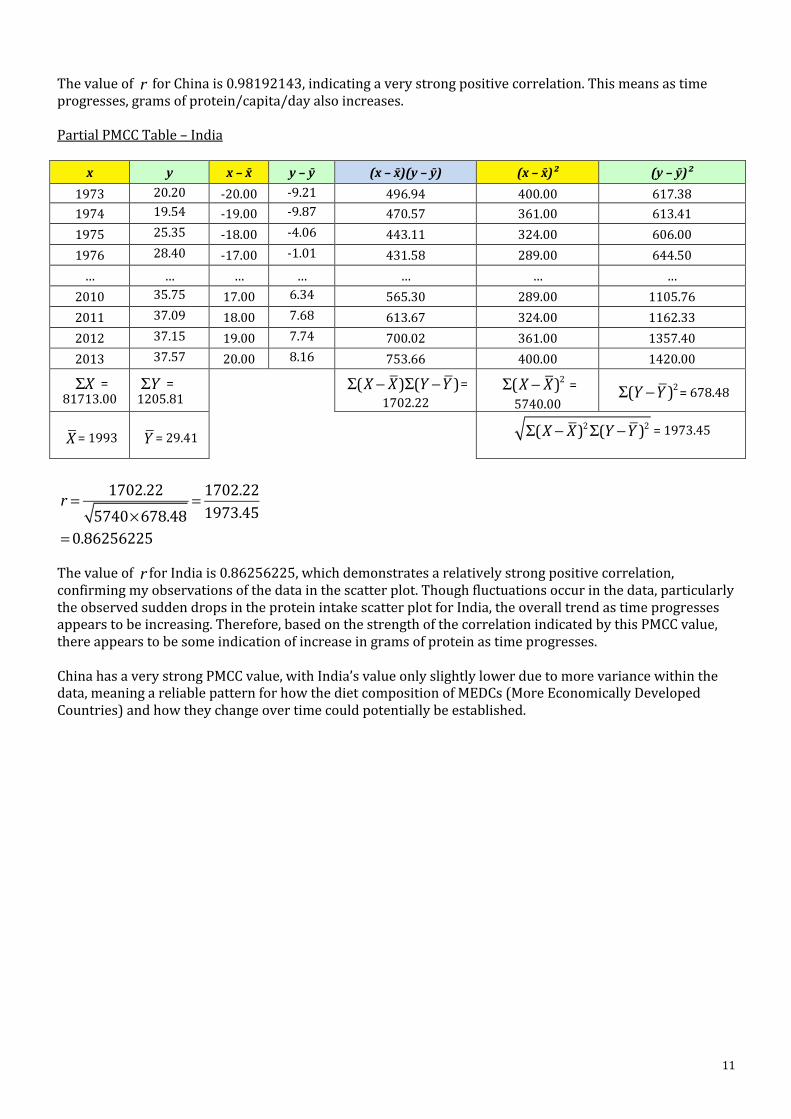
TherelationshipbetweenproteinintakeandGDPinIndiaisnotasstrongasthatinChina.ThedatapointsarefarmorespreadoutonceGDPincreasesbeyond$PPP3500,andveryclusteredwithin$PPP1000-2500.Visually,thoughtheremayappeartobeaneventualincreaseinproteinasGDPincreases,therelationshipseenonthisgraphisnowherenearasconsistentasthesamegraphforChina.Furthermore,itmustbenotedthatthexaxisscales(GDP)forthisgraphandthecorrespondingoneforChinaareextremelydifferent.ThiswasintentionallydoneasthevisualtrendindatapointsforIndiawouldbeverydifficulttointerpretifthescalewasthesameasChina’s,duetothefastdifferencesineachcountry’sGDP.ThoughscatterplotsallowedmetodetermineagoodvisualpictureofhowChinaandIndiacompareintermsofproteinintake,IwillnowcalculatePearson’sProductMomentCorrelationCoefficienttogainafinalconcreteunderstandingofchangesinproteinintakebetweenthesetwocountries.Pearson’sProductMomentCorrelationCoefficient–PMCCAsIamattemptingtofindthestrengthoftherelationshipbetweenthepassageoftimeandproteinintakepercapita,Icalculatedthecorrelationcoefficientforthesetwovariables.ThePMCCvaluewillthenallowmetocomparethestrengthofanylinearcorrelationsfoundinbothChinaandIndia’sdatasets.ThePMCCvaluewillbeofparticularnoteduetothedifferencesinthescatterplotsgeneratedaboveforChinaandIndia–Chinahadstrongcorrelationsbetweenprotein,GDPandtime,whileIndiahadanoticeablyspreadofdatapoints.ThefollowingformulaforcanbeplacedinatableinExceltocalculatethervalueforproteinpercapitaovertimebyhandforbothChinaandIndia,wherethe valuerepresentstheyear,andthe valuerepresentsgramsofproteinpercapita.
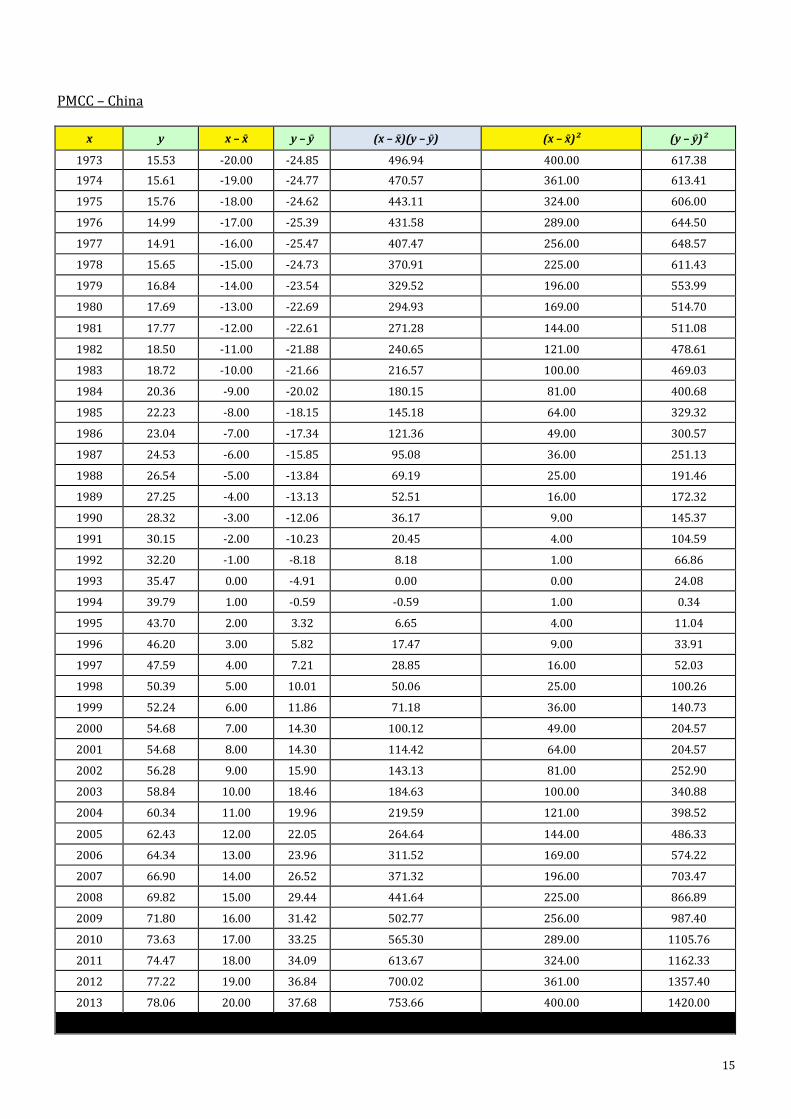
PartialPMCCTable–China
x y x–x̄ y–ȳ (x–x̄)(y–ȳ) (x–x̄)² (y–ȳ)²1973 15.53 -20.00 -24.85 496.94 400.00 617.381974 15.61 -19.00 -24.77 470.57 361.00 613.411975 15.76 -18.00 -24.62 443.11 324.00 606.001976 14.99 -17.00 -25.39 431.58 289.00 644.50… … … … … … …
2010 73.63 17.00 33.25 565.30 289.00 1105.762011 74.47 18.00 34.09 613.67 324.00 1162.332012 77.22 19.00 36.84 700.02 361.00 1357.402013 78.06 20.00 37.68 753.66 400.00 1420.00
=81713.00
=1655.46 =
10161.85=
5740.00=18658.65
=1993 =40.38 =10348.94
!X !Y
!!r = Σ (Χ− X )(Y −Y )
Σ(Χ− X )2Σ(Y −Y )2
!ΣX !ΣY !!Σ(X − X )Σ(Y −Y ) !!Σ(X − X )2
!!Σ(Y −Y )2
!X !Y !! Σ(X − X )2Σ(Y −Y )2
!!
r = 10161.855740×18658.65
= 10161.8510348.94=0.98192143
11
Thevalueof forChinais0.98192143,indicatingaverystrongpositivecorrelation.Thismeansastimeprogresses,gramsofprotein/capita/dayalsoincreases.PartialPMCCTable–India
x y x–x̄ y–ȳ (x–x̄)(y–ȳ) (x–x̄)² (y–ȳ)²1973 20.20 -20.00 -9.21 496.94 400.00 617.381974 19.54 -19.00 -9.87 470.57 361.00 613.411975 25.35 -18.00 -4.06 443.11 324.00 606.001976 28.40 -17.00 -1.01 431.58 289.00 644.50… … … … … … …
2010 35.75 17.00 6.34 565.30 289.00 1105.762011 37.09 18.00 7.68 613.67 324.00 1162.332012 37.15 19.00 7.74 700.02 361.00 1357.402013 37.57 20.00 8.16 753.66 400.00 1420.00
=81713.00
=1205.81 =
1702.22=
5740.00=678.48
=1993 =29.41 =1973.45
Thevalueof forIndiais0.86256225,whichdemonstratesarelativelystrongpositivecorrelation,confirmingmyobservationsofthedatainthescatterplot.Thoughfluctuationsoccurinthedata,particularlytheobservedsuddendropsintheproteinintakescatterplotforIndia,theoveralltrendastimeprogressesappearstobeincreasing.Therefore,basedonthestrengthofthecorrelationindicatedbythisPMCCvalue,thereappearstobesomeindicationofincreaseingramsofproteinastimeprogresses.ChinahasaverystrongPMCCvalue,withIndia’svalueonlyslightlylowerduetomorevariancewithinthedata,meaningareliablepatternforhowthedietcompositionofMEDCs(MoreEconomicallyDevelopedCountries)andhowtheychangeovertimecouldpotentiallybeestablished.
!r
!ΣX !ΣY !!Σ(X − X )Σ(Y −Y ) !!Σ(X − X )2
!!Σ(Y −Y )2
!X !Y !! Σ(X − X )2Σ(Y −Y )2
!!
r = 1702.225740×678.48
= 1702.221973.45=0.86256225
!r

12
ConclusionBasedontheresultsobtainedbythisinvestigation,itcanbeconcludedthatproteinintakecouldpotentiallybeassociatedwithchangeovertimeorincreasesinGDPineconomicallydevelopingcountries.Whileonecountry,China,showedverystrongpositivecorrelationsbetweenproteinintake,timeandGDP,Indiahadslightlyweakercorrelationsinfluencedbyfluctuationsindata.Thecalculationofthemedianshowstheinconsistencyinproteinintakebetweenthetwocountriesatthesamesnapshotintime.Chinahadamedianof37.63,whileIndiahadamedianof29.85.Themeanoverfiveyearswascalculatedtodeterminewhethertherewasindeedachangeinproteinintakeovertime.The5yearmeanisamethodofdeterminingaverageincreaseinproteinovertime,andbothcountriesshowincreaseovertime.Thescatterplotsdrawnwereabletovisualisethecontrastbetweenthestrengthofthecorrelations.ThedataforChinademonstratesastrongrelationshipbetweenproteinintake,GDPandchangesovertime,seenthroughthespreadofthedata.Contrastingly,theprocessesconductedforIndiademonstratepositivecorrelationswithlessstrengththanChina’sbetweenprotein,GDPandtime.Inconclusion,theresultsofthisinvestigationindicatetheconceptofthenutritionaltransitioncanbereasonablyobservedinthetwotargetcountries.However,itmustbeconsideredthatthoughbothIndiaandChinaareprominentdemographicpopulationsthatwillundergosignificantchangesinthecomingdecades,theprogressandtrendsseeninthiscountrycannotbeusedtopredictormodeltrendsindevelopmentforallothercountriesofmediumincome.DiscussionofValidityThevalidityofthisinvestigationmayhavebeeninfluencedbyothervariablesthatwerenotultimatelytested.Economicsarenottheonlyfactorthatplayintothechangingdietcompositionofacountry;policydecisionsorlevelofcorruptionareotherindicatorsthatcaninfluencethedevelopmentofacountry,andthustheproportionofproteininacitizen’sdiet.Externalfactorssuchasfinancialcrashesandlivestockfailureduetonaturaldisastersarealsounabletobefactoredintothedatainthisinvestigation.Assuchvariableswerenottakenintoaccount,theresultsfromtheinvestigationwerelimited.Secondly,onlytwocountrieswereselectedtobetested,astheyhavethelargestpopulationsandpredictedratesofgrowthbotheconomicallyanddemographically.However,theuniquesituationofChinaandIndiameansanyconclusionsdrawnfromthedatapresentedinthisreportmaynotapplytootherdevelopingcountries.Thislimitationappliesparticularlytocountrieswithfarsmallerpopulationsandlessfinancialstability.Thereforetheusefulnessandapplicabilityoftheseresultsinbeingabletodocumentasimilartrendinothercountriesisrestricted.Asmentionedinthebodyofthereport,thedataIused,despitebeingfromareputabledatabase,stillhadlimitations–namelytherewereexternalfactorsandvariablesnotincludedinthedatasetIwasanalysing.Fortheproteinpercapitadata,itwasestablishedthattheamountofproteinneededwouldvarygreatlydependingonthedemographicsofanindividual.Ifacountryhadalargelyyouthfulpopulation,theamountofproteinintakerequiredwoulddifferfromacountrywithanageingpopulation.TheproteindatacollectedfromtheFAOdidnotprovideoptionstodiffrentiatebasedondemographicsofage,genderetc,whichmayhaveprovidedamorecompletepictureofproteinintakeacrossanentirecountry.Asanextensiontothisproject,andtoreducethelimitationsdiscussed,itwouldbeinterestingtoconductfurtherinvestigationintotherelationshipsbetweenprotein,GDPandothervariableswithinspecificcountries.Forexample,Icouldcollectdatafromthegovernmentwebsiteofmycountryonthedietaryconsumptionhabits,income,andnationalityofvariousdistrictsinthearea.Iwouldthenbeabletoexamineanypatternsfoundbetweendifferencesinage,income,genderornationalitywhencomparedwithproteinintake.Icouldalsoinvestigatethechangesinproportionofothermacronutrients,notjustprotein,mostnotablyprocessedsugarsandfats.

13
Works Cited Anil, Alok Medikepura. "India and China Together Can Lead the Fourth Industrial Revolution. Here’s
How." World Economic Forum, 23 Nov. 2017, www.weforum.org/agenda/2017/11/india-and-
china-together-can-lead-the-fourth-industrial-revolution-here-s-how/.
Codrington, Stephen. Our Changing Planet. Solid Star Press Sydney, 2017.
Food and Agriculture Organization of the United Nations (FAO). Protein supply quantity (g/capita/day)
from 1973-2013 in China and India. Food and Agriculture Organisation of the United Nations,
www.fao.org/faostat/en/#data. Raw data.
"GDP (current US$)." The World Bank, World Bank Group,
data.worldbank.org/indicator/NY.GDP.MKTP.CD.
Gunnars, Kris. "Protein Intake – How Much Protein Should You Eat Per Day?" Healthline, Healthline
Media, July 2018, www.healthline.com/nutrition/how-much-protein-per-day.
Panagariya, Arvind. "India in the 1980s and 1990s: A Triumph of Reforms." U of Maryland, 2003.
International Monetary Fund, www.imf.org/external/np/apd/seminars/2003/newdelhi/pana.pdf.
Working paper.
Pendick, Daniel. "How Much Protein Do You Need Every Day?" Harvard Health Publishing, Harvard
University, June 2015, www.health.harvard.edu/blog/how-much-protein-do-you-need-every-day-
201506188096.
Rodhe, David. The Swelling Middle. 2012. Reuters, 2012, www.reuters.com/middle-class-infographic.
"What Is BRICS." BRICS 2017 China, BRICS2017.org, Jan. 2017,
brics2017.org/English/AboutBRICS/BRICS/.
"What Is the Nutrition Transition?" The Nutrition Transition, U of North Carolina Population Centre,
www.cpc.unc.edu/projects/nutrans/whatis.
The World Bank. GDP, PPP (current international $) in China and India. UNdata,
data.un.org/Data.aspx?q=GDP&d=WDI&f=Indicator_Code%3aNY.GDP.MKTP.PP.CD. Raw
data.

14
AppendixChina-Data&CalculationsSumofProteinperYearandGDPpercapita;5YearMeanCalculation
Year Sumofg/capita/day GDP/capita($PPP) 5yearmean(protein)
1973 15.53
dataunavailable
15.341974 15.611975 15.761976 14.991977 14.911978 15.65
17.311979 16.841980 17.691981 17.771982 18.501983 18.72
21.781984 20.361985 22.231986 23.041987 24.531988 26.54
28.891989 27.25
1990 28.32 986.571991 30.15 1099.051992 32.20 1268.271993 35.47 1461.61
42.551994 39.79 1668.581995 43.70 1869.471996 46.20 2070.771997 47.59 2277.211998 50.39 2458.63
53.651999 52.24 2664.492000 54.68 2933.312001 54.68 3226.852002 56.28 3551.662003 58.84 3961.27
62.572004 60.34 4455.212005 62.43 5092.562006 64.34 5883.722007 66.90 6863.982008 69.82 7635.07
74.17
2009 71.80 8374.432010 73.63 9333.122011 74.47 10384.372012 77.22 11351.062013 78.06 12367.97
15
PMCC–China
x y x–x̄ y–ȳ (x–x̄)(y–ȳ) (x–x̄)² (y–ȳ)²
1973 15.53 -20.00 -24.85 496.94 400.00 617.381974 15.61 -19.00 -24.77 470.57 361.00 613.41
1975 15.76 -18.00 -24.62 443.11 324.00 606.00
1976 14.99 -17.00 -25.39 431.58 289.00 644.50
1977 14.91 -16.00 -25.47 407.47 256.00 648.57
1978 15.65 -15.00 -24.73 370.91 225.00 611.43
1979 16.84 -14.00 -23.54 329.52 196.00 553.99
1980 17.69 -13.00 -22.69 294.93 169.00 514.70
1981 17.77 -12.00 -22.61 271.28 144.00 511.08
1982 18.50 -11.00 -21.88 240.65 121.00 478.61
1983 18.72 -10.00 -21.66 216.57 100.00 469.03
1984 20.36 -9.00 -20.02 180.15 81.00 400.68
1985 22.23 -8.00 -18.15 145.18 64.00 329.32
1986 23.04 -7.00 -17.34 121.36 49.00 300.57
1987 24.53 -6.00 -15.85 95.08 36.00 251.13
1988 26.54 -5.00 -13.84 69.19 25.00 191.46
1989 27.25 -4.00 -13.13 52.51 16.00 172.32
1990 28.32 -3.00 -12.06 36.17 9.00 145.37
1991 30.15 -2.00 -10.23 20.45 4.00 104.59
1992 32.20 -1.00 -8.18 8.18 1.00 66.86
1993 35.47 0.00 -4.91 0.00 0.00 24.08
1994 39.79 1.00 -0.59 -0.59 1.00 0.34
1995 43.70 2.00 3.32 6.65 4.00 11.04
1996 46.20 3.00 5.82 17.47 9.00 33.91
1997 47.59 4.00 7.21 28.85 16.00 52.03
1998 50.39 5.00 10.01 50.06 25.00 100.26
1999 52.24 6.00 11.86 71.18 36.00 140.73
2000 54.68 7.00 14.30 100.12 49.00 204.57
2001 54.68 8.00 14.30 114.42 64.00 204.57
2002 56.28 9.00 15.90 143.13 81.00 252.90
2003 58.84 10.00 18.46 184.63 100.00 340.88
2004 60.34 11.00 19.96 219.59 121.00 398.52
2005 62.43 12.00 22.05 264.64 144.00 486.33
2006 64.34 13.00 23.96 311.52 169.00 574.22
2007 66.90 14.00 26.52 371.32 196.00 703.47
2008 69.82 15.00 29.44 441.64 225.00 866.89
2009 71.80 16.00 31.42 502.77 256.00 987.40
2010 73.63 17.00 33.25 565.30 289.00 1105.76
2011 74.47 18.00 34.09 613.67 324.00 1162.33
2012 77.22 19.00 36.84 700.02 361.00 1357.40
2013 78.06 20.00 37.68 753.66 400.00 1420.00

16
=81713.00
=1655.46
=10161.85
=5740.00 =18658.65
=1993 =40.38 =10348.94
r=0.9819
!ΣX !ΣY !!Σ(X − X )Σ(Y −Y ) !!Σ(X − X )2 !!Σ(Y −Y )
2
!X !Y !! Σ(X − X )2Σ(Y −Y )2
17
India–ProteinData&CalculationsSumofProteinperYearandGDPpercapita;5YearMeanCalculation
Year Sumofg/capita/day GDP/capita($PPP) 5yearmean(protein)
1973 20.20
dataunavailable
21.721974 19.541975 25.351976 28.401977 27.171978 26.42
26.80
1979 26.331980 22.941981 20.591982 26.411983 27.91
28.231984 28.981985 28.571986 30.141987 28.421988 27.85
29.111989 30.021990 29.03 1134.221991 29.86 1160.461992 27.66 1227.161993 28.69 1290.35
29.941994 29.73 1378.501995 31.32 1485.031996 30.12 1595.711997 31.38 1657.411998 30.02 1746.49
30.121999 31.62 1895.442000 29.84 1977.652001 30.00 2083.822002 30.20 2159.362003 29.13 2336.47
31.972004 30.14 2549.272005 29.97 2830.412006 31.84 3138.632007 33.68 3484.882008 33.96 3637.64
36.06
2009 34.82 3920.012010 35.75 4315.602011 37.09 4635.882012 37.15 4916.492013 37.57 5250.51

18
PMCC–India
x y x–x̄ y–ȳ (x–x̄)(y–ȳ) (x–x̄)² (y–ȳ)²
1973 20.20 -20.00 -9.21 184.20 400.00 84.821974 19.54 -19.00 -9.87 187.53 361.00 97.42
1975 25.35 -18.00 -4.06 73.08 324.00 16.48
1976 28.40 -17.00 -1.01 17.17 289.00 1.02
1977 27.17 -16.00 -2.24 35.84 256.00 5.02
1978 26.42 -15.00 -2.99 44.85 225.00 8.94
1979 26.33 -14.00 -3.08 43.12 196.00 9.49
1980 22.94 -13.00 -6.47 84.11 169.00 41.86
1981 20.59 -12.00 -8.82 105.84 144.00 77.79
1982 26.41 -11.00 -3.00 33.00 121.00 9.00
1983 27.91 -10.00 -1.50 15.00 100.00 2.25
1984 28.98 -9.00 -0.43 3.87 81.00 0.18
1985 28.57 -8.00 -0.84 6.72 64.00 0.71
1986 30.14 -7.00 0.73 -5.11 49.00 0.53
1987 28.42 -6.00 -0.99 5.94 36.00 0.98
1988 27.85 -5.00 -1.56 7.80 25.00 2.43
1989 30.02 -4.00 0.61 -2.44 16.00 0.37
1990 29.03 -3.00 -0.38 1.14 9.00 0.14
1991 29.86 -2.00 0.45 -0.90 4.00 0.20
1992 27.66 -1.00 -1.75 1.75 1.00 3.06
1993 28.69 0.00 -0.72 0.00 0.00 0.52
1994 29.73 1.00 0.32 0.32 1.00 0.10
1995 31.32 2.00 1.91 3.82 4.00 3.65
1996 30.12 3.00 0.71 2.13 9.00 0.50
1997 31.38 4.00 1.97 7.88 16.00 3.88
1998 30.02 5.00 0.61 3.05 25.00 0.37
1999 31.62 6.00 2.21 13.26 36.00 4.88
2000 29.84 7.00 0.43 3.01 49.00 0.18
2001 30.00 8.00 0.59 4.72 64.00 0.35
2002 30.20 9.00 0.79 7.11 81.00 0.62
2003 29.13 10.00 -0.28 -2.80 100.00 0.08
2004 30.14 11.00 0.73 8.03 121.00 0.53
2005 29.97 12.00 0.56 6.72 144.00 0.31
2006 31.84 13.00 2.43 31.59 169.00 5.90
2007 33.68 14.00 4.27 59.78 196.00 18.23
2008 33.96 15.00 4.55 68.25 225.00 20.70
2009 34.82 16.00 5.41 86.56 256.00 29.27
2010 35.75 17.00 6.34 107.78 289.00 40.20
2011 37.09 18.00 7.68 138.24 324.00 58.98
2012 37.15 19.00 7.74 147.06 361.00 59.91
2013 37.57 20.00 8.16 163.20 400.00 66.59

19
=81713.00
=1205.81
=1702.22
=5740.00 =678.48
=1993 =29.41
=1973.45
r=0.8625
!ΣX !ΣY !!Σ(X − X )Σ(Y −Y ) !!Σ(X − X )2 !!Σ(Y −Y )
2
!X !Y !! Σ(X − X )2Σ(Y −Y )2