ib science internal assessment guide
TRANSCRIPT

Version 1.2
IB SCIENCE Internal Assessment Guide
Page 2 of 15
Table of Contents
Page Section Title
2 Introduction
3 Personal Engagement
4 Exploration
8 Analysis
11 Evaluation
14 Communication
15 Additional Writing Tips
Introduction
The major piece of assessment in Group 4 subjects, in addition to the exams, is the internal assessment (IA) investigation.
Investigations could be centered on lab work, database analysis or a hybrid of both.
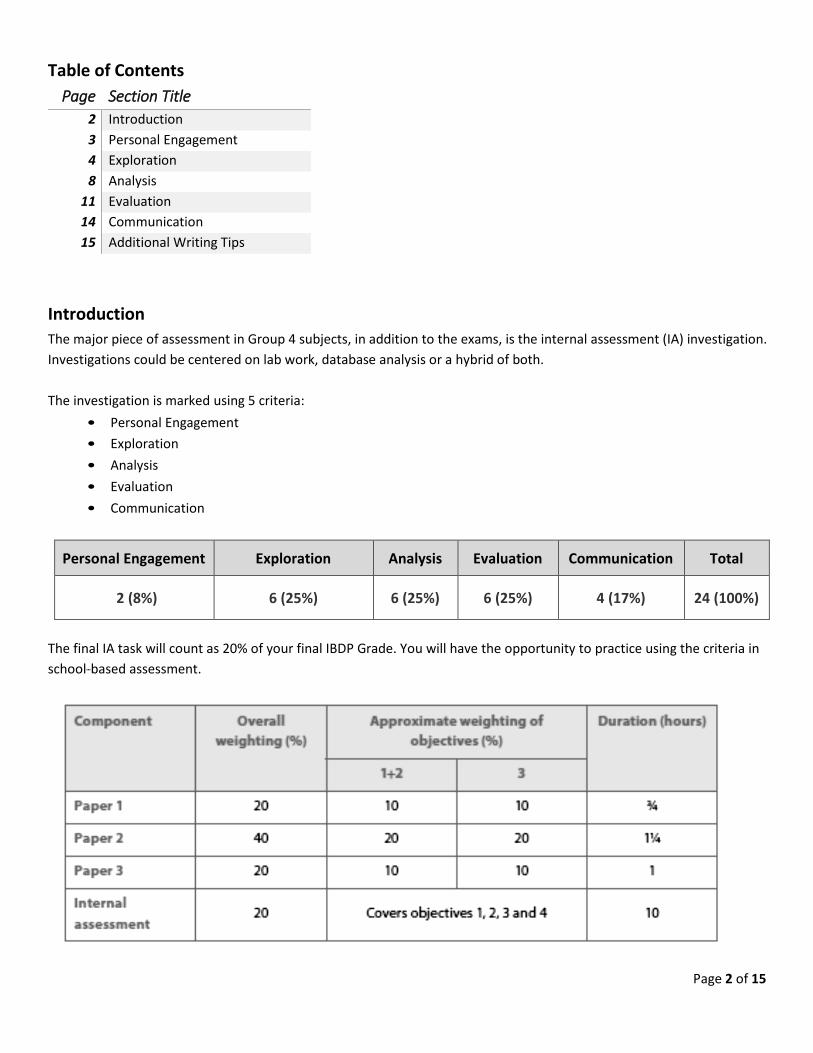
The investigation is marked using 5 criteria:
• Personal Engagement
• Exploration
• Analysis
• Evaluation
• Communication
Personal Engagement
Exploration
Analysis
Evaluation
Communication
Total
2 (8%)
6 (25%)
6 (25%)
6 (25%)
4 (17%)
24 (100%)
The final IA task will count as 20% of your final IBDP Grade. You will have the opportunity to practice using the criteria in
school-based assessment.
Page 3 of 15
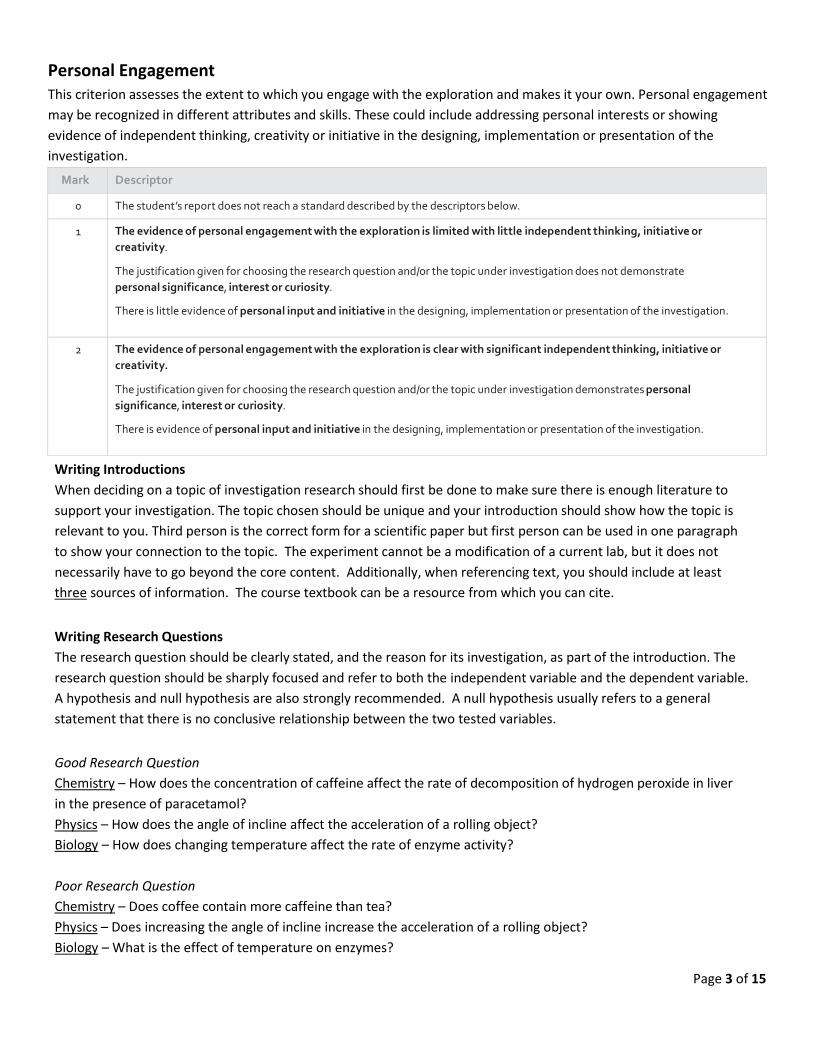
Personal Engagement This criterion assesses the extent to which you engage with the exploration and makes it your own. Personal engagement
may be recognized in different attributes and skills. These could include addressing personal interests or showing
evidence of independent thinking, creativity or initiative in the designing, implementation or presentation of the
investigation.
Mark Descriptor
0 The student’s report does not reach a standard described by the descriptors below.
1 The evidence of personal engagement with the exploration is limited with little independent thinking, initiative or
creativity.
The justification given for choosing the research question and/or the topic under investigation does not demonstrate
personal significance, interest or curiosity.
There is little evidence of personal input and initiative in the designing, implementation or presentation of the investigation.
2 The evidence of personal engagement with the exploration is clear with significant independent thinking, initiative or
creativity.
The justification given for choosing the research question and/or the topic under investigation demonstrates personal
significance, interest or curiosity.
There is evidence of personal input and initiative in the designing, implementation or presentation of the investigation.
Writing Introductions
When deciding on a topic of investigation research should first be done to make sure there is enough literature to
support your investigation. The topic chosen should be unique and your introduction should show how the topic is
relevant to you. Third person is the correct form for a scientific paper but first person can be used in one paragraph
to show your connection to the topic. The experiment cannot be a modification of a current lab, but it does not
necessarily have to go beyond the core content. Additionally, when referencing text, you should include at least
three sources of information. The course textbook can be a resource from which you can cite.
Writing Research Questions
The research question should be clearly stated, and the reason for its investigation, as part of the introduction. The
research question should be sharply focused and refer to both the independent variable and the dependent variable.
A hypothesis and null hypothesis are also strongly recommended. A null hypothesis usually refers to a general
statement that there is no conclusive relationship between the two tested variables.
Good Research Question
Chemistry – How does the concentration of caffeine affect the rate of decomposition of hydrogen peroxide in liver
in the presence of paracetamol?
Physics – How does the angle of incline affect the acceleration of a rolling object?
Biology – How does changing temperature affect the rate of enzyme activity?
Poor Research Question
Chemistry – Does coffee contain more caffeine than tea?
Physics – Does increasing the angle of incline increase the acceleration of a rolling object?
Biology – What is the effect of temperature on enzymes?
Page 4 of 15
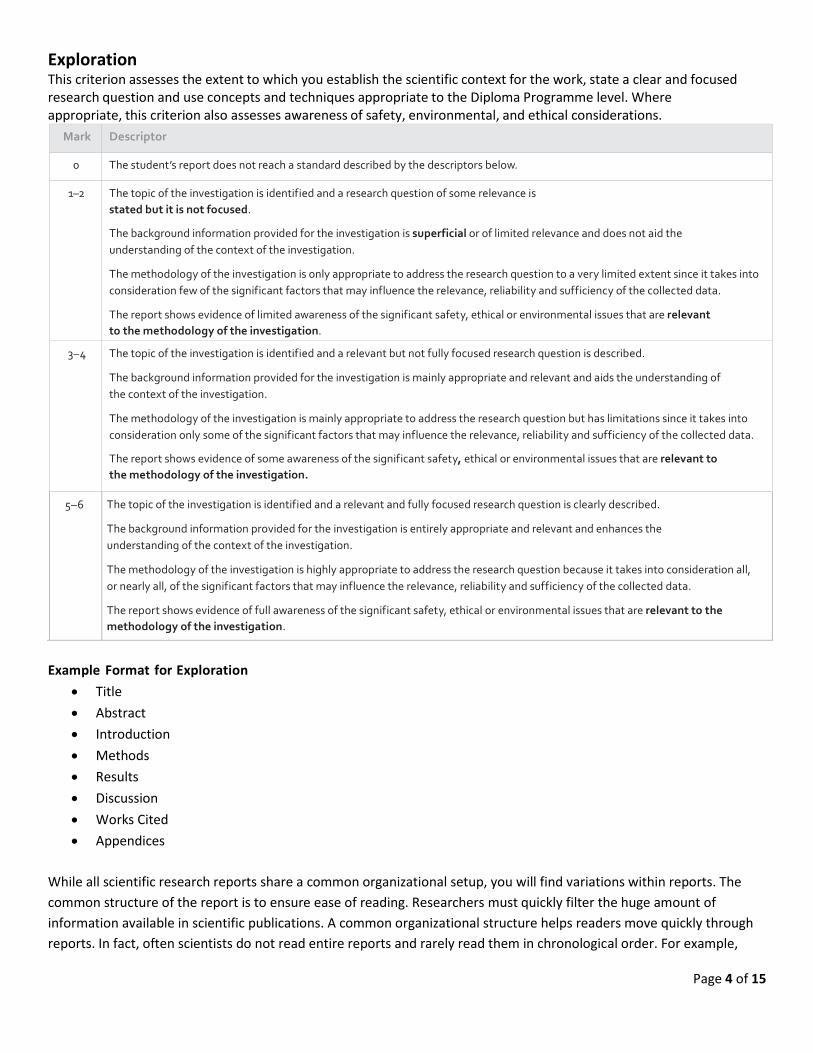
Exploration This criterion assesses the extent to which you establish the scientific context for the work, state a clear and focused research question and use concepts and techniques appropriate to the Diploma Programme level. Where appropriate, this criterion also assesses awareness of safety, environmental, and ethical considerations. Mark Descriptor
0 The student’s report does not reach a standard described by the descriptors below.
1–2 The topic of the investigation is identified and a research question of some relevance is
stated but it is not focused.
The background information provided for the investigation is superficial or of limited relevance and does not aid the
understanding of the context of the investigation.
The methodology of the investigation is only appropriate to address the research question to a very limited extent since it takes into
consideration few of the significant factors that may influence the relevance, reliability and sufficiency of the collected data.
The report shows evidence of limited awareness of the significant safety, ethical or environmental issues that are relevant
to the methodology of the investigation.
3–4 The topic of the investigation is identified and a relevant but not fully focused research question is described.
The background information provided for the investigation is mainly appropriate and relevant and aids the understanding of
the context of the investigation.
The methodology of the investigation is mainly appropriate to address the research question but has limitations since it takes into
consideration only some of the significant factors that may influence the relevance, reliability and sufficiency of the collected data.
The report shows evidence of some awareness of the significant safety, ethical or environmental issues that are relevant to
the methodology of the investigation.
5–6 The topic of the investigation is identified and a relevant and fully focused research question is clearly described. The background information provided for the investigation is entirely appropriate and relevant and enhances the
understanding of the context of the investigation. The methodology of the investigation is highly appropriate to address the research question because it takes into consideration all,
or nearly all, of the significant factors that may influence the relevance, reliability and sufficiency of the collected data. The report shows evidence of full awareness of the significant safety, ethical or environmental issues that are relevant to the
methodology of the investigation.
Example Format for Exploration
Title
Abstract
Introduction
Methods
Results
Discussion
Works Cited
Appendices
While all scientific research reports share a common organizational setup, you will find variations within reports. The
common structure of the report is to ensure ease of reading. Researchers must quickly filter the huge amount of
information available in scientific publications. A common organizational structure helps readers move quickly through
reports. In fact, often scientists do not read entire reports and rarely read them in chronological order. For example,
Page 5 of 15
they may skip directly to the findings and not read the methods. The discrete sections of a report also force the
researcher to carefully distinguish the various aspects of the experiment. For example, what is a result and what is your
interpretation of that finding?
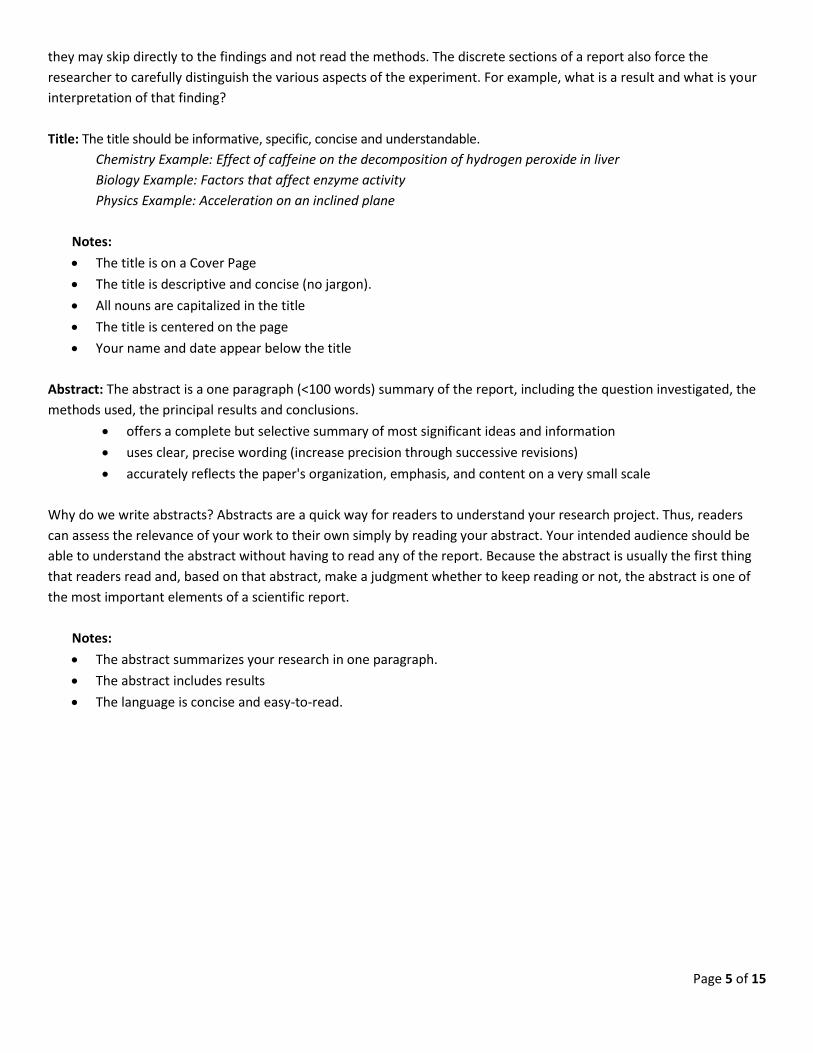
Title: The title should be informative, specific, concise and understandable.
Chemistry Example: Effect of caffeine on the decomposition of hydrogen peroxide in liver
Biology Example: Factors that affect enzyme activity
Physics Example: Acceleration on an inclined plane
Notes:
The title is on a Cover Page
The title is descriptive and concise (no jargon).
All nouns are capitalized in the title
The title is centered on the page
Your name and date appear below the title
Abstract: The abstract is a one paragraph (<100 words) summary of the report, including the question investigated, the
methods used, the principal results and conclusions.
offers a complete but selective summary of most significant ideas and information
uses clear, precise wording (increase precision through successive revisions)
accurately reflects the paper's organization, emphasis, and content on a very small scale
Why do we write abstracts? Abstracts are a quick way for readers to understand your research project. Thus, readers
can assess the relevance of your work to their own simply by reading your abstract. Your intended audience should be
able to understand the abstract without having to read any of the report. Because the abstract is usually the first thing
that readers read and, based on that abstract, make a judgment whether to keep reading or not, the abstract is one of
the most important elements of a scientific report.
Notes:
The abstract summarizes your research in one paragraph.
The abstract includes results
The language is concise and easy-to-read.

Page 6 of 15
Introduction: The introduction is a brief section (no more than 1 page usually) designed to inform the reader of the
relevance of your research and includes a short history or relevant background that leads to a statement of the
problem that is being addressed. Introductions usually follow a funnel style, starting broadly and then narrowing.
They funnel from something known, to something unknown, to the question the paper is asking. It also explains
why the topic is worthy of investigation and give sufficient background information and must include the following
information:
Research Question: Must refer to both the independent and the dependent variables
Independent Variable: What are you going to change/manipulate?
Dependent Variable: What will change because the independent variable is changed?
Controlled Variable: What variables will you keep constant?
Notes
Focuses on the overall issue, problem, or question that your research addresses. What is the context of your
study (i.e. how does this relate to other research)?
Provides sufficient context and background for the reader to understand and evaluate your research, including
appropriate visual aids (drawings, etc.). Warning: Don't be too long-winded here. You do not need an entire
history of frog biology, for example.
Defines terms which your reader may not know.
Defines abbreviations that will be used in the report. For example, "The compound action potential (CAP) . . ." In
following instances, you may use "CAP" in place of compound action potential.
Develops the rationale for your work: poses questions or research problems and outlines your main research
focus. What was your research question?
Materials: The materials section includes the number and type (volume/dimensions) of equipment required.
Additionally, make sure that uncertainties are noted on all measuring equipment and, if you are using solutions,
make sure to include concentrations.
Safety instructions: If you are using chemicals, refer to the Material Safety Data Sheets (MSDS) and make note of any safety
equipment or special instructions (i.e. hot equipment, keep in fume hood, reacts with plastic, etc.) that will be required for
your experiment. Please also make note if safety goggles or safety glasses are necessary.

Page 7 of 15
Method: In the method section, use step by step instructions (numbered) and make sure to include the concentrations
and exact volumes to be used. You should make references to the controls if deemed necessary and ensure sufficient
collection of relevant data by replicating 3-5 times (based on what’s needed) and allowing for at least 5 data points if
investigating a trend. It should also include a diagram/s of your equipment set up. Be precise, complete, and concise.
Include only relevant information—no unnecessary details, anecdotes, excuses, or confessions. You should also include
a procedure on how to analyze your data including relevant mathematical equations.
Notes:
Details experimental procedures and describes your specific experiment method.
Creates labeled diagrams of experimental setup, if appropriate
Describes techniques for tracking functional variables (timing, temperature, humidity, etc.) and rational for
tracking those variables
Explains analytical techniques used
Includes reasons why you took certain measurements or chose to use certain equations.
Does NOT tell us what was discovered. That information should be in the results section.
Broken down into subsections, if appropriate.
Includes visuals that are labeled and referenced in the text. Tables and graphs are numbered consecutively in
the report (Table 1, Table 2, etc.). Tables and graphs include a title.
Visuals are large enough to read the units and each visual does not extend across more than one page.
Decimal quantities include a 0 before the decimal point. For example, 0.05.
Notice the format of mathematical expressions. Equations are spaced apart from the text.
Exploration Checklist
o Is the research question carefully worded?
o Does the research question include the dependent and independent variable?
o Is the independent variable clearly stated?
o Does the dependent variable directly stem from the independent variable?
o Are all controlled variables clearly stated and explained as to how they remain constant?
o Are the experimental groups and control groups evident?
o Does the control group differ from the experimental group(s) only by the independent variable?
o Are the independent and the dependent variables quantitative?
o Is the independent variable set up so there are 5 intervals?
o Are there 3-5 trials at each interval of the independent variable?
o Are regular measurements of controlled variables included?
o Is there a clear picture or diagram of the experimental apparatus?
o Are all materials used clearly and precisely listed?
o Is error (uncertainties) taken into account?
o Are proper safety procedures and notes about appropriate safety equipment included?

Page 8 of 15
Analysis This criterion assesses the extent to which you report provides evidence that you have selected, recorded, processed
and interpreted the data in ways that are relevant to the research question and can support a conclusion.
Mark Descriptor
0 The student’s report does not reach a standard described by the descriptors below.
1–2
The report includes insufficient relevant raw data to support a valid conclusion to the research question.
Some basic data processing is carried out but is either too inaccurate or too insufficient to lead to a valid conclusion.
The report shows evidence of little consideration of the impact of measurement uncertainty on the analysis.
The processed data is incorrectly or insufficiently interpreted so that the conclusion is invalid or very incomplete.
3–4 The report includes relevant but incomplete quantitative and qualitative raw data that could support a simple or partially valid
conclusion to the research question.
Appropriate and sufficient data processing is carried out that could lead to a broadly valid conclusion but there are significant
inaccuracies and inconsistencies in the processing.
The report shows evidence of some consideration of the impact of measurement uncertainty on the analysis.
The processed data is interpreted so that a broadly valid but incomplete or limited conclusion to the research question can be
deduced.
5–6 The report includes sufficient relevant quantitative and qualitative raw data that could support a detailed and valid conclusion
to the research question.
Appropriate and sufficient data processing is carried out with the accuracy required to enable a conclusion to the research question to be drawn
that is fully consistent with the experimental data.
The report shows evidence of full and appropriate consideration of the impact of measurement uncertainty on the
analysis.
The processed data is correctly interpreted so that a completely valid and detailed conclusion to the research question can be
deduced.
Recording Raw Data
Record ALL relevant data and observations using a table
o Include quantitative data (e.g, measurements of temperature, mass, volume, absorbance, pressure – all
with the appropriate units)
o Include qualitative observations before and after the experiment. (e.g. “the final color at the endpoint
was a faint pink”, “during the reaction, the bromine water changed from being a bright yellow to solution
of no color”) and any anomalies with data or uncertainties should also be noted.
Include uncertainty of measurements which can be estimated or is available from the measuring device
Within tables of quantitative data, write the units and uncertainty in the column heading
Significant digits in the data and the uncertainty in the data must be consistent
Use the same number of decimal places for your raw data
You are not expected to state the level of precision in the concentration of a solution prepared for you
Page 9 of 15
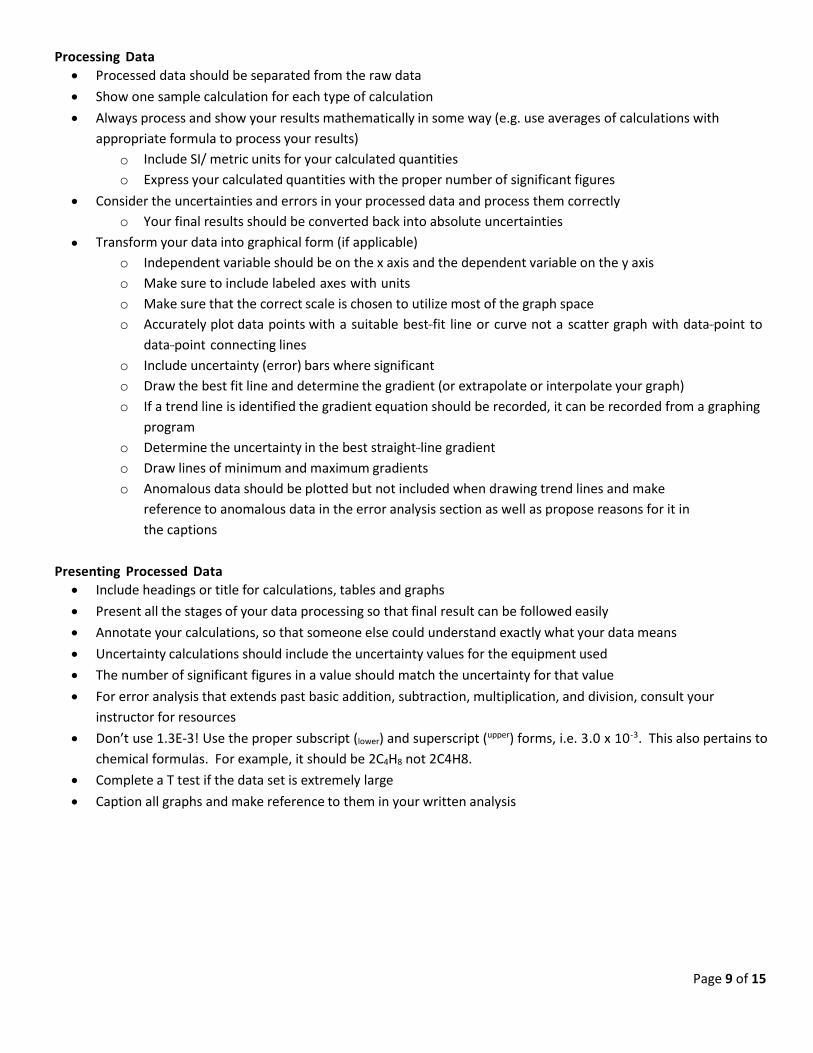
Processing Data
Processed data should be separated from the raw data
Show one sample calculation for each type of calculation
Always process and show your results mathematically in some way (e.g. use averages of calculations with
appropriate formula to process your results)
o Include SI/ metric units for your calculated quantities
o Express your calculated quantities with the proper number of significant figures
Consider the uncertainties and errors in your processed data and process them correctly
o Your final results should be converted back into absolute uncertainties
Transform your data into graphical form (if applicable)
o Independent variable should be on the x axis and the dependent variable on the y axis
o Make sure to include labeled axes with units
o Make sure that the correct scale is chosen to utilize most of the graph space
o Accurately plot data points with a suitable best-fit line or curve not a scatter graph with data-point to
data-point connecting lines
o Include uncertainty (error) bars where significant
o Draw the best fit line and determine the gradient (or extrapolate or interpolate your graph)
o If a trend line is identified the gradient equation should be recorded, it can be recorded from a graphing
program
o Determine the uncertainty in the best straight-line gradient
o Draw lines of minimum and maximum gradients
o Anomalous data should be plotted but not included when drawing trend lines and make
reference to anomalous data in the error analysis section as well as propose reasons for it in
the captions
Presenting Processed Data
Include headings or title for calculations, tables and graphs
Present all the stages of your data processing so that final result can be followed easily
Annotate your calculations, so that someone else could understand exactly what your data means
Uncertainty calculations should include the uncertainty values for the equipment used
The number of significant figures in a value should match the uncertainty for that value
For error analysis that extends past basic addition, subtraction, multiplication, and division, consult your
instructor for resources
Don’t use 1.3E-3! Use the proper subscript (lower) and superscript (upper) forms, i.e. 3.0 x 10⁻³. This also pertains to
chemical formulas. For example, it should be 2C4H8 not 2C4H8.
Complete a T test if the data set is extremely large
Caption all graphs and make reference to them in your written analysis
Page 10 of 15
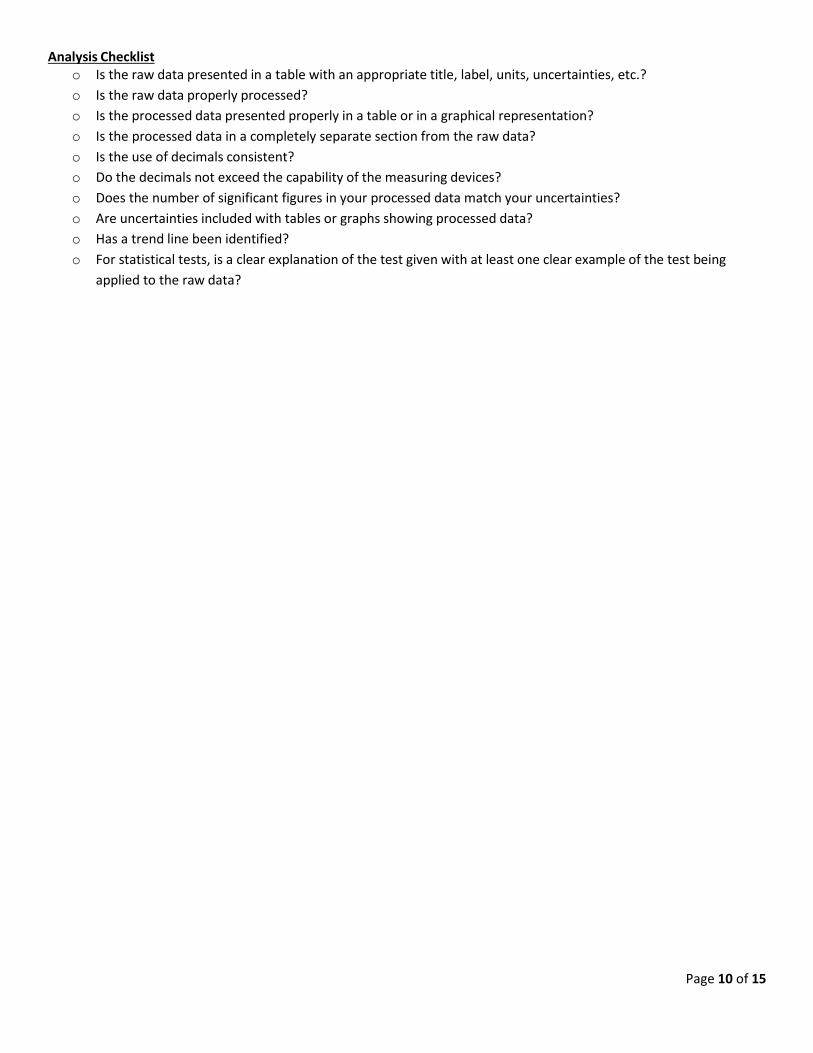
Analysis Checklist o Is the raw data presented in a table with an appropriate title, label, units, uncertainties, etc.?
o Is the raw data properly processed?
o Is the processed data presented properly in a table or in a graphical representation?
o Is the processed data in a completely separate section from the raw data?
o Is the use of decimals consistent?
o Do the decimals not exceed the capability of the measuring devices?
o Does the number of significant figures in your processed data match your uncertainties?
o Are uncertainties included with tables or graphs showing processed data?
o Has a trend line been identified?
o For statistical tests, is a clear explanation of the test given with at least one clear example of the test being
applied to the raw data?
Page 11 of 15
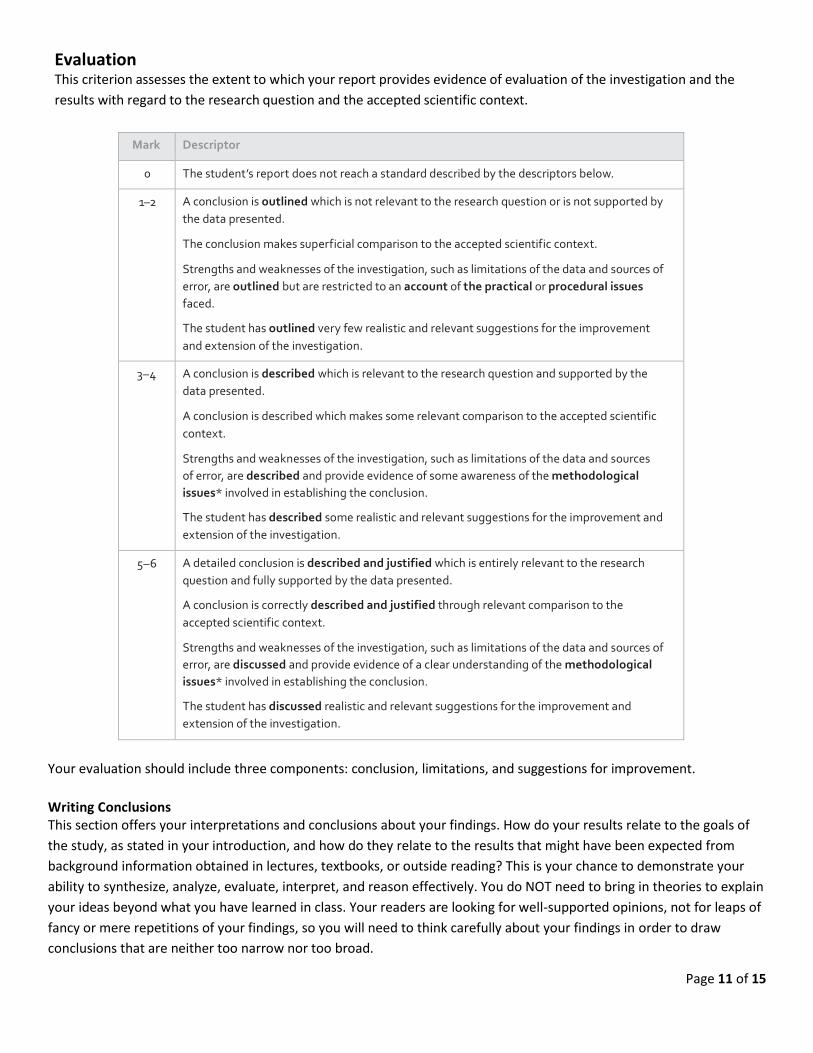
Evaluation This criterion assesses the extent to which your report provides evidence of evaluation of the investigation and the
results with regard to the research question and the accepted scientific context.
Mark Descriptor
0 The student’s report does not reach a standard described by the descriptors below.
1–2 A conclusion is outlined which is not relevant to the research question or is not supported by
the data presented.
The conclusion makes superficial comparison to the accepted scientific context.
Strengths and weaknesses of the investigation, such as limitations of the data and sources of
error, are outlined but are restricted to an account of the practical or procedural issues
faced.
The student has outlined very few realistic and relevant suggestions for the improvement
and extension of the investigation.
3–4 A conclusion is described which is relevant to the research question and supported by the
data presented.
A conclusion is described which makes some relevant comparison to the accepted scientific
context.
Strengths and weaknesses of the investigation, such as limitations of the data and sources
of error, are described and provide evidence of some awareness of the methodological
issues* involved in establishing the conclusion.
The student has described some realistic and relevant suggestions for the improvement and
extension of the investigation.
5–6 A detailed conclusion is described and justified which is entirely relevant to the research
question and fully supported by the data presented.
A conclusion is correctly described and justified through relevant comparison to the
accepted scientific context.
Strengths and weaknesses of the investigation, such as limitations of the data and sources of
error, are discussed and provide evidence of a clear understanding of the methodological
issues* involved in establishing the conclusion.
The student has discussed realistic and relevant suggestions for the improvement and
extension of the investigation.
Your evaluation should include three components: conclusion, limitations, and suggestions for improvement.
Writing Conclusions This section offers your interpretations and conclusions about your findings. How do your results relate to the goals of
the study, as stated in your introduction, and how do they relate to the results that might have been expected from
background information obtained in lectures, textbooks, or outside reading? This is your chance to demonstrate your
ability to synthesize, analyze, evaluate, interpret, and reason effectively. You do NOT need to bring in theories to explain
your ideas beyond what you have learned in class. Your readers are looking for well-supported opinions, not for leaps of
fancy or mere repetitions of your findings, so you will need to think carefully about your findings in order to draw
conclusions that are neither too narrow nor too broad.
Page 12 of 15
Make a valid conclusion and relate it to the aim or the hypothesis
o Use detailed scientific knowledge to explain a valid conclusion given the evidence available from your
results.
o Try to identify observation, trends or patterns in the results to back up your conclusion.
o Explain how your results support or don’t support your original hypothesis if appropriate.
You must take into account any systematic or random errors and uncertainties.
o A percentage error should be compared with the total estimated random error as derived from the
propagation of uncertainties.
o Discuss whether systematic error or further random errors were encountered
o Include comparisons of different graphs or descriptions of trends shown in graphs.
When measuring an already known and accepted value of a physical quantity, compare the experimental
value with the textbook or literature value. Be sure to reference the literature used
If applicable, state the theoretical or expected value and compare your result to it using the % difference
calculation results
When writing a conclusion consider the following:
o Considering how large is the errors or uncertainties in your results, how confident are you in the results? Are
they fairly conclusive, or are other interpretations/results possible? Effect of Error
• Was your value too low? What errors contributed to making it low? Was it a systematic error?
• Was your value too high? What errors contributed to making it too high? Was it a systematic error?
• Which error, of those listed, was the most significant?
• Are your results reliable, given the errors listed? Justify this.
Limitations of the Experimental Procedure • Identify and discuss at least three significant errors and limitations that could have affected the outcome of
your experiment. Were there important variables that were not controlled? Were there flaws in the
procedure you chose which could affect the results? Are measurements and observations reliable? Were
enough trials done to know precision?
• Your emphasis in this section should be on systematic errors, not the random errors that always occur in
reading instruments and taking measurements.
• You must identify the source of error and if possible, state how it affected results.
o Acceptable Example: “Because the simple calorimeter we used was made from a tin can, some heat was
lost to the surroundings—metals conduct heat well. Therefore, the value obtained for the heat gained
by the water in the calorimeter was lower than it should have been.”
o Unacceptable Examples: “The test tubes weren’t clean” or “Human Error”
• Are there flaws in the procedures which could affect the results?
• Are important variables not controlled?
• Are measurements and observations reliable?
• Is precision unknown because of lack of replication?
• Analyze possible sources of error and distinguish systematic and random error
• Indicate the direction and magnitude of the effects on the final result through percent error

Page 13 of 15
• Are tests conclusive? Are other interpretations possible? Do you have an alternate hypothesis?
• Take account of magnitudes of errors and uncertainties in considering the reliabilities and limitations of
conclusions.
Suggestions for Improvement
• Suggest improvements or fixes for the weaknesses you identified in the previous section. These suggestions
should be realistic, keeping in mind the type of equipment normally found in high school or college general
chemistry labs. Suggestions should focus on specific pieces of equipment or techniques you used.
• Vague comments such as “We should have worked more carefully” or “I should have been given a better
calorimeter” won't cut it! For identified weaknesses, suggest improvements
• Suggestions should be realistic, not involving unavailable equipment…
• Suggestions should be specific (not “more careful work” or “more time”)
• Proposed changes may do any or all of the following:
1. Eliminate or reduce errors
2. Improve control of variables
3. Reduce approximations
4. Provide other procedures for better measurements.
5. State if modifications are unnecessary or impossible (standard procedures used…)
Works Cited If you reference an outside source in your report, you should cite where you found that source. You should also cite
sources which your reader, a fellow student, may be unfamiliar with. Cite only material that you have actually read.
Evaluation checklist
o Is there a clear pattern shown by your processed data?
o Is a clear conclusion, using the processed data, presented?
o Has the Research Question been appropriately answered?
o Is the actual processed data used in the conclusion?
o Is there a correlation between your work and literature values? (if applicable)
o Has the percent error been calculated? (if applicable)
o Are weaknesses of experimental design stated?
o Is the quality of the data discussed? – systematic and random errors are referenced
o Are there references to equipment or processes in the discussion of the design weaknesses?
o Are suggested modifications to the design presented based on the weaknesses presented?
o Are the suggested modifications specific and significant?
o Did you properly cite your sources?

Page 14 of 15
Communication This criterion assesses whether the investigation is presented and reported in a way that supports effective communication of the focus, process and outcomes.
Mark Descriptor
0 The student’s report does not reach a standard described by the descriptors below.
1–2 The presentation of the investigation is unclear, making it difficult to understand the
focus, process and outcomes.
The report is not well structured and is unclear: the necessary information on focus, process
and outcomes is missing or is presented in an incoherent or disorganized way.
The understanding of the focus, process and outcomes of the investigation is obscured by the
presence of inappropriate or irrelevant information.
There are many errors in the use of subject specific terminology and conventions*.
3–4 The presentation of the investigation is clear. Any errors do not hamper understanding of
the focus, process and outcomes.
The report is well structured and clear: the necessary information on focus, process and
outcomes is present and presented in a coherent way.
The report is relevant and concise thereby facilitating a ready understanding of the focus,
process and outcomes of the investigation.
The use of subject specific terminology and conventions is appropriate and correct. Any
errors do not hamper understanding.
*For example, incorrect/missing labeling of graphs, tables, images; uses of units, decimal places
By using the example format structures given in this guide you will be able to write a well-structured and clear report.
Lastly, please remember to include citations and a bibliography in your report.

Page 15 of 15
Additional Writing Tips
Appendix An appendix contains additional material that is not a necessary part of your research paper. It may be useful in
providing a more all-inclusive understanding of the research problem and/or there is simply too much data to be
included in the body of the paper. A separate appendix should be used for each distinct topic or set of data and always
have a title descriptive of its contents and should be lettered A, B, C, etc. Information in your appendix does not count
towards your total page or word count.
Other Writing Tips
Keep it simple. The purpose of this report is to describe your PROCESS, not come to any conclusions that will
alter the world.
Jargon confuses your reader; it doesn't make you sound smart
You may write from the first person point of view ("I" or "we") if that sentence style aids the reader in
understanding your point better. BUT, remember you are not writing an autobiography, so try to use passive
voice to keep the focus on our research rather than on you.
"This." The antecedent "this" needs a noun. This what?
"It." The pronoun "it" is not particularly descriptive. Use specific nouns as much as possible.
Words like "very" and "really" do not add significance. Simply say, for example, "This findings was significant
because . . ."
You do not need to use phrases like "as stated above." In written communication, readers generally don't need
such pointers as they remember what they've read previously in short reports. However, do reference figures
and graphs: "As shown in Figure 3 . . ."
Use non-sexist language. To avoid "he or she" constructions, write in plural form ("they").