guidance on the internal assessment - classweb.link · chemistry for the ib diploma © cambridge...
TRANSCRIPT

GUIDANCE ON THE INTERNAL ASSESSMENT 1CHEMISTRY FOR THE IB DIPLOMA © CAMBRIDGE UNIVERSITY PRESS 2011
Guidance on the internal assessment
DesignThis involves formulating a research question that you will investigate. As part of this criterion you must also identify the variables in the experiment.
Aspect 1• De� ne your research question. This must be clearly stated and not
vague.
• List all possible variables. Decide which are the key variables, i.e. the ones that are most important in determining the outcome of the experiment. Decide which variable is to be investigated. Which variables are to be controlled?
You should classify your variables as independent, dependent and controlled.
For instance, Table 1 shows the independent, dependent and controlled variables if you are investigating the e� ect of changing the concentration of hydrochloric acid on the rate at which hydrogen is given o� in the following reaction:
Mg + 2HCl → MgCl2 + H2
For example, a suitable research question could be: ‘How will changing the concentration of X a� ect the value of Y in the reaction...?’ Where a particular chemical reaction is being studied, you should give an equation for that reaction, e.g.: ‘In the reaction A(s) + B(aq) → C(aq) + D(g), how does changing the concentration of B a� ect the rate at which D is produced?’
A variable is any factor that could a� ect the outcome of the experiment.
A diagram is required only if it helps to explain how the apparatus is set up. There is no point in drawing a diagram in, for example, a titration experiment. Any diagram should be clearly labelled.
You do not have to do this all theoretically, as you can use preliminary experiments to work out suitable amounts/concentrations.
Independent variable concentration of HCl the variable that you change in order to see what effect it has
Dependent variable volume of hydrogen given off in a certain time what you measure
Controlled variables temperature, surface area of magnesium, volume of acid, atmospheric pressure
the things you keep the same
Table 1 The independent, dependent and controlled variables in an experiment to investigate the effect of changing the concentration of hydrochloric acid on the rate of hydrogen production.
It is also worth mentioning here that you must keep all apparatus and the procedure constant between di� erent runs of the same experiment.
Aspect 2• List the apparatus to be used. The list of apparatus should include
absolutely everything that you will need in order to carry out the experiment. For example, will you use a measuring cylinder or a pipette to measure out 25 cm3 of a solution? If you use a measuring cylinder, what size will you take? Don’t forget the electronic balance!
• List all the chemicals that you will require. You should state masses of solids that you will use and concentrations and volumes of solutions required.
• You should give a step-by-step method detailing how you will carry out the experiment. Your method should be such that someone reading it could recreate your experiment exactly. For example, in an

2 GUIDANCE ON THE INTERNAL ASSESSMENT CHEMISTRY FOR THE IB DIPLOMA © CAMBRIDGE UNIVERSITY PRESS 2011
investigation of the e� ect of concentration on the reaction between magnesium and hydrochloric acid:■ I will set up the apparatus as in the diagram■ I will � ll the gas burette to the top with tap water■ I will place the boiling tube in the water in the plastic trough
(control of variables – temperature) and measure the temperature of the water
■ I will weigh out accurately 0.06 g of magnesium ribbon on the electronic balance
■ I will put the magnesium ribbon into the boiling tube■ I will use the following concentrations of hydrochloric acid:
0.20 mol dm−3, 0.40 mol dm−3, 0.60 mol dm−3, 0.80 mol dm−3, 1.0 mol dm−3
■ I will make up the various concentration of HCl as follows: 0.80 mol dm−3 could be prepared by putting 80 cm3 of the acid into a 100 cm3 measuring cylinder and making it up to the 100 cm3 mark by adding distilled water, whereas 0.60 mol dm−3 would require 60 cm3 of the acid and 40 cm3 of water
■ I will measure out 10 cm3 of 1 mol dm−3 acid using the 10 cm3 measuring cylinder and measure the temperature of the acid
■ I will pour the acid as quickly as possible into the boiling tube, place the bung on the tube and start the stopwatch (these three actions should be done as close to simultaneously as possible)
■ I will record the level of water in the gas burette every 15 s until the gas burette is � lled with gas or there appears to be no further reaction
■ I will repeat the experiment with the same concentration of hydrochloric acid and mass of magnesium; in order to make the repeated experiment as close to the original as possible the boiling tube must be washed out thoroughly and dried and the water in the trough into which the boiling tube is placed should be replaced in case the temperature has changed
■ I will then carry out the experiment using the other concentrations of hydrochloric acid
■ I will repeat all experiments until consistent results are obtained
• If you have some variables that are going to prove very di� cult to control (e.g. atmospheric pressure), then you should not simply ignore them and, wherever possible, you should at least monitor these variables to determine to what extent they do remain constant
• If you use a method that is adapted from another source, you must reference the original source; however, you must change this method in some way, as the whole point of this section is not that you simply use a method from a book or the internet but that you design a method yourself.
Aspect 3You should plan to collect su� cient relevant data. For instance, if you are investigating the trend in a particular continuous variable, with the aim of plotting a line graph, you should plan to change your independent variable at least � ve times – this will give you su� cient points to plot a graph.
If you are investigating a discrete variable (e.g. how the di� erent isomers of C3H8O a� ect their enthalpy change of combustion), you will
Example of apparatus list for the reaction between Mg and HCl:
• boiling tubes (×2)
• gas burette (50 cm3)
• measuring cylinder (10 cm3)
• measuring cylinder (100 cm3)
• delivery tube and bung
• plastic trough (×2)
• electronic balance
• stopwatch
• magnesium ribbon (approx. 0.5 g)
• hydrochloric acid (1 mol dm−3) (approx. 500 cm3)
• distilled water (approx. 500 cm3)
• tap water
Your method should contain an explanation of how you are going to control the variables that you need to control and how you will vary the others. For example, the temperature is controlled by placing the boiling tube in a trough of water; the volume is controlled by always using 10 cm3 of hydrochloric acid; the surface area of the magnesium is controlled by always using one single strip of magnesium, etc.

GUIDANCE ON THE INTERNAL ASSESSMENT 3CHEMISTRY FOR THE IB DIPLOMA © CAMBRIDGE UNIVERSITY PRESS 2011
not be required to change the variable � ve times (there are only three possible isomers!), but you should change the variable as many times as possible. You would not use this data to plot a line graph – a bar chart would be more appropriate.
You should plan to use as large a range of the independent variable as possible. For example, if you are investigating the e� ect of temperature on the rate of a particular reaction, investigating � ve temperatures between 20 °C and 30 °C is unlikely to produce experimental data that will give a true picture of the e� ect of this variable. You should carry out preliminary work to determine the maximum and minimum values for the range that you can investigate. For example, you could try your rates experiment at 90 °C and � nd that the reaction is over in less than 3 s, so this temperature is impractical. The reaction at 80 °C, however, takes about 10 s, and the rate can be measured reasonably precisely at this temperature. The maximum temperature you will investigate will therefore be 80 °C. In the same way you should investigate the minimum temperature that you can use. You should explain in your experimental report how you have used preliminary work to determine the values of the independent variable that you will investigate.
In most experiments you should plan to take repeat readings of a particular property. This will allow you to take an average (mean), which should improve the reliability of your data. You should generally plan to take repeat readings until consistent results are obtained.
A trial run of an experiment is often a good idea, as this will give you an idea as to whether the quantities you are using give sensible and reliable results.
Data collection and processing
Aspect 1: data collectionRecording data. You must record all raw data that you measure. Best practice is to record data neatly as you go along and not to scribble data onto a piece of paper and then try and make sense of it later when you come to write up the experiment.
Raw dataIt is important that you do actually record raw data. For example, when carrying out an experiment that involves a rise or fall in temperature, the initial and � nal temperatures must be recorded – not the temperature change, as temperature change is a derived quantity worked out from the initial and � nal temperatures.
Recording data
• Record all data in a neat table so that it is easy for anyone looking at it to understand them. Make sure that you have written accurate and complete headings in the table and, if necessary, write su� cient explanation to make it clear exactly what the table is showing.
• All quantitative data must be accompanied by a unit where appropriate.
• All data must be recorded to the degree of precision appropriate to the apparatus, e.g. a mass recorded on a two decimal place electronic balance must be recorded as 23.00 g and not 23 g.
Raw data are measurements that you actually make.

4 CHEMISTRY FOR THE IB DIPLOMA © CAMBRIDGE UNIVERSITY PRESS 2011GUIDANCE ON THE INTERNAL ASSESSMENT
• All data recorded with the same piece of apparatus must be recorded to the same degree of precision.
• All quantitative data must be accompanied by an uncertainty. You should estimate the degree of precision to which your measuring apparatus can measure.
UncertaintiesIn general, the uncertainty of a measurement made on a digital instrument should be quoted as ± the smallest division. Therefore, a reading on an electronic balance measuring to two decimal places should be quoted as 23.00 ± 0.01 g.
As a general rule of thumb, for analogue instruments, the uncertainty on a measurement is half the smallest division to which you take a reading. This may be the division on the piece of apparatus used, or it may be an estimate if the divisions are su� ciently far apart to be able to estimate between them.
For a ruler measuring in mm, a value could be recorded as 23.0 ± 0.5 mm. For a ruler on which the smallest division is 1 cm, you can usually estimate a value for a length more accurately than to the nearest cm. If you think that you can estimate a value to the nearest 0.2 cm, i.e. values of 23.0, 23.2, 23.4 cm, etc. could be recorded, then you should take the uncertainty as half the division to which you are measuring, in this case 0.2 cm, and the values can be recorded as 23.2 ± 0.1 cm.
In some cases, for example when using a stopwatch, you may need to estimate an uncertainty due to reaction times.
An example of the recording of quantitative data for an experiment to measure the rate of reaction between magnesium and hydrochloric acid could be:
Initial data
mass of magnesium ribbon / g 0.12 ± 0.01
volume of hydrochloric acid / cm3 25.0 ± 0.1
concentration of HCl / mol dm−3 0.20
initial temperature of HCl / °C 18.0 ± 0.5
fi nal temperature of HCl / °C 20.0 ± 0.5
Time ± 0.2 / s Reading on gas burette ± 0.1 / cm3
0.0 0.0
30.0 10.5
60.0 18.3
90.0 25.6
etc.
Using a buretteIt is usual to read a burette to two decimal places, with the second decimal place being estimated as 0 (on, or very close to the line) or 5 (between the lines).
Uncertainties are discussed in more detail in Chapter 11 of the Coursebook.
If you think that the uncertainty in a particular quantity is negligible, so that it can be ignored, you must state this.
The concentration of HCl is stated without an uncertainty, as this was supplied and the uncertainty is unknown.
The number of decimal places recorded for the initial data corresponds to the uncertainty. So, 25.0 ± 0.1 and 0.12 ± 0.01 are correct, but e.g. 25 ± 0.1, 0.12 ± 0.1 and 0.12 ± 0.10 would all be incorrect.

GUIDANCE ON THE INTERNAL ASSESSMENT 5CHEMISTRY FOR THE IB DIPLOMA © CAMBRIDGE UNIVERSITY PRESS 2011
Trial Run 2 Run 3
Initial reading / cm3 0.00 ± 0.03 10.05 ± 0.03 5.20 ± 0.03
Final reading / cm3 23.30 ± 0.03 33.15 ± 0.03 28.25 ± 0.03
Titre / cm3 23.30 ± 0.06 23.10 ± 0.06 23.05 ± 0.06
Note: you are reading the burette to the nearest 0.05 cm3, and so your uncertainty is half of this, i.e. 0.03 cm3 (rounded up).
Note: all readings have been recorded to the same degree of precision, i.e. same number of decimal places.
The uncertainty on the titre is ±0.06, as this is the sum of the uncertainties on the initial and � nal readings – when adding or subtracting quantities, the uncertainties must be added together.
When using measuring instruments such as a pH meter or a colorimeter, you could make observations such as:
• the reading on the pH meter was not stable
• the needle on the colorimeter took a long time to reach the � nal value.
Data loggingIf you are using data-logging equipment, you must state the sensitivity of the instrument and make sure that the precision of your data does not exceed the sensitivity of the instrument used. For example, if you are using a pH probe with a sensitivity of ±0.02, you cannot quote a pH of 2.378.
Qualitative dataAs part of this criterion, you should also record qualitative data, in the form of observations, in each experiment. For example, in the experiment to determine the e� ect of the concentration of HCl(aq) on the rate of reaction with magnesium, observations could include:
• the magnesium was pale grey
• the hydrochloric acid was a colourless solution
• the reaction mixture � zzed, with the evolution of a colourless gas
• the magnesium ‘dissolved’
• the rate of e� ervescence and the speed with which the magnesium dissolved increased as the concentration of the hydrochloric acid increased
• the � nal mixture was a colourless solution
• the reaction mixture became hotter
• it was di� cult to take readings at higher concentrations, because the gas was being produced so quickly.Of these, the most important observations are the last two, as these are
critical to the experiment and probably a source of error. These should be referred to in the evaluation section.
Even in a titration experiment, you will be expected to record observations, and these could include the observed colour change and the intensity of the indicator colour in each run:
Run 1 Run 2 Run 3
Initial reading / cm3 0.00 ± 0.03 10.05 ± 0.03 5.20 ± 0.03
Final reading / cm3 23.30 ± 0.03 33.15 ± 0.03 28.25 ± 0.03
Titre / cm3 23.30 ± 0.06 23.10 ± 0.06 23.05 ± 0.06
Observations rough titration; colour change of indicator from colourless to pink; fi nal colour was bright pink
fi nal solution pale pink very pale pink; one drop caused colour change
Initial and � nal readings on the burette must be recorded (these are the raw data), as the titre is a derived quantity, obtained by calculation from the raw data.

6 CHEMISTRY FOR THE IB DIPLOMA © CAMBRIDGE UNIVERSITY PRESS 2011GUIDANCE ON THE INTERNAL ASSESSMENT
When the experiment involves solely qualitative data, it is essential that all observations are as detailed as possible. The initial colour and physical state of the starting material should be recorded. For example, consider the addition of ammonia solution to copper sulfate solution:
Initial appearance of
substances
Observations made during the reaction Final appearance
of substances
copper sulfate was a royal blue solution; the ammonia solution was colourless with a pungent odour
upon addition of a few drops of ammonia, a pale blue gelatinous precipitate was formed, which fl oated upon the blue solution; as the mixture was shaken, the precipitate was distributed throughout the mixture; addition of excess ammonia caused the precipitate to dissolve to give a dark blue solution
dark blue solution
Aspect 2: data processingData processing involves the processing of raw data into a form from which conclusions can be drawn:
• if repeat readings are made, these should be averaged
• calculations, using the averaged value, should be carried out to work out the required quantity
• processing will often involve drawing a graph and a line of best � t (see below)
• wherever possible, the gradient (with units) of the graph should be calculated.
Aspect 3: data presentation
Drawing graphsData should be presented in a way that allows for easy interpretation. This means that, wherever possible, a graph should be drawn.
One way of labelling axes on a graph is:
• volume of gas / cm3
• pressure / 104 N m−2.The second form allows you to plot values such as 2.0 × 10⁴ N m−2 as 2.0.
The points on the graph should not be joined up, but instead a line of best � t (either a straight line or a curve) should be drawn.
When you are plotting continuous data e.g. volume of gas produced against time, then you should plot a line graph (scatter graph) and draw a line of best � t. If you are plotting discrete data, e.g. enthalpy of combustion values for a series of alcohols, a bar chart is more appropriate.
Error analysisThe examples below illustrate the level of error analysis that must be carried out. Consider a calorimetry (measuring heat changes) experiment:
Initial temperature / °C 21.5 ± 0.2 Initial mass / g 23.57 ± 0.01
Final temperature / °C 24.2 ± 0.2 Final mass / g 23.23 ± 0.01
Temperature difference / °C 2.7 ± 0.4 Mass difference / g 0.34 ± 0.02
You should set out your calculation clearly, showing all the steps.
A graph must have a title.
It is important to consider whether the graph should go through the origin or not.
When a straight-line graph is drawn, it is usual to work out the gradient (with units) of the line of best � t.
When two values containing an uncertainty are added or subtracted, the absolute uncertainties are added, so the uncertainty in the temperature di� erence is the sum of the uncertainties for the original readings, i.e. 0.2 + 0.2 = 0.4.
Axes must be correctly labelled.
GUIDANCE ON THE INTERNAL ASSESSMENT 7CHEMISTRY FOR THE IB DIPLOMA © CAMBRIDGE UNIVERSITY PRESS 2011
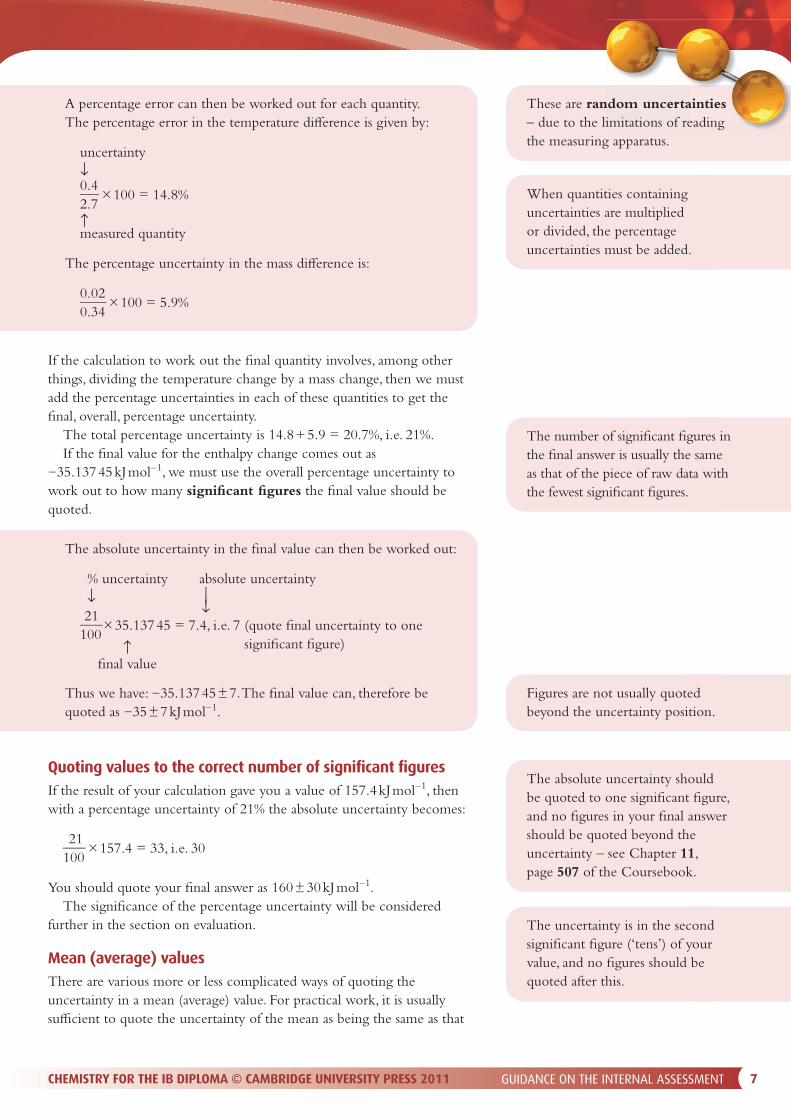
If the calculation to work out the � nal quantity involves, among other things, dividing the temperature change by a mass change, then we must add the percentage uncertainties in each of these quantities to get the � nal, overall, percentage uncertainty.
The total percentage uncertainty is 14.8 + 5.9 = 20.7%, i.e. 21%.If the � nal value for the enthalpy change comes out as
−35.137 45 kJ mol−1, we must use the overall percentage uncertainty to work out to how many signi� cant � gures the � nal value should be quoted.
A percentage error can then be worked out for each quantity.The percentage error in the temperature di� erence is given by:
uncertainty↓0.42.7 × 100 = 14.8%
↑measured quantity
The percentage uncertainty in the mass di� erence is:
0.020.34
× 100 = 5.9%
The absolute uncertainty in the � nal value can then be worked out:
% uncertainty absolute uncertainty ↓ 21 ↓
100 × 35.137 45 = 7.4, i.e. 7 (quote � nal uncertainty to one
signi� cant � gure) ↑ � nal value
Thus we have: −35.137 45 ± 7. The � nal value can, therefore be quoted as −35 ± 7 kJ mol−1.
When quantities containing uncertainties are multiplied or divided, the percentage uncertainties must be added.
The number of signi� cant � gures in the � nal answer is usually the same as that of the piece of raw data with the fewest signi� cant � gures.
The absolute uncertainty should be quoted to one signi� cant � gure, and no � gures in your � nal answer should be quoted beyond the uncertainty – see Chapter 11, page 507 of the Coursebook.
The uncertainty is in the second signi� cant � gure (‘tens’) of your value, and no � gures should be quoted after this.
Figures are not usually quoted beyond the uncertainty position.
Quoting values to the correct number of signifi cant fi guresIf the result of your calculation gave you a value of 157.4 kJ mol−1, then with a percentage uncertainty of 21% the absolute uncertainty becomes:
21100
× 157.4 = 33, i.e. 30
You should quote your � nal answer as 160 ± 30 kJ mol−1.The signi� cance of the percentage uncertainty will be considered
further in the section on evaluation.
Mean (average) valuesThere are various more or less complicated ways of quoting the uncertainty in a mean (average) value. For practical work, it is usually su� cient to quote the uncertainty of the mean as being the same as that
These are random uncertainties – due to the limitations of reading the measuring apparatus.

8 CHEMISTRY FOR THE IB DIPLOMA © CAMBRIDGE UNIVERSITY PRESS 2011GUIDANCE ON THE INTERNAL ASSESSMENT
of the original quantity. Thus, if we need to � nd the mean of 21.0 ± 0.2, 21.3 ± 0.2, 21.5 ± 0.2, we can take it as 21.3 ± 0.2.
Conclusion and evaluationIn this section you must draw and explain conclusions and evaluate the experiment.
Aspect 1You must use the results you have obtained to draw some sort of conclusion. Where you have designed the experiment, your conclusion should, of course, relate back to the research question. It is important that the conclusion is based on your results and not on what you think the results should have been. For instance, you cannot draw a straight-line graph that does not pass through the origin then draw the conclusion that a proportional relationship exists, if that is not what your data are showing.
You must explain how your processed data have led you to a particular conclusion. For example: ‘Owing to the fact that the graph of reaction rate against concentration is a straight line passing through the origin, it can be concluded that in the reaction between Mg and HCl a directly proportional relationship exists between the concentration of HCl and the rate of reaction.’
The values you have worked out should be compared with literature values and, where possible, a percentage error calculated.
Your conclusion should be quantitative where possible.
You should quote a full reference for the literature value. % error =
literature value − experimental value × 100 literature value
For instance, if you have worked out a value of 35.7 kJ mol−1 for a particular quantity, and the accepted literature value is 39.5 kJ mol−1, the percentage error is:
% error = 39.5 − 35.7
× 100 = 9.6% 39.5
This value should be compared with the total percentage random uncertainty in your experiment.
If the percentage error, when compared with the literature value, is smaller than that due to random uncertainties, you can be fairly con� dent that the experiment has worked well as a way of obtaining a value for this particular quantity. If the random uncertainties are, however, quite large, the experiment can be further re� ned by using more precise measuring apparatus and/or taking more repeat measurements. You should comment on this.
If your percentage error is larger than the percentage uncertainty due to random uncertainties, then this suggests that there are systematic errors in your experimental procedure, and these must be eliminated as far as possible to obtain a more accurate value for the measured quantity. In the case of systematic errors, redesign of the experiment must be considered. Systematic errors will have resulted in your value being either larger or smaller than the accepted value – explain which. You must comment on this.

GUIDANCE ON THE INTERNAL ASSESSMENT 9CHEMISTRY FOR THE IB DIPLOMA © CAMBRIDGE UNIVERSITY PRESS 2011
If you have worked out a trend for which there is no literature value, you should consider how any conclusion you draw would � t in with accepted theory. For instance, if you are doing a rates experiment and accepted theory would have predicted a graph that passed through the origin, whereas you have obtained a good straight line that does not pass through the origin, you could explain this as probably due to systematic errors in the experiment.
If you have drawn a line of best � t you should comment on whether all your points lie on or very close to the line, as an indication of the quality of your data.
Aspect 2The limitations of the procedure must be considered.
Systematic errorPossible sources of systematic error in an experiment could include:
• heat loss to the surroundings
• solutions not being exactly the stated concentrations
• poor technique (there are many aspects to this, such as not stopping a stopclock at the correct moment, contamination of apparatus, etc.).
You should consider each factor and in which direction it will cause an error – for example, will heat loss to the surroundings cause your � nal value to be too small or too large? You must be careful here, because if your � nal value for an enthalpy change experiment was more exothermic than the literature value, you cannot explain the di� erence in terms of heat loss to the surroundings, as this would cause the value to be less exothermic.
You should then consider the relative size of these � aws in your procedure – is one factor a lot more signi� cant than the others? This should be identi� ed as the major source of systematic error.
Random errorYou should consider the nature of random errors in your experiment as shown by percentage uncertainties that have already been calculated. Is one source of random uncertainty much larger than the others? For instance, if you are measuring a temperature di� erence with a random uncertainty of ±5% and a mass with an electronic balance with a random uncertainty of ±0.1%, then the precision of the experiment can be much more signi� cantly improved by using a more precise thermometer compared with using a more precise balance.
Questions to considerFor instance, when calculating an enthalpy change involving a solution,
did you assume that the speci� c heat capacity of the solution was the same as that of water?
You should consider whether the variables that were identi� ed as controlled variables were actually controlled. For instance, you may have stated that temperature was a controlled variable in a rates experiment, but was this actively controlled or did you just rely on the temperature not changing very much?
Was the range of value you used for your independent variable too small for you to be certain about a conclusion – for instance, if you were
You should analyse the apparatus you used and the techniques involved in order to identify as many sources of error as possible.
You should consider whether any approximations used in the calculations could a� ect your overall result.
Note: only random errors, and not systematic errors, can be reduced by taking more repeat readings.
10 CHEMISTRY FOR THE IB DIPLOMA © CAMBRIDGE UNIVERSITY PRESS 2011GUIDANCE ON THE INTERNAL ASSESSMENT
investigating the e� ect of concentration on rate and only changed the concentration from 1.0 to 1.5 mol dm−3?
Aspect 3Suggest improvements to the experiment to eliminate as far as possible the � aws you have identi� ed. You should consider improvements to reduce both random and systematic errors.
Reducing/eliminating systematic errorsStart with the most signi� cant error and suggest improvements, which should be as speci� c as possible, e.g. ‘use a beaker made of expanded polystyrene’ (styrofoam) is better than ‘stop heat loss to the surroundings’. Your improvements should be realistic and possible to carry out in a school laboratory.
Consider how controlled variables may be more actively controlled. For instance, do you need to do a rates experiment in a water bath or insulate the reaction vessel better?
Reducing random errorsIt is important to realise that random errors can never be completely eliminated, only reduced. This can be done by taking more repeat readings or using more precise apparatus. You must, again, be speci� c about the more precise apparatus and must, for example, suggest the use of a burette instead of a measuring cylinder to measure the volumes of liquids, rather than just saying, ‘use more precise apparatus’.
Finally, you could suggest what further measurements might need to be taken to improve your data. For instance, if the range of values was too small, what other readings should be taken? Again, be speci� c. For example, ‘the following concentrations should also be investigated to provide a better range of results from which a more reliable conclusion may be drawn…’.
Remember, be speci� c!