massachusetts multifamily high rise baseline study...
TRANSCRIPT

DOCUMENT TITLE
1
Massachusetts Multifamily High Rise Baseline Study-FINAL REPORT
March 24, 2017
SUBMITTED TO: The Massachusetts Electric and Gas Program Administrators
SUBMITTED BY:
NMR Group, Inc., Dorothy Conant, and DNV-GL

MASSACHUSETTS MULTIFAMILY HIGH RISE BASELINE-FINAL
Table of Contents EXECUTIVE SUMMARY .............................................................................................................. I
FINAL UDRH INPUTS ............................................................................................................. I
SAMPLE PROJECTS AND DATA ............................................................................................ IV
RECRUITING ....................................................................................................................... IV
ON-SITE INSPECTIONS AND PLAN REVIEWS .......................................................................... V
RELATIVE PRECISION OF RESULTS ....................................................................................... V
MEASURE-LEVEL FINDINGS ................................................................................................ VI
RECOMMENDATIONS AND CONSIDERATIONS ........................................................................ IX
SECTION 1 INTRODUCTION ............................................................................................... 1
1.1 BACKGROUND AND STUDY GOAL ............................................................................... 1
1.1.1 Study Goal .......................................................................................................... 1
1.2 SAMPLING PLAN ........................................................................................................ 1
1.2.1 Final Sample ....................................................................................................... 2
1.2.2 Sample to Market Comparison ........................................................................... 2
1.2.3 Data and Analysis ............................................................................................... 6
1.2.4 Precision ............................................................................................................. 6
1.3 DRY RUN INSPECTIONS ............................................................................................. 8
SECTION 2 RECRUITMENT AND SCHEDULING .................................................................... 9
2.1 IDENTIFYING SAMPLE ................................................................................................. 9
2.2 BARRIERS TO RECRUITMENT .................................................................................... 10
2.3 RECRUITMENT STRATEGIES ..................................................................................... 10
2.3.1 Program Participant Recruitment ...................................................................... 10
2.3.2 Non-Participant Recruitment ............................................................................. 11
2.3.3 Building Department Visits and Mystery Shopping ........................................... 11
SECTION 3 ON-SITE DATA COLLECTION AND PLAN REVIEW ............................................ 13
3.1 ON-SITE DATA COLLECTION ..................................................................................... 13
3.1.1 Walk-through with Building Manager ................................................................ 13
3.1.2 In-Unit Inspections ............................................................................................ 13
3.1.3 Plan Review ...................................................................................................... 13
3.1.4 Data Quality and Sample Sizes ........................................................................ 14
SECTION 4 COMPARISON TO CURRENT PROGRAM MODEL INPUTS .................................. 15
SECTION 5 BUILDING ENVELOPE .................................................................................... 24

MASSACHUSETTS MULTIFAMILY HIGH RISE BASELINE-FINAL
5.1 WALL INSULATION ................................................................................................... 24
5.2 ROOF INSULATION ................................................................................................... 26
5.3 FRAME FLOOR INSULATION ...................................................................................... 27
5.4 SLAB INSULATION .................................................................................................... 28
5.5 FOUNDATION WALL INSULATION ............................................................................... 28
5.6 GLAZING EFFICIENCY .............................................................................................. 28
SECTION 6 MECHANICAL EQUIPMENT ............................................................................. 30
6.1 HEATING SYSTEM SUMMARY ................................................................................... 30
6.1.1 Whole Building Heating Systems ...................................................................... 30
6.1.2 In-Unit Heating Systems ................................................................................... 32
6.2 COOLING SYSTEM SUMMARY ................................................................................... 32
6.2.1 Whole-Building Cooling Systems ...................................................................... 33
6.2.2 In-Unit Cooling Systems ................................................................................... 34
6.3 WATER HEATING SUMMARY ..................................................................................... 35
6.3.1 Whole-Building Water Heating Systems ........................................................... 35
6.3.2 In-Unit Water Heating Systems ......................................................................... 36
SECTION 7 VENTILATION ................................................................................................ 37
SECTION 8 MOTORS AND DRIVES ................................................................................... 38
8.1 ELECTRONICALLY COMMUTATED MOTORS ............................................................... 38
8.2 VARIABLE FREQUENCY DRIVES ................................................................................ 38
SECTION 9 APPLIANCES AND WATER FIXTURES ............................................................. 39
9.1 APPLIANCES ............................................................................................................ 39
9.2 WATER FIXTURES .................................................................................................... 42
SECTION 10 LIGHTING ..................................................................................................... 45
10.1 IN-UNIT LIGHTING .................................................................................................... 46
10.2 COMMON AREA LIGHTING ........................................................................................ 48
10.2.1 Lobby Elevator .................................................................................................. 51
10.2.2 Office ................................................................................................................. 52
10.2.3 Fitness .............................................................................................................. 53
10.2.4 Lounge Clubhouse ............................................................................................ 54
10.2.5 Storage ............................................................................................................. 55
10.2.6 Corridors ........................................................................................................... 56
10.2.7 Stairwells ........................................................................................................... 57

MASSACHUSETTS MULTIFAMILY HIGH RISE BASELINE-FINAL
10.2.8 Mechanical/Utility Room ................................................................................... 58
10.2.9 Meeting Rooms ................................................................................................. 59
10.2.10 Garage ......................................................................................................... 60
Figures FIGURE 1: PERCENT OF PROJECTS AND UNITS BY PROJECT STORY CATEGORY ....................... 3FIGURE 2: PERCENT OF PROJECTS BY PROJECT SIZE CATEGORY ............................................ 4FIGURE 3: PERCENT OF UNITS BY PROJECT SIZE CATEGORY ................................................... 4FIGURE 4: WHOLE BUILDING PATH (≤ 10 STORIES) ENROLLED AND STUDY BUILDINGS ............. 5FIGURE 5: IN-UNIT ONLY PATH (≥ 11 STORIES) ENROLLED AND STUDY BUILDINGS ................... 5FIGURE 6: PERCENT OF TOTAL BULBS/FIXTURES ................................................................... 46FIGURE 7: PERCENT OF TOTAL WATTS .................................................................................. 46FIGURE 8: RAW AND AREA WEIGHTED AVERAGE WATTS PER SQUARE FOOT ......................... 47FIGURE 9: WATTS PER SQUARE FOOT OF LAMPED AREA BY PROJECT ................................... 47FIGURE 10: COMMON AREA PERCENT OF TOTAL BULBS/FIXTURES ........................................ 49FIGURE 11: COMMON AREAS PERCENT OF TOTAL WATTS ...................................................... 49FIGURE 12: LOBBY ELEVATOR AREA WATTS PER SQUARE FOOT ........................................... 51FIGURE 13: OFFICE AREA WATTS PER SQUARE FOOT ............................................................ 52FIGURE 14: FITNESS AREA WATTS PER SQUARE FOOT .......................................................... 53FIGURE 15: LOUNGE CLUBHOUSE AREA WATTS PER SQUARE FOOT ...................................... 54FIGURE 16: STORAGE AREA WATTS PER SQUARE FOOT ........................................................ 55FIGURE 17: CORRIDOR AREA WATTS PER SQUARE FOOT ....................................................... 56FIGURE 18: STAIRWELL AREA WATTS PER SQUARE FOOT ..................................................... 57FIGURE 19: MECHANICAL/UTILITY ROOM WATTS PER SQUARE FOOT ..................................... 58FIGURE 20: MEETING ROOM AREA WATTS PER SQUARE FOOT ............................................... 59FIGURE 21: GARAGE AREA WATTS PER SQUARE FOOT .......................................................... 60
Tables TABLE 1: FINAL LIGHTING UDRH INPUTS ................................................................................. IITABLE 2: FINAL HEATING UDRH INPUTS ................................................................................. IITABLE 3: FINAL COOLING UDRH INPUTS ................................................................................. IITABLE 4: FINAL WATER HEATING UDRH INPUTS .................................................................... IIITABLE 5: FINAL BUILDING SHELL UDRH INPUTS..................................................................... IIITABLE 6: FINAL SHOWERHEAD AND FAUCET UDRH INPUTS .................................................... IIITABLE 7: FINAL INFILTRATION AND VENTILATION UDRH INPUTS ............................................. IIITABLE 8: SAMPLE COEFFICIENTS OF VARIATION AND RELATIVE PRECISIONS ............................ 6TABLE 9: SAMPLE DISPOSITION FOR RECRUITMENT ................................................................. 9TABLE 10: COMPARISON OF PROGRAM INPUTS AND BASELINE FINDINGS—LIGHTING ............. 16TABLE 11: COMPARISON OF PROGRAM INPUTS AND BASELINE FINDINGS—WALLS ................. 17TABLE 12: COMPARISON OF PROGRAM INPUTS AND BASELINE FINDINGS—ROOFS ................. 18TABLE 13: COMPARISON OF PROGRAM INPUTS AND BASELINE FINDINGS—CURTAIN
WALLS/WINDOWS ...................................................................................................... 18

MASSACHUSETTS MULTIFAMILY HIGH RISE BASELINE-FINAL
TABLE 14: COMPARISON OF PROGRAM INPUTS AND BASELINE FINDINGS—HEATING
EQUIPMENT ............................................................................................................... 19TABLE 15: COMPARISON OF PROGRAM INPUTS AND BASELINE FINDINGS—COOLING
EQUIPMENT ............................................................................................................... 20TABLE 16: COMPARISON OF PROGRAM INPUTS AND BASELINE FINDINGS—WATER
HEATING EQUIPMENT ................................................................................................. 21TABLE 17: COMPARISON OF PROGRAM INPUTS AND BASELINE FINDINGS—WATER
FIXTURES .................................................................................................................. 22TABLE 18: COMPARISON OF PROGRAM INPUTS AND BASELINE FINDINGS—AIR
INFILTRATION ............................................................................................................. 22TABLE 19: COMPARISON OF PROGRAM INPUTS AND BASELINE FINDINGS—VENTILATION ........ 23TABLE 20: WOOD FRAME WALL TOTAL R-VALUE* ................................................................. 25TABLE 21: STEEL FRAME WALL TOTAL R-VALUE* ................................................................. 25TABLE 22: ROOF DECK R-VALUE (CONTINUOUS ONLY)* ........................................................ 26TABLE 23: ATTIC R-VALUE* .................................................................................................. 27TABLE 24: FRAME FLOOR R-VALUE ....................................................................................... 27TABLE 25: CURTAIN WALL U-FACTOR ................................................................................... 29TABLE 26: DISTRIBUTION OF HEATING CONFIGURATIONS IN INSPECTED BUILDINGS ................ 30TABLE 27: CENTRAL NATURAL GAS BOILER THERMAL EFFICIENCY (%) ................................. 31TABLE 28: IN-UNIT WATER SOURCE HEAT PUMP EFFICIENCIES (COP) ................................... 31TABLE 29: IN-UNIT DUCTLESS MINI-SPLIT HSPF ................................................................... 32TABLE 30: DISTRIBUTION OF COOLING CONFIGURATIONS IN INSPECTED BUILDINGS................ 33TABLE 31: IN-UNIT WATER SOURCE HEAT PUMP EFFICIENCIES (EER) ................................... 33TABLE 32: IN-UNIT CENTRAL AIR CONDITIONING SEER ......................................................... 34TABLE 33: IN-UNIT DUCTLESS MINI-SPLIT SEER ................................................................... 34TABLE 34: DISTRIBUTION OF WATER HEATING CONFIGURATIONS IN INSPECTED
BUILDINGS ................................................................................................................. 35TABLE 35: WHOLE BUILDING STAND-ALONE NATURAL GAS WATER HEATING
EFFICIENCIES............................................................................................................. 35TABLE 36: IN-UNIT STAND-ALONE ELECTRIC HOT WATER HEATER EFFICIENCY (EF) ............. 36TABLE 37: REFRIGERATION CONSUMPTION (KWH/YR.) ........................................................... 40TABLE 38: ENERGY STAR STATUS OF REFRIGERATORS ..................................................... 40TABLE 39: CLOTHES WASHER CONSUMPTION (KWH/YR.) ....................................................... 41TABLE 40: ENERGY STAR STATUS OF CLOTHES WASHERS ................................................ 41TABLE 41: DISHWASHER CONSUMPTION (KWH/YR.) ............................................................... 42TABLE 42: SHOWERHEAD FLOW RATES (GPM) ..................................................................... 42TABLE 43: KITCHEN FAUCET FLOW RATES (GPM) ................................................................. 43TABLE 44: LAVATORY FAUCET FLOW RATES (GPM) .............................................................. 43TABLE 45: TOILET FLUSH FLOW RATE (GPF) ........................................................................ 44TABLE 46: IN-UNIT LIGHTING WATTS PER SQUARE FOOT STATISTICS ..................................... 48TABLE 47: LOBBY ELEVATOR AREA WATTS PER SQUARE FOOT STATISTICS .......................... 51TABLE 48: OFFICE AREA WATTS PER SQUARE FOOT STATISTICS ........................................... 52TABLE 49: FITNESS AREA WATTS PER SQUARE FOOT STATISTICS ......................................... 53TABLE 50: LOUNGE CLUBHOUSE AREA WATTS PER SQUARE FOOT STATISTICS ..................... 54

MASSACHUSETTS MULTIFAMILY HIGH RISE BASELINE-FINAL
TABLE 51: STORAGE AREA WATTS PER SQUARE FOOT STATISTICS ....................................... 55TABLE 52: CORRIDOR AREA WATTS PER SQUARE FOOT STATISTICS ..................................... 56TABLE 53: STAIRWELL AREA WATTS PER SQUARE FOOT STATISTICS .................................... 57TABLE 54: MECHANICAL/UTILITY ROOM WATTS PER SQUARE FOOT STATISTICS .................... 58TABLE 55: MEETING ROOM AREA WATTS PER SQUARE FOOT STATISTICS .............................. 59TABLE 56: GARAGE AREA WATTS PER SQUARE FOOT STATISTICS ......................................... 60

MASSACHUSETTS MULTIFAMILY HIGH RISE BASELINE-FINAL
I
Executive Summary This study represents the first baseline study of new construction building practices in high-rise multifamily buildings to support the Multifamily High Rise (MFHR) new construction program that is sponsored by the Program Administrators (PAs). From 2010 through 2012 MFHR new construction projects were addressed through the
Multifamily Pilot. As of 2013, the PAs Residential New Construction (RNC) program addresses two major housing categories: low rise and high rise. The low-rise category addresses detached and attached single-family homes and multifamily buildings that are three stories and lower. The high-rise category addresses MFHR buildings four stories and higher with five or more units.
The MFHR program offers two paths for participation:
Whole Building Simple Prescriptive Path: Addresses both in-unit savings and whole-building energy savings for all gas and electric energy-efficiency measures.
Residential In-Unit Savings Path: Focuses on the in-unit residential metered electric savings.
In general, four to ten story participating projects follow the whole building simple prescriptive path, and over ten story participating projects follow the residential in-unit savings path.
This study’s goal was to develop a baseline of new construction building practices and characteristics in the high-rise multifamily new construction market for the Massachusetts PAs to use to calculate gross savings for buildings participating in the Multifamily High-rise Program (MFHR program).1 The final steps in this project were to discuss the study findings with the PAs, Energy Efficiency Advisory Council (EEAC) Consultants, and program implementation contractor; update the current energy model baselines; and issue an addendum to this report documenting the final agreed upon User Defined Reference Home (UDRH) inputs for the energy model.2
FINAL UDRH INPUTS The tables below detail the final UDRH inputs that were agreed upon by the working group. More detail on these values can be found in the UDRH addendum.3 The retrospective baseline values will be used to re-run savings for the 2016 program year while the prospective values will be used to calculate savings for the 2017 program year.
1 In 2016 the MFHR program changed from using an algorithm based approach to estimate savings to using building modeling software. 2 Final 2016-2017 UDRH Inputs: Addendum to Massachusetts Multifamily High Rise Baseline Study, Submitted to The Electric and Gas Program Administrators of Massachusetts by NMR Group, Inc. and Dorothy Conant. March 8, 2017. 3 http://ma-eeac.org/wordpress/wp-content/uploads/Addendum-to-MA-Multifamily-High-Rise-Baseline-Study.pdf
ES

MASSACHUSETTS MULTIFAMILY HIGH RISE BASELINE-FINAL
II
Table 1: Final Lighting UDRH Inputs Measure Retrospective Baseline Prospective Baseline
Residential Lighting Power Density (LPD) 0.75 W/SF 0.75 W/SF
Lobby LPD 0.80 W/SF 0.81 W/SF Office LPD 0.80 W/SF 0.99 W/SF
Fitness LPD 0.66 W/SF 0.65 W/SF Recreation LPD 0.58 W/SF 0.66 W/SF
Storage LPD 0.58 W/SF 0.57 W/SF Corridor LPD 0.51 W/SF 0.59 W/SF
Table 2: Final Heating UDRH Inputs Measure Retrospective Baseline Prospective Baseline
Whole Building Central Boiler
<300,000 Btu/h 82% AFUE
≥300,000 Btu/h 85% Thermal Efficiency
<300,000 Btu/h 82% AFUE
≥300,000 Btu/h 85% Thermal Efficiency
Furnace with Central A/C
<225,000 Btu/h, 85% AFUE
≥225,000 Btu/h,
80% Thermal Efficiency
<225,000 Btu/h, 85% AFUE
≥ 225,000 Btu/h,
80% Thermal Efficiency Ductless Mini-Split Heat Pumps 8.2 HSPF 8.2 HSPF
Water Source Heat Pumps 4.2 COP 4.3 COP Ground Source Heat Pumps 3.1 COP 3.2 COP
VRF-Air-Cooled 2.05 COP 2.05 COP VRF-Air-Cooled with Heat
Recovery 2.05 COP 2.05 COP
Table 3: Final Cooling UDRH Inputs Measure Retrospective Baseline Prospective Baseline
Furnace with Central A/C 13.0 SEER 13.0 SEER Hydronic Heating with Central A/C 13.0 SEER 13.0 SEER
Ductless Mini-Split Heat Pumps 14.5 SEER and 12.0 EER 14.5 SEER and 12.0 EER Water Source Heat Pumps 12.0 EER 13.0 EER
Ground Source Heat Pumps 13.4 EER 14.1 EER VRF-Air-Cooled 10.6 EER 10.6 EER
VRF-Air-Cooled with Heat Recovery 10.4 EER 10.4 EER
Hydronic Baseboard with Through-Wall A/C
12.0 SEER 12.0 SEER

MASSACHUSETTS MULTIFAMILY HIGH RISE BASELINE-FINAL
III
Table 4: Final Water Heating UDRH Inputs Measure Retrospective Baseline Prospective Baseline
In-Unit Natural Gas Storage Water Heater 0.67-0.0019V EF
≤55 gallons, 0.675-.0015V EF;
>55 gallons, 0.8012-0.00078V EF
In-Unit Natural Gas On-Demand Water Heater 0.62-0.0019V EF 0.82-0.0019V EF
In-Unit Electric Storage Water Heater 0.97-.00132V EF
≤55 gallons, 0.960-.0003V EF;
>55 gallons, 2.057-0.00113V EF
In-Unit Electric On-Demand Water Heater 0.97-.00132V EF 0.93-0.00132V EF
In-Unit Electric Heat Pump Water Heater 0.93-.00132V EF
≤55 gallons, 0.960-.0003V EF;
>55 gallons, 2.057-0.00113V EF
Table 5: Final Building Shell UDRH Inputs Measure Retrospective Baseline Prospective Baseline
Mass R-13.3 c.i. R-13.3 c.i.
Wood Stud R-13 + R-7.5 c.i. or R-20 + R-3.8 c.i.
R-13 + R-7.5 c.i. or R-20 + R-3.8 c.i.
Steel Frame R-13 + R-7.5 c.i. R-13 + R-7.5 c.i. Flat Roof R-25 c.i. R-30 c.i.
Attic R-49 R-49
Fenestration U-Factor
U-0.38
Operable fenestration U-0.45
Entrance Doors
U-0.77
Fixed fenestration U-0.38
Operable fenestration
U-0.45
Entrance Doors U-0.77
Table 6: Final Showerhead and Faucet UDRH Inputs Measure Retrospective Baseline Prospective Baseline
Showerheads 2.2 GPM 2.2 GPM Lavatory Faucets 2.0 GPM 2.0 GPM Kitchen Faucets 2.2 GPM 2.2 GPM
Table 7: Final Infiltration and Ventilation UDRH Inputs Measure Retrospective Baseline Prospective Baseline
Whole Building Infiltration Rate 0.40 CFM75/SF of exterior surface area
0.40 CFM75/SF of exterior surface area
ERV/HRV None installed on corridor ventilations supply air
None installed on corridor ventilations supply air
MASSACHUSETTS MULTIFAMILY HIGH RISE BASELINE-FINAL
IV
SAMPLE PROJECTS AND DATA The final target sample for this study was 17 multifamily high rise projects—11 projects not participating in the MFHR program and six projects participating in the program. The final sample is six non-participating and 11 participating projects. The evaluation team (the Team) recruited ten non-participating and seven participating projects. However, four projects that were not participating in the program when they were recruited were later enrolled in the program, changing them from non-participating to participating projects. This reflects the program implementation contractor’s (ICF) strong marketing of the program and the program’s high market penetration (estimated to be over 50% of eligible buildings by the program’s implementation contractor).
Sample projects have a mix of incentivized and unincentivized measures. Some incentivized measures in projects participating in the MFHR program are incentivized by the MFHR program and some by other commercial and industrial (C&I) programs. Six participating projects received incentives from other C&I programs, including the C&I New Construction and C&I Custom programs; incentivized measures include lighting, heating, cooling, DHW, and pump measures. The results presented in this report compare the energy efficiency of incentivized to unincentivized measures and building characteristics regardless of what program the incentives came from.
The Team accessed data from a variety of sources. Data from on-site inspections were available for 11 projects. The Team relied on building department plans for five projects, and a combination of on-site inspection data and building department plans for one project. In addition, the program’s implementation contractor (ICF) provided application worksheets for participating projects and the PAs provided technical assistance (TA) reports for five projects.4
RECRUITING Recruiting eligible projects was challenging. It is often difficult to identify an appropriate contact who can approve an on-site inspection. Developers often need to provide approval for other contacts associated with the property (e.g., project managers or landlords) to allow evaluators on-site access and they were not motivated to participate by a $500 incentive. This study sought to inspect buildings that were largely complete but still contained unoccupied yet finished units that could be inspected as part of the on-site visit. Recruiting projects that were in this stage of construction/occupancy proved to be extremely difficult. In addition, projects nearing completion are often facing construction deadlines, budget issues, or other challenges that affect developers’ and project managers’ willingness to take time to participate in a voluntary study.
4 TA reports are technical assistance reports evaluating energy and cost savings associated with energy conservation measures for projects participating in the C&I Custom Incentive program. The reports are prepared for program administrators by outside consultants.

MASSACHUSETTS MULTIFAMILY HIGH RISE BASELINE-FINAL
V
ON-SITE INSPECTIONS AND PLAN REVIEWS The on-site inspections, which took one to two hours on average, varied in terms of on-site data collection due to the availability and cooperation of the primary contacts at each project. For all of the inspected buildings, auditors were able to access a unit to collect information on in-unit mechanical equipment, lighting, and appliances. Ultimately, on-site visits were used to create a relationship with the primary contact at each project which was then leveraged to procure project documents (e.g., as-built plans, submittals, etc.) and answer follow-up/clarifying questions.
In most cases the information collected on site was consistent with the plan and submittal information, but there were a few instances where that was not the case. In general, larger measures such as the building shell and mechanical equipment were consistent between the plans and on-site inspections. Smaller items, such as appliances and lighting, are easier for builders to change at the last minute and, as a result, there were occasional discrepancies between the on-site data collection and the plan review for these types of measures.
For projects that the Team was unable to recruit for an on-site inspection, the Team visited building departments to gather copies of available building plans and project documents and conducted mystery shopping visits. Consistent with findings in prior studies,5 the level of detail in building department plans and submittals varied widely from project to project and jurisdiction to jurisdiction. The Team found that mystery shopping is not a reliable option for confirming in-unit details. In general, the as-built information collected for sites where the Team conducted on-site inspections was much more detailed and accurate than the information collected from building departments. Any information that was verified via on-site inspections was used to override information from the plan review. In most cases the information collected on site was consistent with the plan information, some items, such as appliances and lighting, are easier for builders to change at the last minute and, consequently, there were occasional discrepancies between the on-site data collection and the plan review for these types of measures. The Team excluded measures from the detailed analyses when reliable information was not available. For this reason, the sample sizes associated with each measure may vary from what readers might expect.
RELATIVE PRECISION OF RESULTS Given the small sample sizes and limited data available for some buildings, the relative precision of measure and building characteristic results at the 90% confidence level vary widely.
Lighting measures have by far the highest variability from project to project and the poorest relative precisions, ranging from ±13% W/ft2 for stairwells to ±40% for garages.
5 http://ma-eeac.org/wordpress/wp-content/uploads/Commercial-Building-Department-Document-Review-Final-Report.pdf

MASSACHUSETTS MULTIFAMILY HIGH RISE BASELINE-FINAL
VI
Building envelope measure relative precisions range from ±4% for wood framed wall insulation R-value to ±27% for attic insulation R-value.
Mechanical equipment efficiencies (includes heating, cooling and water heating equipment), appliance kWh per year, and water fixture flow rates have the lowest variability from project to project and the best relative precisions.
o Relative precisions for all heating, cooling and water heating equipment are ±1% or better.
o Relative precisions for refrigerator, clothes washer and dishwasher kWh/yr. are ±2% or better.
o Relative precisions for showerhead, kitchen faucet, lavatory and toilet flush flow rates are all better than ±1%.
Statistical Testing
Throughout the report, statistical testing for significant differences at the 90% confidence level was conducted when the samples being compared had at least ten observations each. The only measures meeting this criterion, and therefore tested for significant difference, are appliances, water fixtures, and some mechanical equipment.
MEASURE-LEVEL FINDINGS Building Envelope
The Team assessed the average R-values and U-factors for key building shell components. In general, the Team found that average efficiencies of shell measures in the study sample either meet or exceed the current baseline energy model inputs in terms of efficiency. The sample sizes and the fact that the results include both incentivized and unincentivized measures should be considered when reviewing these findings. Below are some of the key findings for building envelope measures. More details can be found in Section 5, including both raw and area weighted averages.
The average unweighted R-value for wood-framed wall insulation is R-20.4 cavity insulation. This covers six projects, one that received incentives and five that did not. The overall average R-value is similar to the current program baseline value of R-13 cavity insulation plus R-7.5 continuous insulation.
The average unweighted R-value for steel-framed walls (R-17.5 cavity plus R-11.8 continuous) is higher than the current program input of R-13 cavity insulation plus R-7.5 continuous insulation. This covers nine projects, two of which received incentives and seven that did not.
The average unweighted R-value for flat roofs (R-31.0 continuous) is higher than the current program baseline (R-21.0 continuous). This covers 13 projects, three that received incentives and ten that did not.
The average unweighted R-value for attic insulation (R-33.0 cavity plus R-8.6 continuous) is slightly higher than the current program baseline (R-38 cavity). This covers six projects, one that received incentives and five that did not.

MASSACHUSETTS MULTIFAMILY HIGH RISE BASELINE-FINAL
VII
Mechanical Equipment
The Team identified the type and efficiency of heating, cooling, and water heating equipment. For each of these end uses there is a mix of whole building and in-unit equipment. Generally speaking, larger projects are associated with centralized mechanical equipment that is tied to in-unit distribution systems and smaller projects are associated with only in-unit equipment. More details can be found in Section 6.
The most common heating and cooling configuration among the inspected projects was to have central boilers and cooling towers connected to in-unit water source heat pumps (WSHPs). This is consistent with the MFHR program for large projects with central configurations. That said, the most common configuration in the program is a residentially metered in-unit fan coil system with air conditioning.
The efficiency of central commercial boilers (93.1% thermal efficiency) is much higher than the current energy model baseline (80% thermal efficiency). This covers ten projects, five that received incentives and five that did not. There is no major difference in efficiency between the two (93.2% thermal efficiency and 92.9% thermal efficiency, respectively).
The average efficiency of water source heat pumps is higher for the study buildings (4.9 COP for heating and 13.7 EER for cooling) than the current energy model baseline (4.2 COP for heating and 12.0 EER for cooling). This covers eight projects, three that received incentives and five that did not.
Appliances and Water Fixtures
The Team collected information on refrigerators, clothes washers, and dishwashers. We also collected flow rates for showerheads, kitchen faucets, and lavatory faucets. The bullets below detail the key findings associated with these measures. More details can be found in Section 9.
Refrigerators that received incentives have significantly lower annual electric consumption than unincentivized refrigerators (410 and 567, respectively). Relatedly, all of the incentivized refrigerators are ENERGY STAR certified while only 53% of the unincentivized refrigerators meet those criteria.
Clothes washers that received incentives have significantly lower annual electric consumption than unincentivized clothes washers (102 and 171 kWh/yr., respectively). All of the incentivized clothes washers are ENERGY STAR certified while 79% of the unincentivized clothes washers meet those criteria.6
6 Incentivized clothes washers were required to be more efficient than the minimum ENERGY STAR standard at the time.

MASSACHUSETTS MULTIFAMILY HIGH RISE BASELINE-FINAL
VIII
Showerheads (1.69 GPM vs. 1.75 GPM), kitchen faucets (1.47 GPM vs. 1.78 GPM), and lavatory faucets (1.12 GPM vs. 1.35 GPM) that received incentives all have significantly lower flow rates than their unincentivized counterparts.
Lighting
The lighting market has changed so much over the last few years that the lighting data collected for this report likely do not reflect the current lighting market. LED prices have fallen and acceptance of LEDs by builders and developers has grown substantially. Lighting power densities for both in-unit and common area lighting were highly variable and, consequently, the relative precisions of results are high (poor). More details can be found in Section 10.
In-Unit Lighting: CFL lighting is the predominant technology in the projects studied for this report. Overall, CFL bulbs account for 61% of in-unit bulbs and LEDs account for 11%. CFL bulbs also account for over one-half (53%) of in-unit lighting wattage and LEDs account for only four percent. Other bulbs, including incandescent bulbs, account for more than one half (55%) of the lighting wattage in projects where lighting measures were not incentivized.
For in-unit lighting power densities (LPD), measured in watts per square foot, the area weighted averages are lower than the raw averages for both projects where lighting was incentivized and projects where lighting was not incentivized. This indicates the projects with higher square footages installed more energy efficient lighting.
Common Area Lighting: LED bulbs predominated in common area lighting in the projects studied for this report. Overall, LED bulbs accounted for 39% of common area bulbs, CFLs accounted for 32%, T8/T5 bulbs for 26%, and other bulbs (including incandescent) accounted for 3%. However, T8/T5 bulbs predominated in common area lighting wattage. Overall, T8/T5 bulbs accounted for 45% of common area lighting wattage, CFLs accounted for 28%, LED bulbs for 23%, and other bulbs (including incandescent) accounted for 4%.
Several common areas were addressed: lobby/elevator, office, fitness, lounge/clubhouse, storage, corridors, stairwells, mechanical/utility rooms, meeting rooms, and garages. The energy model baselines address only lobby/elevator, office, fitness, lounge/clubhouse, storage, and corridor areas. (Meeting rooms fall under lounge/clubhouse and stairwells under corridors in the energy model. Incentives are provided for stairwells using the same LPD as corridors. Lighting controls in stairwells are also incentivized. Incentives are provided for garages on a prescriptive basis that aligns with the C&I Prescriptive Exterior Lighting offerings.) Not all projects have all these types of common areas and in some cases the building plans did not include useable lighting data for these areas. Therefore, the sample sizes for some areas are quite small and, as with in-unit lighting, the relative precisions of the results are high (poor). Unlike in-unit lighting, unweighted average LPD is higher than the area weighted average for some common areas and lower for others. Of the areas included in the energy model, LPD’s are lower than the current energy model baselines for lobby/elevator, office, and lounge/clubhouse (recreation) areas. LPD’s are

MASSACHUSETTS MULTIFAMILY HIGH RISE BASELINE-FINAL
IX
higher than the current energy model baselines for fitness, storage, and corridor areas. More detail can be found in Section 10.2.
RECOMMENDATIONS AND CONSIDERATIONS Recommendation: The PAs should use the new UDRH inputs that were agreed
to as part of this study to calculate program savings. The Team agreed to retrospective inputs that should be used to re-run savings for the 2016 program year and prospective inputs that should be used run savings for the 2017 program year. The final UDRH inputs were issued as an addendum to this report and can be found on the EEAC website.7
Recommendation: The PAs should conduct a process evaluation for the MFHR program to gain a better understanding of the MFHR market. A process evaluation could include interviews with key market actors (e.g., developers, architects, and project managers) that have participated in the program and those that have not. The evaluation could answer key questions that were identified during this evaluation: How does the accuracy of building department plans compare to those of as-
built plans? What is the likelihood of installing high efficiency appliances in the absence
of program incentives? What would motivate developers and project managers to participate in a
future baseline study? Are there measures not currently covered by the program that, if
incentivized, would result in increased efficiencies?
Consideration: Limit on-site inspections to in-unit and whole building lighting measures and rely on as-built building plans and submittals for building envelope, mechanical equipment, appliance, and water fixture measures: Focus on obtaining plans and submittals whenever possible as opposed to trying to conduct full on-site visits. The level of detail available from the on-site inspections is minimal and relying on plans would provide consistent data collection. This would also remove the need to target projects that are in one specific phase of construction. Lighting, however, is an exception because it is one of the most likely measure specifications to change from plan submittal to project completion, making on-site inspections necessary to identify where specifications changed during the building process.
Consideration: In future evaluations of common area lighting have program implementation staff work closely with the evaluation team to clarify the definitions of the various common areas: In many cases the decision of exactly what square footage should be considered as being in a specific common area
7 http://ma-eeac.org/wordpress/wp-content/uploads/Addendum-to-MA-Multifamily-High-Rise-Baseline-Study.pdf

MASSACHUSETTS MULTIFAMILY HIGH RISE BASELINE-FINAL
X
definition is not obvious. To make sure the evaluation study’s findings are comparable to program data it is important to ensure the evaluation team is defining these areas in the same way as the program.

MASSACHUSETTS MULTIFAMILY HIGH RISE BASELINE-FINAL
1
Section 1 Introduction The purpose of this study is to assess the baseline characteristics of high-rise (four-story and higher) multifamily buildings for the Massachusetts Program Administrators (PAs) and the Energy Efficiency Advisory Council (EEAC). NMR, Dorothy Conant, and DNV-GL (the Team), conducted on-site inspections, visited building departments, and conducted detailed plan reviews between 2014 and
2015 to answer the study’s research questions.
1.1 BACKGROUND AND STUDY GOAL This study represents the first baseline study of new construction building practices in high-rise multifamily buildings to support the Multifamily High Rise (MFHR) new construction program that is sponsored by the PAs. From 2010 through 2012 MFHR new construction projects were addressed through the Multifamily Pilot. As of 2013, the PAs Residential New Construction (RNC) program addresses two major housing categories: low rise and high rise. The low-rise category addresses detached and attached single-family homes and multifamily buildings that are three stories and lower. The high-rise category addresses MFHR buildings four stories and higher with five or more units.
The MFHR program offers two paths for participation:
Whole Building Simple Prescriptive Path: Addresses both in-unit savings and whole-building energy savings for all gas and electric energy-efficiency measures.
Residential In-Unit Savings Path: Focuses on the in-unit residential metered electric savings.
1.1.1 Study Goal
As previously mentioned, the goal of this study is to assess the baseline characteristics of MFHR new construction in Massachusetts. Specifically, at the building level, this study documents construction practices for building envelope, heating, ventilation, air conditioning, domestic hot water, common area lighting, and pump and motor characteristics. At the unit level, the study documents appliances, lighting, domestic hot water, heating systems, cooling systems, and water usage characteristics.
1.2 SAMPLING PLAN The Team originally proposed inspecting a sample of 30 projects—20 non-participating and 10 participating projects. Before finalizing the sample size, the Team conducted two dry-run inspections of eligible projects and mystery shopped two projects not interested in participating in the study to facilitate developing a realistic budget. (see section 1.3 Dry Run Inspections) Based on the results of the dry-run inspections the Team proposed a smaller sample size of 17 projects and the working group agreed–ten new non-participating projects and five new participating projects plus one non-participating and one participating project from the dry-run inspections.
1

MASSACHUSETTS MULTIFAMILY HIGH RISE BASELINE-FINAL
2
1.2.1 Final Sample
The final sample is six non-participating and 11 participating projects. The Team recruited ten non-participating and seven participating projects. However, four projects that were not participating in the program when recruited were later enrolled in the program, becoming participating projects.
Other characteristics of the sample include:
Location:
Eleven projects in Boston Two projects in Lawrence One project each in Cambridge, Brockton, Melrose and Marlborough
Year completed:
One project in 2012 Four projects in 2013 Seven projects in 2014 Five projects in 2015
Code permitted under
One project 7th edition/2006 IECC Thirteen projects 8th edition/2009 IECC Three projects unknown
Unit type
Fifteen apartment projects Two condo projects Twelve market rate unit projects Three market rate and affordable unit projects One affordable and low income unit project One low income project
Number of stories and units
Ten four to ten story projects with from 11 to 93 units Seven over ten story projects with from 177 to 400 units
1.2.2 Sample to Market Comparison
Although the final study sample includes a mix of small and large participating and non-participating projects it is a small sample and not a good representation of the overall high-rise multifamily building market. The program’s implementation contractor (ICF) reports the average participating building is five stories, 75 units, with residentially metered HVAC and

MASSACHUSETTS MULTIFAMILY HIGH RISE BASELINE-FINAL
3
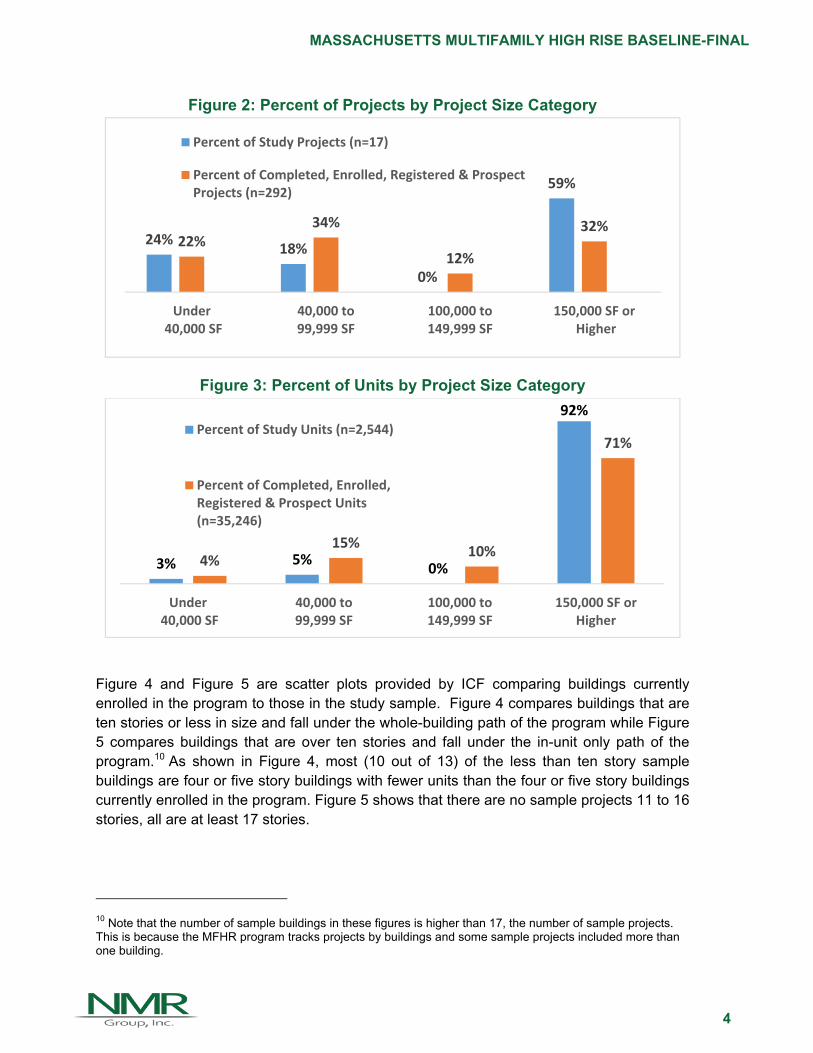
DHW.8 At the building level, the average sample building is 12 stories and 124 units. Figure 1 through Figure 3 below show how the 17 baseline study projects compare to current program data provided by ICF on completed, enrolled and registered projects plus the estimated number of prospect projects—the market.9 As shown, the 17 baseline study projects have higher percentages of 11 story or higher projects (41% vs.16% market), units in 11 story or higher projects (71% vs. 45% market), projects 150,000 square feet or larger (59% vs. 32% market), and units in projects 150,000 square feet or larger (92% vs. 71% market). This is not surprising because given the small sample size, the working group agreed to intentionally oversample large projects to cover more units and square footage.
Figure 1: Percent of Projects and Units by Project Story Category
8 Going forward, presumably both average size and unit count will be reduced now that all mastered-metered projects regardless of size must enroll in the high-rise program. 9 Completed projects have participated in the MFHR program and received incentives, enrolled and registered projects are projects that are currently participating in the MFHR program but the projects are not yet completed, and prospect projects are projects that are potentially eligible to participate in the MFHR program.
59%
41%
84%
16%
4 to 10 Story 11 Story Plus
Percent of Study Projects (n=17)
Percent of Completed, Enrolled,Registered & Prospect Projects(n=292)
29%
71%
55%45%
4 to 10 Story 11 Story Plus
Percent of Study Units (n=2,544)
Percent of Completed, Enrolled,Registered & Prospect Units(n=35,246)
MASSACHUSETTS MULTIFAMILY HIGH RISE BASELINE-FINAL
4
Figure 2: Percent of Projects by Project Size Category
Figure 3: Percent of Units by Project Size Category
Figure 4 and Figure 5 are scatter plots provided by ICF comparing buildings currently enrolled in the program to those in the study sample. Figure 4 compares buildings that are ten stories or less in size and fall under the whole-building path of the program while Figure 5 compares buildings that are over ten stories and fall under the in-unit only path of the program.10 As shown in Figure 4, most (10 out of 13) of the less than ten story sample buildings are four or five story buildings with fewer units than the four or five story buildings currently enrolled in the program. Figure 5 shows that there are no sample projects 11 to 16 stories, all are at least 17 stories.
10 Note that the number of sample buildings in these figures is higher than 17, the number of sample projects. This is because the MFHR program tracks projects by buildings and some sample projects included more than one building.
24%18%
0%
59%
22%34%
12%
32%
Under 40,000 SF
40,000 to99,999 SF
100,000 to149,999 SF
150,000 SF or Higher
Percent of Study Projects (n=17)
Percent of Completed, Enrolled, Registered & ProspectProjects (n=292)
3% 5%0%
92%
4%15%
10%
71%
Under 40,000 SF
40,000 to99,999 SF
100,000 to149,999 SF
150,000 SF orHigher
Percent of Study Units (n=2,544)
Percent of Completed, Enrolled,Registered & Prospect Units(n=35,246)

MASSACHUSETTS MULTIFAMILY HIGH RISE BASELINE-FINAL
5
Figure 4: Whole Building Path (≤ 10 Stories) Enrolled and Study Buildings
Figure 5: In-Unit Only Path (≥ 11 Stories) Enrolled and Study Buildings

MASSACHUSETTS MULTIFAMILY HIGH RISE BASELINE-FINAL
6
1.2.3 Data and Analysis
The Team accessed data from a variety of sources. Data from on-site inspections were available for 11 projects. The Team relied on building department plans for five projects, and a combination of on-site inspection data and building department plans for one project. In addition, ICF provided application worksheets for participating projects and the PAs provided Technical Assistance (TA) reports for five projects.
The Team initially analyzed data by project category, comparing measures in participating projects to measures in non-participating projects, and presented the results to the working group. We learned that participating projects have a mix of incentivized and unincentivized measures and that some incentivized measures are incentivized by the MFHR program and some by other commercial and industrial (C&I) programs. Six participating projects received incentives from other C&I programs, including the C&I New Construction and C&I Custom programs; incentivized measures include lighting, heating, cooling, DHW, and pump measures. The Team proposed analyzing all data by incentivized versus not incentivized and the working group agreed. Both raw and area weighted results are presented for lighting and building envelope measures.
1.2.4 Precision
In general, smaller sample sizes reduce overall study precision and it was unlikely a sample size of 17 projects would achieve an overall study precision of 90/10. It was impossible to know how many observations there would be for specific types of equipment before projects were recruited and inspected. We expected that the sample sizes for some specific types of equipment and building envelope characteristics would be very small and that confidence/precision levels would vary across measures.
Table 8 shows the actual coefficients of variation and relative precision at the 90% confidence level for inspected building and in-unit measures. The rows for measures with relative precisions higher than ±15% are highlighted. As shown, relative precisions range from ±4% to ±27% for building envelope measures; from ±1% to 2% for mechanical equipment, appliance kWh/yr., and water measures; and from ±13% to ±40% for lighting W/ft2.11
Table 8: Sample Coefficients of Variation and Relative Precisions
Parameter Sample
Size
Coefficient of Variation of Sample
Relative Precision
Building Envelope Measures
Wood Frame Wall Insulation R-value 6 0.06 ±4%
Steel Frame Wall Insulation R-value 9 0.27 ±15%
Roof Deck Insulation R-value 13 0.31 ±14%
Attic Insulation R-value 6 0.41 ±27%
Curtain Wall U-Factor 7 0.13 ±8%
11 The high relative precisions for lighting are discussed in more detail in lighting Section 10 and 10.2.

MASSACHUSETTS MULTIFAMILY HIGH RISE BASELINE-FINAL
7
Parameter Sample
Size
Coefficient of Variation of Sample
Relative Precision
Mechanical Equipment
Central Natural Gas Boiler Thermal Efficiency (TE) 29 0.01 ±0.3%
In-Unit Water Source Heat Pump Efficiencies Heating (COP) 1,975 0.04 ±0.1%
In-Unit Water Source Heat Pump Efficiencies Cooling (EER) 1,975 0.06 ±0.2%
In-Unit Ductless Mini-Split SEER 19 0.04 ±1%
In-Unit Central A/C SEER 219 0.04 ±0.4%
Whole Building Stand-Alone Natural Gas Water Heating TE 17 0.03 ±1%
In-Unit Stand-Alone Electric Hot Water Heater Energy Factor 57 0.01 ±0.2%
Refrigeration Consumption (kWh/yr.) 2,367 0.23 ±0.6%
Appliances
Clothes Washer Consumption (kWh/yr.) 1,927 0.49 ±2%
Dishwasher Consumption (kWh/yr.) 2,122 0.06 ±0.2%
Water Flow Rates
Showerhead Flow Rates (GPM) 3,537 0.24 ±0.5%
Kitchen Faucet Flow Rates (GPM) 2,696 0.18 ±0.5%
Lavatory Faucet Flow Rates (GPM) 3,782 0.27 ±0.5%
Toilet Flush Flow Rate (GPF) 4,032 0.12 ±0.2%
Lighting
In-Unit W/ft2 Lamped Area (projects) 16 0.54 ±21%
Common Area Corridor W/ft2 16 0.46 ±18%
Common Area Stairwells W/ft2 16 0.34 ±13%
Common Area Lobby/Elevator W/ft2 15 0.88 ±36%
Common Area Fitness W/ft2 4 1.11 ±90%
Common Area Mechanical/Utility Room W/ft2 7 0.58 ±38%
Common Area Storage Area W/ft2 8 0.69 ±39%
Common Area Office W/ft2 12 0.88 ±17%
Common Area Meeting Rooms W/ft2 4 0.7 ±57%
Common Area Lounge/Clubhouse W/ft2 7 0.45 ±27%
Common Area Garage W/ft2 6 0.61 ±40%

MASSACHUSETTS MULTIFAMILY HIGH RISE BASELINE-FINAL
8
1.3 DRY RUN INSPECTIONS In order to develop a realistic scope and budget for this study, the Team conducted dry-run inspections. The goal of these inspections was to answer the following research questions:
What is the pool of potential study participants?
What level of effort is required to procure participation from prospective participants?
How amenable are building managers to detailed on-site inspections?
How difficult is it to access as-built plans?
Can reasonable information be procured through mystery shopping and plan review at building departments?
The Team conducted two dry-run inspections, one with a participating project and one with a non-participating project. In addition, the Team conducted mystery shopping visits and building department outreach for two non-participant buildings. The dry-run inspections revealed:
Recruiting non-participating projects is difficult and time consuming. It is hard to get access to individual units if all units are occupied. Some projects may not agree to in-unit inspections and/or blower door testing. The walk-through inspection with the contractor/building manager takes 1-1.5 hours. There are different processes for accessing filed plans from different building
departments and different levels of cooperation from building departments. Limited information is available from mystery shopping.
The key findings of the dry-run inspections helped define the scope and budget associated with this study. The Team used the results of the two inspected buildings (one participating and one non-participating) in the final sample for the study.

MASSACHUSETTS MULTIFAMILY HIGH RISE BASELINE-FINAL
9
Section 2 Recruitment and Scheduling This section details the recruitment and scheduling efforts that took place as part of this study. Recruitment and scheduling activities took place in 2014 and 2015.
2.1 IDENTIFYING SAMPLE ICF International, the MFHR program’s implementation contractor, tracked multifamily new construction activity in the state in order to recruit projects for the program and track the program’s penetration rate. ICF provided the Team with a list of all projects that they had tracked since the beginning of the MFHR program. Table 9 displays the types of projects that were included in the database and the status of those projects at the time. Below is a brief definition of each project status:
Prospect project—A project that may fit the program criteria but has not been contacted by the implementation contractor, has not registered in the program, and has not completed participation in the program.
Recruited by ICF—A project that has not yet registered or participated in the program, but has been in contact with the implementation contractor.
Registered in program—A project that is registered with the program but has not yet completed participation.
Participated in program—A project that has completed participation in the program. Ineligible—A project that does not meet the participation criteria of the MFHR
program.
Table 9: Sample Disposition for Recruitment Project Status Count
Sample Size 493 Prospect project 54% Recruited by ICF 18%
Registered in program 16% Participated in program 9%
Ineligible 3%
As previously discussed, the Team decided to include a mix of both program participants and non-program buildings. The Team identified prospect projects as non-participant buildings while projects that either participated in the program or were registered or enrolled in the program were considered program participants. The Team recruited ten non-participant projects, but four of these enrolled in the program after they were recruited.
2

MASSACHUSETTS MULTIFAMILY HIGH RISE BASELINE-FINAL
10
2.2 BARRIERS TO RECRUITMENT The multifamily market has been a challenge to the energy-efficiency evaluation industry for quite some time,12 and this study continues to highlight that issue. Below is a list of some of the key barriers to recruitment that were identified during this study.
Numerous stakeholders—Multifamily buildings have many stakeholders: developers, architects, project managers, property managers, tenants, etc. For this reason, it is often difficult to identify an appropriate contact for on-site recruitment.
Developer approval—Developers often need to provide approval for other contacts associated with the property (e.g., project managers or architects) to allow evaluators access on site. Receiving this approval can be challenging for a variety of reasons, including the inability to make contact with the developer or a lack of incentive for the developer.
Lack of an incentive—Developers were not motivated by a $500 incentive to participate in this study. These are very busy people and the opportunity cost of giving up their time to participate was often greater than the $500 incentive. While project managers or landlords may be motivated by such an incentive, they often are not allowed to accept incentives and would have to provide them to the developer anyway.
Construction timing—This project sought to inspect buildings that were largely complete but still contained unoccupied yet finished units that could be inspected as part of the on-site visit. Identifying projects that were in this stage of construction/occupancy proved to be extremely difficult. On top of the challenges associated with identifying these types of projects, the difficulty in recruiting these projects was enhanced by the fact that projects nearing completion are often facing construction deadlines, budget issues, or other challenges that may limit developers’ willingness to take time to participate in a voluntary study.
These issues were magnified in many instances for this study, particularly because these were MFHR new construction projects.
2.3 RECRUITMENT STRATEGIES The Team used different strategies to recruit program participants and non-participants.
2.3.1 Program Participant Recruitment
ICF provided the evaluation team with the contact information for program participants whose projects were still under construction. These contacts were easy to recruit because of their association with the program. During recruitment, these contacts were reminded about their participation in the program and about their primary contact at ICF and the PAs. After mentioning ICF and PA contacts most of the program participants were more than willing to participate in the study.
12 http://www.iepec.org/wp-content/uploads/2015/papers/084.pdf

MASSACHUSETTS MULTIFAMILY HIGH RISE BASELINE-FINAL
11
2.3.2 Non-Participant Recruitment
The Team used a variety of strategies to recruit eligible non-participant projects to participate in the study. Given the complex MFHR new construction market, the Team attempted to contact a mix of market actors including developers, architects, project managers, and property managers.
The primary contact was typically the developer or project manager. As a starting point, the Team attempted to reach the primary contact first, before moving onto secondary contacts. Generally, the Team had access to the company name of the developer or project manager, but less frequently had the name of the person that needed to be contacted. The following steps were typically taken to try to procure participants in the study:
Attempt to identify the name, phone number, and email associated with the primary contact for the project. This was generally done through internet research or a phone call to the corporate office of the developer.
After the primary contact had been identified the Team conducted an average of five phone calls.
o Call were attempted at different times of the day and on different days of the week in order to reach the contacts.
Sent follow-up emails after phone calls and voicemails were not responded to If the primary contact was unable to be reached, then the Team conducted
secondary research to identify other contacts associated with the projects. o The Team conducted outreach to secondary contacts to see if 1) they would
provide access to the project or 2) they would put us in touch with the primary contact.
Overall, the non-participant recruitment process was extremely challenging. For the most part, these are contacts who had previously decided not to participate in the MFHR program. The program offers more incentives than a study such as this one ever could. As a result, it’s not surprising that these contacts decided not to participate in a study evaluating the program they elected not to participate in. The projects with contacts that are amenable to these types of studies appear to be participating in the program (as indicated by the high estimated program penetration rate), leaving the population that is most difficult to reach as non-participants for this study.
2.3.3 Building Department Visits and Mystery Shopping
In the end, the Team was unable to procure enough non-participant recruits agreeing to an on-site inspection to meet our revised sample targets for the study. As a result, the Team visited building departments to review the plans for three non-participant projects where we were unable to retrieve as-built plans or physically inspect the building. These projects were supplemented with mystery shopping visits, where the Team qualitatively assessed the measures on site and compared them with the building department plans. Specifically, during the mystery shopping visits, the Team attempted to verify the types of appliances, lighting, and in-unit mechanical equipment that were installed. In addition to in-unit details, the Team attempted to verify the type of common area lighting that was installed in various

MASSACHUSETTS MULTIFAMILY HIGH RISE BASELINE-FINAL
12
locations. Building department plans were also reviewed for information on whole building measures for two projects that participated only in the program’s Residential In-Unit Savings Path.
Identifying building departments that were willing and able to provide access to building plans proved challenging. Multiple building departments were non-responsive to our request to review building plans even after we filed written requests per their instruction. The City of Boston has building department plans available on public computers; these files were leveraged for this study, but the quality of the plans in terms of content, readability, and completeness varied widely by project.

MASSACHUSETTS MULTIFAMILY HIGH RISE BASELINE-FINAL
13
Section 3 On-site Data Collection and Plan Review This section details the data collection procedures that were followed during the on-site inspections and outlines the items that were reviewed as part of our building plan review.
3.1 ON-SITE DATA COLLECTION The on-site inspections varied in terms of on-site data collection due to the availability and cooperation of the primary contacts at each project. Ultimately, these visits were used to create a relationship with the primary contact at each project which was then leveraged to procure project documents (e.g., as-built plans, submittals, etc.) and answer follow-up/clarifying questions.
3.1.1 Walk-through with Building Manager
Upon arrival on site, auditors typically conducted a walk-through with the building manager. This took about one-to-two hours on average. During the walk-through building managers showed auditors the property and provided an overview of the building and its efficiency-related components. Specifically, this included access to and a discussion of the following items:
The building’s mechanical systems In-unit HVAC configurations Insulation R-values and materials Overview of the lighting and appliances in the buildings Status of equipment commissioning Participation in any PA incentive programs
3.1.2 In-Unit Inspections
For all inspected buildings, auditors were able to access a unit to collect information on in-unit mechanical equipment, lighting, and appliances. Initially, the Team planned to conduct blower door tests in units as well. In the end, auditors were only able to conduct a blower door test at one of the inspected buildings. Our ability to conduct blower door tests was constrained by a number of factors, but the most common were limited time available on site (due to participant availability), a lack of finished units, or a lack of unoccupied units that were finished and available for inspection.
3.1.3 Plan Review
The bulk of our data collection took place in the form of plan reviews. As previously mentioned, the on-site visits were leveraged to procure as-built plans and submittals from building managers for each of the inspected site visits. The level of detail and information available in as-built plans and submittals varied from project to project. Ultimately, the information gathered in building plans and submittals was corroborated with the on-site data
3

MASSACHUSETTS MULTIFAMILY HIGH RISE BASELINE-FINAL
14
collection and conversations with the primary contact for each property. This process was followed for buildings that we were able to successfully recruit for the project.
For projects that we were unable to recruit we visited building departments to gather copies of available building plans and project documents. Not surprisingly, the level of detail in building department plans and submittals varied widely from project to project and jurisdiction to jurisdiction. In general, the as-built information that we collected for sites that were visited as part of the on-site inspections were much more detailed and accurate than the information that we were able to collect at building departments. The Team attempted to verify the accuracy of building department plans through mystery shopping visits and a review of program documentation. The mystery shopping visits only provided qualitative information and therefore were not all that useful in verifying the accuracy of in-unit measures. The Team was able to leverage TA reports provided by the PAs to verify and/or override the building department plans for any whole building measures that received PA incentives.
Building plans were used to document detailed information for all aspects of data collection. Any information that was verified via on-site inspections was used to override information from the plan review. In most cases the information collected on site was consistent with the plan information, but there were a few instances where that was not the case. In general, larger measures such as the building shell and mechanical equipment were consistent between the plans and on-site inspections. Smaller items, such as appliances and lighting, are easier for builders to change at the last minute and as a result there were occasional discrepancies between the on-site data collection and the plan review for these types of measures.
3.1.4 Data Quality and Sample Sizes
As previously mentioned, the way that data were collected and the quality of the information available varied from site to site. Visually verified information, documentation provided by the PAs and ICF for incentivized measures, and as-built plans were the most reliable sources of consistent data collection. That said, even within these sources the level of detail and reliability associated with each measure was sometimes inconsistent. The variability of available and reliable data, along with the variability of data collection methods, should be taken into consideration when reviewing the results of this study. The Team excluded measures from the detailed analyses when reliable information was not available. For this reason, the sample sizes associated with each measure may vary from what readers might expect.

MASSACHUSETTS MULTIFAMILY HIGH RISE BASELINE-FINAL
15
Section 4 Comparison to Current Program Model Inputs This section compares the Team’s baseline study findings to the current program energy model baseline inputs that are used to calculate program savings. Both raw and area weighted results are presented in lighting and building envelope measure tables (Table 10
through Table 13). The current energy model baselines were provided to the evaluation Team in May of 2016. The current baselines are largely based on ASHRAE 90.1-2010 requirements. The details associated with the study findings in this section can be found in the measure-specific sections later in this report. These comparisons were meant to inform the PAs and EEAC about how the current program energy model baselines compare to the study findings. The study findings were used as a starting point to update the program energy model baselines. In the final UDRH13 the study findings were not directly adopted as the energy model baselines because of the small sample sizes and various data collection methods associated with this study. Instead, the results of this study were used to inform the final updated baseline inputs.
13 Final 2016-2017 UDRH Inputs: Addendum to Massachusetts Multifamily High Rise Baseline Study, Submitted to The Electric and Gas Program Administrators of Massachusetts by NMR Group, Inc. and Dorothy Conant. March 8, 2017.
4

MASSACHUSETTS MULTIFAMILY HIGH RISE BASELINE-FINAL
16
Table 10: Comparison of Program Inputs and Baseline Findings—Lighting
Current Program Model Inputs Study Findings
Measure Baseline Overall Study
Average Incentivized
Average Not Incentivized
Average
Don’t Know if Incentivized
Average
Residential Lighting Power Density (LPD)
0.75 W/SF W/SF (n=16)
Raw 0.61 WAV* 0.48
W/SF (n=8) Raw 0.40 WAV
0.35
W/SF (n=8) Raw 0.83 WAV 0.74
n/a
Lobby LPD 0.9 W/SF W/SF (n=15)
Raw 0.78 WAV 0.38
W/SF (n=4) Raw 0.63 WAV
0.29
W/SF (n=9) Raw 0.97 WAV 0.49
W/SF (n=x) Raw 0.26 WAV 0.30
Office LPD 1.11 W/SF W/SF (n=12)
Raw 0.75 WAV 0.74
W/SF (n=3) Raw 0.99 WAV
1.04
W/SF (n=7) Raw 0.68 WAV 0.49
W/SF (n=2) Raw 0.65 WAV 0.64
Fitness LPD 0.72 W/SF W/SF (n=4) Raw 1.18 WAV 1.66
n/a W/SF (n=3) Raw 0.53 WAV 0.41
W/SF (n=1) Raw 3.12 WAV 3.12
Recreation LPD 0.73 W/SF W/SF (n=7) Raw 0.47 WAV 0.47
W/SF (n=2) Raw 0.0.49 WAV
0.0.54
W/SF (n=4) Raw 0.48 WAV 0.45
W/SF (n=1) Raw 0.41 WAV 0.41
Storage LPD 0.63 W/SF W/SF (n=8) Raw 1.12 WAV 1.44
W/SF (n=1) Raw 1.01 WAV
1.01
W/SF (n=6) Raw 1.08 WAV 1.49
W/SF (n=1) Raw 1.45 WAV 1.45
Corridor LPD 0.66 W/SF W/SF (n=16)
Raw 0.97 WAV 0.79
W/SF (n=2) Raw 0.68 WAV
0.92
W/SF (n=12) Raw 0.1.03 WAV 0.68
W/SF (n=2) Raw 0.93 WAV 0.92
*Area weighted average.

MASSACHUSETTS MULTIFAMILY HIGH RISE BASELINE-FINAL
17
Table 11: Comparison of Program Inputs and Baseline Findings—Walls
Current Program Model Inputs Study Findings
Measure Baseline Overall Study
Average Incentivized Average
Not Incentivized Average
Don’t Know if Incentivized
Average
Mass R-13.3 c.i. n/a n/a n/a n/a
Wood Stud* R-13.0 + R-7.5 c.i. R, cavity only (n=6)
Raw 20.4, WAV 20.1
R, cavity only (n=1)
Raw 19.0 WAV 19.0
R, cavity only (n=5)
Raw 20.7 WAV 20.7
n/a
Metal Stud R-13.0 + R-7.5 c.i. n/a n/a n/a n/a
Steel Frame R-13.0 + R-7.5 c.i.
R, cavity + cont. (n=9)
Raw 17.5 + 11.8 c.i. WAV 18.7 + 10.2 c.i.**
R, cavity + cont. (n=2)
Raw 26.0 + 13.1 c.i. WAV 27.4 + 8.8 c.i.
R, cavity + cont. (n=7)
Raw 15.1 + 7.5 c.i. WAV 17.2 + 10.6 c.i.**
n/a
*The projects inspected did not include any wood framed walls with continuous insulation. **One site does not include cavity insulation and is excluded from the weighted cavity R-value calculation.

MASSACHUSETTS MULTIFAMILY HIGH RISE BASELINE-FINAL
18
Table 12: Comparison of Program Inputs and Baseline Findings—Roofs
Current Program Model Inputs Study Findings
Measure Baseline Overall Study
Average Incentivized
Average Not Incentivized
Average
Don’t Know if Incentivized
Average
Flat Roof R-20.0 c.i. R, cont. only (n=13)
Raw 31.0 c.i. WAV 26.8 c.i.
R, cont. only (n=3)
Raw 32.3 c.i. WAV 32.1 c.i.
R, cont. only (n=10)
Raw 30.6 c.i. WAV 26.1 c.i.
n/a
Attic R-38.0
R, cavity + cont. (n=6)
Raw 33.0 + 8.6 c.i. WAV 25.7 + 7.2 c.i.*
R, cavity + cont. (n=1)
Raw 50.0 + 5.0 c.i. WAV 50.0 + 5.0 c.i.
R, cavity + cont. (n=5)
Raw 29.7 + 9.3 c.i. WAV 24.8 + 7.6 c.i.*
n/a
*One site does not include continuous insulation and is excluded from the continuous R-value calculation.
Table 13: Comparison of Program Inputs and Baseline Findings—Curtain Walls/Windows
Current Program Model Inputs Study Findings
Measure Baseline Overall Study
Average Incentivized
Average Not Incentivized
Average
Don’t Know if Incentivized
Average
Curtain Wall/ Window U-Factor
U-0.35 U-factor (n=7)
Raw 0.36 WAV 0.36
n/a U-factor (n=7)
Raw 0.36 WAV 0.36
n/a

MASSACHUSETTS MULTIFAMILY HIGH RISE BASELINE-FINAL
19
Table 14: Comparison of Program Inputs and Baseline Findings—Heating Equipment
Current Program Model Inputs Study Findings
Measure Baseline Overall Study
Average Incentivized
Average Not Incentivized
Average
Don’t Know if Incentivized
Average
Whole Building Central Boiler
0.80 Thermal Efficiency
93.1 TE (n=29 boilers, 10 projects)
93.2 TE (n=15 boilers, 5
projects)
92.9 TE (n=14 boilers, 5
projects) n/a
Furnace with Central A/C 0.80 Thermal
Efficiency n/a n/a n/a n/a
Water Source Heat Pumps
4.2 COP 4.9 COP (n=1,975 WSHP, 8 projects)
5.0 COP (n=797 WSHP, 3
projects)
4.8 COP (n=1,178 WSHP, 5
projects) n/a
Ground Source Heat Pumps
3.1 COP n/a n/a n/a n/a
Ductless Mini-Split Heat Pumps
7.7 HSPF 9.70 HSPF (n=19 MS, 2 projects)
n/a 9.70 HSPF
(n=19 MS, 2 projects)
n/a
VRF - Air-Cooled 2.05 COP n/a n/a n/a n/a VRF - Air-Cooled with
Heat Recovery 2.05 COP n/a n/a n/a n/a

MASSACHUSETTS MULTIFAMILY HIGH RISE BASELINE-FINAL
20
Table 15: Comparison of Program Inputs and Baseline Findings—Cooling Equipment
Current Program Model Inputs Study Findings
Measure Baseline Overall Study
Average Incentivized
Average Not Incentivized
Average
Don’t Know if Incentivized
Average
Furnace with Central A/C 13.0 SEER 14.0 SEER
(n=219 CAC, 4 projects)
n/a 14.0 SEER
(n=219 CAC, 4 projects)
n/a
Hydronic Heating with Central A/C
13.0 SEER 14.0 SEER
(n=219 CAC, 4 projects)
n/a 14.0 SEER
(n=219 CAC, 4 projects)
n/a
Ductless Mini-Split Heat Pumps
13.0 SEER 16.8 SEER (n=19 MS, 2
projects) n/a
16.8 SEER (n=19 MS, 2
projects) n/a
Water Source Heat Pumps
12.0 EER 13.7 EER
(n=1,975 WSHP, 8 projects)
14.0 EER (n=797 WSHP, 3
projects)
13.6 EER (n=1,178 WSHP, 5
projects) n/a
Ground Source Heat Pumps
13.4 EER n/a n/a n/a n/a
VRF - Air-Cooled 10.6 EER n/a n/a n/a n/a VRF - Air-Cooled with
Heat Recovery 10.4 EER n/a n/a n/a n/a
Hydronic Baseboard with Through-Wall A/C
12.0 SEER n/a n/a n/a n/a
MASSACHUSETTS MULTIFAMILY HIGH RISE BASELINE-FINAL
21
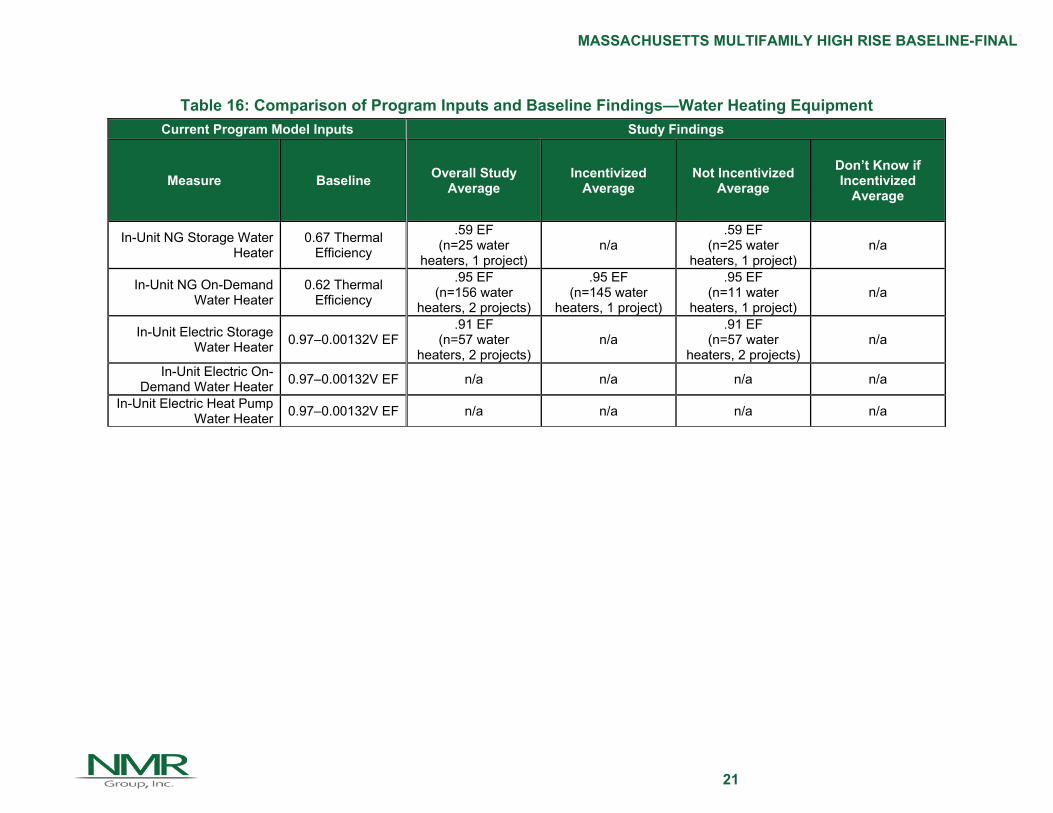
Table 16: Comparison of Program Inputs and Baseline Findings—Water Heating Equipment
Current Program Model Inputs Study Findings
Measure Baseline Overall Study
Average Incentivized
Average Not Incentivized
Average
Don’t Know if Incentivized
Average
In-Unit NG Storage Water Heater
0.67 Thermal Efficiency
.59 EF (n=25 water
heaters, 1 project) n/a
.59 EF (n=25 water
heaters, 1 project) n/a
In-Unit NG On-Demand Water Heater
0.62 Thermal Efficiency
.95 EF (n=156 water
heaters, 2 projects)
.95 EF (n=145 water
heaters, 1 project)
.95 EF (n=11 water
heaters, 1 project) n/a
In-Unit Electric Storage Water Heater
0.97–0.00132V EF.91 EF
(n=57 water heaters, 2 projects)
n/a .91 EF
(n=57 water heaters, 2 projects)
n/a
In-Unit Electric On-Demand Water Heater
0.97–0.00132V EF n/a n/a n/a n/a
In-Unit Electric Heat Pump Water Heater
0.97–0.00132V EF n/a n/a n/a n/a

MASSACHUSETTS MULTIFAMILY HIGH RISE BASELINE-FINAL
22
Table 17: Comparison of Program Inputs and Baseline Findings—Water Fixtures
Current Program Model Inputs Study Findings
Measure Baseline Overall Study
Average Incentivized
Average Not Incentivized
Average
Don’t Know if Incentivized
Average
Showerheads 2.5 GPM
1.90 GPM (n=3,537
showerheads, 14 projects)
1.69 GPM (n=1,558
showerheads, 6 projects)
1.75 GPM (n=1,144
showerheads, 7 projects)
2.50 GPM (n=835 showerheads,
1 project)
Lav Faucets 2.2 GPM 1.26 GPM
(n=3,782 faucets, 15 projects)
1.12 GPM (n=1,974 faucets, 8
projects)
1.35 GPM (n=973 faucets, 6
projects)
1.50 GPM (n=835 faucets, 1
project)
Kitchen Faucets 2.2 GPM 1.81 GPM
(n=2,696 faucets, 13 projects)
1.47 GPM (n=864 faucets, 5
projects)
1.78 GPM (n=997 faucets, 7
projects)
2.20 GPM (n=835 faucets, 1
project)
Table 18: Comparison of Program Inputs and Baseline Findings—Air Infiltration14
Current Program Model Inputs Study Findings
Measure Baseline Overall Study
Average Incentivized
Average Not Incentivized
Average
Don’t Know if Incentivized
Average
Whole Building Infiltration Rate 0.35 CFM75/SF of
exterior surface area n/a n/a n/a n/a
14 The Team attempted to conduct air leakage testing during the on-site inspections but was unable to do so given the stage of construction for participating projects and the time constraints associated with the on-site inspections.

MASSACHUSETTS MULTIFAMILY HIGH RISE BASELINE-FINAL
23
Table 19: Comparison of Program Inputs and Baseline Findings—Ventilation
Current Program Model Inputs Study Findings
Measure Baseline Overall Study
Average Incentivized
Average Not Incentivized
Average
Don’t Know if Incentivized
Average
ERV/HRV None installed on corridor ventilation
supply air
23 ERVs in 10 Projects
9 ERVs in 3 Projects14 ERVs in 7
Projects n/a

MASSACHUSETTS MULTIFAMILY HIGH RISE BASELINE-FINAL
24
Section 5 Building Envelope This section presents findings on the insulation R-values and glazing U-factors that were identified during the on-site inspections. Given the small number of buildings included in this study the sample sizes for some building envelope measures are much smaller than they are for others. We do not present detailed information on framing types or
insulation materials—instead this information is simply addressed in the text for this section.
The Team calculated R-values for shell measures in two ways. First, we calculated the average R-value for a component per project. This was done using the UA calculation method, where R-values are weighted based on their relative area within a project. After calculating one R-value per project, the R-values are then averaged across all projects. This approach provides all projects the same weight in terms of importance—the size of the building does not influence the findings. Under the second approach we calculated average R-values using a UA calculation across all projects. This approach provides a higher weight to larger projects since the shell assemblies have larger areas. The bullets below provide an example of the difference between these calculations using wall insulation.
Approach #1
Project 1—average R-value of 19.5 within the project (10,000 square feet of wall area)
Project 2—average R-value of 25.3 within the project (50,000 square feet of wall area)
22.41 19.5 2 25.3
2
Approach #2
Same Project R-values and wall area square footages as Approach #1
24.160,000
119.5
10,000 1
25.350,000
Both of these R-values are presented in each summary table.
5.1 WALL INSULATION For wood frame and steel frame wall insulation, the current energy model baseline for the program is R-13 cavity insulation plus R-7.5 continuous insulation based on ASHRAE 90.1 2010. The working group agreed to use the 2015 IECC requirements for these measures in the new UDRH; the 2015 IECC has the same requirements as ASHRAE 90.1 2010 and therefore these baseline inputs remain unchanged. Table 20 presents the average R-value statistics for wood-frame walls that were inspected as part of this study. Overall, six projects have wood-framed walls with an average R-value of R-20.4. One project received incentives for wall insulation and has R-19 wall insulation. The five not incentivized projects with wood-frame wall insulation have an average R-value of R-20.7 with R-values ranging
5

MASSACHUSETTS MULTIFAMILY HIGH RISE BASELINE-FINAL
25
from R-19.3 to R-22.0. When weighted by the wall area across all projects, the overall R-value is R-20.1. Of the six projects with wood-framed walls, five have fiberglass batt insulation. One of those projects also has a section of walls that are insulated with low-density spray foam. One project uses dense pack cellulose for wall insulation.
Table 20: Wood Frame Wall Total R-Value*
Wood Frame Wall R-Value All
(n=6 Projects) Incentivized
(n=1 Projects)
Not Incentivized
(n=5 Projects)
Minimum R-value 19.0 19.0 19.3
Maximum R-value 22.0 19.0 22.0
Average R-value 20.4 19.0 20.7
Median R-value 20.7 19.0 21.0
Coefficient of Variation 0.06 -- 0.05
Relative Precision at 90% 3.8% -- 3.6%
Area Weighted Avg. R-value 20.1 19.0 20.7
*Sample sizes too small to test for significant differences.
Table 21 presents the overall R-value statistics for projects with steel-framed walls. The overall average R-value for these walls is R-29.3, R-33.5 for projects that received incentives and R-28.1 for projects that did not. These R-values encompass both cavity and continuous insulation R-values. When weighted by the wall area across all projects the total average R-value falls to R-26.4. The average steel frame wall cavity R-value is R-17.5 and the average continuous insulation R-value is R-11.8. The cavity insulation in steel-framed walls is a mix of fiberglass batts, high density spray foam, and dense packed cellulose. Continuous insulation is a mix of high density spray foam and extruded polystyrene (XPS) rigid foam board.
Table 21: Steel Frame Wall Total R-Value*
Steel Frame Wall Total R-Value
All (n=9 Projects)
Incentivized (n=2 Projects)
Not Incentivized
(n=7 Projects)
Minimum R-value 18.0 29.0 18.0
Maximum R-value 40.0 38.0 40.0
Average R-value 29.3 33.5 28.1
Median R-value 30.0 33.5 30.0
Coefficient of Variation 0.27 0.19 0.30
Relative Precision at 90% 15.0% 22.1% 18.8%
Area Weighted Avg. R-value 26.4 36.4 25.0

MASSACHUSETTS MULTIFAMILY HIGH RISE BASELINE-FINAL
26
*Sample sizes too small to test for significant differences.
5.2 ROOF INSULATION Table 22 presents the R-value statistics for projects that had continuous roof deck insulation. The current energy model baseline for the program is R-20 continuous insulation based on ASHRAE 90.1 2010. The working group agreed to use a value of R-30 continuous insulation, based on 2015 IECC requirements, in the new UDRH. Overall, 13 projects have continuous roof deck insulation as their only form of roof top insulation and the overall average R-value is R-31.0. Three projects received incentives from the PAs for roof deck insulation and have an average R-value of R-32.3. The remaining ten projects did not receive incentives and have an average R-value of R-30.6. When weighted by the roof deck area across all projects the overall average R-value falls to R-26.8. Roof deck insulation material is typically XPS rigid foam or polyisocyanurate rigid foam insulation. One project has a combination of high density spray foam and extruded polystyrene insulation.
Table 22: Roof Deck R-Value (Continuous Only)*
Roof Deck R-Value All
(n=13 Projects)Incentivized
(n=3 Projects)
Not Incentivized
(n=10 Projects)
Minimum R-value 20.0 25.0 20.0
Maximum R-value 50.0 40.0 50.0
Average R-value 31.0 32.3 30.6
Median R-value 30.0 32.0 27.5
Coefficient of Variation 0.31 0.23 0.34
Relative Precision at 90% 14.0% 22.0% 17.7%
Area Weighted Avg. R-value 26.8 32.1 26.1
*Sample sizes too small to test for significant differences.
For the purposes of this report, attic insulation is considered to include any project that contained some form of cavity insulation in the attic and/or roof. The current energy model baseline for the program is R-38 cavity insulation based on ASHRAE 90.1 2010. The working group agreed to use a value of R-49 cavity insulation, based on 2015 IECC requirements, in the new UDRH. Table 23 presents the R-value statistics for attic insulation. Please note that these values account for both cavity and continuous insulation. As shown the overall average R-value for attics in the study is R-41.6. One project received incentives for attic insulation and has an average R-value of R-55. Across all projects the average R-value of cavity insulation is R-33.0 and the average R-value of continuous insulation is R-8.6. When weighted by the attic area across all projects the overall average R-value falls to R-30.0.
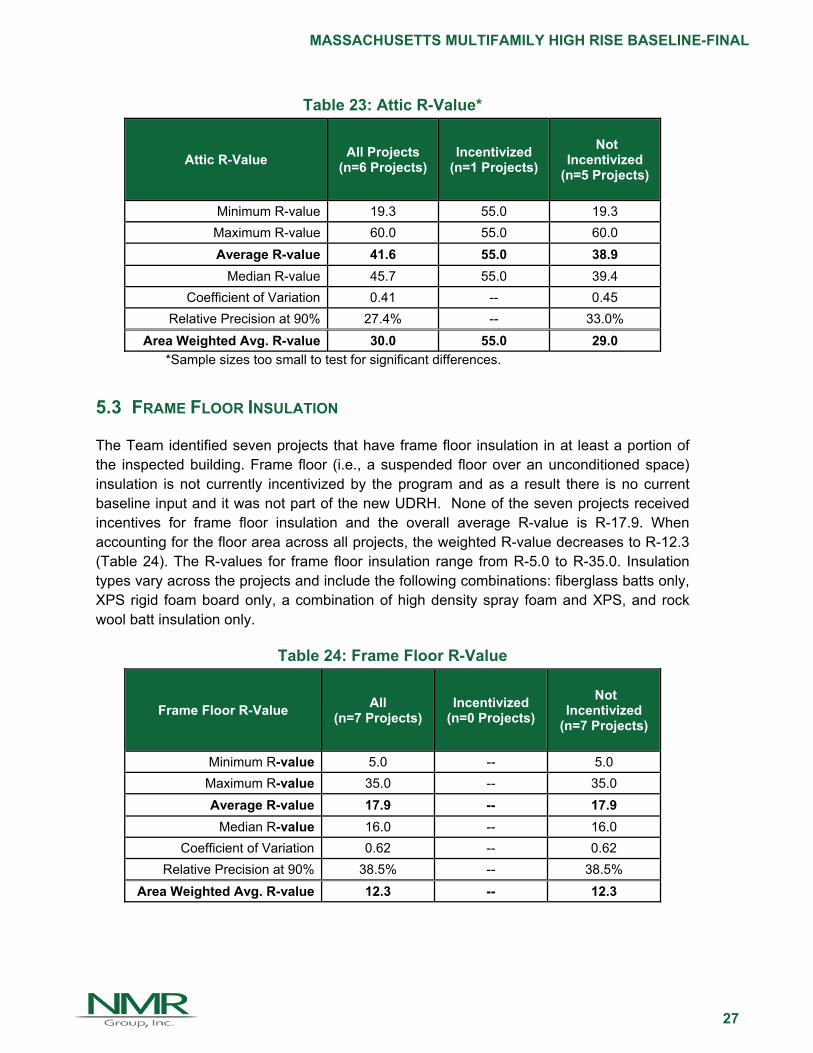
MASSACHUSETTS MULTIFAMILY HIGH RISE BASELINE-FINAL
27
Table 23: Attic R-Value*
Attic R-Value All Projects
(n=6 Projects) Incentivized
(n=1 Projects)
Not Incentivized
(n=5 Projects)
Minimum R-value 19.3 55.0 19.3
Maximum R-value 60.0 55.0 60.0
Average R-value 41.6 55.0 38.9
Median R-value 45.7 55.0 39.4
Coefficient of Variation 0.41 -- 0.45
Relative Precision at 90% 27.4% -- 33.0%
Area Weighted Avg. R-value 30.0 55.0 29.0
*Sample sizes too small to test for significant differences.
5.3 FRAME FLOOR INSULATION
The Team identified seven projects that have frame floor insulation in at least a portion of the inspected building. Frame floor (i.e., a suspended floor over an unconditioned space) insulation is not currently incentivized by the program and as a result there is no current baseline input and it was not part of the new UDRH. None of the seven projects received incentives for frame floor insulation and the overall average R-value is R-17.9. When accounting for the floor area across all projects, the weighted R-value decreases to R-12.3 (Table 24). The R-values for frame floor insulation range from R-5.0 to R-35.0. Insulation types vary across the projects and include the following combinations: fiberglass batts only, XPS rigid foam board only, a combination of high density spray foam and XPS, and rock wool batt insulation only.
Table 24: Frame Floor R-Value
Frame Floor R-Value All
(n=7 Projects) Incentivized
(n=0 Projects)
Not Incentivized
(n=7 Projects)
Minimum R-value 5.0 -- 5.0
Maximum R-value 35.0 -- 35.0
Average R-value 17.9 -- 17.9
Median R-value 16.0 -- 16.0
Coefficient of Variation 0.62 -- 0.62
Relative Precision at 90% 38.5% -- 38.5%
Area Weighted Avg. R-value 12.3 -- 12.3

MASSACHUSETTS MULTIFAMILY HIGH RISE BASELINE-FINAL
28
5.4 SLAB INSULATION Slab insulation was previously covered by the program though incentives were discontinued in 2016. As a result, there is no current baseline input and this measure is not included in the new UDRH. Eleven of the 17 projects had slab on-grade construction. Slab insulation details were documented based on plan review as the Team inspected completed buildings and therefore the slabs and any corresponding insulation were not visible.
Seven of the eleven projects with slab on-grade construction either did not have slab insulation or the Team was unable to determine if slab insulation was present based on a review of building plans and supplemental documentation. Note, four of the seven projects without slab insulation were renovation projects that likely did not re-pour the building slab upon renovation.
The overall average R-value for projects with slab on-grade construction is R-3.7. The average among the four projects with insulation is R-10.25. Slab insulation was typically located on the perimeter and under the slab and was insulated using a variety of rigid foam board insulation types.
5.5 FOUNDATION WALL INSULATION Foundation wall insulation is not a measure that is currently incentivized by the program. As a result, there is no current baseline input and this measure is not included in the new UDRH. Six of the 17 projects inspected as part of this study were found to have foundation walls that acted as part of the thermal boundary. None of these six projects received incentives for foundation wall insulation. The average R-value for these projects is R-7.1. Two of the six projects did not have any foundation wall insulation while the other four have an average R-value of R-10.7. Two of the four projects with foundation wall insulation use XPS as the insulation material and the other two use spray foam (one with low density spray foam and the other with high density spray foam).
5.6 GLAZING EFFICIENCY Table 25 presents the curtain wall U-factors that were identified as part of the inspections for this study. The current energy model baseline for the program is U-0.35 based on ASHRAE 90.1 2010. The working group agreed to use the 2015 IECC requirements for fenestration U-factors in the new UDRH. This results in a new baseline of U-0.38 for fixed fenestration and U-0.45 for operable fenestration. Seven projects have curtain walls and these typically compose a large portion of the overall wall area, in some cases curtain walls represent the entire wall area for the inspected buildings. On average, curtain walls have a U-factor of 0.36 with a minimum of 0.34 and a maximum of 0.47—none of the inspected projects received incentives for curtain walls. The overall average U-factor for curtain walls remains the same when weighted to account for the total curtain wall area across all projects.
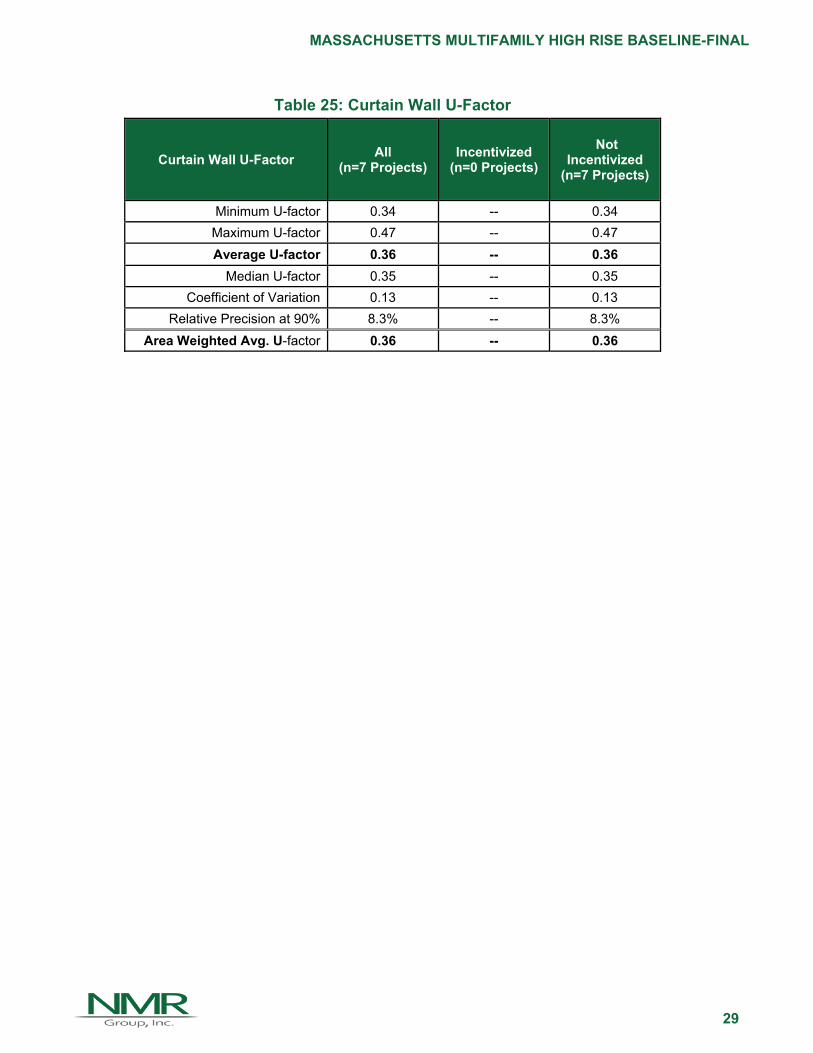
MASSACHUSETTS MULTIFAMILY HIGH RISE BASELINE-FINAL
29
Table 25: Curtain Wall U-Factor
Curtain Wall U-Factor All
(n=7 Projects) Incentivized
(n=0 Projects)
Not Incentivized
(n=7 Projects)
Minimum U-factor 0.34 -- 0.34
Maximum U-factor 0.47 -- 0.47
Average U-factor 0.36 -- 0.36
Median U-factor 0.35 -- 0.35
Coefficient of Variation 0.13 -- 0.13
Relative Precision at 90% 8.3% -- 8.3%
Area Weighted Avg. U-factor 0.36 -- 0.36

MASSACHUSETTS MULTIFAMILY HIGH RISE BASELINE-FINAL
30
Section 6 Mechanical Equipment This section details the whole building and in-unit mechanical equipment that was documented as part of this study. Results are presented for all measures and then separately for measures that were incentivized, not incentivized, or the Team was unable to determine the
incentive status.
6.1 HEATING SYSTEM SUMMARY Table 26 shows the distribution of heating system configurations from the inspected projects. Twelve of the 17 projects have central heating equipment while the remaining five have in-unit heating equipment. As shown, the most common configuration is a central boiler in conjunction with in-unit water source heat pumps (WSHPs); this configuration was only found in larger buildings.
Table 26: Distribution of Heating Configurations in Inspected Buildings
Heating System Technology Central or In-Unit Heating
Configuration
All Projects (n=17)
Central boiler with in-unit WSHP Central 8 (47%)
Central boiler with in-unit baseboard Central 2 (12%)
Domestic hot water tank serving as hydro-air boiler In-Unit 2 (12%)
Central boiler with in-unit room fan coil units Central 1 (6%)
Central steam plant serving in-unit room fan coil units Central 1 (6%)
In-unit furnaces In-unit 1 (6%)
In-unit ductless mini-splits In-Unit 1 (6%)
Mix of in-unit furnaces and ductless mini-splits In-Unit 1 (6%)
6.1.1 Whole Building Heating Systems
Table 27 presents details on the thermal efficiency of central natural gas boilers that were found during the on-site inspections. The current energy model baseline for the program is a thermal efficiency of 80% based on ASHRAE 90.1 2010. The working group agreed that the new UDRH would use a baseline of 82% AFUE for boilers that are less than 300,000 Btu/h in capacity and 85% thermal efficiency for boilers with a capacity greater than or equal to 300,000 Btu/h; the former is the federal standard and the latter is from the gas
6

MASSACHUSETTS MULTIFAMILY HIGH RISE BASELINE-FINAL
31
boiler market characterization study.15 In total, 29 central natural gas boilers, found in ten separate projects, were identified as the primary heating system for the building and units. The average thermal efficiency across all boilers is 93.1% and there is no significant difference in thermal efficiency between incentivized boilers and unincentivized boilers. One project has two large residential boilers that were not incentivized and have efficiencies of 95 AFUE; these boilers are not included in Table 27 because they are residential boilers rated for efficiency in terms of AFUE as opposed to the other central boilers that are commercial boilers and rated in terms of thermal efficiency.
The number of central boilers per project ranges from one to four boilers and the capacity of boilers ranges from 556 kBtuh to 2,850 kBtuh.
Table 27: Central Natural Gas Boiler Thermal Efficiency (%)
Central Boiler Thermal Efficiency (%)
All (n=29 Boilers, 10 Projects)
Incentivized (n=15 Boilers,
5 Projects)
Not Incentivized (n=14 Boilers,
5 Projects)
Minimum TE 92.0 92.0 92.0
Maximum TE 94.6 94.5 94.6
Average TE 93.1 93.2 92.9
Median TE 93.5 93.5 92.0
Coefficient of Variation 0.01 0.01 0.01
Relative Precision at 90% 0.3% 0.4% 0.5%
Eight of the ten projects with central boilers use in-unit WSHPs to provide heating and cooling to individual units. Overall the Team identified 1,975 WSHPs--797 incentivized units in three projects and 1,178 unincentivized units in five projects. Table 28 presents the average coefficient of performance (COP) for the heating side of the inspected WSHPs. The current energy model baseline for the program is 4.2 COP based on ASHRAE 90.1 2010. The new UDRH input is 4.3 COP based on ASHRAE 90.1 2013. Overall, the average COP for WSHPs is 4.9. Incentivized WSHPs have a significantly higher COP (5.0) than unincentivized WSHPs (4.8) (Table 28).
The capacity of WSHPs ranges from 12.5 kBtuh per unit to 27.9 kBtuh per unit.
Table 28: In-Unit Water Source Heat Pump Efficiencies (COP)
WSHP-COP All
(n=1,975 WSHP, 8 Projects)
Incentivized (n=797 WSHP,
3 Projects)
Not Incentivized (n=1,178 WSHP,
5 Projects)
Minimum COP 4.5 4.7 4.5
Maximum COP 5.2 5.2 5.1
15 http://ma-eeac.org/wordpress/wp-content/uploads/Gas-Boiler-Market-Characterization-Study-Phase-II-Final-Report.pdf

MASSACHUSETTS MULTIFAMILY HIGH RISE BASELINE-FINAL
32
Average COP 4.9 5.0* 4.8*
Median COP 4.7 5.0 4.7
Coefficient of Variation 0.04 0.04 0.04
Relative Precision at 90% 0.1% 0.2% 0.2%
*Significantly different at the 90% confidence level.
6.1.2 In-Unit Heating Systems
Five of the 17 inspected projects (29%) have in-unit heating systems that were not tied to any sort of central heating equipment. Two separate projects have domestic water heating systems that serve as hydro-air boilers. In each of these projects a hot water heater has been plumbed to act as a boiler and the hot water is run through an in-unit air handler. One project uses natural gas instantaneous hot water heaters with an Energy Factor of 0.95 while the other uses natural gas stand-alone water heaters with an Energy Factor of 0.59.
Three projects used either in-unit furnaces or in-unit ductless mini-splits for heating. In total, there were 49 furnaces in two projects, all of which were not incentivized and have an efficiency of 95 AFUE. Table 29 details the efficiencies of the ductless mini-splits that were identified in two projects. The current energy baseline input for the program is 7.7 HSPF based on ASHRAE 90.1 2010. The new UDRH input is 8.2 HSPF based on a ductless mini-split heat pump impact evaluation. 16 As shown, no in-unit ductless mini-splits were incentivized by the PAs and the average heating efficiency is 9.7 HSPF.
Table 29: In-Unit Ductless Mini-Split HSPF
In-Unit Ductless MS HSPF
All (n=19 Ductless MS, 2 Projects)
Incentivized (n=0 Ductless MS, 0 Projects)
Not Incentivized (n=19 Ductless MS, 2 Projects)
Minimum HSPF 9.3 -- 9.3
Maximum HSPF 10.0 -- 10.0
Average HSPF 9.7 -- 9.7
Median HSPF 10.0 -- 10.0
Coefficient of Variation 0.04 -- 0.04
Relative Precision at 90% 1.4% -- 1.4%
6.2 COOLING SYSTEM SUMMARY Table 30 shows the distribution of cooling system configurations from the inspected projects. As was the case with heating configurations, 12 of the 17 projects have central cooling equipment while the remaining five have in-unit cooling equipment. As shown, the most common configuration is a cooling tower in conjunction with in-unit WSHPs; this configuration was only found in larger buildings.
16 http://ma-eeac.org/wordpress/wp-content/uploads/Ductless-Mini-Split-Heat-Pump-Impact-Evaluation.pdf
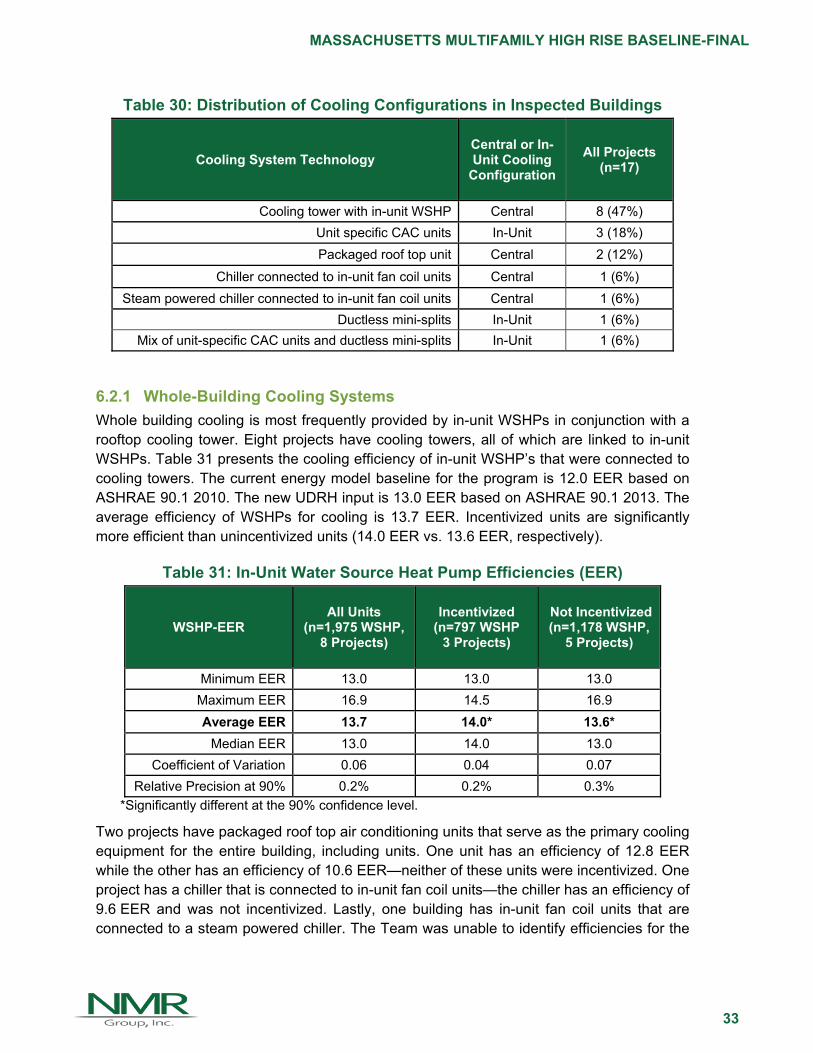
MASSACHUSETTS MULTIFAMILY HIGH RISE BASELINE-FINAL
33
Table 30: Distribution of Cooling Configurations in Inspected Buildings
Cooling System Technology Central or In-Unit Cooling
Configuration
All Projects (n=17)
Cooling tower with in-unit WSHP Central 8 (47%)
Unit specific CAC units In-Unit 3 (18%)
Packaged roof top unit Central 2 (12%)
Chiller connected to in-unit fan coil units Central 1 (6%)
Steam powered chiller connected to in-unit fan coil units Central 1 (6%)
Ductless mini-splits In-Unit 1 (6%)
Mix of unit-specific CAC units and ductless mini-splits In-Unit 1 (6%)
6.2.1 Whole-Building Cooling Systems
Whole building cooling is most frequently provided by in-unit WSHPs in conjunction with a rooftop cooling tower. Eight projects have cooling towers, all of which are linked to in-unit WSHPs. Table 31 presents the cooling efficiency of in-unit WSHP’s that were connected to cooling towers. The current energy model baseline for the program is 12.0 EER based on ASHRAE 90.1 2010. The new UDRH input is 13.0 EER based on ASHRAE 90.1 2013. The average efficiency of WSHPs for cooling is 13.7 EER. Incentivized units are significantly more efficient than unincentivized units (14.0 EER vs. 13.6 EER, respectively).
Table 31: In-Unit Water Source Heat Pump Efficiencies (EER)
WSHP-EER All Units
(n=1,975 WSHP, 8 Projects)
Incentivized (n=797 WSHP
3 Projects)
Not Incentivized (n=1,178 WSHP,
5 Projects)
Minimum EER 13.0 13.0 13.0
Maximum EER 16.9 14.5 16.9
Average EER 13.7 14.0* 13.6*
Median EER 13.0 14.0 13.0
Coefficient of Variation 0.06 0.04 0.07
Relative Precision at 90% 0.2% 0.2% 0.3%
*Significantly different at the 90% confidence level.
Two projects have packaged roof top air conditioning units that serve as the primary cooling equipment for the entire building, including units. One unit has an efficiency of 12.8 EER while the other has an efficiency of 10.6 EER—neither of these units were incentivized. One project has a chiller that is connected to in-unit fan coil units—the chiller has an efficiency of 9.6 EER and was not incentivized. Lastly, one building has in-unit fan coil units that are connected to a steam powered chiller. The Team was unable to identify efficiencies for the

MASSACHUSETTS MULTIFAMILY HIGH RISE BASELINE-FINAL
34
cooling towers that are connected to in-unit WSHPs in eight projects and the steam powered chiller found in one project.
6.2.2 In-Unit Cooling Systems
Five of the 17 projects (29%) included in this study have in-unit cooling systems that are not connected to a larger central system. Three projects have central air conditioning systems dedicated to each individual unit, one project has ductless mini-splits in each unit, and one has a mix of central air conditioning systems and ductless mini-splits in the units. Table 32 and Table 33 detail the efficiency of central air conditioning systems and ductless mini-splits that were identified during the on-site inspections. The current energy model baseline for the program is 13.0 SEER for both of these technologies based on ASHRAE 90.1 2010. The new UDRH input for central air conditioning systems is 13.0 SEER, which is the current federal standard. The new UDRH input for ductless mini-splits is 14.5 SEER and 12.0 EER based on the previously mentioned ductless mini-split heat pump impact evaluation. As shown the average efficiency of central air conditioning systems is 14.0 SEER while the average efficiency of ductless mini-splits is 16.8 SEER; none of the inspected central air conditioning systems or ductless mini-splits were incentivized by the PAs.
Table 32: In-Unit Central Air Conditioning SEER
In-Unit Central A/C SEER
All (n=219 CAC
Units)
Incentivized (n=0 CAC Units)
Not Incentivized (n=219 CAC
Units)
Minimum SEER 13.0 -- 13.0
Maximum SEER 15.0 -- 15.0
Average SEER 14.0 -- 14.0
Median SEER 14.0 -- 14.0
Coefficient of Variation 0.04 -- 0.04
Relative Precision at 90% 0.4% -- 0.4%
Table 33: In-Unit Ductless Mini-Split SEER
In-Unit Ductless MS SEER
All (n=19 Ductless
MS)
Incentivized (n=0 Ductless MS)
Not Incentivized (n=19 Ductless
MS)
Minimum SEER 16.3 -- 16.3
Maximum SEER 17.5 -- 17.5
Average SEER 16.8 -- 16.8
Median SEER 16.3 -- 16.3
Coefficient of Variation 0.04 -- 0.04
Relative Precision at 90% 1.4% -- 1.4%

MASSACHUSETTS MULTIFAMILY HIGH RISE BASELINE-FINAL
35
6.3 WATER HEATING SUMMARY Table 34 displays the water heating technologies being used in the inspected buildings. As shown, 12 out of 17 projects (71%) have central water heating equipment while the remaining five have unit-specific equipment. The most common water heating configuration, typically in larger buildings, is to have commercial stand-alone gas water heaters that supply both common area and in-unit domestic hot water.
Table 34: Distribution of Water Heating Configurations in Inspected Buildings
Water Heating System Technology
Central or In-Unit Water
Heating Configuration
All Projects (n=17)
Commercial stand-alone gas water heaters Central 9 (53%)
Commercial indirect tanks Central 2 (12%)
Stand-alone electric water heaters In-Unit 2 (12%)
Instantaneous natural gas water heaters In-Unit 2 (12%)
Stand-alone gas water heaters In-Unit 1 (6%)
Steam powered instantaneous water heating system Central 1 (6%)
6.3.1 Whole-Building Water Heating Systems
Among the sampled projects, whole building water heating is most commonly provided by condensing natural gas storage tank water heaters. Table 35 presents the efficiencies of such water heaters. As shown, the overall thermal efficiency for these water heaters is 93.8%--incentivized units have a thermal efficiency of 92.5% and unincentivized units have a thermal efficiency of 94.2%.
Table 35: Whole Building Stand-Alone Natural Gas Water Heating Efficiencies
Stand-Alone Gas DHW TE (%)
All (n=17 Water
Heaters, 9 Projects)
Incentivized (n=4 Water
Heaters, 2 Projects)
Not Incentivized (n=13 Water
Heaters, 7 Projects)
Minimum TE 89.0 90.0 89.0
Maximum TE 96.0 95.0 96.0
Average TE 93.8 92.5 94.2
Median TE 95.0 92.5 95.0
Coefficient of Variation 0.03 0.03 0.03
Relative Precision at 90% 1.1% 2.6% 1.2%

MASSACHUSETTS MULTIFAMILY HIGH RISE BASELINE-FINAL
36
Two projects use commercial indirect water heaters with heat provided by the central heating systems. The efficiency for these units is a function of the boiler efficiency. Finally, one project has a central steam powered water heating system.
6.3.2 In-Unit Water Heating Systems
Five projects have in-unit water heating systems, two with electric storage tank water heaters, two with natural gas instantaneous water heaters, and one with natural gas stand-alone storage tank water heaters.
Table 36 details the energy factors for the in-unit electric water heaters that were identified during the inspections. The current energy model baseline for the program is a .97 EF based on ASHRAE 90.1 2010. The new UDRH input is 0.96 EF minus 0.0003 times the volume of the unit for systems with a volume less than or equal to 55 gallons. The new UDRH input for systems with a volume greater than 55 gallons is 2.057 EF minus 0.00113 times the volume of the unit. Both values are based on the current federal standard. The average energy factor is 0.91 and none of the water heaters were incentivized by the PAs.
Table 36: In-Unit Stand-Alone Electric Hot Water Heater Efficiency (EF)
In-Unit Stand-Alone Electric DHW EF
All (n=57 Water
Heaters, 2 Projects)
Incentivized (n=0 Water
Heaters, 0 Projects)
Not Incentivized (n=57 Water
Heaters, 2 Projects)
Minimum EF 0.90 -- 0.90
Maximum EF 0.92 -- 0.92
Average EF 0.91 -- 0.91
Median EF 0.92 -- 0.92
Coefficient of Variation 0.01 -- 0.01
Relative Precision at 90% 0.2% -- 0.2%
All of the in-unit instantaneous natural gas water heaters have energy factors of 0.95; one project with 145 water heaters received incentives from the PAs while the other project with 11 water heaters did not. Only one project has in-unit stand-alone natural gas water heaters. In total, there are 25 of these waters heaters, none of which were incentivized, that have energy factors of 0.59.

MASSACHUSETTS MULTIFAMILY HIGH RISE BASELINE-FINAL
37
Section 7 Ventilation The Team documented the presence and characteristics of rooftop ventilation units for buildings included in this study. The most common form of ventilation is rooftop energy recovery ventilation (ERV) units. These units typically provide ventilation to the entire building, including both common areas and residential units.
In total, the Team identified 23 ERV’s in ten different projects. Three projects, with a total of nine ERV’s received incentives from the PAs for their ventilation equipment, while the remaining seven projects, with a total of 14 ERVs, did not receive incentives. The Team was only able to verify the efficiency ratings for 12 of the 23 ERVs. The average total efficiency for these 12 units is 68.1% with a minimum of 64% and maximum of 80.4%. The Team verified the flow rate for all of the units and the average flow rate is 7,564 cubic feet per minute (CFM). The minimum flow rate is 750 CFM and the maximum is 30,000 CFM.
7

MASSACHUSETTS MULTIFAMILY HIGH RISE BASELINE-FINAL
38
Section 8 Motors and Drives This section briefly details the available information on motors and drives that was collected as part of this study. As part of the on-site inspections and plan review the Team documented the presence and count of variable frequency drives (VFDs) and electronically commutated motors (ECMs).
8.1 ELECTRONICALLY COMMUTATED MOTORS The Team used a combination of in-unit inspections and plan reviews to identify the make and model of WSHPs, furnaces, and air handlers. The make and model information associated with these technologies was used to identify whether or not ECMs were present. The program does not currently incentivize ECMs specifically; instead, the program incentivizes the overall efficiency of units such as furnaces, which incorporates the efficiency of the ECM.
The Team confirmed that 19% of the 1,975 WSHPs that were identified as part of this study contain ECMs. It is possible that this is an underestimate as the Team was unable to verify all the model specifications for the WSHPs in some projects.
The Team tracked the presence of ECMs in furnaces and air handlers that were inspected as part of this study. Of the 49 furnaces that were inspected as part of this study, 39 (80%) have ECMs. The two projects with domestic water heating systems that serve as hydro-air boilers utilize air handlers with ECMs; these projects have 170 air handlers with EMCs.
8.2 VARIABLE FREQUENCY DRIVES The presence and count of VFDs was typically documented through a plan review and it was often challenging to determine the exact presence and count of this technology. As a result, the information presented in this section should be considered an estimate given the wide range in quality and availability of detailed plans.
Overall, the Team identified 138 VFDs in 15 different projects. Six of the 15 projects, representing 41% of all VFDs, were incentivized by the PAs. The remaining nine projects, representing 59% of the VFDs, were not incentivized by the PAs. The VFDs were most often connected to water circulation pumps.
8

MASSACHUSETTS MULTIFAMILY HIGH RISE BASELINE-FINAL
39
Section 9 Appliances and Water Fixtures This sections details the findings for appliances and water fixtures. Specifically, the Team collected information from on-site inspections, plan review, and a review of program documentation to identify the characteristics of the following measures:
Appliances o In-unit refrigerators o In-unit clothes washers o In-unit dishwashers o Common area clothes washers
Water fixtures o Showerhead flow rates o Lavatory faucet flow rates o Kitchen faucet flow rates o Toilet flush flow rates
All of these measures were incentivized by the program at one point or another. That said, the program currently only offers incentivizes for showerhead flow rates, lavatory faucet flow rates, and kitchen faucet flow rates. The incentives for all appliances and toilet flush flow rates have been discontinued over time. In-unit appliance incentives were discontinued based on evidence of high free-ridership in other PA programs.
Information on appliances came from a variety of sources and was not available for every project in the sample. Whenever possible the Team used information from the on-site inspections, ICF on-site data collection forms or application forms, and PA TA reports. If any of these data were not available, the Team used as-built plans and in very few cases building department plans to determine the efficiency of appliances and water fixtures. Any use of building department plans was supplemented with mystery shopping information. If the Team felt the building department data were not reliable then they were excluded from the analysis. The use of building department plans is highlighted for each appliance and water fixture in the text below.
9.1 APPLIANCES Table 37 details the electric energy consumption of the in-unit refrigerators that were inspected as part of this study. The Team verified the details of 2,367 refrigerators in 15 projects. The information for two projects that did not receive incentives and one project where the incentive status was unknown came from building department plans. The overall average electric consumption for refrigerators is 499 kWh/yr. Seven projects containing 923 refrigerators received incentives for refrigerators and have an average consumption of 410 kWh/yr.; this is significantly lower than the 567 kWh/yr. average for 1,044 refrigerators from eight projects that did not receive incentives.
9

MASSACHUSETTS MULTIFAMILY HIGH RISE BASELINE-FINAL
40
Table 37: Refrigeration Consumption (kWh/yr.)
Refrigerator kWh
All (n=2,367
Refrigerators, 15 Projects)
Incentivized (n=923
Refrigerators, 7 Projects)*
Not Incentivized
(n=1,044 Refrigerators, 8 Projects)*
Don't Know (n=400
Refrigerators, 1 Project)
Minimum kWh 363 380 363 378
Maximum kWh 701 460 701 553
Average kWh 499 410** 567** 525
Median kWh 460 408 555 553
Coefficient of Variation 0.23 0.08 0.22 0.12
Relative Precision at 90% 0.6% 0.4% 1.0% 1.0%
*One project had some incentivized refrigerators and some unincentivized refrigerators. **Significantly different at the 90% confidence level.
Overall, 64% of the refrigerators in study projects are ENERGY STAR certified. The difference in ENERGY STAR certification between incentivized refrigerators (100%) and unincentivized refrigerators (53%) is significantly different (Table 38).
Table 38: ENERGY STAR Status of Refrigerators
ENERGY STAR Status
All (n=2,367
Refrigerators, 15 Projects)
Incentivized (n=923
Refrigerators, 7 Projects)*
Not Incentivized
(n=1,044 Refrigerators, 8 Projects)*
Don't Know (n=400
Refrigerators, 1 Project)
ENERGY STAR certified 64% 100%** 53%** 100%
Not ENERGY STAR certified
36% 0%** 47%** 0%
*One project had some incentivized refrigerators and some unincentivized refrigerators. **Significantly different at the 90% confidence level.
The Team identified detailed information on clothes washers in nine projects—two projects that received incentives for clothes washers, six that did not receive incentives, and one that is unknown. The information for two projects that did not receive incentives and one project where the incentive status was unknown came from building department plans. The overall electric energy consumption for clothes washers is 180 kWh/yr. Incentivized clothes washers have significantly lower consumption (102 kWh/yr.) than unincentivized units (171 kWh/yr.) (Table 39).

MASSACHUSETTS MULTIFAMILY HIGH RISE BASELINE-FINAL
41
Table 39: Clothes Washer Consumption (kWh/yr.)
Clothes Washer kWh
All (n=1,927 Clothes
Washers, 9 Projects)
Incentivized (n=438 Clothes
Washers, 2 Projects)
Not Incentivized
(n=1,089 Clothes
Washers, 6 Projects)
Don't Know (n=400 Clothes
Washers, 1 Project)
Minimum kWh 90 99 90 290
Maximum kWh 338 171 338 290
Average kWh 180 102* 171* 290
Median kWh 154 99 154 290
Coefficient of Variation 0.49 0.13 0.49 0.00
Relative Precision at 90% 1.6% 1.0% 2.2% 0.0%
*Significantly different at the 90% confidence level.
Overall, 67% of all the clothes washers that were included in this study are ENERGY STAR certified. All of the clothes washers that were incentivized are ENERGY STAR certified, which is significantly higher than those that were not incentivized (79%) (Table 40).
Table 40: ENERGY STAR Status of Clothes Washers
ENERGY STAR Status
All (n=1,927 Clothes
Washers, 9 Projects)
Incentivized (n=438 Clothes
Washers, 2 Projects)
Not Incentivized
(n=1,089 Clothes
Washers, 6 Projects)
Don't Know (n=400 Clothes
Washers, 1 Project)
ENERGY STAR certified 67% 100%* 79%* 0%
Not ENERGY STAR certified 33% 0%* 21%* 100%
*Significantly different at the 90% confidence level.
Table 41 presents the electric consumption statistics for dishwashers that were inspected as part of this study. In total, 2,122 dishwashers were reviewed in 14 different projects—one project with 75 dishwashers received incentives. The information for two projects that did not receive incentives and one project where the incentive status was unknown came from building department plans. The average electric consumption across all dishwashers is 276 kWh/yr. All of the dishwashers in the study were ENERGY STAR certified.

MASSACHUSETTS MULTIFAMILY HIGH RISE BASELINE-FINAL
42
Table 41: Dishwasher Consumption (kWh/yr.)
Dishwasher kWh
All Projects (n=2,122
Dishwashers, 14 Projects)
Incentivized (n=75
Dishwashers, 1 Project)
Not Incentivized
(n=1,647 Dishwashers, 12 Projects)
Don't Know (n=400
Dishwashers, 1 Project)
Minimum kWh 259 295 259 260
Maximum kWh 313 295 313 260
Average kWh 276 295* 279* 260
Median kWh 275 295 275 260
Coefficient of Variation 0.06 0.00 0.06 0.00
Relative Precision at 90%
0.2% 0.0% 0.2% 0.0%
*Significantly different at the 90% confidence level.
9.2 WATER FIXTURES The Team verified showerhead flow rates, in gallons per minute (GPM), in 14 different projects that contained 3,537 showerheads. Six projects received incentives for showerheads, seven projects did not, and for one project the incentive status is unknown. The information for one project that did not receive incentives and the one project where the incentive status was unknown came from building department plans. As shown in Table 42, incentivized showerheads have a significantly lower average flow rate (1.69 GPM) than unincentivized showerheads (1.75 GPM). The current energy model baseline for the program is 2.5 GPM. The working group agreed to a new UDRH input of 2.2 GPM.
Table 42: Showerhead Flow Rates (GPM)
Showerhead GPM
All Units (n=3,537
Showerheads, 14 Projects)
Incentivized (n=1,558
Showerheads, 6 Projects)
Not Incentivized
(n=1,144 Showerheads,
7 Projects)
Don't Know (n=835
Showerheads, 1 Project)
Minimum GPM 1.30 1.30 1.30 2.50
Maximum GPM 2.50 2.50 2.50 2.50
Average GPM 1.90 1.69* 1.75* 2.50
Median GPM 1.75 1.50 1.75 2.50
Coefficient of Variation 0.24 0.21 0.22 0.00
Relative Precision at 90%
0.5% 0.8% 1.0% 0.0%
*Significantly different at the 90% confidence level.

MASSACHUSETTS MULTIFAMILY HIGH RISE BASELINE-FINAL
43
The average kitchen faucet flow rate is 1.81 GPM for the sample of projects considered in this study. The information for two projects that did not receive incentives and one project where the incentive status was unknown came from building department plans. Incentivized kitchen faucets (1.47 GPM) have significantly lower flow rates than unincentivized flow rates (1.78 GPM) (Table 43). The current energy model baseline for the program is 2.2 GPM. The working group agreed to a new UDRH input of 2.2 GPM.
Table 43: Kitchen Faucet Flow Rates (GPM)
Kitchen Faucet GPM
All Units (n=2,696
Faucets, 13 Projects)
Incentivized (n=864
Faucets, 5 Projects)
Not Incentivized
(n=997 Faucets, 7 Projects)
Don't Know (n=835
Faucets, 1 Project)
Minimum GPM 1.00 1.00 1.40 2.20
Maximum GPM 2.20 1.50 2.20 2.20
Average GPM 1.81 1.47* 1.78* 2.20
Median GPM 1.80 1.50 1.80 2.20
Coefficient of Variation 0.18 0.05 0.14 0.00
Relative Precision at 90% 0.5% 0.3% 0.7% 0.0%
*Significantly different at the 90% confidence level.
The average lavatory faucet flow rate among projects considered in this study is 1.26 GPM. The information for one project that did not receive incentives and the one project where the incentive status was unknown came from building department plans. Incentivized faucets (1.12 GPM) have significantly lower flow rates than unincentivized faucets (1.35 GPM) (Table 44). The current energy model baseline for the program is 2.2 GPM. The working group agreed to a new UDRH input of 2.0 GPM.
Table 44: Lavatory Faucet Flow Rates (GPM)
Lav Faucet GPM
All Projects (n=3782
Faucets, 15 Projects)
Incentivized (n=1,974
Faucets, 8 Projects)
Not Incentivized
(n=973 Faucets, 6 Projects)
Don't Know (n=835
Faucets, 1 Project)
Minimum GPM 0.50 0.50 0.50 1.50
Maximum GPM 1.85 1.50 1.85 1.50
Average GPM 1.26 1.12* 1.35* 1.50
Median GPM 1.50 1.10 1.50 1.50
Coefficient of Variation 0.27 0.28 0.28 0.00
Relative Precision at 90% 0.5% 0.9% 1.4% 0.0%
*Significantly different at the 90% confidence level.
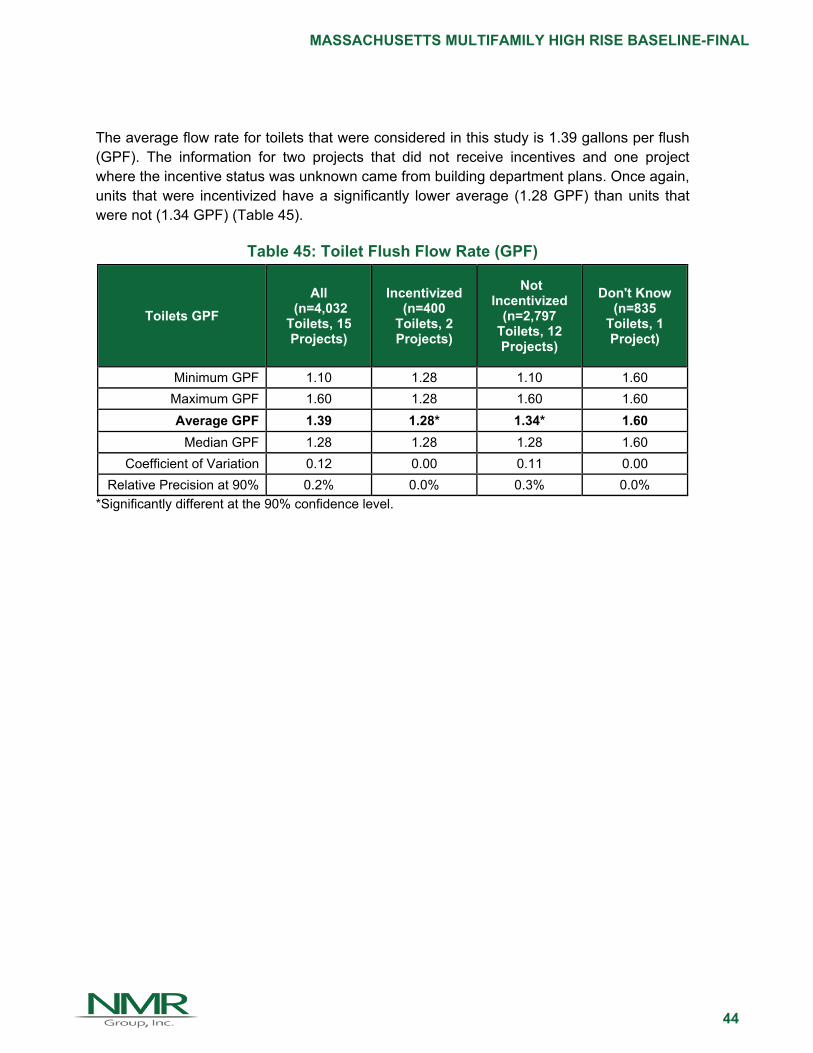
MASSACHUSETTS MULTIFAMILY HIGH RISE BASELINE-FINAL
44
The average flow rate for toilets that were considered in this study is 1.39 gallons per flush (GPF). The information for two projects that did not receive incentives and one project where the incentive status was unknown came from building department plans. Once again, units that were incentivized have a significantly lower average (1.28 GPF) than units that were not (1.34 GPF) (Table 45).
Table 45: Toilet Flush Flow Rate (GPF)
Toilets GPF
All (n=4,032
Toilets, 15 Projects)
Incentivized (n=400
Toilets, 2 Projects)
Not Incentivized
(n=2,797 Toilets, 12 Projects)
Don't Know (n=835
Toilets, 1 Project)
Minimum GPF 1.10 1.28 1.10 1.60
Maximum GPF 1.60 1.28 1.60 1.60
Average GPF 1.39 1.28* 1.34* 1.60
Median GPF 1.28 1.28 1.28 1.60
Coefficient of Variation 0.12 0.00 0.11 0.00
Relative Precision at 90% 0.2% 0.0% 0.3% 0.0%
*Significantly different at the 90% confidence level.

MASSACHUSETTS MULTIFAMILY HIGH RISE BASELINE-FINAL
45
Section 10 Lighting It is difficult to forecast the future market in any scenario where the market is changing. The lighting market has changed so much over the last few years that the lighting data collected for this report likely do not reflect the current lighting market. LED prices have fallen and acceptance of LEDs by builders and developers has grown
substantially.
Also, lighting is one of the most likely measure specifications to change during the building process. For large projects, it is not unusual to have a gap of several years between the time the building plan is filed with a building department and the project is completed. For five projects in this study the Team was not able to obtain as-built plans, only building department plans. For these five projects, specifically, the lighting specifications may have changed from the time the plans were filed.
The economy and construction market have also changed, and continue to change. The mix of new multifamily projects is shifting from mainly affordable to more market rate projects. Developers who own and manage properties tend to be more interested in future operational savings provided by installing LED lighting.
In addition, a 2015 study of Massachusetts commercial new construction energy code compliance found:
LPD for both interior and exterior lighting was consistently lower (better) than code mandates. This can be mostly attributed to technology advances in fluorescent and solid-state (LED) lighting and in reductions in the cost of LED lighting. During the recent Department of Energy (DOE) Energy Codes Conference, it was discussed that lighting technology is advancing faster than codes can keep up, and the next model code is anticipated to include a 40% reduction in lighting power allowances.17
The following two sections cover study findings for in-unit lighting and common area lighting.
17 Full report available at: http://ma-eeac.org/wordpress/wp-content/uploads/Commercial-New-Construction-Energy-Code-Compliance-Follow-up-Study.pdf
10

MASSACHUSETTS MULTIFAMILY HIGH RISE BASELINE-FINAL
46
10.1 IN-UNIT LIGHTING CFL lighting predominated in the projects studied for this report. Overall, CFL bulbs accounted for 61% of in-unit bulbs, LEDs accounted for 11%, T8/T5 bulbs for 8%, and other bulbs (including incandescent) accounted for 20% (Figure 6). CFL bulbs also accounted for over one-half (53%) of in-unit lighting wattage, LEDs accounted for only 4%, T8/T5 bulbs for 9%, and other bulbs (including incandescent) accounted for 34%. Other bulbs, including incandescent bulbs, accounted for more than one half (55%) of the lighting wattage in projects where lighting measures were not incentivized. (Figure 7)
Figure 6: Percent of Total Bulbs/Fixtures
Figure 7: Percent of Total Watts
Figure 8 shows the average W/ft2 across projects and the average W/ft2 weighted by square footage for all projects, for projects where lighting measures were incentivized, and for projects where lighting measures were not incentivized. As shown, the weighted averages are lower in every case than the project averages. This indicates the projects with higher square footage installed more energy efficient lighting.

MASSACHUSETTS MULTIFAMILY HIGH RISE BASELINE-FINAL
47
Figure 8: Raw and Area Weighted Average Watts per Square Foot
Figure 9 plots W/ft2 of lamped area in residential units by project. As shown W/ft2 covered a wide range across projects, with the projects where lighting measures were incentivized clearly having lower W/ft2 than most projects where lighting measures were not incentivized. The current energy model baseline is 0.75 W/ft2. The working group agreed to keep 0.75 W/ft2 as the residential lighting power density in the new UDRH.
Figure 9: Watts per Square Foot of Lamped Area by Project
Table 46 shows summary statistics for in-unit lighting W/ft2, including the coefficient of variation and relative precision of the results at the 90% confidence level. As shown, the high variability from project to project resulted in poor relative precisions of ±17% or higher
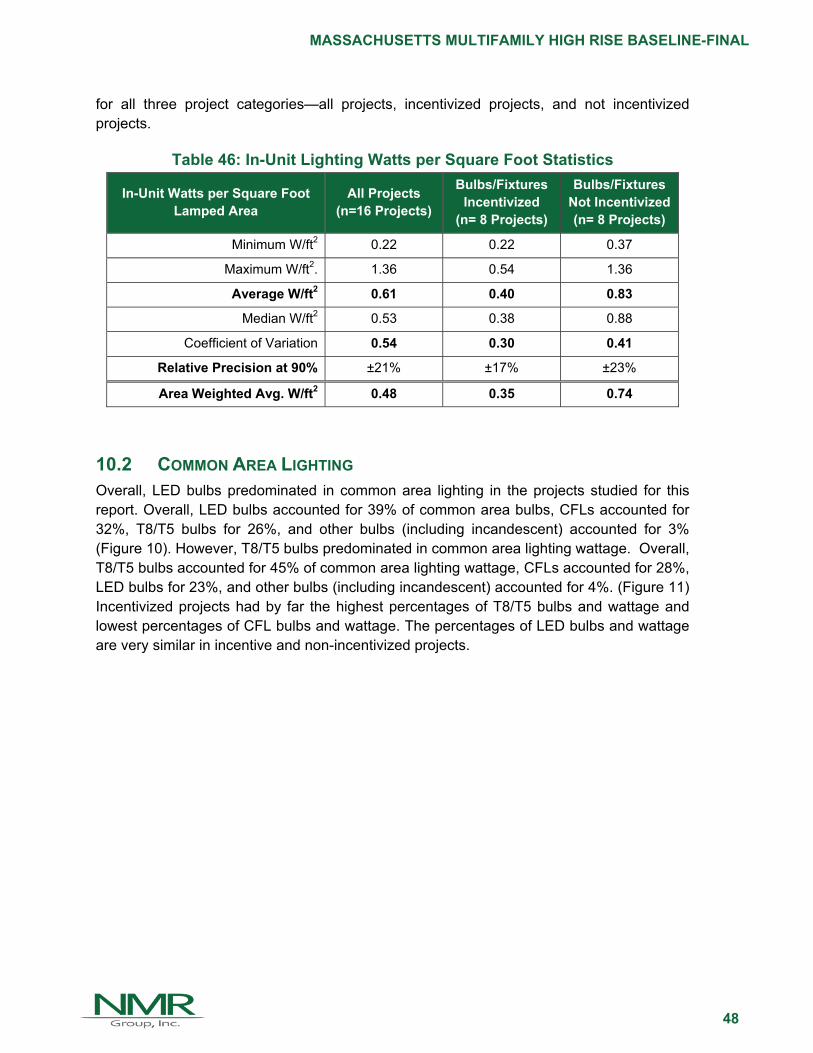
MASSACHUSETTS MULTIFAMILY HIGH RISE BASELINE-FINAL
48
for all three project categories—all projects, incentivized projects, and not incentivized projects.
Table 46: In-Unit Lighting Watts per Square Foot Statistics
In-Unit Watts per Square Foot Lamped Area
All Projects (n=16 Projects)
Bulbs/Fixtures Incentivized
(n= 8 Projects)
Bulbs/Fixtures Not Incentivized (n= 8 Projects)
Minimum W/ft2 0.22 0.22 0.37
Maximum W/ft2. 1.36 0.54 1.36
Average W/ft2 0.61 0.40 0.83
Median W/ft2 0.53 0.38 0.88
Coefficient of Variation 0.54 0.30 0.41
Relative Precision at 90% ±21% ±17% ±23%
Area Weighted Avg. W/ft2 0.48 0.35 0.74
10.2 COMMON AREA LIGHTING Overall, LED bulbs predominated in common area lighting in the projects studied for this report. Overall, LED bulbs accounted for 39% of common area bulbs, CFLs accounted for 32%, T8/T5 bulbs for 26%, and other bulbs (including incandescent) accounted for 3% (Figure 10). However, T8/T5 bulbs predominated in common area lighting wattage. Overall, T8/T5 bulbs accounted for 45% of common area lighting wattage, CFLs accounted for 28%, LED bulbs for 23%, and other bulbs (including incandescent) accounted for 4%. (Figure 11) Incentivized projects had by far the highest percentages of T8/T5 bulbs and wattage and lowest percentages of CFL bulbs and wattage. The percentages of LED bulbs and wattage are very similar in incentive and non-incentivized projects.

MASSACHUSETTS MULTIFAMILY HIGH RISE BASELINE-FINAL
49
Figure 10: Common Area Percent of Total Bulbs/Fixtures
Figure 11: Common Areas Percent of Total Watts
The common area lighting data presented here were not used to develop UDRH inputs because of the small sample sizes, lack of useable data in some building plans, high coefficients of variation and poor relative precisions. The following sections showing study results based on on-site observations and building plan reviews are provided for information only, simply reporting what was found. Data are presented for:
Lobby elevator areas Office areas Fitness facility areas Lounge clubhouse areas Storage areas

MASSACHUSETTS MULTIFAMILY HIGH RISE BASELINE-FINAL
50
Corridors Stairwells Mechanical or utility rooms Meeting rooms Garages
Not all projects had all these types of common areas and in some cases the building plans did not include useable lighting data for these areas. Therefore, the sample sizes for some areas are quite small. Sample sizes range from four for fitness areas and meeting rooms to 16 for corridors and stairwells. Consistent with in-unit lighting, variation in W/ft2 across projects is high and all common area lighting results have poor relative precisions. Looking at relative precision at the 90% confidence level for all projects with a specific type of common area lighting data, the lowest relative precisions are ±13% for stairwells, 17% for office areas, and 18% for corridors. The highest relative precisions are for fitness areas (±90%) and garages (±40%).
It was not always obvious to evaluators exactly what square footage should be considered as being in a specific common area category. Also, in some cases, the program’s definitions of common areas have changed. Examples of these changes, provided by ICF, include:
“Fitness Facility Area” was added in 2015. In prior years, this space would have been included in the “Meeting Room” category.
In 2013-2014, the “Lounge/Clubhouse” space would have been included in the “Meeting Room” category. In 2015 and after, it would have been categorized as either “Fitness”, “Conference/Meeting”, or “Lounge,” depending on its primary use.
“Meeting Rooms” was updated in 2015 to “Conference/Meeting Rooms.”
“Mechanical or Utility Rooms” include laundry room; restroom; janitor closet; trash/recycling; bike room; mechanical rooms, including elevator machine room; irrigation/site storage.
“Garages": An “Exterior Lighting” category, which includes unconditioned garages was added in 2015. Incentives are available on a prescriptive basis and mirror the Commercial and Industrial exterior lighting prescriptive incentives.
“Stairwells” are included in the “corridor” areas of the building and receive the same lighting schedule, which is always on.

MASSACHUSETTS MULTIFAMILY HIGH RISE BASELINE-FINAL
51
10.2.1 Lobby Elevator
The current energy model baseline is 0.90 W/ft2 based on ASHRAE 90.1-2010 Table 9.6.1, Lobby. The new prospective UDRH input is 0.81 W/ft2, based on the working group decision to apply a 10% reduction to the 2015 IECC requirement of 0.90 W/ft2. The retrospective UDRH baseline input for calculating 2016 savings is 0.80 W/ft2, based on the working group decision to apply a 27% reduction to 2012 IECC requirements.
Figure 12: Lobby Elevator Area Watts per Square Foot
Table 47: Lobby Elevator Area Watts per Square Foot Statistics
Lobby Elevator Watts per Square Foot
All Projects (n=15
Projects)
Incentivized (n=4
Projects)
Not Incentivized
(n=9 Projects)
Don't Know (n=2
Projects)
Minimum W/ft2. 0.10 0.22 0.10 0.16
Maximum W/ft2. 2.58 0.99 2.58 0.37
Average W/ft2 0.78 0.63 0.97 0.26
Median W/ft2 0.60 0.65 0.62 0.26
Coefficient of Variation 0.88 0.51 0.85 0.57
Relative Precision at 90% ±36% ±41% ±45% ±66%
Area Weighted Avg. W/ft2 0.38 0.29 0.49 0.30

MASSACHUSETTS MULTIFAMILY HIGH RISE BASELINE-FINAL
52
10.2.2 Office
The current energy model baseline is 1.11 W/ft2 based on ASHRAE 90.1-2010 Table 9.6.1, Office, Enclosed. The new prospective UDRH input is 0.99 W/ft2, based on the working group decision to apply a 10% reduction to the 2015 IECC requirement of 1.1 W/ft2. The retrospective UDRH baseline input for calculating 2016 savings is 0.80 W/ft2, based on the working group decision to apply a 27% reduction to 2012 IECC requirements.
Figure 13: Office Area Watts per Square Foot
Table 48: Office Area Watts per Square Foot Statistics
Office Areas Watts per Square Foot
All Projects (n=12
Projects)
Incentivized (n=3
Projects)
Not Incentivized
(n=7 Projects)
Don't Know (n=2
Projects)
Minimum W/ft2. 0.31 0.75 0.31 0.40
Maximum W/ft2 1.23 1.23 1.01 0.89
Average W/ft2 0.75 0.99 0.68 0.65
Median W/ft2 0.76 0.99 0.65 0.65
Coefficient of Variation 0.88 0.51 0.85 0.57
Relative Precision at 90% ±17% ±23% ±21% ±61%
Area Weighted Avg. W/ft2 0.74 1.04 0.49 0.64

MASSACHUSETTS MULTIFAMILY HIGH RISE BASELINE-FINAL
53
10.2.3 Fitness
The current energy model baseline is 0.72 W/ft2 based on ASHRAE 90.1-2010 Table 9.6.1, Gymnasium/Fitness Center, Fitness Area. The new prospective UDRH input is 0.65 W/ft2, based on the working group decision to apply a 10% reduction to the 2015 IECC requirement of 0.72 W/ft2. The retrospective UDRH baseline input for calculating 2016 savings is 0.66 W/ft2, based on the working group decision to apply a 27% reduction to 2012 IECC requirements.
Figure 14: Fitness Area Watts per Square Foot
Table 49: Fitness Area Watts per Square Foot Statistics
Fitness Area Watts per Square Foot
All Projects
(n=4 Projects)
Incentivized (n=0
Projects)
Not Incentivized
(n= 3 Projects)
Don't Know (n=1
Project)
Minimum W/ft2. 0.33 n/a 0.33 3.12
Maximum W/ft2 3.12 n/a 0.74 3.12
Average W/ft2 1.18 n/a 0.53 3.12
Median W/ft2 0.63 n/a 0.53 3.12
Coefficient of Variation 1.11 n/a 0.38 n/a
Relative Precision at 90% ±90% n/a ±36% n/a
Area Weighted Avg. W/ft2 1.66 n/a 0.41 ±3.12

MASSACHUSETTS MULTIFAMILY HIGH RISE BASELINE-FINAL
54
10.2.4 Lounge Clubhouse
The current energy model baseline is 0.73 W/ft2 based on ASHRAE 90.1-2010 Table 9.6.1, Lounge/Recreation. The new prospective UDRH input for recreation is 0.66 W/ft2, based on the working group decision to apply a 10% reduction to the 2015 IECC requirement of 0.73 W/ft2. The retrospective UDRH baseline input for calculating 2016 savings is 0.58 W/ft2, based on the working group decision to apply a 27% reduction to 2012 IECC requirements.
Figure 15: Lounge Clubhouse Area Watts per Square Foot
Table 50: Lounge Clubhouse Area Watts per Square Foot Statistics
Lounge Clubhouse Watts per Square Foot
All Projects (n=7
Projects)
Incentivized (n=2
Projects)
Not Incentivized
(n=4 Projects)
Don't Know (n=1 Project)
Minimum W/ft2 0.25 0.27 0.25 0.41
Maximum W/ft2 0.80 0.71 0.80 0.41
Average W/ft2 0.47 0.49 0.48 0.41
Median W/ft2 0.41 0.49 0.44 0.41
Coefficient of Variation 0.45 0.63 0.49 n/a
Relative Precision at 90% ±27% ±73% ±40% n/a
Area Weighted Avg. W/ft2 0.47 0.54 0.45 0.41

MASSACHUSETTS MULTIFAMILY HIGH RISE BASELINE-FINAL
55
10.2.5 Storage
The current energy model baseline is 0.63 W/ft2 based on ASHRAE 90.1-2010 Table 9.6.1, Storage. The new prospective UDRH input is 0.57 W/ft2, based on the working group decision to apply a 10% reduction to the 2015 IECC requirement of 0.63 W/ft2. The retrospective UDRH baseline input for calculating 2016 savings is 0.58 W/ft2, based on the working group decision to apply a 27% reduction to 2012 IECC requirements.
Figure 16: Storage Area Watts per Square Foot
Table 51: Storage Area Watts per Square Foot Statistics
Storage Area Watts per Square Foot
All Projects (n=8
Projects)
Incentivized (n=1
Project)
Not Incentivized
(n= 6 Projcts)
Don't Know (n=1
Project)
Minimum W/ft2 0.25 1.01 0.25 1.45
Maximum W/ft2 2.68 1.01 2.68 1.45
Average W/ft2 1.12 1.01 1.08 1.45
Median W/ft2. 1.01 1.01 0.86 1.45
Coefficient of Variation 0.69 n/a 0.83 n/a
Relative Precision at 90% ±39% n/a ±55% n/a
Area Weighted Avg. W/ft2 1.44 1.01 1.49 1.45

MASSACHUSETTS MULTIFAMILY HIGH RISE BASELINE-FINAL
56
10.2.6 Corridors
The current energy model baseline is 0.66 W/ft2 based on ASHRAE 90.1-2010 Table 9.6.1, Corridor/Transition. The new prospective UDRH input is 0.59 W/ft2, based on the working group decision to apply a 10% reduction to the 2015 IECC requirement of 0.66 W/ft2. The retrospective UDRH baseline input for calculating 2016 savings is 0.51 /ft2, based on the working group decision to apply a 27% reduction to 2012 IECC requirements.
Figure 17: Corridor Area Watts per Square Foot
Table 52: Corridor Area Watts per Square Foot Statistics
Corridor Watts per Square Foot
All Projects
(n=16 Projects)
Incentivized (n= 2
Projects)
Not Incentivized
(n= 12 Projects)
Don't Know (n=2
Projects)
Minimum W/ft2 0.40 0.40 0.42 0.87
Maximum W/ft2 2.10 0.97 2.10 0.99
Average W/ft2 0.97 0.68 1.03 0.93
Median W/ft2 0.93 0.68 0.96 0.93
Coefficient of Variation 0.46 0.59 0.48 0.09
Relative Precision at 90% ±18% ±68% ±22% ±11%
Area Weighted Avg. W/ft2 0.79 0.92 0.68 0.92

MASSACHUSETTS MULTIFAMILY HIGH RISE BASELINE-FINAL
57
10.2.7 Stairwells
There is no specific input for stairwells in the energy model. Stairwells are included under corridors in the energy model baseline.
Figure 18: Stairwell Area Watts per Square Foot
Table 53: Stairwell Area Watts per Square Foot Statistics
Stairwells Watts per Square Foot
All Projects
(n=16 Projects)
Incentivized (n=4
Projects)
Not Incentivized
(n=10 Projects)
Don't Know (n=2
Projects)
Minimum W/ft2 0.25 0.79 0.25 0.36
Maximum W/ft2 0.98 0.90 0.98 0.38
Average W/ft2 0.72 0.85 0.73 0.37
Median W/ft2 0.82 0.86 0.83 0.37
Coefficient of Variation 0.34 0.06 0.34 0.05
Relative Precision at 90% ±13% ±5% ±17% ±5%
Area Weighted Avg. W/ft2 0.59 0.88 0.61 0.37
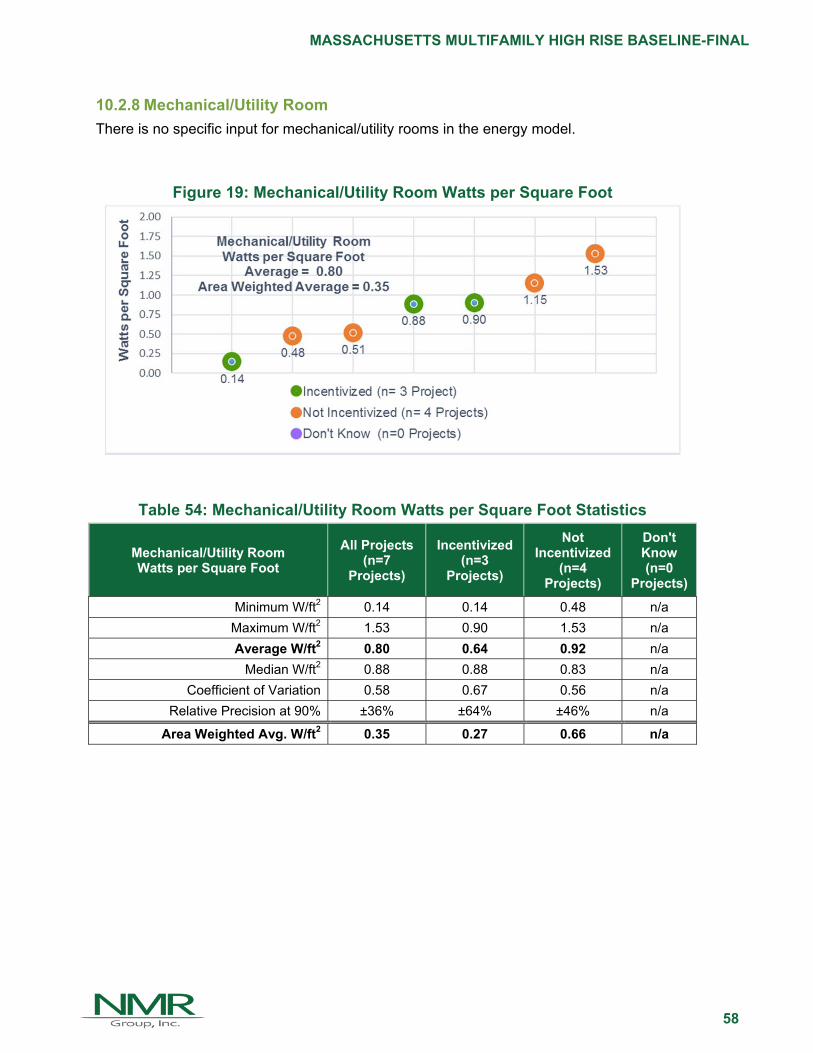
MASSACHUSETTS MULTIFAMILY HIGH RISE BASELINE-FINAL
58
10.2.8 Mechanical/Utility Room
There is no specific input for mechanical/utility rooms in the energy model.
Figure 19: Mechanical/Utility Room Watts per Square Foot
Table 54: Mechanical/Utility Room Watts per Square Foot Statistics
Mechanical/Utility Room Watts per Square Foot
All Projects (n=7
Projects)
Incentivized (n=3
Projects)
Not Incentivized
(n=4 Projects)
Don't Know (n=0
Projects)
Minimum W/ft2 0.14 0.14 0.48 n/a
Maximum W/ft2 1.53 0.90 1.53 n/a
Average W/ft2 0.80 0.64 0.92 n/a
Median W/ft2 0.88 0.88 0.83 n/a
Coefficient of Variation 0.58 0.67 0.56 n/a
Relative Precision at 90% ±36% ±64% ±46% n/a
Area Weighted Avg. W/ft2 0.35 0.27 0.66 n/a

MASSACHUSETTS MULTIFAMILY HIGH RISE BASELINE-FINAL
59
10.2.9 Meeting Rooms
There is no specific input for meeting rooms in the energy model. Meeting rooms fall under lounge/clubhouse in the energy model baseline.
Figure 20: Meeting Room Area Watts per Square Foot
Table 55: Meeting Room Area Watts per Square Foot Statistics
Meeting Room Areas Watts per Square Foot
All Projects (n=4
Projects)
Incentivized (n=2
Projects)
Not Incentivized
(n=1 Project)
Don't Know (n=1
Project) Minimum W/ft2 0.22 0.47 1.33 0.22
Maximum W/ft2 1.33 0.69 1.33 0.22
Average W/ft2 0.68 0.58 1.33 0.22
Median W/ft2 0.58 0.58 1.33 0.22
Coefficient of Variation 0.70 0.26 n/a n/a
Relative Precision at 90% ±57% ±30% n/a n/a
Area Weighted Avg. W/ft2 0.49 0.53 1.33 0.22
e W/ft2

MASSACHUSETTS MULTIFAMILY HIGH RISE BASELINE-FINAL
60
10.2.10 Garage
There is no specific input for garages in the energy model. An “Exterior Lighting” category, which includes unconditioned garages was added in 2015. Incentives are available on a prescriptive basis and mirror the Commercial and Industrial exterior lighting prescriptive incentives.
Figure 21: Garage Area Watts per Square Foot
Table 56: Garage Area Watts per Square Foot Statistics
Garage Watts per Square Foot
All Projects (n=6
Projects)
Incentivized (n=1
Project)
Not Incentivized
(n=3 Projects)
Don't Know (n=2
Projects)
Minimum W/ft2 0.10 0.10 0.10 0.11
Maximum W/ft2 0.41 0.10 0.41 0.25
Average W/ft2 0.21 0.10 0.27 0.18
Median W/ft2 0.18 0.10 0.29 0.18
Coefficient of Variation 0.61 n/a 0.59 0.53
Relative Precision at 90% ±40% n/a ±56% ±61%
Area Weighted Avg. W/ft2 0.38 n/a 0.29 0.18