masala self-healing networks field test reportsgemfinalreport.fi/files/sgem_fp2_d6.13.1.docx · web...
TRANSCRIPT

- 1 -
D6.13.1: Proof of concepts
D6.13.1: Proof of concepts Masala Field test
CLEEN OY Eteläranta 10, P.O. BOX 10, FI-00131 HELSINKI, FINLAND www.cleen.fi

- 2 -
D6.13.1: Proof of concepts
Revision History
Edition Date Status Editor
v0.1 27.2.2013 Created Antti Kostiainen
(ABB)
CLEEN OY Eteläranta 10, P.O. BOX 10, FI-00131 HELSINKI, FINLAND www.cleen.fi

- 3 -
D6.13.1: Proof of concepts
D6.13.1: Proof of concepts Masala Field test
Table of Contents
Revision History...............................................................................................................................1Table of Contents.............................................................................................................................21 Preface.......................................................................................................................................32 Scope.........................................................................................................................................33 Methodology..............................................................................................................................34 Substation.................................................................................................................................3
4.1 Protection relays....................................................................................................................34.2 61850.....................................................................................................................................44.3 Substation computer..............................................................................................................4
5 Network automation.................................................................................................................55.1 Zone Concept........................................................................................................................55.2 Fault indication.......................................................................................................................5
5.2.1 Integrated solution...........................................................................................................65.2.2 Fault measurement unit, VTT..........................................................................................65.2.3 Horstmann CompasB......................................................................................................6
5.3 Protection zones....................................................................................................................75.4 Communication......................................................................................................................7
6 DMS............................................................................................................................................96.1 Communication with substation computer.............................................................................96.2 Reclosing location................................................................................................................106.3 Developing fault...................................................................................................................10
7 Field test..................................................................................................................................107.1 Test crew.............................................................................................................................10
7.1.1 Fault trailer....................................................................................................................107.1.2 Measurement devices...................................................................................................12
1.1 Measurement devices and related data...............................................................................131.2 Measurement equipment.....................................................................................................157.2 Test cases............................................................................................................................26
7.2.1 Location #1, Stenstrandintie E44058............................................................................277.2.2 Fault location #2, Luotsiasema ESM1279.....................................................................287.2.3 Location #3, AndersBergintie ESM1106.......................................................................297.2.4 Fault location #4, Dammossen ESM1368.....................................................................30
7.3 Results.................................................................................................................................317.3.1 Location #1 Stenstrandintie...........................................................................................317.3.2 Location #2 Luotsiasema ESM1279..............................................................................327.3.3 Location #3, AndersBergintie ESM1106.......................................................................337.3.4 Location #4, Dammossen ESM1368.............................................................................34
8 Conclusions............................................................................................................................359 Abbreviations..........................................................................................................................36
CLEEN OY Eteläranta 10, P.O. BOX 10, FI-00131 HELSINKI, FINLAND www.cleen.fi

- 4 -
D6.13.1: Proof of concepts
1 PrefaceThis report was done as a part of the Finnish national research project "Smart Grid and Energy Market" SGEM.It was funded by Tekes – the Finnish Funding Agency for Technology and Innovation and the project partners.
2 ScopeOverall purpose of this subtask is to make an experimental research of a generic test concept for fast fault isolation and self-healing functionality in rural area OHL network. The concept is based on smart central protection unit and relays in primary substation, remote-controlled disconnector/recloser stations and fault indicators in MV network. The general idea in this task is to move some of the analyzing actions from the DSO system operator level to primary substation level by adding smartness into it.
Demonstrations in this task are made incrementally. In the first stage, the system provides only aninformation package for operation center which can approve the actions. In the future the smartprotection unit can possibly make simple switching actions independently.
3 MethodologyFollowing work methods were used to make field test possible:
1. Primary Substation modernization2. Network component modernization3. System level development
4 SubstationSubstation protection equipment was renewed using IEC 61850 compliant 615 protection relays of the ABB Relion product family to provide improved protection and fault distance calculation capabilities, especially for earth faults. The replaced static protection relays that originated from the 1970’s were not able to meet the new requirements when it comes to fault data recordings, modern TCP/IP communication and earth-fault protection.
4.1 Protection relays Modern protection and control relays offer versatile protection algorithms for earth fault detection. The protection functions enable fast and selective protection. The start signals of protection functions are triggered into a disturbance data recording utilizing the COMTRADE format. The data recording enable prediction of non-permanent earth faults in the network. Further, the recordings include status indications of the circuit breaker and auto-reclosings based on the events.
CLEEN OY Eteläranta 10, P.O. BOX 10, FI-00131 HELSINKI, FINLAND www.cleen.fi
- 5 -
D6.13.1: Proof of concepts
4.2 61850Substation communication IEC61850 is very wildly used in IED communication. Interlocking is implemented using GOOSE messages instead of copper wirings. ARC protection is implemented using REF615 feeder terminals attached with light sensor. Light information is transferred to feeding bay using GOOSE messages.
Communication network in substation is fully redundant there is no single point failure.
Figure 1. FIGURE 6: Self-healing Ethernet ring.
4.3 Substation computer
Distributed intelligence in the substation: Disturbance data recordings are stored in a grid automation controller. The controller calculates distance estimates of network faults immediately after a fault situation (semi-online). The grid automation controller generates a fault report including the distance estimation information and sends it to the DMS.
CLEEN OY Eteläranta 10, P.O. BOX 10, FI-00131 HELSINKI, FINLAND www.cleen.fi

- 6 -
D6.13.1: Proof of concepts
Figure 2. Measurement information sources for the automated fault location, isolation and service restoration process.
5 Network automationThe piloted feeders(2) include a total of 80 control zones of which 20 are remote controlled disconnector areas located about 5 km apart on an average and 2 are protected and remote controlled recloser areas.
5.1 Zone Concept
Capability of the zone dividers, the differences in fault vulnerability between areas and the load priority levels within the areas are the main issues for the definition of zone borders. Needless to say, differentiating areas with low fault probability from those with high fault risks is clearly justifiable. Another zone divider criterion is the need to secure supply to areas with substantial and/or critical consumption. The same criteria are used when determining whether a zone is to be defined as a protection zone or a control zone.
5.2 Fault indicationFault indication devices are supporting accurate fault location in case when distance calculation gives to possible location in different branches. Fault indicator are located begin of long branches. Permanent solution is done by using remote disconnector integrated solution.Fault indication and measurement data is presented in SCADA and DMS systems.
Three different kind of fault indication were tested.
CLEEN OY Eteläranta 10, P.O. BOX 10, FI-00131 HELSINKI, FINLAND www.cleen.fi

- 7 -
D6.13.1: Proof of concepts
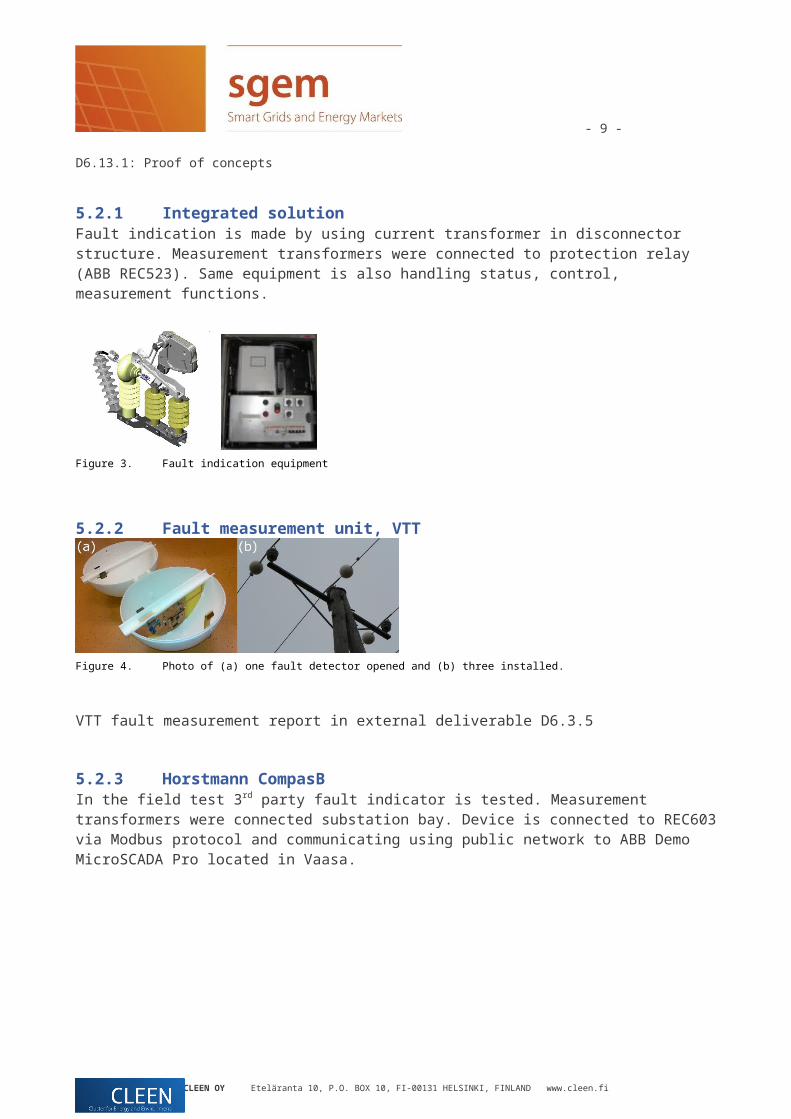
5.2.1 Integrated solutionFault indication is made by using current transformer in disconnector structure. Measurement transformers were connected to protection relay (ABB REC523). Same equipment is also handling status, control, measurement functions.
Figure 3. Fault indication equipment
5.2.2 Fault measurement unit, VTT
Figure 4. Photo of (a) one fault detector opened and (b) three installed.
VTT fault measurement report in external deliverable D6.3.5
5.2.3 Horstmann CompasBIn the field test 3rd party fault indicator is tested. Measurement transformers were connected substation bay. Device is connected to REC603 via Modbus protocol and communicating using public network to ABB Demo MicroSCADA Pro located in Vaasa.
Figure 5. ComPass B
CLEEN OY Eteläranta 10, P.O. BOX 10, FI-00131 HELSINKI, FINLAND www.cleen.fi

- 8 -
D6.13.1: Proof of concepts
Figure 6. Horstman CompasSB connected to ABB REC603
5.3 Protection zonesThe reclosers in the line feeder enable automatic isolation of the fault into the dedicated protection zone. The status indications of the circuit breaker and the auto-reclosings are sent to the ncc scada and DMS system.
Figure 7. Traditional mounting of a vacuum circuit breaker in an overhead line distribution network (Pole-mounted Recloser).
5.4 CommunicationThe network automation devices use the public network (GPRS) for IEC 60870-5-104 based communication with the SCADA system, which is cooperating with the DMS systems. The substation level distributed intelligence (running on the COM600 grid automation controller) and the substation Remote Terminal Unit (RTU) communicate with the control centre using a private fibre optic TCP/IP network.
CLEEN OY Eteläranta 10, P.O. BOX 10, FI-00131 HELSINKI, FINLAND www.cleen.fi
- 9 -
D6.13.1: Proof of concepts
The coverage of the public network was measured in the planned disconnector and recloser locations for verification of the availability of the network. Since the communication network depends on the power supplied from a distribution network, it is important that there are several communication link stations available for the network automation devices and that some of the link stations are supplied from a different distribution feeder or substation. Results based on the measurements proved that the coverage area in each automation point is approximately 2-3 times larger than that obtained by a normal cell phone. This benefit was acquired by means of industrial grade communication radios and antennas used that provide improved gain, which is a key performance figure in radio technology. In this way inherent redundancy was achieved resulting in that power outages in a single base station cause no connectivity failures.
Measurement report here!!
CLEEN OY Eteläranta 10, P.O. BOX 10, FI-00131 HELSINKI, FINLAND www.cleen.fi

- 10 -
D6.13.1: Proof of concepts
6 DMS
The distributed intelligence in the substation serves the DMS with a fault report. The SCADA system provides the position indication of the disconnectors and recloser also including the status of the fault indicators. These pieces of information are combined and analyzed by the DMS system against the network database and thus it can locate the fault on the geographical map. The DMS processes the fault report. The information provided is combined with the geographical network data. The DMS also combines the status values and measurement data of the disconnectors into the fault location calculation. If no fault indicators are used, the DMS will include the network type information into the calculation (Fuzzy logic).
Figure 8. Graphical presentation of the DMS 600 fault management view. For fault location the DMS 600 suggests several fault locations. The fault indicators in the feeder line branches pinpoint the correct fault location.
CLEEN OY Eteläranta 10, P.O. BOX 10, FI-00131 HELSINKI, FINLAND www.cleen.fi

- 11 -
D6.13.1: Proof of concepts
6.1 Communication with substation computerFault report or common used name fault package is directly transferred from substation to DMS system. In the normal setup all information from substation is transferred via SCADA system. TCP Socket message is used for fault package sending. This interface is not a standard interface and will work only with ABB DMS600. Standard IEC104 interface for fault package transfer is planned to implement.
6.2 Reclosing locationReclosing fault distance values are saved to DMS600 database when receiving fault package from substation computer. Reclosing can be presented in user interface by selecting them from reclosing list.
6.3 Developing faultFault package with type developing fault is saved to DMS database for analyses purposes.
CLEEN OY Eteläranta 10, P.O. BOX 10, FI-00131 HELSINKI, FINLAND www.cleen.fi

- 12 -
D6.13.1: Proof of concepts
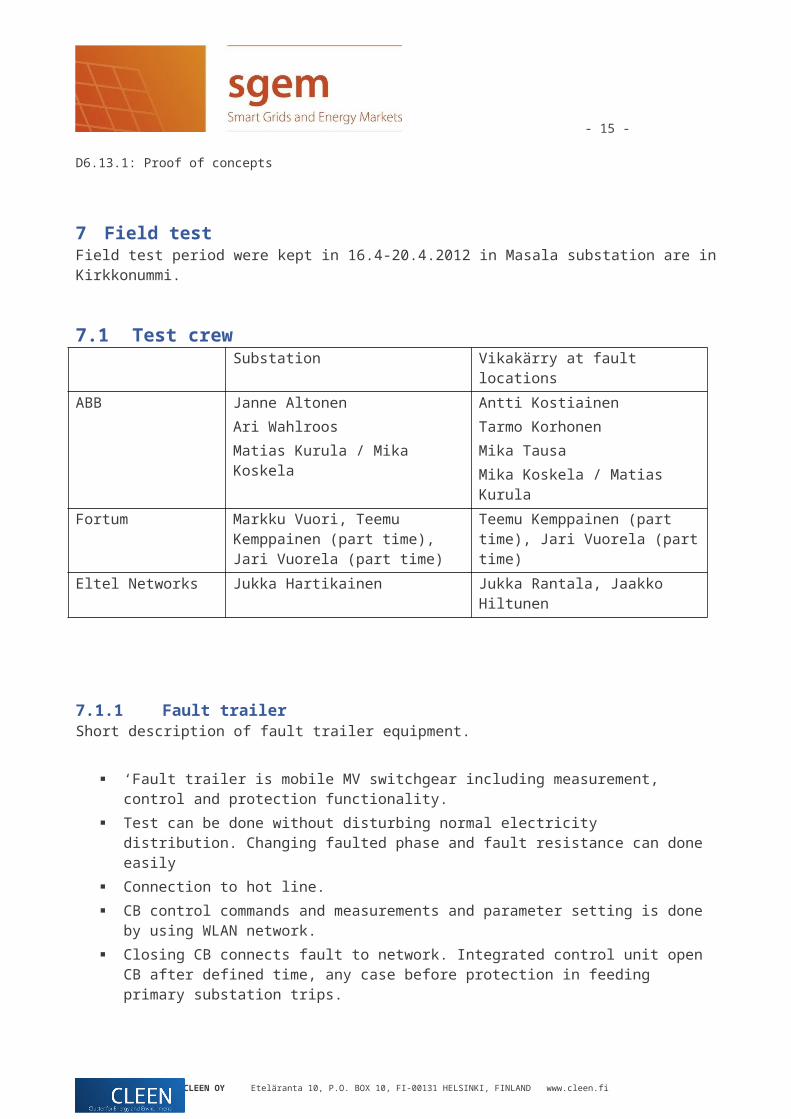
7 Field testField test period were kept in 16.4-20.4.2012 in Masala substation are in Kirkkonummi.
7.1 Test crewSubstation Vikakärry at fault locations
ABB Janne AltonenAri WahlroosMatias Kurula / Mika Koskela
Antti KostiainenTarmo KorhonenMika TausaMika Koskela / Matias Kurula
Fortum Markku Vuori, Teemu Kemppainen (part time), Jari Vuorela (part time)
Teemu Kemppainen (part time), Jari Vuorela (part time)
Eltel Networks Jukka Hartikainen Jukka Rantala, Jaakko Hiltunen
7.1.1 Fault trailerShort description of fault trailer equipment.
‘Fault trailer is mobile MV switchgear including measurement, control and protection functionality.
Test can be done without disturbing normal electricity distribution. Changing faulted phase and fault resistance can done easily
Connection to hot line. CB control commands and measurements and parameter setting is done by using WLAN
network. Closing CB connects fault to network. Integrated control unit open CB after defined time,
any case before protection in feeding primary substation trips. Fault disconnection is secured with IED protection function in fault trailer.
CLEEN OY Eteläranta 10, P.O. BOX 10, FI-00131 HELSINKI, FINLAND www.cleen.fi

- 13 -
D6.13.1: Proof of concepts
Figure 9. Fault trailer principle
Figure 10. Hot line connection work
Figure 11. Remote control
CLEEN OY Eteläranta 10, P.O. BOX 10, FI-00131 HELSINKI, FINLAND www.cleen.fi

- 14 -
D6.13.1: Proof of concepts
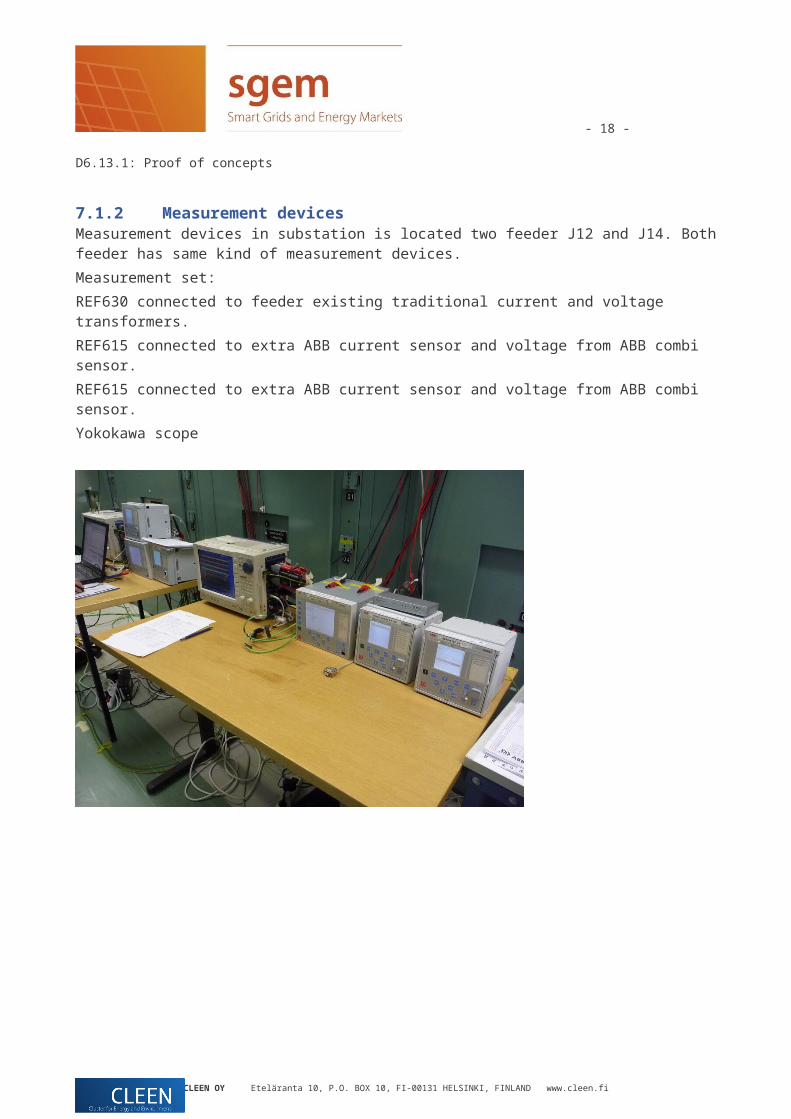
7.1.2 Measurement devicesMeasurement devices in substation is located two feeder J12 and J14. Both feeder has same kind of measurement devices.Measurement set:REF630 connected to feeder existing traditional current and voltage transformers.REF615 connected to extra ABB current sensor and voltage from ABB combi sensor.REF615 connected to extra ABB current sensor and voltage from ABB combi sensor.Yokokawa scope
CLEEN OY Eteläranta 10, P.O. BOX 10, FI-00131 HELSINKI, FINLAND www.cleen.fi
- 15 -
D6.13.1: Proof of concepts
1.1 Measurement devices and related data
Rated current / voltage FAnominal FAactual Rated burdenPhase current CT
300 / 5 KOFA 24D2, 10P10
10 ? 15VA
Residual current CT
70 / 1 KOLA 06 A1
? ? ?
Phase current sensor (two sets), temporary installation
80A / 150mV
Phase voltage sensor (two sets), temporary installation
Division ratio 10000
Table 1. Substation Masala, bay 12, measurement device and related data
Rated voltage Class Rated burdenPhase voltage VT
20000:sqrt(3) / 100:sqrt(3)
KRES 24 A2-V01
0,5 50VA
Residual voltage VT
3*[20000:sqrt(3)] / 100:3 KRES 24 A2-V01
1 (?) 90VA (?)
Table 2. Substation Masala, bay 12, measurement device and related data [4]
CLEEN OY Eteläranta 10, P.O. BOX 10, FI-00131 HELSINKI, FINLAND www.cleen.fi

- 16 -
D6.13.1: Proof of concepts
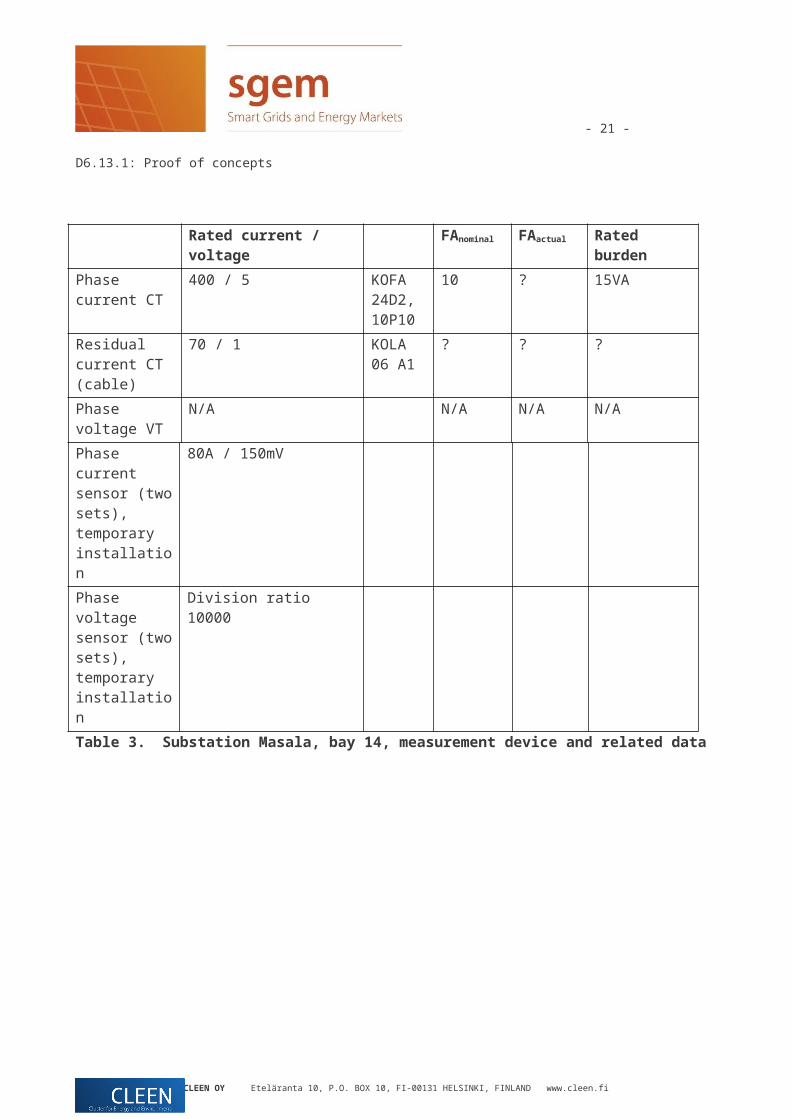
Rated current / voltage FAnominal FAactual Rated burdenPhase current CT
400 / 5 KOFA 24D2, 10P10
10 ? 15VA
Residual current CT (cable)
70 / 1 KOLA 06 A1
? ? ?
Phase voltage VT
N/A N/A N/A N/A
Phase current sensor (two sets), temporary installation
80A / 150mV
Phase voltage sensor (two sets), temporary installation
Division ratio 10000
Table 3. Substation Masala, bay 14, measurement device and related data
CLEEN OY Eteläranta 10, P.O. BOX 10, FI-00131 HELSINKI, FINLAND www.cleen.fi
- 17 -
D6.13.1: Proof of concepts
1.2 Measurement equipmentScaling
Shunt (0,1ohm) [1] /Sensor number
Channel
Sampling frequency
100kHz - - -
Current measurement card
701251 - - -
IL1_J12 300A / 5A / 0,5V => 600 S08 (corr. 1.0094) Ch1IL2_J12 300A / 5A / 0,5V => 600 S11 (corr. 0.99171) Ch2IL3_J12 300A / 5A / 0,5V => 600 S18 (corr. 1.0144) Ch3
I0_j12 70A / 1A / 0,1V => 700 S19 (corr. 0.99521) Ch4IL1_J12s 80A / 150 mV => 533.3 06
(corr. 1.0428 +0.0780deg)Ch5
IL2_J12s 80A / 150 mV => 533.3 10(corr. 1.0376 +0.0820deg)
Ch6
IL3_J12s 80A / 150 mV => 533.3 07(corr. 1.0390 +0.0780deg)
Ch7
Voltage measurement card
701260
UL1_J12 20000/sqrt(3) / 100/sqrt(3) / 100/3 =>
200 N/A Ch9
UL2_J12 20000/sqrt(3) / 100/sqrt(3) / 100/3 =>
200 N/A Ch10
UL3_J12 20000/sqrt(3) / 100/sqrt(3) / 100/3 =>
200 N/A Ch11
U0 20000/sqrt(3) / 100/sqrt(3) / 100/3 =>
115.47 N/A Ch13
UL1_J12s 20000 / 2 => 10000 5412002233 Ch14UL2_J12s 20000 / 2 => 10000 5412002242 Ch15UL3_J12s 20000 / 2 => 10000 5412002237 Ch16
Logic probe n/a
Table 4. Measurement equipment Yokogawa ScopeCorder DL750 at substation Masala bay 12, HonksbyScaling in the table above for DL750 channels takes into account the whole chain from primary to the signal into the measuring card.
CLEEN OY Eteläranta 10, P.O. BOX 10, FI-00131 HELSINKI, FINLAND www.cleen.fi
- 18 -
D6.13.1: Proof of concepts
Scaling
Shunt (0,1ohm) [1] /Sensor number
Channel
Sampling frequency
100kHz - - -
Current measurement card
701251 (Ch1 – Ch12) / 701250 (Ch13 - Ch16)
-
IL1_J14 400A / 5A / 0,5V => 800 S13 (corr. 1.0091) Ch1IL2_J14 400A / 5A / 0,5V => 800 S07 (corr. 0.99068) Ch2IL3_J14 400A / 5A / 0,5V => 800 S06 (corr. 1.0204) Ch3
I0_j14 70A / 1A / 0,1V => 700 S15 (corr. 1.0116) Ch4IL1_J14s 80A / 150 mV => 533.3 12
(corr. 1.0363 +0.0820deg)Ch5
IL2_J14s 80A / 150 mV => 533.3 11(corr. 1.0397 +0.0800deg)
Ch6
IL3_J14s 80A / 150 mV => 533.3 05(corr. 1.0369 +0.0800deg)
Ch7
Voltage measurement card
701260 - - -
UL1_J14 20000/sqrt(3) / 100/sqrt(3) / 100/3 =>
200 N/A Ch9
UL2_J14 20000/sqrt(3) / 100/sqrt(3) / 100/3 =>
200 N/A Ch10
UL3_J14 20000/sqrt(3) / 100/sqrt(3) / 100/3 =>
200 N/A Ch11
U0_J14 20000/sqrt(3) / 100/sqrt(3) / 100/3 =>
115.47 N/A Ch13
UL1_J14s 20000 / 2 => 10000 5412002240 Ch14UL2_J14s 20000 / 2 => 10000 5412002244 Ch15UL3_J14s 20000 / 2 => 10000 5412002235 Ch16
Logic probe n/a
Table 5. Measurement equipment Yokogawa ScopeCorder DL750 at substation Masala bay 14, Tolls
CLEEN OY Eteläranta 10, P.O. BOX 10, FI-00131 HELSINKI, FINLAND www.cleen.fi

- 19 -
D6.13.1: Proof of concepts
Scaling in the table above for DL750 channels takes into account the whole chain from primary to the signal into the measuring card.
Scaling
Shunt (0,1ohm) Channel
Sampling frequency
100kHz - - -
Current measurement card
701251 / 701260 (Ch7) - - -
IL1 80A / 150mV / 150mV*) =>
533.33 N/A Ch1
IL2 80A / 150mV / 150mV*) =>
533.33 N/A Ch2
IL3 80A / 150mV / 150mV*) =>
533.33 N/A Ch7
I0 100A / 1A / 150mV *) => 666.67 N/A Ch3
Voltage measurement card
701251 - - -
UL1 20000V / 2V / 2V => 10000 N/A Ch4UL2 20000V / 2V / 2V => 10000 N/A Ch5UL3 20000V / 2V / 2V => 10000 N/A Ch6
Logic probe 700987Logic probe, high speed
700986
*) Level of the relay “output” to Scope is 150mV for CT, (1.42V for VT signals), sensor signals come out on the same level as they go in (current 150mV, voltage 2V)Table 6. Measurement equipment Yokogawa ScopeCorder DL750 at Vikakärry
Scaling in the table above for DL750 channels takes into account the whole chain from primary to the signal into the measuring card.
CLEEN OY Eteläranta 10, P.O. BOX 10, FI-00131 HELSINKI, FINLAND www.cleen.fi

- 20 -
D6.13.1: Proof of concepts
Scaling COMTRADE(.dat & .cfg)
Scaling pu (.hdr & .rec, can be load with drecload.m)
Channel
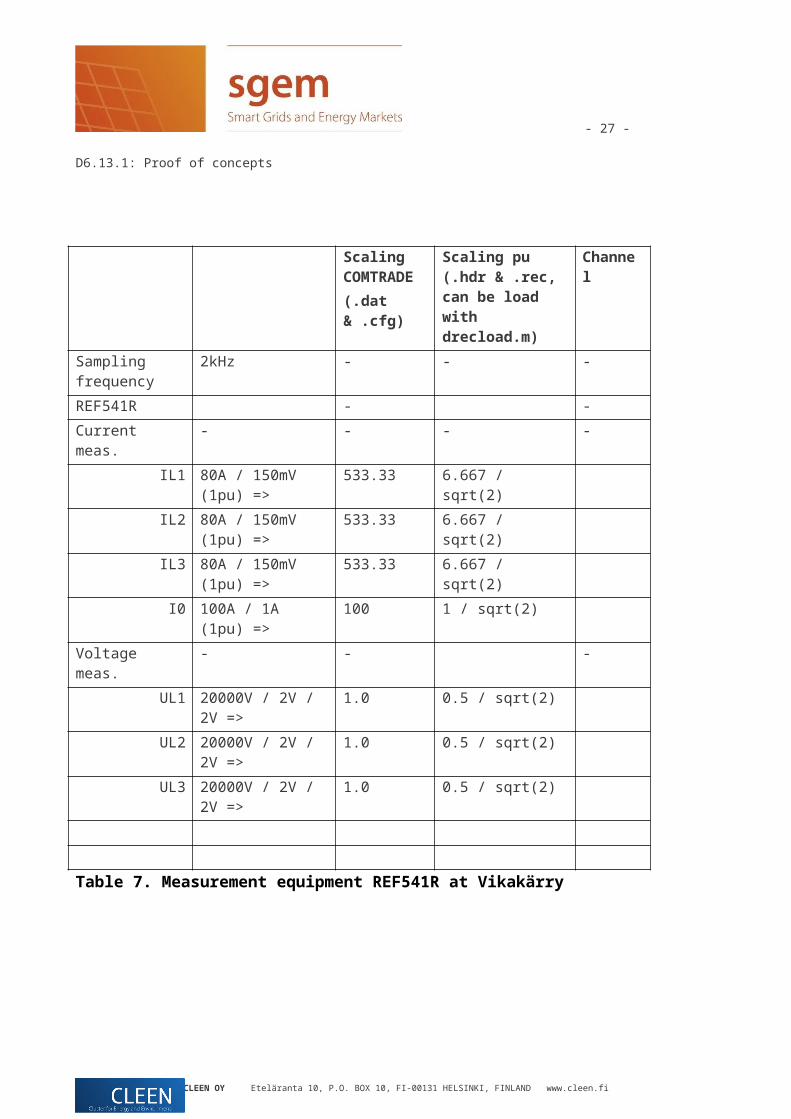
Sampling frequency
2kHz - - -
REF541R - -Current meas. - - - -
IL1 80A / 150mV (1pu) =>
533.33 6.667 / sqrt(2)
IL2 80A / 150mV (1pu) =>
533.33 6.667 / sqrt(2)
IL3 80A / 150mV (1pu) =>
533.33 6.667 / sqrt(2)
I0 100A / 1A (1pu) => 100 1 / sqrt(2)Voltage meas. - - -
UL1 20000V / 2V / 2V =>
1.0 0.5 / sqrt(2)
UL2 20000V / 2V / 2V =>
1.0 0.5 / sqrt(2)
UL3 20000V / 2V / 2V =>
1.0 0.5 / sqrt(2)
Table 7. Measurement equipment REF541R at Vikakärry
CLEEN OY Eteläranta 10, P.O. BOX 10, FI-00131 HELSINKI, FINLAND www.cleen.fi
- 21 -
D6.13.1: Proof of concepts
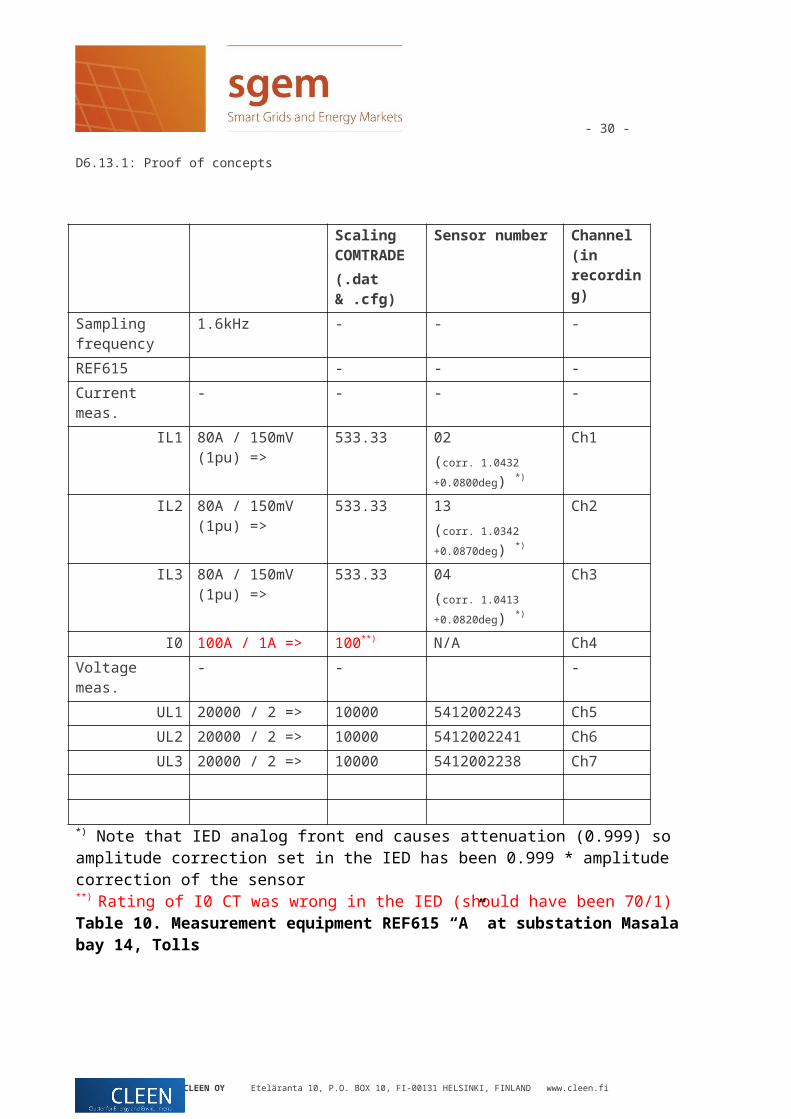
Scaling COMTRADE(.dat & .cfg)
Sensor number Channel (in recording)
Sampling frequency
1.6kHz - - -
REF615 - - -Current meas. - - - -
IL1 80A / 150mV (1pu) =>
533.33 08(corr. 1.0357 +0.0870deg) *)
Ch1
IL2 80A / 150mV (1pu) =>
533.33 03(corr. 1.0384 +0.0780deg) *)
Ch2
IL3 80A / 150mV (1pu) =>
533.33 09(corr. 1.0399 +0.0800deg) *)
Ch3
I0 70A / 1A => 70 N/A Ch4Voltage meas. - - -
UL1 20000 / 2 => 10000 5412002239 Ch5UL2 20000 / 2 => 10000 5412002234 Ch6UL3 20000 / 2 => 10000 5412002236 Ch7
*) Note that IED analog front end causes attenuation (0.999) so amplitude correction set in the IED has been 0.999 * amplitude correction of the sensorTable 8. Measurement equipment REF615 “A” at substation Masala bay 12, Honksby
CLEEN OY Eteläranta 10, P.O. BOX 10, FI-00131 HELSINKI, FINLAND www.cleen.fi

- 22 -
D6.13.1: Proof of concepts
Scaling COMTRADE(.dat & .cfg)
Channel (in recording)
Sampling frequency
1.6kHz - -
REF615 - -Current meas. - - -
I0 70A / 1A => 70 Ch2Voltage meas. - - -
U0 20000:sqrt(3) / 100:sqrt(3) / 100:3 =>
115.47 Ch1
Table 9. Measurement equipment REF615 “B” at substation Masala bay 12, Honksby
CLEEN OY Eteläranta 10, P.O. BOX 10, FI-00131 HELSINKI, FINLAND www.cleen.fi

- 23 -
D6.13.1: Proof of concepts
Scaling COMTRADE(.dat & .cfg)
Sensor number Channel (in recording)
Sampling frequency
1.6kHz - - -
REF615 - - -Current meas. - - - -
IL1 80A / 150mV (1pu) =>
533.33 02(corr. 1.0432 +0.0800deg) *)
Ch1
IL2 80A / 150mV (1pu) =>
533.33 13(corr. 1.0342 +0.0870deg) *)
Ch2
IL3 80A / 150mV (1pu) =>
533.33 04(corr. 1.0413 +0.0820deg) *)
Ch3
I0 100A / 1A => 100**) N/A Ch4Voltage meas. - - -
UL1 20000 / 2 => 10000 5412002243 Ch5UL2 20000 / 2 => 10000 5412002241 Ch6UL3 20000 / 2 => 10000 5412002238 Ch7
*) Note that IED analog front end causes attenuation (0.999) so amplitude correction set in the IED has been 0.999 * amplitude correction of the sensor**) Rating of I0 CT was wrong in the IED (should have been 70/1)Table 10. Measurement equipment REF615 “A” at substation Masala bay 14, Tolls
CLEEN OY Eteläranta 10, P.O. BOX 10, FI-00131 HELSINKI, FINLAND www.cleen.fi

- 24 -
D6.13.1: Proof of concepts
Scaling COMTRADE(.dat & .cfg)
Channel (in recording)
Sampling frequency
1.6kHz - -
REF615 - -Current meas. - - -
I0 70A / 1A => 70 Ch2Voltage meas. - - -
U0 20000:sqrt(3) / 100:sqrt(3) / 100:3 =>
115.47 Ch1
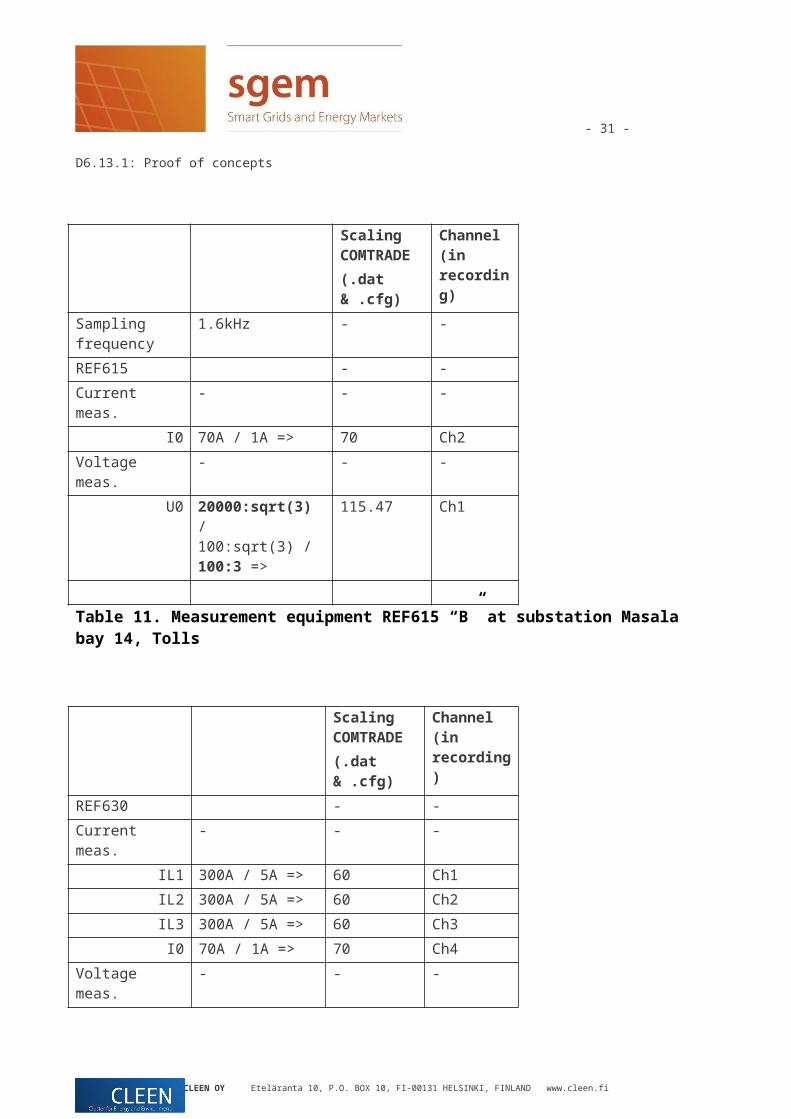
Table 11. Measurement equipment REF615 “B” at substation Masala bay 14, Tolls
Scaling COMTRADE(.dat & .cfg)
Channel (in recording)
REF630 - -Current meas. - - -
IL1 300A / 5A => 60 Ch1IL2 300A / 5A => 60 Ch2IL3 300A / 5A => 60 Ch3
I0 70A / 1A => 70 Ch4Voltage meas. - - -
UL1 20000:sqrt(3) / 100:sqrt(3) / 100:3 =>
200 Ch5
UL2 20000:sqrt(3) / 100:sqrt(3) / 100:3 =>
200 Ch6
UL3 20000:sqrt(3) / 100:sqrt(3) / 100:3 =>
200 Ch7
U0 20000:sqrt(3) / 100:sqrt(3) / 100:3 =>
115.47 Ch8
Table 12. Measurement equipment REF630 at substation Masala bay 12, Honksby
CLEEN OY Eteläranta 10, P.O. BOX 10, FI-00131 HELSINKI, FINLAND www.cleen.fi

- 25 -
D6.13.1: Proof of concepts
Scaling COMTRADE(.dat & .cfg)
Channel (in recording)
REF630 - -Current meas. - - -
IL1 400A / 5A => 80 Ch1IL2 400A / 5A => 80 Ch2IL3 400A / 5A => 80 Ch3
I0 70A / 1A => 70 Ch4Voltage meas. - - -
UL1 20000:sqrt(3) / 100:sqrt(3) / 100:3 =>
200 Ch5
UL2 20000:sqrt(3) / 100:sqrt(3) / 100:3 =>
200 Ch6
UL3 20000:sqrt(3) / 100:sqrt(3) / 100:3 =>
200 Ch7
U0 20000:sqrt(3) / 100:sqrt(3) / 100:3 =>
115.47 Ch8
Table 13. Measurement equipment REF630 at substation Masala bay 14, Tolls
CLEEN OY Eteläranta 10, P.O. BOX 10, FI-00131 HELSINKI, FINLAND www.cleen.fi

- 26 -
D6.13.1: Proof of concepts
Picture: Current sensors
Picture: Voltage sensors
CLEEN OY Eteläranta 10, P.O. BOX 10, FI-00131 HELSINKI, FINLAND www.cleen.fi
- 27 -
D6.13.1: Proof of concepts
CLEEN OY Eteläranta 10, P.O. BOX 10, FI-00131 HELSINKI, FINLAND www.cleen.fi

- 28 -
D6.13.1: Proof of concepts
7.2 Test cases
Test plan was made before field test period. Some extra test are made, like natural kind faults. Natural faults are made by connect wire directly to ground or tree.
101 test caseFault connection directly to network or via fault resistance.
39 direct (RF=0 W), 8 intermitted earth fault trials
33 low impedance (RF<500 ohm) Natural faults RF~250-2000 ohm
19 high impedance (RF = 1.7, 3.3 ja 5 kohm)3-phase short circuit faults
1 direct 2 with resistance (RF=7 ja 14 ohm/phase, star connection)
CLEEN OY Eteläranta 10, P.O. BOX 10, FI-00131 HELSINKI, FINLAND www.cleen.fi

- 29 -
D6.13.1: Proof of concepts
7.2.1 Location #1, Stenstrandintie E44058
Feeder J12 Honksby Distance, d=12.8 km 6 direct earth fault (tvika=0.4 s) 3 intermitted earth fault 4 high impedance, RF=3.3 kW (tvika=0.4 s) Fault connected to each phase
Disconnector fault detection verified
CLEEN OY Eteläranta 10, P.O. BOX 10, FI-00131 HELSINKI, FINLAND www.cleen.fi
- 30 -
D6.13.1: Proof of concepts
7.2.2 Fault location #2, Luotsiasema ESM1279 Feeder J14 Tolls Distance, d=27.4 km (=1 p.u.) 7 jäykkää maasulkua (tvika=0.4 s) 2 katkeilevan maasulun ’’yritystä’’ 17 pieni- ja suuri-ohmisia maasulkuja (tvika=0.4 s) 4 ’’luonnollisen’’ tyyppistä maasulkua (tvika=0.4 s) 1 kolmivaiheinen jäykkä oikosulku (tvika=0.1 s) Varioitiin viallista vaihetta ja vikaresistanssia (RF=0, 50, 100, 150, 330,
500, 1650, 3300 W)
CLEEN OY Eteläranta 10, P.O. BOX 10, FI-00131 HELSINKI, FINLAND www.cleen.fi
ESM1279
- 31 -
D6.13.1: Proof of concepts
7.2.3 Location #3, AndersBergintie ESM1106 Feeder J14 Tolls Distance, d=18.4 km =0.62 p.u. 8 jäykkää maasulkua (tvika=0.4 s) 3 katkeilevan maasulun ’’yritystä’’ 20 pieni- ja suuri-ohmisia maasulkuja (tvika=0.4 s) 3 ’’luonnollisen’’ tyyppistä maasulkua (tvika=0.4 s) 1 kolmivaiheinen oikosulku, RF=7 W, (tvika=0.1 s) Varioitiin viallista vaihetta ja vikaresistanssia (RF=0, 50, 100, 150, 330, 500,
1650, 3300, 5000 W)
CLEEN OY Eteläranta 10, P.O. BOX 10, FI-00131 HELSINKI, FINLAND www.cleen.fi
ESM1106
Masala SA

- 32 -
D6.13.1: Proof of concepts
7.2.4 Fault location #4, Dammossen ESM1368 Feeder J14 Tolls Distance, d=4.3 km (=0.12 p.u.) 10 jäykkää maasulkua (tvika=0.4 s) 11 pieni-ohmisia maasulkuja (tvika=0.4 s) 1 kolmivaiheinen oikosulku, RF=14 W, (tvika=0.1 s) Varioitiin viallista vaihetta ja vikaresistanssia (RF=0, 50, 100, 150, 330, 500 W)
CLEEN OY Eteläranta 10, P.O. BOX 10, FI-00131 HELSINKI, FINLAND www.cleen.fi
ESM1368
Masala SA

- 33 -
D6.13.1: Proof of concepts
7.3 ResultsFault location accuracy Janne?
7.3.1 Location #1 Stenstrandintie
1 2 3 4 5 6 7 8 9-0.1
-0.08
-0.06
-0.04
-0.02
0
0.02
0.04
0.06
0.08
0.1
Koe numero
Virh
e [p
u]
d_orig
Test #
Fault type RF/phase [ohm]
D_orig[pu]
TARGET[pu]
Inaccuracy_orig[pu]
1 L1E 0 0.45 0.46 -0.01
2 L1E 0 0.46 0.46 0.00
3 L2E 0 0.48 0.46 0.02
4 L2E 0 0.47 0.46 0.01
5 L3E 0 0.46 0.46 0.00
6 L3E 0 0.47 0.46 0.01
7 L1E* 0 0.51 0.46 0.05
8 L1E* 0 0.50 0.46 0.04
9 L1E* 0 0.52 0.46 0.06*Intermitted earth faultSummary
Location accuracy Low impedance ~ 1,5km
CLEEN OY Eteläranta 10, P.O. BOX 10, FI-00131 HELSINKI, FINLAND www.cleen.fi

- 34 -
D6.13.1: Proof of concepts
7.3.2 Location #2 Luotsiasema ESM1279
1 2 3 4 5 6 7 8 9-0.1
-0.08
-0.06
-0.04
-0.02
0
0.02
0.04
0.06
0.08
0.1
Koe numero
Virh
e [p
u]
d_orig
Koe #
Vikatyyppi RF/vaihe [ohm]
D_orig[pu]
D_optim [pu]
TARGET[pu]
Virhe_orig[pu]
Virhe_optim [pu]
13 L1 0 1.02 1.01 1 0.02 0.0114 L1 0 1.02 1.01 1 0.02 0.0115 L2 0 1.01 1.00 1 0.01 0.0016 L2 0 1.00 1.00 1 0.00 0.0017 L3 0 1.01 1.00 1 0.01 0.0018 L3 0 1.01 1.01 1 0.01 0.0119 L3 0 1.02 1.01 1 0.02 0.0120 L3 50 1.02 1.01 1 0.02 0.0121 L3 50 1.03 1.02 1 0.03 0.0222 L3 50 1.03 1.02 1 0.03 0.0223 L3 100 1.04 1.03 1 0.04 0.0324 L3 150 1.08 1.04 1 0.08 0.0425 L3 330 1.20 1.20 1 0.20 0.2026 L3 330 1.17 1.18 1 0.17 0.1827 L2 330 1.18 1.20 1 0.18 0.2028 L1 330 1.14 1.14 1 0.14 0.14
Summary Location accuracy
Low impedance ~ 4km
CLEEN OY Eteläranta 10, P.O. BOX 10, FI-00131 HELSINKI, FINLAND www.cleen.fi

- 35 -
D6.13.1: Proof of concepts
7.3.3 Location #3, AndersBergintie ESM1106
0 50 100 150 200 250 300 350 400
-0.25
-0.2
-0.15
-0.1
-0.05
0
0.05
0.1
0.15
0.2
0.25
Vikavastus [ohm]
Virh
e [p
u]
d_origd_optim
Koe #
Vikatyyppi RF/vaihe [ohm]
D_orig[pu]
D_optim [pu]
TARGET[pu]
Virhe_orig[pu]
Virhe_optim [pu]
44 3 0 0.69 0.63 0.62 0.07 0.0145 3 0 0.70 0.64 0.62 0.08 0.0246 2 0 0.68 0.62 0.62 0.06 0.0047 2 0 0.67 0.62 0.62 0.05 0.0048 1 0 0.68 0.62 0.62 0.06 0.0049 1 0 0.68 0.63 0.62 0.06 0.0150 1 0 0.68 0.62 0.62 0.06 0.0051 1 0 0.68 0.63 0.62 0.06 0.0152 1 50 0.69 0.64 0.62 0.07 0.0253 1 50 0.69 0.64 0.62 0.07 0.0254 1 50 0.67 0.62 0.62 0.05 0.0055 1 100 0.71 0.65 0.62 0.09 0.0356 1 150 0.67 0.61 0.62 0.05 -0.0157 1 330 0.73 0.70 0.62 0.11 0.0858 1 330 0.68 0.59 0.62 0.06 -0.0359 2 330 0.58 0.51 0.62 -0.04 -0.1160 3 330 0.86 0.85 0.62 0.24 0.23
Location accuracy Low impedance ~ 3km
CLEEN OY Eteläranta 10, P.O. BOX 10, FI-00131 HELSINKI, FINLAND www.cleen.fi

- 36 -
D6.13.1: Proof of concepts
7.3.4 Location #4, Dammossen ESM1368
0 50 100 150 200 250 300 350 400
-0.25
-0.2
-0.15
-0.1
-0.05
0
0.05
0.1
0.15
0.2
0.25
Vikavastus [ohm]
Virh
e [p
u]
d_origd_optim
Koe #
Vikatyyppi RF/vaihe [ohm]
D_orig[pu]
D_optim [pu]
TARGET[pu]
Virhe_orig[pu]
Virhe_optim [pu]
79 1 0 0.15 0.16 0.12 0.03 0.0480 1 0 0.15 0.15 0.12 0.03 0.0381 1 0 0.15 0.16 0.12 0.03 0.0482 1 0 0.16 0.17 0.12 0.04 0.0583 2 0 0.17 0.18 0.12 0.05 0.0684 2 0 0.17 0.18 0.12 0.05 0.0685 2 0 0.16 0.17 0.12 0.04 0.0586 3 0 0.16 0.17 0.12 0.04 0.0587 3 0 0.17 0.18 0.12 0.05 0.0688 3 0 0.17 0.18 0.12 0.05 0.0689 3 50 0.19 0.15 0.12 0.07 0.0390 3 50 0.18 0.13 0.12 0.06 0.0191 3 50 0.18 0.13 0.12 0.06 0.0192 3 100 0.20 0.12 0.12 0.08 0.0093 3 150 0.21 0.12 0.12 0.09 0.0094 3 330 0.24 0.07 0.12 0.12 -0.0595 3 330 0.25 0.09 0.12 0.13 -0.0396 2 330 0.32 0.15 0.12 0.20 0.0397 1 330 0.23 0.06 0.12 0.11 -0.06
CLEEN OY Eteläranta 10, P.O. BOX 10, FI-00131 HELSINKI, FINLAND www.cleen.fi

- 37 -
D6.13.1: Proof of concepts
8 Conclusions
Short circuit location very accuracy Earth fault location enough accuracy in low impedance (RF~<100 ohm) Earth fault distance calculation inaccuracy is increasing linear with fault resistance. Earth fault calculation parameter accuracy and correctness is important. Errors should be minimized in measurement chain.
Field tests was proofing that earth fault distance calculation algorithm in isolated network is enough accurate to enable fast fault isolation and geographical location. Tested fault indicators detects fault which distance can be calculated without any problems. Indicators are supporting very well fault location in DMS system by eliminating several locations when main line had branches.
00.2
0.40.6
0.81
-0.20
0.20.4
0.60
100
200
300
400
Vikaetäisyys [pu]Virhe [pu]
Vik
avas
tus
[ohm
]
CLEEN OY Eteläranta 10, P.O. BOX 10, FI-00131 HELSINKI, FINLAND www.cleen.fi

- 38 -
D6.13.1: Proof of concepts
9 Abbreviations
CIM Common Interface ModelDSO Distribution Service OperatorsNCC network control centerDMS Distribution management systemSOA Service Oriented ArchitectureEA Enterprise Architect toolUML Unified Modeling LanguageAMR Automated meter readingwsdl Web service definition languageXML Extensible Markup LanguageCIS Customer information systemGIS Geographical information systemAM Asset data management systemSCADA Supervisory, control and data acquisitionAMI Advanced Metering InfrastructureAMM Automated Metering ManagementOPC OLE for Process ControlESB Enterprise service bus
CLEEN OY Eteläranta 10, P.O. BOX 10, FI-00131 HELSINKI, FINLAND www.cleen.fi

- 39 -
D6.13.1: Proof of concepts
CLEEN OY Eteläranta 10, P.O. BOX 10, FI-00131 HELSINKI, FINLAND www.cleen.fi