maryland’s 2014 ozone “season” · maryland’s 2014 ozone “season
TRANSCRIPT

Martin O’Malley, Governor | Anthony G. Brown, Lt. Governor | Robert M. Summers, Ph.D., Secretary
Maryland’s 2014 Ozone “Season”
Joel Dreessen
Laura Warren

Ozone Season Summary
Date Daily Max
8-Hr Ozone
MD Monitors
> 75 ppb Region
6/16/14 81 ppb 1 Metro Baltimore
6/17/14 80 ppb 1 Metro Baltimore
7/11/14 79 ppb 3 Metro Baltimore
8/6/14 77 ppb 1 Metro
Washington
8/27/14 85 ppb 4 Metro Baltimore
& Washington
5 Maryland exceedance days,
> 75 ppb 8-hour daily max
All Code Orange days, or
Unhealthy for Sensitive Groups
(USG)
Highest day on August 27th at
85 ppb
Cleanest Maryland ozone season
on record
2013 was the next cleanest
season on record with 9
exceedance days
Forecast 4 Air Quality Alerts
6/17/14, 8/4/14, 8/5/14, 8/27/14
8/6/14
7/11/14 6/17/14
6/16/14
24 Hour Back Trajectories
NAM 40km initiated 500m, 21z
8/27/14
2

Meteorological Trends
At BWI, only 12 days*
at or above 90˚F
Above average June
precip in the central US
Below average July
temperatures, especially
in the central US
Winds seemed to be
more often southerly to
southeasterly similar to
2013
*As of 9/3/14, Source: NCDC 3

Case Study: July 11, 2014
Surface Analysis 7/11/14 at 18z
NOAA Operational Model 06z for Next Day
NOAA Operational Model 06z for Current Day
Ozone Conditions:
3 MD monitors exceeded
79 ppb 8-hour max at Fair Hill in NE MD
Meteorology:
Reverse corridor flow
Surface high pressure centered to NW
Surface temperatures 86°F at BWI but ~
90°F at PHL
06z NOAA operational model
No Orange in next day predictions, but
some Orange on the current day
Radar Wind Profiler 7/11/14 in Central MD
4 Source: AirNow, WPC, NAQFC
Daily Ozone AQI 7/11/14

Case Study: August 4-6, 2014
24 hour back trajectories for August 5, 2014
•High pressure over West Virginia and western Maryland created stagnant winds
•Surface temperatures were mid to upper 80s
•Monday August 4: transition day from lower 40s ppb on Sunday with clean northerly flow to threshold USG day for DC (71ppb)
•Tuesday, August 5 was thought to be a “slam dunk” USG forecast with temperatures ~90°F
50m
500m
1500m
5

Case Study: August 4-6, 2014
Day 2 Forecast for August 5
8 hr Avg Ozone
1 hour Max Ozone 1 hour Max Ozone
8 hr Avg Ozone 6

Case Study: August 4-6, 2014
Day 1 Forecast for August 5
8 hr Avg Ozone
1 hour Max Ozone 1 hour Max Ozone
8 hr Avg Ozone 7

Case Study: August 4-6, 2014
~100ppb of ozone 250-1000m AGL
Likely composite sounding with plane data 8

~100ppb of ozone 250-1000m AGL
Model surface ozone forecast was excessive but seems correct when applied to the aloft ozone plume
9
Case Study: August 4-6, 2014
Summary: August 4-6, 2014
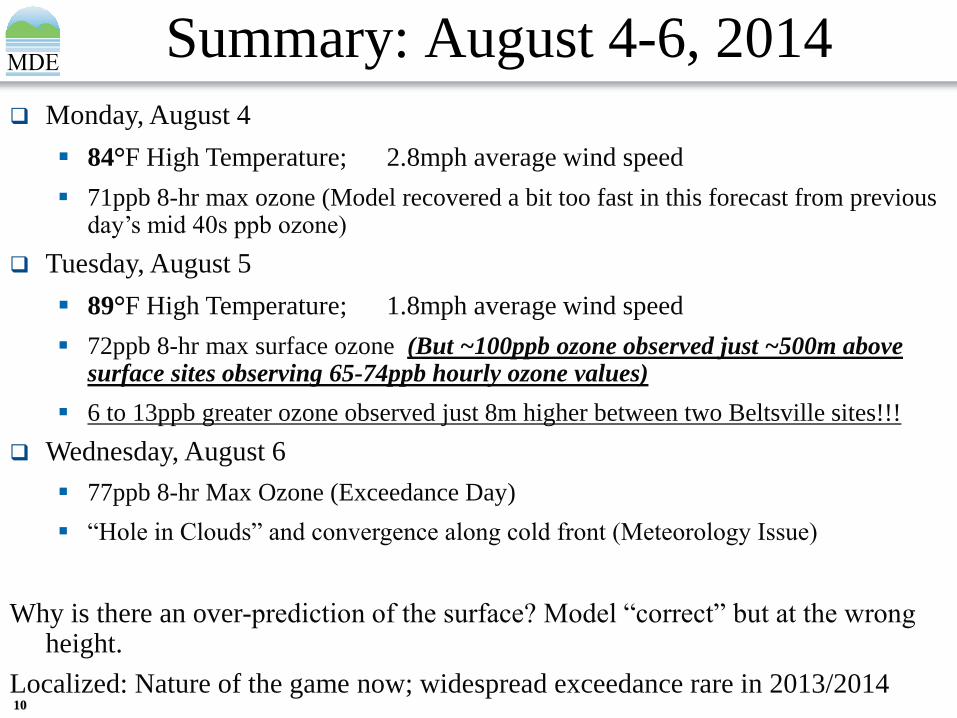
Monday, August 4
84°F High Temperature; 2.8mph average wind speed
71ppb 8-hr max ozone (Model recovered a bit too fast in this forecast from previous day’s mid 40s ppb ozone)
Tuesday, August 5
89°F High Temperature; 1.8mph average wind speed
72ppb 8-hr max surface ozone (But ~100ppb ozone observed just ~500m above surface sites observing 65-74ppb hourly ozone values)
6 to 13ppb greater ozone observed just 8m higher between two Beltsville sites!!!
Wednesday, August 6
77ppb 8-hr Max Ozone (Exceedance Day)
“Hole in Clouds” and convergence along cold front (Meteorology Issue)
Why is there an over-prediction of the surface? Model “correct” but at the wrong height.
Localized: Nature of the game now; widespread exceedance rare in 2013/2014 10

Recent information obtained regarding marine
emissions in the Bay areas could be causing over
prediction of surface ozone, especially in light of
lower than actual PBLH. All boat emissions in the
bay are ingested at level zero (0), or on the ground
in the off-the-shelf NEI. This would cause a spike
in NOx at the surface and potentially lead to ozone
overestimation.
Operational models tend to over predict surface ozone
Ozone too high in the Chesapeake Bay and near Norfolk, Virginia
11

Ship Emissions: MARAMA 2007
12
Level zero (0) emissions
Non-level zero (0) emissions
NOx Emissions
Source: University of Maryland
Is the emissions inventory correct?
Are ship/train/plane emissions processed correctly?
12
Ozone Trends
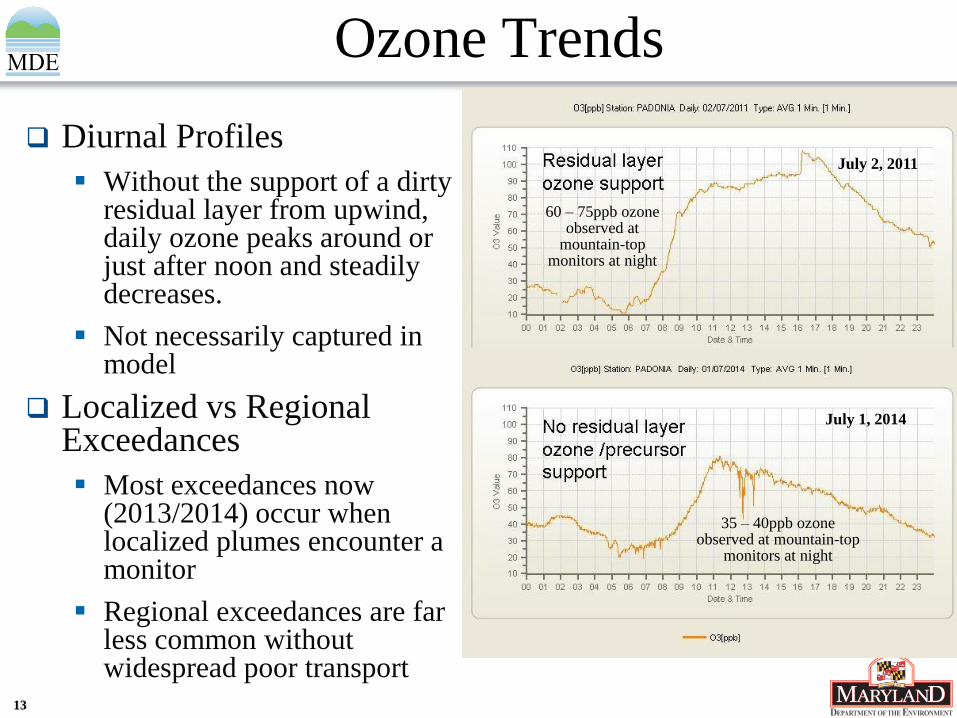
Diurnal Profiles
Without the support of a dirty residual layer from upwind, daily ozone peaks around or just after noon and steadily decreases.
Not necessarily captured in model
Localized vs Regional Exceedances
Most exceedances now (2013/2014) occur when localized plumes encounter a monitor
Regional exceedances are far less common without widespread poor transport
60 – 75ppb ozone observed at
mountain-top monitors at night
35 – 40ppb ozone observed at mountain-top
monitors at night
July 2, 2011
July 1, 2014
13

Ozone Trends: Bermuda High
The pressure gradient between the Midwest and Atlantic(~35°N)
has been steadily increasing since at least 1980.
South and southeast wind component has been steadily growing
Is there an implication on air quality trends in the future?
Atlantic Ocean Minus Continental Locations
y = 0.0527x + 2.4753
R2 = 0.2654
0
1
2
3
4
5
6
19
80
19
82
19
84
19
86
19
88
19
90
19
92
19
94
19
96
19
98
20
00
20
02
20
04
20
06
20
08
20
10
20
12
20
14
Year
Mil
lib
ars
D
iffe
ren
ce
Atlantic - Midwest
Atlantic - Westward
Atlantic - APLT
14

Appendix: MD Ozone Summary
As of Sept. 3*
15