maryland integrated science assessment · the misa preliminary student report is an on-demand...
TRANSCRIPT

Maryland Integrated Science AssessmentScore Report Interpretation Guide


SPRING 2019 MISA SCORE REPORT INTERPRETATION GUIDE iii
Table of Contents
1.0 General Information for Parents and Educators ...........................................................51.1 Background of the Maryland Integrated Science Assessment .............................................. 5
1.2 Confidentiality of Reporting Results ........................................................................................ 5
1.3 Purpose of this Guide ................................................................................................................ 5
2.0 Understanding the Preliminary Student Report ...........................................................62.1 Types of Scores on the MISA Preliminary Student Report .................................................... 6
2.1.1 Scale Score ........................................................................................................................ 62.1.2 Performance Level ............................................................................................................... 62.1.3 Dimensions of Science Performance Indicators .................................................................. 6
2.2 Preliminary Student Report ...................................................................................................... 7
2.3 Description of Preliminary Student Report ............................................................................. 7
3.0 Understanding the MISA Individual Student Report ....................................................93.1 Types of Scores on the MISA Individual Student Report ....................................................... 9
3.1.1 Scale Score ......................................................................................................................... 93.1.2 Performance Level ............................................................................................................... 93.1.3 Dimensions of Science Performance Indicators .................................................................. 9
3.2 Sample Individual Student Report .........................................................................................10
3.3 Description of Individual Student Reports .............................................................................11
4.0 Understanding the MISA School and District Reports ...............................................144.1 Purpose and Use of MISA Results ..........................................................................................14
4.2 MISA School and District Reports ..........................................................................................144.2.1 Types of Scores on the MISA School and District Reports ................................................144.2.2 Scale Score........................................................................................................................144.2.3 Performance Level .............................................................................................................144.2.4 Dimensions of Science Performance Indicators ................................................................15
4.3 Sample Student Label ..............................................................................................................15
4.4 Description of Student Label ...................................................................................................15
4.5 Sample Student Roster Report ................................................................................................16
4.6 Description of Student Roster Reports ..................................................................................16
4.7 Sample District Summary of Schools Report .......................................................................18
4.8 Description of District Summary of Schools Report .............................................................18
5.0 Understanding the MISA Performance Level Summary Reports, State Summary Report, and School Evidence Statement Analysis Report ...................20
5.1 Background .............................................................................................................................. 20
5.2 Confidentiality of Reporting Results ..................................................................................... 20
5.3 Accessing the Reports ............................................................................................................ 20
5.4 Understanding the School Performance Level Summary .................................................... 205.4.1 General Overview ............................................................................................................. 205.4.2 Sample School Performance Level Summary .................................................................. 215.4.3 Description of MISA School Performance Level Summary ............................................... 21
SPRING 2019 MISA SCORE REPORT INTERPRETATION GUIDEiv
5.5 Understanding the MISA State Summary of Districts Report ............................................. 225.5.1 General Overview ............................................................................................................. 225.5.2 Sample State Summary of Districts Report ...................................................................... 225.5.3 Description of MISA State Summary of Districts Report ................................................... 22
5.6 Understanding the MISA School Evidence Statement Analysis Report ............................. 245.6.1 General Overview ............................................................................................................. 245.6.2 Sample School Evidence Statement Analysis Report – Page 1 ....................................... 245.6.3 Description of School Evidence Statement Analysis Report – Page 1.............................. 245.6.4 Sample School Evidence Statement Analysis Report – Page 2 ....................................... 265.6.5 Description of School Evidence Statement Analysis Report – Page 2.............................. 27
Appendix A
Scale Score Ranges ................................................................................................................ 29
Appendix B
Performance Level Descriptors ............................................................................................. 31

SPRING 2019 MISA SCORE REPORT INTERPRETATION GUIDE 5
1.0 General Information for Parents and Educators1.1 Background of the Maryland Integrated Science AssessmentIn 2013, the Maryland State Board of Education adopted the Next Generation Science Standards (NGSS) as the new Maryland Science Standards. To assess progress toward these standards for students in grades 5 and 8, the Maryland State Department of Education (MSDE) developed the Maryland Integrated Science Assessment (MISA).
The Spring 2019 MISA assessments were administered in either computer-based or paper-based format. The tests assessed student mastery of the three dimensions necessary to understand science: Science and Engineering Practices (SEP), Crosscutting Concepts (CCC), and Disciplinary Core Ideas (DCI). Students demonstrated their mastery by interacting with a stimulus such as a video, chart, or diagram, and then responding to several items supported by the stimulus.
1.2 Confidentiality of Reporting ResultsIndividual student performance results are confidential and may be released only in accordance with the Family Educational Rights and Privacy Act of 1974 (20 U.S.C. Section 1232g). Aggregated student performance data are made available to the public and do not contain the names of individual students or teachers. The State Summary of Districts Report and School Evidence Analysis Reports are for use at a state, district, and school level and are not intended for public distribution.
1.3 Purpose of this GuideThis guide provides information on the Preliminary Student Reports, Individual Student Reports, school reports, district reports, and state reports provided for MISA results. Section 3.0, which outlines and explains elements of the Individual Student Report, may be shared with parents. This section will help parents understand their child’s test results. Section 4.0 outlines and explains elements of the school and district reports. Section 5.0 includes reports for use at a state, district, and school level.
Sample reports included in this guide are for illustration purposes only. They are provided to show the basic layout of the reports and the information they provide. Sample reports do not include actual data from any test administration.
SPRING 2019 MISA SCORE REPORT INTERPRETATION GUIDE6
2.0 Understanding the Preliminary Student Report
2.1 Types of Scores on the MISA Preliminary Student ReportThe MISA Preliminary Student Report is an on-demand report in PearsonAccessnext. Student performance on MISA is described on the Preliminary Student Report using scale scores, performance levels, and subcategory performance indicators.
2.1.1 Scale Score A scale score is a numerical value that summarizes student performance. Not all students respond to the same set of test items, so each student’s raw score (actual points earned on test items) is adjusted for the slight differences in difficulty among the various forms and administrations of the test. The resulting scale score allows for an accurate comparison across test forms and administration years within a grade or course and content area. MISA reports provide overall scale scores for the science assessment, which determine a student’s performance level. MISA scale scores range from 650 to 850 for all tests.
For example, a student who earns an overall scale score of 750 on one form of the grade 5 science assessment would be expected to earn an overall scale score of 750 on any other form of the grade 5 science assessment. Furthermore, the student’s overall scale score and level of mastery of concepts and skills would be comparable to a student who took the same assessment the previous year or following year.
2.1.2 Performance LevelEach performance level is a broad, categorical level defined by a student’s overall scale score and is used to report overall student performance by describing how well students met the expectations for their grade band/course. Each performance level is defined by a range of overall scale scores for the assessment. There are four performance levels for MISA:
• Level 5: Exceeded expectations
• Level 4: Met expectations
• Level 3: Approached expectations
• Level 2: Partially met expectations
Students performing at levels 4 and 5 met or exceeded expectations and are on track for the next grade band. Additional information pertaining to the test performance levels can be found in Appendix A.
Performance Level Descriptors (PLDs) describe the knowledge, skills, and practices that students should know and be able to demonstrate at each performance level in science. PLDs are available at http://www.marylandpublicschools.org/about/Pages/DCAA/Science/index.aspx.
2.1.3 Dimensions of Science Performance IndicatorsMastery of the dimensions of science is reported using graphical representations that indicate how the student performed relative to the overall performance of students who met or approached expectations for the content area.
Performance for each of the three dimensions is reported using categories rather than scale scores or performance levels. The three categories are: Met or Exceeded Expectations, Approached Expectations, and Did Not Yet Meet Expectations.

SPRING 2019 MISA SCORE REPORT INTERPRETATION GUIDE 7
2.2 Preliminary Student Report
9
MARY M POPPINS (7898978823)
Produced on 5/10/2018
Test Details
Test NameGrade 5 Science
StateMaryland
Grade05
Testing LEAQA LEA 24
Date of Birth11/30/2000
Testing SchoolQA SCHOOL2 (066662)
How Did MARY Perform Overall?
Maryland Integrated Science Assessment Report 2017-2018
This report shows whether MARY met grade band expectations in science and is on track for the next grade band. The Maryland Integrated Science Assessment (MISA) is just one measure of how well your child is performing academically.
How Did Your Child Perform in Science?
Reporting Item Performance Level Indicator
--> Physical Science Met or Exceeded Expectations
--> Earth and Space Science Approached Expectations
--> Life Science Approached Expectations
--> Science and Engineering Practices Met or Exceeded Expectations
--> Crosscutting Concepts Did Not Yet Meet Expectations
Performance Level Indicator:Did Not Yet Meet Expectations
Approached ExpectationsMet or Exceeded Expectations
Results provided in PearsonAccessnext OnDemand Reports are preliminary. Official results will be reported by your state.
2018-2019
Produced 2019
A
B
C
E
D
2.3 Description of Preliminary Student ReportA. Identification InformationThe student’s name, state student-ID, grade band when assessed, date of birth, state, district name, and school name are provided.

SPRING 2019 MISA SCORE REPORT INTERPRETATION GUIDE8
B. Overall Scale ScoreThe student’s overall scale score is shown in this section.
C. Graphical Representation of Overall Performance: Overall Scale Score and Performance LevelThis graphic provides an illustration of the four performance levels (Exceeded Expectations, Approached Expectations, Met Expectations, and Partially Met Expectations) and where the student’s overall scale score is positioned along the performance scale. The student’s score is indicated by the black triangle positioned along the range of overall scale scores that define each performance level. Refer to Appendix A for the full list of scale score ranges for each performance level.
D. Description of ReportThe description of the report includes the content area assessed and the assessment year. It also provides a general overview of the score report.
E. How Did Your Child Perform in Science?This section of the report shows the student’s performance in the three dimensions of science: Disciplinary Core Ideas (DCI), Science and Engineering Practices (SEP), and Crosscutting Concepts (CC). Performance in DCI is shown through three subcategories: Physical Science, Life Science, and Earth and Space Sciences. The performance level achieved for each dimension and subcategory is shown at the right side of the box. Performance in the dimensions of science is reported using the following categories rather than scale scores or performance levels:
• Met or Exceeded Expectations: Students in this category are likely academically well prepared to engage successfully in further studies in the dimension of science content area and may need instructional enrichment.
• Approached Expectations: Students in this category likely need academic support to engage successfully in further studies in the dimension of science content area.
• Did Not Yet Meet Expectations: Students in this category are likely not academically well prepared to engage successfully in further studies in the dimension of science content area. Such students likely need instructional interventions to increase achievement in the dimension of science content area.
SPRING 2019 MISA SCORE REPORT INTERPRETATION GUIDE 9
3.0 Understanding the MISA Individual Student Report
3.1 Types of Scores on the MISA Individual Student ReportStudent performance on MISA is described on the Individual Student Report using scale scores, performance levels, and subcategory performance indicators. State, district, and school average results are included in relevant sections of the report to help parents understand how their child’s performance compares to that of other students. In some instances, a dash (–) will appear in place of average results for a school and/or district. This indicates that there are too few students to maintain student privacy and therefore results are not reported.
3.1.1 Scale ScoreA scale score is a numerical value that summarizes student performance. Not all students respond to the same set of test items, so each student’s raw score (actual points earned on test items) is adjusted for the slight differences in difficulty among the various forms and administrations of the test. The resulting scale score allows for an accurate comparison across test forms and administration years within a grade or course and content area. MISA reports provide overall scale scores for the science assessment, which determine a student’s performance level. MISA scale scores range from 650 to 850 for all tests.
For example, a student who earns an overall scale score of 750 on one form of the grade 5 science assessment would be expected to earn an overall scale score of 750 on any other form of the grade 5 science assessment. Furthermore, the student’s overall scale score and level of mastery of concepts and skills would be comparable to a student who took the same assessment the previous year or following year.
3.1.2 Performance LevelEach performance level is a broad, categorical level defined by a student’s overall scale score and is used to report overall student performance by describing how well students met the expectations for their grade band/course. Each performance level is defined by a range of overall scale scores for the assessment. There are four performance levels for MISA:
• Level 5: Exceeded expectations
• Level 4: Met expectations
• Level 3: Approached expectations
• Level 2: Partially met expectations
Students performing at levels 4 and 5 met or exceeded expectations and are on track for the next grade band. Additional information pertaining to the test performance levels can be found in Appendix A.
Performance Level Descriptors (PLDs) describe the knowledge, skills, and practices that students should know and be able to demonstrate at each performance level in science. PLDs are available at http://www.marylandpublicschools.org/about/Pages/DCAA/Science/index.aspx.
3.1.3 Dimensions of Science Performance IndicatorsMastery of the dimensions of science is reported using graphical representations that indicate how the student performed relative to the overall performance of students who met or approached expectations for the content area.
SPRING 2019 MISA SCORE REPORT INTERPRETATION GUIDE10
Performance for each of the three dimensions is reported using categories rather than scale scores or performance levels.
• Met or Exceeded Expectations – represented by an up arrow
• Approached Expectations – represented by a bidirectional arrow
• Did Not Yet Meet Expectations – represented by a down arrow
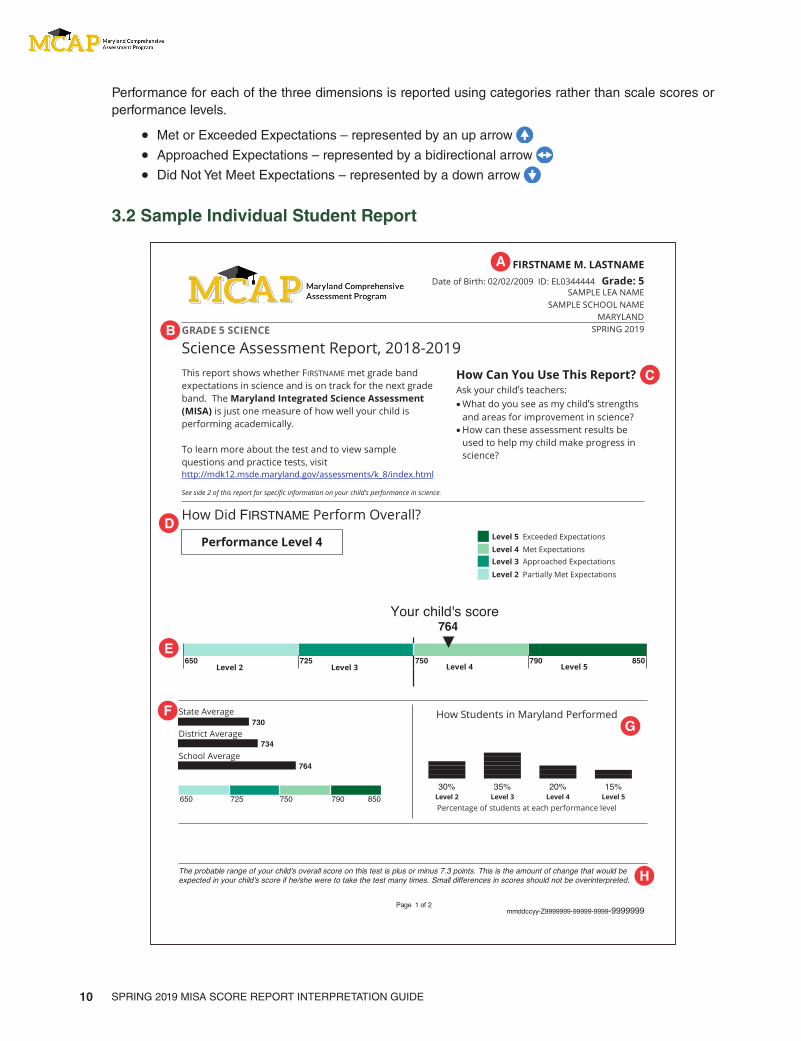
3.2 Sample Individual Student Report
A
B
C
D
E
FG
H
FIRSTNAME M. LASTNAMEDate of Birth: 02/02/2009 ID: EL0344444 Grade: 5
SAMPLE LEA NAMESAMPLE SCHOOL NAME
MARYLANDSPRING 2019
Page 1 of 2
GRADE 5 SCIENCE
Science Assessment Report, 2018-2019This report shows whether FIRSTNAME met grade bandexpectations in science and is on track for the next gradeband. TheMaryland Integrated Science Assessment(MISA) is just one measure of how well your child isperforming academically.
To learn more about the test and to view samplequestions and practice tests, visithttp://mdk12.msde.maryland.gov/assessments/k_8/index.html
How Can You Use This Report?Ask your child’s teachers:•What do you see as my child’s strengthsand areas for improvement in science?
•How can these assessment results beused to help my child make progress inscience?
See side 2 of this report for specific information on your child’s performance in science.
How Did FIRSTNAME Perform Overall?
The probable range of your child's overall score on this test is plus or minus 7.3 points. This is the amount of change that would beexpected in your child's score if he/she were to take the test many times. Small differences in scores should not be overinterpreted.
State Average
District Average
School Average
650 725 750 790 850
How Students in Maryland Performed
Percentage of students at each performance level
734
30% 35% 20% 15%Level 2 Level 3 Level 4 Level 5
764
Your child's score764
mmddccyy-Z9999999-99999-9999-9999999
Level 5 Exceeded Expectations
Level 4 Met ExpectationsLevel 3 Approached Expectations
Level 2 Partially Met Expectations
Performance Level 4
730
650Level 2
725Level 3
750Level 4
790Level 5
850

SPRING 2019 MISA SCORE REPORT INTERPRETATION GUIDE 11
3.3 Description of Individual Student ReportsA. Identification InformationAn Individual Student Report lists the student’s name, date of birth, state student ID, grade band when assessed, district name, school name, and state.
B. Description of ReportThe description of the report provides the grade band/course assessed, content area assessed, and assessment year. It also provides a general overview of the assessment and score report.

SPRING 2019 MISA SCORE REPORT INTERPRETATION GUIDE12
C. How to Use the ReportThis section provides guidance for how parents can use the report to start a discussion with their child’s teacher(s). It is important for parents and educators to have regular check-ins to ensure students are learning the necessary skills to stay on track. Parents can use the information in the report to understand their child’s strengths and needs and to work with educators to identify resources to support his or her education.
D. Overall Scale Score and Performance LevelThis section of the report provides the student’s overall scale score and performance level (refer to Section 3.1). Students receive an overall scale score and, based on that score, are placed in one of four performance levels, from Level 5, indicating the student exceeded expectations, to Level 2, indicating the student partially met expectations.
E. Graphical Representation of Overall Performance: Overall Scale Score and Performance LevelThis graphic provides an illustration of the four performance levels and where the student’s overall scale score is positioned along the performance scale. The student’s score is indicated by the black triangle positioned along the range of overall scale scores that define each performance level. The ranges of overall scale scores are indicated underneath the graphic. The scale scores needed to reach each performance level vary slightly between grades 5 and 8. Refer to Appendix A for the full list of scale score ranges for each performance level.
F. Average of School, District, and StateThe average overall scale scores of the school, district, and state are shown below the overall scale score and performance level graphic. This allows for comparing a student’s overall scale score to the average overall scale score of students at the school, district, and state levels for the same grade band.
G. Percentage of Students at Each Performance LevelThis section provides a bar graph showing the percentage of students within the state who performed at each of the four performance levels.
H. Probable RangeThe probable range of scores is based on the standard error of measurement, which reflects the variability that would be expected in the scores that your student would likely receive if the same form of the assessment was taken multiple times. The probable range of scores differs across forms and across level of performance within forms.
I. Dimensions of Science Reporting CategoriesThe report shows the student’s performance for the three dimensions of science: Disciplinary Core Ideas (DCI), Science and Engineering Practices (SEP), and Crosscutting Concepts (CCC). In addition, there are three subcategories in the DCI dimension: Physical Science, Life Science, and Earth and Space Sciences. Each dimension of science is indicated by a large, black header. The DCI subcategories are indicated by a smaller black header.
J. Dimension of Science Performance IndicatorsA student’s dimension of science performance indicators represent how well the student performed in the dimensions of science. As with overall category scores, a measure of student proficiency for each dimension is estimated on a common, underlying measurement scale. Student performance in the dimensions of science is reported using categories rather than scale scores or performance levels.
SPRING 2019 MISA SCORE REPORT INTERPRETATION GUIDE 13
• Met or Exceeded Expectations – represented by an up arrow
• Approached Expectations – represented by a bidirectional arrow
• Did Not Yet Meet Expectations – represented by a down arrow
K. Description of Dimensions of Science Performance Indicator GraphicsStudent performance for each dimension is marked with a performance indicator.
a. An up arrow for the specified dimension indicates that the student “Met or Exceeded Expectations. Students in this category are likely academically well prepared to engage successfully in further studies in the dimension of science content area and may need instructional enrichment.
b. A bidirectional arrow for the specified dimension indicates that the student “Approached Expectations.” Students in this category likely need academic support to engage successfully in further studies in the dimension of science content area.
c. A down arrow for the specified dimension indicates that the student “Did Not Yet Meet Expectations.” Students in this category are likely not academically well prepared to engage successfully in further studies in the dimension of science content area. Such students likely need instructional interventions to increase achievement in the dimension of science content area.
L. Description of the Maryland Integrated Science AssessmentsThis section provides a brief description of the MISA. It also includes information on how teachers, schools, and districts use the reports to make improvements to educational programming.

SPRING 2019 MISA SCORE REPORT INTERPRETATION GUIDE14
4.0 Understanding the MISA School and District Reports4.1 Purpose and Use of MISA ResultsThe primary purpose of MISA is to provide high-quality science assessments to measure how well students understand grade band concepts in science. The assessment is one of several ways to help parents and teachers understand how well children are acquiring science concepts and practices. These reports:
• Summarize student achievement in science
• Describe student performance relative to meeting standards
• Support improvement planning (e.g., prioritize professional learning and resource decisions, advise program alignment with academic standards, reflect on the effectiveness of school initiatives)
4.2 MISA School and District ReportsIn addition to Individual Student Reports, schools will receive a Student Roster, and districts will receive a School Performance Level Summary. These reports summarize how students in the school or district performed and are described later in this section.
4.2.1 Types of Scores on the MISA School and District ReportsPerformance on MISA assessments is described on the school and district reports using scale scores, performance levels, and dimensions of science performance indicators. Information about state, district, and school average results is included in relevant sections of the reports to help schools and districts understand how student and school performance compares to other students and schools.
4.2.2 Scale ScoreA scale score is a numerical value that summarizes student performance. Not all students respond to the same set of test items, so each student’s raw score (actual points earned on test items) is adjusted for the slight differences in difficulty among the various forms and administrations of the test. The resulting scale score allows for an accurate comparison across test forms and administration years within a grade or course and content area. MISA reports provide overall scale scores for science, which determine a student’s performance level. MISA scale scores range from 650 to 850 for all tests.
For example, a student who earns an overall scale score of 750 on one form of the grade 5 MISA test would be expected to earn an overall scale score of 750 on any other form of the grade 5 MISA test. Furthermore, the student’s overall scale score and level of mastery of concepts and skills would be comparable to a student who took the same assessment the previous year or following year.
4.2.3 Performance LevelEach performance level is a broad, categorical level defined by a student’s overall scale score and is used to report overall student performance by describing how well students met the expectations for their grade band/course. Each performance level is defined by a range of overall scale scores for the assessment. There are four performance levels for MISA assessments:
• Level 5: Exceeded expectations
• Level 4: Met expectations
• Level 3: Approached expectations
• Level 2: Partially met expectations
SPRING 2019 MISA SCORE REPORT INTERPRETATION GUIDE 15
Students performing at levels 4 and 5 met or exceeded expectations and are on track for the next grade band. Additional information pertaining to the test performance levels can be found in Appendix A.
Performance Level Descriptors (PLDs) describe the knowledge, skills, and practices that students should know and be able to demonstrate at each performance level in science and at each grade band/course. PLDs are available at http://www.marylandpublicschools.org/about/Pages/DCAA/Science/index.aspx.
4.2.4 Dimensions of Science Performance IndicatorsDimensions of science performance indicators for MISA assessments are reported using graphical representations that indicate how the student performed relative to the overall performance of students who met or nearly met expectations for the content area.
Dimensions of science performance is reported using categories rather than scale scores or performance levels.
• Met or Exceeded Expectations – represented by an up arrow
• Approached Expectations – represented by a bidirectional arrow
• Did Not Yet Meet Expectations – represented by a down arrow
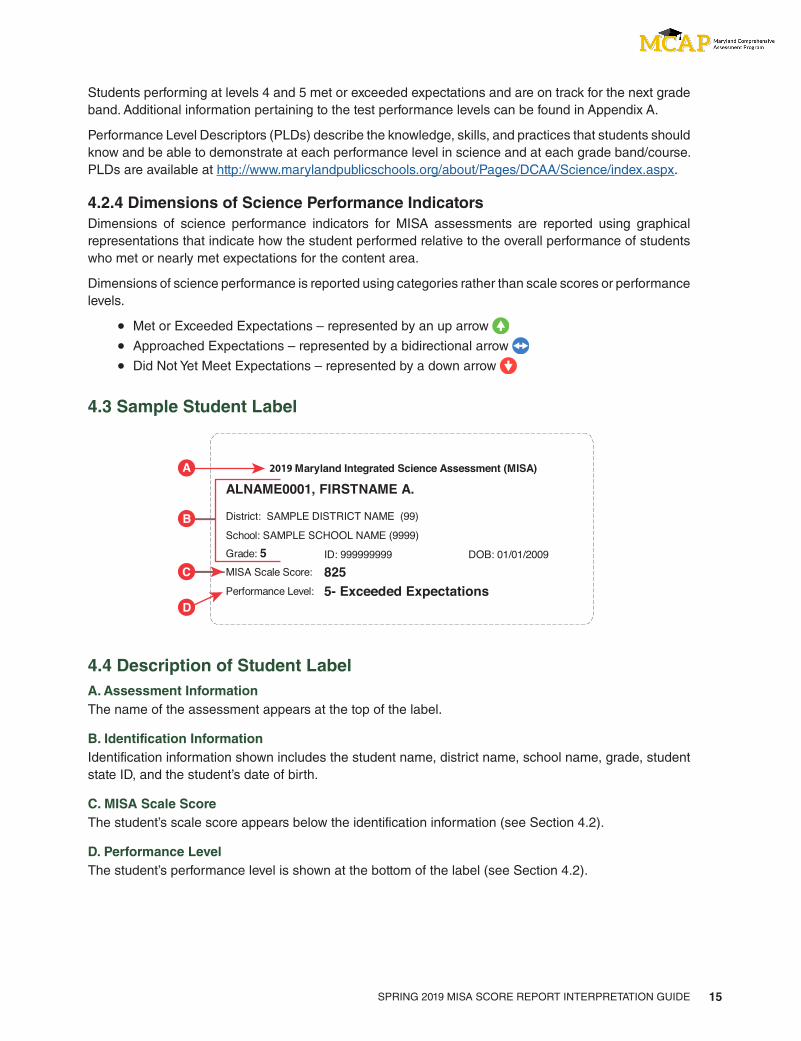
4.3 Sample Student Label
2018 Maryland Integrated Science Assessment (MISA)
ALNAME0001, FIRSTNAME A.
District: SAMPLE DISTRICT NAME (99)
School: SAMPLE SCHOOL NAME (9999)Grade: 5 ID: 999999999 DOB: 01/01/2009MISA Scale Score: 825Performance Level: 5- Exceeded Expectations
A
B
D
C
2019
4.4 Description of Student LabelA. Assessment InformationThe name of the assessment appears at the top of the label.
B. Identification InformationIdentification information shown includes the student name, district name, school name, grade, student state ID, and the student’s date of birth.
C. MISA Scale ScoreThe student’s scale score appears below the identification information (see Section 4.2).
D. Performance LevelThe student’s performance level is shown at the bottom of the label (see Section 4.2).

SPRING 2019 MISA SCORE REPORT INTERPRETATION GUIDE16
4.5 Sample Student Roster Report
4.6 Description of Student Roster ReportsA. Identification InformationStudent Rosters list the grade band or course assessed, school name, district name, and state.
B. Assessment InformationThe report heading provides the content area assessed, grade band/course assessed, and assessment year.
C. Roster of StudentsThe first column of the Student Roster includes an alphabetized list of all students in the school at the specified grade band/course who took the science assessment. The first three rows include the state, district, and school averages.
D. Overall Scale Score and Performance LevelThis column of the report provides the student’s overall scale score and color-coded performance level (refer to Section 4.2). Students receive a numerical score and, based on that score, are placed in one of four performance levels, from Level 5, indicating the student exceeded expectations, to Level 2, indicating the student has partially met expectations. Performance levels are indicated by the color highlighting behind the number. Refer to E for the color key. The first three rows contain state, district, and school averages.
SPRING 2019 MISA SCORE REPORT INTERPRETATION GUIDE 17
E. Description of Performance Level GraphicThis graphic provides a colored illustration of the four performance levels and helps to quickly show the performance level for each student's scale score.
F. Dimensions of Science Reporting CategoriesThe report shows student performance on the three dimensions of science: Disciplinary Core Ideas (DCI), Science and Engineering Practices (SEP), and Crosscutting Concepts (CCC). In addition, there are three subcategories in the DCI dimension: Physical Science, Life Science, and Earth and Space Sciences.
G. Dimension of Science Performance IndicatorsA student’s performance here represents how well the student performed in the dimensions of science or, for DCI, in the subcategories within the dimension. As with overall and reporting category scores, a measure of student proficiency for each dimension and subcategory is estimated on a common, underlying measurement scale.
Student performance for dimensions of science is reported using categories rather than scale scores or performance levels.
• Met or Exceeded Expectations – represented by an up arrow
• Approached Expectations – represented by a bidirectional arrow
• Did Not Yet Meet Expectations – represented by a down arrow
State, district, and school dimension of science performance shown in the first three rows is reported by the percentage (both graphically and numerically) of students who did not yet meet, approached, or met/exceeded expectations. The numerical values appearing below the graph indicate the percentage of students performing at the Did Not Yet Meet Expectations, Approached Expectations, and Met or Exceeded Expectations levels from left to right, respectively. Due to rounding, percentages may not total 100%.
Note: In most cases, numbers will NOT appear centered under each color.
H. Description of Dimension of Science Performance Indicator GraphicsStudent performance for each dimension of science is marked with a dimension of science performance indicator.
• An up arrow for the specified dimension of science indicates that the student “Met or Exceeded Expectations.” Students in this category are likely academically well prepared to engage successfully in further studies in the dimension of science content area and may need instructional enrichment.
• A bidirectional arrow for the specified dimension of science indicates that the student “Approached Expectations.” Students in this category likely need academic support to engage successfully in further studies in the dimension of science content area.
• A down arrow for the specified dimension of science indicates that the student “Did Not Yet Meet Expectations.” Students in this category are likely not academically well prepared to engage successfully in further studies in the dimension of science content area. Such students likely need instructional interventions to increase achievement in the dimension of science content area.

SPRING 2019 MISA SCORE REPORT INTERPRETATION GUIDE18
4.7 Sample District Summary of Schools Report
4.8 Description of District Summary of Schools ReportA. Identification InformationThe District Summary of Schools Report lists the grade band/course, district name, and state.
B. Assessment InformationThe report heading provides the content area assessed, grade band/course, and assessment year.
C. Number of StudentsThe first two rows in this column contain the number of students included in reporting at the state and district levels. Subsequent rows contain the number of students included in reporting at each school within the district.
D. Percentage of Students at Each Performance LevelThe first column of the report shows the distribution of students achieving each performance level— indicated both graphically and numerically. Each colored section of the graph represents a performance level, beginning with Level 2 on the left through Level 5 on the right. The numerical values appearing below the graph indicate the percentage of students in Performance Levels 2 through 5, left to right respectively. Due to rounding, percentages may not total 100%. The name of the school is listed in each row above the graph.
Note: In most cases, numbers will NOT appear centered under each color.
SPRING 2019 MISA SCORE REPORT INTERPRETATION GUIDE 19
E. Description of Performance Level GraphicsThis graphic provides a colored illustration of the four performance levels and distinguishes the percentage of students in each performance level.
F. Average Overall Scale ScoreThis column of the report provides the average overall scale score (refer to Section 4.2) for all students assessed at the school for the specified assessment on the report. The first two rows contain state and district averages.
G. Dimensions of Science Reporting CategoriesThe report shows student performance for the three dimensions of science: Disciplinary Core Ideas (DCI), Science and Engineering Practices (SEP), and Crosscutting Concepts (CCC). In addition, there are three subcategories in the DCI dimension: Physical Science, Life Science, and Earth and Space Sciences.
H. Dimensions of Science Performance IndicatorsA student’s performance indicator in a dimension of science represents how well the student performed in that dimension. As with overall and reporting category scores, a measure of student proficiency for each dimension is estimated on a common, underlying measurement scale.
Performance in the dimensions of science is reported using categories rather than scale scores or performance levels.
• Met or Exceeded Expectations – represented by an up arrow
• Approached Expectations – represented by a bidirectional arrow
• Did Not Yet Meet Expectations – represented by a down arrow
On District Summary of Schools Reports, dimension of science performance for the state, district, and schools is reported by the percentage (both graphically and numerically) of students who did not yet meet, approached, or met/exceeded expectations. The numerical values appearing below the graph indicate the percentage of students performing at the Did Not Yet Meet Expectations, Approached Expectations, and Met or Exceeded Expectations levels from left to right, respectively. Due to rounding, percentages may not total 100%.
Note: In most cases, numbers will NOT appear centered under each color.
I. Description of Dimensions of Science Performance Indicator GraphicsStudent performance for each subcategory is illustrated with an explanatory icon. For District Summary of Schools Reports, only the colors of the icons are used in the graphical representation under each dimension of science.
• The green section (right section) of the graph for the specified dimension indicates that the student “Met or Exceeded Expectations.” Students in this category are likely academically well prepared to engage successfully in further studies in the dimension of science content area and may need instructional enrichment.
• The blue section (middle section) of the graph for the specified dimension of science indicates that the student “Approached Expectations.” Students in this category likely need academic support to engage successfully in further studies in the dimension of science content area.
• The red section (left section) of the graph for the specified dimension of science indicates that the student “Did Not Yet Meet Expectations.” Students in this category are likely not academically well prepared to engage successfully in further studies in the dimension of science content area. Such students likely need instructional interventions to increase achievement in the dimension of science content area.

SPRING 2019 MISA SCORE REPORT INTERPRETATION GUIDE20
5.0 Understanding the MISA Performance Level Summary Reports, State Summary Report, and School Evidence Statement Analysis Report5.1 BackgroundDuring the Spring 2019 administration, additional reports were created to provide more in-depth analysis of items as they relate to both the alignment to MISA Evidence Statements and the Next Generation Science Standards (NGSS).
5.2 Confidentiality of Reporting ResultsThe reports covered in Section 5.0 are for use at a state, district, and school level and are not intended for public distribution.
5.3 Accessing the ReportsThe Performance Level Summary reports, State Summary of Districts, and the School Evidence Statement Analysis can be accessed through PearsonAccessnext Published Reports. Once signed in to PearsonAccessnext, you must be in the MISA Spring 2019 administration. Under the “Reports” drop-down menu, choose “Published Reports.” It is helpful to type “Performance”, “State Summary”, or “Evidence” under the “Find Reports” search to filter for these reports.
5.4 Understanding the School Performance Level Summary
5.4.1 General OverviewThe Performance Level Summary reports are provided at a State, District, and School Level. This report breaks out the performance aggregations into subcategory levels.

SPRING 2019 MISA SCORE REPORT INTERPRETATION GUIDE 21
5.4.2 Sample School Performance Level Summary
5.4.3 Description of MISA School Performance Level Summary
A. Identification InformationThe report identifies the district and school name.
B. Content Area and Grade Band/CourseThe content area of the report, the grade band/course of the assessment, and the administration year are identified.
C. Demographic and Program Categories and Student GroupsDemographic and program categories with student groups are listed on the left side of the table. Results for students for whom no demographic or program information was coded are included in the “not indicated” student group.
D. Number of Valid ScoresThe number of valid scores includes only students with a valid score. Student with no score are not included.
E. Average Scale ScoreThe average scale score is displayed for the state and district as well as each demographic or program student group. On school level reports, the average scale score for the school is also included. The average does not include students with no scores.

SPRING 2019 MISA SCORE REPORT INTERPRETATION GUIDE22
F. Performance Level ResultsThe number and percentage of students who performed at the Partially Met Expectations, Approached Expectations, Met Expectations, and Exceeded Expectations, as well as aggregated to Met or Exceeded Expectations performance levels, are displayed for each demographic or program student group.
5.5 Understanding the MISA State Summary of Districts Report
5.5.1 General OverviewThe State Summary of Districts Report shows performance levels for all districts within the state. The report also shows the performance aggregations by overall scale score and by the three dimensions of science.
5.5.2 Sample State Summary of Districts Report
5.5.3 Description of MISA State Summary of Districts Report
A. Identification InformationThe report identifies the grade band/course, state, and administration.
B. Content Area and Grade Band/CourseThe content area of the report, the grade band/course of the assessment, and the administration year are identified.

SPRING 2019 MISA SCORE REPORT INTERPRETATION GUIDE 23
C. Performance Level ResultsThe proportion of students who performed at the Partially Met Expectations, Approached Expectations, Met Expectations, and Exceeded Expectations levels is displayed for each district.
D. Description of Performance Level GraphicThis graphic provides a colored illustration of the four performance levels and helps to quickly show the performance level for each overall scale score.
E. Number of StudentsThe report shows the number of students assessed in each district for the administration reported.
F. Average Scale ScoreThe average scale score for each district is displayed.
G. Dimensions of Science Reporting Categories The report shows aggregated student performance for the three dimensions of science: Disciplinary Core Ideas (DCI), Science and Engineering Practices (SEP), and Crosscutting Concepts (CCC). In addition, there are three subcategories in the DCI dimension: Physical Science, Life Science, and Earth and Space Sciences.
H. Dimensions of Science Performance IndicatorsA student’s performance indicator in a dimension of science represents how well the student performed in that dimension. As with overall and reporting category scores, a measure of student proficiency for each dimension is estimated on a common, underlying measurement scale.
Performance in the dimensions of science is reported using categories rather than scale scores or performance levels.
• Met or Exceeded Expectations – represented by an up arrow
• Approached Expectations – represented by a bidirectional arrow
• Did Not Yet Meet Expectations – represented by a down arrow
On the State Summary of Districts Report, dimension of science performance for the state, district, and schools is reported by the percentage (both graphically and numerically) of students who did not yet meet, approached, or met/exceeded expectations. The numerical values appearing below the graph indicate the percentage of students performing at the Did Not Yet Meet Expectations, Approached Expectations, and Met or Exceeded Expectations levels from left to right, respectively. Due to rounding, percentages may not total 100%.
Note: In most cases, numbers will NOT appear centered under each color.
I. Description of Dimensions of Science Performance Indicator GraphicsStudent performance for each subcategory is illustrated with an explanatory icon. For the State Summary of Districts Report, only the colors of the icons are used in the graphical representation under each dimension of science.
• The green section (right section) of the graph for the specified dimension indicates that the student “Met or Exceeded Expectations.” Students in this category are likely academically well prepared to engage successfully in further studies in the dimension of science content area and may need instructional enrichment.
• The blue section (middle section) of the graph for the specified dimension of science indicates that the student “Approached Expectations.” Students in this category likely need academic support to engage successfully in further studies in the dimension of science content area.

SPRING 2019 MISA SCORE REPORT INTERPRETATION GUIDE24
• The red section (left section) of the graph for the specified dimension of science indicates that the student “Did Not Yet Meet Expectations.” Students in this category are likely not academically well prepared to engage successfully in further studies in the dimension of science content area. Such students likely need instructional interventions to increase achievement in the dimension of science content area.
5.6 Understanding the MISA School Evidence Statement Analysis Report
5.6.1 General OverviewThe MISA School Evidence Statement Analysis Report is a two-page report that analyzes the performance of the MISA evidence statements at a state, district, and school level for each evidence statement represented by items on the Spring 2019 MISA assessment. Information is reported for each grade band/course in which science is assessed.
5.6.2 Sample School Evidence Statement Analysis Report – Page 1
5.6.3 Description of School Evidence Statement Analysis Report – Page 1Page 1 of the Evidence Statement Analysis Report shows the performance by evidence statement in graph form. The sample report in Section 5.6.2 shows an example of a Grade 5 report at a school level.
A. District and School InformationReports are provided at a school level but also provide the same evidence statement information about district and state levels.
B. Description of ReportThe content area assessed, grade band/course assessed, and assessment year is shown here.
SPRING 2019 MISA SCORE REPORT INTERPRETATION GUIDE 25
C. Students with Valid ScoresThe report presents the average percent correct by evidence statement for students who have MISA reportable summative scale scores in the Spring 2019 administration. Reportable scores are those records that have met attemptedness, are non-voided records, and are without suppression codes that have excluded students from aggregations.
D. GraphThe average percent correct by each cluster of items, combined at an evidence statement level is represented on the chart at a state level, district level, and school level. A legend is provided to show which lines represent each level shown. State symbols are connected with a solid line. District and school symbols are not connected. District and school symbols are not connected because, depending on the form assignment selection taken at the school and district, all evidence statements may not be represented. If an evidence statement is not represented at a school or district level, there will not be a symbol on the chart for that evidence statement listed. If a symbol is on the chart at zero percent, this indicates that evidence statement group had 0% achieved out of the maximum points possible for that school or district.
E. Evidence Statement and Difficulty OrderMISA items are written to MISA Evidence Statements, which are based on the Next Generation Science Standards. Each operational item on the assessment is combined into an evidence statement group. These items are aligned on the report in every evidence statement group that applies to that item. This means one item could be represented on the report multiple times depending on its alignment.
The evidence statements are placed in order on the graph from most to least difficult. This difficulty order is determined by the performance level of items based on the State level. Evidence statements where the State average points achieved versus the maximum points possible was lower are considered more difficult.
F. LegendThe legend for this graph provides a symbol for State, District, and School values.

SPRING 2019 MISA SCORE REPORT INTERPRETATION GUIDE26
5.6.4 Sample School Evidence Statement Analysis Report – Page 2
This report is NOT for public review. Distribution within your school/district must be in accordance with state and federal privacy laws, and local school board policy.
NGSS website: https://nextgenscience.orgEvidence Statements: https://nextgenscience.org/evidence-statements
Maryland Science Standards: http://mdk12.msde.maryland.gov/instruction/curriculum/science/index.html
Page 2 06062019-Z9999999-30-2002 - 0000002
CONFIDENTIAL - DO NOT DISTRIBUTE
This report shows the operational Evidence Statements for the given grade and subject sorted by difficulty.
School Evidence Statement Analysis Grade 5
SAMPLE SCHOOL NAME
SAMPLE DISTRICT NAME
MARYLAND
SPRING 2019
SCIENCEGrade 5 Assessment, 2018-2019
DifficultyOrder NGS Standard Evidence Dimensions SchoolMost toLeast
Performance Statement Science and Engineering Practices (SEP)or Crosscutting Concepts (CCC)
Disciplinary Core Ideas (DCI) StudentCount
1 5-ESS1, 5-ESS1-1 5-ESS1-1.4.a.iv SEP Earth and Space Science 02 4-PS4, 4-PS4-3 4-PS4-3.2.b.i SEP Physical Science 03 3-LS1, 3-LS1-1 3-LS1-1.3.b SEP Life Science 314 3-LS2, 3-LS2-1 3-LS2-1.2.a.ii.2 SEP Life Science 315 4-LS1, 4-LS1-2 4-LS1-2.3.a.i CCC Life Science 316 5-ESS2, 5-ESS2-1 5-ESS2-1.2.a CCC Earth and Space Science 317 4-LS1, 4-LS1-2 4-LS1-2.1.a.ii CCC Life Science 318 4-PS4, 4-PS4-3 4-PS4-3.1.a.i SEP Physical Science 09 3-LS4, 3-LS4-2 3-LS4-2.1.a CCC Life Science 3110 3-LS4, 3-LS4-1 3-LS4-1.1.a.iii SEP Life Science 011 3-LS4, 3-LS4-4 3-LS4-4.2.a.iii SEP Life Science 012 4-ESS1, 4-ESS1-1 4-ESS1-1.2.a.ii SEP Life Science 013 5-ESS2, 5-ESS2-1 5-ESS2-1.3.a.i CCC Earth and Space Science 3114 3-LS4, 3-LS4-2 3-LS4-2.2.a.ii SEP Life Science 3115 3-LS4, 3-LS4-3 3-LS4-3.3.a.iii SEP Life Science 016 3-LS2, 3-LS2-1 3-LS2-1.1.a SEP Life Science 3117 3-LS4, 3-LS4-3 3-LS4-3.3.a.i SEP Life Science 018 3-LS4, 3-LS4-3 3-LS4-3.1.a SEP Life Science 3119 3-LS1, 3-LS1-1 3-LS1-1.2.a.ii CCC Life Science 3120 5-PS1, 5-PS1-4 5-PS1-4.1.b CCC Physical Science 3121 5-PS1, 5-PS1-4 5-PS1-4.3.a.i SEP Physical Science 3122 3-LS3, 3-LS3-1 3-LS3-1.2.a.i SEP Life Science 3123 5-ESS1, 5-ESS1-1 5-ESS1-1.3.a SEP Earth and Space Science 024 3-LS1, 3-LS1-1 3-LS1-1.2.a.iii CCC Life Science 3125 3-LS3, 3-LS3-1 3-LS3-1.3.a SEP Life Science 3126 3-LS4, 3-LS4-2 3-LS4-2.1.b CCC Life Science 3127 5-ESS2, 5-ESS2-2 5-ESS2-2.2.a.ii CCC Earth and Space Science 3128 3-LS4, 3-LS4-3 3-LS4-3.2.a.iii SEP Life Science 3129 3-LS4, 3-LS4-1 3-LS4-1.2.a.v SEP Life Science 030 3-LS4, 3-LS4-3 3-LS4-3.3.a.ii SEP Life Science 031 3-PS2, 3-PS2-2 3-PS2-2.1.b CCC Physical Science 032 3-LS2, 3-LS2-1 3-LS2-1.2.a.ii.1 SEP Life Science 033 3-PS2, 3-PS2-1 3-PS2-1.2.a.ii SEP Physical Science 034 3-PS2, 3-PS2-3 3-PS2-3.1.a.ii CCC Physical Science 3135 3-LS4, 3-LS4-4 3-LS4-4.3.a.i.2 SEP Life Science 036 3-LS4, 3-LS4-3 3-LS4-3.2.a.ii SEP Life Science 3137 5-ESS2, 5-ESS2-2 5-ESS2-2.1.a.i CCC Earth and Space Science 3138 4-ESS3, 4-ESS3-1 4-ESS3-1.2.a.i SEP Earth and Space Science 3139 5-PS1, 5-PS1-1 5-PS1-1.3.a CCC Physical Science 040 3-PS2, 3-PS2-1 3-PS2-1.3.a.iv SEP Physical Science 0
continued
A B DC
E

SPRING 2019 MISA SCORE REPORT INTERPRETATION GUIDE 27
5.6.5 Description of School Evidence Statement Analysis Report – Page 2Page 2 of the MISA School Evidence Statement Analysis Report links the MISA Evidence Statement to the Next Generation Science Standards upon which they are based.
A. Next Generation Science Standards (NGSS)The Next Generation Science Standard(s) linked to the MISA Evidence Statement is listed in the second column. An evidence statement could be connected to multiple standards.
B. MISA Evidence StatementEvidence Statements are listed in the same order as on the page 1 graph, from most to least difficult.
C. Dimensions of ScienceThe NGSS dimensions of science are paired in this column with the standard and evidence statement associated with the dimension.
D. Student CountThe student count represents the number of students whose form of the assessment contained an item or items written to the evidence statement listed in column B. The count may differ by row as there are different forms of the assessment and not all forms include all items or evidence statements.
E. Additional InformationLinks to more detailed information on the MISA Evidence Statements, the NGSS website, and the Maryland Science Standards are provided at the bottom of the report.

SPRING 2019 MISA SCORE REPORT INTERPRETATION GUIDE28

SPRING 2019 MISA SCORE REPORT INTERPRETATION GUIDE 29
Appendix A Scale Score Ranges

SPRING 2019 MISA SCORE REPORT INTERPRETATION GUIDE30
Grade 5 Science
Level 2 Cut 650 Level 2 Range 650–728
Level 3 Cut 729 Level 3 Range 729–749
Level 4 Cut 750 Level 4 Range 750–771
Level 5 Cut 772 Level 5 Range 772–850
Grade 8 Science
Level 2 Cut 650 Level 2 Range 650–725
Level 3 Cut 726 Level 3 Range 726–749
Level 4 Cut 750 Level 4 Range 750–772
Level 5 Cut 773 Level 5 Range 773–850
SPRING 2019 MISA SCORE REPORT INTERPRETATION GUIDE 31
Appendix B Performance Level Descriptors
SPRING 2019 MISA SCORE REPORT INTERPRETATION GUIDE32
Performance Level Descriptors
Grades 5 and 8 SciencePerformance Level Descriptors (PLDs) for grade 5 science and grade 8 science are available on the following websites:
Maryland Public Schools:
http://www.marylandpublicschools.org/about/Pages/DCAA/Science/index.aspx
Maryland Integrated Science Assessment:
http://mdk12.msde.maryland.gov/assessments/k_8/index_b.html
Maryland Report Card website:
http://reportcard.msde.maryland.gov/

SPRING 2019 MISA SCORE REPORT INTERPRETATION GUIDE 33

MD1118881 1 2 3 4 5 A B C D E Printed in the USA ISD21106