maricopa county attorney’s office report on the scope … and...the scope and nature of the gang...
TRANSCRIPT

october 2012
Maricopa County Attorney’s Office Report on
the scope and nature of the gang problem among the arrestee population

Acknowledgements The AARIN Project staff thanks Peter Ozanne and Amy Rex for their establishment of the AARIN project and for all of their hard work and assistance on the project. We also thank the Maricopa County Manager and the Board of Supervisors for their continued support for AARIN. Additionally, we would like to thank the officers and command staff of the Maricopa County Sheriff’s Office, without whose cooperation, we would not be able to conduct the project.
This project was funded by Maricopa County. Opinions contained herein are those of the author and do not represent the position of either Maricopa County or Arizona State University.
AARIN Project Staff
Charles M. Katz, Principal Investigator Watts Family Director
Center for Violence Prevention &Community Safety Arizona State University
David E. Choate, Co-Principal Investigator
Associate Director of Operations Center for Violence Prevention & Community Safety
Arizona State University
Marisol Cortez
AARIN Project Manager Center for Violence Prevention & Community Safety
Arizona State University
Michael D. White, Co-Principal Investigator Associate Professor
School of Criminology and Criminal Justice Arizona State University
Lidia Nuño, Research Analyst
AARIN Project Manager Center for Violence Prevention & Community Safety
Arizona State University
Jody Arganbright Business Operations Manager
Center for Violence Prevention & Community Safety Arizona State University
In an effort to reduce our impact on the environment, we have chosen to distribute this report as a digital file.
© 2012 by the Arizona Board of Regents for and on behalf of Arizona State University and its Center for Violence Prevention and Community Safety. This document may be copied and transmitted freely. No deletions, additions, or alterations of contents are permitted without the expressed written consent of the Center for Violence Prevention and Community Safety.
Center for Violence Prevention and Community Safety 500 N. 3rd Street, NHI-1, Suite 200 Phoenix, AZ 85069-7100
(602) 496-1470 Web site: http://cvpcs.asu.edu

Arizona Arrestee Reporting Information Network 2012 Maricopa County Attorney’s Office Report: Understanding the Scope and Nature of the Gang Problem in Maricopa County, Arizona
By
Lidia E. Nuño, M.S. Charles M. Katz, Ph.D.
September 2012
Suggested citation:
Nuño, L. E. and Katz, C. M. (2012). Arizona Arrestee Reporting Information Network: 2012 Maricopa County
Attorney’s Office Report: Understanding the Scope and Nature of the Gang Problem in Maricopa County. Phoenix,
AZ: Center for Violence Prevention & Community Safety, Arizona State University.

Center for Violence Prevention and Community Safety 1
AARIN Program Overview The Arizona Arrestee Reporting Information Network (AARIN) is a monitoring system that provides on-going descriptive information about drug use, crime, victimization, and other characteristics of interest among individuals arrested in Maricopa County, Arizona. Funded by the Maricopa County Board of Supervisors beginning in 2007, AARIN is modeled after the former National Institute of Justice (NIJ) national-level Arrestee Drug Abuse Monitoring Program (ADAM). In three facilities throughout the county, professionally trained interviewers conduct voluntary and confidential interviews with recently booked adult arrestees and juvenile detainees. Questions focus on a range of topics including education, employment and other demographics, patterns of drug use (lifetime and recent), substance abuse and dependence risk, criminal activity, gang affiliation, victimization, mental health, interactions with police, public health concerns, incarceration and probation, citizenship, and treatment experiences. Each interviewee also provides a urine specimen that is tested for the presence of alcohol and/or drugs. Arrestees who have been in custody longer than 48 hours are ineligible for participation in AARIN, due to the 72-hour time limitation for valid testing of urine specimen.
The instruments used and the reporting mechanism underwent a substantial revision in 2011. While maintaining all of the data elements from the previous core set of questions, the baseline interview expanded by more than 60%. Additionally, with the change in the core questionnaire, the project shifted its reporting strategy to focus reports to each of six key Maricopa County criminal justice agencies: Maricopa County Manager’s Office, Maricopa County Sheriff’s Office, Maricopa County Attorney’s Office, the Office of the Public Defender, Adult Probation Department, and the Juvenile Probation Department.
Overall, AARIN serves as a near-real time information source on the extent and nature of drug abuse and related activity in Maricopa County, AZ. This information helps to inform policy and practice among police, courts and correctional agencies to increase public safety and address the needs of individuals who find themselves in the criminal justice system.
For information using the most recent set of data, please see the following reports:
Maricopa County Manager’s Office – Report detailing substance abuse and public health concerns among the Maricopa County arrestee population.
Maricopa County Sheriff’s Office – Reports broad characteristics of the entire AARIN sample and a detailed comparison of arrestees’ perception of police in general, and use of force by and against police, by arresting agency.
Maricopa County Attorney’s Office – Detailed report covering street gangs using key core questionnaire elements and a comprehensive interpretation of the Gang Addendum.
Office of the Public Defender – Report comparing arrestees who are at-risk for a mental health problem, substance abuse/dependence problem, a co-occurring disorder (both substance abuse/dependence and mental health), or not at risk.

Arizona State University – College of Public Programs 2
Adult Probation Department – Comprehensive summary of the core questionnaire comparing Maricopa County probationers to probationers from elsewhere and those arrestees who have not served probation.
Juvenile Probation Department - Comprehensive summary of the core juvenile questionnaire comparing Maricopa County juvenile probationers to those who have served probation elsewhere and those detainees who have not served probation.
For other reports and more information about the project, visit the AARIN page of the Center for Violence Prevention & Community Safety’s website: http://cvpcs.asu.edu/ .
Methodology: Sampling and Data Collection In order to ensure representative results for the entire population of arrestees in Maricopa County, the AARIN project employs a systematic sampling protocol that includes the collection of data with target quotas each day. Data are collected during three cycles each calendar year – with interviews conducted during a continuous two-week period at the Central Intake of Maricopa County’s Fourth Avenue Jail each collection cycle. Dispersing data collection cycles across three different four-month blocks helps control for possible seasonal variations in crime and arrest patterns, and conducting collections covering all seven days of the week account for possible differences between weekdays and weekends, or other day-to-day variations. The periodic data collection cycles combined with the sampling protocols ensures a representative sample of all Maricopa County arrestees. The same procedures employed by AARIN were tested under ADAM (Maricopa County was one of the sites used in the evaluation) comparing the selected sample to comprehensive jail census data to assess the representativeness of the sample to the population on key characteristics. The National Opinion Research Center at the University of Chicago was the national data manager for ADAM at the time and concluded that the periodic data collection cycles, sampling protocols and daily quotas would result in a scientifically representative sample of study participants that could be generalized to the whole of arrestees for the particular jurisdiction (i.e. Maricopa County arrestees).
Daily collection quotas call for 23 males and 7 females to be interviewed, including the completion of the core instrument, any and all addenda, and to provide a urine specimen. Potential participants are selected using a standardized procedure (described below) to ensure both a sufficiently randomized and representative sample of arrestees. Some of the potential participants are either unavailable or otherwise ineligible for participation. Most commonly this applies to those arrestees who have already been released from custody or transferred to another facility, but also includes those whose behavior constitutes a safety risk to the jail and/or interview staff. Upon initial contact, arrestees are read an informed consent script (see inset), to which they voluntarily either decline or agree to participate; typically more than 90% agree to participate.
Consent Script: Hello, my name is __. I am working on a research project run by Arizona State University. The purpose of the project is to understand issues and problems confronted by people and to help give advice on how to provide services to individuals who have been arrested. I would like to ask you a series of questions that will take 15-45 minutes to answer. There are no foreseeable risks for participating in this research, and there are no benefits to you individually. Jail personnel will not have access to the information that you provide us. The information you provide is confidential and anonymous, and it will not help or hurt your case. If, for any

Center for Violence Prevention and Community Safety 3
reason, you become distressed or anxious during the interview, you can request to speak with the facility’s medical personnel or psychological counselors. I will not write down your name or any other identifying information the questionnaire. You can refuse to answer any question, and you may stop the interview at any time for any reason. At the end of the interview I will ask you to provide a urine sample. If you listen to my questions, I will give you a candy bar. Do you have any questions?
During the data collection period, interviews are conducted during an eight-hour period each day, with arrestees who are randomly selected based on their booking time that yields a stratified random sample. Consistent with the ADAM sampling strategy, a stock (i.e., arrested and booked during non-data collection hours) and flow (i.e., during data collection hours) process is employed to ensure a representative sample of arrestees across any given 24-hour period. The stock sample is selected by starting with a list of all bookings processed from the 16-hours that range from when collection ended the previous day through the start-time of the current collection day. Eligible bookings are counted and divided by ten, which gives the selection interval. A random start-point is selected, and each nth (e.g. the value equal to the selection interval) arrestee is selected as a potential participant. A “nearest-neighbor” procedure is used to replace members of the stock list that are either found to be ineligible or unavailable, or whom decline to participate, until the daily quota of 10 completed and provided interviews is met. The flow sample is more straight-forward. Potential participants are randomly selected as they are booked into the facility as needed. A minimum of 13 completed and provided interviews are expected to meet daily quota.
Survey Instrument The core AARIN survey instrument is modeled after the ADAM and Drug Use Forecasting (DUF) instruments, and was developed with input from Maricopa County officials. Starting with the third collection cycle of 2011, AARIN began using a new core instrument. The new instrument included the same elements of the previous version, but expanded by more than 60% following extensive input from Maricopa County officials representing six key agencies related to the criminal justice system and the arrestee population – the County Manager’s Office, Sheriff’s Office, County Attorney, Public Defender, Adult Probation, and Juvenile Probation.
The instrument is broken down into a variety of sections that include: demographics and background information (sex, race/ethnicity, age, citizenship, educational level, methods of income), current and past drug use (ever, past 12 months, 30 days and three days), drug dependency and treatment, medical marijuana and marijuana acquisition, criminal history (ever, past 12 months), gang involvement, firearms possession, victimization (past 12 months, 30 days), police interactions, mental health issues (ever and past 12 months), correctional health services and public health concerns, and incarceration and probation history (ever and past 12 months). Additionally, the AARIN platform includes addenda instruments to the core set of questions. Addenda are used to collect more detailed information regarding a particular topic and/or population. Recently, both a police contact and gang addenda were used, collecting information from arrestees about police in general, use of force by and against the police (Police Contact Addendum), reasons and methods for joining and leaving a gang, gang organizational structure and criminal activities, and the respondents’ perceptions of cohesion and connectedness to their gang (Gang Addendum).

Arizona State University – College of Public Programs 4
Urinalysis Testing Once an interview is completed, the arrestee then submits a urine sample. The urine specimens are tested for alcohol and four illicit drugs: cocaine, marijuana, methamphetamine, and opiates. The testing is done using the enzyme-multiplied immunoassay technique (EMIT), which has shown a high degree of accuracy with very few false-positive results (Reardon, 1993). As a reliability check, all specimens that test positive with the EMIT methods are then tested again using Gas Chromatography with Mass Spectrum Detection (GC/MS). The EMIT technique with GC/MS confirmation procedures are well-established and offer highly reliable results for the illicit drugs under study here – cocaine, marijuana, methamphetamine, and opiates – for up to 72 hours after use. Unfortunately, these procedures offer high reliability results for alcohol for only 12-24 hours after use. The adoption of more sensitive alcohol screening procedures was cost-prohibitive, however.

5
Maricopa County Attorney’s Office Report
Over the past several years, Arizona policymakers have debated a number of gang-related
policies. These discussions have ranged from arguments over the wisdom of granting authority
to local and state law enforcement agencies to collect, maintain, and disseminate gang related
intelligence to enacting legislation on sentencing enhancements for gang related offenses. The
belief that gang members are responsible for a disproportionate amount of crime and violence
in the state is at the root of many of these policy discussions. Unfortunately, there is little
available information about gangs, gang members, and gang crime in Maricopa County in
general and even less information about adult gangs, gang members, and gang crime in
Maricopa County.
The purpose of this report is to use data from a sample of recently booked arrestees in
Maricopa County to examine the scope and nature of Maricopa County’s gang problem. In
particular, this report supplements data presented in the bi-annual report on gangs conducted
by the Arizona Criminal Justice Commission, which relies on official police data and their
occasional white paper on gangs that relies on self-report data from school youth. We
organized our analyses around six research questions: (1) what proportion of adult arrestees
are involved in a gang, and what are the socio-demographic differences between those who are
associated with a gang and those who are not; (2) what are the rituals associated with gang
joining; (3) how do gang and non-gang arrestees differ in their experiences with crime, drug use
and victimization; (4) what is the organizational structure and composition of gangs; (5) how do
members socially identify with their gang; and (6) how and why do members leave their gang?
What proportion of adult arrestees are involved in a gang, and
what are the socio-demographic differences between those who
are associated with a gang and those who are not? Analysis of the data obtained from a sample of recently booked adult arrestees in Maricopa
County, Arizona indicated that about 10 percent of adult arrestees were currently associated
with a gang. Specifically, as presented in Exhibit 1, 5.2 percent were gang associates, 5.1
percent were current gang members, and 7 percent were former members of a gang. About 83
percent of arrestees reported that they had never been associated with a gang. The distribution
of arrestees by gang status is presented in Exhibit 1.

6
Exhibit 2 provides descriptive characteristics for the sample and compares them by gang status.
Males accounted for 73.1 percent of non-gang members, 83.1 percent of gang associates, 87.3
percent of current gang members, and 93.1 percent of former gang members. On average, non-
gang members were significantly older (32.9 years old), followed by former gang members
(31.36 years old) and gang associates (26.34 years old). Current gang members were
significantly younger, averaging 26.17 years old.
There were significant differences in ethnic composition between groups. About 40.5 percent
of non-gang members were Caucasian, 13.7 percent were African American, 29.5 percent were
Hispanic, and 16.4 percent reported being from an “other” ethnic background. The majority of
82.7
5.2 5.1 7.0
0
10
20
30
40
50
60
70
80
90
100
Non-Gang Member
Gang Associate Current Gang Member
Former Gang Member
Pe
rce
nta
ge
Exhibit 1. Gang membership among the AARIN sample (N=1,269)
Research Definition of Gang Member
In the current study, gang membership was measured by asking the
participants whether they were currently a member of a gang. If
the participant responded “no” to this question, they were then
asked whether they were a former gang member or friend of a
gang member. Participants who reported that at least half of their
friends were current gang members were included in the analysis
as a gang associate.

7
gang associates reported being Hispanic (35.4 percent), 21.5 percent reported being African
American, 13.8 percent were Caucasian, and 29.2 were from an “other” ethnic background.
Current gang members were largely Hispanic (52.4 percent), 11.1 percent were African
American, and 6.3 percent were Caucasian. Close to a third (30.2 percent) of current gang
members indicated being from an “other” ethnic group. Similar to gang associates and current
gang members, former gang members were most likely to be Hispanic (44.8 percent). About
20.7 percent were African American, 16.1 percent were Caucasian, and 18.4 percent were from
an “other” ethnic background.
The analysis indicated significant differences in educational status across groups, with gang
members being significantly less likely to have graduated high school. For example, while about
55 percent of current gang members reported not graduating high school (or receiving their
GED) 43 to 44 percent of gang associates and former gang members reported not graduating,
and only about 30 percent of non-gang members reported not graduating high school.

8
Exhibit 2: Demographic characteristics by gang status (N=1,269)
Non-Gang Member Associate Current Former
% N % N % N % N
Gender*
Male 73.1 750 83.1 54 87.3 55 93.1 81
Female 26.9 276 16.9 11 12.7 8 6.9 6
Race/Ethnicity*
Caucasian 40.5 415 13.8 9 6.3 4 16.1 14
African American 13.7 140 21.5 14 11.1 7 20.7 18
Hispanic 29.5 302 35.4 23 52.4 33 44.8 39
Other 16.4 168 29.2 19 30.2 19 18.4 16
Legal Status
U.S. Citizen 89.6 913 98.5 64 96.8 61 95.3 82
Illegal Immigrant 7.7 78 1.5 1 3.2 2 4.7 4
Legal Immigrant 2.7 28 0.0 0 0.0 0 0.0 0
Education*
Less than High School 29.6 301 43.1 28 54.8 34 44.0 37
HS Graduate or GED 34.6 352 29.2 19 29.0 18 35.7 30
Some College 35.9 365 27.7 18 16.1 10 20.2 17
Source of Income (Past 30 Days)*
Working Full Time 34.3 338 19.7 12 23.7 14 35.7 30
Working Part Time 17.1 168 13.1 8 15.3 9 15.5 13
Other Legal Sources 30.0 295 27.9 17 22.0 13 29.8 25
Illegal Sources 8.5 84 32.8 20 30.5 18 16.7 14
No Income 10.1 99 6.6 4 8.5 5 2.4 2
Age* Mean = 32.90
Mean = 26.34
Mean = 26.17
Mean = 31.36
* p<.05
Analysis of the data also indicated gang status was significantly related to source of income.
Former gang members were significantly more likely to report working full-time in the past 30
days (35.7 percent), followed by non-gang members (34.3 percent), current gang members
(23.7 percent), and gang associates (19.7 percent). Thirty percent of non-gang members
reported that they obtained income from other legal sources in the past 30 days, compared to

9
27.9 percent of gang associates, 22 percent of current gang members, and 29.8 percent of
former gang members. Those associated with a gang were significantly more likely to self-
report receiving illegal income in the past 30 days compared to non-gang members.
Specifically, 32.8 percent of gang associates, 30.5 percent of current gang members, and 16.7 of
former gang members reported income from an illegal source in the past 30 days, compared to
8.5 percent of non-gang members. Last, 10.1 percent of non-gang members, 6.6 percent of
gang associates, 8.5 percent of current gang members, and 2.4 percent of former gang
members reported no income in the past 30 days.
Our analysis showed that few gang members reported being an illegal immigrant. While 7.7
percent of non gang members reported being an illegal immigrant, only 3.2 percent of current
gang members reported being an illegal immigrant.
Study Methodology
The present study used data collected as part of the Arizona Arrestee Reporting
Information Network (AARIN). Maricopa County established AARIN in January 2007 to
monitor drug use trends, treatment needs, and at-risk behavior among recently booked
arrestees in Maricopa County, Arizona. For six weeks per year, trained local staff
conducted voluntary and anonymous interviews with adults and juveniles who had been
arrested within the past 48 hours.
The primary instrument generated self-report data on a variety of socio-demographic and
behavior variable. At the beginning of the survey, arrestees reported age, ethnicity, and
educational background, and the interviewer recorded gender, which was obtained from
official booking data. Arrestees then answered a series of questions about their drug use
history, treatment needs, mental health history, criminal history, prior experiences with
victimization, and immigration status. At the end of the interview, charge data were
collected from official processing records, and each arrestee was asked to provide a urine
sample to be analyzed for four different drugs and alcohol.
Analysis for this report relied on our adult sample. The interviews were conducted in 2011 and 2012. Researchers originally contacted 1,808 adult arrestees; about 90 percent agreed to be interviewed. Of those interviewed, 93.4 percent agreed to provide a urine sample. For more information about the AARIN program or prior peer reviewed research on gang, gang crime and the response to gangs in the Phoenix metropolitan area see: Decker et al., 2008; Katz et al. 1997; 2000; 2003; 2005; 2011a, 2011b; 2011c; Katz and Schnebly, 2011; Katz and Webb, 2006; Webb et al., 2006; Rodriguez et al., 2005.

10
What are the rituals associated with gang joining? Respondents also were asked to report the way in which they joined their gang. The rituals are
listed in Exhibit 3. Gang status was not significantly related to the way in which the respondent
joined the gang. About two-thirds of gang members reported that they were jumped or beaten
in to their gangs. About 13 to14 percent of gang members reported that they got into a fight or
shot someone to join their gang and another 7 to 9 percent committed a crime to join their
gang. About 22 to 31 percent of gang members reported that they were born into the gang or
had to do nothing to join the gang. Very few gang members reported that they killed someone
or were sexed in.
Exhibit 3: Rituals associated with gang joining by gang status (N=215)
Current Former
% N % N
What did you do to join the gang?
Jumped in or beaten up 60.3 35 65.8 52
Fight or shoot someone 13.8 8 12.7 10
Kill someone 1.7 1 1.3 1
Commit a crime 8.6 5 7.6 6
Get sexed in 0.0 0 1.3 1
Born into it 19.0 11 13.9 11
Nothing 12.1 7 8.9 7
Other 6.9 4 6.3 5
* p<.05
How do gang and non-gang arrestees differ in their
experiences with crime, drug use, and victimization? Exhibit 4 provides information on the self-reported criminal involvement of arrestees in the
past 12 months by gang status. Although there were no significant differences in involvement in
identity theft by gang status, the analysis revealed significant differences in violent offenses,
property offenses, firearm offenses, drug use, and drug sales across groups. Current gang
members were significantly more likely to self-report committing a violent offense in the past
12 months (63.5 percent), followed by gang associates (52.3 percent), former gang members
(48.3 percent), and non-gang members (28.6 percent).
With respect to involvement in property crime, 46.2 percent of gang associates reported
committing a property offense in the past 12 months, followed by 38.1 percent of current gang
members, 28.7 percent of former gang members and 21.5 percent of non-gang members.

11
Exhibit 4: Prevalence of self-reported criminality in the past 12 months by gang status (N=1,269)
Non-Gang Member Associate Current Former
% N % N % N % N
Any Violent Offense* 28.6 293 52.3 34 63.5 40 48.3 42
Any Property Offense* 21.5 221 46.2 30 38.1 24 28.7 25
Any Drug Use* 64.7 664 84.6 55 88.9 56 79.3 69
Drug Sales* 10.7 110 18.5 12 34.9 22 25.3 22
Any Firearm Offense* 5.4 55 12.3 8 38.1 24 9.2 8
Identity Theft 1.9 19 6.2 4 4.8 3 1.1 1
* p<.05
Self-reported drug use was most prevalent among current gang members (88.9 percent). Gang
associates were almost as likely as current gang members to use any drug, with 84.6 percent of
them reporting any drug use in the past 12 months. About 79 percent of former gang members
and 64.7 percent of non-gang members reported any drug use in the past 12 months.
Similar to self-reported drug use, drug sales were also most prevalent among current gang
members, with 34.9 percent reporting to have sold drugs in the past 12 months. About a
quarter (25.3 percent) of former gang members, 18.5 percent of gang associates, and 10.7
percent of non-gang members also reported engaging in drug sales in the past 12 months.
Current gang members were the most likely to engage in firearm offenses, with 38.1 percent
reporting engaging in a firearm offense in the past 12 months. About 12.3 percent of gang
associates, 9.2 percent of former gang members, and 5.4 percent of non-gang members said
they committed a firearm offense.
Current gang members, former gang members, and gang associates also were asked questions
about illegal activity with the gang. As presented in Exhibit 5, the results of the analysis
indicated that gang status was not significantly related to any of the 11 different types of crime
committed by the respondents’ gangs. About three-quarters of gang members reported that
their gang engaged in graffiti, stealing, robbery, assault, intimidation and threats, drug use, and
drug selling; and generally more than half of respondents indicated that their gang engaged in
drive-by shootings, murder, and gun sales.

12
Exhibit 5. Types of crime committed by the gang by gang status (N=215)
Associate
Current
Former
% N
% N
% N
Do members of the gang ever: Draw graffiti 75.4 43
70.7 41
81.5 66
Steal 85.5 47
78.6 44
78.2 61 Intimidate or threaten
people 85.2 46
76.8 43
81.0 64
Rob 72.7 40
80.4 45
72.2 57
Jump or attack people 71.9 41
71.4 40
80.0 64
Do drive-by shootings 45.1 23
46.4 26
61.8 47
Kill people 47.5 19
56.9 29
66.7 50
Use any drug 96.6 57
89.8 53
94.0 78
Sell any drug 83.9 47
78.6 44
81.2 65
Sell drugs to drug dealers 76.9 40
63.6 35
61.5 48
Sell guns 63.8 30
60.0 33
54.5 42
* p<.05
Exhibit 6 presents our findings related to differences in drug use by gang status. We found that
gang status was significantly related to marijuana, powder cocaine, and crack cocaine use.
Current gang members (74.6 percent) and gang associates (73.8 percent) were more likely than
former gang members (63.2 percent) and non-gang members (51.2 percent) to self-report using
marijuana in the past 12 months. Similar patterns were observed when examining past 3 day
use and the results of urinalysis.

13
Exhibit 6. Self-report drug use by gang status (N=1,269)
Non-Gang Member
Associate
Current
Former
% N
% N
% N
% N
Marijuana Past 12 Months * 51.2 525
73.8 48
74.6 47
63.2 55
Past 3 Days * 28.9 297
46.2 30
54.0 34
43.7 38
Urinalysis * 31.9 326
50.0 32
59.7 37
43.7 38
Powder Cocaine Past 12 Months * 10.7 110
16.9 11
27.0 17
23.0 20
Past 3 Days * 2.7 28
6.2 4
7.9 5
6.9 6
Urinalysis * 8.9 91
10.9 7
21.0 13
11.5 10
Crack Cocaine Past 12 Months * 7.1 73
4.6 3
4.8 3
17.2 15
Past 3 Days 2.9 30
1.5 1
1.6 1
5.7 5
Heroin Past 12 Months 11.0 113
10.8 7
11.1 7
8.0 7
Past 3 Days 6.6 68
3.1 2
4.8 3
2.3 2
Urinalysis 12.1 124
6.2 4
9.7 6
4.6 4
Methamphetamine Past 12 Months 29.2 300
32.3 21
39.7 25
34.5 30
Past 3 Days 17.4 179
20.0 13
25.4 16
24.1 21
Urinalysis 30.9 315
25.0 16
38.7 24
41.4 36
* p<.05
Powder cocaine use also was prevalent and significantly related to gang status. Current gang
members were the most likely to self-report using powder cocaine in the past 12 months,
followed by former gang members (23 percent), gang associates (16.9 percent), and non-gang
members (10.7 percent). Once again similar patterns were observed when examining past 3 day
use and the results of the analysis.
The results of our analysis suggested different patterns of cocaine use compared to those of
marijuana and powder cocaine. Here, former gang members were most likely to report crack
use (17.2 percent) in the past 12 months, followed by non-gang members (7.1 percent). Gang
associates and current gang members were the least likely to report crack cocaine use in the

14
past 12 months (4.8 percent and 4.6 percent, respectively). A similar pattern was observed
when examining past 3 day crack cocaine use.
While heroin and methamphetamine use was prevalent among participants, their use was not
significantly differentiated by gang status.
Exhibit 7 presents our results with respect to the relationship between victimization and gang
status. Overall, non-gang members were less likely to be the victim of a crime when compared
to those who were associated with a gang.
Exhibit 7: Self-reported victimization by gang status - Past 12 months (N=1,269)
Non-Gang Member Associate Current Former
% N % N % N % N
Threatened with a Gun* 13.7 141 36.9 24 34.9 22 27.6 24
Shot or Shot At* 5.9 61 29.2 19 41.3 26 13.8 12
Threatened with a Weapon (Not a Gun)* 15.0 154 35.4 23 31.7 20 24.1 21
Injured with a Weapon (Not a Gun)* 6.9 71 9.2 6 22.2 14 16.1 14
Assaulted with no Weapon* 20.2 207 40.0 26 34.9 22 28.7 25
No. of Times Victimized Mean Mean Mean Mean
Threatened with a Gun 2.19 2.38 3.09 2.21
Shot or Shot At 1.85 2.37 2.92 2.91 Threatened with a Weapon (Not a
Gun) 6.23 7.39 3.50 5.81
Injured with a Weapon (Not a Gun) 3.18 6.00 1.64 2.35
Assaulted with no Weapon 4.29 5.50 7.55 3.40
* p<.05
For example, gang associates were more likely to have been threatened with a gun (36.9
percent) in the past 12 months, compared to current gang members (34.9 percent), former
gang members (27.6 percent), and non-gang members (13.7 percent). Related, current gang
members were more likely to self-report being shot or shot at in the past year (41.3 percent),
followed by gang associates (29.2 percent), former gang members (13.8 percent), and non-gang
members (5.9 percent). When asked whether they had been threatened with a weapon (not a
gun), 35.4 percent of gang associates reported being victimized. About 31.7 percent of current
gang members, 24.1 percent of former gang members, and 15 percent of non-gang members
also experienced having been threatened with a weapon (not a gun) in the past 12 months.

15
Current gang members were significantly more likely to have been injured with a weapon (22.2
percent), compared to gang associates (9.2 percent), former gang members (16.1 percent), and
non-gang members (6.9 percent). Gang associates were significantly more likely to experience
an assault without a weapon (40.0 percent), compared to current gang members (34.9
percent), former gang members (28.7 percent), and non-gang members (20.2 percent).
On average, participants reported being threatened with a gun, shot or shot at, or injured with
a weapon (not a gun) anywhere between one and six times in the past 12 months. Overall,
respondents were more likely to say they had been threatened with a weapon (not a gun) or
assaulted with no weapon, which occurred on average somewhere between three and eight
times in the past 12 months.
What is the organizational structure and composition of gangs? Current gang members, former gang members, and gang associates were asked questions
about the organization of their gang. The responses provided by the participants are listed in
Exhibit 8. Our analysis indicated that gang status was not significantly associated to the
organization of the gang. The general pattern of the results suggest that the vast majority of
gangs in Maricopa County claim territory, are characterized by special colors, symbols, signs or
clothing, make money from drug and gun sales, and members have certain responsibilities
within the gang. Many of the gang members interviewed also reported that their gang had a
leader, held regular meetings, and members gave money to the gang. Most of the gang
members interviewed reported that members were not required to follow rules.
Exhibit 8: Gang organization by gang status (N=215)
Associate Current Former
% N % N % N
The gang has a territory 84.2 48 88.5 54 89.0 73
The gang has a leader 69.4 34 56.7 34 64.6 53
The gang holds regular meetings 46.8 22 53.3 32 58.8 47
There are rules members have to follow 9.3 5 16.9 10 24.4 20
The gang has special colors, symbols, signs, or clothing
91.1 51 86.9 53 88.0 73
Members give money to the gang 60.9 28 68.3 41 51.2 42
The gang makes money from drug sales 87.8 43 74.6 44 77.5 62
The gang makes money from gun sales 67.4 29 60.3 35 59.2 45
Do members have responsibilities with the gang
72.1 31 72.7 40 55.8 43
* p<.05

16
Furthermore, the respondents offered information regarding the characteristics and
composition of the respondents’ gangs. These characteristics are presented in Exhibit 9. With
one exception, gang status was not significantly related to the characteristics of the
respondents’ gang. More than 90 percent of respondents reported that their gang had existed
for more than 3 years. More than a third of respondents indicated that there are sub-groups
or cliques that comprise their gang. On average the youngest member of the respondent’s
gang was 12 to 14 years old (depending on the respondent’s gang status) and the oldest
member 42 to 50 years old (depending on the respondent’s gang status). Over 80 percent of
the members of the respondent’s gang were males, who were predominantly Hispanic
(between 48 and 54 percent, depending on gang status) or African American (between 15 and
32 percent, depending on gang status). Respondents reported that about 7 to 13 percent of the
members of their gang were White, about 4 to over 13 percent were Native Americans, and
approximately 1 to 9 percent were from an “other” ethnic background.
Exhibit 9. Characteristics and composition of the gang by gang status (N=215)
Associate
Current
Former
%
%
%
How long has the gang been together?
6 months to 1 year 0.0
1.7
2.5
1 to 3 years 1.8
0.0
6.3
More than 3 years 98.2
98.3
91.1
Is there a clique within the gang? 34.6
42.4
39.8
Mean age of youngest member 14.09
13.42
12.08
Mean age of oldest member* 46.97
50.25
42.70
Gender composition of gang Males 83.0
83.5
82.8
Females 17.0
16.5
17.4
Ethnic composition of gang: White 13.08
7.22
10.09
African American 15.24
22.51
31.89
Hispanic 51.22
48.06
53.36
Native American 13.01
13.35
3.85
Other 7.45
8.86
0.81
* p<.05

17
How do members socially identify with their gang? Current and former gang members were provided with a series of statements that described
their perceptions of their gang. Exhibit 10 provides a list of these statements and the
percentage of respondents who agreed with each statement.
A little over half of current gang members (55 percent) said their gang had little to do with the
way they felt about themselves, compared to 75 percent of former gang members. Differently,
when participants were asked if they felt the gang was an important reflection of whom they
are, current gang members were more likely to agree with this statement (39.3 percent) than
former gang members (25 percent). Over 42 percent of current gang members and close to 18
percent of former gang members said belonging to a gang was an important part of their life.
Current gang members and former gang members had similar responses (71.7 and 72.6,
respectively) when asked if the gang has almost nothing to do with what kind of person they
are. About 34.4 percent of current gang members and 15.5 percent of former gang members
said the gang was a big part of their lives. Almost 64 percent of former gang members and 39.3
percent of current gang members said a member of a gang would leave the gang if something
better came along. Eighty percent of current gang members and 83.3 percent of former gang
members said there is no future in belonging to a gang.
More than 70 percent of the current and former gang members agreed that members of their
gang were cooperative with each other, could depend on each other, and stand up for each
other. About 26 percent of the current and former gang members said that the gang makes
them feel important and about one-third said that the gang makes them feel useful, gives them
a sense of belonging, and is really enjoyable. About 68 percent of former gang members and
about 72 percent of current gang members expect to remain in the gang for years; and 54.1
percent of current gang members and 45.8% of former gang members reported that being in a
gang is a good way to make money.

18
Exhibit 10:Social identification with the gang (N=151)
Current Former
% N % N
My gang has very little to do with how I feel about myself.* 55.0 33 75.0 63
My gang is an important reflection of who I am.* 39.3 24 25.0 21
Belonging to my gang is an important part of me.* 42.6 26 17.9 15
My gang has almost nothing to do with what kind of person I am.* 71.7 43 72.6 61
My gang is a big part of my life.* 34.4 21 15.5 13
The members of my gang are cooperative with each other. 73.3 44 71.0 59
The members of my gang know they can depend on each other. 80.0 48 73.8 62
The members of my gang stand up for each other. 91.9 56 94.1 79
Being in a gang makes me feel important. 26.3 16 26.2 22
Gang members provide a good deal of support for one another. 64.0 39 63.1 53
Being a member of a gang makes me feel like I am a useful person to have around.
32.8 20 35.4 29
Being a member of a gang makes me feel like I really belong somewhere. 32.8 20 38.5 32
Being a member of a gang is really enjoyable. 37.7 23 29.2 24
Being in a gang is a good way to make money. 54.1 33 45.8 38
A gang member expects to remain in the gang for many years. 72.1 44 67.8 57
A gang member would leave the gang if something better came along.* 39.3 24 63.9 53
There is no future to belonging in a gang.* 80.0 48 83.3 70
* p<.05

19
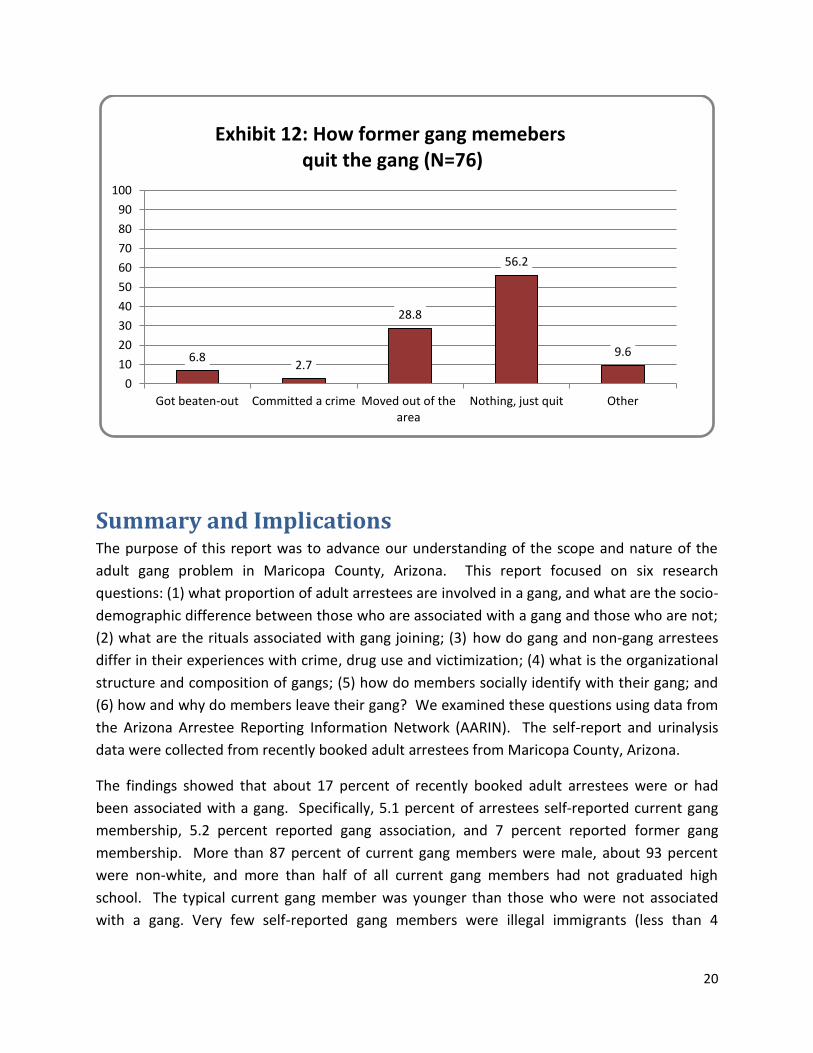
How and why do members leave their gang? Last, former gang members were asked about their experiences when exiting their gang. The
responses given by former gang members are presented in Exhibit11 and Exhibit12.
When we asked former gang members the reasons for which they stopped being a member of
a gang, the most common response was because they started a family (32.9 percent). Former
gang members were as likely to report leaving the gang due to other personal reasons or simply
because they became tired of being in a gang (30.1 percent). About 12.3 percent said that they
left the gang to avoid violence, and last, former gang members were as likely to leave the gang
due to getting a job, or because they went to jail or prison (5.5 percent).
The majority of gang members said they did not have to do anything to leave the gang (56.2
percent). About 28.8 percent said they moved out of the area in order to leave the gang.
Almost seven percent said that they were beaten-out of the gang, and 2.7 percent said they
had to commit a crime in order to leave the gang. Last, 9.6 percent said they had to do
something else in order to stop being a member of a gang.
12.3
30.1
5.5
32.9
5.5
30.1
0
10
20
30
40
50
60
70
80
90
100
To avoid violence Got tired of it Got a job Started a family Went to jail or prison Other reason
Exhibit 11: Reasons why former gang members decided to leave the gang (N=76)
20
Summary and Implications The purpose of this report was to advance our understanding of the scope and nature of the
adult gang problem in Maricopa County, Arizona. This report focused on six research
questions: (1) what proportion of adult arrestees are involved in a gang, and what are the socio-
demographic difference between those who are associated with a gang and those who are not;
(2) what are the rituals associated with gang joining; (3) how do gang and non-gang arrestees
differ in their experiences with crime, drug use and victimization; (4) what is the organizational
structure and composition of gangs; (5) how do members socially identify with their gang; and
(6) how and why do members leave their gang? We examined these questions using data from
the Arizona Arrestee Reporting Information Network (AARIN). The self-report and urinalysis
data were collected from recently booked adult arrestees from Maricopa County, Arizona.
The findings showed that about 17 percent of recently booked adult arrestees were or had
been associated with a gang. Specifically, 5.1 percent of arrestees self-reported current gang
membership, 5.2 percent reported gang association, and 7 percent reported former gang
membership. More than 87 percent of current gang members were male, about 93 percent
were non-white, and more than half of all current gang members had not graduated high
school. The typical current gang member was younger than those who were not associated
with a gang. Very few self-reported gang members were illegal immigrants (less than 4
6.8 2.7
28.8
56.2
9.6
0
10
20
30
40
50
60
70
80
90
100
Got beaten-out Committed a crime Moved out of the area
Nothing, just quit Other
Exhibit 12: How former gang memebers quit the gang (N=76)

21
percent), but many current gang members (30.5 percent) reported that their primary source of
income was from illegal sources.
Most self-reported gang members engaged in a ritual upon joining their gang, such as being
jumped in, fighting (or shooting) someone, or committing a crime. About a third of gang
members reported that they did not have to do anything to join their gang or reported that
they were born into their gang. Very few individuals reported that they were required to kill
someone or be sexed into the gang.
Current gang members were significantly more likely to be involved in crime, drug use, and
victimization than non-gang members. For instance, in the past 12 months current gang
members were 1.4 times more likely to use drugs, 1.8 times more likely to engage in a property
offense, 2.2 times more likely to engage in a violent offense, 3.2 times more likely to engage in
drug sales, and 7 times more likely to engage in a firearm offense than non-gang members.
Urinalyses confirmed that gang members were more involved in drug use than non-gang
members. Approximately 60 percent of current gang members tested positive for marijuana
use compared to 31.9 percent of non-gang members. Similarly, 21 percent of current gang
members tested positive for cocaine use compared to 8.9 percent of non-gang members.
Similar to the offending patterns described above, gang members were significantly more likely
to be the victims of violent crime. For example, in the past 12 months current gang members
were seven times more likely to be shot (41.3 percent versus 5.9 percent), 3.2 times more likely
to have been injured with a weapon (not a gun) (22.2 percent versus 6.9 percent) and 1.7 times
more likely to have been assaulted with no weapon (34.9 percent versus 20.2 percent)
compared to non-gang members.
Almost all of the current gang members reported that their gang has existed for more than
three years. While most gang members reported that their gang did not have formal rules that
members had to follow, gangs exhibited a substantial amount of organizational structure.
Many reported their gang claimed territory, had a leader, and that their gang made money
from drug and gun sales. Similarly, current gang members identified closely with their gang.
Most reported that they could depend on fellow gang members for support and that they
intended to remain in their gang for years. Interestingly, however, many current gang
members did not believe that their gang membership was a reflection of themselves, and
stated that their gang has almost nothing to do with what kind of person they are. Most gang
members also stated that their membership was not a big part of their life, did not make them
feel important, and did not necessarily make them feel like they belonged somewhere.
Among former members, most reported leaving their gang because they started a family, got
tired of the gang, or left the gang to avoid violence. More than 80 percent reported that they
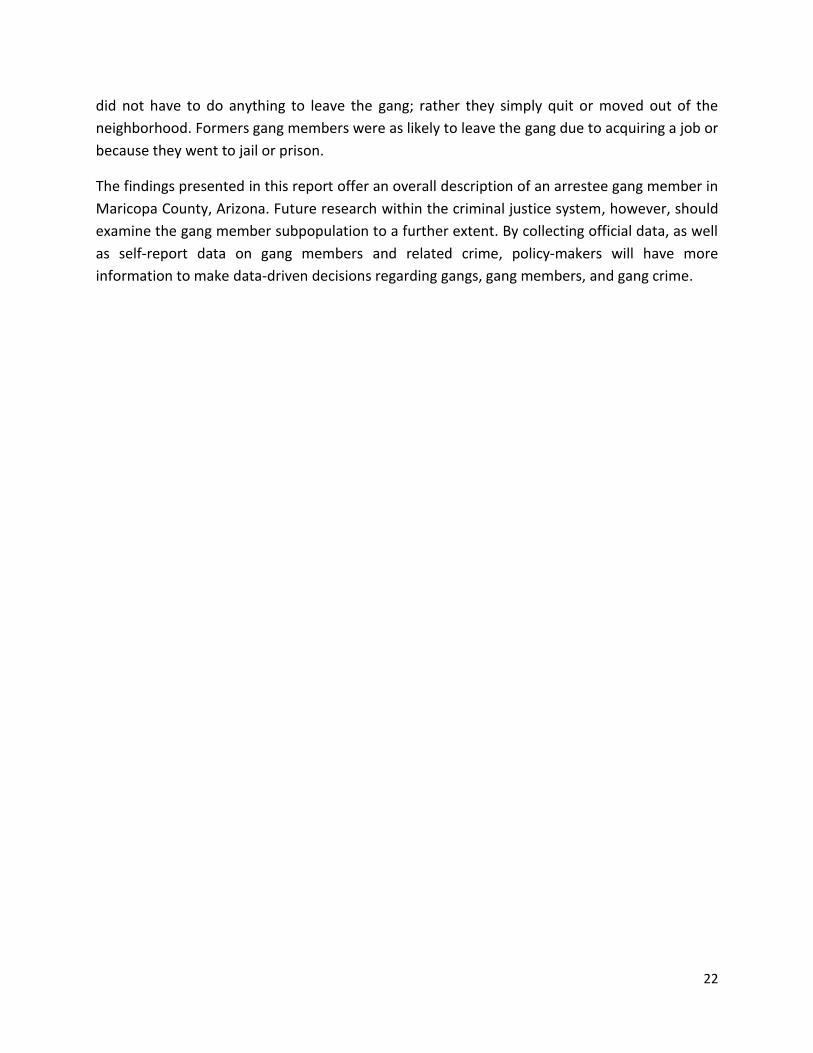
22
did not have to do anything to leave the gang; rather they simply quit or moved out of the
neighborhood. Formers gang members were as likely to leave the gang due to acquiring a job or
because they went to jail or prison.
The findings presented in this report offer an overall description of an arrestee gang member in
Maricopa County, Arizona. Future research within the criminal justice system, however, should
examine the gang member subpopulation to a further extent. By collecting official data, as well
as self-report data on gang members and related crime, policy-makers will have more
information to make data-driven decisions regarding gangs, gang members, and gang crime.

23
References Decker, Scott H., Charles M. Katz, and Vincent J. Webb. 2008. “Understanding the black box of gang organization: Implications for violence, drug sales, and violent victimization.” Crime & Delinquency 54 (1): 153-172.
Katz, Charles M., Edward R. Maguire, and David Choate. 2011a. “A cross-national comparison of gangs
in the United States and Trinidad and Tobago.” International Criminal Justice Review, 21, 3: 243-262.
Katz, Charles M. and Stephen Schnebly. 2011. “Neighborhood Variation in Gang Member
Concentrations.” Crime & Delinquency, 57, 3: 377-407.
Katz, Charles M., Kate Fox, Vincent J. Webb, and Jennifer Shaffer. 2011b. “Understanding the
relationship between violent victimization and gang membership.” Journal of Criminal Justice, 39: 48-
59.
Katz, Charles M., Andrew Fox and Michael White. 2011c. “Examining the relationship between illegal
immigration, and drug use.” Justice Quarterly, 28, 4: 541-575.
Katz, Charles M., Vincent J. Webb, and Scott H. Decker. 2005. “Using the Arrestee Drug Abuse Monitoring (ADAM) program to further understand the relationship between drug use and gang membership.” Justice Quarterly, 22 (1): 58-88. Katz, Charles M., Vincent J. Webb, and Todd A. Armstrong. 2003. “Fear of Gangs: A Test of Alternative Theoretical Models.” Justice Quarterly, 20 (1): 95-130
Katz, Charles M., Vincent J. Webb, and David R. Schaefer. 2000. “The Validity of Police Gang Intelligence Lists: Examining Differences in Delinquency between Documented Gang Members and Non-Documented Delinquent Youth.” Police Quarterly 3 (4): 413-437. Katz, Charles M., Vincent J. Webb, Patrick R. Gartin, and Chris E. Marshall. 1997. "The Validity of Self-Reported Marijuana and Cocaine Use." Journal of Criminal Justice 25 (1): 31-42. Katz, Charles M. and Vincent J. Webb. 2006. Policing Gangs in America. Cambridge University Press: New York. Webb, Vincent, Charles M. Katz, and Scott Decker. 2006. “Assessing the validity of self-reports by gang members: Results from the Arrestee Drug-Abuse Monitoring program.” Crime & Delinquency 52 (2): 232-252.
Rodriguez, Nancy, Charles M. Katz, Vincent J. Webb, and David Schaefer. 2005. “Examining the impact of individual, community, and market factors on methamphetamine use: A tale of two cities.” Journal of Drug Issues 35 (4): 665-694.

MAILING ADDRESSCenter for Violence Prevention and Community Safety
College of Public ProgramsArizona State University
Mail Code 3120500 N. 3rd Street, Suite 200Phoenix, Arizona 85004-2135
PHONE602.496.1470
WEB SITEhttp://cvpcs.asu.edu
About the Center for Violence Prevention & Community Safety
Arizona State University, in order to deepen its commitment to the communities of Arizona and to society as a whole, has set a new standard for research universities, as modeled by the New American University. Accordingly, ASU is measured not by whom we exclude, but by whom we include.
The University is pursuing research that considers the public good and is assuming a greater responsibility to our communities for economic, social, and cultural vitality. Social embeddedness – university-wide, interactive, and mutually-supportive partnerships with Arizona communities – is at the core of our development as a New American University.
Toward the goal of social embeddedness, in response to the growing need of our communities to improve the public’s safety and well-being, in July 2005 ASU established the Center for Violence Prevention and Community Safety. The Center’s mission is to generate, share, and apply quality research and knowledge to create “best practice” standards.
Specifically, the Center evaluates policies and programs; analyzes and evaluates patterns and causes of violence; develops strategies and programs; develops a clearinghouse of research reports and “best practice” models; educates, trains, and provides technical assistance; and facilitates the development and construction of databases.
For more information about the Center for Violence Prevention and Community Safety, please contact us using the information provided below.