mapping waste in the food and drink industry · mapping waste in the food and drink industry . ......
TRANSCRIPT

A report for Defra and
The Food and Drink Federation
November 2010
Mapping Waste in the Food and Drink Industry
This report has been prepared by: Caroline Bartlett Checked as a final copy by: Katie Deegan Reviewed by: Nick Morley Date: 01 November 2010 Contact: [email protected] File reference number: DEFR01 235 summary.doc
Oakdene Hollins provides clients with these services: ● Modelling and impact assessment ● Programme management and evaluation ● Project management ● Ecolabelling advice ● Carbon footprinting ● Critical review of life cycle assessment ● Policy and strategy development ● Lean manufacturing ● Economic analysis ● Market appraisal.
For more information visit www.oakdenehollins.co.uk Oakdene Hollins is registered to ISO 9001:2008
We print our reports on Ecolabel / recycled paper

For Defra and the Food and Drink Federation
Contents
1 Executive summary 1
2 Introduction 2 2.1 FDF Five-Fold Environmental Ambition 2 2.2 Previous report 2 2.3 Survey methodology 2
3 Distribution of waste produced 4 3.1 Waste breakdown and recovery/disposal routes 4 3.2 Amount of waste produced 7 3.3 Total waste to landfill 10 3.4 Landfill waste by type 13 3.5 Anaerobic digestion 16 3.6 Composting 19 3.7 Landspreading 22 3.8 Thermal treatment 25 3.9 Recovery/disposal routes for waste by country 28
4 By-products and surpluses 31
5 Trends in waste arisings 34 5.1 Trends in waste arisings and management 34 5.2 Data limitations 38
6 Conclusions 39

For Defra and the Food and Drink Federation
Acknowledgements
We would like to thank Defra for funding the study. We would also like to thank the Food and Drink Federation for preparing and circulating the survey, and their members who took the time to complete the questionnaires and answer queries when they arose. In particular, thank you to David Bellamy and Peter Andrews at FDF, and Lucy Foster and Farhana Amin at Defra for their input and feedback on the report.

For Defra and the Food and Drink Federation 1
1 Executive summary
In 2008, Defra and the Food and Drink Federation (FDF) commissioned a report to assess the amount of food and packaging waste arising from FDF member manufacturing sites across the UK during 2006. This study examined the geographic distribution of waste and management techniques utilised. It also sought to highlight any areas where significant landfilling or low value recovery was being carried out, with the intention of promoting management techniques at higher tiers of the waste hierarchy. This 2010 report builds on the previous study to provide an updated snapshot of the amount and geographical distribution of food and packaging waste arising across FDF member sites along with how this waste is being managed. Data were gathered for both 2008 and 2009 from 149 manufacturing sites and, where appropriate, were also compared to the 2006 data from the previous report. A smaller sub sample of 115 sites providing data for all three years was analysed in order to identify trends. The 2008 and 2009 returns have also been amalgamated to give a representation of FDF member practices according to different geographical areas. These areas were determined according to the number of sites responding from specific counties. Those areas showing small number of responding sites were combined to maintain confidentiality. Of the 481,000 tonnes waste produced in 2009 by the 149 responding sites, only 43,000 tonnes (9%) was sent to landfill, with 435,000 tonnes (90.3%) recovered or recycled in some manner. This was a significant improvement on both the 2006 and the 2008 data, where 16.5% and 12.5% of arisings were sent to landfill respectively. This shows that FDF is making good progress towards meeting its target of seeking to send zero food and packaging waste
to landfill from 2015, part of its ‘Five-Fold Environmental Ambition’. There were no substantial ‘hotspots’ for landfill; no area sent more than 5,000 tonnes to landfill in 2009; eight areas sent less than 1,000 tonnes. The majority of waste sent to landfill in both 2008 and 2009 was mixed food and packaging waste, which is similar to the findings of the first survey. Also the majority of the arisings occurred due to food waste yet only a small fraction (i.e. 1.7% in 2009) of this was landfilled. In both years, FDF members produced over 340,000 tonnes of by-products and surpluses, with a significant tonnage (approx 98% of total) going to animal feed. Analysis of the sub sample of 115 sites providing data for all three years suggested that a decoupling of waste generation against production has taken place, in line with the ‘more for less’ approach. Actual waste arisings have decreased by 16.5% over the three years surveyed whilst production has increased over the period by 3%. A shift towards the middle tier of the waste hierarchy is apparent. As in 2006, landspreading was the dominant waste management option, its share increasing to 63% of all waste generated. Two areas used anaerobic digestion (AD) in 2009. The results show growth in uptake of AD, albeit from a modest base. There clearly remains ample opportunity for broader uptake of this technology. The previous report suggested that targeting waste segregation at source should be prioritised, to reduce the tonnage of mixed waste going to landfill. The latest survey data showed a decrease in mixed waste as a proportion of total waste arisings, suggesting that more segregation is occurring although there is still opportunity for improvement.

2 For Defra and the Food and Drink Federation
2 Introduction
2.1 FDF Five-Fold Environmental Ambition
In October 2007 the Food and Drink Federation (FDF) committed, on behalf of its members, to making a significant contribution to improving the environment by targeting priorities where they can make the biggest difference. Working collectively, the FDF ‘Five-fold Ambition’ aims to: Show leadership nationally and internationally by achieving a 20% absolute reduction in CO2 emissions by 2010 compared to 19901 and aspiring to a 30% reduction by 2020; Send zero food and packaging waste to landfill from 2015; Make a significant contribution to WRAP’s work to achieve an absolute reduction in the level of packaging reaching households by 2010 compared to 2005 and provide more advice to consumers on how best to recycle or otherwise recover used packaging; Achieve significant reductions in water use2 and contribute to an industry-wide absolute target3 to reduce water use by 20% by 2020 compared to 2007, and Embed environmental standards in their transport practices, including contracts with hauliers as they fall for renewal, to achieve fewer and friendlier food transport miles and contribute to an absolute target for the UK food chain to reduce the environmental and social costs of its domestic food transportation by 20% by 2012 compared to 20024. This survey was commissioned jointly by FDF and Defra to collect data on food and packaging waste arisings from FDF member manufacturing sites in 2008 and 2009, its geographical distribution and the management routes utilised. This report will help FDF track delivery
1
Proposed in the Food Industry Sustainability Strategy published by
Defra in 2006 2 Water use outside of that embedded in products themselves
3 Proposed in the Food Industry Sustainability Strategy published by
Defra in 2006 4
Proposed in the Food Industry Sustainability Strategy published by
Defra in 2006
of its Ambition to send zero food and packaging waste to landfill from 2015, inform development of waste treatment capacity and to move waste management up the hierarchy. The insight that this report provides is important to Defra given the coalition Government’s aims of taking steps to achieve a zero waste economy. The survey follows on from a joint FDF and Defra report commissioned in 20085, which provided a snapshot of the level of food and packaging waste arising across FDF member sites during 2006, its geographical distribution and management routes.
2.2 Previous report
The survey distributed by FDF in 2008, looked at 2006 data and generated returns from 236 sites. This data showed over 800,000 tonnes of waste arisings across the members. At 138,000 tonnes (equivalent to 16.5% of the total arisings), food and packaging waste sent to landfill was found to be modest. The majority comprised mixed food and packaging waste, with 110,000 tonnes of the 135,000 tonnes arising, sent to landfill. Food waste was the most recovered type of waste, the majority (36%) being sent for landspreading, with uptake of anaerobic digestion also being significant, at 11% of food waste All parts of the country employed some method of recovery, with 82% of total arisings recycled or recovered in some way. An additional 512,000 tonnes of potential waste was avoided due to use of by-products, principally as animal feed.
2.3 Survey methodology
The 2010 survey provides an updated snapshot of the level of food and packaging waste arising across FDF member manufacturing sites and makes comparison with the previous 2008 survey of 2006 data. Two years’ worth of data
5
FDF (2008) Mapping Waste in the food industry Report available from
http://www.fdf.org.uk/publicgeneral/mapping_waste_in_the_food_industry.pdf

For Defra and the Food and Drink Federation 3
were requested (2008 and 2009). Data on by-products and surpluses were also collected and broken down by destination following feedback from members responding to the previous
survey. The use of by-products in, for example, animal feed is considered to be a beneficial avoidance of waste. This survey therefore included a table in which respondents could enter the tonnage of by products and surpluses going to animal feed, charity (human) or other destination, material that would otherwise have become a waste if it had been discarded. Questionnaires were sent to all FDF members to survey food and packaging waste arisings at their food manufacturing sites in the UK for 2008 and 2009, along with recycling, recovery and disposal routes according to whether it was food, packaging or mixed food and packaging waste. Member companies with a combined turnover of £15bn responded, providing data in respect of 149 sites. This equates to about 20% of the UK food and drink manufacturing industry by value. Individual site waste data was aggregated into different geographic areas (e.g. counties) based on the postcode of each site. Where there were only a few sites in a particular area data were combined with another area to form larger groupings, to avoid breaching commercial confidentiality. Due to the smaller number of responses than the previous survey, larger county groupings were necessary, meaning that the geographic areas were not directly
comparable to those created for the 2008 report. A total of 24 areas were created, and these can be seen in Appendix 1. The main body of this report (Section 3) is subdivided as follows:
amount of waste produced
total waste to landfill
landfill waste by type
anaerobic digestion
composting
landspreading
thermal treatment
disposal/recovery routes by country. Section 4 provides detail of the waste avoidance in terms of use of by-products and surpluses and presents this information graphically by geographical area. Section 5 analyses the sub sample of 115 sites which provided data for all three survey years in order to identify trends. Due to the heterogeneity of the food and drink industry, it is not appropriate to make direct comparisons, such as average waste production per site or per tonne of product, between sites in different sub sectors. However by analysing aggregate data from a sub sample of like-for-like sites, a more accurate understanding of trends can be developed. Section 6 summarises the conclusions and progress since the 2006 survey.

4 For Defra and the Food and Drink Federation
3 Distribution of waste produced
3.1 Waste breakdown and recovery/disposal routes
The waste hierarchy is a useful tool for defining best practice in waste management, with the options higher in the list typically offering the greatest environmental benefit. Whilst this cannot be considered absolute (distance to available facilities being a factor for example), the general consensus is to promote the higher tiers when considering waste management.
The hierarchy is now enshrined in EU Law, being incorporated into the revised 2008 EU Waste Framework Directive. It is used as a basis for evaluation within this report, with management techniques incorporating those higher tier options usually considered as the best practice. The responding FDF members showed minimal utilisation of the lowest tier of the hierarchy, the ‘disposal’ options, which accounted for only 12.8% and 9.7% of the waste arisings in 2008 and 2009 respectively. However, the highest tier was also under-utilised, with the majority of the arisings ‘recovered’, mainly through landspreading, for both years. Details of the waste arisings as well as the recovery/ disposal routes used by FDF member sites for both 2008 and 2009 can be seen in Table 3.1.
Table 3.1 does not show the ‘waste’ that is prevented from arising – whilst this is more difficult to quantify when considering resource efficiency or similar, it is possible to quantify by-product and surplus food tonnages. The main use of these materials - as animal feed - offers significant opportunity for maximising value. In both the reporting years, FDF members produced over 340,000 tonnes of by-products and surpluses, with a significant tonnage [approx 98% of total] going to animal feed. By products and surpluses are discussed in greater detail in Section 4. Whilst a slightly larger tonnage of waste was generated in 2009 compared to 2008, the general trend over the two years has been a positive one, with a 3.1% reduction in waste sent to the lowest tier ‘disposal’ options. In particular, waste to landfill has fallen from 59,000 tonnes to 43,000 tonnes. Two of the highest tier recycling options, anaerobic digestion (AD) and composting, have both shown increases in utilisation. In contrast, recycling overall has shown a lower level of uptake, falling from 80,000 to 76,000 tonnes. Table 3.2 provides a comparison of the recovery and disposal routes for the two years, and these findings are examined in more detail in the subsequent sections.

For Defra and the Food and Drink Federation 5
Table 3.1: Total breakdown of recovery and disposal routes (in tonnes) used by FDF member sites in 2008 and 2009 by waste arising type
Management route Treatment and disposal
options
Food waste[see footnote
1]
Packaging waste[see footnote
2]
Mixed food & packaging waste[see
footnote3]
Total [see footnote4]
2008 2009 2008 2009 2008 2009 2008 2009
Recycle/ compost
Anaerobic digestion 2,865 4,625 0 0 0 0 2,865 4,625
Composting 7,901 13,311 367 848 4,656 7,540 12,924 21,699
Recycling 23,945 11,693 41,347 49,215 6,725 14,764 79,992 75,672
Other recycling 7,599 7,747 0 0 3,176 2,627 10,775 10,374
Recovery
Landspreading5 280,066 302,105 0 0 907 1,567 281,193 303,871
Thermal treatment6 with
energy recovery 16,542 12,252 722 737 4,623 4,104 21,887 17,093
Other recovery 279 378 304 796 1,763 0 2,346 1,174
Disposal (lowest)7
Thermal treatment8
without energy recovery 523 196 0 0 0 0 523 196
Landfill 12,162 6,288 11,510 6,345 35,107 30,771 59,179 43,389
Other disposal 300 2,821 157 124 180 159 637 3,104
TOTAL 352,182 361,416 54,407 58,065 57,137 61,532 472,320 481,196
1
This should represent the total food waste arisings which left via the backdoor of the factory unmixed including any inedible fraction but not food waste mixed with packaging waste. It should not include any data on by-products and surpluses. 2
This should represent the total packaging waste arisings which left the factory via the backdoor, unmixed. It should not include reusable packaging unless it had reached the end of its life or any packaging mixed in with food waste. 3
This should represent the total mixed food & packaging waste arisings, i.e. finished goods or food & packaging waste which arose separately but was mixed on site before leaving via factory backdoor, e.g. in a single skip. It should not include any data on by-products and surpluses. 4
This includes the tonnage arising from a small number of sites not able to provide a breakdown by waste type 5
This covers direct landspreading of liquid wastes or sludges for agricultural benefit or ecological improvement and includes soil injection. The spreading of outputs from A/D or composting should not to be included to avoid double counting. 6
Thermal treatment includes the technologies of incineration, gasification and pyrolysis. 7
Trade effluent disposed of via public sewer to a municipal waste water treatment plant was not included. 8
Thermal treatment includes the technologies of incineration, gasification and pyrolysis.

For Defra and the Food and Drink Federation 6
Table 3.2: Comparison of recovery and disposal routes (in tonnes) used by FDF member sites in 2008 and 2009
Year
Total waste(tonnes)
Grand total
AD
Co
mp
os-
tin
g
Rec
yclin
g
Oth
er
recy
clin
g
Lan
d-
spre
adin
g
Ther
mal
trtm
t, +
ener
gy
reco
very
Oth
er
reco
very
Ther
mal
trtm
t, n
o
ener
gy
reco
very
Lan
dfi
ll
Oth
er
dis
po
sal
2008 2,865 12,924 79,992 10,775 281,193 21,887 2,346 523 59,179 637 472,320
2009 4,625 21,699 75,672 10,374 303,871 17,093 1,174 196 43,389 3,104 481,196

For Defra and the Food and Drink Federation 7
3.2 Amount of waste produced
Responding FDF member sites located in Staffordshire produced the largest tonnage of waste during both reporting years, with a substantial increase of 22.9% in 2009 (Table 3.3). Half the areas showed an overall increase in arisings, the most noticeable being Lancashire, with an increase of 96.3%, though from a relatively small base in comparison to the
others. The remaining areas all produced lower tonnages than the previous year, with the West Midlands reducing waste generation by 39.1%. Figure 3.1 and Figure 3.2 show the geographical distribution of waste arisings for the responding sites in each year.
Table 3.3: Tonnes of food and packaging waste arisings from FDF member sites, by area, for 2008 and 2009
County Waste arisings (tonnes)
2008 2009
Staffordshire 54,541 67,049
South Yorkshire 49,230 43,670
Gloucestershire and Wiltshire 40,877 46,451
Shropshire and Herefordshire 40,523 39,193
Norfolk and Suffolk 40,343 42,598
South West Counties 37,053 36,503
Cambridgeshire 28,117 23,944
Leicestershire and Rutland 21,511 17,680
Oxon, Herts, Beds, Bucks and Berks 20,090 18,131
Cumbria, County Durham and Northumberland 19,895 23,975
Derbyshire and Nottinghamshire 17,609 19,643
Wales 15,465 18,939
Lincolnshire 15,302 12,731
London 13,592 13,621
Greater Manchester 10,677 10,603
West Midlands 10,408 6,342
Scotland 10,371 8,766
Northamptonshire 6,175 6,709
Cheshire and Merseyside 5,505 4,824
Kent and Essex 5,485 7,143
Northern Ireland 2,956 3,209
Lancashire 2,883 5,659
North Yorkshire 2,560 2,520
Hants 1,152 1,294
Total 472,320 481,197

8 For Defra and the Food and Drink Federation
Figure 3.1: Tonnes of food and packaging waste arisings from FDF member sites, by area, in 2008
Key (indicative scale):
65,000 tonnes
32,500 tonnes
0

For Defra and the Food and Drink Federation 9
Figure 3.2: Tonnes of food and packaging waste arisings from FDF member sites, by area, in 2009
Key (indicative scale):
65,000 tonnes
32,500 tonnes
0

10 For Defra and the Food and Drink Federation
3.3 Total waste to landfill
According to the waste hierarchy, landfill is one of the least desirable management routes and should be avoided wherever possible. It is also a costly option, and many organisations find diverting waste from landfill can often offer a financial as well as an environmental benefit. Food waste, in particular, is very damaging when landfilled, releasing harmful greenhouse gases as the matter decomposes. There is also the loss of resources that went into producing the food in the first place to consider. For these reasons, the FDF has a target of zero food and packaging waste to landfill from 2015 as one of its ‘Five-Fold Environmental Ambitions’.
Table 3.4 shows the waste sent to landfill by responding member sites aggregated by geographic area for each of the two years. The overall trend has been positive, with total landfilled waste falling by over 15,000 tonnes (26.7%) between 2008 and 2009. Gloucestershire and Wiltshire were found to have sent the greatest tonnages in both 2008 and 2009. The tonnage sent by that area has shown improvement, however, with a decrease of 37.6% over the period. Figure 3.3 and Figure 3.4 show the geographical distribution of waste arisings sent to landfill in each year.
Table 3.4: Tonnes of waste arisings sent to landfill from FDF member sites, by area, in 2008 and 2009.
County Waste to landfill (tonnes)
2008 2009
Gloucestershire and Wiltshire 7,877 4,913
London 4,998 3,625
Wales 4,368 3,521
Lincolnshire 4,153 3,344
Norfolk and Suffolk 4,109 2,167
Cambridgeshire 4,082 2,896
Scotland 3,894 3,809
South Yorkshire 3,257 2,073
Leicestershire and Rutland 3,003 2,109
Derbyshire and Nottinghamshire 2,974 1,737
Cumbria, County Durham and Northumberland 2,772 1,827
Cheshire and Merseyside 2,166 1,598
Staffordshire 1,725 1,371
Greater Manchester 1,595 1,111
West Midlands 1,443 974
South West Counties 1,423 1,333
North Yorkshire 1,164 650
Oxon, Herts, Beds, Bucks and Berks 940 1,011
Northern Ireland 837 694
Lancashire 751 793
Hants 725 727
Kent and Essex 365 279
Northamptonshire 297 316
Shropshire and Herefordshire 261 511
Total 59,179 43,389

For Defra and the Food and Drink Federation 11
Figure 3.3: Tonnes of waste arisings sent to landfill from FDF member sites, by area, in 2008
Key (indicative scale):
8,000 tonnes
4,000 tonnes
0

12 For Defra and the Food and Drink Federation
Figure 3.4: Tonnes of waste arisings sent to landfill from FDF member sites, by area, in 2009
Key: (indicative scale):
8,000 tonnes
4,000 tonnes
0

For Defra and the Food and Drink Federation 13
3.4 Landfill waste by type
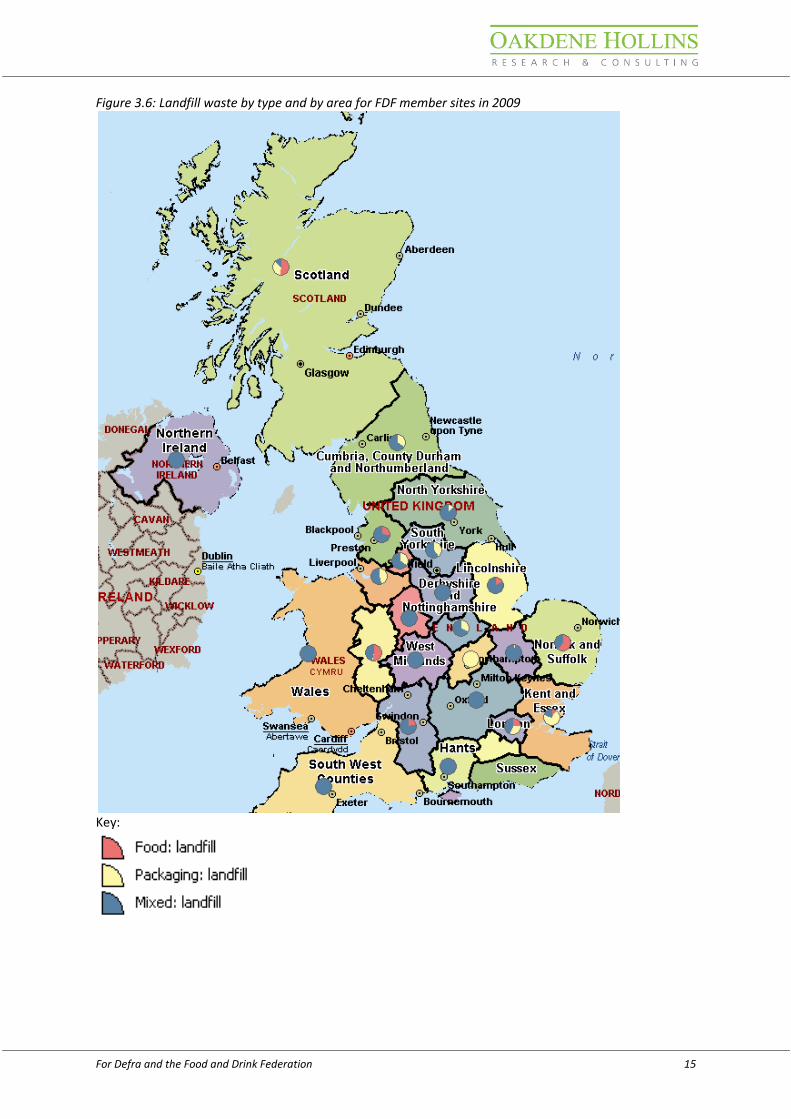
This section examines the type of waste sent to landfill in the different geographic areas, whether food, packaging or mixed food and packaging (see Figure 3.5 and Figure 3.6). The responding sites did not appear to send large proportions of food waste to landfill (20.6% in 2008 dropping to 14.5% by 2009). Of the 24 areas examined, 14 did not send any food waste to landfill. Packaging waste was also a minor proportion of landfill waste, with mixed waste dominating the
landfill tonnages for most areas. There were some exceptions, however; Northamptonshire’s landfill waste, for example, was 100% packaging. In 2008 only two areas had landfill waste comprising of over 50% food; three in 2009, the most notable of these being Norfolk and Suffolk. Kent and Essex’s landfill waste changed in composition from mainly food (67%) to mainly packaging, with less than 10% mixed waste in either year.

14 For Defra and the Food and Drink Federation
Figure 3.5: Landfill waste by type and by area for FDF member sites in 2008
Key:
For Defra and the Food and Drink Federation 15
Figure 3.6: Landfill waste by type and by area for FDF member sites in 2009
Key:
16 For Defra and the Food and Drink Federation
3.5 Anaerobic digestion
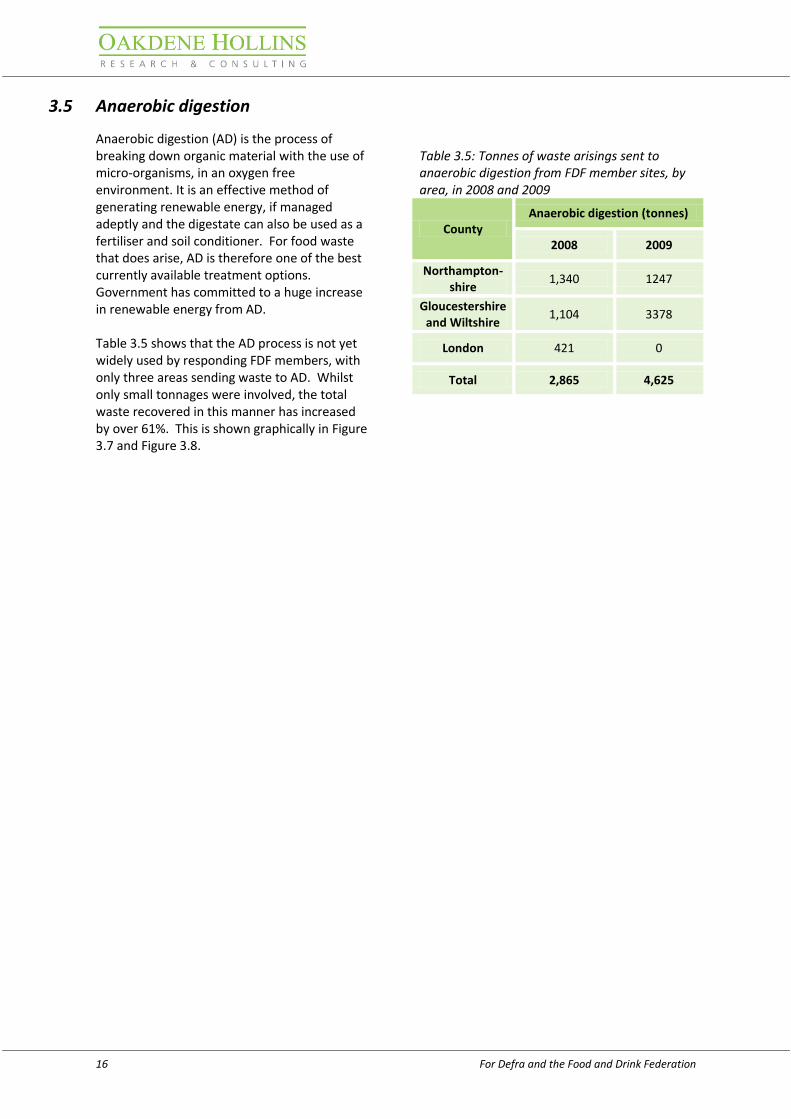
Anaerobic digestion (AD) is the process of breaking down organic material with the use of micro-organisms, in an oxygen free environment. It is an effective method of generating renewable energy, if managed adeptly and the digestate can also be used as a fertiliser and soil conditioner. For food waste that does arise, AD is therefore one of the best currently available treatment options. Government has committed to a huge increase in renewable energy from AD. Table 3.5 shows that the AD process is not yet widely used by responding FDF members, with only three areas sending waste to AD. Whilst only small tonnages were involved, the total waste recovered in this manner has increased by over 61%. This is shown graphically in Figure 3.7 and Figure 3.8.
Table 3.5: Tonnes of waste arisings sent to anaerobic digestion from FDF member sites, by area, in 2008 and 2009
County Anaerobic digestion (tonnes)
2008 2009
Northampton-shire
1,340 1247
Gloucestershire and Wiltshire
1,104 3378
London 421 0
Total 2,865 4,625

For Defra and the Food and Drink Federation 17
Figure 3.7: Tonnes of waste arisings sent to anaerobic digestion from FDF member sites, by area, in 2008
Key (indicative scale):
3,500 tonnes
1,750 tonnes 0

18 For Defra and the Food and Drink Federation
Figure 3.8: Tonnes of waste arisings sent to anaerobic digestion from FDF member sites, by area, in 2009
Key (indicative scale):
3,500 tonnes
1,750 tonnes 0

For Defra and the Food and Drink Federation 19
3.6 Composting
Composting is another option within the waste hierarchy for treating food waste that has environmental benefits. The resulting compost can be used as a soil conditioner to enhance biological activity and encourage growth. The survey data suggests the use of composting is growing, though uptake still remains fairly uneven across the UK. In 2008, nine areas out of a total of 24 carried out composting, albeit at low levels in some cases. By 2009 a further two areas had also started. In 2008, composting was utilised for just 2.7% of total food and packaging waste arisings; by 2009 this had grown to 4.5%,
with nearly 21,700 tonnes recovered in this manner (Table 3.6). As can be seen in Figure 3.9 and Figure 3.10, Wales composted the largest tonnage of material for both years. Staffordshire was also significant, with an increase from 2,950 tonnes in 2008, to 4,244 tonnes in 2009. Both London and South Yorkshire sites have started utilising this process since 2008, with the result that in 2009 London composted the third largest tonnage of all the areas.
Table 3.6: Tonnes of waste arisings sent for composting from FDF member sites, by area, in 2008 and 2009
County Composting (tonnes)
2008 2009
Wales 4,500 7,468
Staffordshire 2,950 4,244
Lincolnshire 2,213 1,698
Kent and Essex 1,424 2,627
Oxon, Herts, Beds, Bucks and Berks 694 728
Cumbria, County Durham and Northumberland 380 736
Lancashire 367 652
Scotland 240 266
North Yorkshire 156 414
London 0 2,670
South Yorkshire 0 196
Total 12,924 21,699

20 For Defra and the Food and Drink Federation
Figure 3.9: Tonnes of waste arisings sent to composting from FDF member sites, by area, in 2008
Key (indicative scale):
8,000 tonnes
4,000 tonnes
0

For Defra and the Food and Drink Federation 21
Figure 3.10: Tonnes of waste arisings sent to composting from FDF member sites, by area, in 2009
Key (indicative scale):
8,000 tonnes
4,000 tonnes
0

22 For Defra and the Food and Drink Federation
3.7 Landspreading
Landspreading was the dominant waste management route utilised by responding member sites, accounting for 59% of total arisings in 2008 and 63% in 2009. When considering food waste alone, this percentage becomes more significant, with 83.6% of food waste recovered in this manner in 2009. Whilst a better environmental option compared to landfill or other disposal options, it is worth considering that landspreading only falls within the mid-range of the waste hierarchy, being deemed a recovery option. It therefore falls ‘below’ composting, AD and other recycling methods. One reason why landspreading predominates could be due to the fact that it is
often a more financially favourable option, particularly when the site is based in a rural area and agricultural land is plentiful. Transportation costs may also have an influence on its uptake. Staffordshire showed the greatest tonnage of waste to landspreading, contributing 19% of the total for the UK. Most areas have shown an increase in tonnage of waste used for landspreading. In some cases this increase is substantial, such as in London (over 150%), and Leicestershire and Rutland (127%). Geographical distribution can be seen in Figure 3.11 and Figure 3.12
Table 3.7: Tonnes of waste arisings sent to landspreading, from FDF member sites, by area, in 2008 and 2009
County Landspreading(tonnes)
2008 2009
Staffordshire 46,721 57,875
Shropshire and Herefordshire 40,032 38,403
South Yorkshire 38,936 36,142
South West Counties 34,391 34,022
Norfolk and Suffolk 28,047 30,897
Gloucestershire and Wiltshire 24,730 30,701
Oxon, Herts, Beds, Bucks and Berks 16,214 13,992
Cambridgeshire 15,275 12,723
Derbyshire and Nottinghamshire 12,101 13,730
Cumbria, County Durham and Northumberland 11,052 14,555
Greater Manchester 4,784 7,921
Northamptonshire 4,380 4,780
Kent and Essex 2,056 2,425
Northern Ireland 934 900
Cheshire and Merseyside 576 344
Lincolnshire 428 2,004
London 413 1,043
Leicestershire and Rutland 103 234
Scotland 20 20
Wales 0 1,160
Total 281,193 303,871

For Defra and the Food and Drink Federation 23
Figure 3.11: Tonnes of waste arisings sent to landspreading from FDF members sites, by area, in 2008
Key (indicative scale):
60,000 tonnes
30,000 tonnes 0

24 For Defra and the Food and Drink Federation
Figure 3.12: Tonnes of waste arisings sent to landspreading from FDF member sites, by area, in 2009
Key (indicative scale):
60,000 tonnes
30,000 tonnes 0

For Defra and the Food and Drink Federation 25
3.8 Thermal treatment
Thermal treatment with energy recovery was not a significantly used waste management route for the sites responding to this survey. Only 4.6% of the total waste arisings were treated in this manner in 2008. This decreased to 3.6% in 2009, with members seemingly opting for landspreading or higher recycling/composting routes. Leicestershire and Rutland sent the most waste to thermal treatment in both years, with a decrease from 13,000 tonnes to 9,000 tonnes within that period. Table 3.8 shows an increase in the number of areas with recovery via thermal treatment:
however, the actual tonnages involved are minimal, and all areas which sent over 1,000 tonnes to thermal treatment in 2008 have since reduced this tonnage. Excluding the three areas with no thermal treatment in 2008, and showing a small tonnage for 2009, Scotland is the only area which has seen a growth in waste to thermal treatment. Geographical distribution can be seen in Figure 3.13 and Figure 3.14, with Leicester and Rutland the clear ‘hotspot’ for thermal treatment of waste.
Table 3.8: Tonnes of waste arisings sent for thermal treatment with energy recovery from FDF members’ sites, by area, in 2008 and 2009
County Thermal treatment with energy recovery (tonnes)
2008 2009
Leicestershire and Rutland 13,003 9,491
Wales 4,592 3,988
Cambridgeshire 2,574 2,318
South Yorkshire 1,002 66
Kent and Essex 351 325
Oxon, Herts, Beds, Bucks and Berks 199 185
London 117 81
Scotland 30 474
South West Counties 18 0
Staffordshire 0 80
West Midlands 0 45
Lincolnshire 0 40
Total 21,886 17,093

26 For Defra and the Food and Drink Federation
Figure 3.13: Tonnes of waste arisings sent to thermal treatment (with energy recovery) from FDF member sites, by area, in 2008
Key (indicative scale):
14,000 tonnes
7,000 tonnes
0

For Defra and the Food and Drink Federation 27
Figure 3.14: Tonnes of waste arisings sent to thermal treatment (with energy recovery) from FDF member sites, by area, in 2009
Key (indicative scale):
14,000 tonnes
7,000 tonnes
0

28 For Defra and the Food and Drink Federation
3.9 Recovery/disposal routes for waste by country
In England the dominant waste recovery/disposal option for the responding sites was landspreading as shown in both Figure 3.15 and Figure 3.16. Scottish sites appeared to use recycling (more favoured in the waste hierarchy) as the key waste management pathway, while Northern Ireland typically sent waste to landfill. Only three recovery or disposal options were utilised in Northern Ireland, with recycling, landspreading and landfill the only pathways opted for by responding members. It is important to factor in sample size, however. Responses from Northern Ireland for this survey were low, so
individual site responses are likely to skew data slightly and this may not be an accurate representation of all food and drink manufacturing sites within the country. No single recovery/disposal route dominated in Wales, with roughly a quarter of the waste generated going to each of composting, thermal treatment and landfill in 2008. In 2009, there was a greater trend towards composting, the top tier option in the waste hierarchy, with both thermal treatment and landfill (mid- and lower- tier options) losing share.

For Defra and the Food and Drink Federation 29
Figure 3.15: Recovery/disposal routes for waste arisings by country for FDF member sites in 2008

30 For Defra and the Food and Drink Federation
Figure 3.16: Recovery/disposal routes for waste arisings by country for FDF member sites in 2009

For Defra and the Food and Drink Federation 31
4 By-products and surpluses
During manufacture of the ‘main’ product, additional co or by-products are often produced. Product returns and other ‘surpluses’ can also arise due for example change in customer demands. Where these materials are further utilised, for example in animal feed or redistributed to charities, they are not considered waste. For both years covered by this survey, over 340,000 tonnes of potential waste were prevented from entering the waste stream (Table 4.1) by being used for human consumption (e.g. surpluses given to charity) or as animal feed (e.g. by products). This avoidance of waste has a large environmental benefit for several reasons. Firstly, without waste there is no landfilling, with its associated greenhouse gas emissions. Secondly, some of the embodied energy used to create what is a high value end product and to acquire the raw material for it, is conserved. Resources that
would otherwise have been consumed (in the production of animal feed, for example) are also saved. However, it is still important to minimise surpluses and by-product creation which result from production inefficiencies. Figure 4.1 and Figure 4.2 show the tonnage of by-product and surpluses arising by geographic area for 2008 and 2009. The majority is by-product, though both Derbyshire and Nottinghamshire and Gloucestershire and Wiltshire showed no by-product generation in either year. Greater Manchester had the greatest tonnage of by- products and surpluses for both years, with over 73,000 tonnes generated in 2008, increasing by 12% to more than 82,000 tonnes by 2009. This was almost exclusively sent for animal feed, though a small proportion of surplus product was also apparent.
Table 4.1: Tonnes of by-products and surpluses from FDF member sites in 2008 and 2009
Year Animal feed Human
consumption via charity
Other Total (tonnes)
2008 341,828 171 5,966 347,965
2009 357,256 111 9,091 366,458

32 For Defra and the Food and Drink Federation
Figure 4.1: Tonnes of by-products and surpluses from FDF member sites, by area, in 2008
Key: tonnes (indicative scale)

For Defra and the Food and Drink Federation 33
Figure 4.2: Tonnes of by-products and surpluses from FDF member sites, by area, in 2009
Key: tonnes (indicative scale)

34 For Defra and the Food and Drink Federation
5 Trends in waste arisings
5.1 Trends in waste arisings and management
In order to create a like to like comparison with the previous survey data, a sub sample of sites providing arisings data for each of the three years was created and analysed. (Possible limitations of this approach are discussed in Section 5.2) A total of 115 sites fitted this criterion, and the aggregated tonnages are given in Table 5.1. There is a positive trend showing that, whilst total production has grown from 5.2 to 5.4 million tonnes per year (equivalent to a 3% increase), the quantity of waste produced has decreased by 16.5%. The waste produced has
therefore dropped from 0.06 tonnes per tonne of product, to 0.05 tonnes per tonne of product (Figure 5.1). This suggests that a decoupling of waste generation against production has taken place in line with the ‘more for less’ approach. Total waste avoided, measured according to tonnes of by-products and surpluses created, has also decreased. This suggests that the overall material input to create product has been minimised and possibly that manufacturing methods have moved towards leaner production rather than focussing on waste segregation. This is again in line with the waste hierarchy, with the preferred option being prevention rather than reuse, recycling or other recovery practices.
Table 5.1: Total production and waste arisings from FDF member sites providing data for 2006, 2008 and 2009 in tonnes
Year Total production
(tonnes) Total by-
products/surpluses(tonnes)
Total waste (excl byproducts/surpluses)
(tonnes)
2006 5,246,540 330,880 315,519
2008 5,255,394a 309,879 269,806
2009 5,401,461b 316,797 263,414
a This figure includes a small percentage of estimated production, taken from 2006 data, due to a small number of sites being wary over provision of
production data. b
As above.

For Defra and the Food and Drink Federation 35
Figure 5.1: Total waste produced per tonne of product from FDF member sites providing data for 2006, 2008 and 2009
Table 5.2: Use of recovery/disposal routes (in tonnes) by FDF member sites providing data for 2006, 2008 and 2009
Year AD Com-
posting Recycling
Other recycling
Land- spreading
Thermal trtmt (with
energy recovery)
Other recovery
Thermal trtmt (no
energy recovery)
Land-fill
Other disposal
Total (tonnes)
2006 21 13,851 107,748 637 99,428 2,493 5,721 2,284 63,984 14,819 315,519
2008 2,865 12,230 66,256 10,775 102,745 21,856 2,067 523 49,952 537 269,806
2009 4,625 20,971 61,861 10,374 111,634 16,534 996 196 35,940 283 263,414
Table 5.3: Waste arisings by type for FDF member sites providing data for 2006, 2008 and 2009
Year Total food waste Total packaging waste Total mixed waste Total waste
(tonnes) (t) (%) (t) (%) (t) (%)
2006 204,328 65 41,509 13 69,682 22 315,519
2008 168,660 63 48,455 18 52,691 20 269,806
2009 161,464 61 49,665 19 52,285 20 263,414 The 2008 survey to collect 2006 data did not originally set out to record the tonnages of by products and surpluses which do not enter the waste stream. However, many respondents included these tonnages, and therefore an incomplete figure was created, with a strong possibility that some respondents included these materials within the ‘recycling’ figure. This may partly explain the 39% drop in recycling between 2006 and 2008 (43% by 2009). However, the tonnage of by-products produced (the vast majority of which went to animal feed) was also greater in 2006 (see Figure 5.2). It is more likely, therefore, that the
reduction may in part be due to improvements in overall resource efficiency, leaving less tonnage requiring waste management. Figure 5.3 and Table 5.2 show that responding member sites appear to be moving towards more use of landspreading in recent years, with a greater proportion of food waste going to this recovery method than any other. Recycling has seen the greatest percentage loss, emphasising the move from top tier to middle tier of the waste hierarchy.
0
0.01
0.02
0.03
0.04
0.05
0.06
0.07
2006 2008 2009
Was
te p
er
ton
ne
pro
du
ct (
t)
Year

36 For Defra and the Food and Drink Federation
Figure 5.2: Tonnes of by-products and surpluses produced by FDF member sites providing data for 2006, 2008 and 2009
Figure 5.3: Use of recovery/disposal routes (in tonnes) by FDF member sites providing data for 2006, 2008 and 2009
0
50,000
100,000
150,000
200,000
250,000
300,000
350,000
2006 2008 2009
Ton
ne
s
Year
Animal feed
Charity or other surplus/byproduct
0
50,000
100,000
150,000
200,000
250,000
2006 2008 2009
Ton
ne
s
Year
Other disposal
Landfill
Thermal treatment (no energy recovery)
Other recovery
Thermal treatment (with energy recovery)
Landspreading
Other recycling
Recycling
Composting
AD

For Defra and the Food and Drink Federation 37
Figure 5.4: Breakdown of recovery/disposal routes for packaging waste arisings (in tonnes) from FDF member sites providing data for 2006, 2008 and 2009
No significant changes appear to have occurred regarding packaging waste disposal/ recycling/ recovery practices since 2006, though the tonnage of packaging waste has increased (see Figure 5.4). This may not necessarily be a negative trend, with greater segregation increasing ‘purer’ waste streams, allowing larger proportions of the total waste to be recycled. This may also be linked to the recorded increase in total production since 2006. The majority of packaging arisings are recycled, in each of the three survey years. A very small increase has been seen in composting of packaging waste, and this is perhaps a reflection of increasing treatment facility availability, though with tonnages ranging from 367 to 868 tonnes, this is still an infrequent recovery option.
Figure 5.5 shows a decrease in tonnage of mixed food and packaging waste arising, yet this is only notable when considering the 2006 data. The arisings for 2008 and 2009 are similar, with less than 500 tonnes difference between the two years. Whilst the dominant end route for mixed food and packaging waste continues to be landfill, the proportion of arisings sent for disposal in this manner has decreased each year, with increasing diversion to recycling and composting. There has been a small increase in thermal treatment with energy recovery and a reduction in thermal treatment without energy recovery.
0
10,000
20,000
30,000
40,000
50,000
60,000
2006 2008 2009
Ton
ne
s
Year
Other disposal
Landfill
Thermal treatment (no energy recovery)
Other recovery
Thermal treatment (with energy recovery)
Landspreading
Other recycling
Recycling
Composting
AD

38 For Defra and the Food and Drink Federation
Figure 5.5: Breakdown of recovery/disposal routes for mixed food and packaging waste arisings (in tonnes) from FDF member sites providing data for 2006, 2008 and 2009
5.2 Data limitations
For the 2010 survey there was a reduced number of responding member sites (149) compared to the 2008 survey (236). Therefore it was not possible to directly compare waste management trends for all sites. It is also important to recognise that being a snapshot survey of a sample of FDF members, the trends recorded are not necessarily a reflection of the
industry as a whole (see also Section 2.3). Due to the heterogeneity of the food and drink industry, it is not appropriate to make direct comparisons, such as average waste production per site or per tonne of product, between sites in different sub sectors. However analysing aggregate data from a sub sample of like-for-like sites can provide a useful comparison.
0
10,000
20,000
30,000
40,000
50,000
60,000
70,000
80,000
2006 2008 2009
Ton
ne
s
Year
Other disposal
Landfill
Thermal treatment (no energy recovery)
Other recovery
Thermal treatment (with energy recovery)
Landspreading
Other recycling
Recycling
Composting
AD

For Defra and the Food and Drink Federation 39
6 Conclusions
This survey shows that FDF is making good progress towards meeting its target of seeking to send zero food and packaging waste to landfill from 2015, part of its ‘Five-Fold Environmental Ambition’. Of the 481,000 tonnes waste produced in 2009 by the 149 responding sites, only 43,000 tonnes (9%) was sent to landfill, with 435,000 tonnes (90.3%) recovered or recycled in some manner. This was a significant improvement on both the 2006 and the 2008 data, where 16.5% and 12.5% of arisings were sent to landfill respectively. There were no substantial ‘hotspots’ for landfill; no area sent more than 5,000 tonnes to landfill in 2009; eight areas sent less than 1,000 tonnes. The majority of waste sent to landfill in both 2008 and 2009 was mixed food and packaging waste, which is similar to the findings of the first survey. Also the majority of the arisings occurred due to food waste yet only a small fraction (i.e. 1.7% in 2009) of this was landfilled. In both years, FDF members produced over 340,000 tonnes of by-products and surpluses, with a significant tonnage (approx 98% of total) going to animal feed. Analysis of the sub sample of 115 sites providing data for all three years suggested that a
decoupling of waste generation against production has taken place, in line with the ‘more for less’ approach. Actual waste arisings have decreased by 16.5% over the three years surveyed whilst production has increased over the period by 3%. A shift towards the middle tier of the waste hierarchy is apparent. As in 2006, landspreading was the dominant waste management option, its share actually increasing to 63% of all waste generated. Two areas used anaerobic digestion (AD) in 2009. The results show growth in uptake of AD, albeit from a modest base. There clearly remains ample opportunity for broader uptake of this technology. The previous report suggested that targeting waste segregation at source should be prioritised, to reduce the tonnage of mixed waste going to landfill. The latest survey data showed a decrease in mixed waste as a proportion of total waste arisings, suggesting that more segregation is occurring although there is still opportunity for improvement.

40 For Defra and the Food and Drink Federation
Appendix 1
Geographic areas allocated to given territories Site data from the following counties and cities were aggregated together to protect commercial sensitivity. County Territory
Cambridgeshire Cambridgeshire
Peterborough Cambridgeshire
Cheshire Cheshire and Merseyside
Halton Cheshire and Merseyside
Knowsley Cheshire and Merseyside
Liverpool Cheshire and Merseyside
Sefton Cheshire and Merseyside
St Helens Cheshire and Merseyside
Warrington Cheshire and Merseyside
Wirral Cheshire and Merseyside
Cumbria Cumbria, County Durham and Northumberland
Darlington Cumbria, County Durham and Northumberland
Durham Cumbria, County Durham and Northumberland
Gateshead Cumbria, County Durham and Northumberland
Hartlepool Cumbria, County Durham and Northumberland
Middlesbrough Cumbria, County Durham and Northumberland
Newcastle-upon-Tyne Cumbria, County Durham and Northumberland
North Tyneside Cumbria, County Durham and Northumberland
Northumberland Cumbria, County Durham and Northumberland
Redcar and Cleveland Cumbria, County Durham and Northumberland
South Tyneside Cumbria, County Durham and Northumberland
Stoc,000 tonneson-on-Tees Cumbria, County Durham and Northumberland
Sunderland Cumbria, County Durham and Northumberland
City of Derby Derbyshire and Nottinghamshire
Derbyshire Derbyshire and Nottinghamshire
Nottingham City Derbyshire and Nottinghamshire
Nottinghamshire Derbyshire and Nottinghamshire
Gloucestershire Gloucestershire and Wiltshire
Swindon Gloucestershire and Wiltshire
Wiltshire Gloucestershire and Wiltshire
Manchester Greater Manchester
Oldham Greater Manchester
Rochdale Greater Manchester
Stockport Greater Manchester
Tameside Greater Manchester
Trafford Greater Manchester
Hants Hants
Portsmouth Hants
Southampton Hants
Isle of Wight Isle of Wight
Essex Kent and Essex
Kent Kent and Essex
Medway Towns Kent and Essex
Southend-on-Sea Kent and Essex
Thurrock Kent and Essex
Blackburn with Darwen Lancashire
Blackpool Lancashire

For Defra and the Food and Drink Federation 41
County Territory
Bolton Lancashire
Bury Lancashire
Lancashire Lancashire
Salford Lancashire
Wigan Lancashire
City of Leicester Leicestershire and Rutland
Leicestershire Leicestershire and Rutland
Rutland Leicestershire and Rutland
Lincolnshire Lincolnshire
North East Lincolnshire Lincolnshire
North Lincolnshire Lincolnshire
Barking and Dagenham London
Barnet London
Bexley London
Brent London
Bromley London
Camden London
City of London London
Croydon London
Ealing London
Enfield London
Greenwich London
Hackney London
Hammersmith and Fulham London
Haringey London
Harrow London
Havering London
Hillingdon London
Hounslow London
Islington London
Kensington and Chelsea London
Kingston-upon-Thames London
Lambeth London
Lewisham London
Merton London
Newham London
Redbridge London
Richmond-upon-thames London
Southwark London
Sutton London
Tower Hamlets London
Waltham Forest London
Wandsworth London
Westminster London
Norfolk Norfolk and Suffolk
Suffolk Norfolk and Suffolk
East Riding of Yorkshire North Yorkshire
Kingston-upon-Hull North Yorkshire
North Yorkshire North Yorkshire
York North Yorkshire
Northamptonshire Northamptonshire
Antrim Northern Ireland
Ards Northern Ireland
Armagh Northern Ireland
Ballymena Northern Ireland
Ballymoney Northern Ireland

42 For Defra and the Food and Drink Federation
County Territory
Banbridge Northern Ireland
Belfast City Northern Ireland
Carrickfergus Northern Ireland
Castlereagh Northern Ireland
Coleraine Northern Ireland
Cookstown Northern Ireland
Craigavon Northern Ireland
Derry City Northern Ireland
Down Northern Ireland
Dungannon Northern Ireland
Fermanagh Northern Ireland
Larne Northern Ireland
Limavady Northern Ireland
Lisburn Northern Ireland
Magherafelt Northern Ireland
Moyle Northern Ireland
Newry and Mourne Northern Ireland
Newtownabbey Northern Ireland
North Down Northern Ireland
Omagh Northern Ireland
Strabane Northern Ireland
Bedfordshire Oxon, Herts, Beds, Bucks and Berks
Bracknell Forest Oxon, Herts, Beds, Bucks and Berks
Buckinghamshire Oxon, Herts, Beds, Bucks and Berks
Hertfordshire Oxon, Herts, Beds, Bucks and Berks
Luton Oxon, Herts, Beds, Bucks and Berks
Milton Keynes Oxon, Herts, Beds, Bucks and Berks
Oxon Oxon, Herts, Beds, Bucks and Berks
Reading Oxon, Herts, Beds, Bucks and Berks
Slough Oxon, Herts, Beds, Bucks and Berks
West Berkshire Oxon, Herts, Beds, Bucks and Berks
Windsor and Maidenhead Oxon, Herts, Beds, Bucks and Berks
Wokingham Oxon, Herts, Beds, Bucks and Berks
Aberdeen City Scotland
Aberdeenshire Scotland
Angus Scotland
Argyll and Bute Scotland
Clackmannanshire Scotland
Dumfries and Galloway Scotland
Dundee City Scotland
East Ayrshire Scotland
East Dunbartonshire Scotland
East Lothian Scotland
East Renfrewshire Scotland
Edinburgh City Scotland
Falkirk Scotland
Fife Scotland
Glasgow City Scotland
Highland Scotland
Inverclyde Scotland
Midlothian Scotland
Moray Scotland
North Ayrshire Scotland
North Lanarkshire Scotland
Orkney Islands Scotland
Perth and Kinross Scotland

For Defra and the Food and Drink Federation 43
County Territory
Renfrewshire Scotland
Scottish Borders Scotland
South Ayrshire Scotland
South Lanarkshire Scotland
Stirling Scotland
West Dunbartonshire Scotland
West Lothian Scotland
Western Isles Scotland
Herefordshire Shropshire and Herefordshire
Shropshire Shropshire and Herefordshire
Telford and Wrekin Shropshire and Herefordshire
Bath and North East Somerset South West Counties
Bournemouth South West Counties
Bristol South West Counties
Cornwall South West Counties
Devon South West Counties
Dorset South West Counties
North Somerset South West Counties
Plymouth South West Counties
Poole South West Counties
Somerset South West Counties
South Gloucestershire South West Counties
Torbay South West Counties
Barnsley South Yorkshire
Bradford South Yorkshire
Calderdale South Yorkshire
Doncaster South Yorkshire
Kirklees South Yorkshire
Leeds South Yorkshire
Rotherham South Yorkshire
Sheffield South Yorkshire
Wakefield South Yorkshire
Staffordshire Staffordshire
Stoke-on-Trent Staffordshire
Surrey Surrey
Brighton and Hove Sussex
East Sussex Sussex
West Sussex Sussex
Blaenau Gwent Wales
Bridgend Wales
Caerphilly Wales
Cardiff Wales
Carmarthenshire Wales
Ceredigion Wales
Conwy Wales
Denbighshire Wales
Flintshire Wales
Gwynedd Wales
Isle of Anglesey Wales
Merthyr Tydfil Wales
Monmouthshire Wales
Neath Port Talbot Wales
Newport Wales
Pembrokeshire Wales
Powys Wales

44 For Defra and the Food and Drink Federation
County Territory
Rhondda Cynon Taff Wales
Swansea Wales
Torfaen Wales
Vale of Glamorgan Wales
Wrexham Wales
Birmingham West Midlands
Coventry West Midlands
Dudley West Midlands
Sandwell West Midlands
Solihull West Midlands
Walsall West Midlands
Warwickshire West Midlands
Wolverhampton West Midlands
Worcestershire West Midlands

About the author:
Caroline Bartlett BSc (Hons) Caroline is a Research Consultant at Oakdene Hollins. Her degree in Environmental Biology gives her a great understanding of waste management techniques and barriers to recovery and recycling across many waste streams. In particular, Caroline’s expertise lies in textiles and food and drink, and previous work includes projects evaluating hospitality sector glass arisings, refillable beverage system opportunities and the economics of bulk wine importation. She also co-authored the previous report ‘Mapping waste in the food industry’, based on FDF member survey responses in 2008.
Disclaimer: Oakdene Hollins Ltd believes the content of this report to be correct as at the date of writing. The opinions contained in this report, except where specifically attributed, are those of Oakdene Hollins Ltd. They are based upon the information that was available to us at the time of writing. We are always pleased to receive updated information and opposing opinions about any of the contents. The listing or featuring of a particular product or company does not constitute an endorsement by Oakdene Hollins, and we cannot guarantee the performance of individual products or materials. This report must not be used to endorse, or suggest Oakdene Hollins’ endorsement of, a commercial product or service. We have prepared this report with all reasonable skill, care and diligence within the terms of the contract with the client. Although we have made all reasonable endeavours to ensure the accuracy of information presented in this report, we make no warranties in this respect. Factors such as prices and regulatory requirements are subject to change, and users of the report should check the current situation. In addition, care should be taken in using any of the cost information provided as it is based upon specific assumptions (such as scale, location, context, etc.). Clients should satisfy themselves beforehand as to the adequacy of the information in this report before making any decisions based on it.
