manufacturing excellence in a compound semiconductor...
TRANSCRIPT
Manufacturing Excellence in a Compound Semiconductor Fabrication Facility
Eugene Huang, Charles Dell, James Ploeger Motorola Semiconductor Products Sector
Compound Semiconductor One: CS-1 2100 East Elliot Road, Mail Drop EL609 Tempe, AZ 85284
Phone: 480-413-6370, FAX: 480-413-5748, Email: [email protected] Abstract Motorola’s 150mm Compound Semiconductor One (CS-1) fabrication facility serves as both a production and a development factory. It currently can provide a plethora of technologies; whether it is MESFET, pHEMT, HBT or HIGFET devices. The principles that CS-1’s Manufacturing team is guided by are 1) Speed of Execution and 2) High Quality. By adhering to these two principles, manufacturing can impact both the financial “top line” (sales / revenue) as well as the “bottom line” (sales minus operating expenses). This paper will focus on CS1’s speed of execution and the various ways that it was enhanced. I. INTRODUCTION Due to tremendous competition in the semiconductor market, companies have been in a cost efficient mode of operation. Everyone has been asked to “Do more with less”. For CS-1’s Manufacturing team (which is comprised of management, supervisors and associates), this has meant a 50% reduction in its labor force since Q3 2002. One challenge was to continue to maintain a high speed of execution which would yield such benefits as faster New Product Introduction (NPI), yield enhancement cycles of learning, increased output, potential for additional capacity and reduced inventory cost. Therefore, the first task was to develop a guiding vision for the manufacturing team that would meet the overall objective that is summed best by Dr. Goldratt in his book, “The Goal”. “The goal of a manufacturing organization is to make money… And everything else we do is a means to achieve the goal.” [1] Thus, the vision that was developed and implemented in the summer of 2003 encompassed two guiding principles: 1. Speed of Execution [primarily defined as Turns-to- WIP (T/W)] 2. High Quality (no human error) Turns-to-“Work in Process (WIP)” (T/W) is defined as the number of stages a wafer moves divided by the Beginning on Hand (BOH) inventory. Basically, the higher the T/W is, the greater the speed of execution becomes. T/W was the metric chosen versus Days per Mask Layer due to the backend (source via) processing that occurs. There are various causes that can impact a factory’s ability to achieve a high T/W. These can be broken up into the
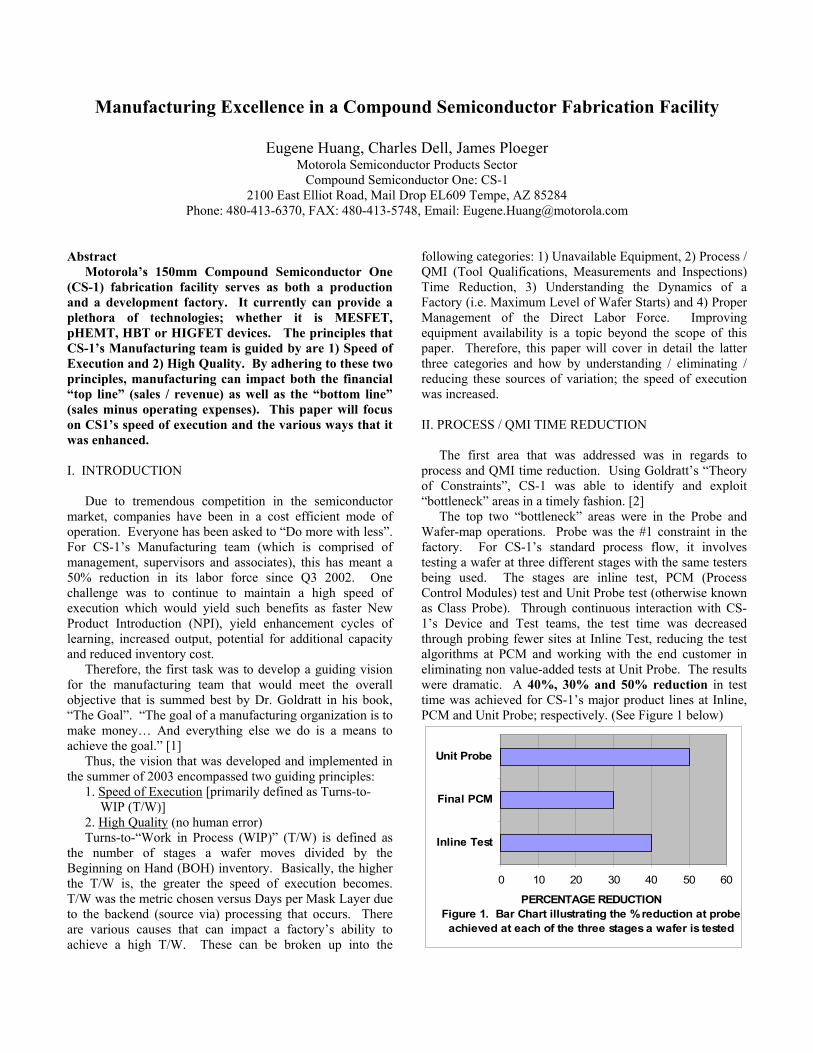
following categories: 1) Unavailable Equipment, 2) Process / QMI (Tool Qualifications, Measurements and Inspections) Time Reduction, 3) Understanding the Dynamics of a Factory (i.e. Maximum Level of Wafer Starts) and 4) Proper Management of the Direct Labor Force. Improving equipment availability is a topic beyond the scope of this paper. Therefore, this paper will cover in detail the latter three categories and how by understanding / eliminating / reducing these sources of variation; the speed of execution was increased. II. PROCESS / QMI TIME REDUCTION The first area that was addressed was in regards to process and QMI time reduction. Using Goldratt’s “Theory of Constraints”, CS-1 was able to identify and exploit “bottleneck” areas in a timely fashion. [2] The top two “bottleneck” areas were in the Probe and Wafer-map operations. Probe was the #1 constraint in the factory. For CS-1’s standard process flow, it involves testing a wafer at three different stages with the same testers being used. The stages are inline test, PCM (Process Control Modules) test and Unit Probe test (otherwise known as Class Probe). Through continuous interaction with CS-1’s Device and Test teams, the test time was decreased through probing fewer sites at Inline Test, reducing the test algorithms at PCM and working with the end customer in eliminating non value-added tests at Unit Probe. The results were dramatic. A 40%, 30% and 50% reduction in test time was achieved for CS-1’s major product lines at Inline, PCM and Unit Probe; respectively. (See Figure 1 below)
0 10 20 30 40 50 60
Inline Test
Final PCM
Unit Probe
PERCENTAGE REDUCTIONFigure 1. Bar Chart illustrating the % reduction at probe
achieved at each of the three stages a wafer is tested
Likewise, the same methodology of identification and exploitation was used for the second “bottleneck” operation: Wafer-map. CS-1 utilizes both a manual and automated inspection (August tool) after the wafer has completed processing to ensure that “detrimental” defects are properly screened out. This operation needed to be improved from a predictability and efficiency standpoint. In terms of the automated portion of the operation, CS-1’s Manufacturing team worked with the Defectivity group with such activities as increasing the scan speed. These enhancements have resulted in a 21% cycle-time reduction at the Wafer-map operation. Continued short and long term activities are still being worked on with such actions as exploring automating portions of the manual inspection and granting additional August tool privileges to the associates. From a manufacturing perspective; tool qualifications, measurements and inspections are regarded as non-value added operations. A regular meeting was created with the Process groups to understand where reductions could occur. With the assistance of the Industrial Engineering group, a model was created that quantified human and tool time for each of the toolsets. (See Figure 2 below) This was beneficial in creating a list of the top process areas to address first. This did not yield as much of an impact as exploiting the above “bottlenecks”, but did result in QMI reductions on certain toolsets (i.e. Metal and CVD). Through cooperation with the Device, Process and Defectivity teams, reductions in “bottleneck” areas and QMI were achieved. This resulted in an increase in the speed of execution.
III. UNDERSTANDING THE DYNAMICS OF A FACTORY A good understanding of the dynamics of a factory is definitely an area that can impact the speed of execution. Naturally, each factory will be different based on a multitude of factors. For instance; the type of technology, equipment set and personnel all do play a role. However, the methodology is the same from the operations management perspective. In manufacturing’s case; the ability to design, operate and improve the system that will create and deliver its end products and services is desired. [3]
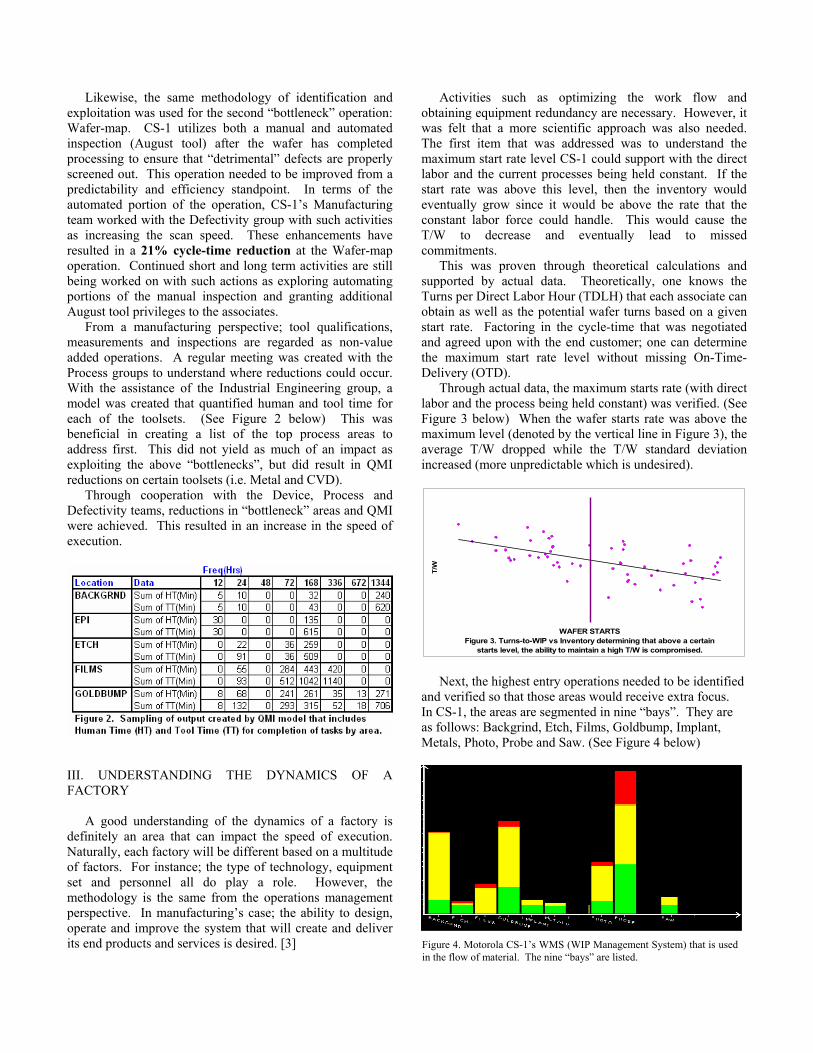
Activities such as optimizing the work flow and obtaining equipment redundancy are necessary. However, it was felt that a more scientific approach was also needed. The first item that was addressed was to understand the maximum start rate level CS-1 could support with the direct labor and the current processes being held constant. If the start rate was above this level, then the inventory would eventually grow since it would be above the rate that the constant labor force could handle. This would cause the T/W to decrease and eventually lead to missed commitments. This was proven through theoretical calculations and supported by actual data. Theoretically, one knows the Turns per Direct Labor Hour (TDLH) that each associate can obtain as well as the potential wafer turns based on a given start rate. Factoring in the cycle-time that was negotiated and agreed upon with the end customer; one can determine the maximum start rate level without missing On-Time-Delivery (OTD). Through actual data, the maximum starts rate (with direct labor and the process being held constant) was verified. (See Figure 3 below) When the wafer starts rate was above the maximum level (denoted by the vertical line in Figure 3), the average T/W dropped while the T/W standard deviation increased (more unpredictable which is undesired).
WAFER STARTSFigure 3. Turns-to-WIP vs Inventory determining that above a certain
starts level, the ability to maintain a high T/W is compromised.
T/W
Next, the highest entry operations needed to be identified and verified so that those areas would receive extra focus. In CS-1, the areas are segmented in nine “bays”. They are as follows: Backgrind, Etch, Films, Goldbump, Implant, Metals, Photo, Probe and Saw. (See Figure 4 below)
Figure 4. Motorola CS-1’s WMS (WIP Management System) that is used in the flow of material. The nine “bays” are listed.
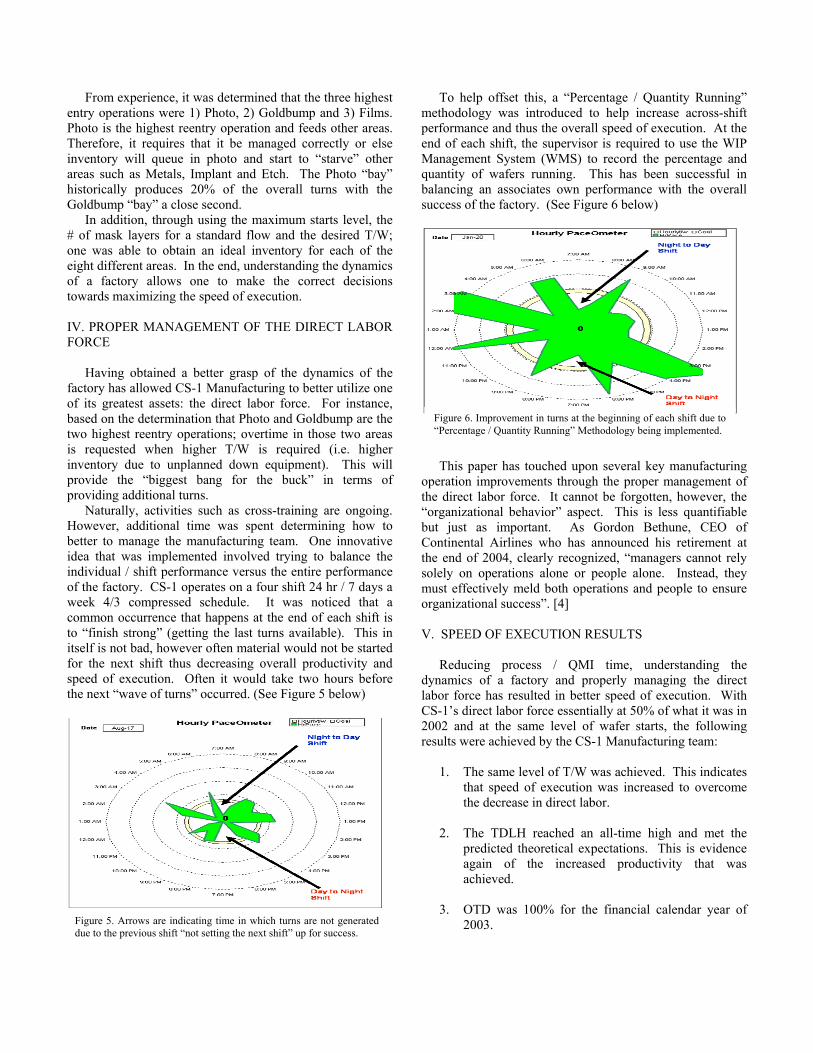
From experience, it was determined that the three highest entry operations were 1) Photo, 2) Goldbump and 3) Films. Photo is the highest reentry operation and feeds other areas. Therefore, it requires that it be managed correctly or else inventory will queue in photo and start to “starve” other areas such as Metals, Implant and Etch. The Photo “bay” historically produces 20% of the overall turns with the Goldbump “bay” a close second. In addition, through using the maximum starts level, the # of mask layers for a standard flow and the desired T/W; one was able to obtain an ideal inventory for each of the eight different areas. In the end, understanding the dynamics of a factory allows one to make the correct decisions towards maximizing the speed of execution. IV. PROPER MANAGEMENT OF THE DIRECT LABOR FORCE Having obtained a better grasp of the dynamics of the factory has allowed CS-1 Manufacturing to better utilize one of its greatest assets: the direct labor force. For instance, based on the determination that Photo and Goldbump are the two highest reentry operations; overtime in those two areas is requested when higher T/W is required (i.e. higher inventory due to unplanned down equipment). This will provide the “biggest bang for the buck” in terms of providing additional turns. Naturally, activities such as cross-training are ongoing. However, additional time was spent determining how to better to manage the manufacturing team. One innovative idea that was implemented involved trying to balance the individual / shift performance versus the entire performance of the factory. CS-1 operates on a four shift 24 hr / 7 days a week 4/3 compressed schedule. It was noticed that a common occurrence that happens at the end of each shift is to “finish strong” (getting the last turns available). This in itself is not bad, however often material would not be started for the next shift thus decreasing overall productivity and speed of execution. Often it would take two hours before the next “wave of turns” occurred. (See Figure 5 below)
To help offset this, a “Percentage / Quantity Running” methodology was introduced to help increase across-shift performance and thus the overall speed of execution. At the end of each shift, the supervisor is required to use the WIP Management System (WMS) to record the percentage and quantity of wafers running. This has been successful in balancing an associates own performance with the overall success of the factory. (See Figure 6 below)
This paper has touched upon several key manufacturing operation improvements through the proper management of the direct labor force. It cannot be forgotten, however, the “organizational behavior” aspect. This is less quantifiable but just as important. As Gordon Bethune, CEO of Continental Airlines who has announced his retirement at the end of 2004, clearly recognized, “managers cannot rely solely on operations alone or people alone. Instead, they must effectively meld both operations and people to ensure organizational success”. [4] V. SPEED OF EXECUTION RESULTS Reducing process / QMI time, understanding the dynamics of a factory and properly managing the direct labor force has resulted in better speed of execution. With CS-1’s direct labor force essentially at 50% of what it was in 2002 and at the same level of wafer starts, the following results were achieved by the CS-1 Manufacturing team:
1. The same level of T/W was achieved. This indicates that speed of execution was increased to overcome the decrease in direct labor.
2. The TDLH reached an all-time high and met the
predicted theoretical expectations. This is evidence again of the increased productivity that was achieved.
3. OTD was 100% for the financial calendar year of
2003.
Figure 5. Arrows are indicating time in which turns are not generated due to the previous shift “not setting the next shift” up for success.
Figure 6. Improvement in turns at the beginning of each shift due to “Percentage / Quantity Running” Methodology being implemented.

VI. CONCLUSIONS In an effort to increase Motorola CS-1’s speed of execution, several different areas (Process / QMI time reduction, understanding the dynamics of a factory and proper management of the direct labor force) were investigated by the manufacturing team. A systematic approach was used in identifying, understanding and implementing solutions. The primary manufacturing enhancements included:
a) Up to a 50% time reduction at Probe was achieved through teamwork with the CS-1 Device and Test groups.
b) A 21% cycle-time improvement was achieved at
Wafer-map, which was the other “bottleneck” area identified.
c) Through cooperation with the CS-1 Process groups,
QMI was reduced in several areas in the factory.
d) With the current manufacturing direct labor force and similar processes, the maximum wafer start level was determined to maintain the required T/W needed to meet FOTD.
e) The three highest reentry operations in the factory
were identified (Photo, Goldbump, Films) with the maximum inventory level determined in each of three areas before overtime was required to continue the needed T/W.
f) Innovative ideas such as the “Percentage / Quantity
Running” methodology was implemented to better utilize the manufacturing team.
ACKNOWLEDGMENTS The authors would like to thank the entire CS-1 organization (Device, Defectivity, Process, Industrial Engineering groups). In particular, thanks are due Steve Veloudos for his work in creating the QMI model and the manufacturing personnel (supervisors and associates) who balance the many needs that are placed on them. REFERENCES [1] E. M. Goldratt, “The Goal”, North River Press, Inc, p. 59, 1992. [2] E. M. Goldratt, “The Goal”, North River Press, Inc, p. 301, 1992. [3] R. B. Chase, F. R. Jacobs and Nicolas J. Aquilano, “Operations Management for Competitive Advantage”, McGraw-Hill/Irwin, p.19, 2004. [4] G. Moorhead and R. W. Griffin, “Organizational Behavior”, Houghton Mifflin Company, p. 29, 2001. ACRONYMS CS-1: Compound Semiconductor One MESFET: Metal Semiconductor Field Effect Transistor pHEMT: Pseudomorphic High Electron Mobility Trans. HBT: Heterojunction Bipolar Transistor HIGFET: Heterostructure Insulated-Gate FET NPI: New Product Introduction WIP: Work in Process T/W: Turns-to-WIP BOH: Beginning on Hand QMI: Qualifications, Measurements and Inspections PCM: Process Control Modules TDLH: Turns per Direct Labor Hour OTD: On-Time Delivery WMS: WIP Management System