manitowoc co incd1lge852tjjqow.cloudfront.net/cik-0000061986/1bb5f3d… · · 2015-11-18bottling...
TRANSCRIPT

FORM 10-K
MANITOWOC CO INC
(Annual Report)
Filed 3/1/1999 For Period Ending 12/31/1998
Address P O BOX 66
MANITOWOC, Wisconsin 54221-0066
Telephone 920-684-4410
CIK 0000061986
Industry Constr. & Agric. Machinery
Sector Capital Goods
Fiscal Year 12/31

UNITED STATES SECURITIES AND EXCHANGE COMMISSION
Washington D.C. 20549
FORM 10-K
[X] ANNUAL REPORT PURSUANT TO SECTION 13 OR 15(d) OF THE SECURITIES
EXCHANGE ACT OF 1934
For the fiscal year ended December 31, 1998
[_] TRANSITION REPORT PURSUANT TO SECTION 13 OR 15(d) OF THE SECURITIES
EXCHANGE ACT OF 1934
For the transition period from ________ to ________
Commission File Number 1-11978
THE MANITOWOC COMPANY, INC.
(Exact name of registrant as specified in its charter)
500 South 16th Street, Manitowoc, Wisconsin 54220
(Address of Principal Executive Offices)(Zip Code)
Registrant's Telephone Number, Including Area Code: (920) 684-4410
Securities Registered Pursuant to Section 12(b) of the Act:
Common Stock, $.01 Par Value New York Stock Exchange
(Title of Each Class) (Name of Each Exchange on Which Registered)
Common Stock Purchase Rights
Securities Registered Pursuant to Section 12(g) of the Act:
Indicate by check mark whether the registrant: (1) has filed all
Wisconsin 39-0448110 --------------------------------------------------- ------------------------ (State or other jurisdiction of (I .R.S. Employer incorporation or organization) Ident ification Number)

reports required to be filed by Section 13 or 15(d) of the Securities
Exchange Act of 1934 during the preceding 12 months (or for such shorter
period that the registrant was required to file such reports), and (2) has
been subject to such filing requirements for the past 90 days.
YES [ X ] No [ ]
Indicate by check mark if disclosure of delinquent filers pursuant to
Item 405 of Regulation S-K is not contained herein, and will not be
contained, to the best of registrant's knowledge, in definitive proxy or
information statements incorporated by reference in Part III of this Form
10-K or any amendment to this Form 10-K. [ X ]
The Aggregate Market Value on January 29, 1999, of the registrant's
Common Stock held by non-affiliates of the registrant was $658,746,165
based on the $39.88 per share average of high and low sale prices on that
date.
The number of shares outstanding of the registrant's Common Stock as
of January 29, 1999 the most recent practicable date, was 17,305,525.
DOCUMENTS INCORPORATED BY REFERENCE
Portions of registrant's Annual Report to Shareholders for the period
ended December 31, 1998 (the "1998 Annual Report"), are incorporated by
reference into Parts I and II of this report. Portions of the registrant's
Proxy Statement, to be prepared and filed for the Annual Meeting of
Shareholders, dated March 15, 1999 (the "1999 Proxy Statement"), are
incorporated by reference in Part III of this report.
See Index to Exhibits.
PART I
Item 1. Business
GENERAL

The Manitowoc Company, Inc. (the "Company" or "Manitowoc"), a
Wisconsin corporation, is a diversified, capital goods manufacturer
headquartered in Manitowoc, Wisconsin. Founded in 1902, the Company is
principally engaged in: a) the design and manufacture of commercial ice
machines, ice/beverage dispensers and refrigeration products for the
foodservice, lodging, convenience store, healthcare and the soft-drink
bottling and dispensing industries; (b) the design and manufacture of
cranes and related products which are used by the energy, construction,
mining and other industries; and (c) ship-repair, conversion, and new
construction services for the maritime industry. The Company currently
operates a large-crane manufacturing facility and an ice machine and reach-
in refrigerator/freezer manufacturing facility in Manitowoc, Wisconsin; six
refrigeration products facilities located in Tennessee, Nevada, and
Wisconsin; an ice/beverage dispenser manufacturing facility in Indiana; a
dispensing valve manufacturing facility in Oregon; ship repair yards in
Sturgeon Bay, Wisconsin and Toledo and Cleveland, Ohio; a crane re-
manufacturing facility in Bauxite, Arkansas; a crane replacement parts
manufacturing facility in Punxsutawney, Pennsylvania and Pompano Beach,
Florida; and boom truck crane operations in Georgetown, Texas and York,
Pennsylvania.
For information relating to the Company's lines of business and
industry segments, see "Management's Discussion and Analysis of Results of
Operations and Financial Condition", "Eleven-Year Financial Summary and
Business Segment Information", Note 1 - "Research and Development" and Note
16 to Consolidated Financial Statements on pages 24-29, 30-31, 37, and 42,
respectively, of the 1998 Annual Report, which are incorporated herein by
reference.
PRODUCTS AND SERVICES
Foodservice

The Foodservice Products business segment designs, manufactures, and
markets commercial ice cube machines, ice storage bins, ice/beverage
dispensers, and related accessories including water filtration systems,
reach-in and walk-in refrigerators and freezers, refrigerated undercounters
and food prep tables, private label residential refrigerator/freezers,
post-mix beverage dispensing valves, compressor racks and modular
refrigeration systems. Serving the needs of foodservice, lodging,
hospitality, convenience store, and healthcare operations worldwide, the
Company has captured a leading percentage of the commercial ice cube
machine, reach-in and walk-in refrigerator market.
Several models of automatic ice cube making and dispensing machines
are designed, manufactured and marketed by Manitowoc Ice, Inc. Offering
daily production capacities from 160 to 1,890 pounds, Manitowoc ice
machines are complemented by storage bins with capacities from 150 to 760
pounds; countertop ice and beverage dispensers with capacities to 160
pounds; floor-standing ice dispensers with capacities to 180 pounds; and
optional accessories such as water filters and ice baggers. The reach-in
refrigerators and freezers are available in one, two or three-door models
that provide gross storage capacities of 23.1, 47.8 and 73.7 cubic feet,
respectively. All units feature patented, top-mount, drop-in refrigeration
modules that operate with environmentally friendly HFC refrigerants.
In September 1997, Manitowoc Ice, Inc. introduced its new Q-Series
model. The new models set an industry standard for aesthetic design and
incorporate plastic and stainless steel components for added durability and
corrosion resistance. In addition, all "Q" models use environmentally
friendly refrigerants. Previously during 1996, Manitowoc Ice, Inc.
introduced the J-Series ice-cube machines that feature a single evaporator
rather than two that were used in earlier models. This improves
reliability, simplifies maintenance, and reduces operating cost. All J-

Series models also feature HFC refrigerants and the patented self-cleaning
system, which cleans and sanitizes our ice machines at a flip of a switch.
An automated self-cleaning system is also available as an option.
On January 8, 1999, the company completed its acquisition of
Purchasing Support Group (PSG). PSG is a systems integrator, with
nationwide distribution of backroom equipment and support system
components. It serves the beverage needs of restaurants, convenience
stores and other outlets. PSG operates in the Northeast and Atlantic Coast
regions, as well as in portions of Arizona, California, Florida, Georgia
and Nevada. This acquisition is expected to improve the distribution of
Manitowoc's beverage dispensing equipment and open new markets.
On September 9, 1998, Manitowoc acquired a 50% ownership interest in
Fabbrica Apparecchiatture per Produzione di Ghiaccia S.r.L. (F.A.G.), and
an option to purchase an additional 30% ownership over the next five years.
This Milan, Italy-based company produces Icetronic and Compact brand ice
makers and private label machines, with capacities between 22-132 pounds
per day. The acquisition gives Manitowoc a manufacturing base in Europe
and broadens its product offering to include smaller models, which are more
appropriate for European and developing markets.
On October 31, 1997, the Company acquired substantially all of the net
assets and business of SerVend International, Inc. ("SerVend") from SerVend
and its affiliate, Fischer Enterprises, Ltd. SerVend is one of the world's
largest manufacturers of ice/beverage dispensers and dispensing valves for
the soft drink industry. Its customers include many of the major quick-
service restaurant chains, convenience stores, and soft-drink bottlers in
the nation. SerVend is headquartered in Sellersburg, Indiana. It has one
manufacturing facility in Sellersburg and another in Portland, Oregon, and
employs about 300 persons.
Effective December 1, 1995, the Company completed the purchase of The
Shannon Group, Inc. The companies acquired in the acquisition were Kolpak,

McCall, Tonka and Kolpak Manufacturing Co. In December 1997, the Company
sold Tonka, its wood-rail walk-in refrigerator/freezers manufacturer in
Greeneville, TN. Kolpak and McCall are manufacturers of commercial
refrigerators, freezers and related products, ranging from small under-
counter units to 300,000 square foot refrigerated warehouses. Among their
wide range of products, Kolpak and McCall are best known for their foamed-
in-place walk-in refrigeration units, refrigerated food-prep tables, reach-
in refrigerator/freezers and modular refrigeration systems. Kolpak and
McCall supply walk-in and reach-in refrigerator/freezers to many of the
leading restaurant and grocery chains in the United States. Kolpak
Manufacturing Co. produces the General Electric line of Monogram
residential refrigerator/freezers.
For additional information on acquisitions, see Note 11 to
Consolidated Financial Statements on page 40 of the 1998 Annual Report,
which is incorporated herein by reference.
Since 1995, the Company has had an arrangement with a joint-venture
partner, Hangzhou Household Electric Appliance Industrial Corporation, to
produce ice machines in China. The joint-venture factory produces the
Company's new model QM-20 ice machine. The QM-20 produces 30 pounds of ice
per day. It was developed to meet the needs of customers in overseas
markets that do not require the 160 to 1,890 pound daily outputs of the
standard ice making models.
The Foodservice Products business segment sales are made from the
Company's inventory and sold worldwide through independent wholesale
distributors, chain accounts, and government agencies. The distribution
network now extends to 80 distributors in 70 countries within Western
Europe, the Far East, the Middle East, the Near East, Latin America, North
America, the Caribbean, and Africa. A new distribution facility in
Rotterdam, Holland has enabled the Company to increase sales of ice and
refrigerated foodservice equipment in Europe.
Since sales are made from the Company's inventory, orders are
generally filled within 24 to 48 hours. The backlog for unfilled orders
for Foodservice Products at December 31, 1998 and 1997 were not
significant.
Cranes and Related Products
The Company designs and manufactures a diversified line of crawler and
truck-mounted lattice boom cranes, hydraulically powered telescopic boom
trucks, rough-terrain forklifts, and material handling equipment, which
are sold under the "Manitowoc", "Manitex", "USTC", and "West-Manitowoc"
names for use by the energy, construction, mining, pulp and paper, and
other industries. The Company also specializes in crane rebuilding and
remanufacturing services, aftermarket replacement parts for
cranes and excavators and industrial repair and rebuilding services for
metal-forming, scrapyard and recycling equipment, which are sold under the
"Femco" name. Many of the Company's customers purchase one crane together
with several options to permit use of the crane in various lifting
applications and other operations. Various crane models combined with
available options have lifting capacities ranging from approximately 10 to
1,500 U.S. tons and excavating capacities ranging from 3 to 15 cubic yards.
The Company has developed a line of hydraulically-driven,
electronically-controlled M-Series crawler cranes. M-Series cranes are
easier to transport, operate and maintain, and are being more productive in
a number of applications. Six models, along with various attachments, have
been introduced with lifting capacities ranging from 65 to 1,500 U.S.
tons.
In 1998, Manitowoc Cranes introduced the 220-ton 777T lattice boom
truck crane which is roadable in all 50 states. This truck-mounted crane
can be driven to virtually any jobsite, be erected without the aid of an
assist crane, and be ready to work in a matter of hours.

In 1997, Manitowoc Cranes introduced the Model-777 lattice-boom
crawler crane that offers a lifting capacity between approximately 175 and
200 U.S. tons. One of the 777's more unique features is its boom hoist,
which consists of two double-acting hydraulic cylinders that connect its
moving mast to the rotating bed. Using hydraulic cylinders to control the
boom angle increases boom-raising speed, reduces maintenance, and
simplifies machinery layout, compared with the commonly used drum-type boom
hoist.
During 1996, Manitowoc Cranes introduced the Model-888. The 888 is a
lattice boom crawler crane with a lifting capacity of 230 U.S. tons.
Because of its innovative design, the 888 will self-assemble and be ready
to work on a jobsite in as little as one hour. Other cranes of similar
size and configuration take many more hours to assemble before they can be
put to work.
Manitowoc introduced two innovative attachments for the highly
successful Model 888 during 1996. The 888 RINGER is a 45-foot diameter
attachment that boosts the 888's nominal capacity to 660 U.S. tons. For
long-reach applications, the 888 can also be rigged with a luffing-jib
attachment that delivers a 105,500-pound maximum capacity and allows the
888 to operate with a maximum combination of 370 feet of boom and luffing
jib.
In addition, Manitowoc Cranes plans to introduce the Model 21000 in
1999. The Model 21000 is the largest mobile crane Manitowoc Cranes has
ever built with a capacity of 1,000 U.S. tons.
To serve the growing market of the smaller independent contractors and
rental-fleet customers who need smaller, less complicated, easily
transportable, and more versatile cranes, West-Manitowoc has developed a
new line of value-priced cranes with those characteristics. The first of
these, the 100-ton lifting capacity Model-222 crane, formerly known as the
West-100, has successfully captured a large portion of the rental market

for self-erecting cranes. During 1997, West-Manitowoc introduced the
222EX, a self-erecting crawler crane that will serve the specialized needs
of bridge and foundation contractors. West further broadened its product
line in 1998 by introducing the Model-111, a 65-ton crawler crane designed
to serve the varied demands of the general construction market. During
1998, West-Manitowoc was consolidated into Manitowoc Cranes.
During 1998, Manitex introduced its new Model 22101S boom truck, which
is the highest capacity boom truck ever mounted on a single rear-axle
chassis, and the 38-ton Model 38100S boom truck, which is the highest
capacity boom truck in the Manitex "S" series fleet.
Femco Machine Co., acquired in 1994, is a manufacturer of parts for
cranes, draglines, and other heavy equipment. Femco is located in
Punxsutawney, Pennsylvania and Pompano Beach, Florida.
Femco and Manitowoc Re-Manufacturing, located in Bauxite, Arkansas,
together form the Aftermarket Group. These companies rebuild and
remanufacture used cranes, both Manitowoc and non-Manitowoc units, for
owners who want to add value to their existing cranes. Femco's existing
South Florida operation is ideally positioned to serve the large Latin
American market where used cranes are the order of the day.
In February, 1996, the Company sold Orley Meyer, the Wisconsin-based
unit which produced overhead cranes of up to 50-ton capacity. Although
Orley Meyer was a profitable and well-run operation, its product line was
outside the Company's core business interests.
The Company's cranes and related products are sold throughout North
America and foreign countries by independent distributors, and by Company-
owned sales subsidiaries located in Mokena, Illinois, and Northampton,
England. In July, 1996, the Company sold its sales subsidiary in Benicia,
California. During calendar 1995, the Company sold its sales subsidiaries
in Long Island City, New York; LaMirada, California; Seattle, Washington;
and Chur, Switzerland.

Distributors generally do not carry inventories of new cranes, except
for the smaller truck cranes. Most distributors maintain service
facilities and inventories of replacement parts. Company employed service
representatives usually assist customers in the initial set-up of new
cranes.
The Company does not generally provide financing for either its
independent distributors or their customers; however, dealers frequently
assist customers in arranging financing and may accept used cranes as
partial payment on the sale of new cranes.
See Note 16 to Consolidated Financial Statements on page 42 of the
1998 Annual Report with respect to export sales, which is incorporated
herein by reference. Such sales are usually made to the Company's foreign
subsidiaries or independent distributors, in addition to sales made to
domestic customers for foreign delivery. Foreign sales are made on Letter
of Credit or similar terms.
The year-end backlog of crane products includes orders which have been
placed on a production schedule, and those orders which the Company has
accepted and which are expected to be shipped and billed during the next
year. The backlog of unfilled orders for cranes and related products at
December 31, 1998 approximated $144.1 million, as compared with $149.1
million a year earlier. The decrease is primarily due to the faster order
fill rates achieved during 1998, which meant the backlog was being worked
off more quickly than in previous years.
Marine
The Company had been a shipbuilder since its inception in 1902. For
almost seven decades, all shipbuilding operations were conducted in
Manitowoc, Wisconsin. Two adjoining shipyards in Sturgeon Bay, Wisconsin,
were acquired in 1968 and 1970, and all shipbuilding activities were
transferred to those facilities.

In January, 1992, the Company acquired substantially all the assets of
Merce Industries, Inc. Merce Industries, Inc. operated the ship repair
facility owned by the Port Authority of Toledo, Ohio, and similar
operations in Cleveland, Ohio. Included with the acquisition was the
assumption of a lease agreement with the Port Authority for the ship repair
facilities.
The Marine Group (made up of Bay Shipbuilding Co. (BSC), Toledo
Shiprepair Co., and Cleveland Shiprepair Co.) dry-docks and services
commercial vessels of all sizes, including 1,000-foot super carriers, the
largest vessels sailing the Great Lakes. The Marine Group's capabilities
include planned and emergency maintenance, vessel inspections, five-year
surveys, conversions, repowering, and retrofitting plus repair service for
hulls, turbines, boilers, propulsion systems and automated cargo/ballasting
systems. To reduce seasonality, the Marine Group has begun to perform non-
marine industrial repair during the summer months.
During 1998, BSC was awarded a contract to build a twin-hull, ocean-
going tank barge for use by Mobil Oil Corporation. Scheduled to enter
service in early 2000, this 140,000-barrel barge will haul grade A refined
petroleum products, including gasoline, jet fuel, and distillates, to major
metropolitan markets along the Eastern Seaboard and Hudson River.
During 1997, BSC took on the project of converting a bulk carrier, the
J. L. Mauthe, into a tug/barge configuration. This conversion was
completed in January 1998. In 1996, BSC completed construction of a self-
unloading cement barge for a Great Lakes customer. BSC intends to pursue
these types of projects with other Great Lakes customers.
The year-end backlog for the marine segment includes repair and
maintenance work presently scheduled at the shipyard which will be
completed in the next year. At December 31, 1998, the backlog approximated
$9.1 million (not including construction projects), compared to $7.9
million one year ago.

Raw Materials and Supplies
The primary raw material used by the Company is structural and rolled
steel, which is purchased from various domestic sources. The Company also
purchases engines and electrical equipment and other semi- and fully-
processed materials. It is the policy of the Company to maintain, wherever
possible, alternate sources of supply for its important materials and
parts. The Company maintains inventories of steel and other purchased
material.
Patents, Trademarks, Licenses
The Company owns a number of United States and foreign patents
pertaining to its crane and foodservice products, and has presently pending
applications for patents in the United States and foreign countries. In
addition, the Company has various registered and unregistered trademarks
and licenses which are of material importance to the Company's business.
While the Company believes its ownership of this intellectual property is
adequately protected in customary fashions under applicable law, no single
patent, trademark or license is critical to the company's overall business.
Seasonality
Typically, the second quarter represents the Company's best quarter in
all of the business segments. Since the summer brings along warmer weather,
there is an increase in the use of ice machines. As a result, distributors
build inventories during the second quarter for the increased demand. In
the Cranes and Related Products segment, summer also represents the main
construction season. Customers require new machines, parts, and service in
advance of that season. With respect to the Marine segment, the Great Lakes
shipping industry's sailing season is normally May through November. Thus,
barring any emergency groundings, the majority of repair and maintenance

work is performed during the winter months and the work is typically
completed during the first and second quarter of the year.
Competition
All of the Company's products are sold in highly competitive markets.
Competition is at all levels, including price, service and product
performance.
Within the ice machine division, there are several manufacturers with
whom the Company competes. The primary competitors include Scotsman
Industries (tradename Scotsman and Crystal Tips), Prospect Heights,
Illinois; Welbilt Company (tradename Ice-O-Matic), New Hyde Park, New York;
and Hoshizaki American, Inc. (tradename Hoshizaki), Peachtree City,
Georgia. The Company is the leading, low-cost, producer of ice machines in
North America.
The list of competitors for the refrigeration products line include
Beverage Air, Spartanburg, South Carolina; The Delfield Company, Mt.
Pleasant, Michigan; Traulsen & Company, Inc., College Point, New York; True
Food Service Company, O'Fallon, Missouri; Masterbilt, New Albany,
Mississippi; and American Panel, Ocala, Florida. The Company is one of the
leading producers of small undercounter refrigeration units and large
refrigerated warehouses as well as a supplier of walk-in
refrigerator/freezers to many of the leading restaurant and grocery chains
in the United States.
Competitors within the beverage dispenser/dispensing valves market
include IMI Cornelius, Anoka, Minnesota, and Lancer Corporation, San
Antonio, Texas. The Company is one of the leading suppliers of fountain
equipment and dispensing valves used by soft-drink bottlers.
With respect to crawler cranes, there are numerous domestic and
foreign manufacturers of cranes with whom the Company competes, including
Link Belt Construction Equipment Co., a subsidiary of Sumitomo Corporation,

Tokyo, Japan; Kobelco, Kobe Steel, Ltd., Tokyo, Japan; Mannesmann Demag
Baumaschinen, Zweibrucken, West Germany; Liebherr-Werk Ehingen GMBH,
Ehingen, West Germany; Hitachi Construction Machinery Co., Ltd., Tokyo,
Japan; and Terex Corporation, Westport, Connecticut. Within the market the
Company serves, lattice boom crawler cranes with lifting capacities greater
than 150 tons, Manitowoc is a world leader of this equipment.
The competitors within the boom truck crane market include Terex
Corporation, Westport, Conneticut, and Grove Crane, Shady Grove,
Pennsylvania. The Company believes that its current output of boom truck
cranes ranks second among its competitors.
In the ship repair operation, the Company is one of two operational
shipyards on the Great Lakes capable of drydocking and servicing 1000 foot
Great Lakes bulk carriers; the other is Erie Marine Enterprises, Erie,
Pennsylvania. There are two other shipyards on the Great Lakes, Fraser
Shipyards, Inc., Superior, Wisconsin, and H. Hansen Industries, Toledo,
Ohio, with whom the Company competes for drydocking and servicing smaller
Great Lakes vessels. The Company also competes with many smaller firms
which perform top side repair work during the winter lay-up period. In
addition, there are shipyards on the East, West and Gulf Coasts capable of
converting and reconstructing vessels of sizes that can enter the Great
Lakes through the St. Lawrence Seaway and the Wellen Canal. There are also
shipyards on the inland rivers capable of servicing smaller, specialized
vessels which the Company is capable of servicing.
For additional information regarding the company's competition, see
"Company Overview" on pages 6-7 of the 1998 Annual Report, which is
incorporated herein by reference.
Employee Relations
The Company employs approximately 3,300 persons, of whom about 600 are
salaried. The number of employees is consistent with the prior year.

The Company has labor agreements with 17 union locals. There have
been no work stoppages during the three years ended December 31, 1998.
Item 2. PROPERTIES
Owned
The Company owns Foodservice manufacturing facilities located in
Manitowoc, Wisconsin; River Falls, Wisconsin; Parsons, Tennessee;
Sellersburg, Indiana; Mason City, Iowa; and Scotts Hill, Tennessee.
Manitowoc Ice, Inc.'s production of ice machines and reach-in coolers
are housed in a recently expanded 368,000 square foot facility in
Manitowoc, Wisconsin. The 128,000 square foot addition was completed
during 1995 and permitted both ice machines and reach-ins to be
manufactured in the same facility.
The acquisition of The Shannon Group, Inc. included four manufacturing
facilities located in Parsons, Tennessee; River Falls, Wisconsin; Mason
City, Iowa; and Scotts Hill, Tennessee. The Parsons and River Falls
facilities have approximately 212,000 and 133,000 square feet of
manufacturing and office space, respectively. The Mason City and Scotts
Hill plants each have about 40,000 square feet of manufacturing space. In
1998, the company closed the Scotts Hill facility and consolidated the
warehousing into its Parsons, Tennessee facility. In 1996, the Company
closed the Mason City facility and consolidated the manufacturing with the
previously leased facility in Greeneville, Tennessee. The Mason City and
Scotts Hill plants are currently held for sale.
SerVend International, Inc. has approximately 140,000 square feet of
manufacturing and office space located in Sellersburg, Indiana.
Cranes and related products are manufactured at plant locations in
Manitowoc, Wisconsin; Georgetown, Texas; York, Pennsylvania; Bauxite,
Arkansas; and Punxsutawney, Pennsylvania. During 1995, the crane

operations in Manitowoc completed a move from the original plant located in
the central city to consolidate all its activities at the existing South
Works facility. South Works' construction was completed in 1978 and is
comprised of approximately 265,000 square feet of manufacturing and office
space located on 76 acres. The original plant, which includes
approximately 600,000 square feet of manufacturing and office space, is
currently being held for sale.
The Punxsutawney operations consist of two manufacturing and office
facilities operated as Femco Machine Co. These facilities have
approximately 71,000 square feet and are located on approximately 34 acres.
A similar facility in nearby Hawthorn, Pennsylvania was sold in November,
1995.
In 1993, the Manitex boom truck crane operations were moved to
Georgetown, Texas. The Company purchased an existing manufacturing and
office facility totaling approximately 175,000 square feet. Previously,
this operation consisted of manufacturing and office facilities located in
McAllen, Texas, and a fabrication plant located in Reynosa, Mexico.
The USTC manufacturing and office facility, acquired in November 1998,
has approximately 110,000 square feet and is located on approximately 17
acres in York, Pennsylvania.
In June, 1987, the Company purchased an existing 20,000 square foot
facility in Bauxite, Arkansas, for the remanufacturing of used cranes.
This facility began operations in fiscal 1988.
The Company's shipyard in Sturgeon Bay, Wisconsin, consists of
approximately 55 acres of waterfront property. Four of those acres, which
connect two operating areas of the shipyard, are leased under a long term
ground lease. There is approximately 295,000 square feet of enclosed
manufacturing and office space. Facilities at the shipyard include a 140
by 1,158 foot graving dock, the largest on the Great Lakes. In addition,
there is a 250 foot graving dock, and a 600 foot floating drydock.

Additional properties consist primarily of a crane sales office and
warehouse facility located in Northampton, England. Sales offices in Long
Island City, New York and Seattle, Washington were sold during the fourth
quarter of 1995.
Leased
The Company leases three manufacturing facilities for the Foodservice
division including approximately 90,000 square feet in Selmer, Tennessee;
150,000 square feet in Sparks, Nevada; and 5,000 square feet in Portland,
Oregon. The Company also leases office space in Franklin, Tennessee. In
addition, the Company leases sales offices and warehouse facilities for
cranes and related products in Mokena, Illinois. Facilities are also
leased in Pompano Beach, Florida for parts manufacturing and crane re-
manufacturing. Furthermore, the Company leases the shipyard facilities at
Toledo and Cleveland, Ohio for the marine segment. These facilities
include waterfront land, buildings, and 800-foot and 550-foot graving
docks.
The acquisition of PSG included four leased distribution facilities in
Roanoke, Virginia; Liphonia, Georgia; Glendale, California; and East
Granby, Connecticut.
Item 3. LEGAL PROCEEDINGS
The information required by this item is incorporated by reference
from Note 13 to Consolidated Financial Statements on pages 40-41 of the
1998 Annual Report.
Item 4. SUBMISSION OF MATTERS TO A VOTE OF SECURITY HOLDERS
No matters were submitted to security holders for a vote during the
fourth quarter of the Company's fiscal year ended December 31, 1998.
Executive Officers of the Registrant

Each of the following officers of the Company has been elected to a one-
year term by the Board of Directors. The information presented is as of
January 31, 1999.
Robert R. Friedl 44 Senior Vice President & CFO 1996
E. Dean Flynn 57 Secretary 1993
Terry D. Growcock, 53, president and chief executive officer since 1998.
Previously, president and general manager of Manitowoc Ice, Inc. (1996);
also executive vice president of Manitowoc Equipment Works (1994). Prior
to joining Manitowoc, Mr. Growcock served in numerous management and
executive positions with Siebe plc and United Technologies.
Robert R. Friedl, 44, senior vice president and chief financial officer
since 1996. Previously, vice president and chief financial officer (1992),
vice president of finance (1990), and assistant treasurer (1988). Prior to
joining Manitowoc, Mr. Friedl served as chief financial officer with
Coradian Corp.; was co-founder, vice president of finance, and treasurer of
Telecom North, Inc.
Thomas G. Musial, 47, vice president human resources since 1995.
Previously, manager of human resources (1987) and personnel/industrial
relations specialist (1976).
Glen E. Tellock, 37, vice president of finance and treasurer since 1998.
Previously, Mr. Tellock served as corporate controller of the company
(1992) and director of accounting (1991). Prior to joining Manitowoc, Mr.
Position With Principal Position Name Age The Registrant Held Since ----------- ------ -------------------- ------------------ Terry D. Growcock 53 President & CEO 1998
Thomas G. Musial 47 Vice President - Hu man Resources 1995 Glen E. Tellock 37 Vice President - Fi nance 1998 and Treasurer

Tellock served as financial planning manager with the Denver Post
Corporation, and as an audit manager for Ernst & Whinney.
E. Dean Flynn, 57, secretary since 1993. Previously, manager of corporate
insurance (1990); assistant corporate secretary (1987); and legal assistant
(1985). Formerly served the Wabco division of Dresser Industries, Inc., in
numerous managerial positions for 23 years, departing as manager of legal
affairs in 1985.
PART II
Item 5. MARKET FOR REGISTRANT'S COMMON EQUITY AND R ELATED
STOCKHOLDER MATTERS
The information required by this item is incorporated by reference from
"Eleven-Year Financial Summary and Business Segment Information,"
"Quarterly Common Stock Price Range," "Supplemental Quarterly Financial
Information (Unaudited)," and "Investor Information," on pages 30-31, 44
and back cover, respectively, of the 1998 Annual Report.
Item 6. SELECTED FINANCIAL DATA
The information required by this item is incorporated by reference from
"Eleven-Year Financial Summary and Business Segment Information" on pages
30-31 of the 1998 Annual Report.
Item 7. MANAGEMENT'S DISCUSSION AND ANALYSIS OF FIN ANCIAL
CONDITION AND RESULTS OF OPERATIONS
The information required by this item is incorporated by reference from
"Management's Discussion and Analysis of Results of Operations and
Financial Condition" on pages 24-29 of the 1998 Annual Report.
Item 7A. QUANTITATIVE AND QUALITATIVE DISCLOSURES A BOUT
MARKET RISK

The information required by this item is incorporated by reference from
"Management's Discussion and Analysis of Results of Operations and
Financial Condition" on pages 24-29 of the 1998 Annual Report.
Item 8. FINANCIAL STATEMENTS AND SUPPLEMENTARY DATA
The financial statements required by this item are incorporated by
reference from pages 32-43 of the 1998 Annual Report. Supplementary
financial information is incorporated by reference from "Supplemental
Quarterly Financial Information (Unaudited)" on page 44 of the 1998 Annual
Report.
Item 9. CHANGES IN AND DISAGREEMENTS WITH ACCOUNTAN TS ON
ACCOUNTING AND FINANCIAL DISCLOSURE
None.
PART III
Item 10. DIRECTORS AND EXECUTIVE OFFICERS OF THE RE GISTRANT
The information required by this item is incorporated by reference from the
sections of the 1999 Proxy Statement captioned "Section 16(a) Beneficial
Ownership Reporting Compliance" and "Election of Directors". See also
"Executive Officers of the Registrant" in Part I hereof, which is
incorporated herein by reference.
Item 11. EXECUTIVE COMPENSATION
The information required by this item is incorporated by reference from
the sections of the 1999 Proxy Statement captioned "Compensation of
Directors", "Executive Compensation", "Contingent Employment Agreements",
and "F. M. Butler Supplemental Retirement Agreement".

Item 12. SECURITY OWNERSHIP OF CERTAIN BENEFICIAL O WNERS
AND MANAGEMENT
The information required by this item is incorporated by reference from the
section of the 1999 Proxy Statement captioned "Ownership of Securities".
Item 13. CERTAIN RELATIONSHIPS AND RELATED TRANSACT IONS
None.
PART IV
Item 14. EXHIBITS, FINANCIAL STATEMENT SCHEDULES, A ND REPORTS
ON FORM 8-K
(a) Documents filed as part of this Report.
(1) Financial Statements:
The following Consolidated Financial Statements are filed as part of this
report under Item 8, "Financial Statements and Supplementary Data":
Report of Independent Public Accountants on years ended December 31, 1998,
1997, and 1996 Financial Statements.
Consolidated Statements of Earnings for the years ended December 31, 1998,
1997, and 1996.
Consolidated Balance Sheets as of December 31, 1998 and 1997.
Consolidated Statements of Cash Flows for the years ended December 31,
1998, 1997, and 1996.
Consolidated Statements of Stockholders' Equity and Comprehensive Income
for the years ended December 31, 1998, 1997 and 1996
Notes to Consolidated Financial Statements.
(2) Financial Statement Schedules:
Financial Statement Schedules for the years ended December 31, 1998,
1997, and 1996.

II Valuation and Qualifying Accounts X
Report of Independent Accountants
on years ended December 31, 1998,
1997, and 1996 Financial Statement
Schedule X
All other financial statement schedules not listed have been omitted since
the required information is included in the consolidated financial
statements or the notes thereto, or is not applicable or required under
rules of Regulation S-X.
(b) Reports on Form 8-K:
None
(c) Exhibits:
See Index to Exhibits immediately following the signature page of
this report, which is incorporated herein by reference.
REPORT OF INDEPENDENT ACCOUNTANTS
Board of Directors and Stockholders
The Manitowoc Company, Inc.
Our report on the consolidated financial statements of The Manitowoc
Company, Inc. and Subsidiaries has been incorporated by reference in this
Form 10-K from page 43 of the 1998 Annual Report of The Manitowoc Company,
Inc. and Subsidiaries. In connection with our audits of such financial
statements, we have also audited the related consolidated financial
statement schedule listed in Item 14(a)(2) of this Form 10-K.
In our opinion, the consolidated financial statement schedule referred to
above, when considered in relation to the basic consolidated financial
statements taken as a whole, presents fairly, in all material respects, the
information required to be included therein.
Filed Schedule Description Herewith -------- ------------------------------ ----------

PRICEWATERHOUSECOOPERS LLP
SIGNATURES
Pursuant to the requirements of Section 13 or 15(d) of the Securities
Exchange Act of 1934, the registrant has duly caused this Report to be
signed on its behalf by the undersigned, thereunto duly authorized:
Terry D. Growcock
President & Chief Executive Officer
/s/ PricewaterhouseCoopers LLP January 26, 1999 -----------------------------------
THE MANITOWOC COMPANY, INC. AND SUBSIDIARIES SCHEDUL E II: VALUATION AND QUALIFYING ACCOUNTS FOR THE YE ARS ENDED DECEMBER 31, 1996, 1997, AND 1998 BALAN CE AT CHARGED TO BA LANCE AT BEGIN NING COSTS AND END OF DESCRIPTION OF Y EAR EXPENSES DEDUCTIONS(1) YEAR ---------------------- ------ ------ ------------ ------------- ---- ---------- YEAR ENDED DECEMBER 31, 1996: Allowance for doubtful accounts $ 1,36 5,356 $ 322,837 $ (711,986) $ 976,207 YEAR ENDED DECEMBER 31, 1997: Allowance for doubtful accounts $ 97 6,207 $1,479,633 $ (573,985) $ 1 ,881,855 YEAR ENDED DECEMBER 31, 1998: Allowance for doubtful accounts $ 1,88 1,855 $ 481,924 $ (707,839) $ 1 ,655,940 (1) Deductions represent bad debts written-off, net of recoveries.
Dated: March 1, 1999 THE MANITOWOC COMPANY, INC. By: /s/ Terry D. Growcock --------------------------------------

Robert R. Friedl
Senior Vice President and Chief Financial
Officer
Pursuant to the requirements of the Securities Exchange Act of 1934,
this Report has been signed below by the following persons constituting a
majority of the Board of Directors on behalf of the registrant and in the
capacities and on the dates indicated:
Terry D. Growcock, President & CEO, Director
Robert R. Friedl, Senior Vice President & CFO
Gilbert F. Rankin, Jr., Director
George T. McCoy, Director
James P. McCann, Director
March 1, 1999
Dean H. Anderson, Director
March 1, 1999
By: /s/ Robert R. Friedl ---------------------------------------
/s/ Terry D. Growcock March 1, 1999 -------------------------------------------
/s/ Robert R. Friedl March 1, 1999 -------------------------------------------
/s/ Gilbert F. Rankin, Jr. March 1, 1999 -------------------------------------------
/s/ George T. McCoy March 1, 1999 -------------------------------------------
/s/ Guido R. Rahr, Jr. March 1, 1999 ------------------------------------------- Guido R. Rahr, Jr., Director March 1, 1999

Robert S. Throop, Director
March 1, 1999
Robert C. Stift, Director
THE MAN ITOWOC COMPANY, INC. ANNUAL REPORT ON FORM 10-K FOR THE YEAR ENDED DECEMBER 31, 1998 IN DEX TO EXHIBITS Filed Exhibit No. Description Herewith ----------- ------------------------------------- ------------------ ---------- 2.1 (a) * Stock Purchase Agreement dated as of O ctober 24, 1995, for the acquisition of The Shannon Gro up, Inc. by The Manitowoc Company, Inc. (filed as Exhi bit 2 to the Company's Report on Form 8-K, dated as of October 25, 1995 and incorporated herein by refere nce). 2.1 (b) * First Amendment to Stock Purchase Agre ement, dated as of December 1, 1995, for the acquisiti on of The Shannon Group, Inc. by The Manitowoc C ompany, Inc. (filed as Exhibit 2.2 to the Company's Report on Form 8-K, dated as of December 1, 1995 and incorporated herein by reference). 2.2 * Purchase and Sale Agreement dated as o f October 1, 1997, for the acquisition of SerVend I nternational, Inc. by The Manitowoc Company, Inc. (f iled as Exhibit 2.1 to the Company's Report on Form 8- K, dated as of October 31, 1997 and incorporated here in by reference). 2.3 Purchase and Sale Agreement dated as o f September 22, 1998, for the acquisition of USTC, Inc . by The Manitowoc Company, Inc. (filed as Exhi bit 2 to the Company's Report on Form 8-K dated as of September 22, 1998 and incorporated herein by refere nce). 3.1 Amended and Restated Articles of Incor poration as amended on November 5, 1984 (filed as Exhibit 3(a) to the Company's Annual Report on Form 10 -K for the

fiscal year ended June 29, 1985 and in corporated herein by reference). 3.2 Restated By-Laws (as amended through M ay 22, 1995) including amendment to Article II chan ging the date of the annual meeting (filed as Exhibit 3 .2 to the Company's Quarterly Report on Form 10- Q for the quarter ended June 30, 1995 and incorp orated herein by reference). 4.1 Rights Agreement dated August 5, 1996 between the Registrant and First Chicago Trust Com pany of New York (filed as Exhibit 4 to the Company's c urrent Report on Form 8-K filed on August 5, 1996 and i ncorporated herein by reference). 4.4 Articles III, V, and VIII of the Amend ed and Restated Articles of Incorporation (see Exhibit 3.1 above). 4.5 Credit Agreement dated as of October 3 1, 1997, among The Manitowoc Company, Inc., as Borrow er, certain subsidiaries from time to time parties thereto, as Guarantors, the several Lenders, and N ationsBank, N.A. as Agent (filed as Exhibit 4.1 to the Company's Report on Form 8-K dated as of October 31, 19 97 and incorporated herein by reference). 4.6 Credit Agreement dated as of April 2, 1998, among The Manitowoc Company, Inc., as Borrower a nd Prudential Insurance Company (filed as Exhibit 4 to the Company's Report on Form 10-Q, dated as of March 31, 1998 and incorporated herein by reference). 10.1(a)** The Manitowoc Company, Inc. Deferred C ompensation Plan effective August 20, 1993 (the "Deferr ed Compensation Plan") (filed as Exhibit 4.1 to the Co mpany's Registration Statement on Form S-8 fil ed June 23, 1993 (Registration No. 33-65316) and incorp orated herein by reference). 10.1(b) ** Amendment to Deferred Compensation Pla n adopted by the
Board of Directors on February 18, 199 7. 10.2 ** The Manitowoc Company, Inc. Management Incentive Compensation Plan (Economic Value Adde d (EVA) Bonus Plan) effective July 4, 1993, and as a mended February 15, 1999. X 10.3 ** Form of Contingent Employment Agreemen t between the Company and Messrs. Butler, Flynn, Fr iedl, Keener, Musial, Growcock, Shaw, Schad, Tellock and certain other employees of the Company (filed as Exhibit 10(c)to the Company's Annual Report on Form 10-K for the fiscal year ended July 1, 1989 and incorporated herein by reference). 10.4 ** Form of Indemnity Agreement between th e Company and each of the directors, executive offic ers and certain other employees of the Company (filed as Exhibit 10(d) to the Company's Annual Report on Form 10-K for the fiscal year ended July 1, 1989 and inc orporated herein by reference). 10.5 ** Supplemental Retirement Agreement betw een Fred M.
Butler and the Company dated March 15, 1993 (filed as Exhibit 10(e) to the Company's Annual Report on Form 10-K for the fiscal year ended July 3, 1993 and incorporated herein by reference). 10.6(a) ** Supplemental Retirement Agreement betw een Robert K. Silva and the Company dated January 2, 1995 (filed as Exhibit 10 to the Company's Report on Form 10-Q for the transition period ended December 3 1, 1994 and incorporated herein by reference). 10.6(b) ** Restatement to clarify Mr. Silva's Su pplemental Retirement Agreement dated March 31, 1 997. 10.7 * The Manitowoc Company, Inc. 1995 Stock Plan (filed as Appendix A to the Company's Proxy Stat ement dated April 2, 1996 for its 1996 Annual Meet ing of Stockholders and incorporated herein b y reference).

11 Statement regarding computation of bas ic and diluted earnings per share (see Note 8 to the 1998 Consolidated Financial Statements incl uded herein). X 13 Portions of the 1998 Annual Report to Shareholders of The Manitowoc Company, Inc. incorporat ed by reference into this Report on Form 10-K. X 20 Press release dated February 17, 1999 regarding declaration of a 3-for-2 stock split. X 21 Subsidiaries of The Manitowoc Company, Inc. X 23.1 Consent of PricewaterhouseCoopers L.L. P., the Company's Independent Public Accountan ts. X 27 Financial Data Schedule. X * Pursuant to Item 601(b)(2) of Regulation S-K, the Registrant agrees to furnish to the Securities and Exchange Co mmission upon request a copy of any unfiled exhibits or schedules to such document. ** Management contracts and executive compensati on plans and arrangements required to be filed as exhibits pursu ant to Item 14(c) of Form 10-K.
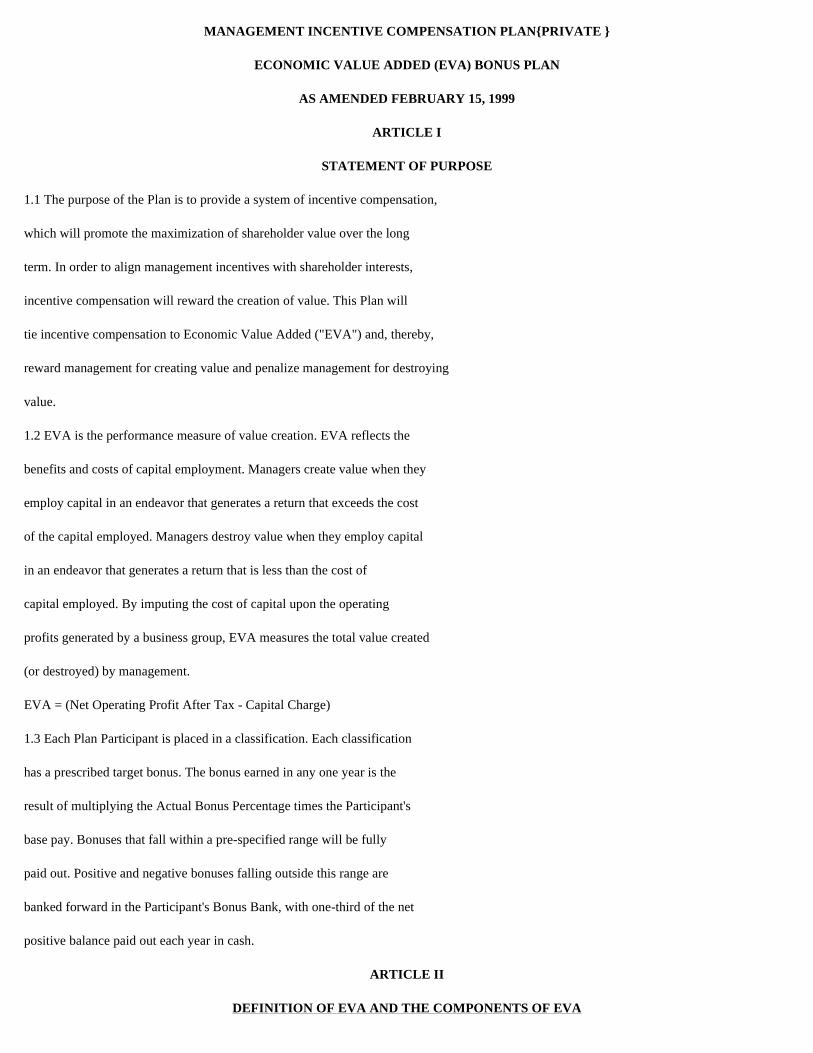
MANAGEMENT INCENTIVE COMPENSATION PLAN{PRIVATE }
ECONOMIC VALUE ADDED (EVA) BONUS PLAN
AS AMENDED FEBRUARY 15, 1999
ARTICLE I
STATEMENT OF PURPOSE
1.1 The purpose of the Plan is to provide a system of incentive compensation,
which will promote the maximization of shareholder value over the long
term. In order to align management incentives with shareholder interests,
incentive compensation will reward the creation of value. This Plan will
tie incentive compensation to Economic Value Added ("EVA") and, thereby,
reward management for creating value and penalize management for destroying
value.
1.2 EVA is the performance measure of value creation. EVA reflects the
benefits and costs of capital employment. Managers create value when they
employ capital in an endeavor that generates a return that exceeds the cost
of the capital employed. Managers destroy value when they employ capital
in an endeavor that generates a return that is less than the cost of
capital employed. By imputing the cost of capital upon the operating
profits generated by a business group, EVA measures the total value created
(or destroyed) by management.
EVA = (Net Operating Profit After Tax - Capital Charge)
1.3 Each Plan Participant is placed in a classification. Each classification
has a prescribed target bonus. The bonus earned in any one year is the
result of multiplying the Actual Bonus Percentage times the Participant's
base pay. Bonuses that fall within a pre-specified range will be fully
paid out. Positive and negative bonuses falling outside this range are
banked forward in the Participant's Bonus Bank, with one-third of the net
positive balance paid out each year in cash.
ARTICLE II
DEFINITION OF EVA AND THE COMPONENTS OF EVA

Unless the context provides a different meaning, the following terms shall have
the following meanings.
2.1 "Participating Group means a business division or group of business
divisions, which are uniquely identified for the purpose of calculating
EVA, and EVA based bonus awards. Some Participants' awards may be a
mixture of two different Participating Groups.
For the purpose of this plan, the Participating Groups are listed on Exhibit C.
2.2. "Capital" means the net investment employed in the operations of each
Participating Group. The components of Capital are as follows:
Notes: (1) NIBCL's include trade A/P to another Manitowoc unit, but do not in-
clude the contingent liability associated with Bonus Banks.
2.3 Each component of Capital will be measured by computing an average balance
based on the ending monthly balance for the twelve months of the Fiscal
Year.
2.4 "Cost of Capital" or "C*" means the weighted average of the after tax cost
of debt and equity for the year in question.
The Cost of Capital will be reviewed annually and revised if it has changed
significantly. Calculations will be carried to one decimal point.
The cost of capital for the initial year is 12.6%. See Exhibit A. In
subsequent plan years the methodology for the calculation of the Cost of Capital
will be:
Gross Accounts Receivable (including trade A/R from another Manitowoc unit) Plus: FIFO Inventory Plus: Other Current Assets Less: Non-Interest Bearing Current Liabilitie s (NIBCL's - See Note 1) Plus: Net PP&E Plus: Other Operating Assets Plus: Capitalized Research & Development Plus: Goodwill acquired after July 3, 1993 Plus: Accumulated Amortization on Goodwill ac quired after July 3, 1993 Plus (Less): Special Items (one-time) --------------------------------------- Equals: Capital

a) Cost of Equity = Risk Free Rate + (Beta x Market Risk Premium)
b) Debt Cost of Capital = Debt Yield x (1 - Tax Rate)
c) The weighted average of the Cost of Equity and the Debt Cost of Capital is
determined by reference to the projected debt to capital ratio from the year in
question business plan where the Risk Free Rate is the average daily closing
yield rate on 30 year U.S. Government Bonds for the month of December
immediately preceding the Plan Year, the BETA is determined by reference to the
most recently available Value Line report on the Company closest to, but before
December 31, the Market Risk Premium is 6%, the Debt Yield is the projected
weighted average yield on the Company's long term obligations for the 12 month
period ending December 31 of the Plan Year, and the tax rate is 39% for U.S.
Companies, and the full statutory rate of the country where a foreign division
or subsidiary is based.
d) Short-term debt is to be treated as long-term for purposes of computing
the cost of capital.
2.5 "Capital Charge" means the deemed opportunity cost of employing Capital in
the business of each Participating Group. The Capital Charge is computed
as follows:
Capital Charge = Capital X Cost of Capital (C*)
2.6 "Net Operating Profit After Tax" or "NOPAT"
"NOPAT" means the after tax cash earnings attributable to the capital employed
in the Participating Group for the year in question. The components of
NOPAT are as follows:
Operating Earnings Plus: Increase (Decrease) in Capitalized R & D (See Note 1) Plus: Increase (Decrease) in Bad Debt Reserve Plus: Increase (Decrease) in Inventory Reserv es Plus: Amortization of Goodwill acquired after July 3, 1993 Less: Other Expense (Excluding interest on d ebt) Plus: Other Income (Excluding investment inc ome) Equals: Net Operating Profit Before Tax Less: Taxes (See Note 2) -------------------------------

2.7 "Economic Value Added" or "EVA" means the NOPAT that remains after
subtracting the Capital Charge, expressed as follows:
NOPAT
Less: Capital Charge
Equals: EVA
EVA may be positive or negative.
ARTICLE III
DEFINITION AND COMPUTATION OF TARGET BONUS VALUE
3.1 "Actual EVA" means the EVA as calculated for each Participating Group for
the year in question.
3.2 "Target EVA" means the level of EVA that is expected in order for the
Participating Group to receive the Target Bonus Value.
The Target EVA for the first year is set at the expected EVA for the year prior
to the first year of the plan after adjusting for inventory write-offs,
Manitex relocation, FAS 106 and 109 and the $5 million product liability
settlement (except for $1.2 million). After the first year, the Base-Line
EVA is revised according to the following formula:
(Last Year's Actual EVA
+ Last Year's Target EVA)
Target EVA = 2 + Expected Improvement in EVA
"Expected Improvement in EVA" means the constant EVA improvement that is added
to shift the target up each year. This is determined by the expected
growth in EVA per year.
See Exhibit B for the Expected Improvement for each Participating Group.
3.3 "Target Bonus Value" means the "Target Bonus Percentage" times a
Participant's base pay.
3.4 "Target Bonus Percentage" is determined by a Participant's classification
as shown on Exhibit B.
Equals: Net Operating Profit After Tax

3.5 "Actual Bonus Value" means the bonus earned * by a Participant and is
computed as the Actual Bonus Percentage times a Participant's base pay.
3.6 "Actual Bonus Percentage" is determined by multiplying the Target Bonus
Percentage by the Bonus Performance Value.
3.7 "Bonus Performance Value" means the difference between the Actual EVA and
the Target EVA divided by the Leverage Factor plus 1.0.
[Actual EVA - Target EVA] Bonus Performance Value = [Leverage Factor] + 1
3.8 "Leverage Factor" is the negative (positive) deviation from Target EVA
necessary before a zero (two times Target) bonus is earned. See Exhibit C
for the Leverage Factor of each Participating Group.
3.9 A Participant's classification is determined by each business unit manager.
They shall generally be direct reports and are subject to approval by the
CEO and the Compensation Committee of the Board of Directors.
* Note: A portion of the Actual Bonus Value may be placed in the Participants'
Bonus Bank. See Article IV for details on the Bonus Bank.
ARTICLE IV
DESCRIPTION OF BONUS BANKS
4.1 Establishment of a Bonus Bank. To encourage a long-term commitment by
Participants to the Company, a portion of exceptional bonuses (amounts
above Target and negative bonuses) shall be credited to "at risk" deferred
accounts ("Bonus Banks"), with the level of payout contingent on sustained
high performance and improvements and continued employment as provided
herein.
4.2 Although a Bonus Bank may, as a result of negative EVA, have a deficit, no
Plan Participant shall be required, at any time, to reimburse his/her Bonus
Bank.
4.3 "Bonus Bank" means, with respect to each Participant, a bookkeeping record
of an account to which amounts are credited, or debited as the case may be,
from time to time under the Plan and from which bonus payments to such

Participant are debited.
4.4 "Bank Balance" means, with respect to each Participant, a bookkeeping
record of the net balance of the amounts credited to and debited against
such Participant's Bonus Bank. A Participant's Bank Balance shall
initially be equal to zero.
If the Bank Balance entering the Plan Year is negative, then
1) Pay 1/3 of the positive bonus earned up to the "Target Bonus Value",
2) Add any unpaid portion of the bonus earned (including negative bonuses)
to the Bonus Bank,
3) Pay out 1/3 of any Positive Bank Balance,
4) Carry the remaining Bank Balance forward to the next year.
4.6 A Participant may elect to withdraw, in cash, all or a portion of the Bank
Balance. The amount available for such withdrawal is the lesser of the
ending Bank Balance of the applicable year or the Bank Balance at the end
of the third prior year.
ARTICLE V
Plan Participation, Transfers and Terminations
5.1 The Committee will have sole discretion in determining who shall
participate in the EVA Bonus Plan. Employees designated for Plan
participation by the Committee shall be management or highly compensated
employees. In order for a Participant to receive or be credited with his
or her Actual Bonus Value f or a Plan Year, the Participant must have (i)
remained employed by the Company or an affiliate through the last day of
such Plan Year, (ii) terminated employment with the Company during the Plan
4.5 Payout Rule: If the Bank Balance en tering the Plan Year is zero or positive, then 1) Pay any positive bonus earned up to the "Tar get Bonus Value", 2) Add any unpaid portion of the bonus earned (including negative bonuses) to the Bonus Bank, 3) Pay out 1/3 of any Positive Bank Balance 4) Carry the remaining Bank Balance forward to the next year.

Year at or after age fifty-five, for any reason, (iii) suffered a
disability within the meaning of Section 5.3 during the Plan Year, or (iv)
died during the Plan Year. In all other cases of termination of employment
prior to the last day of the Plan Year, a Participant shall not be entitle
to any Actual Bonus Value for such Plan Year.
5.2 Transfers. A Participant who transfers his employment from one
Participating Unit of the Company to another shall retain his Bonus Bank
and will be eligible to receive future EVA Plan Awards in accordance with
the provisions of the EVA Plan. Any positive Bonus Bank balance would pay
out in full as soon as is practical.
5.3 Retirement or Disability. A Participant who terminates employment with the
Company, at or after age fifty-five, for any reason ("retirement"), or
suffers a "disability," as such term is defined in the Company's long-term
disability benefits program, while in the Company's employ shall be
eligible to receive the balance of their Bonus Bank. In the case of
retirement, the Participant will receive their balance over three years
subject to reduction if the Actual Bonus Value is negative in any of the
three years subsequent to the year of retirement. In the case of
disability while in the Company's employ, the Participant will receive
their balance as soon as practical after qualifying for benefit payments
under the Company's long-term disability benefits program.
5.4 Involuntary Termination Without Cause or Death. A Participant who is
Terminated without cause or who dies shall receive any positive Bonus Bank
balance. Such payments will be made as soon as is practical.
5.5 Voluntary Termination. In the event that a Participant voluntarily
terminates employment with the Company, the right of the Participant to
their Bonus Bank shall be forfeited unless a different determination is
made by the Committee.
5.6 Involuntary Termination for Cause. In the event of termination of
employment for cause, the right of the Participant to the Bonus Bank shall

be determined by the Committee.
"Cause" shall mean:
(i) any act or acts of the Participant constituting a felony under the laws
of the United States, any state thereof or any foreign jurisdiction;
(ii) any material breach by the Participant of any employment agreement with
the Company or the policies of the Company or the willful and
persistent (after written notice to the Participant) failure or
refusal of the Participant to comply with any lawful directives of the
Board;
(iii) a course of conduct amounting to gross neglect, willful misconduct or
dishonesty; or
(iv) any misappropriation of material property of the Company by the
Participant or any misappropriation of a corporate or business
opportunity of the Company by the Participant.
5.7 Breach of Agreement. Notwithstanding any other provision of the Plan or
any other agreement, in the event that a Participant shall breach any non-
competition agreement with the Company or breach any agreement with respect
to the post-employment conduct of such Participant, the Bonus Bank held by
such Participant shall be forfeited.
5.8 No Guarantee. Participation in the Plan provides no guarantee that a
payment under the Plan will be paid. Selection as a Participant is no
guarantee that payments under the plan will be paid or that selection as a
Participant will be made in the subsequent Calendar Year.
ARTICLE VI
General Provisions
6.1 Withholding of Taxes. The Company shall have the right to withhold the
amount of taxes, which in the determination of the Company, are required to
be withheld under law with respect to any amount due or paid under the
Plan.
6.2 Expenses. All expenses and costs in connection with the adoption and
administration of the plan shall be borne by the Company.
6.3 No prior Right or Offer. Except and until expressly granted pursuant to
the Plan, nothing in the Plan shall be deemed to give any employee any
contractual or other right to participate in the benefits of the Plan.
6.4 Claims for Benefits. In the event a Participant (a "claimant") desires to
make a claim with respect to any of the benefits provided hereunder, the
claimant shall submit evidence satisfactory to the Committee of facts
establishing his entitlement to a payment under the Plan. Any claim with
respect to any of the benefits provided under the Plan shall be made in
writing within ninety (90) days of the event which the claimant asserts
entitles him to benefits. Failure by the claimant to submit his claim
within such ninety (90) day period shall bar the claimant from any claim
for benefits under the Plan.
6.5 In the event that a claim which is made by a claimant is wholly or
partially denied, the claimant will receive from the Committee a written
explanation of the reason for denial and the claimant or his duly
authorized representative may appeal the denial of the claim to the
Committee at any time within ninety (90) days after the receipt by the
claimant of written notice from the Committee of the denial of the claim.
In connection therewith, the claimant or his duly authorized representative
may request a review of the denied claim; may review pertinent documents;
and may submit issues and comments in writing. Upon receipt of an appeal,
the Committee shall make a decision with respect to the appeal and, not
later than sixty (60) days after receipt of a request for review, shall
furnish the claimant with a decision on review in writing, including the
specific reasons for the decision written in a manner calculated to be
understood by the claimant, as well as specific reference to the pertinent
provisions of the Plan upon which the decision is based. In reaching its
decision, the Committee shall have complete discretionary authority to
determine all questions arising in the interpretation and administration of

the Plan, and to construe the terms of the Plan, including any doubtful or
disputed terms and the eligibility of a Participant for benefits.
6.6 Action Taken in Good Faith; Indemnification. The Committee may employ
attorneys, consultants, accountants or other persons and the Company's
directors and officers shall be entitled to rely upon the advice, opinions
or valuations of any such persons. All actions taken and all
interpretations and determinations made by the Committee in good faith
shall be final and binding upon all employees who have received awards, the
Company and all other interested parties. No member of the Committee, nor
any officer, director, employee or representative of the Company, or any of
its affiliates acting on behalf of or in conjunction with the Committee,
shall be personally liable for any action, determination, or inter-
pretation, whether of commission or omission, taken or made with respect to
the Plan, except in circumstances involving actual bad faith or willful
misconduct. In addition to such other rights of indemnification as they
may have as members of the Board, as members of the Committee or as
officers or employees of the Company, all members of the Committee and any
officer, employee or representative of the Company or any of its
subsidiaries acting on their behalf shall be fully indemnified and
protected by the Company with respect to any such action, determination or
interpretation against the reasonable expenses, including attorneys' fees
actually and necessarily incurred, in connection with the defense of any
civil or criminal action, suit or proceeding, or in connection with any
appeal therein, to which they or any of them may be a party by reason of
any action taken or failure to act under or in connection with the Plan or
an award granted thereunder, and against all amounts paid by them in
settlement thereof (provided such settlement is approved by independent
legal counsel selected by Company ) or paid by them in satisfaction of a
judgment in any action, suit or proceeding, except in relation to matters
as to which it shall be adjudged in such action, suit or proceeding that

such person claiming indemnification shall in writing offer the Company the
opportunity, at its own expense, to handle and defend the same. Expenses
(including attorneys' fees) incurred in defending a civil or criminal
action, suit or proceeding shall be paid by the Company in advance of the
final disposition of such action, suit or proceeding if such person
claiming indemnification is entitled to be indemnified as provided in this
Section.
6.7 Rights Personal to Employee. Any rights provided to an employee under the
Plan shall be personal to such employee, shall not be transferable (except
by will or pursuant to the laws of descent or distribution), and shall be
exercisable, during his lifetime, only by such employee.
6.8 Upon termination of the Plan or suspension for a period of more than 90
days, the Bank Balance of each Participant shall be distributed as soon as
practicable but in no event later than 90 days from such event. The
Committee, in its sole discretion, may accelerate distribution of the Bank
Balance, in whole or in part, at any time without penalty.
6.9 Non-Allocation of Award. In the event of a suspension of the Plan in any
Plan Year, as provided herein at Article VIII, Section 8, the Current Bonus
for the subject Plan year shall be deemed forfeited and no portion thereof
shall be allocated to Participants. Any such forfeiture shall not affect
the calculation of EVA in any subsequent year.
ARTICLE VII
Limitations
7.1 No Continued Employment. Nothing contained herein shall provide any
employee with any right to continued employment or in any way abridge the
rights of the Company and its Participating Units to determine the terms
and conditions of employment and whether to terminate employment of any
employee.
7.2 No Vested Rights. Except as otherwise provided herein, no employee or
other person shall have any claim of right (legal, equitable, or otherwise)

to any award, allocation, or distribution or any right, title, or vested
interest in any amounts in his Bonus Bank and no officer or employee of the
Company or any Participating Group or any other person shall have any
authority to make representations or agreements to the contrary. No
interest conferred herein to a Participant shall be assignable or subject
to claim by a Participant's creditors. The right of the Participant to
receive a distribution hereunder shall be an unsecured claim against the
general assets of the Company and the Participant shall have no rights in
or against any specific assets of the Company as the result of
participation hereunder.
7.3 Not Part of Other Benefits. The benefits provided in this plan shall not
be deemed a part of any other benefit provided by the Company to its
employees. The Company assumes no obligation to plan Participants except
as specified herein. This is a complete statement, along with the
Schedules and Appendices attached hereto, of the terms and conditions of
the plan.
7.4 Other Plans. Nothing contained herein shall limit the Company or the
Compensation Committee's power to grant bonuses to employees of the
Company, whether or not Participants in this plan.
7.5 Limitations. Neither the establishment of the plan or the grant of an
award hereunder shall be deemed to constitute an express or implied
contract of employment for any period of time or in any way abridge the
rights of the Company to determine the terms and conditions of employment
or to terminate the employment of any employee with or without cause at any
time.
7.6 Unfunded Plan. This Plan is unfunded and is maintained by the Company in
part to provide deferred compensation to a select group of management and
highly compensated employees. Nothing herein shall create or be construed
to create a trust of any kind, or a fiduciary relationship between the
Company and any Participant.

ARTICLE VIII
Authority
8.1 Compensation Committee Authority. Except as otherwise expressly provided
herein, full power and authority to interpret and administer this plan
shall be vested in the Compensation Committee. The Compensation Committee
may from time to time make such decisions and adopt such rules and
regulations for implementing the Plan as it deems appropriate for any
Participant under the Plan. Any decision taken by the Compensation
Committee arising out of or in connection with the construction, ad-
ministration, interpretation and effect of the Plan shall be final,
conclusive and binding upon all Participants and any person claiming under
or through them.
8.2 Board of Directors Authority. The Board shall be ultimately responsible
for administration of the plan. References made herein to the
"Compensation Committee" assume that the Board of Directors has created a
Compensation Committee to administer the Plan. In the event a Compensation
Committee is not so designated, the Board shall administer the Plan. The
Board or its Compensation Committee, as appropriate, shall work with the
CEO of the Company in all aspects of the administration of the Plan.
ARTICLE IX
Notice
9.1 Any notice to be given pursuant to the provisions of the Plan shall be in
writing and directed to the appropriate recipient thereof at his business
address or office location.
ARTICLE X
Effective Date
10.1 This Plan shall be effective as of July 4, 1993.
ARTICLE XI
Amendments
11.1 This Plan may be amended, suspended or terminated at any time at the sole

discretion of the Board upon the recommendation of the Compensation
Committee. Provided, however, that no such change in the Plan shall be
effective to eliminate or diminish the distribution of any Award that has
been allocated to the Bank of a Participant prior to the date of such
amendment, suspension or termination. Notice of any such amendment,
suspension or termination shall be given promptly to each Participant.
ARTICLE XII
Applicable Law
12.1 This Plan shall be construed in accordance with the provisions of the laws
of the State of Wisconsin.
Exhibit A
Calculation of the Cost of Capital
Inputs Variables:
Risk Free Rate = Average Daily closing yield on U.S. Government 30 Yr. Bonds
(for the month of December preceding the Plan Year).
Market Risk Premium = 6.0% (Fixed)
Beta = Most recently available Value Line report closest to but before
December 31.
Debt/Capital Ratio = Debt as a % of Capital (computed using the projected
monthly average debt/capital ratio for the 12 month period ending December
31 of the Plan Year)
b = Cost of Debt Capital (Projected & Weighted Average Yield on the Company's
Long Term Debt Obligations).
Marginal Tax Rate = 39.0% (Historical Average). However, for exceptions
see 2.4(C)
Calculations:
y = Cost of Equity Capital
= Risk Free Rate + (Beta x Market Risk Premium)
Weighted Average Cost of Capital = [Cost of Equity Capital x (1 - Debt/Capital
Ratio)] + [Cost of Debt x (Debt/Capital Ratio) x (1 - Marginal Tax Rate)]

c* = [y x (1 - Debt/Capital)] + [b x (Debt/Capital) x (1 - Marginal Tax Rate)]
Exhibit B
Exhibit C
Participation Groups Expected Improvement in EVA Leverage Factor
(1) Includes MII, Kolpak, McCall, & Kolpak Manufacturing
(2) Includes MII and SerVend
(3) Includes MCC, Femco, Re-Man, NCC, and MEL
Participant Target Bonus Classification Percentage -------------- ------------- I 60% II 50% III 40% IV 35% V 30% VI 25% VII 20% VIII 15% IX 10% X 5% XI 2%
MANITOWOC ICE - MII 500,000 2,000,000 KOLPAK 350,000 1,000,000 MCCALL 450,000 500,000 KOLPAK MANUFACTURING 100,000 500,000 FOODSERVICE GROUP (1) 1,500,000 4,000,000 SERVEND 250,000 750,000 FOODSERVICE GROUP (2) 750,000 2,250,000 JOINT VENTURE (CHINA) 100,000 300,000 FOODSERVICE SEGMENT 1,000,000 3,500,000 MANITOWOC CRANES - MCC 1,000,000 3,000,000 RE-MANUFACTURING - MRI 50,000 150,000 FEMCO 200,000 600,000 NORTH CENTRAL CRANE - NCC 40,000 120,000 MTW EUROPE LTD ($)-MEL 75,000 225,000 MTW EUROPE LTD (POUNDS) 50,000 150,000 MCC GROUP (3) 1,500,000 4,000,000 CRAWLER CRANE GROUP (4) 1,100,000 3,400,000 AFTERMARKET GROUP (5) 1,200,000 3,600,000 MANITEX - MIT 500,000 1,000,000 WEST MANITOWOC 200,000 350,000 MARINE 150,000 750,000 CORPORATE 1,000,000 7,000,000

(4) Includes MCC, Re-Man, NCC, and MEL
(5) Includes MCC and Femco

PORTIONS OF THE 1998 ANNUAL REPORT TO SHAREHOLDERS
OF THE MANITOWOC COMPANY, INC. INCORPORATED
BY REFERENCE
MANAGEMENT'S DISCUSSION AND ANALYSIS OF RESULTS OF OPERATIONS AND
FINANCIAL CONDITION
Business Description
The Manitowoc Company and its affiliates are market leaders in their
domestic and international businesses.
The Foodservice Equipment Group includes:
- One of the largest suppliers of ice-cube machines and walk-in
refrigerator/freezers in the world -- serving restaurants, hotels
and other institutions.
- One of the world's largest manufacturers of ice/beverage dispensers
and dispensing valves -- serving the soft-drink industry.
The Cranes and Related Products Group includes:
- Businesses with a leading share of the worldwide market for
lattice-boom crawler cranes (over 150-ton capacity) -- serving
heavy-construction, crane-rental, dockside and material-handling
customers.
- Operations with a leading share of the North American boom-truck
market -- serving commercial, industrial, utility construction and
maintenance applications.
The Marine Group is:
- The Marine Group is the leading provider of ship repair,
maintenance, conversion and construction services on the U.S. side
of the Great Lakes.
Additional information on these business segments can be found on pages
6 through 23.
Note on Forward-Looking Statements

Information in this report, and in other company communications, that
are not historical facts are forward-looking statements, which are based
on management's current expectations. These statements involve risks and
uncertainties that could cause actual results to differ materially from
what appears here.
Forward-looking statements include the company's description of plans
and objectives for future operations, and the assumptions behind those
plans. The words "anticipates", "believes", "intends", "estimates" and
"expects", or similar expressions, usually identify forward-looking
statements. In addition, goals established by Manitowoc should not be
viewed as guarantees or promises of future performance. There can be no
assurance the company will be successful in achieving its goals.
In addition to the assumptions and information referred to specifically
in the forward-looking statements, other factors could cause actual
results to be materially different from what is presented here. This
includes a number of factors for each business segment.
The Foodservice Equipment Group -- demographic changes affecting two-
income families, general population growth, and household income;
consolidation in the restaurant industry; the ability to serve large
restaurant chains as they expand their global operations; specialty
foodservice market growth; the demand for quick service restaurants; and
growth in the soft-drink industry.
The Cranes and Related Products Group -- market acceptance of innovative
products; cyclicality in the construction industry; growth in the world
market for heavy cranes; the replacement cycle of technologically
obsolete cranes; and demand for used equipment in developing countries.
The Marine Group -- shipping volume fluctuations based on performance of
the steel industry; five-year survey schedule; the replacement cycle of
older marine vessels; the growth of existing marine fleets; and reducing

seasonality through vessel construction and industrial maintenance.
Corporate -- changes in laws or regulations; successful integration of
acquisitions; competitive pricing; domestic and international economic
conditions; interest rate risk; the ability of Manitowoc's customers and
suppliers to meet Year 2000 compliance; and any unanticipated Year 2000
issues.
Long-Term Goals
Manitowoc has established and will work to achieve these goals by 2002:
- Reach $1.3 billion in sales, with the increase coming from an
estimated 50/50 split between internal and external growth.
- Continue to make global expansion a key priority.
- Supplement its base businesses with strategic acquisitions.
- Generate 80% of revenues from new products and models introduced
since 1998.
- Generate a consistently improving EVA (Economic Value-Added) in
each business unit for all continuing operations.
- Pursue ISO quality certification for all non-marine operations.
Market Conditions: North America
The North American economy was stable for the foodservice industry
throughout 1997 and 1998, while the crane and marine industries saw
improvements in the latest year.
The Foodservice Equipment Group is benefiting from a number of long-term
trends: growth in the restaurant industry, particularly among high-
volume chains; expansion of fast-food franchises into non-traditional
locations, such as automotive service stations, convenience stores and
chain retail stores; growth in health care facilities; and the continued
recovery of the hotel and lodging industry. In the near-term, this group
also benefited from a warmer than normal summer. Two long-term trends

also support growth in the beverage dispensing niche market: higher
quality, more attractive new products are speeding up the beverage
dispenser replacement cycle, which generates 80% of this market's sales;
and increased demand for self-serve fountain equipment by various quick-
service industries. All of these factors kept demand for foodservice
equipment strong in 1998 in nearly all North American markets. We expect
this to continue in 1999.
The Cranes and Related Products Group experienced greater demand again
in 1998. These businesses are expected to continue growing in the next
several years due to increasing construction spending in the U.S.; the
rebuilding of America's infrastructure (funded by the Transportation
Equity Act [TEA-21] -- the federal bill that provides $217 billion for
rebuilding roads/bridges over the next six years, which should increase
demand for cranes, particularly boom trucks and smaller capacity crawler
cranes); and the continuing replacement cycle for an aging large-
capacity liftcrane fleet that is becoming technologically obsolete.
The Marine Group saw increased demand for its products and services as a
result of record levels of shipping tonnage; the general economic
strength of the heavy industry and manufacturing sectors; an interest in
upgrading existing vessels and taking advantage of new automation
equipment; and the aging of the Great Lakes fleet -- averaging 38 years
-- which requires more maintenance and repair. In 1997, the Coast Guard
changed its regulations and provided a one-year extension of the five-
year mandatory dry-docking requirement. Ship owners must apply for the
extension, and decisions are made on a ship-by-ship basis. This did not
have a significant impact on the Marine Group during 1998. Demand was
good at all three ship-repair facilities: Toledo and Cleveland, Ohio,
and Sturgeon Bay, Wisconsin.
Market Conditions: International

Manitowoc's international sales contributed 11.3% of total revenues in
1998.
The Foodservice Equipment Group experienced the strongest demand for its
refrigeration products in the southeast Asian market, with Taiwan and
China contributing most of its international ice-cube machine sales in
1998. Europe also experienced steady growth during the year.
International orders for refrigeration and ice-making equipment from
hotel and restaurant chains are expected to be robust for the next two
years. This is largely due to U.S. firms expanding into international
markets and wanting to take their proven suppliers with them.
The Cranes and Related Products Group saw strong demand in Canada and
signs of a revival in Europe. Demand in Asia declined, due to a
downturn in certain economies there.
The Marine Group's repair and maintenance sales come primarily from the
U.S. While the North American Free Trade Agreement (NAFTA) eliminated
tariffs, making U.S. shipyards more competitive with their Canadian
counterparts, most Canadian shipping companies still choose to have
their vessels serviced in their home country.
Results of Operations
This table summarizes the relationship between components
of operations as a percent of net sales for the last three years.
Percent of Net Sales 1998 1997 1996 -------------------- ---- ---- ---- Net sales 100.0 100.0 100.0 Cost of sales 71.8 72.0 73.1 Gross profit 28.2 28.0 26.9 Engineering, selling & administrative expenses 14.1 15.4 15.9 Amortization and other 0.8 0.7 0.8 Operating income 13.3 11.9 10.2 Interest and other income (expense) (1.6) (1.3) (1.7)

Net Sales -- Consolidated net sales for 1998 increased 27.3% to $694.8
million. Higher sales resulted from increased volume at Foodservice
Equipment (sales up 29.3%) and Cranes and Related Products (up 27.1%),
as both benefited from strong acceptance of new products and recent
acquisitions. New products included "Q" Series ice machines for the
Foodservice Equipment Group, and Models 888 and 777 lattice boom cranes
for the Cranes and Related Products Group. The Marine Group also
experienced a 16.0% sales improvement for the year, with strong demand
for its repair and maintenance services and the construction of a large
dipper-dredge during 1998.
In 1997, net sales rose 9.1% to $545.9 million from $500.5 million in
1996. The improvement resulted from a 23.3% increase in Cranes and
Related Products Group sales, due to strong demand for new products, and
a 2.0% increase in Foodservice Equipment Group sales. Marine Group sales
were down 17.7% because 1996 results included a barge construction
project that was not replicated in 1997.
Gross Margins -- Manitowoc continued to improve its gross margins: 28.2%
in 1998 compared with 28.0% in 1997 and 26.9% in 1996. All three
operations are contributing to this positive trend. The Foodservice
Equipment Group is designing costs out of new products, consolidating
its buying functions for greater purchasing power, and benefiting from
more cost-effective manufacturing. The Cranes and Related Products Group
is experiencing higher margins in the crawler crane and boom-truck
businesses, due to increased productivity, lower labor costs and the
efficient use of outsourcing. The Marine Group is experiencing a mix in
its shipyard activities that has a higher percentage of repair and
service work, which have better margins.
Earnings before taxes 11.7 10.6 8.5 Income taxes 4.3 3.9 3.4 Net earnings 7.4 6.7 5.1

Engineering, Selling and Administrative Expenses -- At $98.1 million in
1998, ES&A increased 16.5% from $84.2 million in 1997, which was a 5.9%
increase from $79.6 million in 1996. However, ES&A continued to decrease
as a percentage of net sales: 14.1% in 1998 versus 15.4% in 1997 and
15.9% in 1996. ES&A costs increased at a slower rate than sales, even
considering the effects of integrating a number of acquisitions. The
focus on controlling expenses at the Cranes and Related Products Group
and cost reductions at the Foodservice Equipment Group helped to slow
increases in ES&A.
Operating Earnings -- All three businesses improved their operating
margins in 1998. This brought a 42.5% increase in Manitowoc's
consolidated operating earnings, which reached $92.6 million for 1998,
compared with $65.0 million in 1997 and $50.9 million in 1996. Operating
margins continue to grow, reaching 13.3% of sales in 1998 versus 11.9%
and 10.2% in 1997 and 1996, respectively. Manitowoc anticipates
increasing operating margins in our existing businesses in the
Foodservice Equipment and Cranes and Related Products groups in 1999 and
beyond, while maintaining the already strong margins at the Marine
Group.
Income Taxes -- The 1998 effective income tax rate was 36.9%, flat with
37.0% for 1997 and down from 39.7% in 1996. In the past two years,
Manitowoc's effective tax rate benefited from a 1997 reorganization of
its holding and operating company structure along segment lines.
Net Earnings -- Higher sales, stronger margins and a stable effective
tax rate led to record net earnings in 1998: $51.4 million, or $2.95 per
diluted share. This represented a 41.1% increase compared with $36.4
million, or $2.09 per diluted share in 1997, which was a 42.0% increase
over $25.6 million, or $1.48 per diluted share in 1996. Net earnings
for 1998 did not grow as quickly as operating earnings primarily because
of higher interest expense associated with acquisitions.

All per-share figures reflect the June 1997 and July 1996 three-for-two
stock splits. Diluted shares outstanding for 1998 were 17.4 million.
This compares to 17.4 million for 1997 and 17.3 million for 1996. The
increase is due to the granting of stock options.
The Foodservice Equipment Group
This segment generated 46.0% of total sales. Its revenues increased
29.3% to $319.5 million, compared with $247.1 million in 1997 and $242.3
million for 1996. The main contributors to stronger sales in 1998 were
(1) inclusion of the SerVend International acquisition for an entire
year, which contributed 42% of the sales increase; and (2) strong
performances from continuing operations, which generated 58% of the
sales increase, led by the positive market reception for the new "Q"
Series ice machines.
Results in 1997 were affected by (1) lower sales of walk-in
refrigerators, as several major fast food chains announced a slowdown in
the pace of new restaurant openings; (2) flat sales for ice machines;
(3) higher sales of reach-in refrigerator/freezers despite a flat
market; (4) lower residential refrigerator/freezer sales as General
Electric reduced inventories and consolidated its distribution centers;
and (5) two months of SerVend operations.
We anticipate that Foodservice Equipment Group sales will continue to
expand, driven by increasing demand for prepared foods, growth in small
kiosk locations and quick-service restaurants, the replacement cycle for
larger walk-in coolers, freezers and ice machines, and the expansion of
restaurant chains into less developed markets outside the U.S.
Foodservice Equipment Group operating earnings grew faster than sales in
1998, up 44.1% to $53.0 million compared with $36.7 million in 1997, and
also higher than $34.0 million in 1996. As a result, this segment
generated 49.0% of total segment operating earnings in 1998, versus

47.6% in 1997 and 54.2% in 1996.
In 1998, operating margins increased to 16.6% from 14.9% and 14.0% in
1997 and 1996, respectively. This dramatic improvement came from (1)
selling the Tonka operation, which was unprofitable; and (2) margin
improvements at McCall and Manitowoc Ice. The rise in 1997's operating
margin resulted from introducing the combined purchasing program, plant
consolidations, and closing the former Shannon Group corporate offices.
In the near term, we believe the Foodservice Equipment Group's greatest
opportunities lie in (1) continuing to introduce new products, such as
the next generation of the successful "Q" Series ice machines in 1999;
(2) continuing to benefit from combined purchasing and improved
manufacturing processes to help increase operating margins; and (3)
successfully continuing the integration of the SerVend, F.A.G. and PSG
acquisitions. Even if the foodservice industry experiences a downturn
in 1999, we believe this segment will continue to grow, although at a
slower pace.
Cranes and Related Products Group
Strong sales from this segment made it Manitowoc's largest business
segment for the second consecutive year, providing 47.5% of total
revenues. At $330.0 million, Cranes sales rose 27.1% over $259.6 million
for 1997, and also were higher than $210.6 million in 1996. The most
significant factor contributing to sales growth continued to be strong
market acceptance of new products, such as the Manitowoc Cranes Models
888 and 777. Products introduced in the past two years represented 50.0%
of the order backlog (other than parts) at the end of 1998, and 34.3% of
total Cranes and Related Products Group sales for the year. Other
factors that contributed to the 1998 sales increase include the active
replacement cycle for crawler cranes, and increased orders from
construction contractors. Higher sales in 1997 resulted from demand for
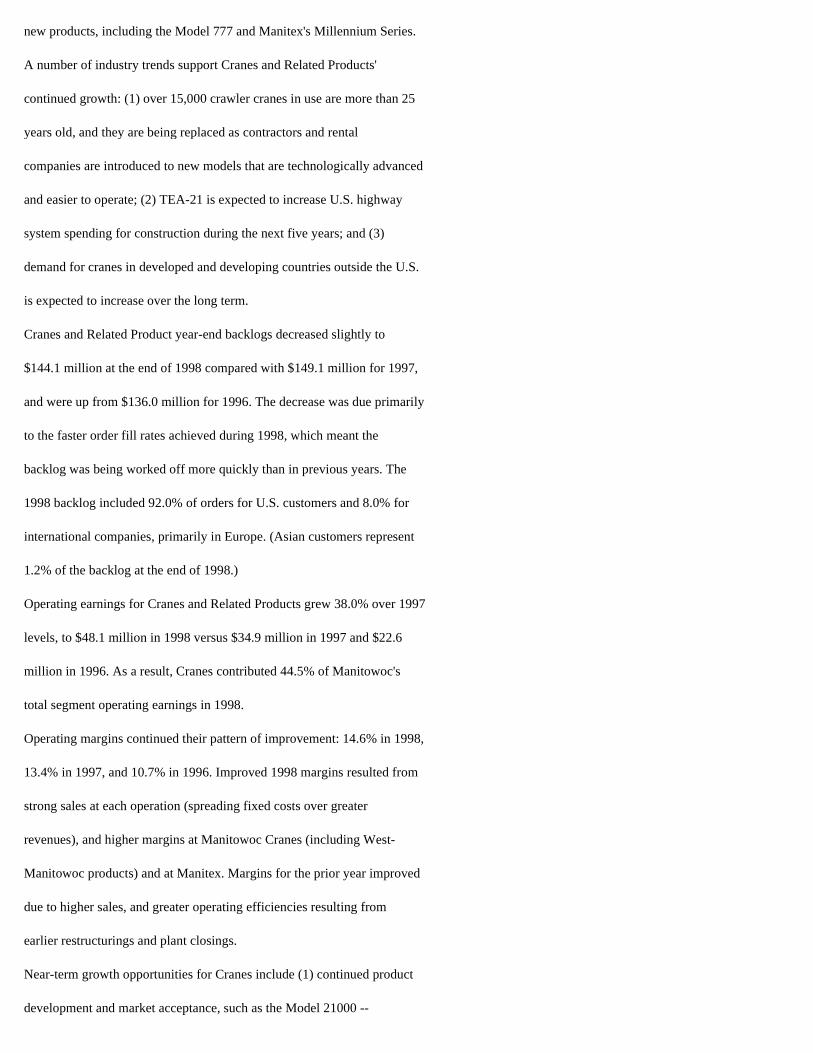
new products, including the Model 777 and Manitex's Millennium Series.
A number of industry trends support Cranes and Related Products'
continued growth: (1) over 15,000 crawler cranes in use are more than 25
years old, and they are being replaced as contractors and rental
companies are introduced to new models that are technologically advanced
and easier to operate; (2) TEA-21 is expected to increase U.S. highway
system spending for construction during the next five years; and (3)
demand for cranes in developed and developing countries outside the U.S.
is expected to increase over the long term.
Cranes and Related Product year-end backlogs decreased slightly to
$144.1 million at the end of 1998 compared with $149.1 million for 1997,
and were up from $136.0 million for 1996. The decrease was due primarily
to the faster order fill rates achieved during 1998, which meant the
backlog was being worked off more quickly than in previous years. The
1998 backlog included 92.0% of orders for U.S. customers and 8.0% for
international companies, primarily in Europe. (Asian customers represent
1.2% of the backlog at the end of 1998.)
Operating earnings for Cranes and Related Products grew 38.0% over 1997
levels, to $48.1 million in 1998 versus $34.9 million in 1997 and $22.6
million in 1996. As a result, Cranes contributed 44.5% of Manitowoc's
total segment operating earnings in 1998.
Operating margins continued their pattern of improvement: 14.6% in 1998,
13.4% in 1997, and 10.7% in 1996. Improved 1998 margins resulted from
strong sales at each operation (spreading fixed costs over greater
revenues), and higher margins at Manitowoc Cranes (including West-
Manitowoc products) and at Manitex. Margins for the prior year improved
due to higher sales, and greater operating efficiencies resulting from
earlier restructurings and plant closings.
Near-term growth opportunities for Cranes include (1) continued product
development and market acceptance, such as the Model 21000 --

Manitowoc's largest crawler crane -- to be introduced in 1999; (2)
successfully integrating the USTC acquisition; and (3) consolidating
West-Manitowoc into Manitowoc Cranes to reduce ES&A expenses.
The Marine Group
This segment generated 6.5% of Manitowoc's 1998 net sales. At $45.4
million, Marine revenues grew 16.0% from $39.2 million in 1997, and
declined from $47.6 million in 1996. The latest year's results included
revenue from building a dipper-dredge (a project not as large as the
prior two years' barge conversions) and more small, higher margin
service and construction projects. The 1997 figure included revenue from
a large barge conversion, which was less than the construction of a
self-unloading cement barge during 1996.
Marine operating earnings were $7.0 million, up 23.5% from $5.6 million
in 1997, and an improvement over $6.2 million in 1996. This segment
contributed 6.5% of total segment operating earnings for the year. The
higher margin projects mentioned earlier boosted Marine's 1998 operating
margins to 15.4%, up from 14.4% and 13.0% in 1997 and 1996,
respectively.
Marine's near-term growth opportunities include (1) more dry-dockings of
1,000 foot vessels scheduled for its Sturgeon Bay facility; (2)
increased interest in upgrading existing vessels and taking advantage of
new automation equipment; and (3) new and potential construction
projects, such as the Mobil Oil tug/barge combination scheduled for
1999.
Liquidity and Capital Resources
Cash flows from operations increased 30.3% in 1998 to $56.8 million,
compared with $43.6 million in 1997 and $64.5 million in 1996. The
improvement came primarily from higher net earnings in 1998. However,

cash flows did not increase as much as earnings because of the greater
need for working capital to fund growth in 1998. The primary investing
and financing uses of cash in the latest year were (1) $48.2 million for
acquisitions; (2) $66.6 million in debt payments; (3) $11.7 million in
capital expenditures, which focused on developing the "Q" Series ice
machines and the acquisition of more efficient machinery and equipment
across all business segments; and (4) $7.8 million in dividend payments.
Estimated capital expenditures for 1999 are in the $14-18 million range.
At December 31, 1998, long-term debt was $79.8 million, or 25.6% of
total capitalization, compared with $66.4 million in 1997, or 25.6%. At
January 31, 1999, the company's total debt-to-capitalization ratio
increased from 44.6% at the end of 1998 to 49.7% following the PSG
acquisition.
Cash and marketable securities were $12.4 million at the end of 1998,
compared with $13.6 million in 1997 and $16.0 million in 1996.
Inventories increased to $82.0 million at the end of 1998, compared with
$54.7 million at year-end 1997 and $44.0 million for 1996. This was the
result of the 27.3% higher sales the company experienced in 1998 and the
acquisition of USTC. The working capital deficit was $7.2 million
compared with 1997's deficit of $25.3 million, and a positive $17.6
million in 1996.
Management believes that available cash, existing credit facilities,
cash generated from operations, and access to public debt and equity
markets will be adequate to fund Manitowoc's capital requirements for
the foreseeable future.
Acquisitions
Acquisitions are expected to contribute approximately 50% of Manitowoc's
sales growth between 1998 and 2002. The company acquired three
businesses over the past three years -- and one in January of 1999 --

and continues to seek new acquisition candidates in each of its business
segments.
On November 3, 1998, Manitowoc purchased Powerscreen USC Inc. (doing
business as USTC, Inc.). USTC builds three proprietary product lines:
boom-truck cranes, rough-terrain forklifts, and material-handling
equipment. It had $33 million in sales for its fiscal year ended March
31, 1998. Together with Manitex, the resulting operations are expected
to become the number two competitor in the $300 million market.
Manitowoc funded the $53.9 million purchase price with funds available
from existing credit facilities.
On September 9, 1998, Manitowoc acquired a 50% ownership interest in
Fabbrica Apparecchiatture per Produzione di Ghiaccia S.r.L. (F.A.G.),
and an option to purchase an additional 30% ownership over the next five
years. This Milan, Italy-based company produces Icetronic and Compact
brand ice makers and private label machines, with capacities between 22-
132 pounds per day. It had $4.0 million (U.S.) in revenues for 1997. The
acquisition gives Manitowoc a manufacturing base in Europe and broadens
its product offering to include smaller models, which are more
appropriate for European and developing markets. The $2.5 million
purchase price was funded through existing credit facilities.
On October 31, 1997, Manitowoc acquired SerVend International, Inc., a
leading manufacturer of ice/beverage dispensers and dispensing valves
for the soft-drink industry, with nearly $50 million in 1996 sales. The
acquisition helped Manitowoc enter this foodservice market niche. The
$72.9 million purchase price was funded through existing credit
facilities.
In addition, on January 8, 1999, the company completed its acquisition
of Purchasing Support Group (PSG). PSG is a systems integrator, with
nationwide distribution of backroom equipment and support system
components. It serves the beverage needs of restaurants, convenience

stores and other outlets. PSG had over $30 million in sales for 1998 and
operates in the Northeast and Atlantic Coast regions, as well as in
portions of Arizona, California, Florida, Georgia and Nevada. This
acquisition is expected to improve the distribution of Manitowoc's
beverage dispensing equipment and open new markets. Manitowoc purchased
PSG for a total of $38.0 million in cash, with financing provided
through its existing credit facilities.
Contingencies
The United States Environmental Protection Agency (EPA) identified the
company as a Potentially Responsible Party (PRP) under the Comprehensive
Environmental Response Compensation and Liability Act (CERCLA), liable
for the costs associated with investigating and cleaning up the
contamination at the Lemberger Landfill Superfund Site near Manitowoc,
Wisconsin.
Eleven of the PRPs have formed the Lemberger Site Remediation Group
(LSRG) and have successfully negotiated with the EPA and Wisconsin
Department of Natural Resources to settle the potential liability at the
site and fund the cleanup. Approximately 150 PRPs have been identified
as having shipped substances to the site.
Recent estimates indicate that the total costs to clean up the site are
approximately $30 million. Although liability is joint and several, the
company's share of liability is estimated to be 11% of the total cleanup
costs. To date, Manitowoc expensed a total of $3.3 million in connection
with this matter.
Quantitative and Qualitative Disclosure About Market Risk
The company is exposed to market risks from changes in interest rates,
commodities and, to a lesser extent, foreign exchange. To reduce such
risks, the company selectively uses financial instruments and other
proactive management techniques. All hedging transactions are
authorized and executed pursuant to clearly defined policies and
procedures, which prohibit the use of financial instruments for trading
purposes.
Discussions of the company's accounting policies and further disclosure
relating to financial instruments is included in Notes 1 and 6 of notes
to consolidated financial statements.
Interest Rate Risk - The company uses interest rate swaps to modify the
company's exposure to interest rate movements by minimizing the effect
of potential interest rate increases on floating rate debt in a rising
interest rate environment. Under these agreements, the company
contracts with a counter-party to exchange the difference between a
fixed rate and a floating rate applied to the notional amount of the
swap. The company's existing swap contracts range between two and four
years in remaining duration at December 31, 1998. The interest payments
or receipts from interest rate swaps are recognized in net income as
adjustments to interest expense on a current basis. The company enters
into swap agreements only with those financial institutions with high
credit ratings which, in the opinion of management, limits the company's
exposure to credit loss. At December 31, 1998, the company had
outstanding two interest rate swap agreements with financial
institutions having a total notional principal amount of $22.6 million.
The effect of these agreements on the company's interest rates during
1998 was not significant. The fair value of these interest rate swap
agreements was a negative $.6 million at December 31, 1998. The
interests rates under the swap agreements were 5.78% and 6.29% at
December 31, 1998 and the weighted average interest rate for the
floating rate debt was 6.28% at December 31, 1998.
Commodity Prices - The company is exposed to the fluctuation in market
prices for such commodities as steel, copper, aluminum and zinc. Each

one of the company's business segments is subject to commodity price
risk as the prices for raw materials change with movements in underlying
commodity prices. Therefore, the company has established various
programs to manage the negotiations of commodity prices. Some of these
programs are centralized within business segments and other programs are
specific to each business unit. In general, the company enters into
contracts with its vendors to lock in commodity prices at various times
and for various periods in order to limit near-term exposure to
fluctuations in raw material prices.
Currency Risk - The company has limited exposure to foreign currency
exchange fluctuations in certain of its European operations. Due to the
relative stability of the European currencies exchanged and the
immaterial amount of transactions processed, the company does not
utilize foreign currency hedges to manage this limited foreign currency
exchange rate exposure.
New Accounting Standards
In June 1998, the Financial Accounting Standards Board issued Financial
Accounting Standard No. 133, "Accounting for Derivative Instruments and
Hedging Activities". This new standard will be effective for the
company's first quarter in the year 2000. It requires companies to
record all derivative instruments on the balance sheet as assets or
liabilities, measured at fair value. Any fair value changes will be
recorded in net income or comprehensive income, depending on whether the
derivative is designated as part of a hedge transaction and if it is,
the type of hedge transaction. The adoption of this statement is not
anticipated to have a significant impact on the company's earnings or
financial position.
Year 2000 Compliance
The Year 2000 (or Y2K) issue is the result of computer systems and
software products that are coded to accept two digits rather than four
in their date code fields to define a year. A company's computer
equipment and software devices with embedded technology that are time-
sensitive may recognize a date using "00" as the year 1900 rather than
2000. This could result in a system failure or miscalculations causing
disruptions of operations, including among other things, a temporary
inability to process transactions, send invoices, or engage in other
normal business activities.
The company has undertaken various initiatives intended to ensure its
computer equipment and software will function properly with respect to
Y2K and beyond. For this purpose, the term "computer equipment and
software" includes systems commonly thought of as Information Technology
(IT) systems -- including accounting, data processing and telephone
systems -- as well as those that are not commonly thought of as IT
systems -- such as manufacturing equipment, company products, alarm
systems, fax machines or other miscellaneous systems. Both IT and non-IT
systems may contain embedded technology, which complicates Y2K
identification, assessment, remediation and testing efforts.
Based on its identification and assessment efforts to date, the company
is in the process of converting, modifying and upgrading its computer
equipment and software to be Y2K compliant, as necessary. In addition,
in the ordinary course of replacing computer equipment and software, the
company attempts to get replacements that are Y2K compliant. Using both
internal and external resources to identify and assess needed Y2K
remediation, the company currently anticipates that its Y2K
identification, assessment, remediation and testing efforts, which began
in 1996, will be completed by October, 1999 and contingency plans will
be developed, as necessary, to address unforeseen circumstances prior to
the end of calendar year 1999. The company believes these efforts will

be completed prior to any currently anticipated impact on its computer
equipment and software. It also does not anticipate any significant
disruption to its normal business operations to achieve this goal. The
company estimates that as of December 31, 1998, it had completed about
80% of the initiatives it believes will be necessary to fully address
potential Y2K issues.
The company also has made inquiries and gathered information on the Y2K
compliance of its significant vendors, suppliers, dealers and
distributors (excluding 1998 acquisitions). This was done in an attempt
to determine the extent to which interfaces with these companies are
vulnerable to Y2K issues, and whether the products and services
purchased from or by these companies are Y2K compliant. As of December
31, 1998, the company received responses from approximately 70% of these
third parties, and 96% of those that responded have provided written
assurances that they expect to address their Y2K issues on a timely
basis. A follow-up mailing to significant vendors, suppliers, dealers
and distributors that did not initially respond, or whose responses were
deemed unsatisfactory by the company, will be completed in the first
quarter of 1999. Although the company cannot assure Y2K compliance by
its key suppliers, dealers and distributors, no major part or critical
operation of any company segment relies on a single source for raw
materials, supplies or services, and the company has multiple
distribution channels for most of its products. Should the company
discover that a vendor, supplier or distributor will not be Y2K
compliant, the company believes it will be able to find cost-
competitive, alternative sources for these raw materials, supplies or
services and continue its production and distribution.
During 1998, the company engaged an independent expert to evaluate its
Y2K identification, assessment, remediation and testing efforts. As a
result of this review, no significant changes to the company's existing

Y2K conversion plan were necessary.
Beginning in the second half of 1997, through December 31, 1998, the
company has spent about $4.0 million to upgrade its systems, including
Y2K issues. About $1.5 million was spent in 1998. Estimated costs for
scheduled system upgrades in 1999, including addressing Y2K concerns,
will approximate $0.5 million. These expenditures will be funded using
cash flows from operations.
The costs of the company's Y2K conversion efforts and the dates by which
it believes these efforts will be completed are based on management's
best estimates. These were developed using many assumptions regarding
future events, including continued availability of certain resources,
third-party remediation plans, and other factors. There can be no
assurance that these estimates will prove to be accurate, and actual
results could differ materially from those currently anticipated.
The company believes that the Y2K issue will not pose significant
operational problems for it. However, if all Y2K issues are not properly
identified, or assessment, remediation and testing are not completed for
Y2K problems that are identified, there can be no assurance that the Y2K
issue will not have a material adverse affect on the company's
relationships with customers, vendors, distributors and others. In
addition, there can be no assurance that the Y2K issues of other
entities will not have a material adverse impact on the company's
systems or results of operations.
Eleven-Year Financial Summary & Business Segment Information ------------- --------------------------------------------------- (Thousand s of dollars, except shares and per share data) Transiti on FISCAL YEARS Calendar Calendar Calendar Calendar Period 1998 1997 1996 1995 1994 ( 1) 1994 1993 --------------------------------------------------- --------------------------------------------------- -----------------------------

NET SALES Foodservice $319,457 $2 47,057 $242,317 $113,814 $ 44,996 $ 93,171 $ 81,424 Cranes & related products 329,953 2 59,645 210,564 169,866 70,958 156,253 178,630 Marine 45,412 39,162 47,584 29,469 7,952 25,956 18,504 --------------------------------------------------- --------------------------------------------------- ----------------------------- Total $694,822 $5 45,864 $500,465 $313,149 $123,906 $275,380 $278,558 --------------------------------------------------- --------------------------------------------------- ----------------------------- Gross margin $195,621 $1 52,600 $134,641 $ 75,470 $ 31,302 $ 67,924 $ 55,785 --------------------------------------------------- --------------------------------------------------- ----------------------------- EARNINGS (LOSS) FROM OPERATIONS Foodservice $ 52,950 $ 3 6,746 $ 33,989 $ 22,729 $ 9,426 $ 21,637 $ 18,311 Cranes & related products 48,116 3 4,878 22,582 3,179 870 2,275 (1,961) Marine 6,978 5,648 6,197 4,024 (799 ) 2,447 593 General corporate (10,543) ( 8,903) (7,678) (6,530) (3,981 ) (5,274) (5,296) Amortization (4,881) ( 3,394) (3,000) (250) -- -- -- Plant relocation costs -- -- (1,200) -- (14,000 ) -- (3,300) --------------------------------------------------- --------------------------------------------------- ----------------------------- Total 92,620 64,975 50,890 23,152 (8,48 4) 21,085 8,347 --------------------------------------------------- --------------------------------------------------- ----------------------------- Other income (expense) - net (11,208) (7,158) (8,384) (32) 16 9 1,494 582 --------------------------------------------------- --------------------------------------------------- ----------------------------- Earnings (loss) before taxes on income 81,412 57,817 42,506 23,120 (8,315 ) 22,579 8,929 Accounting changes -- -- -- -- -- -- (10,214) Provision (benefit) for taxes on income 30,032 21,394 16,863 8,551 (3,243 ) 8,536 2,612 --------------------------------------------------- --------------------------------------------------- ----------------------------- Net earnings (loss) $ 51,380 $ 36,423 $ 25,643 $ 14,569 $ (5,072 ) $ 14,043 $(3,897) --------------------------------------------------- --------------------------------------------------- ----------------------------- OTHER FINANCIAL INFORMATION Cash from operations $ 56,814 $ 43,587 $ 64,514 $ 16,367 $ (330 ) $ 36,995 $62,700 --------------------------------------------------- --------------------------------------------------- ----------------------------- Invested capital (monthly averages): Foodservice (2) $227,863 $1 71,647 $ 68,556 $ 32,696 $ 21,979 $ 25,662 $26,503 Cranes & related products 96,031 67,596 73,246 85,082 81,800 86,288 112,120 Marine 4,534 6,019 7,335 9,579 11,201 13,953 17,497 General corporate (2) 11,476 11,512 94,166 12,409 4,818 4,052 2,581 --------------------------------------------------- --------------------------------------------------- ----------------------------- Total $339,904 $ 256,774 $243,303 $139,766 $119,79 8 $129,955 $158,701 --------------------------------------------------- --------------------------------------------------- ----------------------------- IDENTIFIABLE ASSETS Foodservice (2) $254,506 $ 249,384 $ 90,937 $ 90,126 $ 27,82 8 $ 31,460 $29,526 Cranes & related products 178,470 100,591 88,174 109,118 88,06 8 93,823 105,750 Marine 7,023 6,426 10,648 11,369 13,23 3 16,726 16,720 General corporate (2) 41,015 39,967 127,951 114,302 30,33 6 43,839 56,015 --------------------------------------------------- --------------------------------------------------- ----------------------------- Total $481,014 $ 396,368 $317,710 $324,915 $159,46 5 $185,848 $208,011
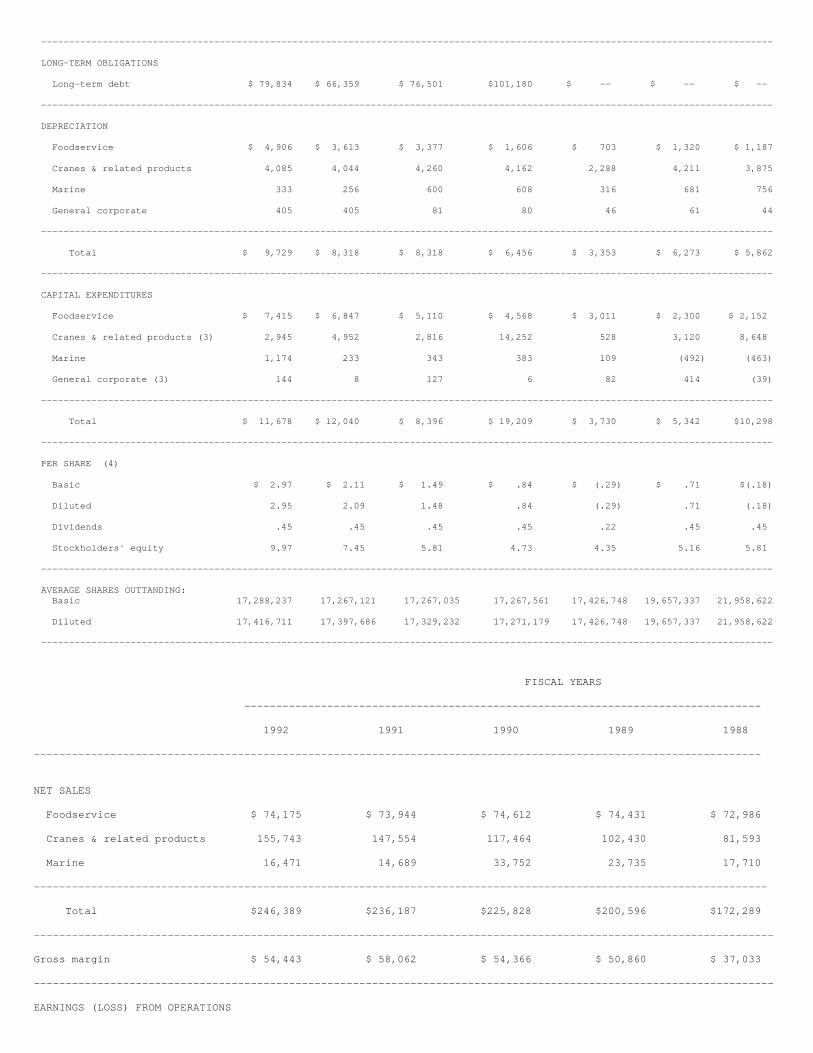
--------------------------------------------------- --------------------------------------------------- ----------------------------- LONG-TERM OBLIGATIONS Long-term debt $ 79,834 $ 66,359 $ 76,501 $101,180 $ -- $ -- $ -- --------------------------------------------------- --------------------------------------------------- ----------------------------- DEPRECIATION Foodservice $ 4,906 $ 3,613 $ 3,377 $ 1,606 $ 70 3 $ 1,320 $ 1,187 Cranes & related products 4,085 4,044 4,260 4,162 2,28 8 4,211 3,875 Marine 333 256 600 608 31 6 681 756 General corporate 405 405 81 80 4 6 61 44 --------------------------------------------------- --------------------------------------------------- ----------------------------- Total $ 9,729 $ 8,318 $ 8,318 $ 6,456 $ 3,35 3 $ 6,273 $ 5,862 --------------------------------------------------- --------------------------------------------------- ----------------------------- CAPITAL EXPENDITURES Foodservice $ 7,415 $ 6,847 $ 5,110 $ 4,568 $ 3,01 1 $ 2,300 $ 2,152 Cranes & related products (3) 2,945 4,952 2,816 14,252 52 8 3,120 8,648 Marine 1,174 233 343 383 10 9 (492) (463) General corporate (3) 144 8 127 6 8 2 414 (39) --------------------------------------------------- --------------------------------------------------- ----------------------------- Total $ 11,678 $ 12,040 $ 8,396 $ 19,209 $ 3,73 0 $ 5,342 $10,298 --------------------------------------------------- --------------------------------------------------- ----------------------------- PER SHARE (4) Basic $ 2.97 $ 2.11 $ 1.49 $ .84 $ (.2 9) $ .71 $(.18) Diluted 2.95 2.09 1.48 .84 (.2 9) .71 (.18) Dividends .45 .45 .45 .45 .2 2 .45 .45 Stockholders' equity 9.97 7.45 5.81 4.73 4.3 5 5.16 5.81 --------------------------------------------------- --------------------------------------------------- ----------------------------- AVERAGE SHARES OUTTANDING: Basic 17,288,237 1 7,267,121 17,267,035 17,267,561 17,426, 748 19,657,337 21,958,622 Diluted 17,416,711 1 7,397,686 17,329,232 17,271,179 17,426, 748 19,657,337 21,958,622 --------------------------------------------------- --------------------------------------------------- -----------------------------
FISCAL YEARS ------------------ --------------------------------------------------- ------------ 1992 1991 1990 1989 1988 --------------------------------------------------- --------------------------------------------------- ------------ NET SALES Foodservice $ 74,175 $ 73,944 $ 74,612 $ 74,431 $ 72,986 Cranes & related products 155,743 147,554 117,464 102,430 81,593 Marine 16,471 14,689 33,752 23,735 17,710 --------------------------------------------------- --------------------------------------------------- ------------- Total $246,389 $236,187 $225,828 $200,596 $172,289 --------------------------------------------------- --------------------------------------------------- -------------- Gross margin $ 54,443 $ 58,062 $ 54,366 $ 50,860 $ 37,033 --------------------------------------------------- --------------------------------------------------- -------------- EARNINGS (LOSS) FROM OPERATIONS

Foodservice $ 17,585 $ 17,364 $ 19,387 $18,468 $ 17,203 Cranes & related products (850) 7,602 5,490 3,454 (1,974) Marine 278 (973) 6,497 3,416 (15,921) General corporate (6,545) (5,734) (6,094) (5,623) (4,744) Amortization -- -- -- -- -- Plant relocation costs -- -- -- -- -- --------------------------------------------------- --------------------------------------------------- -------------- Total 10,468 18,259 25,280 19,715 (5,436) --------------------------------------------------- --------------------------------------------------- -------------- Other income (expense) - net 1,104 2,233 5,077 4,527 4,187 --------------------------------------------------- --------------------------------------------------- -------------- Earnings (loss) before taxes on income 11,572 20,492 30,357 24,242 (1,249) Accounting changes -- -- -- -- -- Provision (benefit) for taxes on income 3,315 5,060 9,327 7,344 (1,341) --------------------------------------------------- --------------------------------------------------- ------------- Net earnings (loss) $ 8,257 $ 15,432 $ 21,030 $ 16,898 $ 92 --------------------------------------------------- --------------------------------------------------- --------------- OTHER FINANCIAL INFORMATION Cash from operations $ 28,250 $ 6,472 $ 14,210 $ (5,278) $ 3,658 --------------------------------------------------- --------------------------------------------------- --------------- Invested capital (monthly averages): Foodservice (2) $ 23,555 $ 25,099 $ 19,018 $ 22,859 $ 21,940 Cranes & related products 137,839 133,777 118,097 99,147 76,335 Marine 16,879 14,621 16,206 28,600 18,894 General corporate (2) 2,025 3,051 6,314 7,656 14,151 --------------------------------------------------- --------------------------------------------------- -------------- Total $180,298 $176,548 $159,635 $158,262 $131,320 --------------------------------------------------- --------------------------------------------------- -------------- IDENTIFIABLE ASSETS Foodservice (2) $ 25,608 $ 28,019 $ 24,168 $ 26,074 $ 27,449 Cranes & related products 138,416 136,995 115,804 96,623 75,217 Marine 19,253 18,009 22,683 32,451 24,049 General corporate (2) 41,829 35,983 50,143 61,966 82,374 --------------------------------------------------- --------------------------------------------------- ------------- Total $225,106 $219,006 $212,798 $217,114 $209,089 --------------------------------------------------- --------------------------------------------------- ------------- LONG-TERM OBLIGATION Long-term debt -- -- -- -- --
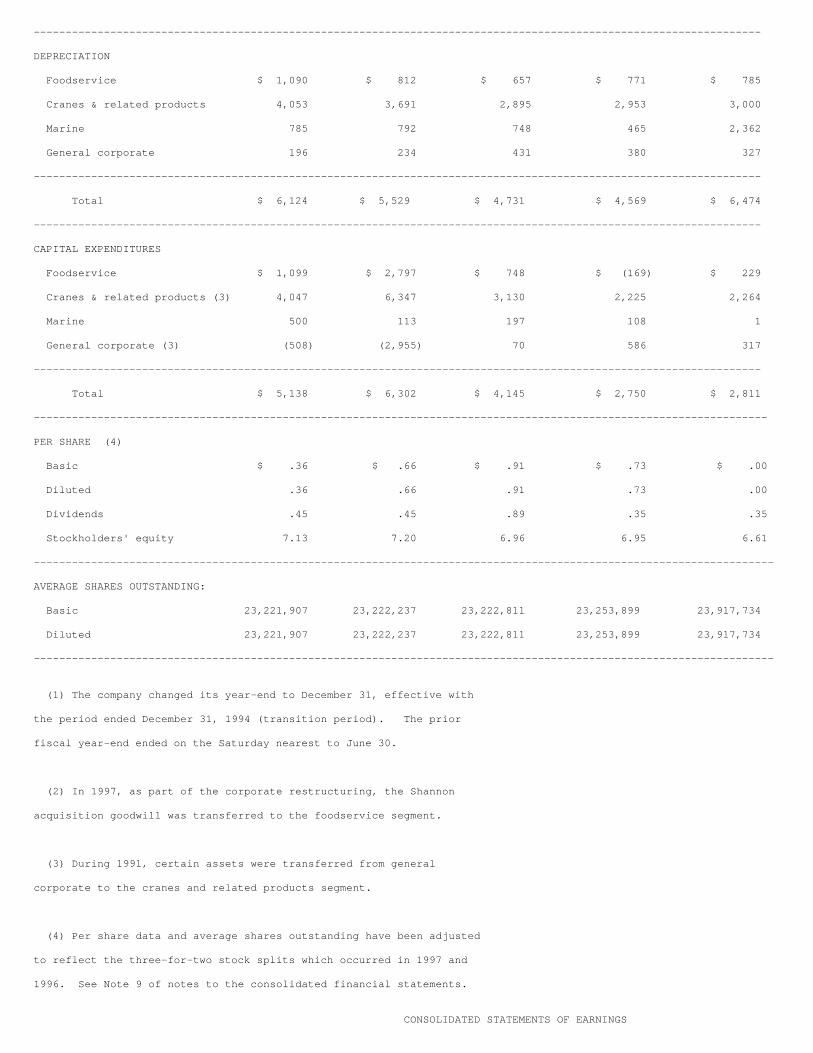
--------------------------------------------------- --------------------------------------------------- ------------ DEPRECIATION Foodservice $ 1,090 $ 812 $ 657 $ 771 $ 785 Cranes & related products 4,053 3,691 2,895 2,953 3,000 Marine 785 792 748 465 2,362 General corporate 196 234 431 380 327 --------------------------------------------------- --------------------------------------------------- ------------ Total $ 6,124 $ 5,529 $ 4,731 $ 4,569 $ 6,474 --------------------------------------------------- --------------------------------------------------- ------------ CAPITAL EXPENDITURES Foodservice $ 1,099 $ 2,797 $ 748 $ (169) $ 229 Cranes & related products (3) 4,047 6,347 3,130 2,225 2,264 Marine 500 113 197 108 1 General corporate (3) (508) (2,955) 70 586 317 --------------------------------------------------- --------------------------------------------------- ------------ Total $ 5,138 $ 6,302 $ 4,145 $ 2,750 $ 2,811 --------------------------------------------------- --------------------------------------------------- ------------- PER SHARE (4) Basic $ .36 $ .66 $ .91 $ .73 $ .00 Diluted .36 .66 .91 .73 .00 Dividends .45 .45 .89 .35 .35 Stockholders' equity 7.13 7.20 6.96 6.95 6.61 --------------------------------------------------- --------------------------------------------------- -------------- AVERAGE SHARES OUTSTANDING: Basic 23,221,907 2 3,222,237 23,222,811 23,253,899 23,917,734 Diluted 23,221,907 2 3,222,237 23,222,811 23,253,899 23,917,734 --------------------------------------------------- --------------------------------------------------- -------------- (1) The company changed its year-end to December 31, effective with the period ended December 31, 1994 (transition peri od). The prior fiscal year-end ended on the Saturday nearest to Ju ne 30. (2) In 1997, as part of the corporate restructuri ng, the Shannon acquisition goodwill was transferred to the foodser vice segment. (3) During 1991, certain assets were transferred from general corporate to the cranes and related products segmen t. (4) Per share data and average shares outstanding have been adjusted to reflect the three-for-two stock splits which occ urred in 1997 and 1996. See Note 9 of notes to the consolidated fina ncial statements.
CONSOLIDATED STATEMENTS OF EARNINGS

(Tho usands of dollars, except per share data) For The Years Ended December 31 ------------ --------------------------------------------------- --- 1998 1997 1996 ----------- --------- ------- EARNINGS Net Sales $694,822 $545,864 $500,465 --------- --------- --------- Costs and expenses: Cost of sales 499,201 393,264 365,824 Engineering, selling, and administrative expenses 98,120 84,231 79,551 Amortization 4,881 3,394 3,000 Plant relocation costs -- -- 1,200 --------- --------- --------- Total costs and expenses 602,202 480,889 449,575 --------- -------- --------- Earnings from operations 92,620 64,975 50,890 Interest expense (9,741) (6,230) (9,097) Interest and dividend income 117 190 394 Other income (expense) (1,584) (1,118) 319 --------- --------- --------- Earnings before taxes on income 81,412 57,817 42,506 Provision for taxes on income 30,032 21,394 16,863 --------- --------- --------- Net earnings $ 51,380 $ 36,423 $ 25,643 --------- --------- --------- PER SHARE DATA Basic $ 2.97 $ 2.11 $ 1.49 Diluted $ 2.95 $ 2.09 $ 1.48 The accompanying notes to consolidated financial st atements are an integral part of these financial statements.
CONSOLIDATED BALANCE SHEETS (T housands of dollars, except shares data)

As of December 3 1 ------------------------- ----------- 1998 1997 ---- ---- ASSETS CURRENT ASSETS Cash and cash equivalents $ 10,582 $ 11,888 Marketable securities 1,834 1,741 Accounts receivable, less allowances of $1,656 and $1,882 69,504 59,237 Inventories 81,978 54,701 Prepaid expenses and other 5,297 2,662 Future income tax benefits 21,682 15,287 --------- -------- Total current assets 190,877 145,516 --------- -------- Intangible assets - net 184,926 146,983 Property, plant and equipment - net 93,583 91,191 Other assets 11,628 12,678 --------- -------- Total assets $481,014 $396,368 --------- -------- LIABILITIES AND STOCKHOLDERS' EQUITY CURRENT LIABILITIES Accounts payable and accrued expenses $123,534 $ 96,540 Current portion of long-term debt 10,968 15,400 Short-term borrowings 48,500 49,100 Product warranties 15,110 9,772 --------- -------- Total current liabilities 198,112 170,812 --------- -------- NON-CURRENT LIABILITIES Long-term debt, less current portion 79,834 66,359 Postretirement health benefits obligation 19,705 19,699 Other liabilities 10,811 10,880 --------- -------- Total non-current liabilities 110,350 96,938 --------- --------

STOCKHOLDERS' EQUITY Common stock (24,497,655 shares issued in 1998 and 1997) 245 245 Additional paid-in capital 31,029 30,980 Accumulated other comprehensive income (212) (192) Retained earnings 222,687 179,088 Treasury stock, at cost (81,197) (81,503) --------- -------- Total stockholders' equity 172,552 128,618 --------- -------- Total liabilities and stockholders' equity $481,014 $396,368 --------- -------- The accompanying notes to consolidated financial st atements are an integral part of these financial statements.
CONSOLIDATED STATEMENTS OF CASH FLOWS (Thousands of dollars) For The Years Ended December 31 -------------------------------- 1998 1997 199 6 CASH FLOWS FROM OPERATIONS ------- ------- ----- -- Net earnings $ 51,380 $ 36,423 $ 25, 643 Adjustments to reconcile net cash from operations: Depreciation 9,729 8,318 8, 318 Amortization of goodwill 4,881 3,394 3, 000 Amortization of deferred financing fees 420 300 300 Deferred income taxes (5,748) (3,172) (4, 383) Plant relocation costs -- -- 1, 200 Loss on sale of property, plant, and equipment 928 218 259 Changes in operating assets and liabilities excluding effects of business acquisitions: Accounts receivable (6,120) 2,532 (2, 865) Inventories (18,662) (6,006) 8, 950 Other current assets (2,535) (1,264) 909 Non-current assets 483 842 324 Current liabilities 24,064 2,492 23, 432 Non-current liabilities (2,006) (490) ( 573)

--------- --------- ------ --- Net cash provided by operations 56,814 43,587 64, 514 --------- --------- ------ --- CASH FLOWS FROM INVESTING Business acquisitions - net of cash acquired (48,175) (66,979) ( 300) Capital expenditures (11,678) (12,040) (8, 396) Proceeds from sale of property, plant, and equipment 1,329 3,533 1, 443 Purchase of marketable securities - net (94) (84) (99) --------- --------- ------ --- Net cash used for investing (58,618) (75,570) (7, 352) --------- --------- ------ --- CASH FLOWS FROM FINANCING Dividends paid (7,781) (7,722) (7, 674) Proceeds from long-term debt 75,000 -- 15, 000 Payments on long-term debt (65,957) (11,606) (38, 704) Proceeds (payments) from short-term borrowings - net (600) 49,100 (26, 807) Debt acquisition costs (521) (290) -- Exercise of stock options 355 38 -- --------- --------- ------ --- Net cash provided by (used for) financing 496 29,520 (58, 185) --------- --------- ------ --- Effect of exchange rate changes on cash 2 (13) 310 --------- --------- ------ --- Net change in cash and cash equivalents (1,306) (2,476) ( 713) --------- --------- ------ --- Balance at beginning of year 11,888 14,364 15, 077 --------- --------- ------ --- Balance at end of year $ 10,582 $ 11,888 $ 14, 364 --------- --------- ------ --- SUPPLEMENTAL CASH FLOW INFORMATION Interest paid $ 8,490 $ 6,927 $ 8, 215 --------- --------- ------ ---

Income taxes paid $ 37,108 $ 21,449 $ 19, 319 --------- --------- ------ --- The accompanying notes to consolidated financial st atements are an integral part of these financial statements.
CONSOLIDATED STAT EMENTS OF STOCKHOLDERS' EQUITY AND COMPREHENSIVE INCOME (Thousand s of dollars, except shares and per share data) For The Years Ended December 31 --- --------------------------------------------------- ----------- 1998 1997 1996 -------- --------- -------- COMMON STOCK - SHARES OUTSTANDING Balance at beginning of year 17,269,175 11,511,357 7,674,468 Three-for-two stock split -- 5,755,679 3,836,889 Stock options exercised 39,694 3,296 -- Stock swaps for stock option exercises (4,291) (1,157) -- --------- -------- -------- Balance at end of year 17,304,578 17,269,175 1 1,511,357 --------- -------- -------- COMMON STOCK - PAR VALUE Balance at beginning of year $ 245 $ 163 $ 109 Three-for-two stock split -- 82 54 --------- -------- -------- Balance at end of year $ 245 $ 245 $ 163 --------- -------- -------- ADDITIONAL PAID-IN CAPITAL Balance at beginning of year $ 30,980 $ 31,061 $ 31,115 Three-for-two stock split -- (82) (54) Stock options exercised 49 1 -- --------- -------- -------- Balance at end of year $ 31,029 $ 30,980 $ 31,061 --------- -------- -------- ACCUMULATED OTHER COMPREHENSIVE INCOME Balance at beginning of year $ (192) $ 220 $ (479) Other comprehensive income (20) (412) 699 --------- -------- -------- Balance at end of year $ (212) $ (192) $ 220 --------- -------- --------
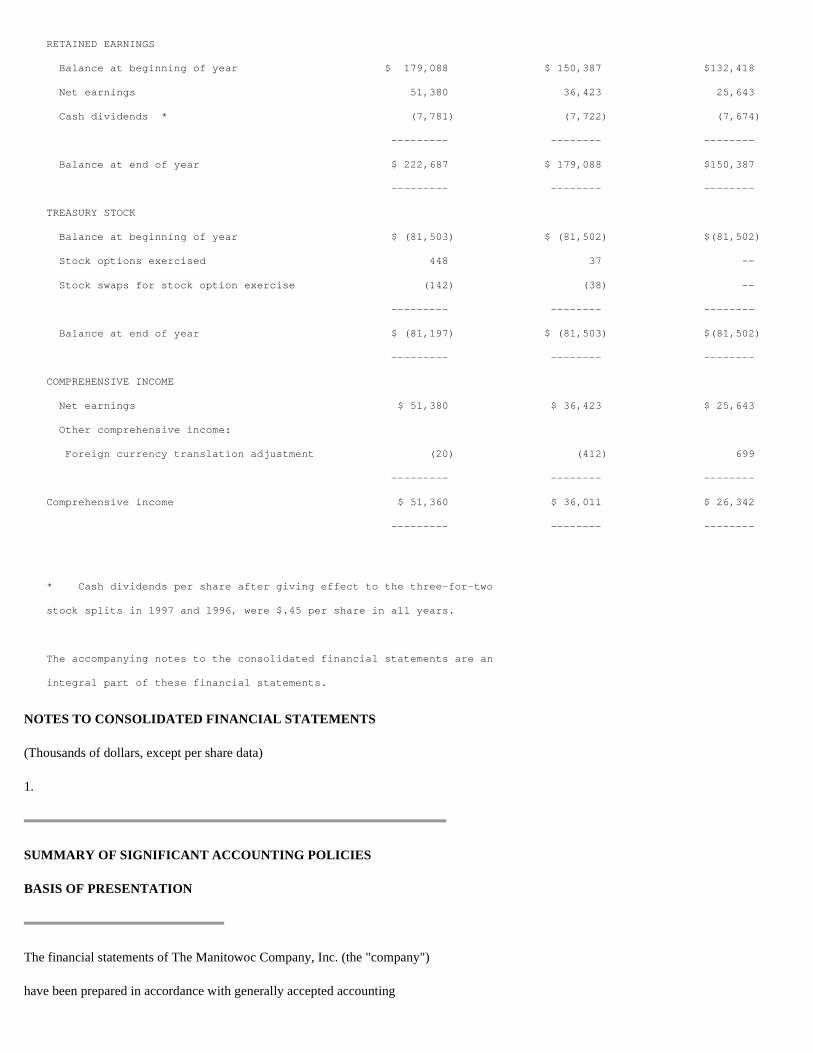
NOTES TO CONSOLIDATED FINANCIAL STATEMENTS
(Thousands of dollars, except per share data)
1.
SUMMARY OF SIGNIFICANT ACCOUNTING POLICIES
BASIS OF PRESENTATION
The financial statements of The Manitowoc Company, Inc. (the "company")
have been prepared in accordance with generally accepted accounting
RETAINED EARNINGS Balance at beginning of year $ 179,088 $ 150,387 $132,418 Net earnings 51,380 36,423 25,643 Cash dividends * (7,781) (7,722) (7,674) --------- -------- -------- Balance at end of year $ 222,687 $ 179,088 $150,387 --------- -------- -------- TREASURY STOCK Balance at beginning of year $ (81,503) $ (81,502) $(81,502) Stock options exercised 448 37 -- Stock swaps for stock option exercise (142) (38) -- --------- -------- -------- Balance at end of year $ (81,197) $ (81,503) $(81,502) --------- -------- -------- COMPREHENSIVE INCOME Net earnings $ 51,380 $ 36,423 $ 25,643 Other comprehensive income: Foreign currency translation adjustment (20) (412) 699 --------- -------- -------- Comprehensive income $ 51,360 $ 36,011 $ 26,342 --------- -------- -------- * Cash dividends per share after giving effect t o the three-for-two stock splits in 1997 and 1996, were $.45 per share in all years. The accompanying notes to the consolidated financia l statements are an integral part of these financial statements.

principles, which require management to make estimates and assumptions
that affect the reported amounts of assets, liabilities, revenues and
expenses for the years presented. They also affect the disclosures of
contingencies. Actual results could differ from those estimates.
PRINCIPLES OF CONSOLIDATION
The consolidated financial statements include the accounts of the
company and its wholly and partially owned domestic and non-U.S.
subsidiaries. Significant intercompany balances and transactions have
been eliminated.
COMPREHENSIVE INCOME
The company adopted Statement of Financial Accounting Standard (SFAS)
No. 130, "Reporting Comprehensive Income," in 1998. SFAS No. 130
establishes standards for reporting and display of comprehensive income
as defined, and its components within the financial statements, which
includes, in addition to net income, other items that are reported as
direct adjustments to stockholders' equity. Presently, the company's
foreign currency translation item is the only item which requires
inclusion in this statement. The company has reclassified the financial
statements of prior years for the adoption of this statement.
INVENTORIES
Inventories are stated at the lower of cost or market as described in
Note 4. Advance payments from customers are netted against inventories
to the extent of related accumulated costs. Advance payments netted
against inventories at December 31, 1998 and 1997 were $1,242 and
$1,574, respectively. Advance payments received in excess of related
costs on uncompleted contracts are classified as accrued expenses.
REVENUE RECOGNITION
Revenues and expenses in all business segments are generally recognized
upon shipment or completion of service provided. However, revenues and
costs on contracts for long-term projects are recognized according to
the percentage-of-completion method, commencing when work has progressed
to a state where estimates are reasonably accurate. These estimates are
reviewed and revised periodically throughout the lives of the contracts,
and adjustments to income resulting from such revisions are recorded in
the accounting period in which the revisions are made. Estimated losses
on such contracts are recognized in full when they are identified.
FOREIGN CURRENCY TRANSLATION
The financial statements of the company's non-U.S. subsidiaries are
translated using the current exchange rate for assets and liabilities
and the weighted average exchange rate for the year for statement of
earnings items. Resulting translation adjustments are recorded directly
to a separate component of stockholders' equity referred to as other
comprehensive income.
PROPERTY, PLANT AND EQUIPMENT
Property, plant and equipment is depreciated over the estimated useful
lives of the assets using the straight-line depreciation method for all
property acquired after June 29, 1991. Property acquired prior to June 30,
1991, is depreciated using the sum-of-the-years-digits method.
Property, plant and equipment is depreciated over the following
estimated useful lives:
Years
Buildings and improvements 40 Drydocks and dock fronts 15 -27 Machinery, equipment and tooling 4 -15
INTANGIBLE ASSETS
Intangible assets consist primarily of costs in excess of net assets of
businesses acquired (see Note 11). Intangible assets are amortized
using the straight-line method over their estimated beneficial lives,
not to exceed 40 years. Subsequent to an acquisition, the company
continually evaluates whether later events and circumstances have
occurred that indicate the remaining estimated useful life of
intangibles may warrant revision or that the remaining balance of
intangibles may not be recoverable. When factors indicate that
intangibles should be evaluated for possible impairment, the company
uses an estimate of the related business' discounted net cash flows over
the remaining life of the intangibles in measuring whether the
intangibles are recoverable. Intangible assets at December 31, 1998 and
1997 of $184,926 and $146,983, respectively, are net of accumulated
amortization of $12,545 and $7,244, respectively.
FAIR VALUE OF FINANCIAL INSTRUMENTS
The carrying amounts reported in the consolidated balance sheets for
cash and cash equivalents, accounts receivable, accounts payable and
short-term borrowings approximate fair value due to the immediate short-
term maturity of these financial instruments. The carrying amount
reported for long-term debt approximates fair value since either the
underlying instrument bears interest at a variable rate that reprices
frequently or the interest rate approximates the market rate at December
31, 1998.
The fair value of interest rate swaps is the amount at which they could
be settled, based on estimates obtained from financial institutions (see
Computer hardware and software 5 Vehicles 4-5

Note 6).
DERIVATIVE FINANCIAL INSTRUMENTS
Derivative financial instruments are used by the company to manage risks
associated with interest rate market volatility. Interest rate swap
agreements are used to modify the company's exposure to interest rate
movements and reduce borrowing costs. For interest rate swap
agreements, net interest payments or receipts are recorded as
adjustments to interest expense on a current basis. In June 1998, the
Financial Accounting Standards Board issued SFAS No. 133, "Accounting
for Derivative Instruments and Hedging Activities." This statement is
effective for the company's 2000 financial statements. It requires all
derivative instruments to be recorded on the balance sheet as assets or
liabilities, at their fair value. Changes in the fair value of
derivatives are recorded each period in current earnings or
comprehensive income, depending on whether the derivative is designated
as a part of a hedge transaction and if it is, the type of hedge
transaction. The adoption of this statement is not anticipated to have
a significant impact on the company's earnings or financial position.
INCOME TAXES
The company utilizes the liability method to recognize deferred tax
assets and liabilities for the expected future income tax consequences
of events that have been recognized in the company's financial
statements. Under this method, deferred tax assets and liabilities are
determined based on the temporary differences between financial
statement carrying amounts and the tax basis of assets and liabilities
using enacted tax rates in effect in the years in which the temporary
differences are expected to reverse.
POSTRETIREMENT BENEFITS OTHER THAN PENSIONS

The expected cost of postretirement health care benefits is recorded
during the years that the employees render service.
RESEARCH AND DEVELOPMENT
Research and development costs are charged to expense as incurred and
amount to $4,704 in 1998, $4,412 in 1997, and $3,502 in 1996.
WARRANTIES
Estimated warranty costs are provided at the time of sale of the
warranted products, based on historical warranty experience for the
related product.
EARNINGS PER SHARE
Basic earnings per share is computed by dividing net earnings by the
weighted average shares outstanding during each year/period. Diluted
earnings per share is computed similar to basic earnings per share
except that the weighted average shares outstanding is increased to
include the number of additional shares that would have been outstanding
if stock options were exercised and the proceeds from such exercise were
used to acquire shares of common stock at the average market price
during the year/period.
CASH EQUIVALENTS
All short-term investments purchased with an original maturity of three
months or less are considered cash equivalents.
ENVIRONMENTAL LIABILITIES
The company accrues for losses associated with environmental remediation
obligations when such losses are probable and reasonably estimable.

Such accruals are adjusted as information develops or circumstances
change. Costs of future expenditures for environmental remediation
obligations are not discounted to their present value.
RECLASSIFICATIONS
Certain reclassifications have been made to the financial statements of
prior years to conform to the presentation for 1998.
2.
PROPERTY, PLANT AND EQUIPMENT
Property, plant and equipment is summarized at December 31 as follows:
3.
MARKETABLE SECURITIES
Marketable securities at December 31, 1998 and 1997 included $1.8
million and $1.7 million, respectively, of securities which are
available for sale. The difference between fair market value and cost
for these investments was not significant in either year.
4.
1998 1997 ---- ---- Land $ 3,207 $ 3,133 Buildings 64,230 63,276 Drydocks and dock fronts 21,675 21,743 Machinery, equipment and tooling 118,230 111,919 Construction in progress 4,018 2,760 --------- --------- Total cost 211,360 202,831 Less accumulated depreciation (117,777) (111,640) --------- --------- Property, plant and equipment - net $ 93,583 $ 91,191 --------- ---------

INVENTORIES
The components of inventories are summarized at December 31 as follows:
Inventories are carried at the lower of cost or market using the first-
in, first-out (FIFO) method for 47% and 60% of total inventory for 1998
and 1997, respectively. The remainder of the inventories are costed
using the last-in, first-out (LIFO) method.
5.
ACCOUNTS PAYABLE AND ACCRUED EXPENSES
Accounts payable and accrued expenses are summarized at December 31 as
follows:
6.
1998 1997 ---- ---- Components: Raw materials $ 32,564 $ 25,881 Work-in-process 27,882 22,331 Finished goods 42,304 27,972 ------- -------- Total inventories at FIFO cost 102,750 76,184 Excess of FIFO cost over LIFO value (20,772) (21,483) ------- -------- Total inventories $ 81,978 $ 54,701 ------- --------
1998 1997 ---- ---- Trade accounts payable $ 43,603 $ 34,070 Profit sharing and incentives 24,851 20,630 Income taxes payable 4,905 5,766 Customer progress payments 7,209 207 Accrued product liability 10,167 7,795 Miscellaneous accrued expenses 32,799 28,072 -------- --------- Total $123,534 $ 96,540 -------- ---------

DEBT
Long-term debt is summarized at December 31 as follows:
The company entered into a Credit Agreement ("Agreement") on December 1,
1995 with a group of banks to fund the purchase of The Shannon Group,
Inc. (see Note 11). The Agreement was amended and restated on October
28, 1997 at the time of the SerVend acquisition and amended again on
October 21, 1998. Currently, the Agreement provides for maximum
borrowings of $78 million under a term loan and maximum borrowings of
$125 million under revolving loans. There were $48.5 million and $49.1
million of borrowings under the revolving loan portion of the Agreement
at December 31, 1998 and 1997, respectively.
The Agreement includes covenants the most restrictive of which require
the maintenance of various debt and net worth ratios. Annual commitment
fees at the end of 1998 were 0.15% on the unused portion of the
available credit. Borrowings under the Agreement bear interest at a
rate equal to the sum of a base rate, or LIBOR rate (London Interbank
Offered Rate), at the option of the company, plus an applicable
percentage, as defined. The base rate is equal to the greater of the
Federal Funds rate in effect on such day plus .5% or the prime rate in
effect on such day. The weighted average interest rate for the term and
1998 1997 ---- ---- Term loan payable $ 10,479 $ 75,390 Notes payable 75,000 -- Capital lease obligations 5,323 6,369 -------- -------- 90,802 81,759 Less current portion 10,968 15,400 -------- -------- $ 79,834 $ 66,359 ======== ========

revolving loans at December 31, 1998 and 1997 was 6.28% and 6.50%,
respectively. Payments of principal and interest for the term loan are
due quarterly through September 30, 1999. Borrowings under the
Agreement are not collateralized.
On April 2, 1998, the company privately placed, with Prudential
Insurance Company, $50 million in principal amount of Series A Senior
Notes. On October 31, 1998, the company issued, also with Prudential
Insurance Company, $25 million in principal amount of Senior Shelf Notes
(collectively referred to as the "Notes"). The company used the
proceeds from the sale of the Notes to pay down existing borrowings
under the term loan and finance its acquisition in 1998.
The Notes are not collateralized and bear interest at the fixed weighted
average rate of 6.53%. The Notes mature in 12 years and require
principal payments beginning in the eighth year after issuance. The
agreement between the company and Prudential Insurance Company pursuant
to which the Notes were issued (the "Note Agreement") includes covenants
the most restrictive of which require the company to maintain certain
debt ratios and levels of net worth. These covenants are no more
restrictive than the covenants made by the company in connection with
the aforementioned Credit Agreement.
The company has entered into interest rate swap agreements, which expire
at various times through October 2002, to reduce the impact of changes
in interest rates on its floating rate debt. At December 31, 1998, the
company had outstanding two interest rate swap agreements with financial
institutions, having a total notional principal amount of $22.6 million.
The effect of these agreements on the company's interest rates during
1998 was not significant. Interest expense has been adjusted for the
net receivable or payable under these agreements. The fair value of
these interest rate swap agreements is a negative $0.6 million at
December 31, 1998. The company is exposed to credit loss in the event

of non-performance by the financial institutions. However, management
does not anticipate such non-performance.
Capital lease obligations relate to the company's obligations on two
property leases for industrial property located in the State of
Tennessee and one in the State of Indiana. These obligations are due in
monthly or annual installments including principal and interest at rates
varying from 3.8% to 10.0%. These obligations mature at various dates
through 2004.
The aggregate scheduled maturities of long-term debt and capital lease
obligations in subsequent years are as follows:
7.
INCOME TAXES
Components of earnings before income taxes are as follows:
1999 $ 10,968 2000 691 2001 747 2002 246 2003 250 Thereafter 77,900 -------- $ 90,802 ========
1998 1997 1996 ---- -------- --------- Earnings before income taxes: Domestic $ 81,081 $ 58,706 $ 41,702 Foreign 331 (889) 804 -------- -------- -------- TOTAL $ 81,412 $ 57,817 $ 42,506 -------- -------- -------- The provision for taxes on income is as follows:

The Federal statutory income tax rate is reconciled to the company's
effective income tax rate as follows:
The deferred income tax accounts reflect the impact of temporary
differences between the basis of assets and liabilities for financial
reporting purposes and their related basis as measured by income tax
regulations. A summary of the deferred income tax accounts at December
1998 1997 1996 -------- -------- --------- Current: Federal $ 32,251 $ 22,307 $ 17,743 State 3,424 1,973 3,190 Foreign 105 286 313 -------- -------- -------- Total current 35,780 24,566 21,246 -------- -------- -------- Deferred - federal and state (5,748) (3,172) (4,383 ) -------- -------- -------- Total deferred (5,748) (3,172) (4,383 ) -------- -------- -------- Provision for taxes on income $ 30,032 $ 21,394 $ 16,863 ======== ======== ========
1998 1997 1996 -------- -------- --------- Federal income tax at statutory rate 35.0 % 35.0 % 35.0 % State income taxes, net of federal income tax benefit 2.6 2.2 4.8 Non-deductible goodwill amortization 1.1 1.4 1.7 Tax-exempt FSC income (1.1) (1.9) (1.3) Adjustments to prior years' income tax accruals -- (1.1) (0.9) Provision for tax on foreign income, net of foreign tax credits -- 1.5 0.2 Elimination of valuation allowance (1.0) -- -- Other 0.3 (0.1) 0.2 -------- -------- -------- Provision for taxes on income 36.9 % 37.0 % 39.7 % ======== ======== ========

31 is as follows:
The company does not provide for taxes which would be payable if
undistributed earnings of foreign subsidiaries or its foreign affiliate
were remitted because the company either considers these earnings to be
invested for an indefinite period or anticipates that when such earnings
are distributed, the U.S. income taxes payable would be substantially
1998 1997 -------- -------- Current deferred tax assets: Inventories $ 3,559 $ 2,503 Accounts receivable 793 312 Product warranty reserves 4,567 3,715 Product liability reserves 3,988 3,074 Environmental reserves 194 59 Future customer discount reserves 742 655 Other employee-related benefits and allowances 4,616 2,985 Property, plant and equipment 1,205 599 Other 2,018 1,385 -------- -------- Future income tax benefits, current $ 21,682 $ 15,287 ======== ======== Non-current deferred tax assets (liabilities): Property, plant and equipment $(10,040) $ (8,337) Postretirement benefits other than pensions 7,694 7,903 Deferred employee benefits 3,034 2,321 Severance benefits 1,167 1,098 Product warranty reserves 1,057 1,123 Environmental reserves 458 431 Net operating loss carryforwards 2,186 2,556 Other 11 -- Valuation allowance -- (881) -------- -------- Net future income tax benefits, non-current $ 5,567 $ 6,214 ======== ========

offset by foreign tax credits.
As of December 31, 1998, the company has approximately $16.3 million of
state net operating loss carryforwards, which are available to reduce
future state tax liabilities. The company also has acquired federal net
operating losses of $4.8 million available to reduce federal taxable
income. These loss carryforwards expire in varying amounts through
2012. A valuation allowance was recorded at December 31, 1997 to
reflect the estimated amount of deferred assets which may not be
realized due to the possible limitation on the future use of certain
state tax net operating loss carryforwards. During 1998, the company
eliminated the valuation allowance to reflect certain tax strategies
designed to utilize these net operating loss carryforwards.
8.
EARNINGS PER SHARE
The following is a reconciliation of the average shares outstanding used
to compute basic and diluted earnings per share. There is no earnings
impact from the assumed conversions of the stock options in any of the
years.
1998 1997 1996 -------------------- ------------------- -------------------- Per Per Per Share Share Share Shares Amount Shares Amount Shares Amount ----- ----- ----- ----- ----- ----- Basic EPS 17,288,237 $2.97 1 7,267,121 $2.11 17,267,035 $1.49 ===== ===== ==== Effect of Dilutive Securities - Stock Options 128,474 130,565 62,197 ---------- -------- -------- Diluted EPS 17,416,711 $ 2.95 1 7,397,686 $2.09 17,329,232 $1.48 ========== ===== = ========= ===== ======== ====

9.
STOCKHOLDERS' EQUITY
Authorized capitalization consists of 75 million shares of $.01 par
value common stock and 3.5 million shares of $.01 par value preferred
stock. None of the preferred shares have been issued. Pursuant to a
Rights Agreement dated August 5, 1996, each common share carries with it
two-thirds of a Right (as adjusted to reflect the 1997 three-for-two
stock split) to purchase additional stock. The Rights are not currently
exercisable and cannot be separated from the shares unless certain
specified events occur, including the acquisition of 20% or more of the
common stock by a person or group, or the commencement of a tender offer
for 20% or more of the common stock. In the event a person or group
actually acquires 20% or more of the common stock, or if the company is
merged with an acquiring person, subject to approval by the board of
directors, each Right permits the holder to purchase one share of common
stock for $100. The Rights expire on September 18, 2006 and may be
redeemed by the company for $.01 per Right (in cash or stock) under
certain circumstances.
All references in the financial statements to average number of common
shares outstanding and related earnings per share amounts, market prices
per share of common stock, and stock option plan data have been restated
to reflect the company's three-for-two stock splits of its common stock
on May 19, 1997 and July 2, 1996.
10.
STOCK OPTIONS
The Manitowoc Company, Inc. Stock Plan (the "Plan") provides for the
granting of stock options as an incentive to certain key employees.
Under the Plan, stock options to acquire up to 1.125 million shares of

common stock, in the aggregate, may be granted under a time-vesting
formula at an exercise price equal to the market price of the common
stock at the date of grant. The options become exercisable in equal 25%
increments beginning on the second anniversary of the grant date over a
four year period and expire ten years subsequent to the grant date.
Stock option transactions for the years ended December 31, 1998, 1997
and 1996 are summarized as follows:
The outstanding stock options at December 31, 1998 have a range of
exercise prices of $11.67 to $45.81 per option. Options with exercise
prices ranging between $11.67 and $14.89 per option have a remaining
weighted average contractual life of 7.0 years; of such options, 15,224
options with an exercise price of $11.67 per option are currently
exercisable and 20,865 options with an exercise price of $14.89 per
option are currently exercisable. Options with an exercise price of
$28.17 and $48.12 per option have a remaining contractual life of
approximately 8.4 years and 9.6 years, respectively; of such options,
none are currently exercisable. The weighted average fair value at date
1998 1997 1996 -------------------- ------- ---------------------------- -- ------------------------- Wei ghted Weighted Weighted Ave rage Average Average Exe rcise Exercise Exercise Shares Pr ice Shares Price S hares Price ------ --- ---- --------- -------- -- ----- -------- Options outstanding, beginning of year 405,454 $20.49 215,100 $ 13.45 96,075 $11.67 Options granted 139,600 $45.81 193,650 $ 28.17 119,025 $14.89 Options exercised (39,694) $12.50 (3,296) $ 11.67 -- -- Options forfeited (98,689) $28.78 -- -- -- -- -------- ------- ------- Options outstanding, end of year 406,671 $27.95 405,454 $ 20.49 215,100 $13.45 ======== ======= ======= Options exercisable, end of year 36,089 20,722 -- ======== ======= =======

of grant for options granted during 1998, 1997, and 1996 was $17.65,
$9.44, and $4.69 per option, respectively. The fair value of options at
date of grant was estimated using the Black-Scholes option pricing model
with the following weighted average assumptions:
The company applies Accounting Principles Board Opinion No. 25, under
which no compensation cost has been recognized in the statements of
earnings. Had compensation cost been determined under an alternative
method suggested by SFAS No. 123, "Accounting for Stock-Based
Compensation," net income would have decreased $547, $263 and $82 in
1998, 1997, and 1996, respectively; and diluted earnings per share would
have been $2.92, $2.07 and $1.48 in 1998, 1997, and 1996, respectively.
11.
ACQUISITIONS
On November 3, 1998, the company acquired substantially all of the net
business assets of U.S. Truck Crane, Inc. ("USTC"), from a subsidiary of
UK-based Powerscreen International PLC. Located in York, Pennsylvania,
USTC builds three proprietary product lines, including boom trucks,
rough terrain forklifts, and other types of material handling equipment.
The aggregate consideration paid by the company for the net assets of
USTC was $53,927 which includes direct acquisition costs of $337 and
assumed liabilities of $8,067. The purchase price paid for USTC is
1998 1997 1996 ---- ---- ---- Expected life (years) 7 7 7 ------- ------- ------- Risk-free interest rate 5.8 % 6.7 % 6.8 % ------- ------- ------- Expected volatility 31.9 % 27.6 % 25.4 % ------- ------- ------- Expected dividend yield 1.5 % 2.3 % 2.4 % ------- ------- -------

subject to a post-closing adjustment as set forth in the Purchase and
Sale Agreement. The company has not recorded any adjustment to the
purchase price based upon the post-closing adjustment at December 31,
1998. The acquisition of USTC was financed through a combination of the
company's credit facilities under the Credit Agreement and Note
Agreement (see Note 6).
The acquisition of USTC has been recorded using the purchase method of
accounting. The cost of the acquisition has been allocated on the basis
of the estimated fair values of the assets acquired and the liabilities
assumed. The preliminary estimate of the excess of the cost over the
fair value of the net assets acquired is $40,636, which includes $38,736
of goodwill and is being amortized over a weighted average life of 38
years. The results of USTC's operations subsequent to the date of
acquisition are included in the Consolidated Statements of Earnings for
the year ended December 31, 1998.
The following unaudited information presents, on a pro-forma basis, the
USTC acquisition as if it had occurred at the beginning of the year
indicated:
On October 31, 1997, the company acquired substantially all of the net
assets and business operated by SerVend International, Inc. ("SerVend")
from SerVend and its affiliate, Fischer Enterprises, Ltd. SerVend is
one of the world's largest manufacturers of ice/beverage dispensers and
1998 1997 ---- ---- Net sales $723,178 $ 575,332 -------- - ------- Net earnings $ 52,476 $ 36,837 -------- - ------- Basic earnings per share $ 3.04 $ 2.13 -------- - ------- Diluted earnings per share $ 3.01 $ 2.12 -------- - -------

dispensing valves for the soft drink industry. Its customers include
many of the major quick-service restaurant chains, convenience stores,
and soft-drink bottlers in the nation.
The aggregate consideration paid by the company for the net business
assets of SerVend was $72,946 which includes cash acquired of $119,
direct acquisition costs of $1,167 and assumed liabilities of $6,250.
The acquisition has been recorded using the purchase method of
accounting. The cost of the acquisition has been allocated on the basis
of the estimated fair values of the assets acquired and the liabilities
assumed. The excess of the cost over the fair value of the net assets
acquired of $57,596 is being amortized over a weighted average life of
36 years. The results of SerVend's operations subsequent to the date of
acquisition are included in the Consolidated Statements of Earnings for
the years ended December 31, 1998 and 1997.
The following unaudited information presents on a pro forma basis, the
SerVend acquisition as if it had occurred at the beginning of 1997:
On January 8, 1999, the company acquired all of the outstanding common
stock of Purchasing Support Group ("PSG"), a four-member beverage
service organization that was formed in 1997, for $38.0 million in cash.
The four companies which combined to form PSG are the Chandler Wingfield
Co., Inc.; the Chester Paul Company; Funkhouser Associates, Inc.; and
Larry Scott & Associates, Inc. Individually, each of the companies
comprising PSG have been serving soft-drink bottling operations
throughout the United States since the 1960's with a variety of
Net sales $587,376 -------- Net earnings $ 35,711 -------- Basic earnings per share $ 2.07 -------- Diluted earnings per share $ 2.05 --------

equipment and services for beverage dispensing systems. The acquisition
was financed through the company's existing credit facilities.
12.
PLANT CONSOLIDATIONS AND ASSETS HELD FOR SALE
During the fourth quarter of 1996, the company's decision to consolidate
and close walk-in refrigeration plants located in Iowa and Tennessee
resulted in a $1.2 million charge to earnings in the Foodservice
segment. The charge includes a write-down to the estimated net
realizable values of the assets being abandoned and takes into
consideration future holding costs and costs related to the sale of the
properties. During 1998 and 1997, $127 and $132 was charged against the
reserve, respectively.
The company holds assets for sale which include land and improvements,
buildings, and certain machinery and equipment at the "Peninsula
facility" located in Manitowoc, Wisconsin. The current carrying value
of these assets, and certain of the assets mentioned above, determined
through independent appraisals, is approximately $3.5 million and is
included in other assets at December 31, 1998. The company has reserved
for the future holding costs, which are included in accounts payable and
accrued expenses, consisting primarily of utilities, security,
maintenance, property taxes and insurance. The company has also
recorded reserves for potential environmental liabilities on the
Peninsula location. During the years ended December 31, 1998, 1997 and
1996, $(54), $35 and $1,100 was charged against these reserves,
respectively.
13.
CONTINGENCIES
The United States Environmental Protection Agency ("EPA") has identified

the company as a Potentially Responsible Party ("PRP") under the
Comprehensive Environmental Response Compensation and Liability Act
("CERCLA"), liable for the costs associated with investigating and
cleaning up contamination at the Lemberger Landfill Superfund Site (the
"Site") near Manitowoc, Wisconsin.
Approximately 150 PRP's have been identified as having shipped
substances to the Site. Eleven of the potentially responsible parties
have formed a group (the Lemberger Site Remediation Group, or "LSRG")
and have successfully negotiated with the EPA and the Wisconsin
Department of Natural Resources to settle the potential liability at the
Site and fund the cleanup.
Recent estimates indicate that the total costs to clean up the Site are
approximately $30 million. Although liability is joint and several, the
company's percentage share of liability is estimated to be 11% of the
total cleanup costs. Prior to December 31, 1996, the company accrued
$3.3 million in connection with this matter. Expenses recorded in 1998,
1997 and 1996 were insigificant. Remediation work at the Site has been
completed, with only long-term pumping and treating of ground water and
Site maintenance remaining. The remaining estimated liability for this
matter, included in other current and noncurrent liabilities at December
31, 1998, is $1.1 million.
As of December 31, 1998, 25 product-related lawsuits were pending. Of
these, one occurred between 1985 and 1990 when the company was
completely self-insured. The remaining lawsuits occurred subsequent to
June 1, 1990, at which time the company has insurance coverages ranging
from a $5.5 million self-insured retention with a $10.0 million limit on
the insurer's contribution in 1990, to the current $1.0 million self-
insured retention for Cranes and Marine cases ($0.1 million for
Foodservice cases) and $50.0 million limit on the insurer's
contribution.

Product liability reserves included in accounts payable and accrued
expenses at December 31, 1998 are $10.2 million; $5.2 million reserved
specifically for the 25 cases referenced above, and $5.0 million for
claims incurred but not reported. These reserves were estimated using
actuarial methods. The reserve for the one uninsured claim is
insignificant. The highest current reserve for an insured claim is $0.9
million. Based on the company's experience in defending itself against
product liability claims, management believes the current reserves are
adequate for estimated settlements on aggregate self-insured and insured
claims. Any recoveries from insurance carriers are dependent upon the
legal sufficiency of claims and the solvency of insurance carriers.
It is reasonably possible that the estimates for environmental
remediation and product liability costs may change in the near future
based upon new information which may arise. Presently, there is no
reliable means to estimate the amount of any such potential changes.
The company is also involved in various other legal actions arising in
the normal course of business. After taking into consideration legal
counsels' evaluation of such actions, in the opinion of management,
ultimate resolution is not expected to have a material adverse effect on
the consolidated financial statements.
14.
RETIREMENT AND HEALTH CARE PLANS
During 1998, the company adopted SFAS No. 132, "Employers' Disclosures
about Pensions and Other Postretirement Benefits," which revises
disclosures about pensions and postretirement plans. This statement did
not change the measurement or recognition of the company's plans, but
resulted in additional disclosures.
The company provides retirement benefits through noncontributory
deferred profit sharing plans covering substantially all employees.

Company contributions to the plans are based upon formulas contained in
such plans. The company also has a defined contribution plan in which
the company matches 25% of participant contributions up to a maximum of
5% of a participant's compensation. Total costs incurred under these
plans were $12,909, $10,371 and $8,810, in 1998, 1997 and 1996,
respectively.
The company also provides certain health care benefits for eligible
retired employees. Substantially all of the company's domestic
employees hired before January 1, 1990, may become eligible for these
benefits if they reach a normal retirement age while working for the
company and satisfy certain years-of-service requirements.
The components of the periodic postretirement health benefit cost are as
follows:
The following is a reconciliation of the change in the accumulated
periodic postretirement health benefit obligation from January 1, 1997
through December 31, 1998 and a reconciliation of the postretirement
benefit obligation to the accrued amount at December 31, 1998 and 1997:
1998 1997 1996 ----- ------ ------- Service cost - benefits earned during the year $ 296 $ 260 $ 260 Interest cost on accumulated postretirement health benefit obligation 1,144 1,088 1,044 Amortization of actuarial gain (127) (197) (136) ------ ------ ------ Net periodic postretirement health benefit cost $ 1,313 $1,151 $1,168 ------ ------ ------
1998 1997 ---- ---- Benefit obligation, beginning of year $ 15,712 $ 14,822 Service cost 296 260

The health care cost trend rate assumed in the determination of the
accumulated postretirement benefit obligation is 6% in 1998, decreases
1.0% to 5.0% for 1999, and remains at that level thereafter. Increasing
the assumed medical trend rates by one percentage point in each year
would increase the accumulated postretirement health benefit obligation
by $2,180 at December 31, 1998 and the aggregate of the service and
interest cost components of net periodic postretirement health benefit
cost by $229 for 1998. Decreasing the assumed medical trend rates by
one percentage point in each year would decrease the accumulated
postretirement health benefit obligation by $1,789 at December 31, 1998
and the aggregate of the service and interest cost components of net
periodic postretirement health benefit costs by $215 for 1998.
The discount rate used in determining the accumulated postretirement
health benefit obligation is 7.25% for 1998 and 1997. The plan is
unfunded.
It is reasonably possible that the estimate for future retirement and
health care costs may change in the near future based upon changes in
the health care environment or changes in interest rates which may
arise. Presently, there is no reliable means to estimate the amount of
any such potential changes.
Interest cost 1,144 1,088 Participant contributions 818 768 Actuarial loss 567 449 Benefits paid (2,115) (1,675) ------- ------- Benefit obligation, end of year $ 16,422 $ 15,712 ======= ======= Status of the plan, unfunded $16,422 $15,712 Unrecognized net gain 3,283 3,987 ------- ------- Accrued benefit, end of year $19,705 $19,699 ======= =======

15.
LEASES
The company leases various property, plant and equipment. Terms of the
leases vary, but generally require the company to pay property taxes,
insurance premiums, and maintenance costs associated with the leased
property. Rental expense attributable to operating leases was $2,848,
$3,390 and $4,474 in 1998, 1997 and 1996, respectively. Total minimum
rental obligations under noncancelable operating leases, as of December
31, 1998, aggregated $20,160 and were payable as follows:
16.
BUSINESS SEGMENTS
The company adopted SFAS No. 131, "Disclosures about Segments of an
Enterprise and Related Information," in 1998. SFAS 131 supercedes SFAS
14, "Financial Reporting for Segments of a Business Enterprise,"
replacing the "industry segment" approach with the "management"
approach. The management approach designates the internal organization
that is used by management for making operating decisions and assessing
performance as the source of the company's reportable segments. SFAS
131 also requires disclosure about products and services, geographical
areas, and major customers. The segments reported by the company in
prior years have not been changed by the adoption of this statement.
The company has three reportable segments: Foodservice Equipment
("Foodservice"), Cranes and Related Products ("Cranes"), and Marine
Operations ("Marine").
Foodservice products consist primarily of commercial ice cube machines,
1999 $ 3,110 2002 $ 1,619 2000 $ 2,597 2003 $ 1,517 2001 $ 2,157 Thereafte r $ 9,160

dispensers, and related accessories, as well as commercial refrigerators
and freezers and beverage dispensers. Foodservice distributes its
products primarily in the United States, Southeast Asia and Europe.
Foodservice products serve the lodging, restaurant, health care, and
convenience store markets which are impacted by demographic changes and
business cycles.
Cranes products consist primarily of crawler and truck-mounted lattice
boom and hydraulic cranes and excavators which serve the construction,
energy, and mining industries. Cranes distributes its products
worldwide, primarily in the U.S., Southeast Asia, Middle East and
Europe. Cranes operations are tied most closely to energy and
infrastructure projects throughout the world.
Marine provides ship-repair services to foreign and domestic vessels
operating on the Great Lakes. Marine serves the Great Lakes maritime
market consisting of both U.S. and Canadian fleets, inland waterway
operators, and oceangoing vessels that transit the Great Lakes and St.
Lawrence Seaway.
The accounting policies of the segments are the same as those described
in the summary of significant accounting policies except that certain
expenses are not allocated to the segments. These unallocated expenses
are corporate overhead, intangible amortization, interest expense and
income taxes. The company evaluates segment performance based upon
profit or loss before the aforementioned expenses.
The company is organized primarily on the basis of products and is
broken down into 17 business units. Seven of the business units have
been aggregated into the Foodservice segment; seven of the business
units have been aggregated into the Cranes segment; and three of the
business units make up the Marine segment.
Information about reportable segments and a reconciliation of total
segment sales, profits and assets to the consolidated totals as of

December 31, 1998 and 1997 and for the years ending December 31, 1998,
1997 and 1996 are summarized on page 30. The following is sales and
long-lived asset information by geographic area as of and for the years
ended December 31:
Foreign revenue is based upon the location of the customer. Revenue
from no single foreign country was material to the consolidated sales of
the company.
17.
SUBSEQUENT EVENT
On February 17, 1999, the company's board of directors authorized a
three-for-two stock split of the company's shares in the form of a 50%
stock dividend payable beginning March 31, 1999 to shareholders of
record on March 1, 1999. The information in these financial statements
has not been restated to reflect this split. If the share data in these
financial statements had been adjusted for the split, diluted earnings
per share would have been $1.97, $1.39 and $0.99 for 1998, 1997 and
1996.
Sales Long-Lived Assets ----------------------- ---------------- ---------------------- 1998 1997 1996 1998 1997 ------- ------- ------- ------- ---- United States $616,129 $459,704 $432,905 $282,747 $244,789 Other North America 16,881 8,309 9,461 -- -- Europe 36,917 23,345 9,608 5,548 4,146 Asia 12,920 27,235 32,564 1,842 1,917 Middle East 5,610 3,289 5,329 -- -- Central & South America 1,949 14,766 3,541 -- -- Africa 1,774 663 565 -- -- South Pacific & Caribbean 2,642 8,553 6,492 -- -- -------- -------- -------- -------- --------- $694,822 $545,864 $500,465 $290,137 $250,852 ======= ======= ======= ======== =======

MANAGEMENT'S REPORT ON CONSOLIDATED FINANCIAL STATE MENTS
Company management is responsible for the integrity of this annual
report's consolidated financial statements. Those statements were
prepared in accordance with generally accepted accounting principles.
Where necessary, amounts are based on judgments and estimates by
management. All financial information in this report matches the
financial statements.
The company maintains an internal accounting system designed to provide
reasonable assurance that assets are safeguarded and that books and
records reflect only authorized transactions.
To further safeguard assets, the company has established an audit
committee composed of directors who are neither officers nor employees
of the company. The audit committee is responsible for reviewing the
company's financial reports and accounting practices and meets
periodically with the company's independent accountants.
The company's independent accountants provide an objective examination
of the company's financial statements. They evaluate the company's
system of internal controls and perform tests and other procedures
necessary to express an opinion on the fairness of the presentation of
the consolidated financial statements.
REPORT OF INDEPENDENT PUBLIC ACCOUNTANTS
To The Stockholders and Board of Directors of
The Manitowoc Company, Inc. and Subsidiaries
In our opinion, the accompanying consolidated balance sheets and the
/s/ Terry D. Growcock /s/ Robert R. Friedl -------------------------- ------------------------------ Terry D. Growcock Robert R. Friedl President & Senior Vice President & Chief Executive Officer Chief Financial Officer

related consolidated statements of earnings, stockholders' equity and
comprehensive income, and cash flows present fairly, in all material
respects, the financial position of The Manitowoc Company, Inc. and its
Subsidiaries at December 31, 1998 and 1997, and the results of their
operations and their cash flows for the years ended December 31, 1998,
1997 and 1996, in conformity with generally accepted accounting
principles. These financial statements are the responsibility of the
company's management; our responsibility is to express an opinion on
these financial statements based on our audits. We conducted our
audits of these statements in accordance with generally accepted
auditing standards which require that we plan and perform the audit to
obtain reasonable assurance about whether the financial statements are
free of material misstatement. An audit includes examining, on a test
basis, evidence supporting the amounts and disclosures in the financial
statements, assessing the accounting principles used and significant
estimates made by management, and evaluating the overall financial
statement presentation. We believe that our audits provide a
reasonable basis for the opinion expressed above.
PRICEWATERHOUSECOOPERS LLP
Milwaukee, Wisconsin
January 26, 1999, except for information in Note 17, for which the date
is February 17, 1999
/s/ PricewaterhouseCoopers LLP ----------------------------------
SUPPLEMENTAL QUARTERLY FI NANCIAL INFORMATION (UNAUDITED) The table below presents unaudited quarterly data for the years ended December 31, 1998 and 1997 (Thousands of dollar s, except per share data) 1998 1997 ----------------------- ---------------------- -------------- ---------------------------- First Second Third Fourth First Sec ond Third Fourth ------ ------ ------ ------ ------ --- --- --------- ---------

The company's common stock is traded on the New York Stock Exchange.
The share prices shown above are not adjusted for the 1997 and 1996
three-for-two stock splits.
GLOSSARY
Financial Terms
BACKLOG: Firm, unfilled orders. An indicator of future sales.
BOOK VALUE: Another term for shareholder equity, most often shown on a
per-share basis.
CAPITALIZATION: The total market value of a company's outstanding stock
- that is, the stock price multiplied by the number of shares.
Generally, the higher the market cap, the larger the company and the
Net sales $154,139 $188,899 $184,023 $167,761 $116,041 $144 ,985 $133,935 $150,903 Gross margin 43,472 53,094 53,280 45,775 32,008 41 ,829 37,354 41,409 Net earnings 9,337 15,408 15,203 11,432 6,478 11 ,929 9,521 8,495 Per share amounts: * Basic earnings per share .54 .89 .88 .66 .38 .69 .55 .49 Diluted earnings per share .54 .88 .87 .66 .37 .69 .55 .49 Dividends per common share .11 .11 .11 .11 .11 .11 .11 .11 * Per share data adjusted to reflect the 1997 th ree-for-two stock split.
QUARTERLY COMMON STOCK PRICE RANGE Year Ended Year Ended Ye ar Ended December 31, 1998 December 31, 1997 Decemb er 31, 1996 ------------------ ------------------ ---------- ---------------- High Low Close High Low Close High Low Close ---- ---- ---- ---- ---- ----- ---- ---- ----- 1st Quarter $40.13 $29.13 $38.63 $40.00 $33.50 $36.13 $33.25 $27.75 $31.50 2nd Quarter 46.81 38.10 40.31 47.50 34.50 46.75 38.00 31.75 35.88 3rd Quarter 41.88 24.50 30.13 39.94 31.69 35.69 35.75 23.50 32.13 4th Quarter 44.38 24.69 44.38 38.19 29.50 32.50 43.88 31.50 40.50

less volatile the stock.
CASH FLOW: Funds generated by a company to operate the business, make
capital investments, repay debt, pay dividends, repurchase stock, and
make acquisitions.
COST OF CAPITAL: A weighted average of the after-tax cost of equity and
borrowed funds used to invest in operating capital for business.
CURRENT RATIO: Current assets divided by current liabilities, an
indicator of liquidity.
ECONOMIC VALUE-ADDED (EVA): Represents the growth in economic profit
from year to year.
OUTSOURCING: Contracting with an outside supplier to take over a
function that had been performed within the company.
PRICE TO EARNINGS RATIO: The price of a stock divided by its earnings
per share. Also known as P/E, multiple or valuation. This measure
tells investors how much they are paying for a company's earnings.
PRODUCT MIX: A company that sells more than one product can have its
amount of sales vary from year to year, even when the overall number of
units sold remains the same. This occurs when multiple products have
different sales values, or when a greater number of units with higher
sales values are sold in comparison to lower-priced units.
RETURN ON EQUITY: Net earnings divided by stockholders' equity; a
measurement of the amount earned on the shareholders' investment.
RETURN ON INVESTED CAPITAL: An EVA measurement of operating profit
after-tax divided by invested capital, an indicator of how efficiently
the company employs its assets.
STOCK REPURCHASE PLAN: A systematic approach in which a company
repurchases its stock. The result of this action increases the percent
of ownership each remaining shareholder has in the company.
TOTAL RETURN: Return on an investment that includes any dividends or
interest as well as price appreciation.

STOCKHOLDERS' EQUITY: A measurement of the amount earned on the
shareholders' investment.
Industry Terms
BLAST CHILLER: A refrigerated structure similar to a walk-in that is
specially designed to rapidly chill and/or freeze food items in
compliance with safety standards established by the FDA.
BOOM TRUCK: A hydraulic telescopic crane mounted to a commercial truck
chassis. A boom truck is different than a truck crane since it can haul
up to several thousand pounds of payload on its cargo deck.
CRAWLER CRANE: Usually refers to lattice-boom cranes that are mounted
on crawlers rather than a truck chassis. This method of mounting
significantly reduces ground bearing pressures and enables the crane to
pick-and-carry virtually any rated load.
FIVE-YEAR SURVEY: A thorough ship inspection and maintenance process
that must be performed every five years to satisfy stringent maritime
regulations developed by the U.S. Coast Guard, American Bureau of
Shipping, and other regulatory agencies.
GRAVING DOCK: An in-ground concrete structure in which ships can be
constructed or repaired. Because a graving dock is equipped with pumps
and watertight gates, it can be flooded so ships can float in, then be
pumped dry so crews can work on those portions of the ship that are
normally underwater.
ICE/BEVERAGE DISPENSER: A foodservice appliance that dispenses ice and
soft drinks for self-serve applications in quick-service restaurants and
convenience stores.
KIOSK: A limited-menu, walk-up, quick-service restaurant that sells
various food items usually prepared off-premise.
LATTICE BOOM: A fabricated structure usually consisting of four chords
and tubular lacings. Lattice booms are typically lighter in weight than

similar-length telescopic booms. In addition, lattice booms generally
provide higher lifting capacities than telescopic booms in most
situations.
LUFFING JIB: A fabricated structure similar to, but smaller than, a
lattice boom. Mounted at the tip of a lattice boom, luffing jibs can
readily adjust their angles of operation, a capability that is not
possible with conventional fixed-jib attachments.
REACH-IN: A refrigerated cabinet typically used in foodservice
applications for short-term storage of perishable items at safe-keeping
temperatures prior to preparation or serving.
RINGER: Manitowoc's patented heavy-lift attachment that dramatically
improves the reach, capacity, and lift dynamics of the basic crane which
it is mounted to.
SELF-UNLOADING VESSEL: Refers to the fleet of vessels operating on the
Great Lakes that are equipped with cargo-hold conveyors and lattice
discharge booms that enable these vessels to offload their bulk cargoes,
such as iron ore, coal, or cement, without requiring dockside assist
equipment.
TELESCOPIC BOOM: A box-section boom, composed of several overlapping
sections, that is extended or retracted to a desired length by hydraulic
or mechanical means.
TUG/BARGE: A new form of Great Lakes bulk cargo transportation that
consists of a non-powered notch barge that is pushed by a high-horse
power diesel tug.
WALK-IN: A large, foamed-in-place, refrigerated structure often found
in restaurants that can be equipped with cooling or freezing systems for
long-term storage of foodservice items prior to preparation.
INVESTOR INFORMATION
Corporate Headquarters

The Manitowoc Company, Inc.
500 South 16th Street
P. O. Box 66
Manitowoc, WI 54221-0066
Telephone: 920-684-4410
Telefax: 920-683-8129
Independent Public Accountants
PricewaterhouseCoopers LLP
100 East Wisconsin Avenue
Suite 1500
Milwaukee, WI 53202
Stock Transfer Agent and Registrar
First Chicago Trust Company of New York
P. O. Box 2500
Jersey City, NJ 07303-2500
Annual Meeting
The annual meeting of Manitowoc shareholders will be held at 9:00 a.m.,
CDT, on Tuesday, May 4, 1999, in the ballroom of the Holiday Inn at 4601
Calumet Avenue, Manitowoc, WI. We encourage shareholders to participate
in this meeting in person or by proxy.
Stock Listing
Manitowoc's common stock is traded on the New York Stock Exchange and is
identified by the ticker symbol MTW. Current trading volume, share
price, dividends, and related information can be found in the financial
section of most daily newspapers.

Quarterly common stock price information for our three most recent
fiscal years can be found on page 44 of this annual report.
Manitowoc Shareholders
On December 31, 1998, 17,304,587 shares of Manitowoc common stock were
outstanding. At such date, there were 2,633 shareholders of record.
Form 10-K Report
Each year, Manitowoc files its Annual Report on Form 10-K with the
Securities and Exchange Commission. Most of the financial information
contained in that report is included in the Annual Report to
Shareholders.
A COPY OF FORM 10-K AS FILED WITH THE SECURITIES AN D EXCHANGE COMMISSION
FOR 1998, MAY BE OBTAINED BY ANY SHAREHOLDERS, WITH OUT CHARGE, UPON
WRITTEN REQUEST TO:
E. Dean Flynn, Secretary
The Manitowoc Company, Inc.
P. O. Box 66
Manitowoc, WI 54221-0066
Dividends
Common stock dividends are usually considered in conjunction with
quarterly meetings of Manitowoc's board of directors.
Dividend Reinvestment And Stock Purchase Plan
The Dividend Reinvestment and Stock Purchase Plan provides a convenient
method to acquire additional shares of Manitowoc stock through the
investment of quarterly dividends. Shareholders may also purchase
shares by investing cash as often as once a month in varying amounts
from $10 up to a maximum of $60,000 each calendar year.

Participation is voluntary and all fees associated with stock purchases
under these plans are paid for by Manitowoc.
To receive an information booklet and enrollment form, please contact
our stock transfer agent and registrar, First Chicago Trust Company of
New York.
Investor Inquiries
Security analysts, portfolio managers, individual investors, and media
professionals seeking information about Manitowoc are encouraged to
contact the following:
Analysts & Portfolio Managers:
Robert R. Friedl, Senior Vice President & CFO
Telephone: 920-683-8136
Telefax: 920-683-8138
Media Inquiries:
Steven C. Khail, Corporate Communications Manager
Telephone: 920-683-8128
Telefax: 920-683-8138
General Inquiries:
Joan Risch, Shareholder Relations
Telephone: 920-683-8150
Telefax: 920-683-8138
Quarterly Earnings
Manitowoc is planning to announce its quarterly earnings for calendar
1999 according to the following schedule:
1st Quarter - April 13, 1999

Join MTW on the Internet
Manitowoc provides a variety of information about its businesses,
products, and markets at its website address:
http:\\www.manitowoc.com
Equal Opportunity
Manitowoc believes that a diverse workforce is required to compete
successfully in today's global markets. The company provides equal
employment opportunities in its global operations without regard to
race, color, age, gender, religion, national origin, or physical
disability.
2nd Quarter - July 12, 1999 3rd Quarter - October 12, 1999 4th Quarter - January 25, 2000
EXHIBIT 13 - APPENDIX A Cross Reference or Graph N arrative Discussion No. Description ----- ---------------------- - ------------------- 1 Bar Graph of Gross Margin Gros s Margin ($ Millions) for fiscal years 1993-1994 and for calendar years --------- -------------------------- 1995-1998. 19 93 56 19 94 68 19 95 75 19 96 135 19 97 153 19 98 196 2 Line Graph of Segment Segment Ope rating Margins ($ Millions) Operating Margins for fiscal years 1993-1994 ----------- --------------------------- and calendar years 1995-1998. Foodservi ce Cranes Marine

--------- -- ----- ----- 1993 18. 3 (2.0) 0.6 1994 21. 6 2.3 2.4 1995 22. 7 3.2 4.0 1996 34. 0 22.6 6.2 1997 36. 7 34.9 5.6 1998 53. 0 48.1 7.0 3 Bar Graph of Cash Flow Cash Flow F rom Operations ($ Millions) from Operations for fiscal years 1993-1994 and ----------- --------------------------- calendar years 1995-1998. 19 93 62.7 19 94 37.0 19 95 16.4 19 96 64.5 19 97 43.6 19 98 56.8 4 Bar Graph of Invested Capital Inve sted Capital ($ Millions) for fiscal years 1993-1994 and calendar years 1995-1998. ---- -------------------------- 1993 159 1994 130 1995 140 1996 243 1997 257 1998 340 Capital 5 Bar Graph of Capital Exp enditures Depreciation Expenditures and Depreciation for fiscal years 1993-1994 ($ Millions) and calendar years 1995-1998. ----- -------------------------- 1993 5.9 10.3 1994 6.3 5.3 1995 6.5 19.2 1996 8.3 8.4 1997 8.3 12.0 1998 9.7 11.7 Total Return (Dollars) 6 Line Graph of Total Return, including reinvestment of ----------------------- dividends on a quarterly Company S&P 500 S&P DMI basis, of Company Common Stock -------- -------- ------- against cumulative total returns 1993 100.00 100.00 100.00
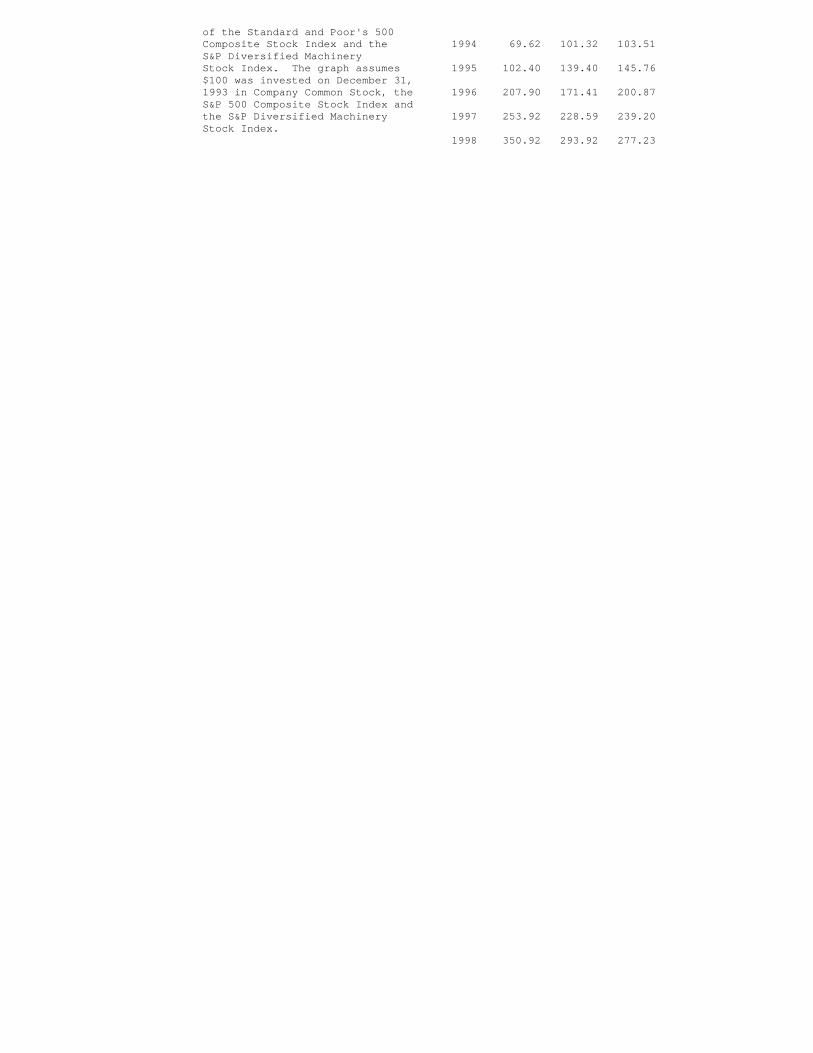
of the Standard and Poor's 500 Composite Stock Index and the 1994 69.62 101.32 103.51 S&P Diversified Machinery Stock Index. The graph assumes 1995 102.40 139.40 145.76 $100 was invested on December 31, 1993 in Company Common Stock, the 1996 207.90 171.41 200.87 S&P 500 Composite Stock Index and the S&P Diversified Machinery 1997 253.92 228.59 239.20 Stock Index. 1998 350.92 293.92 277.23

THE MANITOWOC COMPANY, INC.
NEWS FOR IMMEDIATE RELEASE
THE MANITOWOC COMPANY'S BOARD OF DIRECTORS
APPROVES THREE-FOR-TWO STOCK SPLIT
MANITOWOC, WISCONSIN, February 17, 1999 - The Manitowoc Company, Inc.
(NYSE:MTW) announced today that its board of directors has approved a
three-for-two stock split of the company's common shares in the form of
a 50 percent stock dividend. Manitowoc will distribute the stock
dividend as additional shares to shareholders of record on March 1,
1999. The company will arrange for issuance of these shares beginning
March 31, 1999. The broker cut-off date will be March 19, 1999.
Under the stock split, one new share of company common stock will be
issued for every two shares owned on the record date. Accordingly,
shareholders holding an odd number of shares will receive a fractional
share. Manitowoc's common stock purchase rights under its Rights
Agreement dated August 5, 1996, will also be appropriately adjusted to
reflect the stock split.
The three-for-two stock split will increase the number of outstanding
Manitowoc common shares from approximately 17.3 million to approximately
26.0 million. The company's common stock authorization previously
approved by shareholders is 75 million shares.
The quarterly dividend to be paid on March 10, 1999 to shareholders of
record on March 1, 1999, will be at a rate of 11-1/4 cents per share.
If the dividend were to be paid after the stock split, it would have
amounted to 7-1/2 cents per share. It is expected that any future
dividends on the new shares will be proportionately adjusted to reflect
the increased number of shares except for a possible minor adjustment
for rounding purposes. Manitowoc's directors are next scheduled to
consider another dividend payout at the May 4, 1999 meeting of the board
of directors.

"We are pleased once again to be able to offer our shareholders a stock
dividend," said Terry D. Growcock, Manitowoc president and chief
executive officer. "This is our third stock dividend in less than three
years and reflects our strong operating results and prospects for the
future. This action is intended to benefit our shareholders as well as
improve our stock trading liquidity over time." Manitowoc last split
its stock, also on a three-for-two basis, on June 30, 1997.
The Manitowoc Company, Inc., is a leading manufacturing of ice-cube
machines, ice/beverage dispensers, and commercial refrigeration
equipment for the foodservice industry. It is also a leading producer
of lattice-boom cranes, boom trucks, and related products for the
construction industry, and specializes in ship-repair, conversion, and
new construction services for the Great Lakes maritime industry.
Company Contact:
Glen E. Tellock
Vice President Finance & Treasurer
920-683-8122

EXHIBIT 21 1998 10-K
LIST OF SUBSIDIARIES
JURISDICTION SUBSIDIARY OF INCORPORATION
Femco Machine Co., Inc. Nevada Kolpak Manufacturing Company Tennessee Manitex, Inc. Texas Manitowoc MEC, Inc. Nevada Manitowoc Equipment Works PTE, Ltd. Singapore Manitowoc Equipment Works, Inc. Nevada Manitowoc Europe Holdings, Ltd. England Manitowoc Europe Limited England Manitowoc International Sales Corp. Barbados Manitowoc Korea Company, Ltd. Korea Manitowoc Marine Group, Inc. Nevada Manitowoc Re-Manufacturing, Inc. Wisconsin Manitowoc Western Company, Inc. Wisconsin North Central Crane & Excavator Sales Corp. Nevada West Manitowoc, Inc. Wisconsin Manitowoc CP, Inc. Nevada Manitowoc FP, Inc. Nevada KMT Refrigeration, Inc. Wisconsin Manitowoc Foodservice Group, Inc. Nevada Manitowoc Crane Group, Inc. Nevada Manitowoc Ice, Inc. Wisconsin Manitowoc Cranes, Inc. Wisconsin SerVend International, Inc. Nevada Manitowoc Beverage Systems, Inc. Nevada KMT Sales Corporation Nevada SerVend Sales Corporation Nevada USTC, Inc. Nevada

CONSENT OF INDEPENDENT ACCOUNTANTS
We consent to the incorporation by reference in the registration statements of
The Manitowoc Co., Inc. on Forms S-8 (File Nos. 33-48665 and 33-65316) of our
report dated January 26, 1999, except for information in Note 17, for which the
date is February 17, 1999, on our audits of the consolidated financial
statements and our report dated January 26, 1999 on the financial statement
schedule of The Manitowoc Company, Inc. and Subsidiaries as of December 31,
1998 and 1997, and for the years ended December 31, 1998, 1997 and 1996,
which reports are incorporated by reference and included, respectively, in
this Annual Report on Form 10-K.
/s/ PricewaterhouseCoopers LLP ------------------------------ PRICEWATERHOUSECOOPERS LLP March 1, 1999

End of Filing
© 2005 | EDGAR Online, Inc.
ARTICLE 5
MULTIPLIER: 1000
PERIOD TYPE 12 MOS FISCAL YEAR END DEC 31 1998 PERIOD START JAN 01 1998 PERIOD END DEC 31 1998 CASH 10582 SECURITIES 1834 RECEIVABLES 69504 ALLOWANCES 1656 INVENTORY 81978 CURRENT ASSETS 190877 PP&E 211360 DEPRECIATION 117777 TOTAL ASSETS 481014 CURRENT LIABILITIES 198112 BONDS 0 PREFERRED MANDATORY 0 PREFERRED 0 COMMON 245 OTHER SE 172307 TOTAL LIABILITY AND EQUITY 481014 SALES 694822 TOTAL REVENUES 694822 CGS 499201 TOTAL COSTS 602202 OTHER EXPENSES 1584 LOSS PROVISION 0 INTEREST EXPENSE 9741 INCOME PRETAX 81412 INCOME TAX 30032 INCOME CONTINUING 51380 DISCONTINUED 0 EXTRAORDINARY 0 CHANGES 0 NET INCOME 51380 EPS PRIMARY 2.97 EPS DILUTED 2.95