management research journal - gnims
TRANSCRIPT

Management Research Journal
mebmcejCeSANSMARAN
Volume No. 8 | Issue No. 2 | July - December - 2018 | ISSN No. 2278-7801
Impact Factor - IIJIF (2017) 4.107 | Impact Factor - PIF (2018) 4.504
Business School

SGPC's
Guru Nanak Institute of Management Studies
"SANSMARAN" Management Reasearch Journal
Volume - 8 | Issue -2 | July - December 2018
Disclaimer
The Editorial Committee has taken
utmost care to provide quality
editorial articles in the journal. The
journal is not responsible for the
representation of facts, adaption of
material, interview with person and
personal view of author contained
in the article.
SGPC's
Guru Nanak Institute of Management StudiesKing's Circle, Matunga, Mumbai - 400 019.
Tel. : +91 22 2404 3927/ 28 | Telefax : +91 22 2404 3933Website : www.gnims.edu.in | E-mail : [email protected]
REVIEW COMMITTEE Dr. Ballerishan Narvhede (External)Dr. Sharukh Tara (External)
INTERNALDr. Jasbir KaurProf. Annie PillaiProf. Sagaljit KaurProf. Channpreet KaurProf.Ritu TuliMs. Neeta Malik
PATRONSSardar Bhupinder Singh Manhas Sardar Gurinder Singh Bawa
ADVISORY BOARDDr. Aman Aggarwal: - Professor of Finance,Dean & Director(Rektor)Indian Institute of Finance, New-Delhi.Jagmohan Bhaver : - Eminent AuthorDr. B. R. Singh: - Former Director-HR Ispat Industries Ltd, Mumbai.Dr. A. B. Rao: - Former Director, BVIMSR, Navi MumbaiDr. Meenakshi Sooden: - Former Chairperson and Director of Horticulture and Agriculture Department, Shimla, Himachal Pradesh.Dr. Radha Krishan Pillai: - Director of the Chanakya Institute of Public Leadership.
EDITOROAL BOARDDr. R. K. Hebsur: - Former Deputy Director, Tata Institute of Social Science, Mumbai.Dr. Ashotosh Angiras: - Associate Professor & Head Department of Sanskrit,Captain NCC, Honorary Director of SD Human Center, Research & Development, Ambala Cantt (Haryana).Dr. H. Anil Kumar: - Head NICMAN, Indian Institute of Management, Vastrapur, Ahmedabad 380015.Prof. J. C. Sharma: - Former, HOD of Statistics Department, Tata Institute of Social Science, Mumbai.Dr. Narkhade: - Associate Professor, NITIE- (National Institute of Industrial Engineering), Mumbai.Dr. P. S. Rao:-Dean Research,Wellingkar Institute, Mumbai.
EDITORS IN CHIEFDr. Ajit Singh, Director General, GNIMS Dr. D. Y. Patil : - Director, GNIMS & Associate Dean, University of Mumbai
EDITORSDr. Kamini Khanna, Dr. Kuljeet G. Kahlon,Associate Professor - General Management Library Manager, Head - Research - GNIMS GNIMS
EDITORIAL MEMBERSDr. Sameer PhanseDr. Jyotinder Kaur Dr. MrinalPhalleDr. Sushma PatilDr. Satvinder Singh BediDr. Gautam TrehanDr. Y. V. KamatProf. Imran SiddiquiProf. Kapil BhopatkarProf. Unmesh Alawani

“SANSMARAN”Management Research Journal
Vol. 8 • No. 2 • July - December 2018 ISSN No. 2278-7801 • Impact Factor IIJIF (2017) 4.107 • Impact Factor PIF (2018) 4.504
CONTENTS
1. Analysis of Investment Behaviour and Satisfaction Level in the Mutual Funds Among 03Investors in Panvel AreaMs. Veena Chavan
2. Digital India-Initiation of Second Wave of Agricultural Revolution 11Mr. Sampat Dawkhar
3. A Study on Growth of Microfinance in India 19Dr. Mrinal Phalle
4. A Study on Factors Influencing Attitude Towards Using Electronic HRM 26Mr. Pravin Dinkar Kamble
5. A Comparative Analysis of Organized Retail Sector In India 34Dr. Sushma Patil
6. The Role of State Government in Functioning of Grain Based Distilleries in Maharashtra 44Mr. Digvijay Deshmukh
7. “Toilet Training Interventions among Disabled Children : A Case Study of Raigad District” 54Mr. Sanjay Sevak
8. How Millennials Can Effectively Prepare For Entrepreneurship 63
Mr. Hiten Gor and Mr. Shubham Khatri
9. Emergence of Strategic Cost Management 67Prof. Hema Deogharkar
10. BOOK REVIEW – Research Methodology – Logic, Methods and Cases 70
Dr. Dattajirao Y. Patil
Business School
mebmcejCe

2 Vol. 8 • No. 2 • July - December 2018
“SANSMARAN” Management Research Journal• ISSN No. 2278-7801• Impact Factor IIJIF (2017) 4.107• Impact Factor PIF (2018) 4.504

Vol. 8 • No. 2 • July - December 2018 3
“SANSMARAN” Management Research Journal• ISSN No. 2278-7801• Impact Factor IIJIF (2017) 4.107• Impact Factor PIF (2018) 4.504
Analysis of Investment Behaviour and Satisfaction Level in the
Mutual Funds Among Investors in Panvel Area
Ms. Veena Chavan
Assistant Professor, Bharati Vidyapeeth’s Institute of Management and Research,
Sector 8, CBD Belapur, Navi Mumbai – 400614.
............................................................................................................................................................................................
ABSTRACT :
In the current market scenario, mutual funds are one of the investment avenues which has a great return potential if
invested wisely. The investment in Mutual funds depends on several factors such as Professional Knowledge,
Diversification, Return potential, Low cost, Liquidity, Transparency, Flexibility, Choice of schemes, Tax benefit, Well
regulated, Economies of Scale, Simplicity / Convenience etc. The current study aims to find the factors which are
considered by the investors while investing in mutual funds. This paper also aims to find the satisfaction level from
mutual fund investments among the investors and their investment behaviour. The study was conducted on a sample of
100 respondents selected randomly from Panvel Municipal Corporation Area. The data was analysed by using statistical
tools such as Chi square test and ANOVA. The findings of the study show that majority of investors were moderately and
highly satisfied with their mutual fund investments.
............................................................................................................................................................................................
Keywords:
Mutual Fund, Investment Behaviour
............................................................................................................................................................................................
Introduction :
Asset Management Company of a Mutual fund is an investment company that pools money from different investors and
invests in different investment avenues such as shares, bonds, gold, money market instruments etc. as per the objective
of the fund. Investors consider different factors such as return, risk, liquidity etc. while investing in mutual funds. There
are different types of mutual funds available in the market to suit the varying objectives of different investors. Mutual
fund investments are subject to market risk as its performance is market linked. If the performance of mutual fund meets
the expectation of investors, they will be satisfied else they will be dissatisfied. This paper aims to study the factors
considered while investing in mutual funds and satisfaction level among mutual fund investors.
Scope of Study :
The scope of the study covers identifying the factors considered while investing in mutual funds and measuring the
satisfaction level among mutual fund investors. The A sample of 100 respondents was selected for the research.
Literature Review :
1. Ms. Avani Shah and Dr. Narayan Baser (2012) conducted a research in Ahmadabad with an objective to find
preference of investors in selecting mutual funds. They studied the impact of two variables age & occupation
4 Vol. 8 • No. 2 • July - December 2018
“SANSMARAN” Management Research Journal• ISSN No. 2278-7801• Impact Factor IIJIF (2017) 4.107• Impact Factor PIF (2018) 4.504
preference of investors on mutual funds. Their findings stated that, the preference of investors towards mutual
funds is affected by the variable occupation but not much related to age.
2. Soumyasaha and Munmun Day (2011) in their research paper titled “Analysis of Factors affecting investors
perception of Mutual fund investment” stated that expectation of investors is an important factor. They concluded
that the success of a mutual fund depends on the efficiency with which it is able to meet investor expectation.
3. Shanmugham (2000) conducted a survey of 201 individual investors to study the information sourcing by investors,
their perceptions of various investment strategy dimensions and the factors motivating share investment decisions,
and reports that among the various factors, psychological and sociological factors dominated the economic factors
in share investment decisions.
4. G. Prathap and Dr. A. Rajamohan (2013) have conducted a study on status of awareness among Mutual Fund
Investors in Tamil Nadu and their satisfaction level relating to various issues like rate of return, liquidity, safety,
tax consideration, growth perspective, capital gain, maturity period etc. The study outlined that mostly the investors
have high level awareness and positive approach toward investing in Mutual Funds.
Objectives of the Study are:
1. To know about investors investment preferences among different investment avenues.
2. To assess the satisfaction level of investors in mutual funds
3. To check the importance given to various factors by the investors while investing in mutual funds.
Hypotheses :
H1: Experienced investors give less importance to risk as compared to new investors
H2: Higher the income of investors, lesser will be the importance given to liquidity while investing in Mutual fund.
H3: Higher the income of investors more will be the importance given to high return while investing in Mutual fund.
H4: As the age increases the chances of investing in mutual fund also increases
Research Methodology :
Sampling Unit: The targeted population included the investors or potential investors from Panvel Municipal corporation
area who had an income source. The population consists of Government Employees, Private Firm employee, Professional/
self-employed, businessmen, Agriculture.
Sample Size: sample size considered for the study was of 100 respondents selected through random sampling method.
Variables in this study are as follows:
Independent Variables:
� Personal Characteristics:
� Gender
� Age
� Income
Vol. 8 • No. 2 • July - December 2018 5
“SANSMARAN” Management Research Journal• ISSN No. 2278-7801• Impact Factor IIJIF (2017) 4.107• Impact Factor PIF (2018) 4.504
� Investment Experience
Dependent Variable:
� Chances of investing in Mutual Funds
� Satisfaction level in mutual fund investment
� Importance given to risk factor
� Importance given to return factor
� Importance given to liquidity factor
Data Type : Primary Data.
Tool of Data Collection: Structured Questionnaire.
Sources of Data: The present study is majorly based on the primary data collected from Panvel Municipal corporation
area with the help of structured questionnaire. Secondary data also has been used whenever required from published
reports.
Statistical Tools and Techniques Used:
� Data was analysed through Statistical Package for Social Science (SPSS) version 20.
� Data was gathered through A structured questionnaire for meeting objectives of study.
� Chi- Square Test: For analysing the data, statistical tool such as Chi Square Test has been used to find the
association between the independent variable Gender on dependent variable satisfaction in Mutual Fund investment.
This test is used when both the variables are categorical in nature.
� ANOVA: Analysis of variance is used for as one variable ‘Investment experience’ is interval type and another
variable ‘Importance given to risk factor of MF’ is categorical in nature.
Data Analysis:
The current research is majorly based on the primary data collected through questionnaire from Navi Mumbai. The
research also makes use of published secondary data sources.

6 Vol. 8 • No. 2 • July - December 2018
“SANSMARAN” Management Research Journal• ISSN No. 2278-7801• Impact Factor IIJIF (2017) 4.107• Impact Factor PIF (2018) 4.504
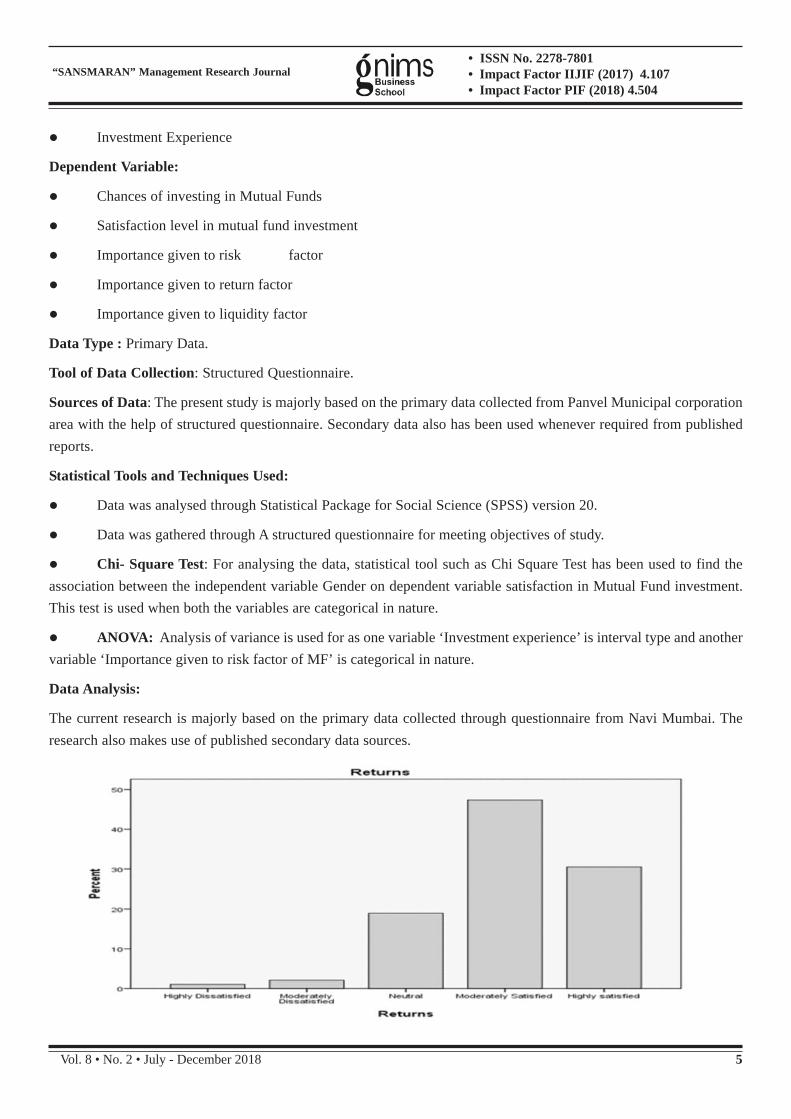
Investment Satisfaction Level Vs Returns from MF
Most of the Mutual Fund investors say, they are Moderately to Highly satisfied by their mutual fund investments as the
mutual funds have given them good returns as per their expectation.
H1: Experienced investors give less importance to risk as compared to new investors
Mean Plot: Investment experience Vs Importance given to risk factor: When importance given to the factor “Less
risk” was plotted against the investment experience, It was observed that moderate importance was given to the factor
“ Less risk” by least experienced investors. But as the investment experience increased, the importance given to risk
factor also increased.
ANOVA
Less Risk
To understand whether the relationship between Investment experience and importance given to risk is significant.
ANOVA was done. ANOVA showed significance level 0.564 >0.05. so the Hypothesis is disproved. There is no

Vol. 8 • No. 2 • July - December 2018 7
“SANSMARAN” Management Research Journal• ISSN No. 2278-7801• Impact Factor IIJIF (2017) 4.107• Impact Factor PIF (2018) 4.504
relationship between investment experience and importance given to Risk.
H2: Higher the income of investors, lesser will be the importance given to liquidity while investing in Mutual
fund.
Mean Plot
There is a relationship seen between income of investor & importance given to liquidity while investing in Mutual fund.
Mean plot shows high income of investors gives less importance to liquidity while investing in Mutual fund than
middle and low-income groups. As the income increased the importance given to liquidity decreases.
To see whether this relationship in significant, the ANOVA was done. Following are the results.
ANOVA
Q2 Annual Income Range
ANOVA test shows significance 0.364 > 0.05. means relationship is not
significant. So hypothesis is rejected.
H3: Higher the income of investors more will be the importance
given to high return while investing in Mutual fund.
Mean Plot

8 Vol. 8 • No. 2 • July - December 2018
“SANSMARAN” Management Research Journal• ISSN No. 2278-7801• Impact Factor IIJIF (2017) 4.107• Impact Factor PIF (2018) 4.504
The above mean plot shows low income group gives less importance to the factor “High Return” and as the income
increases the importance given to the factor “High Return” also increases.
Annual Income Range
Scheffe
Means for groups in
homogeneous subsets are
displayed.
a. Uses Harmonic Mean Sample
Size = 9.580.
b. The group sizes are unequal. The harmonic mean of the group sizes is used. Type I error levels are not guaranteed.
ANOVA
Q2 Annual Income Range
ANOVA shows the significance of 0.036 < 0.05. Therefore, the relationship between Annual income and importance
given to the factor “High Return” is
significant. The alternative hypothesis is
accepted. As the income increases the
importance given to the factor “High Return”
also increases.
By nature, every person has the quest to earn high return. This quest is never satisfied. As the income increases, the
quest to earn high return also goes on increasing.
Age Group Vs Invests in
MF
H4: As the age increases
the chances of investing in
mutual fund increases
The above table shows that
majority of investors in
Mutual Funds are from the
age group of 31 to 40 Years.
Majority of people below 30
yrs of age and above 50
years of age say they do not
invest in Mutual Funds.So
the majority of investors in
MF fall in the age group between 31 to 40yrs and 41 to 50 years .To see whether this relationship is significant, Chi

Vol. 8 • No. 2 • July - December 2018 9
“SANSMARAN” Management Research Journal• ISSN No. 2278-7801• Impact Factor IIJIF (2017) 4.107• Impact Factor PIF (2018) 4.504
square test is carried out.
Following are the results.
a. 2 cells (25.0%) have
expected count less than 5.
The minimum expected
count is 2.04.
Chi square test showed
significance level 0.452
>0.05. So, the Hypothesis is
disproved. There is no
relationship between age
and chances of investing in mutual funds. As there are a
wide variety of mutual fund schemes available in the
market and there are mutual funds available in the market
by various mutual fund companies which almost offer
suitable mutual funds for varying needs of different age
groups and have matching mutual funds. So almost every age person can invest in mutual funds suiting to their profile.
Conclusion:
Financial stability is one of the major contributor to the social empowerment. Mutual funds are one among the best
investment avenues to create long term financial wealth for a common man if invested wisely as per their risk profile.

10 Vol. 8 • No. 2 • July - December 2018
“SANSMARAN” Management Research Journal• ISSN No. 2278-7801• Impact Factor IIJIF (2017) 4.107• Impact Factor PIF (2018) 4.504
Any investor will invest only when he has appropriate knowledge about that investment avenue and he has experienced
or seen good returns earned in similar investments in the past.
After the study, it was observed that majority of investors were highly or moderately satisfied by their investments in
mutual funds. It is a good sign to see further investments in mutual funds.
SIP mode of investing in MF is the most convenient and affordable for a retail investor as they can start from as low as
Rs 500 per month. Investment in mutual funds can be done through branch banking, online payments, non-cash transactions
i.e. cheque payments in case of lump sum investments and direct debit in case of SIP. By such means the investment in
mutual funds has become easier.
References :
� Ms. Avani Shah and Dr. Narayan Baser (2012), “Mutual Fund: Behavioural Finance’s Perspective”, Asia
Pacific Journal of Marketing & Management Review Vol.1 No. 2, October 2012, ISSN 2319-2836
� Soumyasaha and Munmun Day (2011), “Analysis of factors affecting investor’s perception of mutual fund
investment” The IUP journal of Management Research, 10(2):22-45
� Shanmugham R. (2000), “Factors influencing Investment Decisions”, Indian Capital Markets – Trends and
Dimensions (ed.) Tata McGraw-Hill Publishing Company Limited, New Delhi, 2000.
� G.Prathap and Dr. A. Rajamohan (2013), “A STUDY ON STATUS OF AWARENESS AMONG MUTUAL
FUND INVESTORS IN TAMILNADU “,Journal of Exclusive Management Science –December 2013-Vol 2
Issue 12 - ISSN 2277 – 5684
� Vennila R. Nandhagopal Investors’ Preference towards Mutual Funds in Coimbatore City, European Journal of
Social Sciences ISSN 1450-2267, 2012; 29(1):115-125.
� Atmaramani KN. Mutual Funds: The Best Avenue for Investment, Chartered Secretary. 2001; 31(1):9-11.
� Binod Kumar Singh “A Study on Investors’ Attitude towards Mutual Funds as an Investment Option. Journal of
Asian Business Strategy. 12011; (2):8-15.
� Rathnamani V; Investor’s Preferences towards Mutual Fund Industry in Trichy. Journal of Business and
Management. 2013; 6(6):48-55.
� Singh YP, Vanita “Mutual Fund Investors’ Perceptions and Preferences-A Survey”, the Indian Journal of
Commerce.2002; 55(3):8-20.
� Singh BK, Jha AK. “An empirical study on awareness & acceptability of mutual fund”, Regional Students
Conference, ICWAI, 2009; 49-55.
� Subramanya PR, Renukamurthy “investors attitude towards mutual fund” IJMBS.2013; l3 (1) 57-59.
.

Vol. 8 • No. 2 • July - December 2018 11
“SANSMARAN” Management Research Journal• ISSN No. 2278-7801• Impact Factor IIJIF (2017) 4.107• Impact Factor PIF (2018) 4.504
Digital India-Initiation of Second Wave of Agricultural Revolution
Sampat Dawkhar
Research scholar and Dy. Collector, Government of Maharashtra
............................................................................................................................................................................................
ABSTRACT :
The current paper puts new concept of digitalization of farmer and his crop produce sale mechanism with current
technology. The concept is to use digital data of national land record modernization program under government of India
(GOI) scheme already available and use with state to connect for estimation to the calculation of actual yield. The
excessive production of crop can be controlled with short message system (sms) and web portal. The crops which are
required to import are to be cultivated in excess area via blocking the additional plantation with the help of digital
monitoring. To develop software with existing data to calculate actual need of 121 Cr Indian populations as per health
exper tor Food and health organization is doable. To development of system for connecting farmer to actual consumer
with the help of current advance transport and courier mechanism can be done. The actual rate will be 4 times higher
to farmers and cheaper to customers when digital system will establish. To prepare a model with current platform will
save the data entry and accuracy will be increased as per need of common farmers. In the present system we don’t have
any security of expected income with the help of minimum support price as land holdings are decreasing very fast
.Government need to divert farmers for more income generating crop which is possible via digital monitoring of each
and every crop. The research paper explains how to monitor each and every farm, farmer and consumer with working
model.
............................................................................................................................................................................................
Keywords :
Digital Farms, New Agriculture Revolution, Computerized Crop Entry, Demand-Supply Crop Balance.
............................................................................................................................................................................................
1. Introduction :
For the last 40 years, India’s agricultural growth is not as per expectation to the economy. The sector performance
has been about the same before and after the digitalization and computerization of land records. The slow eco-
nomic growth has ill effect on food security, food price inflation and poverty reduction. This paper advocates a
new integrated technology (like digitization of farms and its linkage to digital platform like computerized record
of right, Aadhar based strategy to pull out of what looks like, a vicious circle that agriculture in a new caught in
and farmers will get the maximum benefits for the crop. Indian Agricultural policy has enough success for produc-
tion of agricultural produce, But the agricultural growth rate and food insecurity, food inflation ,assures crop rate
to farmers, Minimum support price and production cost never goes in hand to hand .It has raised a big question as
most of farmers are not happy, Farmers suicide worries every Indian. We are not able to link the agricultural price
policy to farm profitability and food security successfully. In Maharashtra last year the total production of Tur
(Arhar) was high due to which ,market rates were lower than minimum support price (MSP).When the crop

12 Vol. 8 • No. 2 • July - December 2018
“SANSMARAN” Management Research Journal• ISSN No. 2278-7801• Impact Factor IIJIF (2017) 4.107• Impact Factor PIF (2018) 4.504
production is more than requirement of nation , the prices falls .The malpractices with bogus purchases in the
name of genuine farmers is common one with MSP crops. The crop yield from other state or other farmers is
purchased on bogus names which is common. Indian farmers are working hard to produce more yields, but due to
un-assured income, they are not able get justice through the encasement of crops. The rates of farm products are
always very less than the actual rate of the consumer. The system of sale is though protected by law, there are
middle men’s in between them which causes higher rates to consumers but farmers are left with minimum value
for his product. The government machinery has almost no voice when rates are high in market due to stock by
black marketers or low yield by farmers. Report published by thematic group of united nations for sustainable
agriculture (8) underlines many challenges like food safety, production, land degradation, water shortage, wast-
age of food, poverty, poor rural infrastructure, pollution , degradation of loss healthy diet and safe food etc. are
the important factor needs to be considered in coming 2015-50 in world Agriculture .
Example of onion market is very common in India, when farmers are getting Rs 2 per kg, at the same time traders
at end consumer serves with Rs 10-15 per kg to the end customer. If farmer will get Rs 10 at the same time both
will be happy except middle men. There is very big chain of transporters- Local traders -Market committees -
Wholesale traders Retail traders, lastly actual traders from whom actual customers are purchasing. From the chain
we can clearly see that each step is having some machinery at his level, he is investing and getting some profit to
himself , but ultimately same profit is deducted from the share of farmer and it is gifted to trader’s and which is
recovered from the end customers. Same formula is applicable for many crops. When farmers are throwing toma-
toes in dustbin at his farm, same are sold at the rate of 20 kg in Mumbai market.
Agricultural Price Policy, Farm Profitability and Food Security: An Analysis of Rice and Wheat by S Mahindra
Dev. from Commission for Agricultural Costs and Prices, New Delhi. N Chandrasekhar Rao from Centre for
Economic and Social Studies, Hyderabad has studied the issue related to price policy but the many things are
unanswered. (1998).Farmers are lacking for innovative methods of farming due to low income. Sugar factories
had given some sort of assured income in sugar belt like western Maharashtra hence large no of farmers are
cultivating cash crop like sugarcane, we can see some well to do farmers in sugar belt .Sugar factories belong to
farmers in co-operative pattern with pays sufficient taxation to government. Sugarcane crop is fully monitored by
government. Each plot is registered with Sugar factory. Though it is not monitored digitally, sugar cane farming
has good success in price issue. On the basis of this plantation factory and government monitored crop produce
and good rates for sugar are fixed by central government as there is FRP mechanism to do the same. On the same
lines every inch and inch crop should be monitored by government with all information to be shared on Public
domain. It will help government and everyone to get exact figures and proper rates to his crop.
Various Indian states are cultivating different crops as per data of agricultural census .States are having important
crops as rice, wheat, Jowar, Bajra, Cereals, Pulses and food grains, Sugarcane, cotton and groundnut etc. The land
holding of every farmer is decreasing day by day, the land holding in Maharashtra has reduced from 4.28 hectare
in 1970-71 to 1.44 hector and reducing .Besides agriculture we have big livestock as subsidiary source of income
to farmers. The crops are cultivated in 3 seasons but basically in kharif and rabbi seasons.
Farmers in every state are very creative, quality of food grain and cash crops are exported to number of countries.
They are earning good foreign currency through crops like grapes, Pomegranate, mango and many others. Some
crops which can be exported like onion, sugar pulses and other are essential commodity that why export increases

Vol. 8 • No. 2 • July - December 2018 13
“SANSMARAN” Management Research Journal• ISSN No. 2278-7801• Impact Factor IIJIF (2017) 4.107• Impact Factor PIF (2018) 4.504
rates while import decreases the rates directly affecting to farmers. Farmers are facing problems by both sides
because the rates are also related to inflation index .Government needs to find solution for this problem to protect
both consumer as well as farmers. Nowadays farmers are facing big devil of suicide due to Loan and low income
and fixed market rates to farmers. The modern word is going through the digitization, India has accepted motto of
Digital India and we need to add digital farmers for the same which will solve the maximum problem of agricul-
ture.
The research paper is divided into mainly four parts:
1. Digitalization and linking of actual crop data.
2. Fixation of crop region, area, and production.
3. Crop entry blocking mechanism.
4. Digital crop yield sale mechanism including online sale.
1. Digitalization and linking of actual crop data :
The crop data of each and every farmer can be minutely managed with satellite imaging and record of right
data is already available with national land record management Program in progress by GOI (NLRMP).The
digitization of Record of right is almost completed in most of states. The GOI website states our physical
progress of computerization entry status and can be verified from website. Further if we go through the
website of any state, for example government of Maharashtra for land records, department monitored by
settlement commissioner of land records known as www.mumbaimahabhulekh.in which gives the details of
records to citizens. The data shows that almost 7 crores people had visited in one year and 6 crores 7/12
extracts were downloaded, which indicates that in this new era farmers are friendly with digital Indian
record of right. Digital farmer portal will have digital sale page and will able to select the crop, district,
Taluka figures of various crop yields enable them to select proper location .Such consumer or trader will
directly collect such material from particular place. The data entry in the produced data will require time
nearly month. Computerization of the data for Land records program is owned by government and it is
successfully working for last couple of years.
The website selects district, Taluka and village information. When data of village is selected with name and
survey number, the record of right is seen. The link is already having ROR with all crop details and area of
his landholding. The 8A abstract will give us total area in this particular village. As most of citizens are used
to do for the current website data entry for the crop will be made in same software as we can provide one
additional entry for Area under crop by creating additional entry creating link to current 7/12 page. This can
be done easily as already data is uploaded and verified. The crop entry method is designed by law known as
Maharashtra Land Revenue code 1966 and rules there under. The village officer have rights to enter the
crop entry and inspection by senior field officer like circle officer or Tahsildar .The crop entry rights can be
given to farmer and verification will done by government officer for accurate crop entry.
2. Fixation of crop region, area, and production :
Digital platform will monitor crop sowing data with online entries of every crop. The authorized officer
will decide the area under each crop at the start of kharif and rabbi season and same will be entered in
14 Vol. 8 • No. 2 • July - December 2018
“SANSMARAN” Management Research Journal• ISSN No. 2278-7801• Impact Factor IIJIF (2017) 4.107• Impact Factor PIF (2018) 4.504
software .Farmers will be free to enter the area of each crop and approximate yield. The existing crop area
entered on website of each crop will be viewed by farmer and he will decide his future crop. If average area
for particular crop is complete 5 or 10 % crop area with risk with different color can be entered by that
farmer with some risk. When the risk color in data entry is over, the crop entry for that particular crop will
be blocked for this season. The mechanism will stop the excess and unorganized sowing or plantation and
proper assured rates will be possible as there will be no much deference in demand and supply. If farmers
are getting proper rates he will never ask any subsidy from government. He will invest more for improve-
ment of farming method such as organic or residue free farming. The cash crops such as grapes, pomegran-
ate, sugar cane, tea, Mango where we fetch good foreign currency if such plantation is fixed for export by
website. The farms for export can be air marked with the help of this strategy. We have never monitored the
farmer’s data so far. All figures projected by the concern department are far away from accuracy. Digital
data is always correct and manipulation will be not possible. Such data is easily monitored by satellite
images. Satellite will provide image at the time of sowing and when crops are ready to harvest.
The crop area of each and every crop in India is published by Agricultural statistics division of government
of India, can be used for initial crop area fixation .Same can be fromAgricultural Statistics of Government
India 2016,will be used for pilot project. The information covers major, minor crop, pulses, oilseed and
horticulture as well as all Indian crops. The crop area survey is done by government may have some modi-
fication as it is collected through the manual system. Digital entry of the figures will generate accurate
figures with actual production amount filled by farmer himself.
3. Crop entry blocking mechanism :
There is urgent need to determine area under each crop with the average yield as per the agriculture produc-
tion data. The annual need per person is also calculated as per official requirement of every individual.
Researcher has also studied requirement and area for plantation form the figures of Food and agricultural
organization (FAO) of United Nations .The crop sowing or plantation area need to fix after taking review in
each Kharif and Rabi season. Authorities can make any change as per revised need. Besides this some of
crops can be assigned to particular region or district. Let us say apples plantation quota can be fixed to each
apple cultivating district in India. Any excess production already will be used for export and technical
guidance can be provided to such farmers to fetch more foreign currency. If any district is cultivating more
than the assigned area, message will be given when 100% percent quota is fulfilled via media or SMS or
social media. 10% additional sowing allowed to farmers with their risk and after risk of 10 % crop entry
will be blocked in the website. These farmers will plant any other crop of their choice. Farmers in India
have wide choice of crop selection due to geographical advantage of air, sunlight and many other atmo-
spheric factors
The block entry will be regularized or blocked when the server will show the maximum area under sowing
determined by the agriculture department of state. This will alert farmers who are practicing the cropping
pattern on the rumor or wave of maximum rate earned in the current year. Generally what happen in rural
area if any particular crop fetches a good price for this year, every farmer plants same crop by next year to
get higher income, but it exceeds the crop yield and markets rates come down. This has been observed
number of times in rural area. Though there are also other factors for higher production but we need to

Vol. 8 • No. 2 • July - December 2018 15
“SANSMARAN” Management Research Journal• ISSN No. 2278-7801• Impact Factor IIJIF (2017) 4.107• Impact Factor PIF (2018) 4.504
monitor crop area strictly. Any excess production if monitored digitally will be dealt with actual digital data
available.
4. Digital crop yield sale mechanism including online sale :
The table 1 will be designed such a way that all traders are eliminated and direct crop yield will be sold by
farmers. For clarity let us say co-operative housing society requires a Jawar from the Ahmadnagar district
of Maharashtra and farmers at particular Taluka are in position to supply it .The chairman or secretary of
such housing society will call the farmer taking address from government website having their requirement
.If 100 members of society requires 10 kg of for 3 month, they require 1000 kg of Jowar. At present the
market rate to farmer is 20 Rs and consumer is 38 .the transport cast is only Re1 per kg .The society if gives
Rs25 to farmer and Re1 to transport of their choice, farmers can give them organic Jowar by next year in
same price if society assure him to purchase next year and housing society member will save almost Rs14
per kg. Same mechanism will be used for the all fruit and vegetable. Farmer will never ask any subsidy from
government if such chain is developed by digital platform.
The main issue is agriculture is that how to divert farmers for cultivating different and variety of crop
required to different class of society When the data entry is made in land record software the figures for the
sowing, plantation quality of crop at crop cutting stage of agriculture department when Paisewari is de-
clared by government records will be filled up by farmers himself ,he will fill the correct information as
actual e auction is done by him online .The sale model will have window on digital farmer page.
The area under principal crops is fixed as per agricultural census figures, Production of principal crops is
taken as per GOI data bank .As per figures of FAO united nation the average requirement of some of
important cereal, pulses, sugar etc. is shown in left side of chart .If we consider area under crop, average
yield and requirement to the population of India assuming 121 Cr .We can easily calculate our demand
production, required production of crop considering current average yield of crop. In the present calcula-
tion I have calculated it for cereal and pulses, oil seeds sugarcane and milk production. The figures are
matching with government figures and such are under every crop can be easily put under cultivation. The
chart shows higher area under sugarcane than required which can be organized for export or reduced for
other crop with motivation to farmers. Same is case of milk.
Table 1; Recommended balanced diets calories and food in kilogram for Indian nationals and area required

16 Vol. 8 • No. 2 • July - December 2018
“SANSMARAN” Management Research Journal• ISSN No. 2278-7801• Impact Factor IIJIF (2017) 4.107• Impact Factor PIF (2018) 4.504
Source- Food and Agriculture organization of united nation corporate document repository.
The actual chart in the government website will be in drop down menu, which will enable farmer to get
exact plantation figures with approximate yield. The traders or consumer will get actual producer which
will be farmer. The list will enable to contact farmer directly to purchase and rate of the transport will be
fixed by government with km or consumer can collect it directly from the farmer .In addition to this one
more option of crop will be added for crop yield purchase. The PDF list of farmers will give detail village
wise production of crop data to purchase the end use customers as buyer. This will end all middle mans and
if farmer provides correct weight with good quality material. It has been observed in no of cases that
consumers purchased regularly from farmers who have maintained superior quality. Buffalo milk or cow
milk is good example where fresh milk is supplied to consumers at his door step from generations to
generations. The chart is shown only for mechanism .actual data management has been verified by the
author and it works well. The crops shown in above crops are for example, we need to include each and

Vol. 8 • No. 2 • July - December 2018 17
“SANSMARAN” Management Research Journal• ISSN No. 2278-7801• Impact Factor IIJIF (2017) 4.107• Impact Factor PIF (2018) 4.504
every crop to boost the economy.
Table 2-General entry blocking mechanism.
Recommendations :
The methodology described above is very simple and can be monitored easily as we are ready with platform of
digital record of right data. Now days almost majority of farmers are having access to computers, internet, and
smart phones.
The objectives which are listed above are applicable to all state in India. The data of record of rights is already
available with settlement commissioner and linking of same with AADHAR CARD will make easier to identify
the farmers in digital farming .The 7/12 clear show all details of titles and area under Crop. The next step is to add
extension window in software for crop entry with code, area under crop, and average yield of that crop.
It is clear from the above discussion from national land record modernization program the information of land
owner’s name and area with cropping pattern is readily available. The data is filled in simple excel charts hence
the crop entry column can be added easily. The data of land is being monitored by number of state and further
development is going on successfully. Assurance is given to farmer that, when he enters his crop in time, he will
get good crop value. Any excess sowing or plantation is blocked and controlled automatically by government
authority. When no excess of crops or food grains are produced, the machinery will give assurance of rates to
farmers. At the initial stage this pilot project can be implemented in 5 districts, for 5-10 crops like onion where
there is market downfalls and hike are common. Export quota for each such crop will be fixed to generate more
revenue and encourage farmers to cultivate more quality crops for export. In this system we are giving assured
value to farmers hence no subsidy is required to farmers. The systems will save thousands of crores of government
on subsidy. This saved money will be used more effectively for draught removal and natural calamity relief.
The income earned by farmers with the help of current system is very low; the main reason is multiple traders and
stock holding, various government charges. Government has taken decision to free fruit and vegetables sales from
APMC. The largest market in Asia APMCs, but still rates are not directly in their control with various tactics .we
need to overcome the barrier by using digital farmer and digital consumer concept. Perfect transportation system
will help to save farmers with sufficient profit and cheap food grains and vegetables to consumers. Perishable
farm product like milk, vegetable and other can be transported with help of air conditioned containers. Govern-
ment can fix transport contractor like online courier system adopted by online marketing companies like Amazon,
flip cart etc. Transporters job will be transporting only. Processing like milk and other will be at fix cost so that
profit making will be avoided. In this methodology farmer from western Maharashtra will supply milk and other
farm product to housing society in Mumbai in his container. This transport container will be traced with recent
courier system to satisfaction of consumer .Any substandard in quality will made negative remark in farmers

18 Vol. 8 • No. 2 • July - December 2018
“SANSMARAN” Management Research Journal• ISSN No. 2278-7801• Impact Factor IIJIF (2017) 4.107• Impact Factor PIF (2018) 4.504
digital record on website .To monitor data digitally is very easy and practical. It is need of hour to monitor each
and every farmer to save his live hood. Considering his area under cultivation we can’t protect him with current
policy like minimum support price and subsidy. The farmers even get 50 % more to production cost; they will be
not able to survive as they don’t have enough land holding to produce the income of his live hood from crops like
rice or grains. We need to introduce other cash crops to get more income. This can be done only with digital
monitoring.
I would like suggest working model of this system with the help of satellite imaging of crop and data entry to
government website. Present Local government staffs of agricultural, revenue, rural development department are
already working and will be deputed in each and every village to verify each and every entry for initial stage of
implementation. The e- auction for produced material certificate can be issued for quality and loaded at website if
necessary. There is nothing imaginary in this model; everything is based on scientific and mathematical calcula-
tion. We can easily monitor need of every Indian on digital platform and same time it will produce by farmer who
will be known to him with digital communication. The quality will be no issue as he has to accept the same from
courier like transport. This Model will raise the income of farmer by 5 times and consumer cost be reduced by 25
%. Research paper is concluded with good hope and expectation of second agricultural revolution in India.
References :
� Agriculture land use data from ,Directorate of Economics and Statistics, Ministry of Agriculture and Farmers
Welfare, Government of India
� Research paper “A Web-based Agricultural Decision Support System on Crop Growth Monitoring and Food
Security Strategies”.(2010) by Wang Zhi-Qiang, Chen Zhi-Chao Henan Polytechnic University, Jiaozuo,
454000,China.
� Food data ,from the website of ministry of food processing,GOI
� Document repository booklet,(2014), Food and Agriculture organization of united nations
� Land computerization status ,Website of ministry of land resources department GOI
� Research paper “A Literature Review of Crop Area Estimation by Michael Craig and Dale Atkinson” 2013 by
United nations
� Report “ Mahalanobis National Crop Forecast Centre” from Dept. of Agriculture, Cooperation & Farmers Wel-
fare Ministry of Agriculture & Farmers Welfare, and Government of India Website
� “Solutions for sustainable agriculture and food systems. Technical report for the post-2015 development agenda.
a report from thematic group 7(2013)”United nations.
� “Handbook of basic statistics” 2015, Government of Maharashtra publications
� Report “Agricultural policy strategy, Instruments and implementation; A Review and road ahead” 2011 by BM
desai,Errol D’souza,John W mellor,Vijay Paul Sharma,Prabhakar Tamboli.
� Research paper “Estimate and Analysis of Farm income in India from 1983-2011-12”. 2015 Ramesh chand,Raka
Saxena,Simmi Rana
� Agricultural Statistics 2016,. Government of India

Vol. 8 • No. 2 • July - December 2018 19
“SANSMARAN” Management Research Journal• ISSN No. 2278-7801• Impact Factor IIJIF (2017) 4.107• Impact Factor PIF (2018) 4.504
A Study on Growth of Microfinance in India
Dr. Mrinal Phalle
Associate Professor, Guru Nanak Institute of Management Studies, Mumbai
...................................................................................................................................................................................................
ABSTRACT :
Universally microfinance has evolved as a vibrant financial sector with different business models to increase outreach
of banking services for rural population who are beyond the outreach of formal banking system. In India, there is a wide
range of organizations such as commercial Banks, Regional Rural Banks Cooperative Banks and MFIs with diverse
legal forms, different credit delivery methodologies provide microfinance to poor people. Hence the present research
study assessed growth of microfinance under Self Help Group – Bank Linkage Programme (SHG-BLP) in terms of
growth in agency-wise distribution of SHG- Bank Linkage Programme and under Micro Finance Institution / Micro
Finance Organization (MFI)/ MFO-Bank Linkage Programme. The growth has been evaluated by various parameters
such as progress of SHG-BLP; number of savings linked SHGs, credit disbursement and credit outstanding by banks
and under MFIs SHG-BLP. Present study is based on secondary data and descriptive statistics has been used for the
analysis of the data. Present study found that there has been significant rise in amounts of SHG Savings with banks with
has increase in formation of new SHGs mainly through SHG BLP due to initiative taken by NABARD. The study also
found Regional Rural Banks continued its dominance in the share of bank loan disbursed and outstanding position to
commercial and cooperative banks. The research study recommends that use of technology will enhance the outreach
and sustainability of microfinance which leads to economic development of India.
...................................................................................................................................................................................................
Keywords:
Microfinance, Growth, SHG-BLP, MFI- BLP
Introduction :
Indian population is depending on agriculture hence base production dependence on rural segment of economy is the
most. A large part of Indian households has limited access to formal financial services. Insufficient opportunity to
access credit needs leads to more poverty among poor people. Microfinance can be an effective solution to provide the
credit and other basic financial services to increase the income generating activity and productivity of poor people.
Microfinance can be a key tool for self-employment of men and women to bring about change by improving their
income. Microfinance also improves living standards of poor people by providing other financial services such as
micro insurance, micro pension, and remittance. It also creates the empowerment of the women by improving their
income through establishing their own business and reduce their vulnerability. Thus, microfinance seems to be an
excellent mechanism to alleviate poverty of the people as well as for overall economic growth of our country. In
addition to this Government of India, with the help of NABARD has introduced several credits linked poverty alleviation
programmes. SHG-BLP is a pioneered in financial inclusion of people by providing microcredit poor through a wide
network of commercial banks, regional rural banks, co-operative banks and other financial institutions. Hence, it’s
important to study growth of microfinance under SHG-BLP in terms and under MFI/ MFO-Bank Linkage. The present

20 Vol. 8 • No. 2 • July - December 2018
“SANSMARAN” Management Research Journal• ISSN No. 2278-7801• Impact Factor IIJIF (2017) 4.107• Impact Factor PIF (2018) 4.504
study assesses growth under SHG-BLP through different agencies in development of the country.
Literature Review :
According to Weiss (2005) microfinance encompasses the provision of financial services for poor and low-income
clients mostly in the self-employment sector helping them to earn income build assets and manage unpredictable hazards.
It is an efficient instrument of credit to the very low-income households, who do not have access to conventional
financial institutions. Morduch and Rutherford (2003) in their studies found that poor need financial services to help
them, manage their lives and livelihoods that are complex, diverse, dynamic and vulnerable, and the poor want their
financial services to respond by being reliable, flexible, continuous and convenient. According to Robinson (2001)
microfinance has emerged as a ‘revolution’ or a viable alternative to reach the hitherto unreached for their social and
economic empowerment through social land financial intermediation. Many MFIs would like to reach more poor,
uneducated, or female clients to maximize their social impacts Mersland and Strom, (2009). According to Ghate (2007)
Microfinance Industry in India Indian microfinance has continued growing rapidly towards the main objective of financial
inclusion, extending outreach to a growing share of poor households and to approximately 80% of the population that
is yet to be reached directly by the formal institutions. Microfinance services in India are provided mainly by two
different models. However, SHG-Bank Linkage (SBL) model has emerged as the more dominant model due to its
adoption by state-owned financial institutions. Microfinance service providers include apex institutions such as National
Bank for Agriculture and Rural Development (NABARD), Small Industries Development Bank of India (SIDBI), and
Rashtriya Mahila Kosh (RMK). Rao (2008) found that at the retail level, commercial banks, regional rural banks, and
cooperative banks provide microfinance services as a part of the banking activities never made by the private microfinance
industry to include the excluded poor in formal financial services. These semiformal institutions that undertake
microfinance services as their main activity are generally referred to as MFIs. According to (Ghate 2007; Rao, 2008;
Singh 2008) MFIs are mainly in the private sector. Dichter (1997) claimed that commercial banks, community banks,
non-governmental organizations (both local and international), self-help groups, credit unions have engaged in the
provision of micro-credit. Having discussed in above literature importance of SHG -BLP in growth of microfinance it’s
become necessary to find out growth of SHG -BLP. Hence present study assesses growth of microfinance under SHG -
BLP and MFI -BLP.
Research Methodology :
Objectives
The objectives of the present research study are as follows
� To study the growth of microfinance under SHG-BLP program in India.
� To examine the progress of SHG-BLP and MFIs-BLP in India.
Methodology :
In the present study growth has been assessed by three parameters such as progress of SHG-BLP; number of savings
linked SHGs, credit disbursement and credit outstanding under SHG-BLP and MFIs-BLP in India. Compounded annual
growth rate (CAGR) is used to find out the growth of microfinance under SHG-BLP. CAGR provides a constant rate of
return over the time period. In order to assess the growth in loan disbursed, loan outstanding by banks and MFIs, CAGR
is used. The present study has used secondary data and data has been collected from the various, journals, reports,
articles etc. Three years data has been analyzed for the study 2015-16, 2016-17 and 2017-18.

Vol. 8 • No. 2 • July - December 2018 21
“SANSMARAN” Management Research Journal• ISSN No. 2278-7801• Impact Factor IIJIF (2017) 4.107• Impact Factor PIF (2018) 4.504
Data analysis :
The growth of microfinance under SHG-Bank Linkage Programme during past three years has been analyzed in three
parts overall growth under SHG-Bank Linkage Programme, Agency-wise growth of SHG Bank Linkage Programme
and growth under MFI/ MFO-Bank Linkage Programme as follows
A) Overall growth under SHG-Bank Linkage Programme
Results of Table no. 1 show that increase of 3.43 % in the number of SHG Savings with banks. There was a significant
rise in amounts of SHG Savings with banks of 12.69 % over the last three years. As there has been increase in formation
of new SHGs mainly to scaled up savings through SHG BLP programme. As NABARD induced 324 projects which had
trained more than 15,000 women SHG members during last two years with the support of banking system and government
agencies. There was also healthy savings of a SHG which can fulfil needs of its members through inside lending as well
as can used for appropriate investment plan. Loans Disbursed to number of SHGs from 2016 to 2018 has shown a
growth of 7.27 % and total amounts disbursed to SHGs was 8.16% which is commendable as there was decline in loan
disbursement because of demonetisation. Loans Outstanding to SHGs recorded 7.27 % growth in number of SHGs and
9.81 % increase in the quantum of loan outstanding during the last three years.

22 Vol. 8 • No. 2 • July - December 2018
“SANSMARAN” Management Research Journal• ISSN No. 2278-7801• Impact Factor IIJIF (2017) 4.107• Impact Factor PIF (2018) 4.504
B) Agency-wise growth of SHG Bank Linkage Programme
Agency-wise growth of SHG Bank Linkage Programme analyzed as follows
I) Agency-wise Loan disbursed by SHG Bank Linkage Programme
A result of Table No.2 and 3 shows that RRBs have robust share in the credit flow to SHGs in number of SHGs and
amount of loan disbursed under SHG-BLP (18.49 % and 18.16) compared to commercial bank and cooperative banks
for past three years .RRBs have wide network of branches in rural areas as a strength for such a growth . This is also a
result as NABARD encouraged RRBs to finance JLGs in a large scale and accordingly entered into MOUs with 36
RRBs in 19 states during 2017-18 as per NABARD report 2018.Cooperative Bank have declining growth in disbursement
of loan to SHGs (-3.60) which is negative as shown in Table No. 2. Amount of Loan disbursed to SHG by Cooperative
Bank has positive growth (5.79) as per table No. 3. Commercial Banks have 3.98% increase in number SHGs to whom
loan has disbursed (3.98%) and in terms of amount disbursed under SHG-BLP was (4.46%) as per Table No.2 and 3
from year 2016 to 2018.
Table no. 2: Loan disbursed under SHG-BLP (in Nos.)
As on As on As on Growth (%)
31st March 2016 31st March 2017 31st March 2018
Commercial Banks 1132281 1116442 1272886 3.98
Regional Rural Banks 470399 557540 782563 18.49
Cooperative Bank 229643 224138 205683 -3.60
Source: Status of microfinance 2018, 2017, NABARD
Table no. 3: Loan disbursed under SHG-BLP (Amt in lakhs)
As on As on As on Growth (%)
31st March 2016 31st March 2017 31st March 2018
Commercial Banks 2518497 2429702 2870762 4.46
Regional Rural Banks 916493 1161300 1511934 18.16
Cooperative Bank 283700 287113 335892 5.79
Source: Status of microfinance 2018, 2017, NABARD
II) Agency-wise Loan outstanding by SHG Bank Linkage Programme
Results of Table no. 4 show that there was a rise Loan outstanding in terms of number of SHGs by Regional Rural
Banks (4.68 %), followed by Commercial Banks (3.41%)and negative growth by Cooperative Bank (-8.65%) as its
similar with the results of agency-wise Loan disbursed by SBLP. Amounts Loan outstanding under SHG-BLP is maximum
for Regional Rural Banks (12.17%) as disbursement is also high. In case of Commercial Banks Amounts Loan outstanding
to SHG was (9.48%) and for Cooperative Bank it was (2.09%) which is lowest but disbursement has negative growth.
These results suggest that Commercial Banks and Commercial Banks have to take some remedial measures for recovery
of loan.

Vol. 8 • No. 2 • July - December 2018 23
“SANSMARAN” Management Research Journal• ISSN No. 2278-7801• Impact Factor IIJIF (2017) 4.107• Impact Factor PIF (2018) 4.504
Table no. 4: Loan outstanding under SHG-BLP (Amt in Nos.)
As on As on As on Growth (%)
31st March 2016 31st March 2017 31st March 2018
Commercial Banks 2626364 267030 2904086 3.41
Regional Rural Banks 1445476 161184 1658221 4.68
Cooperative Bank 600781 566141 458051 -8.65
Source : Status of microfinance 2018, 2017, NABARD
Table no. 5: Loan outstanding’s under SHG-BLP (Amt in lakhs)
As on As on As on Growth (%)
31st March 2016 31st March 2017 31st March 2018
Commercial Banks 3714562 3866847 4874805 9.48
Regional Rural Banks 1610935 1911991 2273864 12.17
Cooperative Bank 386426 379292.2 411176 2.09
Source: Status of microfinance 2018, 2017, NABARD
B) Growth under MFI/ MFO-Bank Linkage Programme
Growth under MFI/ MFO-Bank Linkage Programme has evaluated as follows
I)Loans disbursed by banks/FIs to MFIs/ MFOs
As per Table No. 6 Loans disbursed by banks/FIs to MFIs/ MFOs have big jump of 43.75% but amount of loans
disbursed by banks/FIs to MFIs/ MFOs shown 7.08% from year 2016 to 2018. NABARD assisted MFIs with grant
support and Revolving Fund Assistance (RFA). Later NABARD helped a number of MFIs with quasi-equity and
subordinated debt instruments from Micro Finance Development and Equity Fund. MFIs today need to upgrade technology
to d automate its operations thus lowering the cost. At the same time, not to lose the human touch to enhance the
customer base.
Table no. 6: Loans disbursed by banks/FIs to MFIs/ MFOs
As on As on As on Growth (%)
31st March 2016 31st March 2017 31st March 2018
Loans disbursed by banks/ 647 2314 1922 43.75
FIs to MFIs/ MFOs (nos)
Loans disbursed by banks/ 20795.57 19304.38 25515.23 7.08
FIs to MFIs/ MFOs Amts
(Amount in Crore)
Source : Status of microfinance 2018, 2017, NABARD

24 Vol. 8 • No. 2 • July - December 2018
“SANSMARAN” Management Research Journal• ISSN No. 2278-7801• Impact Factor IIJIF (2017) 4.107• Impact Factor PIF (2018) 4.504
II) Loans outstanding against MFIs/ MFOs
According to results of Table No. 7 Loans outstanding by banks/FIs to MFIs/ MFOs have maximum in number which
was 35.93% and amount of loans outstanding by banks/FIs to MFIs/ MFOs shown 8.09% as its parallel with the results
of Loans disbursed by banks/FIs to MFIs/ MFOs during year 2016 to 2018.
Table no. 7: Loans outstanding against MFIs/ MFOs
As on As on As on Growth (%)
31st March 2016 31st March 2017 31st March 2018
Loans outstanding against 2020 5357 5073 35.93
MFIs/ MFOs in number
Amount of Loans 25580.84 29225.45 32305.92 8.09
outstanding against
MFIs/ MFOs
(Amount in Crore)
Source: Status of microfinance 2018, 2017, NABARD
Conclusion :
Present study found that there has been significant rise in amounts of SHG Savings with banks with has increase in
formation of new SHGs mainly through SHG BLP due to initiative taken by NABARD for new 324 projects. Thus, the
SHG-Bank Linkage Progrmme has expanded leaps and bounds in India to emerge as largest microfinance sector in the
world also a flagship programme of microfinance in India. The hike in amounts disbursed to SHGs over last three years
which is commendable as there was decline in loan disbursement because of demonetization. This success of the
SHGBLP is combined efforts of agency partners like commercial banks, RRBs, Cooperative banks, NGOs, Government,
and SHG women who believed in the mission of poverty alleviation through microfinance. Regional Rural Banks
continued its dominance in the share of bank loan disbursed and outstanding position to commercial and cooperative
banks. As RRBs have huge rural network and NABARD has provides support to RRBs to finance JLGs in a large scale
for capacity building to create a pool of trainers out of bank staff for formation, nurturing and financing of new JLGs.
The other channel for growth of microfinance in India is through Microfinance Institutions (MFIs) with diverse lending
methodology through individual and group lending providing banking service for the rural population which still out of
formal banking systems. The study found that there is a positive growth in microfinance in India through SHG-BLP
MFI/ MFO-Bank Linkage Programme. The study recommend that use of technology will enhance the outreach improve
recovery performance as it can easily give the track records of SHGs also enhance portfolio quality. Implementation of
MIS systems will provide higher operational efficiencies and over all sustainability of microfinance which leads to
economic development of India.
References :
� Dichter, T. (1997). Appeasing the gods of sustainability: the future of international NGOs in microfinance, St.
Martin’s Press, New York.
� Ghate, P. (2007). Indian microfinance: The Challenges of Rapid Growth, Sage Publications, New Delhi.

Vol. 8 • No. 2 • July - December 2018 25
“SANSMARAN” Management Research Journal• ISSN No. 2278-7801• Impact Factor IIJIF (2017) 4.107• Impact Factor PIF (2018) 4.504
� Mersland and Strom, (2009). Mersland, R. and Strom. R. O. (2009). Performance and governance in microfinance
institutions. Journal of Banking and Finance, 33, 662-669.
� Morduch and Rutherford (2003) Morduch, J. and Rutherford, S. (2003). Microfinance: Analytical Issues for
India, for World Bank, India.
� Rao, M. K. (2008). MFIs in India: An Overview in Karmakar K G (Ed.), Microfinance in India. Sage Publications
India Pvt. Ltd., New Delhi.
� Robinson, M. S. and Net Library, I. (2001). The Microfinance revolution: sustainable finance for the poor.
Washington, DC. The World Bank and the Open Society Institute.
� Singh, S. (2008). SHG-Bank linkage programme: progress and prospects, in Karmakar K G (Ed.). Microfinance
in India, Sage Publications India Pvt. Ltd., New Delhi.
� Status of Microfinance, in India, NABARD (2018)
� Weiss (2005) Weiss, J. and Montgomery, H. (2007). Great expectations: microfinance and poverty reduction in
Asia and Latin America. Oxford Development Studies, 33(3), 391-416.

26 Vol. 8 • No. 2 • July - December 2018
“SANSMARAN” Management Research Journal• ISSN No. 2278-7801• Impact Factor IIJIF (2017) 4.107• Impact Factor PIF (2018) 4.504
A Study on Factors Influencing Attitude Towards Using Electronic HRM
Mr. Pravin Dinkar Kamble
Assistant Professor, MET Institute of Management, Mumbai
................................................................................................................................................................................................
ABSTRACT :
Electronic human resource management (E-HRM) provides human resource (HR) functions with the opportunity to
create new avenues for contributing to organizational success. This study is a preliminary investigation on technology
factors (clarity of E-HRM goals, E-HRM trust, and user satisfaction with E-HRM, perceived usefulness, and perceived
ease of use, intention to use E-HRM, user support, social influence, and facilitating conditions) and attitude towards
using E- HRM among 59 NON-HR professionals to understand employee behavior with the help of identified factors.
This paper also highlights areas for future research on this unique topic among the HR professionals as a whole.
................................................................................................................................................................................................
Keywords:
E-HRM, Technology, Organizational Success
................................................................................................................................................................................................
1. Introduction :
Rapid development of science and technology, especially the usage of Internet and computer technology, has
brought outstanding changes to our economy, society, and culture. Over the last few years, with the advent of
these technologies, a new wave of human resource (HR) technology known as electronic human resource
management (E-HRM) has emerged (Hooi, 2006). However, academic involvement in E-HRM started relatively
late and, to an extent, is still trying to catch up with practice (Ruel et al., 2007). The introduction of E-HRM is
expected to facilitate a more efficient and strategic way of working for HR professionals (Gardner et al., 2003;
Shrivastava & Shaw, 2003).
Using E-HRM technology is a way of implementing HR strategies, policies, and practices. The E-HRM technology
supports the HR function to comply with the HR needs of the organization through web-technology-based channels
(Ruel et al., 2004). The E-HRM technology provides a portal which enables managers, employees, and HR
professionals to view, extract, or alter information which is necessary for managing the HR of the organization. In
addition, with the use of E-HRM, fewer HR professionals are needed, because E-HRM eliminates the “HR
middleman” (Lengnick-Hall & Moritz, 2003).
2. Review of Literature :
Research adoption of E-HRM that is based on the Technology Acceptance Model (TAM) (Davis, 1989) was
introduced by Voermans and Veldhoven (2007). The present study has identified factors of clarity of E-HRM
goals, E-HRM trust, user satisfaction with E-HRM, perceived usefulness, perceived ease of use, intention to use
E-HRM, user support, social influence, and facilitating conditions that can influence attitude towards using
E-HRM.

Vol. 8 • No. 2 • July - December 2018 27
“SANSMARAN” Management Research Journal• ISSN No. 2278-7801• Impact Factor IIJIF (2017) 4.107• Impact Factor PIF (2018) 4.504
2.1. E-HRM
Recently, E-HRM has been studied increasingly by many scholars. Most of the studies on E-HRM were
undertaken in USA and Europe. There are fewer studies from Malaysia, a country that is environmentally,
economically, and technologically far different from the developed economies. Because of the huge
difference in the market environment and the management mechanisms between developed countries and
Malaysia, there should be much different research results on E-HRM. Previous studies on E-HRM have
been conducted by various researchers in developed countries.
Laumer et al. (2010) studied E-HRM in an E-Business environment among 144 HR managers from German
top 1,000 firms. Their survey results revealed that HR managers’ most pressing challenges are staff retention
and internal and external employer branding. They concluded the importance for an E-HRM that needs to
be both effective-adequately fill vacancies – and efficient – make best use of scarce resource.
Strohmeier and Kabst (2009) examined the factors that influence the cross-national organizational adoption
of E-HRM in Europe. Major general and contextual influence factors were derived and tested based on a
large-scale survey with a sample of 2,336 organizations in 23 European countries using logistic regression.
They revealed that E- HRM is a common practice throughout Europe since two-thirds of all organizations
have already adopted E-HRM. They also found that major determinants of E-HRM adoption are size, work
organization, and configuration of HRM.
Voermans and van Veldhoven (2007) conducted a study on attitude towards E-HRM. They utilized an
online questionnaire, in which 99 managers and 257 employees within Philips (Electronics) Netherlands
participated. They found that differences in perceived usability of current IT systems, as well as the preferred
HR roles strategic partner (high preference) and employee champion (low preference), were related to a
positive attitude towards E-HRM systems. For managers, user support was also found to be a predictor of
a positive attitude towards E-HRM.
Olivas-Lujan et al. (2007) conducted a case-based study in order to investigate how four of the most
competitive Mexican firms are implementing their E-HRM strategy. They discovered that to fully understand
the way E-HRM is used in firms from emerging economies, it is important to take into consideration local
idiosyncrasies.
Ruel et al. (2007) examined the contribution of E-HRM to HRM effectiveness. They conducted their study
in the Ministry of Internal Affairs in The Netherlands, where E- HRM in the form of employee self-service
applications was introduced. They found that individual assessment of e-HRM applications influences
HRM technical and strategic effectiveness. This is especially so in the perceived quality of the content and
the structure of e-HRM applications which have a significant and positive effect on technical and strategic
HRM effectiveness. They also found that the basic expectations are that using e-HRM will decrease costs,
will improve the HR service level and will give the HR department space to become a strategic partner.
Ruel et al. (2004) conducted an explorative empirical study in five large companies on web-based HRM.
They concluded that the goals of E-HRM are mainly to improve HR’s administrative efficiency/to achieve
cost reduction. They also found that international companies seem to use the introduction of E-HRM to
standardize/harmonize HR policies and processes. Further, there is a “gap” between E-HRM in a technical

28 Vol. 8 • No. 2 • July - December 2018
“SANSMARAN” Management Research Journal• ISSN No. 2278-7801• Impact Factor IIJIF (2017) 4.107• Impact Factor PIF (2018) 4.504
sense and E-HRM in a practical sense in the five companies involved in their study. Finally, E- HRM
hardly helped to improve employee competences, but resulted in cost reduction and a reduction of the
administrative burden.
2.2 Technology Acceptance Model (TAM)
Technology Acceptance Model (TAM) is one of the most influential models used in explaining the acceptance
of information technology (IT) (Lee et al., 2003). According to TAM (Davis, 1989), perceived usefulness
(PU) and perceived ease of use (PEU) of IT are two major determinants of IT usage. PU defined as the
extent to which a person believes that using the system will enhance his or her job performance and PEU
defined as the extent to which a person believes that using the system will be free of effort. TAM posits that
computer usage is determined by a behavioral intention to use a system, where the intention to use the
system is jointly determined by a person’s attitude toward using the system and its perceived usefulness
(see Figure 1).
Figure 1: Technology Acceptance Model (TAM) (Davis et al., 1989)
2.2 Technology Acceptance Model (TAM)
Despite the growing interest in E-HRM in developed countries, there are very few studies on HRM
technology in India. For instance, Yusliza, Ramayah, and Haslindar (2010) proposed a model based on
TAM and HR Roles that examine the relationship between HR roles and E-HRM adoption. Ramayah et al.
(2006) studied the adoption and usage of a HR information system (HRIS) among HR executives and HR
professionals working in companies in Penang. Their study revealed that compatibility and visibility were
positively related and complexity was negatively related to extent of use of the HRIS. Hooi (2006) studied
the extent of E-HRM practiced in the small and medium sized manufacturing companies. The readiness
and feasibility of implementing E-HRM in the SMEs is dependent on the availability of resources (expertise,
financial, and technical resources) and the attitude of the employees.
Less attention has been made to the relationship with various antecedent factors of technology and attitudes
towards using E-HRM. It has become increasingly important to gain a greater understanding of the factors
on attitude towards using E-HRM. This study is an attempt to fill this gap in E-HRM literature. This paper
is part of a larger research project in which several aspects of E-HRM adoption were investigated.

Vol. 8 • No. 2 • July - December 2018 29
“SANSMARAN” Management Research Journal• ISSN No. 2278-7801• Impact Factor IIJIF (2017) 4.107• Impact Factor PIF (2018) 4.504
2.3 Variables Related to this Study
Attitude is described to be individual’s positive or negative behavior towards a new idea or new technology
and has been known to be a driver of consumer utility or technology adoption (Fishbein & Ajzen, 1975).
As revealed in empirical studies related to the diffusion of technological innovations, attitude exposes
one’s belief about the evaluation and consequences of a given behavior (Li, 2004).
User satisfaction (in this study is User Satisfaction with E-HRM) is a subjective evaluation of the various
use of experiences of an information system based on a pleasant/ unpleasant continuance (Seddon, 1997).
The literature on end-user satisfaction with Information Technology is extensive. Mahmood et al. (2000)
used a meta-analysis approach to synthesize and validate the construct of IT end-user satisfaction. Satisfaction
with IT has been widely accepted as an indicator of IT usage, which is considered as an important driver of
IT success. Thus, user satisfaction with E- HRM has been chosen as a success variable of E-HRM adoption
in this study.
Perceived Ease of Use reflects the degree of difficulty in understanding, learning, or operating the technology.
According to Rogers (1995), it also reflects the degree to which an innovation or new technology is perceived
as better than the substitutes. In this vein, the HR professional’s perception that using E-HRM will involve
minimum effort or that E-HRM will be easy to use with, is an influential factor in E-HRM adoption.
According to TAM, perceived ease of use leads to intention which in turn generates the actual individual
usage behavior.
Facilitating Conditions as described by Venkatesh et al. (2003) as “the degree to which an individual
believes that an organizational and technical infrastructure exists to support use of the system” (p. 453). In
the context of the study, the facilitating conditions include the necessary support from the HR and IT
department to provide education and help to the employees. Also, facilitating conditions include the technical
infrastructure that provides a highly available and responsive system to the users.
3. Objectives of the Study :
a. To study the factors influencing attitude towards using E-HRM
4. Hypothesis :
Ho: There is no significance between factors identified and E-HRM.
H1: There is significance between factors identified and E-HRM.
5. RESEARCH METHODOLOGY
The data for study is collected through primary sources as well as from secondary sources. Primary data is
collected through the questionnaire had 12 questions and 4 demographic enquiries where participants were asked
to provide their responses and SPSS is used to analyze the collected data. Secondary data is collected from
various annual reports, newspapers, journals, e-journals, books, reports, magazines and websites.
5.1 Sample Size
Simple random sampling method was used to get data from the respondents total 100 questionnaires were
distributed out of which 59 respondents actually gave their responses from selected two MNC banks.

30 Vol. 8 • No. 2 • July - December 2018
“SANSMARAN” Management Research Journal• ISSN No. 2278-7801• Impact Factor IIJIF (2017) 4.107• Impact Factor PIF (2018) 4.504
Sources of Data :
The data for study was collected through primary sources as well as from secondary sources. Primary data
was collected from NON-HR employees by a questionnaire to study second side of coin as most of the
literature available is able to capture HR employee point of view.
The scale used in the e-HRM attitudinal measure is a five-point Likert-type scale.
Secondary data was collected from various case studies, research literatures.
Analysis and interpretation of the data:
Data gathered through primary sources and secondary sources complied. The Statistical package for the
Social Sciences (SPSS) is used for statistical analysis of data.
6. Research Work :
Objective 1: To study the factors influencing attitude towards using E-HRM
Hypothesis 1: There is no significance between factors identified and E-HRM.
Rotated Component Matrixa
Extraction Method: Principal Component Analysis.
Rotation Method: Varimax with Kaiser
Normalization.
a. Rotation converged in 5 iterations.
Explanation
The Rotated Components Matrix table mentioned
in Table above is used to understand the results of
analysis. Variables were sorted in such a way that
the components were presented in order that each
component has the highest loading value on the top
loaded strongly followed by the lowest ones.
Component 1: Perceived Ease of Use reflects
Q6, Q7, Q8 and Q9 loaded strongly on Component
1
Component 2: User Satisfaction
Q3, Q4 and Q5 loaded strongly on Component 2.
Component 3: Facilitation Conditions
Q10, Q11 and Q12 loaded strongly on Component 3.
Component 4: Attitude
Q1 and Q2 loaded strongly on Component 4.

Vol. 8 • No. 2 • July - December 2018 31
“SANSMARAN” Management Research Journal• ISSN No. 2278-7801• Impact Factor IIJIF (2017) 4.107• Impact Factor PIF (2018) 4.504
KMO and Bartlett’s Test
Explanation:
The test comprises of the Kaiser –
Meyer – Olkin (KMO) test (Kaiser
et al., 1974) and Bartlett‘s test of
Sphericity (Bartlett, 1954)
adequacy which was followed to
test the case to variable ratio for
the analysis being conducted
applied and to check the suitability
of Components Analysis.
Our significant value was .000 which was even below .05 and denotes that the sample is adequate.
Hence, it shows that the factors identified through responses collected through survey from employees of organization
name were suitable and valid to study the problem.
Therefore, Null Hypothesis is rejected.
Reliability Test :
Explanation :
Cronbach alpha is 0.732 so it shows that the reliability of this data is 100%
as standard value of Cronbach alpha should be 0.7. So, if any researcher
wants to do any project in future he/she can relies on this data if they want
to conduct researcher based on electronic human resource management.
Scope of the Study :
Although the present study had some limitations, the findings will have
ample implications which can be useful for teachers, administrators, policy
makers, HR professionals, Management level lead, as well as for researchers who are interested HR analytics &
automations.
Investing in technology is cost to company, this study will help us understand the best approach to invest time, money
and human resource which will lead to optimum utilization of resources and a perspective from the target audience or
employees for whom the technology is rolled out.
This study aims to add to the quantitative literature on Human Resource as a strategic part of the organization which in
return contributes in line with other revenue earning functions by use of technology and giving more output in time
saves, accuracy and of course employees acceptance.
7. Suggestions, Recommendation and Conclusion :
The results revealed that there is a positive impact of the identified factors on electronic human resource
management. The reliability and correlation of the drivers was also measured to check its significance through p

32 Vol. 8 • No. 2 • July - December 2018
“SANSMARAN” Management Research Journal• ISSN No. 2278-7801• Impact Factor IIJIF (2017) 4.107• Impact Factor PIF (2018) 4.504
value. Four components identified viz.
Component 1: Perceived Ease of Use reflects
Component 2: User Satisfaction
Component 3: Facilitation Conditions
Component 4: Attitude
Suggestions and recommendation
1. Employees should be made aware of the E-HRM tools that are available for their disposal, considerate
awareness and benefits should be well communicated.
2. The E-HRM tool designed should be easy to and should not be complex, it should be designed from lay
man angle.
3. The understanding about the E-HRM tools should be same with its end users for the purpose of which it
has designed.
4. Any systems / software’s / infrastructure should be well equipped for smooth functioning of the E-HRM
tools.
5. The end users should have enough technical support and guidance in case they are stuck somewhere or
when they encounter any technical issue.
6. SOPs and user guides must be available for the disposal of the users for quick references.
7. Through testing of the tools must be done before the final release.
8. Positive outlook and attitude towards these practices must be inculcated in the organization culture.
9. Regular feedbacks / enhancement ideas about the tools must be taken from the end users.
10. The user interface should be user friendly.
11. E-HRM tools should be designed with the intention to simplify the process and improve the process.
12. Technological friendly culture must be promoted in the organization.
8. Limitation of Study and Scope of Further Research :
1. This study is related to only one sector.
2. It includes only Non- HR employees.
3. Sample size is restricted due to time and money constraints.
4. It includes only the selected 2 MNC Banks.
9. References :
� Agarwal, R. & Prasad, J. 1997, ‘The role of innovation characteristics and perceived voluntariness in the
acceptance of information technologies’, Decision Sciences, vol. 28, no. 3, pp. 557-582.
� Amoako-Gyampah, K. & Salam, A. F. 2004, ‘An extension of the technology acceptance model in an ERP

Vol. 8 • No. 2 • July - December 2018 33
“SANSMARAN” Management Research Journal• ISSN No. 2278-7801• Impact Factor IIJIF (2017) 4.107• Impact Factor PIF (2018) 4.504
implementation environment’, Information & Management, vol. 41, no. 6, pp. 731-745.
� Amoroso, D. L. 1988, ‘Organizational issues of end-user computing’, Database, vol. 19, no. 3, pp. 49-58.
� Amoroso, D. L. & Cheney, P. H. 1991, ‘Testing a causal model of end-user application effectiveness’,
Journal of Management Information Systems, vol. 8, no. 1, pp. 63-89.
� Davis, F. D. 1989, ‘Perceived usefulness, perceived ease of use, and user acceptance of information
technologies’, MIS Quarterly, vol. 13, no. 3, pp. 319-340.
� Davis, F. D. 1993, ‘User acceptance of information technology: system characteristics, user perceptions
and behavioural impacts’, International Journal of Man-Machine-Studies, vol. 38, pp. 475-487.
� Davis, F. D., Bagozzi, R. P. & Warshaw, P. R. 1989, ‘User acceptance of computer technology: A comparison
of two theoretical models’, Management Science, vol. 35, no. 8, 982–1003.
� Fishbein, M. & Ajzen, I. 1975, Belief, Attitude, Intention and Behavior: An Introduction to Theory of
Research. Addison-Wesley, Reading, MA.
� Gardner, S. D., Lepak, D. P. & Bartol, K. M. 2003, ‘Virtual HR: The impact of information technology on
the human resource professionals’, Journal of Vocational Behavior, vol. 63, pp. 159-179.
� Hair, J., Babin, B, Money, A & Samouel, P. (2003). Essentials of Business Research Methods. John Wiley
and Sons, Inc. London.
� Hooi, L.W. 2006, ‘Implementing e-HRM: The readiness of small and medium sized manufacturing
companies in Malaysia’, Asia Pacific Business Review, vol. 12, no. 4, pp. 465-485.
� Igbaria, M., Zinatelli, N., Cragg, P. & Cavaye, A. 1997, ‘Personal computing acceptance factors on small
firms’, MIS Quarterly, vol. 21, no. 3, pp. 279-302.
� Lancaster, G. A., Dodd, S. & Williamson, P. R. 2004, ‘Design and analysis of pilot studies: Recommendations
for good practice’, Journal of Evaluation in Clinical Practice, vol. 10, no. 2, pp. 307-312.
� Laumer, S., Eckhardt, A. & Weitzel, T. 2010, ‘Electronic human resource management in an e-business
environment’, Journal of Electronic Commerce Research, vol. 11, no. 4, pp. 240-250.
� Lee, Y., Kozar, K. A. & Larsen, K. R. T. 2003, ‘The technology acceptance model: Past, present, and
future’, Communications of the AIS, vol. 12, pp. 752-780.
� Lengnick-Hall, M. L. & Moritz, S. 2003, ‘The impact of e-HR on the HRM function’, Journal of Labor
Research, vol. 24, no. 3, pp. 365-379.

34 Vol. 8 • No. 2 • July - December 2018
“SANSMARAN” Management Research Journal• ISSN No. 2278-7801• Impact Factor IIJIF (2017) 4.107• Impact Factor PIF (2018) 4.504
A Comparative Analysis of Organized Retail Sector In India
Dr. Sushma Patil
Assistant professor, Guru Nanak Institute of Management Studies, Mumbai
...............................................................................................................................................................................................
ABSTRACT :
Retail sector is one of the emerging sectors of Indian market. Indian Retail Industry is ranked among the ten largest
retail markets in the world. Among the fast-paced Industries retail accounts for 10% of Indian GDP and 8% of total
employment. With the entry of corporate groups such as Future group, Reliance etc. into the retailing market the retail
industry, which, until the early 1990s, was dominated by the unorganized sector, witnessed a rapid growth in the
organized sector. In this research paper, an attempt has been made to study overall growth of organized retail sector, the
role of organized retail and the factors which contribute to growth of organized retail are discussed. Based on secondary
data, a comparative analysis of major organized players in India is done based on Number of stores available across
India, Average store area, Average sales per square feet, Revenue of key players and Retail Productivity. From overall
retail analysis of major key players, it can be concluded that the characteristics of organized retail varies in terms of
store foot print, average store size, average sales per sq. ft, revenue, productivity from player to player and based on
formats also i.e. supermarket, hybrid supermarket and hypermarket. Major organized retail players namely Future
Group, Reliance Group, Aditya Birla Retail, Tata Group, CESC limited, Raheja Corp and Avenue Supermarkets are
taken in to consideration for the study.
...............................................................................................................................................................................................
Keywords :
Missing
...............................................................................................................................................................................................
Introduction :
Concept of Retail :
Retail is the sale of goods to end users, not for resale, but for use and consumption by the purchaser. The word retail is
derived from the French word retailer, meaning to cut a piece off or to break bulk. In simple terms, it implies a first –
hand transaction with the customer. Retailing can be defined as the buying and selling of goods and services. It can also
be defined as the timely delivery of goods and services demanded by consumers at prices that are competitive and
affordable,
(Ms. Vidushi Handa, Mr. Navneet Grover). In 2004, The High Court of Delhi defined the term ‘Retail’ as a sale for final
consumption in contrast to a sale for further sale or processing (i.e. wholesale), a sale to the ultimate consumer. Retailing
can be said to be the link between the producer and the individual consumer buying for personal needs. This avoids
direct interface between the manufacturers and institutional buyers such as the government and other bulk customers.
Retailing is the last link in overall supply chain that connects the individual consumers with the manufacturing and
distribution chain.

Vol. 8 • No. 2 • July - December 2018 35
“SANSMARAN” Management Research Journal• ISSN No. 2278-7801• Impact Factor IIJIF (2017) 4.107• Impact Factor PIF (2018) 4.504
Classification of Retail Industry :
Retail industry can be classified into two categories viz. organized and unorganized retail. Organized retail can be
defined as Organized traders/retailers, who are licensed for trading activities and registered to pay taxes to the government
and Unorganized retail can be defined as unauthorized small shops like conventional kirana shops, general stores,
corner shops among various other small retail outlets but remain as the radiating force of Indian retail industry,(Corporate
Catalyst India).In India, the terms large-scale, modern-format and organized are used synonymously even though they
have different meanings. Large-scale refers to the scale of operation of retail business which in turn implicitly refers to
a chain of stores. Modern-format basically refers to self-service.
With the entry of corporate groups such as Future group, Reliance, ITC etc. into the retailing market the retail industry,
which, until the early 1990s, was dominated by the unorganized sector, witnessed a rapid growth in the organized
sector. Indian retail industry (organized as well as unorganized) spreads over more than 6 million outlets. In the developed
economies, organized retail is in the range of 75-80% of total retail, whereas in developing economies, the traditional
retail sector dominates the retail business. Countries like China, India and Russia are late comers in the diffusion of
modern retail and the main reason why they lagged behind was the severe restrictions on foreign direct investment in
retailing in these countries.
Growth of Organized Retail :
In the past few years, Indian retail sector has seen tremendous growth in the organized segment. Major corporate
players have stepped into the retail arena with long term, futuristic plans to expand their business across verticals, cities
and formats. Companies like Tata, Reliance, Adani Enterprise and Bharti have been investing considerably in the
booming Indian Retail market. Along with these giant retailers, a number of transnational brands have also entered into
the market to set up retail chains in close association with bigger Indian companies. High consumer spending over the
years by the young population and sharp rise in disposable income are driving the Indian organized retail sector’s
growth. Major shift in consumer preferences and lifestyles even Tier I & Tier II cities and towns have given the emergence
of attractive markets for retailers to expand their presence.
According to IBEF Report 2016, Organized Retail Penetration (ORP) in India is low (8 per cent) compared with that in
other countries, such as the US (85 per
cent). This indicates strong growth
potential for organized retail in in 2020,
i t is estimated that organized retail
penetration share would reach 24
percent and unorganized retail
penetration would hold a major share
o f 76 percent.). This indicates strong
growth potential for organized retail in
India as shown in Fig.1.4
Source: BCG Indian Brand Equity Foundation (IBEF) Report January 2016, www.ibef.org
Fig. 1.3 Scope for Expansion in Organized Retail
Indian retail has grown into multi-city as well as multi-format growth by the large business conglomerates. This approach

36 Vol. 8 • No. 2 • July - December 2018
“SANSMARAN” Management Research Journal• ISSN No. 2278-7801• Impact Factor IIJIF (2017) 4.107• Impact Factor PIF (2018) 4.504
led to operating of multi-formats by the same business house, such as Reliance, Future Group, Aditya Birla Group.
Additionally, a few regional retailers in some metros & mini metros have focused on key clusters and have established
successful operations in these cities. So, in this research an attempt has been made to study the growth of organized
retailers, the overall retail scenario and performance of key retail players in organized sector based on secondary data.
In this study comparative analysis of major organized players in India is done on the basis of Number of stores available
across India, Average store area, Average sales per square feet, Revenue of key players and Retail Productivity.
Literature Review :
Chitra Srivastava, Dabas Brenda, Sternquist Humaira Mahi, (2012), in paper titled “Organized retailing in India:
upstream channel structure and management”, have identified structural and relational factors influencing the upstream
channel management of organized retailers in India by conducting in-depth interviews with 15 organized retailers and
two manufacturers in India. Their findings suggest that government regulations influence the supply chain structure in
India. Relational bonds offset the uncertainty borne of weak institutions. Informational transparency and long-term
orientation foster trust between channel partners. This trust, in turn, leads to collaborative partnerships.
R. K. Srivastava (2008) in paper titled “Changing retail scene in India presents how organized retail has developed in
the North and West part of India. He stated that food, groceries and apparel purchase by customers contributed to 52
percent. Small retailers have improved their service to cater to Indian consumers. Credit limits and home service are
helping them to hold on to their customers. He stressed that retailing focus is changing towards satisfying the different
hierarchy of needs of customers.
Sengupta A, (2008) in paper titled “Emergence of modern Indian retail: an historical perspective”, states the emergence
of modern retail business in India which has a history spanning over 30 years. The paper is on food and grocery retail
and he studied in detail the drivers of revolution and growth focusing on the role of manufacturers, retailers and
consumers.
Goswami et.al. (2009) in paper titled “Would Indian consumers move from kirana stores to organized retailers when
shopping for groceries? focus to understand the preference of Indian consumers for large organized retailers over
traditional kirana stores to while shopping for groceries. Influencing factors identified were location, helpful and
trustworthy salespeople, home shopping, cleanliness, promotional offers, quality and negatively related to travel
convenience. Kiranas do well on location but poorly on cleanliness, offers, quality, and helpful trustworthy salespeople.
Vidushi Handa and Navneet Grover (2012) in their paper entitled “Retail Sector in India: Issues & Challenges”,
studied detailed information about the growth of retailing industry in India.
This paper examines how the urban and semi-urban retail markets are witnessing significant growth along with the role
of the Government of India in the industries growth and the need for further reforms.
Objectives :
1) To study the growth aspects of organized retail sector in Indian market.
2) To study the different formats of organized retail in India.
3) To do the comparative analysis of major organized retailer based on selected parameters.
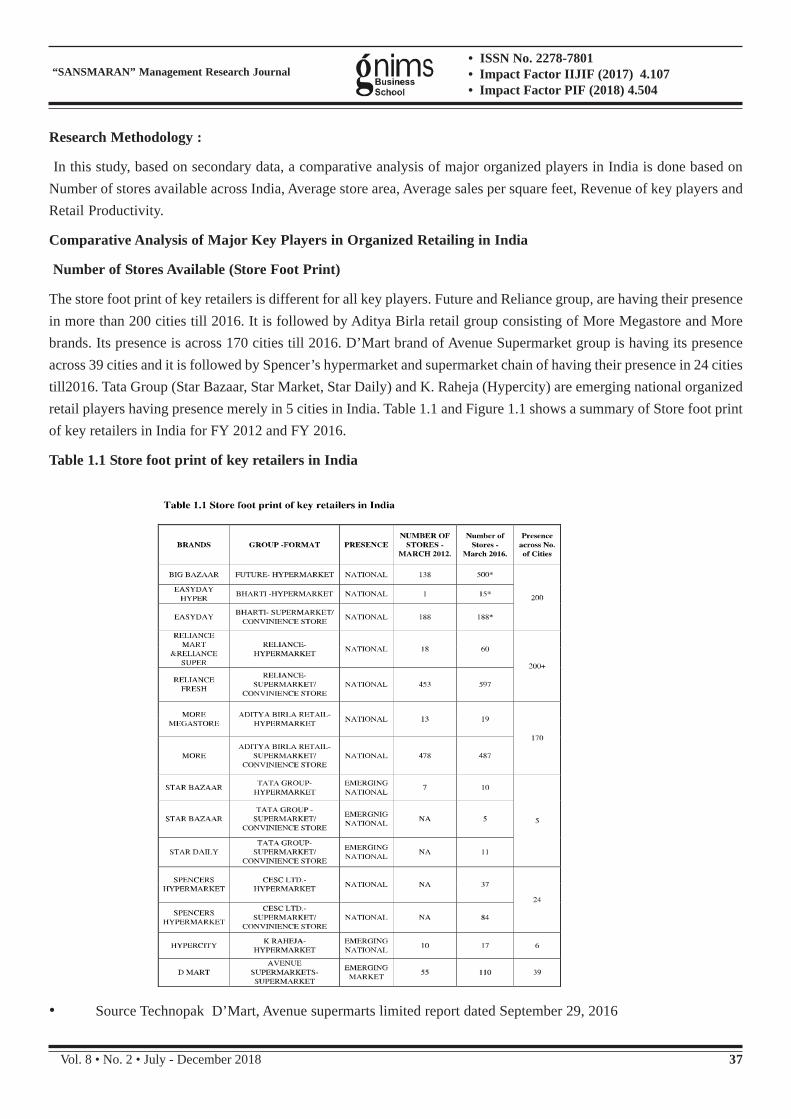
Vol. 8 • No. 2 • July - December 2018 37
“SANSMARAN” Management Research Journal• ISSN No. 2278-7801• Impact Factor IIJIF (2017) 4.107• Impact Factor PIF (2018) 4.504
Research Methodology :
In this study, based on secondary data, a comparative analysis of major organized players in India is done based on
Number of stores available across India, Average store area, Average sales per square feet, Revenue of key players and
Retail Productivity.
Comparative Analysis of Major Key Players in Organized Retailing in India
Number of Stores Available (Store Foot Print)
The store foot print of key retailers is different for all key players. Future and Reliance group, are having their presence
in more than 200 cities till 2016. It is followed by Aditya Birla retail group consisting of More Megastore and More
brands. Its presence is across 170 cities till 2016. D’Mart brand of Avenue Supermarket group is having its presence
across 39 cities and it is followed by Spencer’s hypermarket and supermarket chain of having their presence in 24 cities
till2016. Tata Group (Star Bazaar, Star Market, Star Daily) and K. Raheja (Hypercity) are emerging national organized
retail players having presence merely in 5 cities in India. Table 1.1 and Figure 1.1 shows a summary of Store foot print
of key retailers in India for FY 2012 and FY 2016.
Table 1.1 Store foot print of key retailers in India
• Source Technopak D’Mart, Avenue supermarts limited report dated September 29, 2016

38 Vol. 8 • No. 2 • July - December 2018
“SANSMARAN” Management Research Journal• ISSN No. 2278-7801• Impact Factor IIJIF (2017) 4.107• Impact Factor PIF (2018) 4.504
Fig 1.1 Store foot print of key retailers in India
From Table 1.1 and Fig.1.1 it can be concluded that
Reliance Fresh (supermarket) of Reliance group is having
maximum stores that are 597 till 2016 and presence across
200+ cities. It is followed by Big Bazaar (500 stores),
More (487stores), D mart (110stores), Easy Day (188)
and then Spencer’s supermarket (84 stores). It shows that
Reliance Fresh of Reliance group was having maximum
presence till 2016.
Average Store Area :
As the competition is getting tougher and tougher in the
retail environment, ambience has been taken as one of
the important aspects to lure the shoppers. Today’s customers want a clean, spacious and well-lighted shopping atmosphere
with merchandise clearly marked. A large and well-planned retail store layout allows a retailer to maximize the sales for
each square foot of the allocated selling space within the store.
At present, the organized general merchandise players in India occupy around 40 to 45 million sq. ft. area. This requirement
of retail space is estimated to grow to 60 to 65 million sq. ft. by 2020.
Table 1.2 Average Store Size of Key Players
· Source-Technopak D’Mart, Avenue supermarts limited report dated September 29, 2016

Vol. 8 • No. 2 • July - December 2018 39
“SANSMARAN” Management Research Journal• ISSN No. 2278-7801• Impact Factor IIJIF (2017) 4.107• Impact Factor PIF (2018) 4.504
Table 1.2 and Fig 1.2 and 1.3 shows average store size occupied by major retail players in hypermarket and supermarket
category.
Fig.1.2 Average Store Size in Supermarket Category
From Table 1.2 and Fig ‘1.2, in supermarket category D’Mart is
having maximum average area of 28000-32000 (30,000) Sq. ft
followed by Food Bazaar of Future group of having average
area of 17000 Sq. ft in 2012 and 16500 Sq. ft in 2016. Then it is
followed by Reliance Fresh, Spencer’s supermarket and More
of having store area of 3000-4000 Sq. ft
Fig.1.3 Average Store Size in Hypermarket Category
From Fig.1.3 Hypercity of Raheja group is having
maximum area (75000-85000 Sq. ft) followed by Reliance
Mart, Big Bazaar, Star Bazaar, More Megastore (40000-
45000 Sq. ft) and then Spencer Supermarket (22000-25000
Sq. ft) in 2016 in hypermarket category
Average Sales per Square Feet (Sq.ft)
Emerging national retailers such as D‘Mart, Star Bazaar
have recognized the importance of staying focused and
not spreading across categories. They have focused on
clusters and regions to win market share before entering the market in other regions due to supply chain complexities.
Retailers like D‘Mart who have stayed focused on certain categories and clusters have been able to achieve best in class
productivity among Indian retailers. Table 1.3 shows and Fig 1.4 and Fig 5.5 shows average sales per sq. ft. of key
players in hypermarket and supermarket category.
Table 1.3 Average Sales per Sq. Ft. of Key Players
· D’Mart, Avenue supermarts limited report dated September 29, 2016

40 Vol. 8 • No. 2 • July - December 2018
“SANSMARAN” Management Research Journal• ISSN No. 2278-7801• Impact Factor IIJIF (2017) 4.107• Impact Factor PIF (2018) 4.504
Fig 1.4 Average Sales per Sq. Ft. of Key Players in
Supermarket Category
From Fig 1.4 it can be concluded that D’Mart is having
highest sales per Sq. ft i.e.28000-30,000 INR in 2016 in
supermarket category. It is followed by Reliance Fresh
(18000 INR), Spencer’s (17500 INR), Food bazaar (15250
INR) and More (8500 INR) in 2016.
Fig. 5.5 Average Sales Per Sq. Ft. of Key Players in Hypermarket Category
From fig 1.5 it can be concluded that Spencer’s hypermarket (16500
INR) is having maximum average sales per Sq. ft It is followed by Star
Bazaar (12000 INR), Big Bazaar (10000 INR) More Megastore (9000
INR) and then Hypercity (7500 INR).
Current Revenue & Profitability
Key retailers operating in the F&G segment currently hold around 37%
market share of the USD14bn organized Food & Grocery market, down
from around 49% in 2012. This decrease in the market share of key
retailers is because the organized F&G market has seen emergence of
regional retailers along with an increase in the number of modern convenience stores in Tier I & II cities resulting last
four years. Following table 1.4 and Fig 1.7 shows revenue of key players (INR-Cr) in FY 2012 and FY 2016.
Table 1.4 Revenue of Key Players (INR)
· Source Technopak D’Mart, Avenue supermarts limited report dated September 29, 2016

Vol. 8 • No. 2 • July - December 2018 41
“SANSMARAN” Management Research Journal• ISSN No. 2278-7801• Impact Factor IIJIF (2017) 4.107• Impact Factor PIF (2018) 4.504
Fig. 1.6 Revenue of Key Players (INR)
From fig 1.6.it can be concluded that Big Bazaar (Future group) is
earning highest revenue followed by D’Mart (Avenue Supermarkets)
and then Reliance group comprising Reliance Mart, Reliance Fresh
and Reliance Super. Spencer’ Hypermarket and Supermarket and
Hypercity brand are having revenue at lesser extent as compared to
Big Bazaar, D’Mart and Reliance group.
Retail Productivity
Supermarkets have been observed to garner higher levels of
productivity amongst the general merchandise focused formats. The store productivity of a supermarket is typically 20-
25% higher than that of a hypermarket. Though the efficiencies are higher for supermarkets, the margins are lower as
compared to hypermarkets. The margins are lower due to F&G category accounting for a greater portion of the product
mix, in which the margins are lower as compared to other non-FMCG categories.
It has also been observed that players operating in hybrid supermarket space with average store size of 20,000 to 30,000
sq. ft have been achieving greater productivity as compared to hypermarkets and provide more variety to the consumers
as compared to supermarkets.
The sales per square feet of a hypermarket are low when compared to a supermarket; the gross margins in these formats
are higher than the supermarkets. The higher gross margins are a factor of the category mix which is broadest in case of
a hypermarket, a healthy mix of F&G, fashion & apparel, non-food FMCG and accessories.
Fig. 1.7 Productivity Supermarkets vs. Hybrid Supermarkets vs. Hypermarkets- 2016
Food and Grocery contribute to around 60% to 65% of the
category mix in supermarkets followed by Non-Food FMCG at
15% to 20%. The general merchandise contribution to sales is
around 10% to 15%. High dependency on F&G category results
lower margins for supermarkets. The profitability of these formats
can be attributed to high efficiencies. The sales mix of
hypermarkets is different from supermarkets due to presence of
several categories which the supermarkets do not have, even
though a considerable contribution of sales is from Food &
Grocery category. Food and Grocery contribute to around 30 to 35% of the category mix followed by General Merchandise
at 20% to 25%. The Non-Food FMCG contribution to sales is around 15% to 20%. The higher mix of other categories,
with higher margins is the key reason for greater profitability of hypermarkets.
Findings:
From above overall retail analysis of major key players, it can be concluded that the characteristics of organized retail
varies in terms of store foot print, average store size, average sales per sq. ft, revenue, productivity from player to player
and on the basis of formats also i.e. supermarket, hybrid supermarket and hypermarket. Major organized retail players
namely Future Group, Reliance Group, Aditya Birla Retail, Tata Group, CESC limited, Raheja Corp and Avenue
Supermarkets are taken in to consideration for the study. These key players are compared on the basis of number of

42 Vol. 8 • No. 2 • July - December 2018
“SANSMARAN” Management Research Journal• ISSN No. 2278-7801• Impact Factor IIJIF (2017) 4.107• Impact Factor PIF (2018) 4.504
stores available across India, average store area, average sales per sq. ft revenue of key players and retail productivity.
Number of stores across India-Reliance Fresh (supermarket) of Reliance group is having maximum stores that are
597 till 2016 and presence across 200+ cities. It is followed by Big Bazaar (500 stores), More (487stores), D mart
(110stores), Easy Day (188) and then Spencer’s supermarket (84 stores). It shows that Reliance Fresh of Reliance group
was having maximum presence till 2016.
Average store area- In supermarket category D Mart is having maximum average area of 28000-32000(30,000) sq. ft.
followed by Food Bazaar of Future group of having average area of 17000 sq.ft in 2012 and 16500 sq. ft. in 2016. Then
it is followed by Reliance Fresh, Spencer’s supermarket and More of having store area of 3000-4000 sq. ft
Hypercity of Raheja group is having maximum area (75000-85000 sq. ft) followed by Reliance Mart, Big Bazaar, Star
Bazaar, More Megastore (40000-45000 sq. ft) and then Spencer Supermarket (22000-25000 sq. ft) in 2016 in hypermarket
category
Average sales per sq.ft- D’Mart is having highest average sales per sq.ft i.e.28000-30,000 INR in 2016 in supermarket
category. It is followed by Reliance Fresh (18000 INR), Spencer’s (17500 INR), Food bazaar (15250 INR) and More
(8500 INR) in 2016.
Spencer’s hypermarket (16500 INR) is having maximum average sales per sq. ft It is followed by Star Bazaar (12000
INR), Big Bazaar (10000 INR) More Megastore (9000 INR) and then Hypercity (7500 INR).
Revenue(INR) per annum-Big Bazaar (Future group) is earning highest revenue followed by D’Mart (Avenue
Supermarkets) and then Reliance group comprising Reliance Mart, Reliance Fresh and Reliance Super. Spencer’s
Hypermarket and Supermarket and Hypercity brand are having revenue at lesser extent as compared to Big Bazaar,
D’Mart and Reliance group
Retail productivity- The store productivity of a supermarket is typically 20-25% higher than that of a hypermarket.
Though the efficiencies are higher for supermarkets, the margins are lower as compared to hypermarkets. The margins
are lower due to F&G category accounting for a greater portion of the product mix, in which the margins are lower as
compared to other non-FMCG categories.
It has also been observed that players operating in hybrid supermarket space with average store size of 20,000 to 30,000
sq. ft. have been achieving greater productivity as compared to hypermarkets and provide more variety to the consumers
as compared to supermarkets.
The sales mix of hypermarkets is different from supermarkets due to presence of several categories which the supermarkets
do not have, the higher mix of other categories, with higher margins is the key reason for greater profitability of
hypermarkets.
Conclusion:
Retail sector is one of the emerging sectors of Indian market. Indian Retail Industry is ranked among the ten largest
retail markets in the world. Though India is a developing economy, wherein, the traditional retail sector dominates the
retail business, organized retail has shown tremendous growth. Major corporate players have stepped into the retail
arena with long term, futuristic plans to expand their business across verticals, cities and formats. Companies like Tata,
Reliance, Adani Enterprise and Bharti have been investing considerably in the booming Indian Retail market. Along

Vol. 8 • No. 2 • July - December 2018 43
“SANSMARAN” Management Research Journal• ISSN No. 2278-7801• Impact Factor IIJIF (2017) 4.107• Impact Factor PIF (2018) 4.504
with these giant retailers, a number of transnational brands have also entered into the market to set up retail chains in
close association with bigger Indian companies. High consumer spending over the years by the young population and
sharp rise in disposable income are driving the Indian organized retail sector’s growth. Major shift in consumer preferences
and lifestyles even Tier I & Tier II cities and towns have given the emergence of attractive markets for retailers to
expand their presence. This is bound to result in a shake-up of the landscape with the influx of new working processes,
revamped distribution channels and new technologies that will redefine the way the organized retail will work in future
References:
� Chetan Bajaj et al, (2005) Retail Management, Oxford Publishers.
� Chitra Srivastava, Dabas Brenda, Sternquist Humaira Mahi, (2012). “Organized retailing in India: upstream
channel structure and management”.Journal of Business & Industrial Marketing, Vol. 27 Issue 3 pp. 176 – 195
� Corporate Catalyst India, “A report on Indian Retail Industry”, (2006)
� D’Mart, Avenue supermarts limited report dated September 29, 2016
� Goswami, Paromita and Mishra S. Mridula (2009). “Would Indian consumers move from kirana stores to organized
retailers when shopping for groceries?”. Asia Pacific Journal of Marketing and Logistics, Vol. 21, No. 1, pp. 127-
143.
� India Retail Supply Chain Study – 2013 Opportunities, challenges and path ahead RAI Report.
� Indian Brand Equity Foundation (IBEF) Report January 2016, www.ibef.org
� Indian retail: the next growth story, KPMG Report 2014
� KPMG Press Trust of India, “Food Retail Sector to double to $150 billion by 2025: KPMG”, Business Line, 8th
December 2010.
� R.K. Srivastava, (2008). Changing retail scene in India. International Journal of Retail &Distribution Management
Vol. 36 No. 9, pp. 714-721, Emerald Group Publishing Limited 0959-0552
� Sengupta A (2008). “Emergence of modern Indian retail: an historical perspective”. International Journal of
Retail & Distribution Management, Vol. 36 No. 9, pp. 689-700
� Vidushi Handa and Navneet Grover, (2012). Retail Sector in India: Issues and Challenges. International Journal
of Multidisciplinary Research, Vol.2, Issue 5 May 2012, ISSN 2231 5780.

44 Vol. 8 • No. 2 • July - December 2018
“SANSMARAN” Management Research Journal• ISSN No. 2278-7801• Impact Factor IIJIF (2017) 4.107• Impact Factor PIF (2018) 4.504
The Role of State Government in Functioning of Grain Based Distilleries in Maharashtra
Mr. Digvijay Deshmukh
Research Scholar, IMED, Bharati Vidyapeeth, Pune.
..............................................................................................................................................................................................
ABSTRACT :
The food processing is mostly depending on agriculture and food processing industry has tremendous significance in
human life and its development . The present investigation covers one of the essential issues i.e. role of state government
in running Grain Based Distilleries in Maharashtra. The goal of this paper is to contemplate the issue looked by grain
based distilleries in Maharashtra. The Government and the Policy producers will think that its supportive in approach
making as make change in the feeble and ignored zones of sustenance handling industry. It will be further beneficial to
the thinkers, research scholars, academicians and government officials interested in the food processing industry.
..............................................................................................................................................................................................
Keywords:
Grain Based Distilleries, Finance, Government.
..............................................................................................................................................................................................
Introduction :
India is a nation of towns of which 70% of populace originates from provincial zone and over 60% populace rely upon
agribusiness for their sustenance, haven and garments. Expanding interest for different agro based items for mechanical
utilize, coordinate utilization, and fare has prompted agro based industrialization in our nation. It is work concentrated
in character, needs not so much capital but rather more working capital. The business incorporates jute, cotton, sugar,
palatable oil, sericulture, handiwork, khadi, control looms, dairy, poultry, cows feed, natural product handling and
sustenance articles and certain buyer merchandise. It might be noticed that ongoing patterns in the advancement of agro
handling businesses has pulled in higher capital speculations, upgraded mechanical complexities and administrative
necessities. Numerous organizations have additionally subsidized the agro handling and prepared sustenances as lucrative
road for enhancement. The level of handling has been significantly increased and modernized by the development of
prepared sustenance industry which depends on cooking, blending and concoction change creating a finished vegetable
nourishment. Side-effect handling of real horticulture products has opened the tremendous capability of agro modern
development in the rustic India as of late.
The present study covers one of the important issues i.e. Role of state government in running Grain Based Distilleries
in Maharashtra. In Maharashtra, most of the distilleries are producing alcohol from Molasses, which are attached to
sugar factories. Most of the distilleries are working on seasonal basis as sugar factories running only from November to
March. The sugar season also varying now day as sugarcane crop suffers from shortage of water due uncertain in
rainfall. Most of spirits produced from molasses are used for chemical industries. The quality of spirit produced from
grain is superior with compared to molasses. The effluent generated from grain base distillery is much easier to treat.
As we know, the only central government agency to buy and store the grains is Food Corporation of India i.e. F.C.I.

Vol. 8 • No. 2 • July - December 2018 45
“SANSMARAN” Management Research Journal• ISSN No. 2278-7801• Impact Factor IIJIF (2017) 4.107• Impact Factor PIF (2018) 4.504
They don’t have sufficient godowns to store these plenty of food grains. Because of that, they store such excess grains
in open areas which later due to rainfall and other sources get decayed. Then such grains are not even useful for cattle
feed industry. Hence these grains are supposed to be used for grain distilleries. Secondly, in the Kharip and Rabbi
seasons when farmers produce such crops, the cost of food-grains are deliberately minimized by the traders. So, farmers
don’t even get their production cost. Even government has declared fixed rates for such grains, due to low quality of
such produced grains; traders don’t pay such declared rates. Due to unseasonal rains in various areas jowar and maize
get blackened. Hence there is no value for such grains in market. So unfortunately, farmers have to suffer for that, and
hence they go for suicides. To control all these things, grain based distilleries is the only main source who can pay
maximum rates to such low-class grains. And such grains are the only raw material for grain distilleries.
Review of Literature
Bhattacharya S.N. (1981) in his book “ Development of industries in Backward Areas” studied economic growth and its
problems in five backward district of North Bengal and concluded that in order to achieve higher economic growth, the
potential for developing smaller and more disbursed agro related industries should be systematically identified for each
local area exploited to the fullest extent possible.
Khamkar (2002) has done the study by selecting 34 units for the study in Ratnagiri and Sindhudurg resource region. The
objectives are to study the present position of fruit processing units with reference to investment, profit margin, technology,
employment generation, marketing and to study the problems and to examine the prospects. The observations are that
(i) the fixed capital to working capital is 1:4, and (ii) there is a dominance of labor intensive technology. All units sell
their products through direct and indirect channels.
Varghees and Singh (2006) have made a study entitled ‘Prospects and Problems of Agro-Processing Industries in Bikaner
District of Rajasthan’. The case study method was used for agro-processing industries using cereals, pulses, oilseeds,
milk and wool. The objectives were (i) to identify the existing status of agro processing industries, (ii) to study the
magnitude of profit, to identify major constraints hindering the smooth functioning of units. The information on date of
commencement, installed capacity, working pattern, cost of operation, source of finance, marketing channel, employment
pattern, procurement of input and problems faced are collected. The findings and conclusions are (i) the capital investment
was relatively more for rasgulla processing units, woolen yarn production and oil processing units. (ii) The employment
potential per processing unit was found to be more for woolen yarn production and processing. (iii) The employment
potential in the category of combined papad- bhujia processing, rasgulla processing, dal processing and oil processing
varied between 6 to 7 persons per unit. (iv) The major constraints in the agro processing sector includes factors related
to processing technologies, procurement of raw material and other resources and govt. policies. (v) The production of
raw material like pulses, oil seeds, wool etc is not stable and as a result the availability of raw material for processing is
also not ensured. (vi) The power fluctuations and irregular supply of water are also constraints in the development of
agro-processing industries. The govt. policies are also required to be changed for the smooth development and growth
of agro-processing in this region.
Yogish (2008) has written a paper as agricultural marketing in India. He stated that, in modern times marketing of
agricultural produce is different from that of olden days. National commission on agriculture defined agricultural
marketing as a process which starts with a decision of produce a salable farm commodity and it involves all aspects of
market structure of system, both financial and institutional based on technical and economic considerations and includes
pre and post harvest operations, assembling, grading, storage, transportation and distribution.

46 Vol. 8 • No. 2 • July - December 2018
“SANSMARAN” Management Research Journal• ISSN No. 2278-7801• Impact Factor IIJIF (2017) 4.107• Impact Factor PIF (2018) 4.504
The research paper has written by Dinesha et. al. (2008) titles as ‘Micro, Small and Medium Enterprises in India:
Trends and Challenges’. The paper attempts to analyze the performance of MSMEs in India, to understand the problems
and challenges and to suggest the policy measures. They found the various problems of MSMEs related to lack of
adequate credit, marketing, power, raw material and sickness etc. To strengthening the MSMEs they suggest that there
is a need to improve the proactive policy, easy access of finance, promoting partnership, technology up gradation,
training to manpower, marketing assistance and basic infrastructure.
Khushdeep Dharni, et.al., (2008) in their study on “Food Processing in India : Opportunities and Constraints” observed
that for providing remunerative prices for the agricultural produce it is important that the production advantage available
to India is transformed into the processing advantage. The Indian food industry has no dearth for market opportunities
on account of thriving domestic consumption and new avenues of foreign demand. Food processing is an important link
between agriculture and industry. Scale of operations along with a fragmented supply chain is the major impediment in
the path of speedy growth of food processing in India. Concentration at the level of production, processing and retailing
can provide the much needed impetus for the sector. The government of India has identified food processing sector as
the sunrise sector. A number of initiatives are being put in place for promoting primary as well as secondary processing.
For an unhindered growth is becoming important to address the demand and supply side constraints of food processing
in India. Agriculture will keep on playing a vital role in the Indian Economy and food processing will go a long way for
providing opportunities for sustainable and profitable agriculture in time to come.
Mahendra Dev, S. and Chandrasekhara Rao, N. (2004) in their article on “Food Processing in Andhra Pradesh
Opportunities and Challenges” studied that there has been diversification of Indian diets away from food grains to high
value products like milk, meat products, vegetables and fruits. Food-processing industry has been registering good
growth since the past few decades and particularly after nineties. The conditions are now ideal for the growth of this
industry. The central government has taken some steps to deregulate and encourage the sector after 1991. However, the
role of states is vital. The government of Andhra Pradesh released a policy in November 2003. There are no major
initiatives in the policy and still can be called a good beginning. As against the robust growth at the All-India level, the
growth rate in net value-added in the nineties was almost the same as that in the eighties in the state. The study attempts
to know the opportunities and challenges in processing of rice, fruits and vegetables, oil seeds and livestock products.
Further the study also analysed the working of contracts between processors and farmers.
Scope of The Study :
Although various studies reveal different aspects of food processing units in Maharashtra, no study yet has been made
on the topic of grain based distilleries in Maharashtra. The State Government of Maharashtra on several occasions have
appointed various commissions to evaluate the functioning of molasses based distilleries. The terms of references of
these boards of trustees and various commissions were restricted to certain particular issues identified with distilleries.
This paper deals with the nature, problems, administration and scope of grain based distilleries in Maharashtra is
carried out. It is expected that the study would assist to make suitable policies and strategies for proper development of
the grain based distilleries in Maharashtra.
Research Objective :
To study the initiative taken by the state government in functioning of grain based distilleries in Maharashtra.

Vol. 8 • No. 2 • July - December 2018 47
“SANSMARAN” Management Research Journal• ISSN No. 2278-7801• Impact Factor IIJIF (2017) 4.107• Impact Factor PIF (2018) 4.504
Hypothesis :
H0
Initiative taken from state government in functioning of grain based distilleries in Maharashtra is inadequate.
H1 Initiative taken from state government in functioning of grain based distilleries in Maharashtra is adequate.
Research Methodology :
Questionnaire Structure :
The questionnaire consisted of two sections, starting with general information about grain based distilleries and
government related questions.
Results and Discussion :
The study was Descriptive in nature and survey method was used to complete the study. The population of the study
comprised specifically Grain Based Distilleries from North and Western Maharashtra. There are 31 grain based distilleries
are in Maharashtra. A convenient sampling technique select 50 per cent grain based distilleries i.,e 15 from Maharashtra
for the survey. For data collection, a self-designed questionnaire was administered. The collection data was subjected to
analysis through SPSS. The reliability was determined through Cronbach Alpha. The reliability was established through
face validity method. Factor analysis was used to extract the factors of variables. In the study, convenience sampling
technique is needed. Proper care is required to approach those officials in distilleries who could easily fill up the
questionnaire and were rational in their response.
Table 1: Government Policy:
Government Policy No Yes
Happy With The Policy of the Government 100% 00%
Table 1 shows that all 100 percent of the units are not satisfied with the government monetary and fiscal policies
towards food processing industry. It is due to these units are big one. Every business policy-making is influenced by
government policies and controls throughout the world. Government policy is gaining considerable importance in
operations and activities of a business organization. Business environment is affected by the governmental monetary
and fiscal policies, import-export policies, customs duties etc.

48 Vol. 8 • No. 2 • July - December 2018
“SANSMARAN” Management Research Journal• ISSN No. 2278-7801• Impact Factor IIJIF (2017) 4.107• Impact Factor PIF (2018) 4.504
Graph 1: Government Policy:
Table 2: Government Incentives:
No Yes
Aware about the Government Incentives 10% 90%
The present point throws light upon the entrepreneurs view about the government incentives towards the food processing
unit. Government has formulated various incentive schemes to industries for their better prospects. The awareness by
industry is an important factor to get the benefit of it. Table 2 shows that 90 percent of the units are aware about the
various government schemes formulated time to time by government. 10 percent of the units are unaware about various
government schemes.
Graph 2: Awareness About Government Incentives:
Table 3: Government Incentive:
Government Incentive No Yes
Benefited by any Government Incentive Scheme 80% 20%
Table 3 shows that 20 percent of the units are received the benefit from various governments schemes. 80 percent of
the units are not get benefited by any government incentive scheme, since their inception. It is due to unawareness of

Vol. 8 • No. 2 • July - December 2018 49
“SANSMARAN” Management Research Journal• ISSN No. 2278-7801• Impact Factor IIJIF (2017) 4.107• Impact Factor PIF (2018) 4.504
government schemes, lengthy process for sanctions, unfair practices in government offices, requirement of various
documents etc.
Graph 3: Benefited by Government Incentives:
Table 4: Government Subsidy:
Government Subsidy No Yes
Got Subsidy from the Government 80% 20%
Table 4 shows that 20 percent of the units are received the subsidy from various governments schemes. 80 percent of
the units are not get subsidy by any government, since their inception.
Graph 4: Government Subsidy:
Table 5: Concessional Rate of Interest:
Concessional Rate of Interest No Yes
Loan at Concessional Rate of Interest 90% 10%

50 Vol. 8 • No. 2 • July - December 2018
“SANSMARAN” Management Research Journal• ISSN No. 2278-7801• Impact Factor IIJIF (2017) 4.107• Impact Factor PIF (2018) 4.504
For rapid growth and development of small scale business, the concessional rate of interest loan is a prerequisite. This
type of assistance reduces the burdens of payment on an entrepreneur. Table 5 throws light upon concessional rate of
interest loan given by banks to grain based distillery units surveyed. As per this table only 10 percent of the units get
concessional rate of interest loan. 90 percent of the units are not providing such type of loan. An informal discussion
reveals that the percentage of loan given at concessional rate is more in other industries than food processing industry.
Graph 5: Concessional Rate of Interest:
Table 6: Special Concession in Loan:
Special Concession in Loan No Yes
Special Concession in the Repayment of Loan 95% 5%
Table 6 throws light upon Special concessional rate of interest loan given by banks to grain based distillery units
surveyed. As per this table only 5 percent of the units get Special concessional rate of interest loan. 95 percent of the
units are not providing such type of Special concessional rate of interest on loan .
Graph 6: Special Concession in Loan:

Vol. 8 • No. 2 • July - December 2018 51
“SANSMARAN” Management Research Journal• ISSN No. 2278-7801• Impact Factor IIJIF (2017) 4.107• Impact Factor PIF (2018) 4.504
Table7: Additional Finance:
Need Finance No Yes
Need of Additional Finance 00% 100%
Table 7 throws light upon Need of Additional Finance required for grain based distillery units are surveyed. As per this
table all 100 percent of the units needs additional finance to fulfill the working capital needs of the units. Additional
finance is necessary for all types of business. It may be regarded as the life blood of business.
Graph 7: Additional Finance:
Table 8: State Aid:
State Aid No Yes
Problem in Getting State Aid 00% 100%
Table 8 throws light upon Problem in Getting State Aid for grain based distillery units. As per this table all 100 percent
of the unit’s face Problem in Getting State Aid.
Graph 8: State Aid:
All the table revealed a poor contribution of
Government for the food processing industry with
special references to Grain based distilleries in
Maharashtra. Not even a single variable revealed the
contribution of the Government in this industry. 100
per cent industries required an additional finance. On
the other hand, only 20 % food based industries are
getting subsidies from the Government.Secondly, 10
per cent industries getting loan at concessional rate.

52 Vol. 8 • No. 2 • July - December 2018
“SANSMARAN” Management Research Journal• ISSN No. 2278-7801• Impact Factor IIJIF (2017) 4.107• Impact Factor PIF (2018) 4.504
On the basis of above analysis, we conclude that initiative taken from state government to run grain based distilleries in
Maharashtra is inadequate, so our null hypothesis accepted. So there is a need of Government agencies for the rebirth of
food processing industries in Maharashtra. As we know, indirectly these industries increase the additional income of the
farmers. The government of India has identified food processing sector as the sunrise sector. A number of initiatives are
being put in place for promoting primary as well as secondary processing. For an unhindered growth is becoming
important to address the demand and supply side constraints of food processing in India. Agriculture will keep on
playing a vital role in the Indian Economy and food processing will go a long way for providing opportunities for
sustainable and profitable agriculture in time to come. Further, Sound planning and efficient implementation of project
and better infrastructure facilities are some other important production factors. Cordial support and government incentives,
timely supervision and guidance, sound managerial ability, and provision of technical guidance and counseling are
important managerial and institutional factors. It was observed that easy availability of finance, identification and use
of mega markets, good contacts with marketing personnel are predicted as very much important marketing and financial
factors.
So the researcher proves the null hypothesis that the initiative taken from state government in functioning of grain
based distilleries in Maharashtra is inadequate.
Conclusion :
Food processing industry helps to accelerate agricultural development by giving supply of credit, inputs and other
production enhancement services, processing and marketing and adding value to farmer’s product, generating employment
opportunities and increasing farmer’s net income. Food processing industry motivates the farmers for better productivity
and further opens up possibilities of industrial development. They can also provide a boost to many downstream industries
and generate foreign exchange through export.
Food processing industry with special reference to grain based distilleries in Maharashtra also face the problems like,
need of additional finance, Policy of the Government,unawareness about the government schemes,more capital investment,
requirement of permanent working capital, efforts to improve quality, Government Subsidy etc.
The above conclusions will help the entrepreneurs of food processing units to find out their problems, weaknesses,
threats etc. Also, it will be helpful to improve the performance, and to build the better prospects and increase the
competency in the global context. The Government and the Policy makers will find it helpful in policy making as make
improvement in the weak and neglected areas of food processing industry. It will be further beneficial to the thinkers,
research scholars, academicians and government officials interested in the food processing industry.
Future Avenues :
So, it examined that the grain based food processing industry assumes great significance in terms of additional income
of the farmers, directly or indirectly employment generation, poverty alleviation, improving agricultural productivity,
reducing post-harvest losses, availability of better nutrition, export promotion and foreign exchange earnings. It was
found that these industries requires less fixed capital and more working capital as compared to other industries. The
agro industry annually generates 5 per cent value-added over fixed capital as compared to 39 per cent in other industries
(Annual Survey of Industries). These industries have great importance in the economic liberalization period in the
country and World Trade Organization (WTO) regime. The annual compound growth rates of these sectors have shown
significant growth performance during the 1990’s. The performance of exports of important agricultural and processed

Vol. 8 • No. 2 • July - December 2018 53
“SANSMARAN” Management Research Journal• ISSN No. 2278-7801• Impact Factor IIJIF (2017) 4.107• Impact Factor PIF (2018) 4.504
products has shown tremendous upward growth pattern during the last decade, and there is potential for further growth
in future. Due to increasing importance of food processing sector after economic liberalization and WTO, foreign direct
investment in this sector has also increased substantially(ASI). The future of food processing sector seems to be bright
with growing potential for domestic as well as export markets.
Suggestion :
The present study suggested that globalization creates serious challenges for Indian small-scale food processing industries
with references to Grain based distilleries. This is the time to protect the sector by upgrading the existing technology by
providing adequate financial support with reasonable rate of interest. Intensification of food parks and participative
management are required to compete for quality, price and service. Singh and Mohuley (1996) also have summaries in
their study that due to lack of proper storage facilities and unawareness of preservation technique about 30 percent of
total production goes waste between harvest and disposal. The huge quantity of wastage can be avoided through conversion
of raw material into processed foods. The existing agro-processing units situated in the rural area are not able to handle
much quantity of grain at once time. The establishment of agro-processing units is very essential in potential areas of
the district. It will save from spoilage and give extra income to farmers. The processing units of rural areas of this
district will help in preservation of grains, stabilize the prices, and create additional employment and increasing the
remuneration of farmers. Therefore, entrepreneurs should be mobilized to install processing units in rural areas because
of availability of at cheap rates; cost of establishment and cost of production of processed foods would be less than that
of urban areas.
References :
� Ambumani, V. and Ganesan, s. (1999), ‘Operational Efficiency and Factor Substitution in Small Food Processing
Industries.’ – SEDME, Vol.26 (1), March 1999. Pp. 11-26.
� Anjaiah, J (2008), ‘Inter Regional and Interstate Disparities in Cultivation, Production and Productivity in Food
Processing Agricultural Commodities in Andhra Pradesh.’ - Southern Economist, Vol. 46 (18) Jan.15, 2008.
Pp.15-16.
� Battacharya, S.N. (1981), Development of Industries in Backward Areas”, New Delhi, Metropohitan Publishers.
� Chinnaiyan, P. and Nandagopal, R. (2004), “A Study on Entrepreneurial Performance and Risk Perception: An
Analysis on Small Food Processing Units”, (ed), Contemporary Trends in Business Research, (New Delhi: Allied
Publishers Pvt. Ltd.,)
� Dinesha, P. T., Jaysheela, Hans (2008), ‘Micro, Small and Medium Enterprises in India: Trends and Challenges.’
– SEDMS vol. 35 (2), June 2008. Pp. 35-48.
� Government of Maharashtra, ‘Report of the Fact-Finding Committee on Regional Imbalance in Maharashtra.’
Publication –Government of Maharashtra Planning Department, Bombay, April 1984.
� Karam Singh (2004), “Emerging Trends in Agro Processing Sector,” Indian Journal of Agricultural Economics,
59 (1), p.51.
� Katkar, R. K. (1996), ‘Status and Prospects for Food Processing Industry in India.’-Indian Journal of Agricultural
Marketing – vol-10 (1) – Jan- April 1996.

54 Vol. 8 • No. 2 • July - December 2018
“SANSMARAN” Management Research Journal• ISSN No. 2278-7801• Impact Factor IIJIF (2017) 4.107• Impact Factor PIF (2018) 4.504
“Toilet Training Interventions among Disabled Children : A Case Study of Raigad District”
Mr. Sanjay Sevak
Nursing Tutor, College of Nursing, All India Institute of Medical Sciences (AIIMS), Jodhpur – 342005.
...................................................................................................................................................................................................
ABSTRACT :
Currently, the term Intellectual Disability is being used instead of mental retardation in Diagnostic and Statistical
Manual 5th Revision (DSM-V). Intellectual disability is a term used for children with significant impairment in cognitive
and adaptive behavior along with poor skills in Activities in daily living, decision making, insight, communication and
academic performance. Aim: To assess impact of toilet training interventions among children with intellectual disability.
Method: A Quasi experimental non-randomized control group design was used to assess impact of toilet training
interventions among children with intellectual disability. A total number of 20 children with intellectual developmental
disability were selected by non-probability convenient sampling technique. The reliability of the tool was 0.996 determined
by Cronbach’s Alpha method. The toilet training interventions conducted with the help of charts, pictorial and flip
cards. The mean of the scores obtained by the samples in the pre-test was 38.4 and in the post-test, it increased to 43.5.
The calculated t test value is 3.61 is more than tabulated value, hence we can reject null hypothesis, therefore It can be
concluded that toilet training interventions were effective in toilet training practices among children with intellectual
disability and this improvement is statistically significant.
...................................................................................................................................................................................................
Keywords :
Impact, Toilet Training Interventions, Disabled Children.
...................................................................................................................................................................................................
1. Introduction :
According to Government of India Census, 2001 has revealed that 2.1% of the population is suffering from one
or the other kind of disability including movement disability, mental disability, speech disability and hearing
disability etc. In intellectual disability around 75-90% of the children affected by mild category of intellectual
disability. Among the states in India, Maharashtra stands in top five highest number of disabled person in India.
In contrast, National Sample Survey Organization (NSSO) report estimated 18.49 million disabled persons in the
India, out of that 0.44 million individuals are mentally disabled. Intellectual disability is significantly
impaired intellectual and adaptive functioning disorder that is a highly prevalent in developing country like India,
Pakistan and Nepal etc. According to American Association of Mental Deficiency (1983) “Mental retardation
refers to significantly sub-average general intellectual functioning resulting in or associated with concurrent
impairments in adaptive behavior and manifested during the developmental period”. Deficit in the areas of activities
of daily living may be a significant hurdle for people diagnosed with developmental disability and. According to
Konarski and Dioria, toilet training and eating practices for children with developmental disabilities was continues
to be one of the most frequently researched self-help skills.
The systematic application of learning principles to modify the behavior of children most appropriate and important
functions in the toileting training among children with intellectual disability. Majority of toilet training studies

Vol. 8 • No. 2 • July - December 2018 55
“SANSMARAN” Management Research Journal• ISSN No. 2278-7801• Impact Factor IIJIF (2017) 4.107• Impact Factor PIF (2018) 4.504
emphasize effective learning and appropriate applications. A case study conducted by Dana Sells-Love,
Lisa M. Rinaldi and T. F. McLaughlin on “Toilet training an adolescent with severe mental retardation in the
classroom”. The treatment program was implemented in a self-contained special education classroom for a 19-
year-old-female diagnosed with mental retardation. Result revealed that in terms of wet declined and the number
of times she successfully used the bathroom for urination increased. There were significant treatment differences
found for both behaviors modifications after classroom training.
The burden of intellectual disability on social relationship, stress and financially has long been underestimated.
A study by Nagarkar A. stated intellectual disability affects the social functioning, emotional status, academic
and activities of daily living, which make the child more dependent on the parents or caregiver as compared with
a normal child. When child once he/she has diagnosed with developmental disability many parents became
severe anxious because of dependency, sense of helplessness and lack of understanding about disability and how
to manage the behavioral issues. According to Venkatesan & Das (1994) reported that the type of burden reported
by care takers and family members may including from difficulties in not getting time, management of behaviour
issues, self-care deficit, disruption of their daily routine, social and economic burden.
Katherine Rinald (2011) conducted a study on developmental disabilities for effective toilet training strategies.
The purpose of this study was to evaluate the effeteness of parent attendance at a rapid toilet training workshop
on the toilet training behaviors of their children with developmental disabilities. In the study total 6 parents were
provided with instruction related to teaching urinary continence, positive reinforcement for correct toileting,
scheduled toilet sittings, maintain hygiene regarding toilet training. A multiple baseline design was used to examine
the impact of study. Results revealed that toilet-training workshop increases in positive toileting behaviours in
80% children. According to Hornby G, Singh NN conducted a study on Behavioural group training with parents
of special children. A pre-test and posttest experimental design was used with moderately mentally retarded
children. Result revealed that majority of caretaker’s feedback indicated that the group training was useful,
positive and enhanced knowledge. Baker and McCurry organized training program for parents among group of
mothers. The program consisted of classroom observation, active learning, and video recordings. The result
indicates significant improvements of self-care and activities of learning among children.
Children with intellectual developmental disability can become independent in doing self-help activities/Activities
of daily living depend on training and learning of the children given by parents/caretaker’s A study by Avsar
Ardýc and Atilla Cavkaytar on “Effectiveness of the modiûed Intensive Toilet Training on developmental disability
children”. The aim of study was to determine effectiveness of a modiûed version of Azrin and Foxx’s intensive
toilet training method. The study was conducted with three samples in an educational setting and the results
revealed that the modiûed method was effective in teaching dryness and urinating. Also result indicates positive
parental feedback. Kashima KJ, Baker BL and Landen conducted a review study states that live training verses
media based programme for parents/ caretakers of mentally retarded children regarding self- help skill and activities
of daily living. Result indicates that live training increased parent’s knowledge and understanding of behavioral
principles more than the media- based training. The present study is particularly intended to assess effectiveness
of the toilet training interventions among children with intellectual disability. The investigator identified E.
Kings Goal Attainment Theory suitable for present study. Imogene King’s goal attainment theory is based on the
personal and interpersonal system including interaction, perception, communication, transaction.
The objectives of the study -
� To assess the toilet training practices among children with intellectual disability.

56 Vol. 8 • No. 2 • July - December 2018
“SANSMARAN” Management Research Journal• ISSN No. 2278-7801• Impact Factor IIJIF (2017) 4.107• Impact Factor PIF (2018) 4.504
� To assess impact of toilet training interventions among children with intellectual disability.
Hypothesis :
� H0: There will be no significant difference in toilet training practices among children with Intellectual
disability before and after toilet training interventions.
� H1: There will be significant difference in toilet training practices among children with Intellectual disability
before and after toilet training interventions.
Fig. no.1: Conceptual Framework on E. Kings Goal Attainment Theory :
Berman A., Snyder S, Kozier and Reb’s, Foundation of nursing, concept, process and practice, Ninth edition, Pearson
Education, Inc. publication. New Jersey 2012, p.44-45.
2. Research Methodology :
� Research methodology constitutes the blueprint for the collection, measurement, synthesis and interpretation
of data. In present study, quasi experimental non randomized control group design was used. The sample
comprises of 20 children with intellectual disability (10 samples each for study group and control group)
were selected as per the sampling criteria, living in Raigad district Maharashtra. The population of the
present study is comprised of children with intellectual disability with their parents/caretakers. Non –
Randomized convenient sampling techniques was chosen by the investigator. Non – Randomized convenient
sampling techniques is sampling without randomized and data collection from population members who
are conveniently available and proximity to the researcher to participate in study. The reliability of the tool
was 0.996 determined by Cronbach’s Alpha method. The investigator initially established rapport and the
purpose of study was explained and written consent was obtained from caretakers. A structure questionnaires

Vol. 8 • No. 2 • July - December 2018 57
“SANSMARAN” Management Research Journal• ISSN No. 2278-7801• Impact Factor IIJIF (2017) 4.107• Impact Factor PIF (2018) 4.504
and rating scales used for data collection. A toilet training intervention administered by the investigator
itself. The toilet training intervention conducted with the help of charts, flash cards and pictorials. The
posttest was conducted after 12 weeks.
Study instruments: Structured questionnaire, which had two sections.
Section I – Demographic variables
Types of intellectual disability, gender, type of family, occupation of father and mother and monthly income
of the family.
Section II – Structure questionnaire related to toilet training practices.
DESCRIPTION OF VARIABLES
Independent variables: toilet training interventions
Dependent variables: toilet training practices
Extraneous variables: Extraneous variables are gender, type of intellectual disability, occupation of parents/
care takers, socio economic status etc.
Inclusion criteria – Children with intellectual disability :
� Male and female both genders are included in study.
� Sample age group between 6-18 years.
� Who can understand Marathi or Hindi or English language.
� Who are able to follow the instructions.
� Who are trainable.
� Sample who are present at the time of data collection.
Exclusion criteria
� Who are having sensory perceptual disorder
� Who are already gone through similar kind of training/sessions
� Who are having mental illness.
� Children with severe and profound intellectual disability.
3. Result and Discussion :
SECTION I- DESCRIPTION OF SAMPLE CHARACTERISTICS

58 Vol. 8 • No. 2 • July - December 2018
“SANSMARAN” Management Research Journal• ISSN No. 2278-7801• Impact Factor IIJIF (2017) 4.107• Impact Factor PIF (2018) 4.504
Figure no. 2 Bar diagram showing types of disability among children with intellectual disability :
Above figure interprets that 80 % children were mild intellectual disability in study group while in control group
60 % children had mild intellectual disability.

Vol. 8 • No. 2 • July - December 2018 59
“SANSMARAN” Management Research Journal• ISSN No. 2278-7801• Impact Factor IIJIF (2017) 4.107• Impact Factor PIF (2018) 4.504
Figure no. 3 Bar diagram showing distribution according to gender
The data presented in above bar diagram revealed that majority 80 % children in study group were male whereas
in control group equally distributed in both gender male female children.
Figure no. 4 Bar diagram showing distribution of sample according to types of family
Figure no. 4 reveals that in study group all samples were equally distributed in Joint and nuclear family while in
control group majority of samples belongs to joint family.

60 Vol. 8 • No. 2 • July - December 2018
“SANSMARAN” Management Research Journal• ISSN No. 2278-7801• Impact Factor IIJIF (2017) 4.107• Impact Factor PIF (2018) 4.504
Figure no. 5 Bar diagram showing distribution of sample according to father’s occupation
Above figure no. 5 illustrates that in control maximum samples father occupation belonged to agriculture.
Figure no. 6 Bar diagram showing distribution of sample according to mother’s occupation
Figure no. 6 reveals that majority of samples in control
and study group mother is housewife and caring of children
with intellectual disability at home.
Figure no. 7 Bar diagram showing distribution ofsample according monthly income of family in Rupees.
The data presented in table no. 1 and figure no. 7
presents in study group majority 40% samples monthly family
income ranged between Rs. 16020 – 32049.

Vol. 8 • No. 2 • July - December 2018 61
“SANSMARAN” Management Research Journal• ISSN No. 2278-7801• Impact Factor IIJIF (2017) 4.107• Impact Factor PIF (2018) 4.504
SECTION II – TOILET TRAINING PRACTICES AMONG CHILDREN WITH INTELLECTUALDISABILITY BEFORE AND AFTER INTERVENTION IN STUDY GROUP AND CONTROL GROUP
TABLE 2: Mean scores of toilet training practices before and after intervention in study group and control group
n = 20
Phase Study group Control group
Before toilet training intervention 38.4 41.4
After toilet training interventions 43.5 42
Figure no. 8 Bar diagram showing Meanvalue of toilet training practices before andafter toilet training intervention in studygroup and control group
Figure no. 8 Mean scores of toilet training
practices after toilet training skills improved as
6.8% (5.1) in study group while it improved by
0.8% (0.6) in control group.
SECTION III –COMPARISON OF TOILET TRAINING PRACTICES AMONG CHILDREN WITHINTELLECTUAL DISABILITY BEFORE AND AFTER TOILET TRAINING INTERVENTION
TABLE 3: Significance differences in toilet training practices among children with intellectual disability before and
after the toilet training intervention. n = 20
Phase Mean score S. D t test calculated Tabulated t value
Pre-test 38.4 11.25 3.61 2.09
Post-test 43.5 12.52
* 0.05 level of significant
The mean of the scores obtained by the samples in the pre-test was 38.4 and in the post-test, it increased to 43.5. Instudy group, the calculated t value is more than tabulated t value, hence we can reject null hypothesis, which indicatesthat there is a significant improvement in the toilet training practices after 12 weeks intervention when compared tobaseline toilet training practices and this improvement is statistically significant. therefore, It can be concluded thattoilet training interventions were effective in toilet training practices among children with intellectual disability.
Discussion :
The study was intended to assess impact of toilet training interventions among children with mild and moderate intellectualdisability. The results of the present study showed that there is a significant improvement in the toilet training practicesamong children with intellectual disability.
Conclusion :
Approximately more then 3/4th children with intellectual disability are in the mild category and they can often adequate
toilet training practices, if adequate intervention or training is provided. They can become fairly self-sufficient and in

62 Vol. 8 • No. 2 • July - December 2018
“SANSMARAN” Management Research Journal• ISSN No. 2278-7801• Impact Factor IIJIF (2017) 4.107• Impact Factor PIF (2018) 4.504
some cases, live independently when appropriate and consistent social, family and community supports provided.
Implications :
Toilet training is an important step in activities of daily living. Habit of toilet training and other life skills should begin
at home and community level. Parents and caretakers should encourage this habit to decrease dependency to family
members. Toilet training interventions benefits for parents and caregivers, along with same time and financial resources.
Mental Health Nursing Practice:
Teachers, nurses, doctors, social workers working in special schools, institutions, psychiatric settings come across
various children with intellectual disability. It is essential for children with disabilities to be taught activities of daily
living eg. Toilet training, feeding, hair care, dressing and grooming in order to be successful both at school and in life.
Children develop a sense of independence and decrease dependency on parents as they learn to do things for themselves.
Nursing Education:
To achieve high level of educational standards medical and paramedical professionals needs to be raised to a greater
height. This will be achieved if all the aspects of health needs are considered as a whole. The education curriculum must
include different developmental disabilities in syllabus, which will expose students to the various disabilities including
intellectual disability, mental disability and developmental disability to help the children, family and society. Similarly,
early sign and symptom, preventive modalities, alternative therapies.
Recommendations :
Keeping in view the findings of the study, the following recommendations are made.
� It is suggested that the study may be replicated using a larger population of children with intellectual disability or
other developmental disability.
� Comparative Study of toilet training practices between autistic children and children with intellectual disability.
� Comparative Study of toilet training intervention between children with mild intellectual disability verses moderate
intellectual disability.
� Replication of this study may be done in different settings eg. Those who attending special school verses those
who are not attending any special schools.
References :
� Avsar Ardýc, Atilla Cavkaytar. Effectiveness of the Modiûed Intensive Toilet Training Method on Teaching
Toilet Skills to Children with Autism. Education and Training in Autism and Developmental Disabilities, 2014,
49(2), 263–276
� Baker, B. L., & McCurry, M. C. (1984). School based training: an alternative for parents predicted to demonstrate
low teaching proficiency following group training. Education and Training of the Mentally Retarded, 19(4),
261–267.
� Berman A., Snyder S, Kozier and Reb’s, Foundation of nursing, concept, process and practice, Ninth edition,
Pearson Education, Inc. publication. New Jersey 2012, p.44-45.
� Dana Sells-Love, Lisa M. Rinaldi, T. F. McLaughlin. Toilet Training an Adolescent with Severe Mental Retardation
in the Classroom: A Case Study. Journal of Developmental and Physical Disabilities. Kluwer Academic Publishers-
Plenum Publishers June 2002, Volume 14, Issue 2, pp 111–118
� Highlights of Changes from DSM-IV-TR to DSM-5, American Psychiatric Association (2013), Retrieved on Oct.
05, 2018. Available from URL www.elcamino.edu/faculty /rmascolo/changes-from-dsm-iv-tr—to-dsm-5(1).pdf

Vol. 8 • No. 2 • July - December 2018 63
“SANSMARAN” Management Research Journal• ISSN No. 2278-7801• Impact Factor IIJIF (2017) 4.107• Impact Factor PIF (2018) 4.504
How Millennials Can Effectively Prepare For Entrepreneurship
.............................................................................................................................................................................................
ABSTRACT :
“The capacity to learn is a gift; The ability to learn is a skill; The willingness to learn is a choice.” ¯ Brian Herbert
Nowadays millennials dream about startups, many of them are not in favor of jobs. The general perception of them
regarding startups are the idea of freedom, doing something of their own, wealth creation, flexibility, making a difference,
etc. Some of them focus on important aspects like unique ideas, innovation, planning & also most important three
factors of production viz. land, labour and capital but very few like to invest time in learning from successful and failed
businesses as well as start-ups. Example for that is under Startup India initiative by current PM Narendra Modi, lakhs
of startups registered to avail benefit under the scheme and only a few of them shortlisted for assistance from the
government. The main reason was inadequate preparation. To succeed at something, will power is not the only thing to
look at, instead one should focus on preparation because at the time of execution there will be no time left for preparation,
so what will you do then, at the time of execution – prepare or execute? Obviously execute. So how better your execution
would be will totally depend on your preparation. Good amount of preparation leads to strengthening of your will
power & increasing the chances of success. This leads us to introduce the topic “How millennials can effectively
prepare for entrepreneurship.”
.............................................................................................................................................................................................
Keywords:
Millennials, Entrepreneurship, Startups.
.............................................................................................................................................................................................
Introduction :
As we are an MBA Student, we believe some of us have an option in mind of starting our own business, maybe not now
but sooner or later. We strongly believe “failure teaches the lesson which success may not. Learning from our ancestor’s
mistakes (also means learning from history) makes us one step ahead of where they left. Even one can learn from
success as well, it totally depends upon person-to-person. One compulsion is you should learn from mistakes & avoid
them in future. Same applies for entrepreneurs. Now without delaying let’s start analyzing what are the things we as an
entrepreneur must do.
Discovering your WHY :
We would like to start our first point with a saying by Chris Lema
“When it comes to business and decision making, maybe the most important thing you can grasp is the importance of
knowing yourself.”
Mr. Hiten Gor
MBA Student, GNIMS Business School, Mumbai.
Mr. Shubham Khatri
MBA Student, GNIMS Business School, Mumbai.

64 Vol. 8 • No. 2 • July - December 2018
“SANSMARAN” Management Research Journal• ISSN No. 2278-7801• Impact Factor IIJIF (2017) 4.107• Impact Factor PIF (2018) 4.504
Many do consider ‘discovering your why’ as the best business move. Firstly you need to ask yourself why you want to
do business. Looking at the lives of entrepreneurs and the money they make is the reason, then you are externally driven
for doing the business. Another reason can be that you really want to go for startup, you don’t want to do anything else,
then you are driven internally to do the business. So ask yourself ‘are you driven internally or externally’. Are you
planning to go for startup because you hate your job, then it’s a wrong reason because disliking a particular thing and
thinking that the other one would be better than it is flawed thinking and flawed thinking can result into bad decision
making? Your ‘WHY’ should be strong enough and the reasons for doing the startup should be right, otherwise there
will be chances of startup failure.
“Don’t start a company unless it’s an obsession and something you love. If you have an exit strategy, it’s not an
obsession.” – Mark Cuban
Market-fit product :
The next most important thing is market research. Before starting the business you must do market research. You
should know the answer of some vital questions before you proceed.
What is your business actually about? Does your product have a market? Believe us many startups fail because their
product didn’t meet the market. You may have the greatest idea but if you don’t know how to execute it or there is no
market need of your product or service then it’s of no use. The entrepreneur must know the need of customers as well
as the problem they are facing in the existing product or service. At the initial stage, entrepreneurs must invest time on
improvement of product and services, must research on customer’s behavior and their wants rather than thinking of
things like interior design of office etc. Things like interior design of office should not be their immediate priority. If
your product has a market then go ahead and consider the remaining aspects.
Analysis of industry players :
Who are your competitors? The product or service that you are going to sell that your competitors are also selling, who
is the market leader? How did he start? What are his financial backings? What is your financial condition? Your
competitors can outperform you so ask yourself ‘Will you be able to survive in the market’. An entrepreneur must have
the ability to think differently from competitors and must be a step ahead of peers. So he should change his thinking
process to solve the problem, which cannot be solved with a traditional problem-solving method. This process will lead
him towards innovative ideas, which is the soul of new start-ups. It does not mean to start a new business, one should
have ideas which have never been in existence till date.
Decision Making :
How will you bring the capital – own or by an investor? Do you have the ability to raise additional funds when needed?
Do you have a good team? In first two semesters of MBA, many of us always wonder why we are learning the subjects
of HR namely organizational behavior and human resource management. True entrepreneurs recognize the value of
“High-Performance Team”. High Performance, high potential, high skill as well as the high will are basics of choosing
a team member.
Hence forth you should do self evaluation. What are your skill set? You may be good in sales but don’t know how to
handle finances or marketing, reaching out to customers, etc. Are you surrounded by people whose skills complement
yours?

Vol. 8 • No. 2 • July - December 2018 65
“SANSMARAN” Management Research Journal• ISSN No. 2278-7801• Impact Factor IIJIF (2017) 4.107• Impact Factor PIF (2018) 4.504
If you get favorable answers for these, then things would go well for you. Even if you don’t get favorable answers, then
your further decision making would be appropriate, saving you from the low times.
Survival :
Do you know organization also has blood in its vein? Yes, you read it right. Cash flow and Working capital do the
work of blood for any organization. That is the reason commerce stream student has an individual chapter on both
topics and we in MBA also had chapters on these topics. An entrepreneur must understand the type of his organization
to maintain cash with it to not miss the opportunity as well as optimum use of cash. To use cash optimally one must
understand cash burn rate. Cash burn rate in simple terms is the negative cash flow of your business i.e. the expenses
to run the business. You should know what the cash burning rate for a month is as you also have the investors behind
you. The best entrepreneurs spend on important things and don’t ignore cash burning rate.
Another point is “Margin” aka Profits. Entrepreneurs tend to follow policy of market acquisition with no profit or even
in the loss, selling products or services at the cheap price than competitors. Profit is the oxygen for a business, as it stops
coming death will approach the body. A businessman must know what will be the source of profit for the business &
how much profit they need to survive as well as to grow in the industry.
Segmentation, Targeting & Positioning :
It is being observed that people in organization overlook some important concept of marketing while focusing on
advertisement and promotion. One very important concept is “Positioning”. The organization must be aware of perfect
customer & imperfect customer, Perfect product & Imperfect product, Segmentation, Market Demography, Market
Psychograph etc.
Scalability :
Many organizations manage to get profit for a certain period but they forget the “concept of scalability”. Here the
meaning of scalability is an expansion of business, increasing number of customers and increase in profit. Many
organizations try to acquire new customers and forget to sustain existing or old customers. Scalability helps to get
regular income for an organization.
Feedback-Feed Forward Mechanism :
Last but not the least, “Converting feedback into feedforward”. Many organizations do not have this mechanism or
they do not consider feedbacks valuable. Using this mechanism correctly and taking appropriate actions will help a
business retain its customers.
Conclusion :
You have to find out where you are making mistakes and be proactive. It’s not a comprehensive list of learnings but
definitely you have got a perspective how these small things matter the most. Many startups failed because of not
considering these aspects.
90% of the startups fail – Forbes.com
So you need to know what the 10% did right, so you can follow & what the 90% did wrong, so you can avoid. Along
with all the learnings, we believe an entrepreneur needs passion with patience, will power, out of box thinking with
common sense(which is not so common) to succeed in the journey of entrepreneurship & remember don’t go for a

66 Vol. 8 • No. 2 • July - December 2018
“SANSMARAN” Management Research Journal• ISSN No. 2278-7801• Impact Factor IIJIF (2017) 4.107• Impact Factor PIF (2018) 4.504
startup just for the heck of it.
References :
� Quote by Brian Herbert https://harmoniousresolutions.com/2017/07/26/the-capacity-to-learn-is-a-gift-the-ability-
to-learn-is-a-skill-the-willingness-to-learn-is-a-choice-brian-herbert/
� Quote by Chris Lema https://chrislema.com/knowing-yourself/
� Quote by Mark Cuban http://www.rationalcomics.com/059-mark-cuban-dont-start-a-company-unless/
� Quote by Forbes https://www.forbes.com/sites/neilpatel/2015/01/16/90-of-startups-will-fail-heres-what-you-need-
to-know-about-the-10/#20aa8fb26679
� YouTube video of Dr. Vivek Bindra https://www.youtube.com/watch?v=3soVHA-f1zQ
� YouTube video of Sandeep Maheshwari https://www.youtube.com/
watch?v=wbkpaA6LH80&index=4&list=LLOefsgQXDD_jEBR1tjfhPXg&t=0s
� YouTube video of Intellectual Indies https://www.youtube.com/watch?v=NrFDLgv-nN4

Vol. 8 • No. 2 • July - December 2018 67
“SANSMARAN” Management Research Journal• ISSN No. 2278-7801• Impact Factor IIJIF (2017) 4.107• Impact Factor PIF (2018) 4.504
Emergence of Strategic Cost Management
Prof. Hema Deogharkar
Assistant Professor - Finance, Guru Nanak Institute of Management Studies (GNIMS Business School)
..............................................................................................................................................................................................
ABSTRACT :
In today’s capitative world cost management is need of the time, if company is not following cost reduction techniques
in the business it’s difficult to survive & grow, there are many tools and techniques in the strategic cost management but
base of all are Value chain analysis, Strategic positioning analysis and Cost driver analysis. In this article is giving
overview of strategic cost management three important themes.
..............................................................................................................................................................................................
Keywords:
Value Chain Analysis, Cost Driver, Strategic Cost Management, Cost Positioning
..............................................................................................................................................................................................
Introduction :
Business success is based on a strategic vision and their internal capabilities to deliver value from that investment.
Increased competition forced organisation to develop new markets, increasing regulation and changing demographics,
also must develop a multifaceted cost competence. Strategic cost management takes a broad view of the organization’s
costs, both internal and external, in such a way as to enhance competitive advantage. For developing a cost management
strategy, it is not necessary quality means high cost. Start with the idea that quality is important and ask how to best
spend resources to achieve high quality. There are several techniques company already employ but, when taken together,
they can represent a true strategic approach. cost management strategy introduces a certain degree of subjectivity, as it
also assesses intangible costs and benefits of choices.
The emergence of Strategic Cost Management (SCM) results from a blending of three underlying themes, each taken
from the strategic management literature:
1. Value chain analysis
2. Strategic positioning analysis
3. Cost driver analysis
Each of these three themes represents a stream of research and analysis in which cost information is cast in a light very
different from that in which it is viewed in conventional management accounting.
The first theme focuses on cost management effort stated in question
“How do we organize out thinking about cost management?”
Porter (1985a) has called this focus the value chain. The value chain for any firm in any business is the linked set of
value-creating activities all the way from basic raw material sources for component suppliers through to the ultimate

68 Vol. 8 • No. 2 • July - December 2018
“SANSMARAN” Management Research Journal• ISSN No. 2278-7801• Impact Factor IIJIF (2017) 4.107• Impact Factor PIF (2018) 4.504
end-use product delivered into the final consumers’ hands. This focus is external to the firm, seeing each firm in the
context of the overall chain of value-creating activities of which it is only a part, from basic raw material components to
end-use consumers. The objective of value chain is to serve as means of customer satisfaction increasing the and
managing cost effectively.
Value chain analysis involves the following steps:
1) Internal cost analysis
2) Internal differentiation analysis: Source of differentiation within internal value creating processes.
3) Vertical Linkage analysis: Understand the relationship and associated cost among external suppliers and customer
to maximize the value and minimize cost.
Let’s try to understand value chain analysis with and example a few years ago, one of the automobile company began to
implement Just in time (JIT) management concept to reduce the cost with considering the different activity of value
chain. It was believed that applying JIT concepts could eliminate 20% of these costs because assembly costs.
Source: Michael porter’s Value Chain Model
But, at the same time, the firm experienced dramatic problems with its major suppliers. They began to demand price
increases that more than offset the assembly plant costs savings which resulted into some extended failure of JIT
technique therefore therefore before applying any cost reduction tool, there is need of clear understanding of value
chain analysis. It helps to understand the relations between associated cost with internal and external customer which
ultimately helps for minimizing cost and maximizing profit.
Strategic positioning is about creating and managing a competitive advantage in complex business environment that is
constantly changing. It is necessary to align core competencies and inner strength with enduring market opportunities to
create truly sustainable competitive advantage. Strategic positioning requires an analysis of strengths, weakness and
opportunities and threats faced by the company.

Vol. 8 • No. 2 • July - December 2018 69
“SANSMARAN” Management Research Journal• ISSN No. 2278-7801• Impact Factor IIJIF (2017) 4.107• Impact Factor PIF (2018) 4.504
Six principles of Strategic Positioning:
1. Right goal
2. Deliver value proportion to the customer
3. A distinctive value chain
4. Make a company truly distinctive
5. Define strategy
6. Continuity of direction and continuous improvement
Strategic positioning can explain with an example like company must determine where and how to position their
products in the marketplace. They need to know who is going to buy their products, and why. How significant is the
price? Do consumers perceive that the product has sufficient value to justify paying a higher price — or do they simply
want the lowest price possible? These are all questions that a marketer must answer to have a successful positioning
strategy.
Strategic cost driver received attention among the management accountant over the year as a determinant of unit cost.
Cost driver concept explain the changing relationship between output volume and cost over time. If the output volume
is poor way to explain cost behavior then the better way as per Porter (1985a) presents one attempt to create a
comprehensive list of cost drivers, but his attempt is more important than his list. The first category comprises “structural”
cost drivers, drawing upon the industrial organization literature (Scherer, 1980). From this perspective, there are at least
five strategic choices by the firm regarding its underlying economic structure that drive cost position for any given
product group:
(i) Scale: How big an investment to make in manufacturing, in R&D, and in marketing resources.
(ii) Scope: Degree of vertical integration. Horizontal integration is more related to scale.
(iii) Experience: How many times in the past the firm has already done what it is doing again.
(iv) Technology: What process technologies are used at each step of the firm’s value chain.
(v) Complexity: How wide a line or products or services to offer to customers.
The central concern of any company is how to reduce its costs, since any cost reduction flows straight into profits.
However, cost reduction must be accomplished without impacting customer loyalty or reducing the ability of the
organization to achieve its long - term goals. Thus, the real issue is how to carefully pare away unnecessary costs while
maintaining a robust organization.
References :
� Fred, R.D. (2011), Strategic management: Concepts and case, 13th ed., Pearson Education, Inc, USA
� Porter, M. (1985) The Competitive Advantage: Creating and Sustaining Superior Performance. Free Press, New
York.
� Scherer, F. M. (1980), Industrial Market Structure and Economic Performance, 2nd ed., Rand McNally: Chicago
� John K. Shank & Vijay Govindarajan (1993), The new tool for competitive advantage, Free press, New York
� Directorate of Studies The Institute of Cost Accountants of India (ICAI) (May 2013) , Business Strategy &
Strategic Cost Management , Das Printers, Kolkata.

70 Vol. 8 • No. 2 • July - December 2018
“SANSMARAN” Management Research Journal• ISSN No. 2278-7801• Impact Factor IIJIF (2017) 4.107• Impact Factor PIF (2018) 4.504
BOOK REVIEW – Research Methodology – Logic, Methods and Cases
Dr. D.Y Patil,
Director, GNIMS Business School, Mumbai
...............................................................................................................................................................................................
Book: Research Methodology – Logic, Methods and Cases
Author: Sameer Phanse
Publisher: oxford university press
Edition: First Edition 2016 ISBN: 978-0-19-945378-8
Price: INR625.00
Pages: 637
Binding: Perfect Binding
The present book review analyzed Sameer Phanse book on Research Methodology – Logic, Methods and Cases. This
book brings together adequate matter on a complex topic of research methodology. Research is a part of all disciplines
and it requires a clear and conceptual knowledge of techniques to be used in solving research problems. This book
updates students, researchers and teachers with the theory of research methods and their application in actual research
problems. The contents of the book are oriented towards marketing and applied research but this book can widely be
used in all kinds of courses and researches. It is an applied book in research methodology. The theoretical part of the
book helps the readers to follow the matter in exact and clear manner like how class room sessions are conducted.
Presenting theory as well as practical in a lucid manner makes this book unique. Collection of data, analysis of data,
interpretation of results and report writing are the aspects systematically covered in the book. The most important part
of research process is to deal with advanced data analysis, which is very well focused in twelve chapters that are totally
devoted to applied multivariate data analysis with explanations in some graphs and simple numerical examples that
made it interesting to deal with.
The students, teachers and researchers will find this book congenial and it will instill confidences of students from the
exam point of view. Furthermore, appendices are provided as supporting material to understand and work-out the
theory and numerical problems.
Sameer Phansel, in Research Methodology – Logic, Methods and Cases., investigated what is research and how it
could be carried out in an effective manner by providing concrete and complete information using different designs of
data collection, survey sampling methods, measurement and scaling, statistical hypothesis testing, nonparametric tests,
multivariate analysis, cluster analysis etc. The book is intelligently divided into 16 chapters to express its ingredients in
a lucid manner.
Chapter 1 “Introduction to Research and Research Methodology” lays the groundwork by defining Research,
Types of Research, Types and editing of Data, Information System, and Report Writing. Here, the author has described
the base of research methodology excellently.

Vol. 8 • No. 2 • July - December 2018 71
“SANSMARAN” Management Research Journal• ISSN No. 2278-7801• Impact Factor IIJIF (2017) 4.107• Impact Factor PIF (2018) 4.504
The second chapter “Science and scientific Thinking” provides fundamental information like, Distribution Function,
Mathematical Expectation, Probability and statistics, Scientific explanation Theoretical Distribution, etc. which are the
foundations of statistics and are most commonly used in research methodology.
Following which the third chapter discussed about “Research Process” which focuses on various ingredients like,
SCM model, ABCDE modal theory of validation, empirical and non-empirical phases of theory.
Chapter 4 “Research Designs “ focuses also on data. The author elucidates that it becomes very important to collect
concrete and purified data free from contaminations and biases because data is the backbone of any research and it
should be more flexible to be used for statistical analysis. To meet this desired objective, survey methods are best to
carry out social, psychological and marketing research. This chapter has adequately covered various approaches of
collecting primary information (data) through questionnaires and secondary data from publications, unpublished records,
computerized databases and in-depth interviews.
Chapter 5"Formal Logic, Deduction and Induction” The author focuses on importance of deductive and inductive
arguments and their place in a scientific inquiry and indispensable role of logic in deriving valid conclusion.
Chapter 6,10 and 11Deals with Statistical Hypothesis Testing’, In this chapter, the author exposed that hypothesis is a
strong tool in statistics which has a wide range of utility and there is hardly any science dealing with quantitative
research which does not utilize the technique of testing of hypothesis. He mainly concluded that besides Z, t, x2 and F
tests, there are several statistical tests which are seldom used as compared to these four tests. He added that units are not
measured but are ranked. In case of ranked data, nonparametric tests are applied.
In chapter 7,” Explanation , Prediction and Laws”, deals with logical interrelation between explanations and prediction
in the context of the prevailing laws.
The author devoted the Chapter 8 ‘Observation,Measurements and Data’ to techniques of developing proper scales
with anchor point as deemed relevant to the problem under investigation. The author narrated about marketing management
and social research, and about attitude scales that are principally used to assess the behavior of the respondents and
impact of various plans or schemes or segments of the society. The adequacy of the scales is judged on the basis of
reliability and validity of the constructs.
Chapter 9 and 13" Deals with Statistical Samplingand data collection methods” with emphasis on Need of Surveys,
Various Sampling Methods, types of Distributions, various data collection methods etc and also compares probability
theory with the statistical approach..
Chapter 12,”Introduction to Advanced statistical concept and applications” discusses discriminant, conjoint, factor
analysis, multidimensional scaling, regression analysis with real life examples.
Chapter 14, 15 and 16 deals with Report writing, Questionnaire design and field operations.
Conclusion :
Sameer Phanse in Research Methodology – Logic, Methods and Cases., 2016, investigated what is research and how it
could be carried out in an effective manner by providing concrete and complete information using different designs of
data collection, survey sampling methods, measurement and scaling, statistical hypothesis testing, nonparametric tests,
multivariate analysis, cluster analysis etc.

72 Vol. 8 • No. 2 • July - December 2018
“SANSMARAN” Management Research Journal• ISSN No. 2278-7801• Impact Factor IIJIF (2017) 4.107• Impact Factor PIF (2018) 4.504
This book is an attempt to provide adequate knowledge on a complex topic of research methodology. Research is a part
of all disciplines and it requires a clear and conceptual knowledge of techniques to be used in solving research problems.
Thus, the students, teachers and researchers can update themselves with the theory of research methods and their
application in actual research problem. This book will solve the problem in both the directions.
The contents of the book are oriented towards marketing and applied research. But all the research methods are not
confined to any particular area or discipline of research. In view of this fact, the book can widely be referred in all kinds
of courses and researches.
In this book there are two approaches where one is to teach researchers by theorists who emphasize on development and
derivation of research methods and the other is towards solving research problems. This
book is meant to be an applied book on research methodology. Theoretical part of each and every method is provided in
such a manner that the readers will be able to follow the content in an exact and clear manner.
This book is unique as it is intended to present the theoretical and application aspects of any technique in a lucid
manner. Hence, the students, scholars and the researchers will learn basic methodology and will be able to develop
themselves to make use of statistical procedures in research and profession.

CALL FOR PAPERS
"SANSMARAN" Management Research Journal
ISSN: 2278-7801
Submission Requirements:
• Submitted manuscripts must be original work that is not under submission at another journal or
under consideration for publication in any other form. In case the authors have received
financial/technical assistance for completing the manuscript, they should acknowledge the same
in the manuscript so as to avoid conflicts of ownership. After submitting the manuscript, until the
editorial decision is communicated or if the manuscript is accepted for publication, without prior
approval from the editor, authors cannot publish the manuscript in other publication.
• Maximum length of the manuscript should be between 4000-6000 words.
• Authors should send two electronic copies of the manuscript via e-mail attachment as a Microsoft
Word document file at [email protected]
• One file should contain Title Page which should provide the names of all the authors, their
institutional affiliation, mailing address, e-mail id and Fax/telephone number.
• One separate page including title of the manuscript, an abstract of no more than 200 words
followed by up to 6 Key Words should be included in both the files. Author's identity or
institutional affiliation should not appear on this page.
• The text should be double spaced and should be typed in Times New Roman style with a font size
of 12 pts. and 1 inch margin all around. Use standard indentation for paragraphs.
• Footnotes should appear at the bottom of the page on which they are cited/ referenced. Tables and
Figures should be numbered in Roman Numerals and can appear either in the body of the
manuscript or at the end of the manuscript. Sources of data used in both tables and figures should
be duly acknowledged as a footnote to the same. In case some abbreviations and acronyms are
used in the tables and figures, these should be duly described in the main body text of the
manuscript where they have been cited/ referenced/ interpreted and well as in the footnotes o f the
table/ figure.
• A sampling of the most common entries in reference lists appears below. Please note that for
journal articles, issue numbers are not included unless each issue in the volume begins with page
one. Hence, it is The Journal of Futures Markets, 24,513-532, not The Journal of Futures Markets,
24(6), 513-532. Entries not exemplified below are modeled in the Publication Manual . Please
note that italics are removed from references in the printed publication (this is a departure from
the Publication Manual style).

SGPC's Guru Nanak Institute of Management Studies
King's Circle, Matunga, Mumbai - 400 019.Tel. : +91 22 2404 3927/ 28 | Telefax : +91 22 2404 3933
Website : www.gnims.edu.in | E-mail : [email protected]
Designed & Printed at : Shailesh Printers
Tel.: +91 22 2927 6602 • Cell : +91 97690 11535 • E-mail : [email protected]
IMPACT FACTOR by IIJIF
4.101
an lr ou f o LJ i- be rl aa rn yo i St ca ien nr e ct en I
scholar
Journal Listed in