management accounting tutorial 8 mid module revie /irwin copyright © 2008 by the mcgraw-hill...
TRANSCRIPT
14-1
McGraw-Hill /Irwin Copyright © 2008 by The McGraw-Hill Companies, Inc. All rights reserved.
Management Accounting Tutorial 8 (Prologue, chapter 13, 14, 1, 2, 3)
Mid Module Review
Bangor University Transfer Abroad Programme
McGraw-Hill /Irwin Copyright © 2008 by The McGraw-Hill Companies, Inc. All rights reserved.
Prologue TM Prologue-1
© The McGraw-Hill Companies, Inc., 2008. All rights reserved.
AGENDA: MANAGEMENT ACCOUNTING AND THE BUSINESS ENVIRONMENT
1. Globalization.
2. Strategy.
3. Organizational structure.
4. Process management.
• Lean Production.
• The Theory of Constraints (TOC).
• Six Sigma.
5. The importance of ethics in business.
6. Corporate governance.
• The Sarbanes-Oxley Act of 2002.
7. Enterprise risk management.
McGraw-Hill /Irwin Copyright © 2008 by The McGraw-Hill Companies, Inc. All rights reserved.
Prologue TM Prologue-3
© The McGraw-Hill Companies, Inc., 2008. All rights reserved.
STRATEGY
A strategy is a “game plan” that enables a company to attract customers by distinguishing itself from competitors.
CUSTOMER INTIMACY
• Understanding and responding to individual customer needs better than competitors.
• Ritz-Carlton, Nordstrom, Home Depot
OPERATIONAL EXCELLENCE
• Delivering products and services faster, more conveniently, and at a lower price than competitors.
• Southwest Airlines, Wal-Mart, and The Vanguard Group
PRODUCT LEADERSHIP
• Offering higher quality products than competitors.
• BMW, Cisco Systems, and W.L. Gore McGraw-Hill /Irwin Copyright © 2008 by The McGraw-Hill Companies, Inc. All rights reserved.
Prologue TM Prologue-5
© The McGraw-Hill Companies, Inc., 2008. All rights reserved.
PROCESS MANAGEMENT
• A business process is a series of steps that are followed in order to carry out some task in a business.
• A value chain, as shown below, consists of the major business functions that add value to a company’s products and services.
Lean Production
TM Prologue-6
© The McGraw-Hill Companies, Inc., 2008. All rights reserved.
THE LEAN THINKING MODEL
• In Lean Production, parts and materials are pulled through the assembly process as needed.
• In the push approach used in traditional production control systems, work in process is pushed through the factory from one workstation to the next with little regard to when it is actually needed. In a push system, the overriding concerns are to keep all the workstations busy and to produce as much as possible so as to spread the costs of investments in equipment and other assets across many units.
McGraw-Hill /Irwin Copyright © 2008 by The McGraw-Hill Companies, Inc. All rights reserved.
Prologue TM Prologue-7
© The McGraw-Hill Companies, Inc., 2008. All rights reserved.
THEORY OF CONSTRAINTS (TOC)
• A constraint is anything that limits the ability of an individual or organization to attain its objectives.
• If the factory cannot satisfy demand, the constraint (i.e., bottleneck) is likely to be the workstation with the least capacity.
• The rate of output of the entire factory is determined by the capacity of the constraint.
• The other, non-constraint, work stations have excess capacity.
• Improvement efforts should usually be focused on the constraint.
• Improvements that increase the capacity of the constraint will increase the output of the entire factory.
• Improvements that increase the capacity of workstations that are not constraints will simply increase their excess capacity.
• If the capacity of the current bottleneck is increased enough, the constraint will shift. Improvement efforts should then be shifted to the new constraint (bottleneck).
SIX SIGMA
• Six Sigma relies on customer feedback and fact-based data gathering and analysis techniques to drive process improvement.
• The term Six Sigma refers to a process with an error rate of less than 3.4 per million. This is close to perfection—zero defects.
• The DMAIC (Define, Measure, Analyze, Improve, and Control) framework is often used in conjunction with Six Sigma.
McGraw-Hill /Irwin Copyright © 2008 by The McGraw-Hill Companies, Inc. All rights reserved.
Prologue
TM Prologue-7
© The McGraw-Hill Companies, Inc., 2008. All rights reserved.
THEORY OF CONSTRAINTS (TOC)
• A constraint is anything that limits the ability of an individual or organization to attain its objectives.
• If the factory cannot satisfy demand, the constraint (i.e., bottleneck) is likely to be the workstation with the least capacity.
• The rate of output of the entire factory is determined by the capacity of the constraint.
• The other, non-constraint, work stations have excess capacity.
• Improvement efforts should usually be focused on the constraint.
• Improvements that increase the capacity of the constraint will increase the output of the entire factory.
• Improvements that increase the capacity of workstations that are not constraints will simply increase their excess capacity.
• If the capacity of the current bottleneck is increased enough, the constraint will shift. Improvement efforts should then be shifted to the new constraint (bottleneck).
SIX SIGMA
• Six Sigma relies on customer feedback and fact-based data gathering and analysis techniques to drive process improvement.
• The term Six Sigma refers to a process with an error rate of less than 3.4 per million. This is close to perfection—zero defects.
• The DMAIC (Define, Measure, Analyze, Improve, and Control) framework is often used in conjunction with Six Sigma.
TM Prologue-8
© The McGraw-Hill Companies, Inc., 2008. All rights reserved.
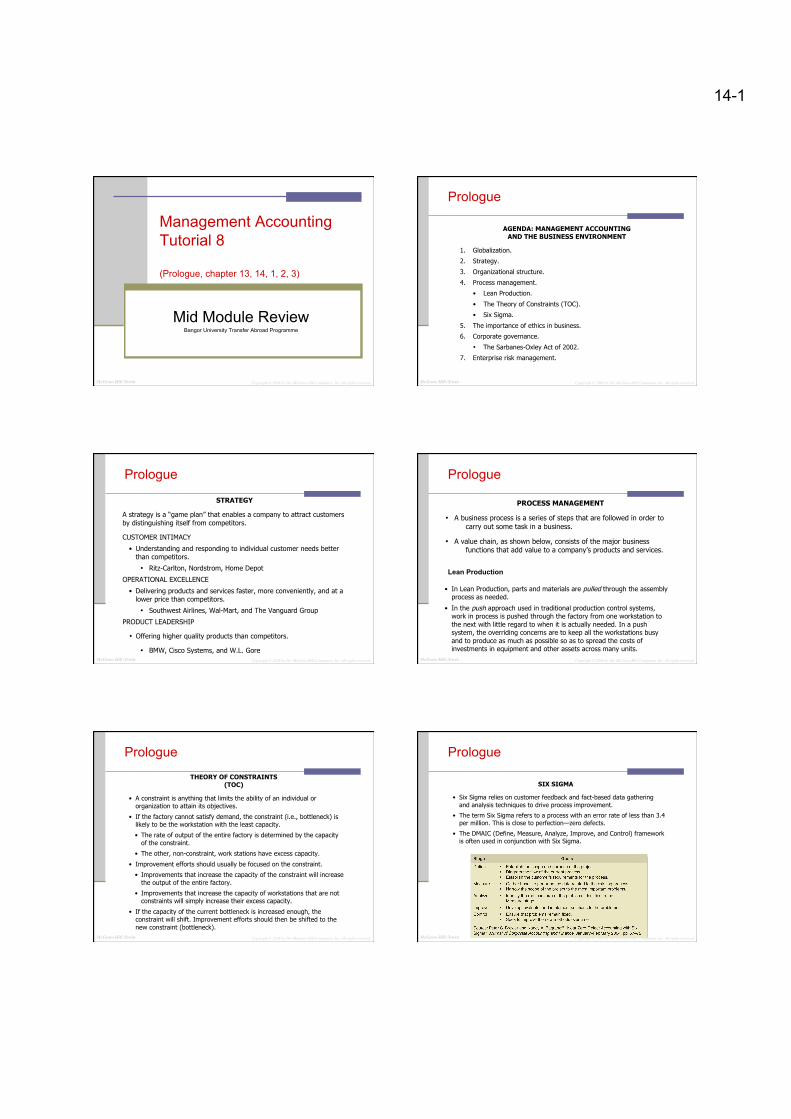
SIX SIGMA: THE DMAIC FRAMEWORK

14-2
McGraw-Hill /Irwin Copyright © 2008 by The McGraw-Hill Companies, Inc. All rights reserved.
Chapter 13 (Statement of Cash Flow) TM 13-1
© The McGraw-Hill Companies, Inc., 2008. All rights reserved.
AGENDA: STATEMENT OF CASH FLOWS
A. Purpose of the statement; definition of cash.
B. Basis of the statement of cash flows: analysis of balance sheet accounts.
C. Sources and uses of funds.
D. Organization of the statement of cash flows.
E. Cash provided by operations—the direct and indirect methods.
F. Steps in preparing a statement of cash flows.
G. Example of statement of cash flows.
I. T-account approach
McGraw-Hill /Irwin Copyright © 2008 by The McGraw-Hill Companies, Inc. All rights reserved.
Chapter 13 (Statement of Cash Flow) TM 13-2
© The McGraw-Hill Companies, Inc., 2008. All rights reserved.
THE STATEMENT OF CASH FLOWS
PURPOSE
The statement of cash flows shows the major uses and sources of cash during a period. It is used to diagnose what has happened to cash.
DEFINITION OF CASH
In the cash flow statement, cash is broadly defined to include cash and cash equivalents. Cash equivalents consist of short-term, highly liquid investments such as treasury bills, commercial paper, and money market funds.
ANALYSIS OF CASH FLOWS
The cash flow statement is constructed by analyzing changes in balance sheet accounts.
McGraw-Hill /Irwin Copyright © 2008 by The McGraw-Hill Companies, Inc. All rights reserved.
Chapter 13 (Statement of Cash Flow) TM 13-5
© The McGraw-Hill Companies, Inc., 2008. All rights reserved.
ORGANIZATION OF STATEMENT OF CASH FLOWS
The statement of cash flows contains three sections:
1. Operating activities.
2. Investing activities.
3. Financing activities.
Each source and use of cash is classified as one of the above activities.
OPERATING ACTIVITIES
Activities that affect current assets, current liabilities, or net income.
INVESTING ACTIVITIES
Transactions relating to acquiring or disposing of non-current assets.
FINANCING ACTIVITIES
Transactions involving creditors or owners of the company. (Exception: Interest is classified as an operating activity.)
McGraw-Hill /Irwin Copyright © 2008 by The McGraw-Hill Companies, Inc. All rights reserved.
Chapter 13 (Statement of Cash Flow) TM 13-6
© The McGraw-Hill Companies, Inc., 2008. All rights reserved.
CASH PROVIDED BY OPERATIONS
The net cash provided by operating activities can be computed using either the direct method or the indirect method.
DIRECT METHOD
Under the direct method, the income statement is reconstructed on a cash basis from top to bottom. Operating cash outflows are subtracted from operating cash inflows to arrive at net cash flow from operating activities.
INDIRECT METHOD
Under the indirect method, the cash provided by operations is determined by adjusting net income to a cash basis.
In practice, the indirect method is used much more frequently than the direct method on external financial reports.
McGraw-Hill /Irwin Copyright © 2008 by The McGraw-Hill Companies, Inc. All rights reserved.
Chapter 13 (Statement of Cash Flow) TM 13-7
© The McGraw-Hill Companies, Inc., 2008. All rights reserved.
PREPARING A STATEMENT OF CASH FLOWS
Preparing a statement of cash flows involves eight basic steps:
1. Copy the title of each balance sheet account onto a worksheet, except for cash and cash equivalents. Contra-asset accounts should be listed with the liabilities.
2. Compute the change in each balance sheet account. Break the change in retained earnings down into net income and dividends.
3. Classify each change as either a source or a use.
4. Write the sources as positive numbers and the uses as negative numbers.
5. Make necessary adjustments (for example, in gains and losses) to reflect gross, rather than net, changes in noncurrent accounts due to financing and investing activities.
6. Categorize each entry on the worksheet as an operating, investing, or financing activity.
7. Copy the data from the worksheet to the statement of cash flows.
8. Prepare a reconciliation of the cash account. McGraw-Hill /Irwin Copyright © 2008 by The McGraw-Hill Companies, Inc. All rights reserved.
Chapter 14 (Financial Statement Analysis) TM 14-1
© The McGraw-Hill Companies, Inc., 2008. All rights reserved.
AGENDA: FINANCIAL STATEMENT ANALYSIS
A. Comparative analysis of financial statements.
1. Trend analysis. (Horizontal analysis)
2. Common-size statements. (Vertical analysis)
B. Ratio analysis—the common stockholder
1. Earnings per share
2. Gross margin percentage
3. Price-earnings ratio
4. Dividend payout ratio
5. Dividend yield ratio
6. Return on total assets
7. Return on common stockholders’ equity
8. Book value per share
C. Ratio analysis—the short-term creditor
1. Working capital
2. Current ratio
3. Acid-test (quick) ratio
4. Accounts receivable turnover and average collection period
5. Inventory turnover and average sale period
D. Ratio analysis—the long-term creditor
1. Times interest earned ratio
2. Debt-to-equity ratio

14-3
McGraw-Hill /Irwin Copyright © 2008 by The McGraw-Hill Companies, Inc. All rights reserved.
Chapter 14 (Financial Statement Analysis)
TM 14-1
© The McGraw-Hill Companies, Inc., 2008. All rights reserved.
AGENDA: FINANCIAL STATEMENT ANALYSIS
A. Comparative analysis of financial statements.
1. Trend analysis. (Horizontal analysis)
2. Common-size statements. (Vertical analysis)
B. Ratio analysis—the common stockholder
1. Earnings per share
2. Gross margin percentage
3. Price-earnings ratio
4. Dividend payout ratio
5. Dividend yield ratio
6. Return on total assets
7. Return on common stockholders’ equity
8. Book value per share
C. Ratio analysis—the short-term creditor
1. Working capital
2. Current ratio
3. Acid-test (quick) ratio
4. Accounts receivable turnover and average collection period
5. Inventory turnover and average sale period
D. Ratio analysis—the long-term creditor
1. Times interest earned ratio
2. Debt-to-equity ratio
McGraw-Hill /Irwin Copyright © 2008 by The McGraw-Hill Companies, Inc. All rights reserved.
Chapter 14 (Financial Statement Analysis) TM 14-2
© The McGraw-Hill Companies, Inc., 2008. All rights reserved.
FINANCIAL STATEMENT ANALYSIS
Few figures on financial statements have much significance by themselves. The relation of one figure to another and the amounts and directions of changes are important.
Several techniques are commonly used to help analyze financial statements:
• Dollar and percentage changes.
• Common-size statements.
• Ratios.
Trend Percentages
Trend percentages state several years’ financial data in terms of a base year.
EXAMPLE: Translate the following data into trend percentages, using Year 1 as the base year. (All dollar amounts are in thousands.)
Year 4 Year 3 Year 2 Year 1 Sales ......................... $650 $600 $550 $500 Accounts receivable .... $70 $52 $44 $40
These data in trend percentage form would be:
Year 4 Year 3 Year 2 Year 1 Sales ......................... 130% 120% 110% * 100% Accounts receivable .... 175% 130% 110% 100% * $550 ÷ $500 = 110%, and so forth.
McGraw-Hill /Irwin Copyright © 2008 by The McGraw-Hill Companies, Inc. All rights reserved.
Chapter 14 (Financial Statement Analysis)
TM 14-6
© The McGraw-Hill Companies, Inc., 2008. All rights reserved.
COMMON-SIZE STATEMENTS (cont’d)
Common-Size Income Statements (All income statement items are stated as a percentage of Sales.)
Common-size
Percentages This Last This Last Year Year Year Year Sales ..................................... $9,000 $8,000 100.0 100.0 Cost of goods sold .................. 5,930 5,100 65.9 63.7 Gross margin ......................... 3,070 2,900 34.1 36.3 Selling and administrative
expenses ............................. 2,160 2,040 24.0 25.5 Net operating income ............. 910 860 10.1 10.8 Interest expense .................... 60 60 0.7 0.8 Net income before taxes ......... 850 800 9.4 10.0 Income taxes (40%) ............... 340 320 3.8 4.0 Net income ............................ $ 510 $ 480 5.7 6.0
Gross Margin Percentage
The gross margin percentage is often monitored by managers and investment analysts. It is computed as follows:
Gross marginGross margin percentage =
Sales
For this year, the gross margin percentage was:
$3,070Gross margin = = 34.1%percentage, this year $9,000
TM 14-7
© The McGraw-Hill Companies, Inc., 2008. All rights reserved.
RATIO ANALYSIS—THE COMMON STOCKHOLDER
Earnings per Share
Earnings per share (EPS) refers to the earnings that are available to the owners of common stock after preferred dividends have been paid. Earnings per share is defined as follows:
Net income - Preferred dividendsEarnings per share = Average common shares outstanding
To compute Molin Corporation’s EPS, first determine the average common shares that were outstanding during the year.
This Year
Last Year
Common stock ($000) ............. $500 $500 ÷ Par value per share ............. $10 $10 = Shares outstanding (000) ..... 50 50
Average common shares outstanding = (50 + 50)/2 = 50
Net income - Preferred dividendsEarnings per share = Average common shares outstanding
$510 - $30= = $9.60 per share
50 shares
McGraw-Hill /Irwin Copyright © 2008 by The McGraw-Hill Companies, Inc. All rights reserved.
Chapter 14 (Financial Statement Analysis) TM 14-8
© The McGraw-Hill Companies, Inc., 2008. All rights reserved.
Price-Earnings Ratio
The relation between the market price of a share of stock and the stock’s current earnings per share is often stated in terms of a price-earnings ratio. Assume that Molin Corporation’s stock is now selling for $72 per share.
Market price per sharePrice-earnings ratio=
Earnings per share
$72.00= =7.5
$9.60
Dividend Payout Ratio
The dividend payout ratio shows what portion of current earnings were paid out as dividends to common stockholders. The dividend this year was $2.60 per share ($130 thousand ÷ 50 thousand shares), and last year it was $2.40 per share ($120 thousand ÷ 50 thousand shares).
Dividends per shareDividend payout ratio=
Earnings per share
$2.60= =27.1%
$9.60
There is no “right” dividend payout ratio, although companies in the same industry tend to have similar dividend payout ratios.
TM 14-8
© The McGraw-Hill Companies, Inc., 2008. All rights reserved.
Price-Earnings Ratio
The relation between the market price of a share of stock and the stock’s current earnings per share is often stated in terms of a price-earnings ratio. Assume that Molin Corporation’s stock is now selling for $72 per share.
Market price per sharePrice-earnings ratio=
Earnings per share
$72.00= =7.5
$9.60
Dividend Payout Ratio
The dividend payout ratio shows what portion of current earnings were paid out as dividends to common stockholders. The dividend this year was $2.60 per share ($130 thousand ÷ 50 thousand shares), and last year it was $2.40 per share ($120 thousand ÷ 50 thousand shares).
Dividends per shareDividend payout ratio=
Earnings per share
$2.60= =27.1%
$9.60
There is no “right” dividend payout ratio, although companies in the same industry tend to have similar dividend payout ratios.
McGraw-Hill /Irwin Copyright © 2008 by The McGraw-Hill Companies, Inc. All rights reserved.
Chapter 14 (Financial Statement Analysis) TM 14-9
© The McGraw-Hill Companies, Inc., 2008. All rights reserved.
Dividend Yield Ratio
The dividend yield ratio measures the cash return being provided by a stock.
Dividends per shareDividend yield ratio=
Market price per share
$2.60= =3.6%
$72.00
A low dividend payout ratio and a low dividend yield ratio indicate that the company is retaining its earnings for internal reinvestment.
Return on Total Assets
The return on total assets is a measure of how well assets have been employed by management.
Net income+[Interest expense×(1-Tax rate)]Return on =total assets Average total assets
$510+[$60×0.60]= =12.1%
($5,000+$4,000)/2
By adding interest expense back to net income, the return on assets is not influenced by the way in which the assets were financed.
McGraw-Hill /Irwin Copyright © 2008 by The McGraw-Hill Companies, Inc. All rights reserved.
Chapter 14 (Financial Statement Analysis) TM 14-10
© The McGraw-Hill Companies, Inc., 2008. All rights reserved.
Return on Common Stockholders’ Equity
Common stockholders’ equity consists of total stockholders’ equity less preferred stock.
Net income - Preferred dividendsReturn on common =stockholders' equity Average total stockholders' equity- Average preferred stock
$510-$30= =19.8%
($2,600+$2,250)/2
Because the return on common stockholders’ equity is greater than the return on total assets, financial leverage is positive in both years.
Book Value per Share
Book value per share shows the amount of common stockholders’ equity per share of common stock.
Common stockholders' equityBook value=per share Number of common shares outstanding
Total stockholders' equity - Preferred stock=Number of common shares outstanding
$3,000 - $400= =$52 per share50 shares

14-4
McGraw-Hill /Irwin Copyright © 2008 by The McGraw-Hill Companies, Inc. All rights reserved.
Chapter 14 (Financial Statement Analysis) TM 14-11
© The McGraw-Hill Companies, Inc., 2008. All rights reserved.
RATIO ANALYSIS—THE SHORT-TERM CREDITOR
Working Capital
The excess of current assets over current liabilities is known as working capital. Molin Corporation’s working capital is:
Working capital = Current assets - Current liabilities
= $2,350 - $1,400 = $950
Working capital is viewed as a cushion of protection for short-term creditors.
Current Ratio
The relation between current assets and current liabilities can also be expressed in terms of the current ratio:
Current assetsCurrent ratio=Current liabilities
$2,350= =1.68
$1,400
A declining current ratio may be a sign of a deteriorating financial condition.
McGraw-Hill /Irwin Copyright © 2008 by The McGraw-Hill Companies, Inc. All rights reserved.
Chapter 14 (Financial Statement Analysis) TM 14-12
© The McGraw-Hill Companies, Inc., 2008. All rights reserved.
Acid-Test Ratio
The acid-test ratio (or quick ratio) provides a more rigorous test than the current ratio of a company’s ability to settle its short-term liabilities.
Cash + Marketable securities+ Accounts receivable + Short-term notes receivableAcid-test ratio=
Current liabilities
$90+ $0 + $800 + $0= =0.64$1,400
Accounts Receivable Turnover
The accounts receivable turnover indicates how quickly accounts receivables are collected.
Sales on accountAccounts receivable=turnover Average accounts receivable balance
$9,000= =13.8
($800 + $500)/2
365 daysAverage collection=period Accounts receivable turnover
365 days= =26.4 days
13.8
McGraw-Hill /Irwin Copyright © 2008 by The McGraw-Hill Companies, Inc. All rights reserved.
Chapter 14 (Financial Statement Analysis) TM 14-13
© The McGraw-Hill Companies, Inc., 2008. All rights reserved.
Inventory Turnover
The inventory turnover ratio measures how quickly inventory is converted into sales. Assume that Molin Corporation’s inventory balance was $700 thousand at the beginning of last year.
Cost of goods soldInventory turnover=
Average inventory balance
$5,930= =5.2
($1,400 + $900)/2
365 daysAverage sale period=Inventory turnover
365 days= =70.2 days
5.2
McGraw-Hill /Irwin Copyright © 2008 by The McGraw-Hill Companies, Inc. All rights reserved.
Chapter 14 (Financial Statement Analysis) TM 14-14
© The McGraw-Hill Companies, Inc., 2008. All rights reserved.
RATIO ANALYSIS—THE LONG-TERM CREDITOR
Times Interest Earned
The times interest earned ratio is a widely used measure of the ability of a company’s operations to provide protection for long-term creditors.
Earnings before interest and taxesTimes interest earned=
Interest expense
$910= =15.2
$60
Debt-To-Equity Ratio
The debt-to-equity ratio measures the amount of assets being provided by creditors for each dollar of assets being provided by owners.
Total liabilitiesDebt-to-equity ratio=
Stockholders' equity
$2,000= =0.67
$3,000
There is no “right” amount of debt for a company to carry. Because different industries face different risks, the level of debt that is appropriate will vary from industry to industry.
McGraw-Hill /Irwin Copyright © 2008 by The McGraw-Hill Companies, Inc. All rights reserved.
Chapter 1 (Cost Concepts) TM 1-1
© The McGraw-Hill Companies, Inc., 2008. All rights reserved.
AGENDA: AN INTRODUCTION TO MANAGERIAL ACCOUNTING AND COST CONCEPTS
1. The work of management.
2. Management accounting contrasted with financial accounting.
3. Cost concepts for preparing external financial reports.
4. Cost concepts for predicting changes in costs due to changes in activity.
5. Cost concepts for assigning costs to costing objects.
6. Cost concepts for making decisions.
McGraw-Hill /Irwin Copyright © 2008 by The McGraw-Hill Companies, Inc. All rights reserved.
Chapter 1 (Cost Concepts) TM 1-4
© The McGraw-Hill Companies, Inc., 2008. All rights reserved.
AN OVERVIEW OF COST TERMS
Purpose of classification Cost classifications
Preparing an income statement and a balance sheet
• Product costs • Direct materials • Direct labor • Manufacturing overhead
• Period costs (nonmanufacturing costs) • Selling costs • Administrative costs
Predicting changes in cost due to changes in activity
• Variable costs • Fixed costs
Assigning costs to cost objects
• Direct costs • Indirect costs
Making decisions • Differential costs • Sunk costs • Opportunity costs
14-5
McGraw-Hill /Irwin Copyright © 2008 by The McGraw-Hill Companies, Inc. All rights reserved.
Chapter 1 (Cost Concepts) TM 1-12
© The McGraw-Hill Companies, Inc., 2008. All rights reserved.
COST CLASSIFICATIONS TO DESCRIBE COST BEHAVIOR
To describe how costs react to changes in activity, costs are often classified as variable or fixed.
VARIABLE COSTS
Variable cost behavior can be summarized as follows:
Variable Cost Behavior In Total Per Unit
Total variable cost increases and decreases in proportion
to changes in activity.
Variable cost per unit is constant.
EXAMPLE: A company manufactures microwave ovens. Each oven requires a timing device that costs $30. The cost per unit and the total cost of the timing device at various levels of activity (i.e., number of ovens produced) would be:
Cost per Timing Device
Number of Ovens
Produced
Total Variable Cost—Timing
Devices $30 1 $30 $30 10 $300 $30 100 $3,000 $30 200 $6,000
McGraw-Hill /Irwin Copyright © 2008 by The McGraw-Hill Companies, Inc. All rights reserved.
Chapter 1 (Cost Concepts)
TM 1-13
© The McGraw-Hill Companies, Inc., 2008. All rights reserved.
FIXED COSTS
Fixed cost behavior can be summarized as follows:
Fixed Cost Behavior In Total Per Unit
Total fixed cost is not affected by changes in activity (i.e., total fixed cost remains constant even
if activity changes).
Fixed cost per unit decreases as the activity level rises and increases as the activity level
falls.
EXAMPLE: Assume again that a company manufactures microwave ovens. The company pays $9,000 per month to rent its factory building. The total cost and the cost per unit of rent at various levels of activity would be:
Rent Cost per Month
Number of Ovens
Produced Rent Cost per
Oven $9,000 1 $9,000 $9,000 10 $900 $9,000 100 $90 $9,000 200 $45
McGraw-Hill /Irwin Copyright © 2008 by The McGraw-Hill Companies, Inc. All rights reserved.
Chapter 1 (Cost Concepts) TM 1-14
© The McGraw-Hill Companies, Inc., 2008. All rights reserved.
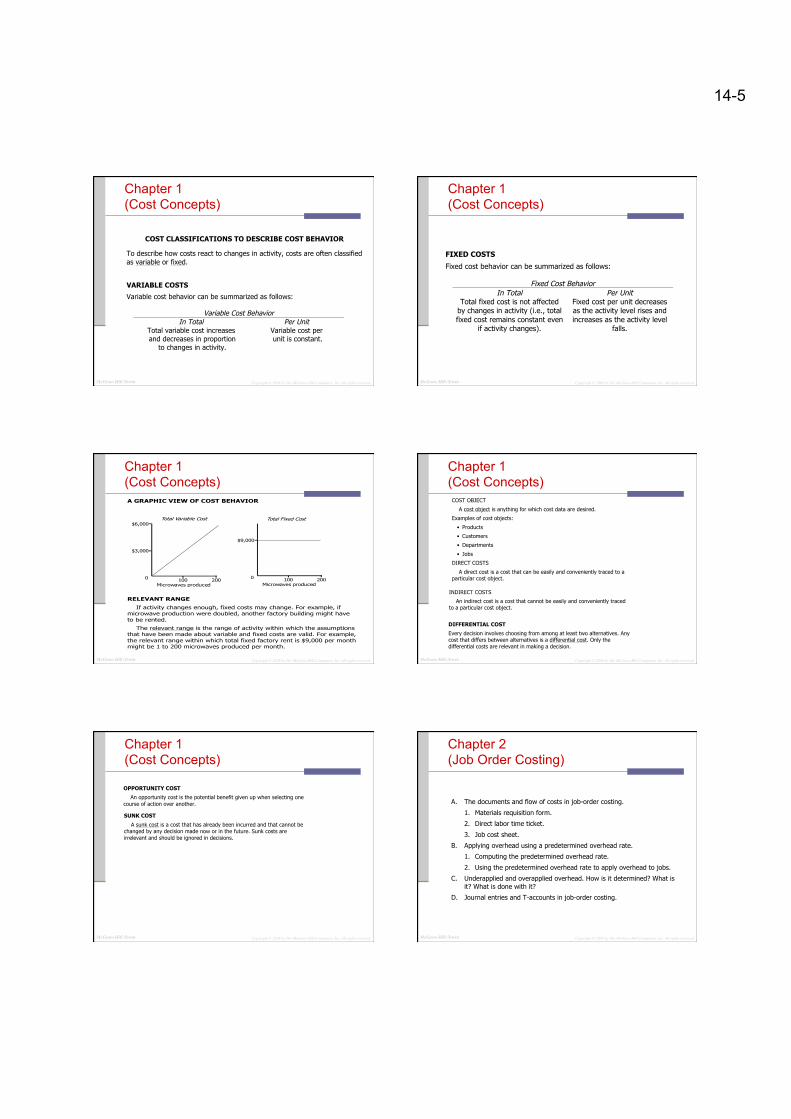
A GRAPHIC VIEW OF COST BEHAVIOR
100 200 0
$3,000
$6,000
Microwaves produced
Total Variable Cost
100 200 0
$9,000
Microwaves produced
Total Fixed Cost
RELEVANT RANGE
If activity changes enough, fixed costs may change. For example, if microwave production were doubled, another factory building might have to be rented.
The relevant range is the range of activity within which the assumptions that have been made about variable and fixed costs are valid. For example, the relevant range within which total fixed factory rent is $9,000 per month might be 1 to 200 microwaves produced per month.
McGraw-Hill /Irwin Copyright © 2008 by The McGraw-Hill Companies, Inc. All rights reserved.
Chapter 1 (Cost Concepts)
TM 1-15
© The McGraw-Hill Companies, Inc., 2008. All rights reserved.
COST CLASSIFICATIONS FOR ASSIGNING COSTS
COST OBJECT
A cost object is anything for which cost data are desired.
Examples of cost objects:
• Products
• Customers
• Departments
• Jobs
DIRECT COSTS
A direct cost is a cost that can be easily and conveniently traced to a particular cost object.
Examples of direct costs:
• The direct costs of a Ford SUV would include the cost of the steering wheel purchased by Ford from a supplier, the costs of direct labor workers, the costs of the tires, and so on.
• The direct costs of a hospital’s radiology department would include X-ray film used in the department, the salaries of radiologists, and the costs of radiology lab equipment.
INDIRECT COSTS
An indirect cost is a cost that cannot be easily and conveniently traced to a particular cost object.
Examples of indirect costs:
• Manufacturing overhead, such as the factory managers’ salary at a multi-product plant, is an indirect cost of any one product.
• General hospital administration costs are indirect costs of the radiology lab.
TM 1-16
© The McGraw-Hill Companies, Inc., 2008. All rights reserved.
COST CLASSIFICATIONS FOR MAKING DECISIONS
DIFFERENTIAL COST
Every decision involves choosing from among at least two alternatives. Any cost that differs between alternatives is a differential cost. Only the differential costs are relevant in making a decision.
EXAMPLE: Bill is currently employed as a lifeguard, but he has been offered a job in an auto service center in the same town. When comparing the two jobs, the differential revenues and costs are:
Lifeguard
Auto Service Center
Differential Costs and Revenues
Monthly salary .................... $1,200 $1,500 $300 Monthly expenses:
Commuting ...................... 30 90 60 Meals .............................. 150 150 0 Apartment rent ................ 450 450 0 Uniform rental .................. 0 50 50 Sunscreen ........................ 10 0 (10)
Total monthly expenses ...... 640 740 100 Net monthly income ............ $ 560 $ 760 $200
McGraw-Hill /Irwin Copyright © 2008 by The McGraw-Hill Companies, Inc. All rights reserved.
Chapter 1 (Cost Concepts) TM 1-17
© The McGraw-Hill Companies, Inc., 2008. All rights reserved.
OPPORTUNITY COST
An opportunity cost is the potential benefit given up when selecting one course of action over another.
EXAMPLE: Linda has a job in the campus bookstore and is paid $65 per day. One of her friends is getting married and Linda would like to attend the wedding, but she would have to miss a day of work. If she attends the wedding, the $65 in lost wages will be an opportunity cost of attending the wedding.
EXAMPLE: The reception for the wedding mentioned above will be held in the ballroom at the Lexington Club. The manager of the Lexington Club had to decide between accepting the booking for the wedding reception or accepting a booking for a corporate seminar. The hall could have been rented to the corporation for $600. The lost rental revenue of $600 is an opportunity cost of accepting the reservation for the wedding.
SUNK COST
A sunk cost is a cost that has already been incurred and that cannot be changed by any decision made now or in the future. Sunk costs are irrelevant and should be ignored in decisions.
EXAMPLE: Linda has already purchased a ticket to a rock concert for $35. If she goes to the wedding, she will be unable to attend the concert. The $35 is a sunk cost that she should ignore when deciding whether or not to attend the wedding. [However, any amount she can get by reselling the ticket is NOT a sunk cost.] And while she should ignore the $35 sunk cost, she should not ignore the enjoyment she would get if she were to attend the concert.
TM 1-17
© The McGraw-Hill Companies, Inc., 2008. All rights reserved.
OPPORTUNITY COST
An opportunity cost is the potential benefit given up when selecting one course of action over another.
EXAMPLE: Linda has a job in the campus bookstore and is paid $65 per day. One of her friends is getting married and Linda would like to attend the wedding, but she would have to miss a day of work. If she attends the wedding, the $65 in lost wages will be an opportunity cost of attending the wedding.
EXAMPLE: The reception for the wedding mentioned above will be held in the ballroom at the Lexington Club. The manager of the Lexington Club had to decide between accepting the booking for the wedding reception or accepting a booking for a corporate seminar. The hall could have been rented to the corporation for $600. The lost rental revenue of $600 is an opportunity cost of accepting the reservation for the wedding.
SUNK COST
A sunk cost is a cost that has already been incurred and that cannot be changed by any decision made now or in the future. Sunk costs are irrelevant and should be ignored in decisions.
EXAMPLE: Linda has already purchased a ticket to a rock concert for $35. If she goes to the wedding, she will be unable to attend the concert. The $35 is a sunk cost that she should ignore when deciding whether or not to attend the wedding. [However, any amount she can get by reselling the ticket is NOT a sunk cost.] And while she should ignore the $35 sunk cost, she should not ignore the enjoyment she would get if she were to attend the concert.
McGraw-Hill /Irwin Copyright © 2008 by The McGraw-Hill Companies, Inc. All rights reserved.
Chapter 2 (Job Order Costing) TM 2-1
© The McGraw-Hill Companies, Inc., 2008. All rights reserved.
AGENDA: JOB-ORDER COSTING
A. The documents and flow of costs in job-order costing.
1. Materials requisition form.
2. Direct labor time ticket.
3. Job cost sheet.
B. Applying overhead using a predetermined overhead rate.
1. Computing the predetermined overhead rate.
2. Using the predetermined overhead rate to apply overhead to jobs.
C. Underapplied and overapplied overhead. How is it determined? What is it? What is done with it?
D. Journal entries and T-accounts in job-order costing.

14-6
McGraw-Hill /Irwin Copyright © 2008 by The McGraw-Hill Companies, Inc. All rights reserved.
Chapter 2 (Job Order Costing) TM 2-6
© The McGraw-Hill Companies, Inc., 2008. All rights reserved.
APPLYING OVERHEAD
• In a job-order costing system, the cost of a job consists of:
1. Actual direct material costs traced to the job.
2. Actual direct labor costs traced to the job.
3. Manufacturing overhead applied to the job using a predetermined overhead rate. Actual overhead costs are not assigned to jobs.
• A predetermined overhead rate is used to assign overhead cost to products and services. It is:
• Based on estimated data.
• Established before the period begins.
• Why use estimated data?
• Waiting until the year is over to determine actual overhead costs would be too late. Managers want cost data immediately.
• Overhead rates, if based on actual costs and activity, would vary substantially from month to month. Much of this variation would be due to random changes in activity.
McGraw-Hill /Irwin Copyright © 2008 by The McGraw-Hill Companies, Inc. All rights reserved.
Chapter 2 (Job Order Costing) TM 2-7
© The McGraw-Hill Companies, Inc., 2008. All rights reserved.
PREDETERMINED OVERHEAD RATE FORMULA
The formula for computing a predetermined overhead rate is:
Estimated total manufacturing overhead costPredetermined =overhead rate Estimated total amount of the allocation base
The company in the preceding example applies overhead costs to jobs on the basis of direct labor-hours. In other words, the allocation base is direct labor-hours.
At the beginning of the year the company estimated that it would incur $320,000 in manufacturing overhead costs and would work 40,000 direct labor hours. The company’s predetermined overhead rate is:
$320,000Predetermined= = $8 per DLHoverhead rate 40,000 DLHs
APPLICATION OF OVERHEAD TO JOBS
The process of assigning overhead to jobs is known as applying overhead.
In the preceding example, Job 2B47 required 27 direct labor-hours. Therefore, $216 of overhead cost was applied to the job as follows:
Predetermined overhead rate .................... $8 per DLH Direct labor-hours required for Job 2B47 .... × 27 DLHs Overhead applied to Job 2B47 ................... $216
McGraw-Hill /Irwin Copyright © 2008 by The McGraw-Hill Companies, Inc. All rights reserved.
Chapter 2 (Job Order Costing) TM 2-12
© The McGraw-Hill Companies, Inc., 2008. All rights reserved.
UNDERAPPLIED AND OVERAPPLIED OVERHEAD
Since predetermined overhead rates are based on estimated data, at the end of an accounting period overhead costs are usually either underapplied or overapplied. In the example, overhead is underapplied by $10,000, which can be determined by examining the balance in the Manufacturing Overhead account:
Manufacturing Overhead
Actual (b) 24,000 (h) 300,000 Applied Overhead (c) 85,000 Overhead Costs (d) 40,000 Costs (e) 16,000 (g) 145,000 310,000 300,000 Under-applied Bal. 10,000
The $10,000 difference between the actual overhead costs and the applied overhead costs in this case is called underapplied overhead because actual overhead costs exceeded the overhead costs that were applied to inventory.
Alternatively, the amount of the underapplied or overapplied overhead can be determined as follows:
Actual overhead costs incurred ...................... $310,000 Applied overhead costs (150% × $200,000) ... 300,000 Underapplied overhead ................................. $ 10,000
3. Disposition of underapplied or overapplied overhead. Close the balance in Manufacturing Overhead to Cost of Goods Sold:
Cost of Goods Sold ............................................. 10,000 Manufacturing Overhead ........................... 10,000
McGraw-Hill /Irwin Copyright © 2008 by The McGraw-Hill Companies, Inc. All rights reserved.
Chapter 3 (Activity Based Costing) TM 3-1
© The McGraw-Hill Companies, Inc., 2008. All rights reserved.
AGENDA: ACTIVITY-BASED COSTING
1. Basic concepts of activity-based costing.
2. Computing activity rates
3. Computing unit product costs.
4. Contrasting activity-based costing and traditional costing.
5. Cost flows in activity-based costing.
McGraw-Hill /Irwin Copyright © 2008 by The McGraw-Hill Companies, Inc. All rights reserved.
Chapter 3 (Activity Based Costing) TM 3-2
© The McGraw-Hill Companies, Inc., 2008. All rights reserved.
ACTIVITY-BASED COSTING
• An activity is any event or transaction that causes the consumption of overhead resources. Examples of activities include:
• Setting up a machine.
• Processing a purchase order.
• Inspecting for defects.
• Performing a blood test.
• Billing customers. • Activity-based costing is a costing process in which:
1. Each major activity has its own activity cost pool to which overhead costs are assigned.
2. Each activity cost pool has its own activity measure.
3. An activity rate (i.e., predetermined overhead rate) is computed for each activity cost pool.
4. The activity rates are used to apply overhead costs to products.
McGraw-Hill /Irwin Copyright © 2008 by The McGraw-Hill Companies, Inc. All rights reserved.
Chapter 3 (Activity Based Costing) TM 3-8
© The McGraw-Hill Companies, Inc., 2008. All rights reserved.
COST FLOWS IN ACTIVITY-BASED COSTING
• Cost flows and journal entries are the same under activity-based costing as they are under more traditional costing systems. The only difference is that overhead is applied to products using multiple activity rates instead of just one predetermined overhead rate.
• Work in process is debited as raw materials are used in production.
Work in Process ............................ XXX Raw Materials ..................... XXX
• Work in process is debited as direct labor costs are incurred.
Work in Process ............................ XXX Wages Payable .................... XXX
• Actual manufacturing overhead costs are credited to Manufacturing Overhead as incurred.
Manufacturing Overhead ............... XXX Accounts Payable ................ XXX
• Overhead is applied to products using activity rates. For each activity cost pool, an entry is made debiting Work in Process and crediting Manufacturing Overhead.
Work in Process ............................ XXX Manufacturing Overhead ...... XXX
• The difference between the total amount of overhead applied and the total amount of overhead actually incurred is overhead overapplied or underapplied.

14-7
McGraw-Hill /Irwin Copyright © 2008 by The McGraw-Hill Companies, Inc. All rights reserved.
SUCCES ON YOUR EXAM !