main pass energy hub™ approved deepwater natural … · approved deepwater natural gas port...
TRANSCRIPT

Main Pass Energy Hub™© 2006 Freeport-McMoRan Energy LLC 1
Main Pass Energy Hub™Approved Deepwater Natural Gas Port
Marine Technology SocietyHouston, TXMay 24, 2007

Main Pass Energy Hub™© 2006 Freeport-McMoRan Energy LLC 2
Location

Main Pass Energy Hub™© 2006 Freeport-McMoRan Energy LLC 3
McMoRan Exploration
Freeport-McMoRan’s natural resources companies have a long history of global operations dating back to early 1900s.
Headquarters located in New Orleans, Louisiana.
Record of success in finding and developing complex, world-class projects.Freeport has owned and operated major offshore facilities since 1958Main Pass facilities – previously permitted as a sulphur mine and oil and gas production and processing facilityReceived MARAD approval for MPEH™ on January 3, 2007
McMoRan Exploration Co. (MMR)
McMoRan Oil & Gas LLC Freeport-McMoRan Energy LLC
MPEH™
Main Pass Energy Hub™© 2006 Freeport-McMoRan Energy LLC 4
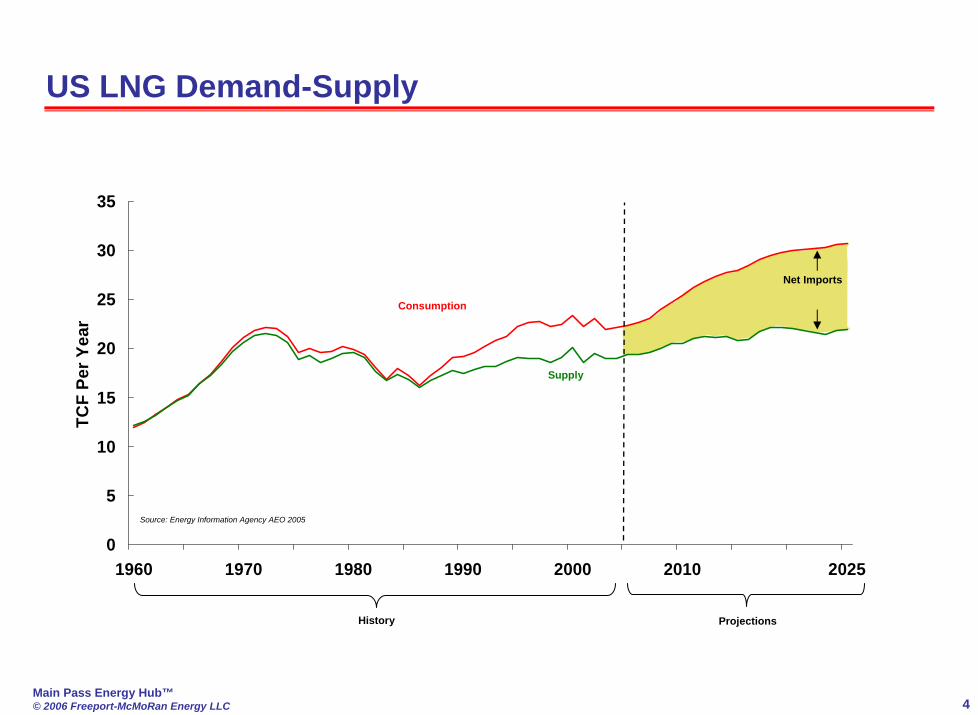
US LNG Demand-Supply
0
5
10
15
20
25
30
35
1960 1970 1980 1990 2000 2010 2025
TCF
Per Y
ear
Net Imports
Consumption
Supply
Source: Energy Information Agency AEO 2005
History Projections

Main Pass Energy Hub™© 2006 Freeport-McMoRan Energy LLC 5
U.S. Production vs. ConsumptionActual demand is cyclical and exceeds supply during certain periods of time and in certain regions of the U.S.
Historical US Supply Demand Profile
0.00
10.00
20.00
30.00
40.00
50.00
60.00
70.00
80.00
90.00
Jan-
90
Jan-
91
Jan-
92
Jan-
93
Jan-
94
Jan-
95
Jan-
96
Jan-
97
Jan-
98
Jan-
99
Jan-
00
Jan-
01
Jan-
02
Jan-
03
Jan-
04
Bcf
/day
Dry Gas Production Pipeline Imports
LNG MPORTS Total Demand

Main Pass Energy Hub™© 2006 Freeport-McMoRan Energy LLC 6
LNG – Production to Market Flow Schematic & Chain Valuation
LNG to U.S.
Well
Natural Gas
Condensate
Liquefaction (Convert to LNG)
1,060 to 1,150 Btu/scf
Natural Gas1,075 Btu/scf
U.S.Pipeline Grid1,075 Btu/scf
LNG Regas at MPEH™
1,060 to 1,150 Btu/scf
Ethane, Propane & Butane Gases Removed to Reduce Btu
Content
1,060 to 1,150Btu/scf
1,060 to 1,150Btu/scf
E&PE&P
$.50$.50
Typical LNG Chain CostTypical LNG Chain Cost$/$/MMbtuMMbtu
LiquefactionLiquefaction
$2.00$2.00
ShippingShipping
$1.00$1.00
TerTer. . RegasRegas
$0.50$0.50
p/l to Mkt
HH – NY $1.50HH – FL $0.50
TotalTotal
$4.00$4.00
FLOW

Main Pass Energy Hub™© 2006 Freeport-McMoRan Energy LLC 7
Conventional vs. Integrated Storage
Conventional Regas Facility
Distribution to Consumers
1.0 bcf/d
Gas Conditioning Gas Storage
3.1 bcf/d PeakRegas1 bcf/d
Gas Cavern Storage
Main Pass Energy Hub™
Gas Conditioning

Main Pass Energy Hub™© 2006 Freeport-McMoRan Energy LLC 8
Project Advantages
Key processes and systems are combined into one facility.
LNG surface storage
Conventional vaporization
On-site gas conditioning
Integrated, high capacity salt cavern gas storage
Premium pipeline header to tie into premium U.S. gas markets

Main Pass Energy Hub™© 2006 Freeport-McMoRan Energy LLC 9
Terminal Capacity• Annual LNG Throughput Capacity 350 Bcf• LNG Surface Storage Capacity
• Liquid 145,000 cm• Vapor Equivalent 3.1 Bcf
• Salt Cavern Storage Capacity 28 Bcf
Terminal Deliverability• LNG Vaporizer (max) 1.6 Bcf/day• Cavern Storage (max) 1.5 Bcf/day• Peak Deliverability 3.1 Bcf/day
•12 Hr offload capability
MPEH™ Technical Specifications
Main Pass Energy Hub™© 2006 Freeport-McMoRan Energy LLC 10
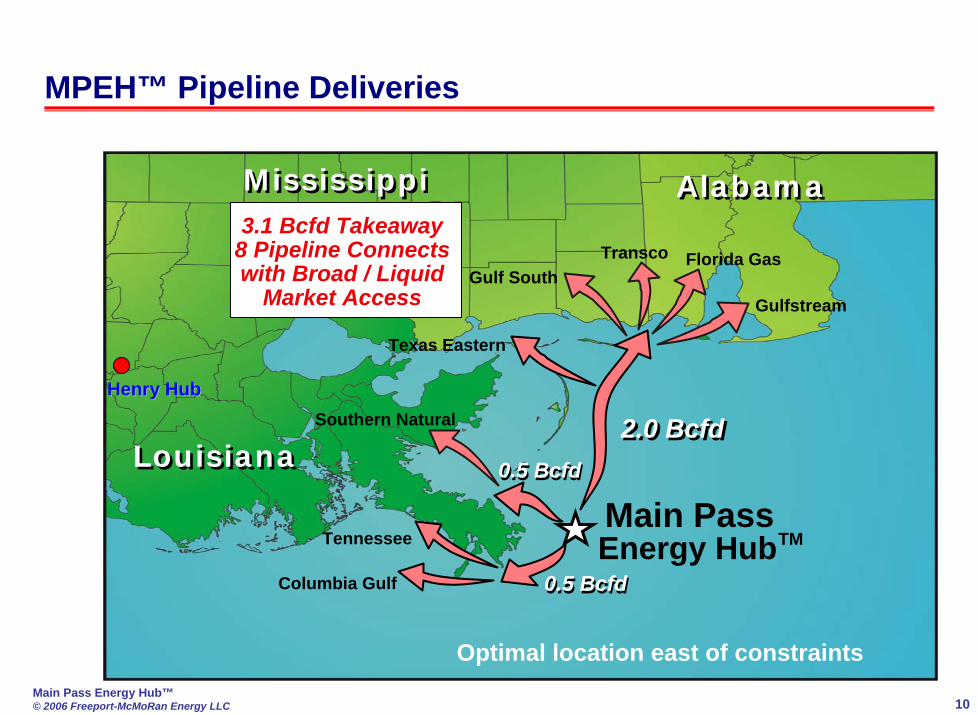
Main PassEnergy HubTM
Columbia Gulf
Tennessee
Texas Eastern
Gulf SouthTransco Florida Gas
Gulfstream
Southern Natural
LouisianaLouisiana
MississippiMississippi AlabamaAlabama3.1 Bcfd Takeaway
8 Pipeline Connects with Broad / Liquid
Market Access
2.0 Bcfd2.0 Bcfd
0.5 Bcfd0.5 Bcfd
0.5 Bcfd0.5 Bcfd
Henry HubHenry Hub
Optimal location east of constraints
MPEH™ Pipeline Deliveries

Main Pass Energy Hub™© 2006 Freeport-McMoRan Energy LLC 11
Major Pipeline Networks Served

Main Pass Energy Hub™© 2006 Freeport-McMoRan Energy LLC 12
Project Timing
License application deemed complete in mid 2004.
March 2006 received final EIS from MARAD/USCGMay 5, 2006 LA Governor vetoed use of “open loop” vaporizationMPEH DWP “closed loop” vaporization “Amended” Application submitted 5/31/06USCG/MARAD published “closed loop” EA 9/19/06MARAD favorable Record Of Decision issued 1/3/07
Continuing to progress commercialization of project.
Existing structures allow a 40 month design and construction schedule.
In advanced discussions with certain LNG suppliers.
Main Pass Energy Hub™© 2006 Freeport-McMoRan Energy LLC 13
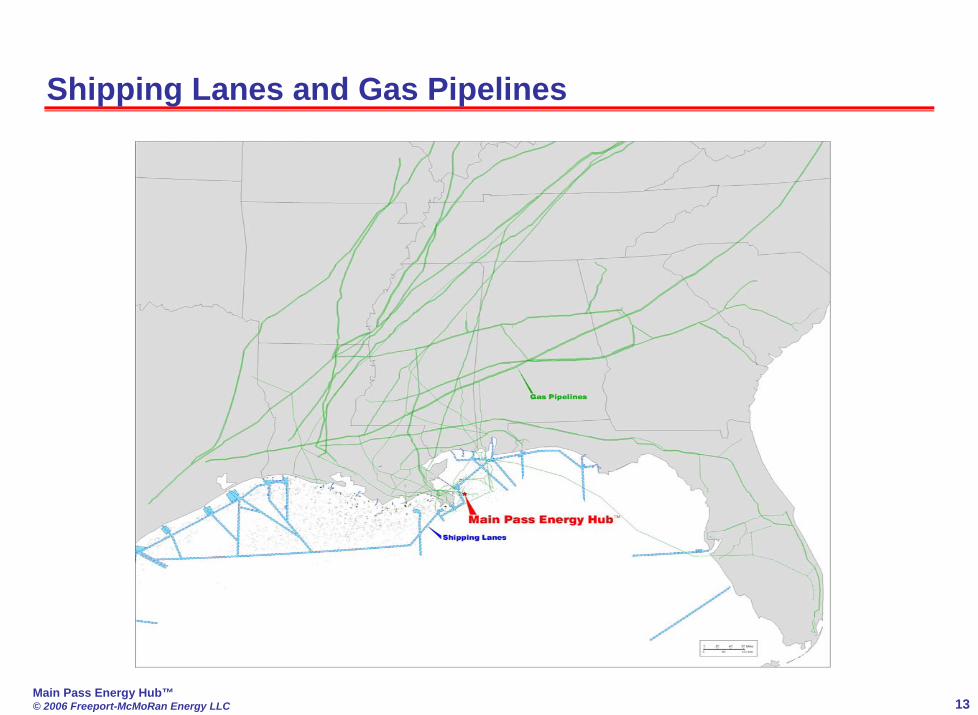
Shipping Lanes and Gas Pipelines
Main Pass Energy Hub™© 2006 Freeport-McMoRan Energy LLC 14
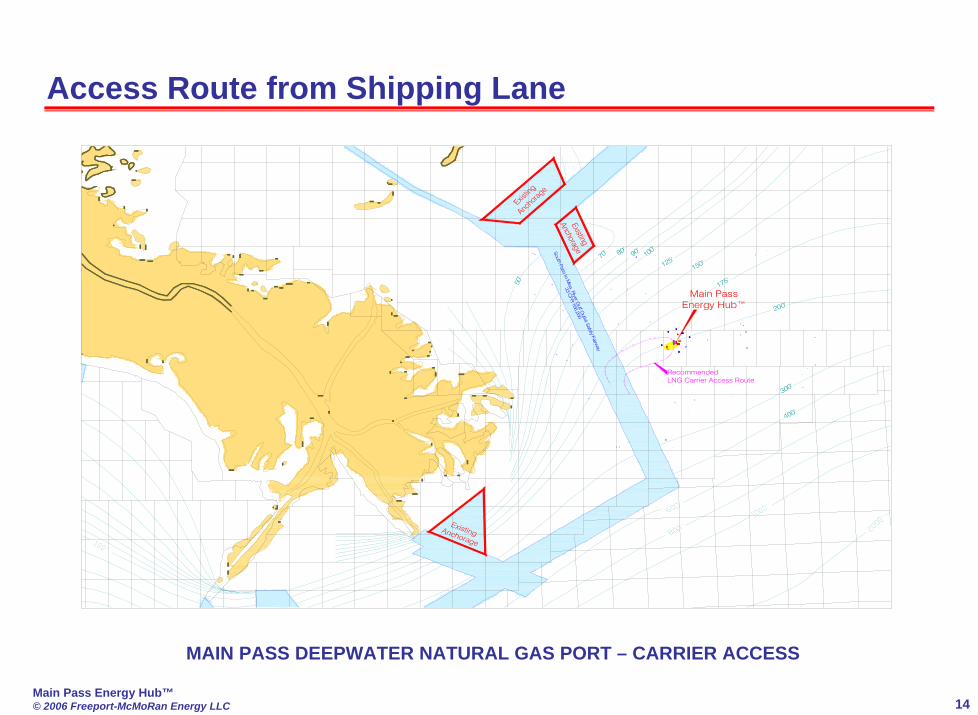
Access Route from Shipping Lane
MAIN PASS DEEPWATER NATURAL GAS PORT – CARRIER ACCESS
300'
200'
100'
175'
150'125'90
'80'70
'
60'
50'
RecommendedLNG Carrier Access Route
South Pass to Miss. R
iver Gulf O
utlet Safety Fairway
33 CFR 166.200
Main Pass Energy Hub™

Main Pass Energy Hub™© 2006 Freeport-McMoRan Energy LLC 15
Carrier Access Circuit from Shipping Lane

Main Pass Energy Hub™© 2006 Freeport-McMoRan Energy LLC 16
Current Configuration

Main Pass Energy Hub™© 2006 Freeport-McMoRan Energy LLC 17
Location AdvantagesLocation:
Federal waters
210-foot (64 m) water depth
38 miles (61 km) east of Venice, Louisiana
16 miles (26 km) east of the mouth of the Mississippi River
Near existing pipeline infrastructure
Deepwater access for ships
Near shipping lanes
2-mile (3.2 km) diameter salt dome capable of accommodating numerous caverns having an estimated storage potential of +500 million barrels (80 MM m3)
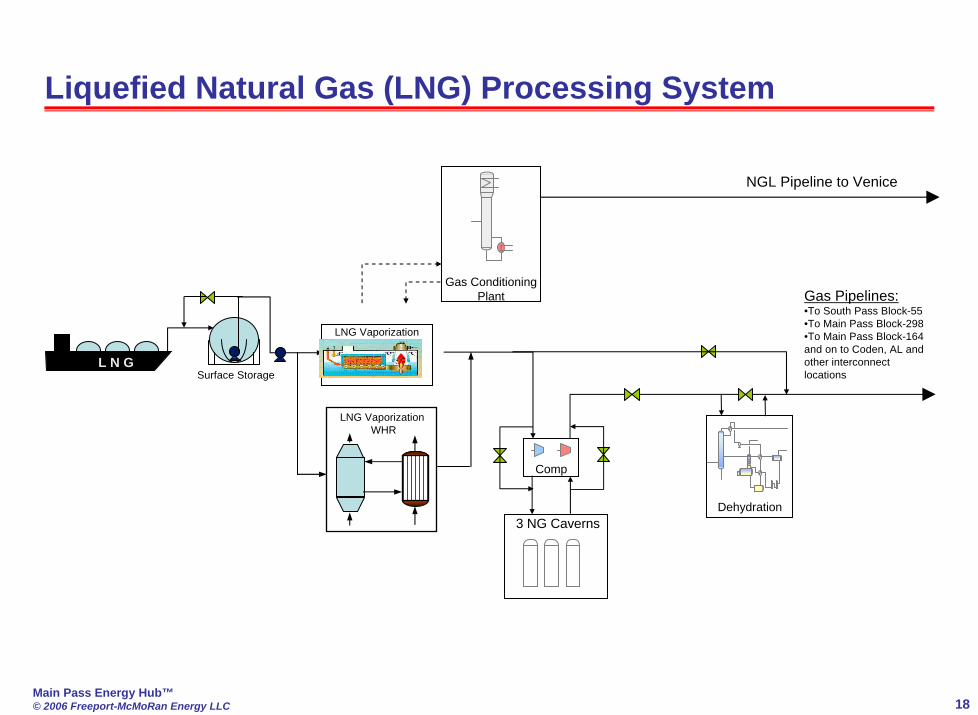
Main Pass Energy Hub™© 2006 Freeport-McMoRan Energy LLC 18
NGL Pipeline to Venice
3 NG Caverns
L N G
Gas Pipelines:•To South Pass Block-55•To Main Pass Block-298•To Main Pass Block-164 and on to Coden, AL and other interconnect locations Surface Storage
Gas Conditioning Plant
Dehydration
Liquefied Natural Gas (LNG) Processing System
Comp
LNG Vaporization (SCV’s)
LNG VaporizationWHR

Main Pass Energy Hub™© 2006 Freeport-McMoRan Energy LLC 19
CA
RR
IER
Platform No.1 LNG Offloading, LNG Vaporization and Gas Conditioning Facilities
Storage Platforms 5 & 6 LNG Storage
Platform No.2 Gas Storage Systems Compression
BS-Y7 Quarters, Shop Warehouse
Soft Berth(Patent Pending)
TM
Platform No.3 LNG Vaporization and Power Generation
StorageCaverns 36" P
ipeline to
Coden, A
L.
16" Pipeline to MP298
20" Pipeline to S
P55
FACILITY LAYOUTFACILITY LAYOUT

Main Pass Energy Hub™© 2006 Freeport-McMoRan Energy LLC 20
Soft Berth™ - Compliant Mooring System

Main Pass Energy Hub™© 2006 Freeport-McMoRan Energy LLC 21
Design Advantages of Soft Berth™
Steel StructuresComplies with existing platformsDesigned to survive Cat 5 Hurricane
210-foot Water DepthSufficient depth to permit use of tuned mooringsAdequate keel clearance for LNG carriers
Reduces blockage effectsEliminates ground effects
Compliant BerthsReduces environmental concerns during berthing of LNG carriersGreatly reduces loads between LNG carriers and berth

Main Pass Energy Hub™© 2006 Freeport-McMoRan Energy LLC 22
Soft Berth™ Load
0.9%1.3%
0.8%1.5%
95.5%
Wind
Mean Drift
Slow Drift
Current
1s t order Wave
Wave Induced Loads on LNGC
0
500
1,000
1,500
2,000
2,500
3,000
3,500
4,000
7 8 9 10 11 12 13 14
Wave Period (sec)
Sway
(kip
s/ft
ampl
itude
)
Beam Seas Excitation Force on LNGC
Beam Seas Inertia Load by LNGC (including added mass)
Difference between Excitation and Inertia Load in Beam Seas

Main Pass Energy Hub™© 2006 Freeport-McMoRan Energy LLC 23

Main Pass Energy Hub™© 2006 Freeport-McMoRan Energy LLC 24
Plan Configuration

Main Pass Energy Hub™© 2006 Freeport-McMoRan Energy LLC 25
Key Points
Berth structures are compliant.
Only second order environmental loads between ship and berth.
Berths free to move due to first order loads.
Berths designed for 160,000 m3 carrier.
Can be upgraded for 250,000 m3 carriers.
Long-term data history indicates weather and sea conditions allow 95% operability for offloading ships.
Soft Berth™ – Patent Pending

Main Pass Energy Hub™© 2006 Freeport-McMoRan Energy LLC 26
BERTH OPERABILITY DESIGN APPROACH
Objective – high availability/operability
Determine MP 299 predominate seas
Design berth to accommodate LNGCs in predominate MP 299 seas
Confirm design model including operability in marine basin tests
Main Pass Energy Hub™© 2006 Freeport-McMoRan Energy LLC 27
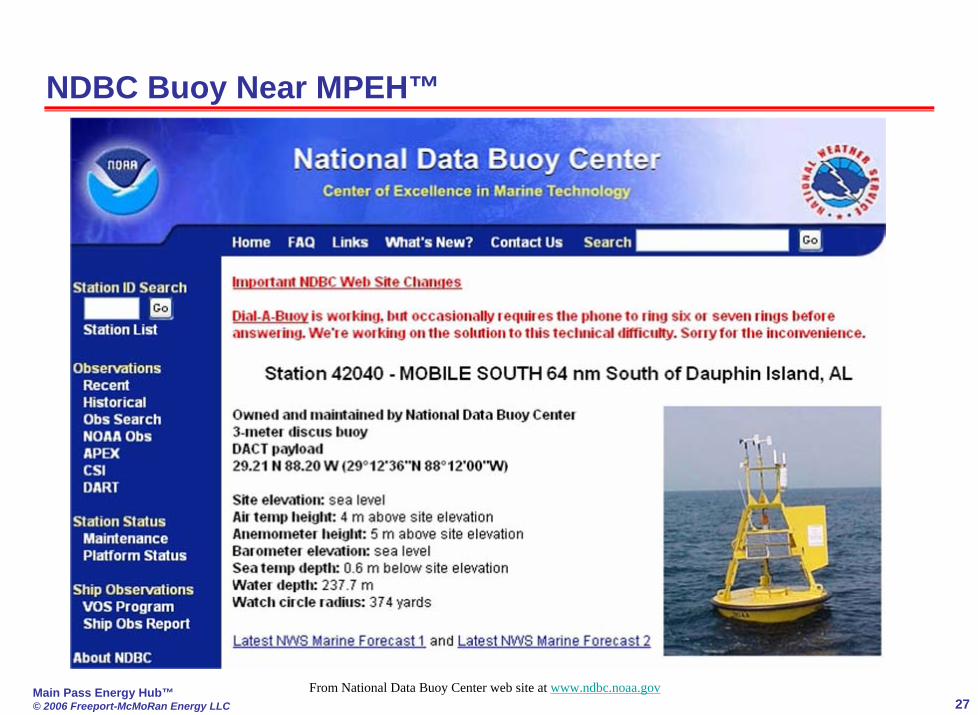
From National Data Buoy Center web site at www.ndbc.noaa.gov
NDBC Buoy Near MPEH™

Main Pass Energy Hub™© 2006 Freeport-McMoRan Energy LLC 28
MPEH™ Proximity to NDBC BuoyMPEHTM 29.30N 88.77W
NDBC Station 42040 29.21N 88.20W

Main Pass Energy Hub™© 2006 Freeport-McMoRan Energy LLC 29
MPEH™ Buoy42040~38 miles214 ft Depth780 ft Depth
Validity of Buoy Data at MPEH™

Main Pass Energy Hub™© 2006 Freeport-McMoRan Energy LLC 30
PARAMETER RANGE FREQ. AVG. PERIOD RESOLUTION ACCURACY
WIND DIR. 0 to 360 1.0 Hz 8 min 1.0 deg +/- 10.0 deg
WIND SPEED 0 to 62 m/s 1.0 Hz 8 min 0.1 m/s +/- 1.0 m/s
WIND GUST 0 to 82 m/s 1.0 Hz 5 sec 0.1 m/s +/- 1.0 m/s
WAVE HEIGHT 0 to 35 m 2.56 Hz 20 min 0.1 m +/- 0.2 m
WAVE PERIOD 0 to 30 sec 2.56 Hz 20 min 1.0 sec +/- 1 second
WAVE DIR. 0 to 360 2.56 Hz 20 min 0.1 deg +/- 10 deg
Average height of the highest one-third of the waves during a 20 minute sampling period.Average period of the highest one-third of the waves observed during a 20 minute sampling period. Mean wave direction corresponding to the highest one-third of the waves observed during a 20 minute sampling period.
Ten-minute average wind direction.
Ten-minute average wind speed values.
Maximum 5-second peak gust during the measurement hour.
DESCRIPTION
From National Data Buoy Center web site at www.ndbc.noaa.gov
NDBC Buoy Data

Main Pass Energy Hub™© 2006 Freeport-McMoRan Energy LLC 31
Wind and Wave Probability Distribution

Main Pass Energy Hub™© 2006 Freeport-McMoRan Energy LLC 32
Weather Data – 8 years
1996 1997 1998 1999 2000 2001 2002 2003

Main Pass Energy Hub™© 2006 Freeport-McMoRan Energy LLC 33
Weather Data – 1 year

Main Pass Energy Hub™© 2006 Freeport-McMoRan Energy LLC 34
Weather Data – 3 Months

Main Pass Energy Hub™© 2006 Freeport-McMoRan Energy LLC 35
Weather Data – 2 Weeks
Main Pass Energy Hub™© 2006 Freeport-McMoRan Energy LLC 36
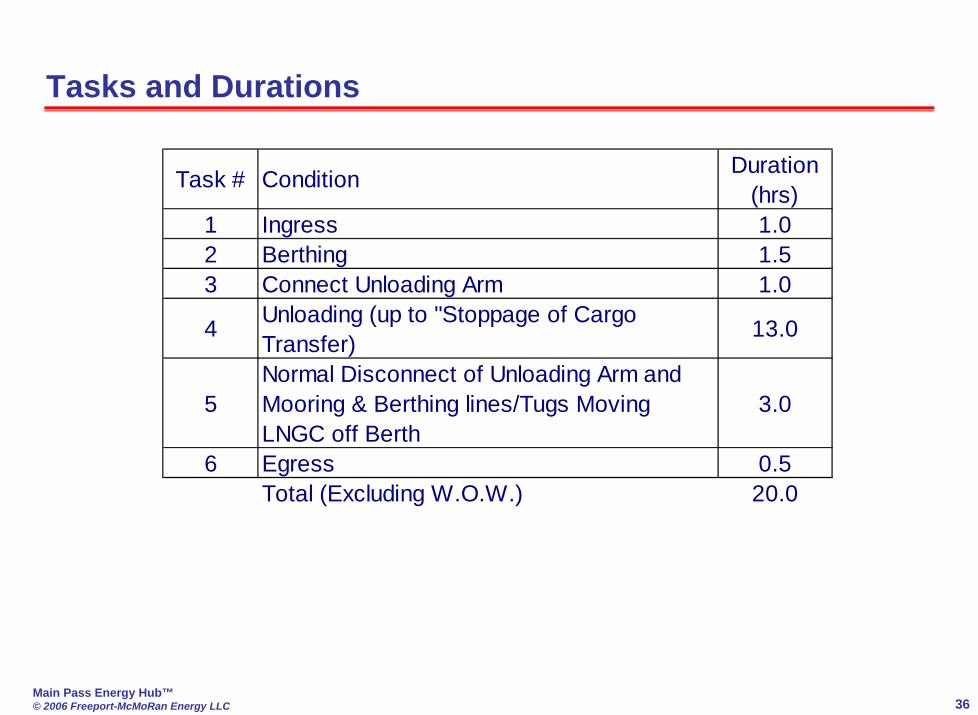
Tasks and Durations
Task # Condition Duration (hrs)
1 Ingress 1.02 Berthing 1.53 Connect Unloading Arm 1.0
4 Unloading (up to "Stoppage of Cargo Transfer)
13.0
5Normal Disconnect of Unloading Arm and Mooring & Berthing lines/Tugs Moving LNGC off Berth
3.0
6 Egress 0.5Total (Excluding W.O.W.) 20.0

Main Pass Energy Hub™© 2006 Freeport-McMoRan Energy LLC 37
Percent operability is based on the following assumptions:
Conclusion: 95%+ operability achieved including times when Tropical Revolving Storms are present in the Gulf of Mexico, this study considers all weather data over the eight year period.
• Berth design availability sea conditions•Berth: 6.6’ (2m) seas, 25 knot winds•Stay on berth: 8’ (2.4m) seas, 35 knot winds
• 1.0bcf/day base vaporizing rate, 72-hr arrival schedule• No down time due to equipment maintenance, repair, or failure
(i.e., equipment is always operable at rated capacity)• 8 years of weather data are used to compare environmental and
system response operating limits based on the task being attempted in a sequential, hour-by-hour basis from Jan 01, 1996 to Dec 31, 2003
Operability Study
Main Pass Energy Hub™© 2006 Freeport-McMoRan Energy LLC 38
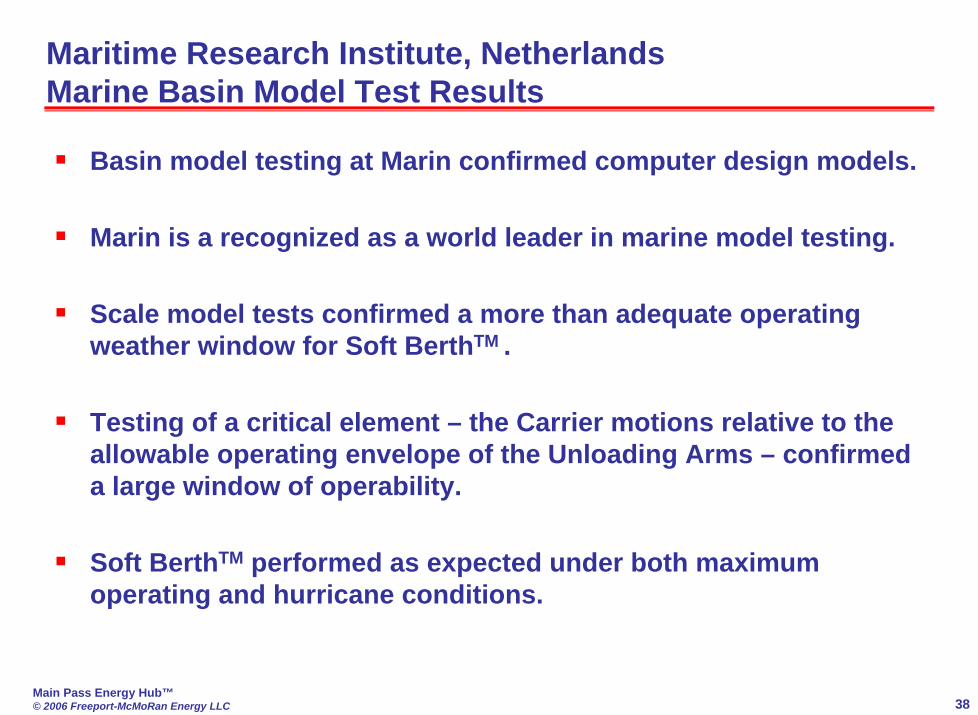
Maritime Research Institute, NetherlandsMarine Basin Model Test Results
Basin model testing at Marin confirmed computer design models.
Marin is a recognized as a world leader in marine model testing.
Scale model tests confirmed a more than adequate operating weather window for Soft BerthTM .
Testing of a critical element – the Carrier motions relative to the allowable operating envelope of the Unloading Arms – confirmed a large window of operability.
Soft BerthTM performed as expected under both maximum operating and hurricane conditions.

Main Pass Energy Hub™© 2006 Freeport-McMoRan Energy LLC 39
Main Pass Energy Hub™© 2006 Freeport-McMoRan Energy LLC 40
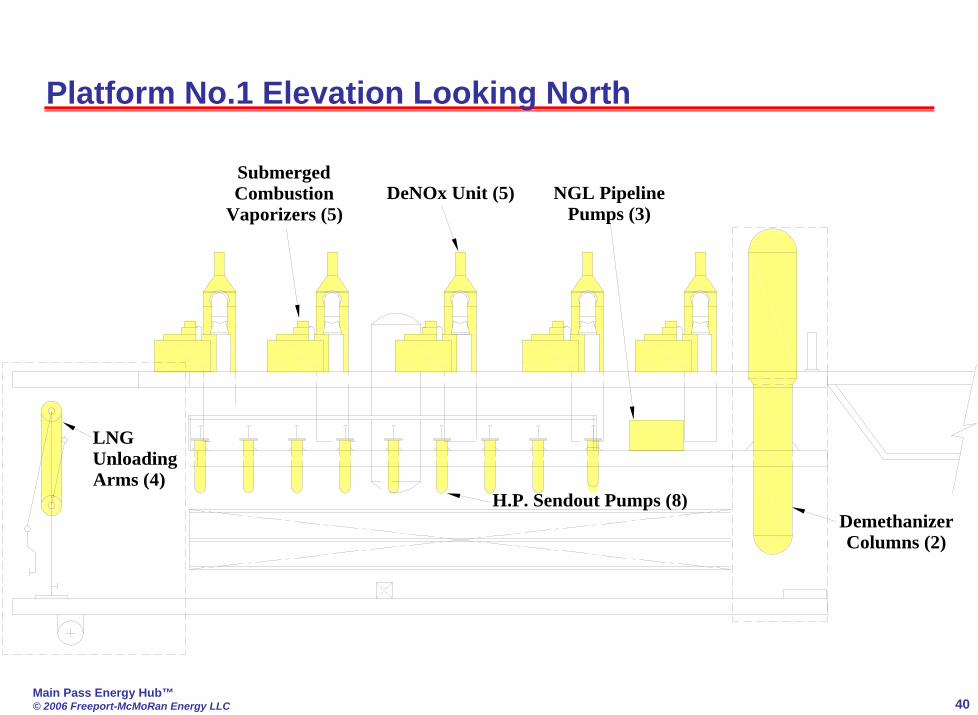
Platform No.1 Elevation Looking North
SubmergedCombustion
Vaporizers (5)NGL Pipeline
Pumps (3)
DemethanizerColumns (2)
LNGUnloadingArms (4)
DeNOx Unit (5)
H.P. Sendout Pumps (8)

Main Pass Energy Hub™© 2006 Freeport-McMoRan Energy LLC 41
Platform No.3Upper Deck Elevation
SubmergedCombustion
Vaporizers (3)DeNOx Unit (3)
Gas TurbineGenerators (3)
ElectrochlorUnits
NitrogenGenerators
Air Compression EmergencyGenerator
Main Pass Energy Hub™© 2006 Freeport-McMoRan Energy LLC 42
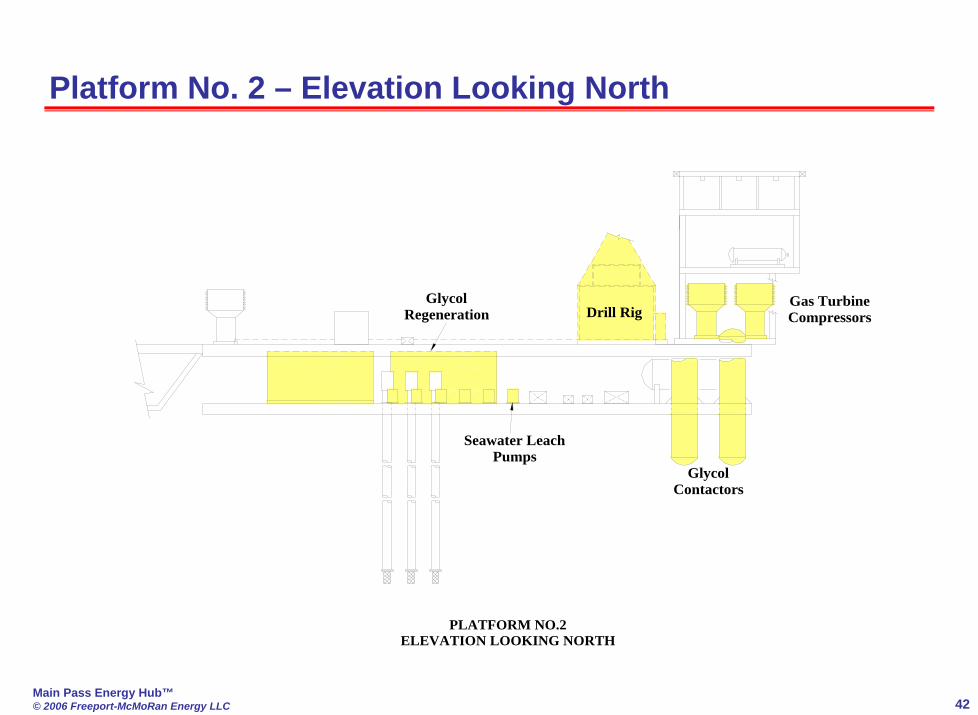
ELEVATION LOOKING NORTHPLATFORM NO.2
Drill RigGas Turbine Compressors
Glycol Regeneration
Seawater Leach Pumps
Glycol Contactors
Platform No. 2 – Elevation Looking North

Main Pass Energy Hub™© 2006 Freeport-McMoRan Energy LLC 43
LNG Storage Platforms – Perspective View
SPB LNG STORAGE TANKS100'H x 120'W x 75'L(3 PER PLATFORM)
STORAGE PLATFORMSPERSPECTIVE VIEW
Main Pass Energy Hub™© 2006 Freeport-McMoRan Energy LLC 44
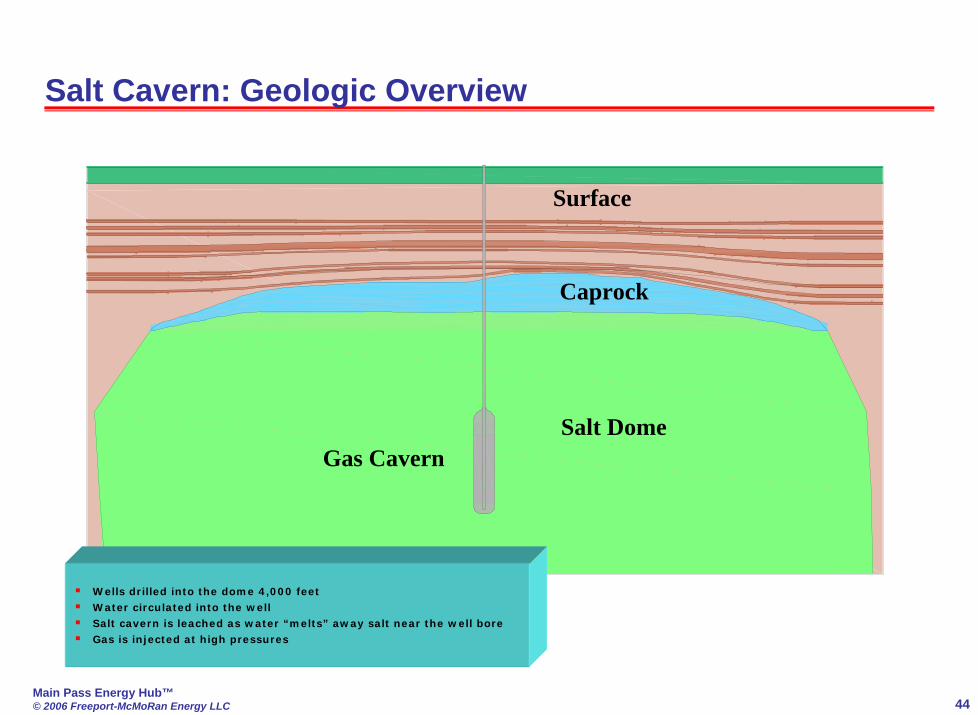
Salt Cavern: Geologic Overview
Salt DomeGas Cavern
Caprock
Surface
Wells drilled into the dome 4,000 feetWater circulated into the wellSalt cavern is leached as water “melts” away salt near the well boreGas is injected at high pressures
Main Pass Energy Hub™© 2006 Freeport-McMoRan Energy LLC 45
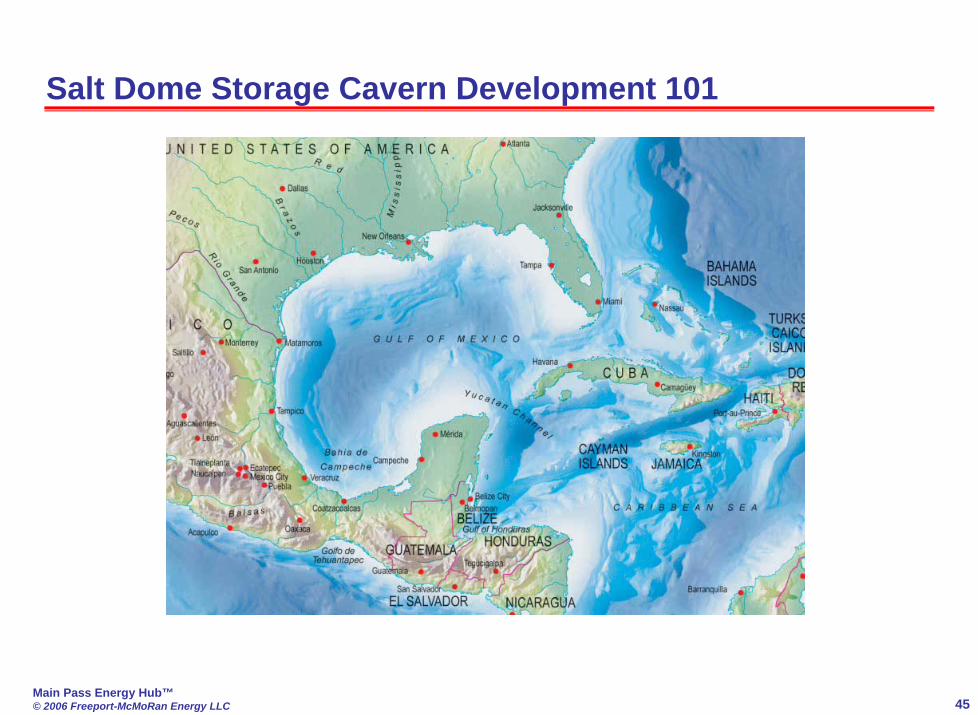
Salt Dome Storage Cavern Development 101
Main Pass Energy Hub™© 2006 Freeport-McMoRan Energy LLC 46
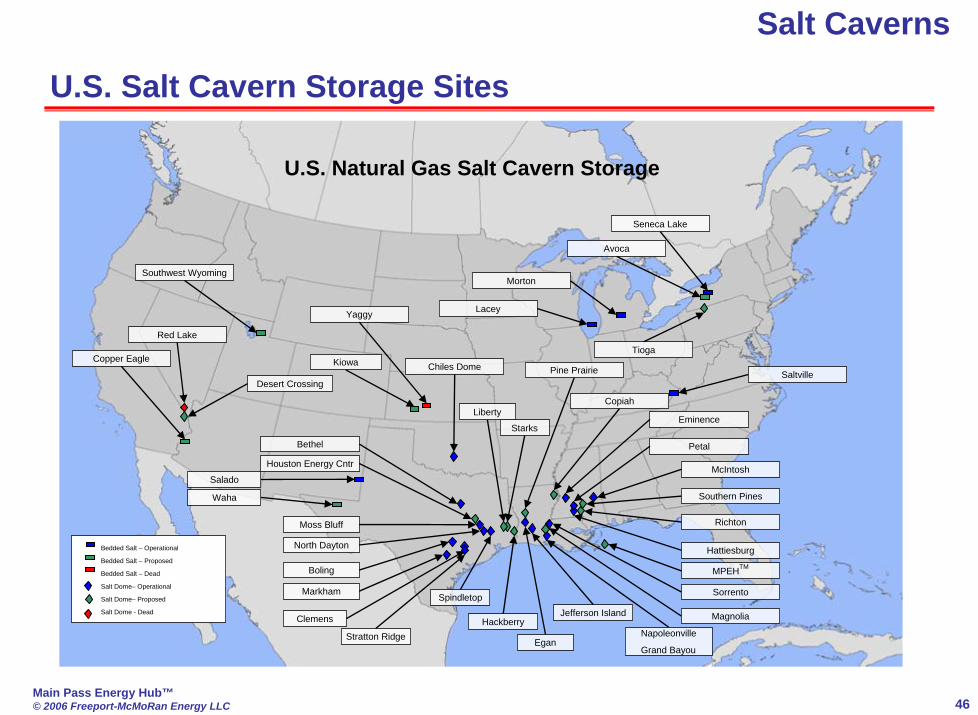
U.S. Salt Cavern Storage Sites
Bedded Salt – Operational
Bedded Salt – Proposed
Bedded Salt – Dead
Salt Dome– Operational
Salt Dome– Proposed
Salt Dome - Dead
U.S. Natural Gas Salt Cavern Storage
McIntosh
Spindletop
Moss Bluff
Houston Energy Cntr
North Dayton
Clemens
Boling
Jefferson Island
Markham
Starks
Pine Prairie
Hackberry
Hattiesburg
Richton
Southern Pines
Sorrento
Copiah
Eminence
Petal
Napoleonville
Grand Bayou
Magnolia
MPEHTM
Egan
Chiles Dome
Tioga
Bethel
Red Lake
Desert Crossing
Copper Eagle Kiowa
Yaggy Lacey
Morton
Avoca
Saltville
Seneca Lake
Waha
Salado
Southwest Wyoming
Liberty
Stratton Ridge
Salt Caverns

Main Pass Energy Hub™© 2006 Freeport-McMoRan Energy LLC 47
Cavern Design
Planned
300142299 298
Edge
of S
alt D
ome
20001500Feet10005000
Platform No.4
(App
rox
2 M
iles
(3.2
Km
) Dia
.)
Compression, Gas Storage Systems
LNG Offloading, Vaporization
Category Parameter
Size 20 in. (51 cm)Shoe Depth 4,210 ft. (1283 m)Salt Back 825 ft. (251 m)
Hanging String Size 10 3/4 in. (27 cm)
59.8 MMcf,10.7 MM bblsVolume
Diameter 250 ft. (76 m)Height 1280 ft. (390 m)
Volume 9.3 bcf (263 MM m³)Max. Gradient
@ casing shoe0.85 psi/ft
Max. Wellhead SIP
3,200 psig
Volume 5.3 bcf (150 MM m³)Min. Gradient
@ casing shoe0.25 psi/ft
Min. WellheadSIP
893 psig
Final Cemented Casing
Cavern
Gas
M.S.L. 0ft.
-1775 ft. (541 m)
-1675 ft. (511 m)
-1475 ft. (450 m)Liner
Top of Salt
Top of Anhydrite
Top of Caprock
36 in. (91 cm) Drive Pipe
30 in. (76 cm) Caprock Casing
24 in. (61 cm) First Cemented Salt Casing
20 in. (51 cm) Final Cemented Salt Casing
Mudline -210 ft. (64 m)
-5590 ft. (1704 m)
-4310 ft. (1314 m)
-4210 ft. (1283 m)
10-3/4 in. (27 cm)
Top of Salt + 100 ft. (30 m)
First Cemtd. Salt Casing
Casing Shoe
Top of Cavern
Bottom of Cavern
Hanging String
Platform No.2
Platform No.1
Shop & WarehouseAccommodations
Gas Storage Caverns
Softberth TM
(Patent Pending)
Working
GasBase
Meters4002000 600 800
20 in. (51 cm) Final Cemtd.Salt Casing
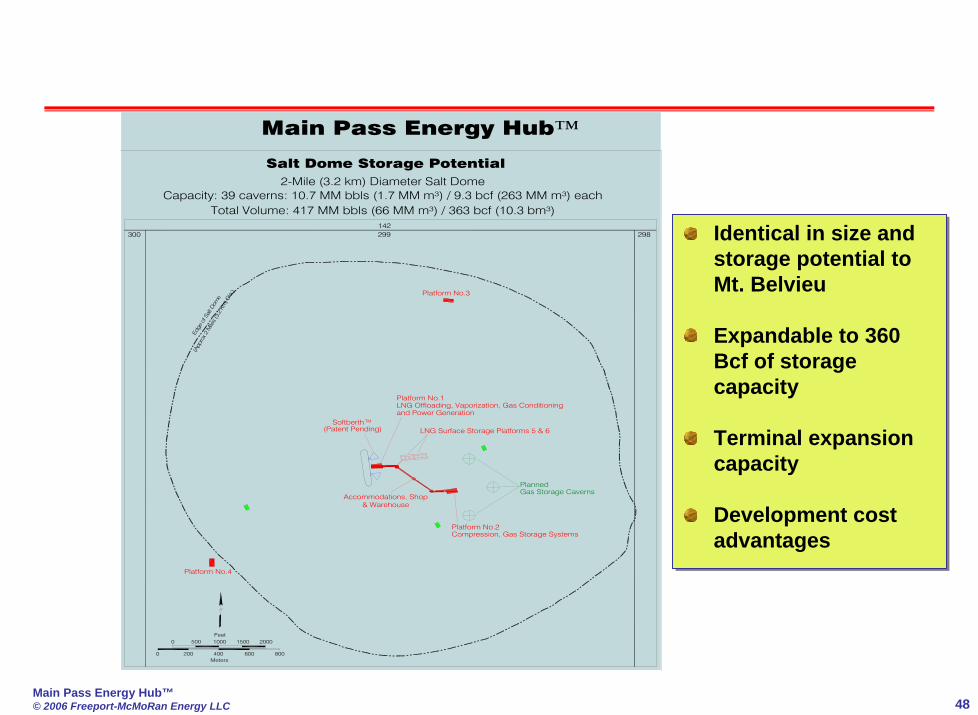
2-Mile (3.2 km) Diameter Salt DomeCapacity: 39 caverns: 10.7 MM bbls (1.7 MM m³) / 9.3 bcf (263 MM m³) each
Total Volume: 417 MM bbls (66 MM m³) / 363 bcf (10.3 bm³)
and Gas Conditioning
1.7 MM m³
Cavern Development Durations
General4Engineering/Well Permitting3Procurement of leaching equipment
Months
Well 14Drilling27Leaching @ 3500 gpm4Dewater42Total Well 1 (Includes Gen'l)
Wells 2 & 34Drilling27Leaching @ 3500 gpm4Dewater35Total Wells 2 & 3 (Excludes Gen'l)
NOTE:Drilling of wells is consecutive, leaching commences following drilling completion.
LNG Surface StoragePlatforms 5 & 6
Platform No.3LNG Vaporization and
Power Generation
Initial Gas Storage CavernSalt Dome Storage Potential
Main Pass Energy Hub™
Main Pass Energy Hub™© 2006 Freeport-McMoRan Energy LLC 48
Scalability of Main Pass Energy Hub
Identical in size and storage potential to Mt. Belvieu
Expandable to 360 Bcf of storage capacity
Terminal expansion capacity
Development cost advantages
Identical in size and storage potential to Mt. Belvieu
Expandable to 360 Bcf of storage capacity
Terminal expansion capacity
Development cost advantages
Planned
300142299 298
Edge
of S
alt D
ome
20001500Feet10005000
Platform No.4
(App
rox 2
Mile
s (3
.2 K
m) D
ia.)
Compression, Gas Storage Systems
LNG Offloading, Vaporization, Gas Conditioning
Platform No.2
Platform No.1
LNG Surface Storage Platforms 5 & 6
& WarehouseAccommodations, Shop
Platform No.3
Gas Storage Caverns
SoftberthTM
(Patent Pending)
Meters4002000 600 800
2-Mile (3.2 km) Diameter Salt DomeCapacity: 39 caverns: 10.7 MM bbls (1.7 MM m³) / 9.3 bcf (263 MM m³) each
Total Volume: 417 MM bbls (66 MM m³) / 363 bcf (10.3 bm³)
and Power Generation
Salt Dome Storage Potential
Main Pass Energy Hub™

Main Pass Energy Hub™© 2006 Freeport-McMoRan Energy LLC 49
Pipeline Header and Major Interconnections
The MPEH™ LNG terminal will have direct pipeline access to 8 major interstate pipeline networks serving the Eastern United States markets.
Facilities